
Submitted:
12 February 2026
Posted:
12 February 2026
You are already at the latest version
Abstract
Alkaline electrolysers are a proven and cost-efficient technology for large-scale hydrogen production. While established, improving their performance remains an active research area. A significant but less recognized factor is the internal geometry of electrode supports, which influences gas removal and mass transport, thereby affecting efficiency. This study details the design, fabrication, and experimental validation of three unique alkaline electrolysers, each featuring a modified internal electrode-support geometry. Their performance was comprehensively assessed through polarization curve analysis in individual, partial, and global configurations. The development followed the Advanced Product Quality Planning (APQP) methodology, employing pure nickel electrodes for stability. The research experimentally demonstrates how specific geometric alterations directly influence electrochemical performance and overall efficiency. By operating three electrolysers simultaneously, the system achieved an overall efficiency of 42% and a maximum oxyhydrogen production rate of 10 L min-1 with minimal electrolyte carryover This systematic work establishes essential design guidelines aimed at advancing the technology from Technology Readiness Level (TRL) 5 to TRL 6, facilitating the development of a reliable 5 kW hydrogen production system.
Keywords:
oxyhydrogen gas
; alkaline electrolysis
; pilot plant
; alkaline electrolyser
; internal geometry
1. Introduction
The rising global energy demand, combined with the limited reserves of fossil fuels and their environmental effects, calls for a major transition to sustainable energy options [1,2]. Renewable sources such as solar, wind, biomass, and hydropower provide a clean, sustainable energy supply that remains plentiful [3]. The rapid expansion of wind farms and solar panel installations reflects significant advancements in harnessing these resources. Integrating intermittent renewable sources into a stable energy grid presents challenges that underscore the need for energy storage and conversion technologies. In this regard, hydrogen—especially “green hydrogen” produced via water electrolysis using renewable energy—has become a vital element for future economic growth and decarbonization efforts worldwide [1,4].
Water electrolysis, an electrochemical process that splits water into hydrogen and oxygen, is essential for hydrogen production. Among the various electrolysis technologies, alkaline electrolysers (AELs) stand out for their high maturity, simple design, and reliance on low-cost materials [5,6]. AELs typically operate with a 25–30% aqueous solution of potassium hydroxide (KOH) or sodium hydroxide (NaOH), in which hydrogen is produced at the cathode and oxygen at the anode. Despite their advantages, scaling up AELs for large-scale renewable hydrogen production introduces new demands to reduce manufacturing costs and enhance operational efficiency, often requiring operation at elevated pressures of up to 30 bar to produce hydrogen at sufficient pressure [5].
Mexico accounts for about 1.4% of worldwide CO2 emissions. In line with the Paris Agreement, it has pledged to cut greenhouse gas emissions by 22% by 2030 and to start decarbonising its economy by 2026 through the adoption of clean energy sources, as outlined in the Electricity Industry Law [7]. Hydrogen is considered one of these clean energies, useful for combustion and electricity production via fuel cells, with water being the main byproduct by-product. Since 2020, the National Electric System Development Program (PRODESEN-SENER-Mexico) has included green hydrogen, projecting a 1.31% increase in installed capacity in combined-cycle power plants (CCP) to support the partial decarbonization of electricity generation between 2024 and 2038. Furthermore, PRODESEN 2024-2038 [8] has reinforced the role of hydrogen by demonstrating the conversion of 4,368 MW of additional CCP capacity through a 75% CH4 and 25% H2 blending strategy between 2024 and 2038. Therefore, it is a priority to produce green hydrogen immediately, add it at low levels in CCP, and develop prototype electrolysis systems. Gaining operational experience with hydrogen technologies is essential, including system sizing, technical setup, and personnel training. Notably, CCP technology accounts for nearly 40% of Mexico’s electricity generation capacity. Using hydrogen-natural gas blends in gas turbines leverages existing infrastructure, supports modular deployment, reduces reliance on imported natural gas, and helps partially decarbonise electricity production. To meet the goals set in PRODESEN 2024-2038, identifying and analysing case studies in Mexico is crucial for exploring feasible large-scale green hydrogen production options, especially via water electrolysis linked with the nation’s renewable energy resources.
The overall system efficiency of an electrolyser is critically influenced by various factors, including the internal geometry of the electrode supports, which dictates mass transport and gas expulsion dynamics. Electrochemical performance, characterised by parameters such as current density and overpotentials, is directly linked to the design of porous electrodes, bubble management, membranes, and flow fields [9]. Specifically, the efficient removal of generated gas bubbles is vital to prevent coverage of active electrode sites, which can impede reactant access and increase ohmic losses, thereby degrading performance [10]. The geometry of the electrode supports and the flow channels within the electrolyser cell play a significant role in facilitating this gas expulsion and ensuring uniform electrolyte distribution [11]. Suboptimal internal geometries can lead to localised mass transport limitations and increased resistance, ultimately affecting the system’s ability to operate efficiently at higher current densities. Innovative approaches in electrolyser design are crucial for overcoming these limitations and advancing the technology. This includes not only material science breakthroughs for catalysts and membranes but also fundamental engineering modifications to the physical architecture of the cells.
The efficiency and overall performance of an Alkaline Water Electrolysis (AWE) system depend heavily on its core electrochemical components, especially the electrode materials, which directly affect reaction kinetics, overpotential, and long-term stability. Many studies have examined specific aspects to enhance the process’s efficiency and performance. For example, electrode spacing has been shown to be a key factor influencing gas production [12], while porous nickel has been suggested to boost current density [13]. Additionally, optimisation of potassium hydroxide (KOH) concentration in the electrolyte has been analysed to improve gas output [14]. However, undesirable byproducts can form during the process, such as hexavalent chromium resulting from material leaching (stainless steel) during electrolysis [15]. From both economic and technical viewpoints, multicriteria analyses have been conducted to assess diverse water electrolysis technologies [16], alongside reviews that focus on the progress and challenges of anion-exchange membrane (AEM) electrolysis [17]. Moreover, various electrode configurations, including zero-gap designs, have been investigated to reduce energy losses and enhance system efficiency [18].
Studies have shown that nickel electrodes effectively support the electrochemical reactions needed for efficient water splitting. However, pure nickel has limited catalytic activity, particularly for the hydrogen and oxygen evolution reactions, resulting in higher overpotentials [13]. This results in higher energy consumption and reduced system efficiency in real-world use, emphasising the importance of exploring alternative or modified nickel-based materials to enhance performance. Extensive research has focused on developing nickel-based alloys and composites. Among these, nickel-iron (Ni-Fe) alloys stand out due to their improved electrocatalytic activity. When iron is integrated into the nickel matrix, a synergistic effect often occurs, leading to significantly lower overpotentials for both HER at the cathode and OER at the anode, thereby boosting overall energy efficiency. For example, recent research has demonstrated the successful use of NiFe layered double hydroxide (LDH) anodes in commercial alkaline electrolysers for high-performance seawater electrolysis, indicating their potential for practical use and notable efficiency improvements [19]. Relevant studies have reported the use of nickel alloys with molybdenum and tungsten to improve resistance to alkaline corrosion [20], and nickel-cobalt alloys that demonstrate superior performance compared to pure nickel electrodes [21]. Moreover, nickel mesh electrodes combined with catalysts have been utilised to achieve current densities exceeding 1 A cm-2 [22]. Comparative analyses of two-dimensional (2D) and three-dimensional (3D) electrode structures have revealed that 3D electrodes can increase hydrogen production by up to 45%, attributed to their larger active surface area [23]. Additionally, incorporating molybdenum disulfide (MoS2) as an electrocatalyst has been shown to enhance electrical conductivity [24], and cold-spray techniques have enabled the fabrication of porous nickel electrodes by depositing aluminium and nickel layers, followed by selective removal of aluminium [25]. Other studies have evaluated the performance of various anode materials under high-temperature conditions [26], developed bifunctional Ni-Zn/rGO catalysts with high activity for hydrogen evolution [27], and fabricated nanostructured electrodes using ultrashort laser pulses to increase surface area and gas production [28]. Furthermore, CuFe electrocatalysts supported on nickel foam have been proposed to improve gas and electrolyte diffusion during electrolysis [29].
In addition to improving electrode materials, several studies have focused on optimising the balance of plant and auxiliary components. For instance, adding zinc oxide (ZnO) to the alkaline electrolyte initially boosts hydrogen production; however, long-term operation can lead to zinc depositing on the electrode surface, which negatively impacts performance [30]. Researchers have also examined how rectifier topology, energy consumption, and gas quality interrelate in alkaline electrolysis systems [31] and explored the use of external magnetic fields to enhance hydrogen generation [32]. Furthermore, zero-gap configurations—reducing the distance between electrodes and diaphragms—have been shown to decrease ohmic losses [33]. Simulation studies across various operating pressures (1-100 bar) suggest that higher pressures are not always beneficial for overall system performance [34]. Since traditional electrical grids are often used to supply energy during the experimental phases of alkaline electrolysis, recent research has investigated incorporating renewable energy sources to enable green hydrogen production. Examples include photovoltaic modules paired with nickel foam electrodes [35], excess wind energy utilised to operate alkaline electrolysers at rates up to 1 Nm3 h-1 [36], and small 20 W solar panels [37]. Additionally, alternative seawater electrolysis methods have been suggested to avoid chlorine formation, as standard techniques are unsuitable due to anodic chlorine evolution [38]. Other studies report hydrogen production rates of 1.138 g h-1 using photovoltaic panels [39] and the integration of solar panels into wind turbine blades with copper electrodes coated with nickel and nickel-vanadium layers [40]. Numerical modelling and simulation, particularly Computational Fluid Dynamics (CFD), have become indispensable tools in the design and optimisation of electrochemical systems. The complexity of multiphase flow, mass transport, and electrochemical reactions within electrolysers often renders purely experimental approaches time-consuming and expensive. These include simulations of electrode-diaphragm distance and electrolyte concentration effects [41], the development of semi-empirical mathematical models to predict the behaviour of 15 kW systems [42], and the application of Aspen Plus software to simulate the electrolysis process [43]. Additionally, three-dimensional numerical modelling of alkaline electrolysis cells operating with KOH electrolyte at current densities of 2 A m-2 has been performed [44]. Other studies explored how temperature influences system performance [45], developed dynamic models for mass and energy balances in 3 MW industrial plants [46], conducted physical modelling of two-phase hydrogen flow within alkaline electrolysers [47], and simulated large-scale systems, including a 250 kW electrolyser producing 50 Nm3 h-1 of hydrogen [48]. Alkaline electrolysers (AEs) offer various advantages and disadvantages compared to other electrolysis methods, as previously discussed. They are modular, cost-effective, and produced through well-established manufacturing processes. Unlike proton exchange membrane electrolysers (PEM), AEs do not require precious metals for their electrodes, have an operational lifespan of up to 20 years, and tend to be more affordable to produce. In Mexico, initial green hydrogen applications are likely to focus on thermal processes that do not demand strict hydrogen purity standards, making alkaline electrolysis the preferred choice. However, the automotive sector needs very high-purity hydrogen for fuel cell operation. In Mexico, the absence of a domestic electrolyser manufacturing industry underscores the importance of developing and adopting hydrogen technologies. This approach aims to reduce reliance on imported equipment and lower costs. It is crucial to start local production, utilising available materials and gradually adding non-local components as demand grows. Additionally, the design of domestic electrolysers should focus on low-cost manufacturing and easy maintenance, while meeting safety and durability standards.
The initial prototypes of alkaline electrolysers were created in 2014 by a research team at the Instituto Politécnico Nacional. Horcasitas-Verdiguel et al. [49] used the Advanced Product Quality Planning (APQP) methodology to guide the design process. They focused on the first three stages: (1) program definition, (2) product design, and (3) process design. Later, Trujillo-Olivares et al. [50] addressed the subsequent two stages: (4) product validation and (5) process validation. These efforts led to a Technology Readiness Level (TRL) of 5, meaning the electrolysers were validated in a relevant operational environment. At this level, prototypes were tested under real conditions with controlled parameters; however, they could not yet perform all the functions of a fully operational system. It was determined that further development is needed to expand the processes and demonstrate the electrolysers’ industrial viability. The main goal of this study is to develop three alkaline electrolysers with varying internal shapes to demonstrate how this design factor influences performance. Specifically, the study focuses on optimising the internal geometry of electrode supports, which also impacts the overall system efficiency. The integration of structured methodologies like APQP, in combination with TRL, are pivotal for developing, validating, and scaling these advanced electrolyser designs, ultimately contributing to a more efficient and sustainable hydrogen economy. This helps speed up the transition of innovative designs into scalable production systems up to 5 kw. The remainder of this paper is as follows: “Experimental methodology” describes all the experiments carried out, “Results” section shows all the experimental data obtained and the section “Conclusions” reflects on the topics.
2. Materials and Methods
2.1. Methodology
In this study, TRL is used to connect the different APQP stages, helping determine the readiness level required for product commercialisation. TRL is a numerical scale that measures technological maturity, crucial for evaluating the feasibility and applicability of innovations, guiding research and development decisions, and supporting the deployment of advanced technologies in industry and society. Over the past decade, our research group has conducted several projects to advance alkaline electrolysis technology, actively involving postgraduate students. These efforts have contributed significantly at both the theoretical and practical levels, advancing through multiple APQP stages and TRL levels, as illustrated in Figure 1, and were inspired by these methodologies to complement and strengthen the overall development in a more comprehensive and systematic manner. The initial phase involved fundamental scientific research at TRL 1 and APQP Stage 1, focusing on the core principles of alkaline electrolysis, its advantages and disadvantages compared to Proton Exchange Membrane (PEM) and Solid Oxide Electrolysis (SOEC).
In the next phase, the team conducted basic scientific tests and developed small-scale laboratory prototypes, advancing to TRL 2-3 and APQP Stage 2. These activities involved applied research, component design, and controlled experiments using low-capacity electrolysers built at the National Polytechnic Institute (IPN). The research also included concept development and analysis of key operational parameters, contributing to knowledge growth and progressing to APQP Stage 3 and TRL 4 validation in a controlled setting. During this phase, all essential data were carefully gathered to support ongoing improvements and move toward TRL 5. The current scientific work focuses on designing and developing a 5 kW scalable pilot plant, reaching APQP Stage 4 and TRL 5. This pilot plant results from extensive experimental testing, integrating various subsystems and evaluating their performance under relevant environmental conditions. The outcomes show significant enhancements over earlier prototypes, marking an important milestone in the development of alkaline electrolysers and demonstrating their potential for practical and commercial use.
An alkaline electrolyser requires at least two electrodes to function, regardless of its size. Oxygen is produced at the anode through hydroxide ion (OH−) oxidation when a direct current is applied to an alkaline aqueous solution. Simultaneously, hydrogen is generated at the cathode by the reduction of protons from water, as shown in Figure 2.
The development of the 5 kW pilot plant followed multiple stages aligned with the APQP methodology and technological maturity levels. The initial three APQP stages were based on the research group’s prior work. APQP Stage 4, focused on product and process validation, involved scaling up tests with different concentrations of potassium hydroxide (KOH) and sodium hydroxide (NaOH) to assess performance and efficiency. It also verified the new purification and cooling systems, accounting for variables such as gas purity and the optimal operating temperature required for scaling the prototype. These activities correspond to TRL 5-6, where the technology is validated in a relevant industrial environment. The last two APQP stages and the remaining TRL levels cover the full development and readiness of the technology. Currently, the pilot plant project fits within this framework, having identified specific process requirements, including material and equipment selection for alkaline electrolysis, and characterisation of input materials and final product specifications.
The pilot plant is designed to operate between 1 and 5 kW, with components selected to handle different flow demands. Each part is resistant to alkaline corrosion, prevents electrolyte or gas leaks, provides proper electrical insulation, and keeps temperatures within set limits. After starting up, collecting detailed performance data at 5 kW will be crucial for refining the process. This information will inform the development of a larger, industrial-scale alkaline electrolysis plant with greater hydrogen production capacity.
The final stage of the APQP methodology, involving production and feedback, marks the next step in this research. It necessitates collaboration with the industrial sector to validate the pilot plant under real operating conditions, ensuring operation by external third parties outside the laboratory. This phase aligns with TRL levels 7 to 9, which ultimately assess whether the technology is ready for commercial production.
Figure 3 illustrates the APQP methodology, which was crucial for organising the progress of this research. By clearly defining each stage, the project objectives were effectively outlined. The figure shows the APQP diagram adapted to the experimental work. Stage 1 describes the conceptual design of the pilot plant. Stage 2 covers the design of the alkaline electrolysers. In Stage 3, the operation of the 5 kW pilot plant is shown as the process implementation. Stage 4 involved validation through results such as polarisation curves and continuous operation tests. Lastly, Stage 5 uses an Ishikawa diagram as a feedback mechanism to identify and resolve opportunities for improvement.
2.2. Components of the Pilot Plant
2.2.1. Electrolyser
The design of this electrolyser includes two side plates made from AISI 304 stainless steel, chosen for their durability under mechanical pressure and in a corrosive, alkaline environment. The system also features two lateral Nylamid SL reservoirs, carefully sized to provide a steady and adequate electrolyte supply to the electrochemical cell. The electrolyte inlet is conveniently located on the cathode side, below the centre of the side plate, to promote even electrolyte flow across the cell. Meanwhile, the electrolyte outlet is positioned on the anode side, above the center, to ensure efficient removal of gases and electrolyte from the system. The inner reservoirs are made from Nylamid SL with a 5 mm wall thickness, designed to hold a single electrode each. They feature an internal half-moon shape that promotes upward gas flow and allows free electrolyte circulation from the bottom to the top outlet. The electrodes are made of nickel to prevent the formation of hexavalent chromium and to ensure stability in alkaline conditions. To seal the assembly and prevent electrolyte and gas leaks, EPDM gaskets with a Shore A hardness of 90 were used between the reservoirs. This sealing material was chosen for its high resistance to alkaline environments, its ability to withstand high temperatures, and its mechanical strength under compression.
The initial design parameters for the alkaline electrolysers were set based on Faraday’s laws of electrolysis and efficiency data from earlier research by the Hydrogen Research Group of the IPN. These parameters were calculated using the following equations:
The amount of hydrogen generated was determined using Faraday’s law. (Equation 1):
where is the mass of hydrogen produced (g), is the applied current (A), t is the operating time (), and is the electrochemical equivalent of hydrogen, with a value of
The overall efficiency of the electrolyser () was evaluated according to Equation 2:
where is the energy content of the hydrogen produced, and is the total energy consumed by the electrolyser during operation [49]. Table 1 presents the basic parameters for sizing the 5 kW electrolyser.
Using these equations and accounting for the current density commonly employed in laboratory experiments at the IPN [51], as well as the operating point specified in the literature for real conditions [52], it was found that 36 electrodes are needed to achieve the pilot plant’s hydrogen production goal. Based on previous experimental experience and mechanical design constraints, the maximum practical number of electrodes per electrolyser unit has been set at 12 [51].
Exceeding this number would necessitate much higher tightening torque, which could cause gasket deformation and sealing issues. Additionally, having too many electrodes can impair the distribution of electrolyte flow within the electrolyser.
As a result, the pilot plant design included three electrolyser units, each with 12 electrodes, thereby fulfilling the total requirement of 36 electrodes while maintaining mechanical integrity and operational efficiency. The configuration of the three cells is shown in Figure 4 solely to demonstrate their spatial arrangement.
As previously noted, the internal geometry of the electrolyser plays a crucial role in gas removal and temperature rise, directly impacting the system’s overall efficiency. Therefore, three different electrolyser configurations were designed and tested to determine the most efficient setup.
To estimate the theoretical oxyhydrogen gas production for an electrode with a 9.8 cm diameter, an active area of 75.43 cm2 was used. Applying a maximum density of 0.5 A cm-2, the resulting maximum current was 37.5 A. Using Faraday’s laws (Equation 1), the estimated gas output per cell was 0.283 L min-1 at a density of 0.0823 g L-1.
The three electrolysers will be connected in series to ensure continuous and scalable production. Each electrolyser has unique internal geometries designed to optimise electrolyte distribution and the removal of the gas–electrolyte mixture.
- The initial setup, called 1EA, features four half-moon openings placed side by side to the electrode supports. The lower two openings help in distributing the electrolyte, whereas the upper two openings are meant to aid in releasing the biphasic mixture of electrolyte and gases (oxyhydrogen gas) formed during operation.
- The second configuration, called 2EA, includes four concave structures that run almost all around the electrodes. It operates on the same basic principle as the first design, with lower openings for electrolyte flow and upper openings for gas removal.
- The third configuration, called 3EA, features a modified internal half-moon geometry. In this setup, the electrolyte primarily flows through the lower part of the electrolyser, with only a single half-moon opening at the top to allow the biphasic mixture of electrolyte and gases to escape.
The comparative analysis of these three configurations will identify the most efficient geometry regarding gas removal, temperature control, and overall electrochemical performance, as shown in Figure 5.
For EA1, an opening area of 171 mm2 and a total gas evacuation area of 1447 mm2 (up to the dotted line) were designed to theoretically permit the correct removal of generated gases. However, the internal geometry also allowed the gas to descend to this dotted line, as observed in Figure 6a, where a zone that did not become an active area was marked after hours of operation.
For EA2, a larger concave opening area of 257 mm2 and a significantly larger evacuation area of 3766 mm2 were implemented. This similarly ensured adequate gas evacuation. However, this geometry also induced internal turbulence, which resulted in the gas stripping approximately 50% of the electrode’s active area, descending nearly to the dotted line.
In contrast, EA3 featured an opening area of 263 mm2 and a deliberately limited evacuation area of 338 mm2. This configuration was found to maximize the utilization of the electrode’s active area while still permitting the free release of per-minute gas production per cell. As can be observed in Figure 6c, no gas-induced markings displacing the electrolyte were present on the electrode surface.
Several studies have analyzed the effects of vacuum-induced fracture between electrodes, which is associated with the formation and accumulation of gas bubbles [53]. In this work, the geometry designated for gas venting was determined to play a fundamental role in mitigating this phenomenon. Both numerical calculations and experimental results demonstrated that the optimized geometry facilitates the continuous and efficient venting of oxyhydrogen gas, reducing the formation of local voids, bubble coalescence, and pressure fluctuations between electrodes. Consequently, the probability of vacuum fracture is diminished, and the mechanical and electrochemical stability of the system is improved.
2.2.2. Power Supply
Oxyhydrogen gas is produced using direct current (DC) supplied by a Keysight N8920A DC power supply, which provides up to 5 kW at 80 V and 170 A. The pilot plant operates at 5 kW with a current density of 0.5 A·cm−2 and an efficiency of 50%. Its performance is evaluated whenever an electrode is added, as increasing the number of electrodes raises both the active surface area and the electrical resistance. To characterise the system, the current is gradually increased, and the resulting voltage response is recorded at each step. These data are used to plot the voltage–current (V–I) characteristic curve of the electrolyser, aiding in the analysis of its electrochemical behaviour.
2.2.3. Phase Separator
After the electrolysis inside the electrolyser, the electrolyte flow and oxyhydrogen gas are directed to a phase separator. This device retains the electrolyte and recirculates it back to the electrolyser, while allowing the gas to escape freely through an upper outlet. Made of stainless steel, the separator has a 3 L capacity and features horizontal plates at the top to slow gas flow and encourage condensation of electrolyte vapour. It also includes a housing for a polypropylene mesh demister, which captures most of the vapour. Additionally, the separator has a double-jacketed design, with a secondary jacket that circulates antifreeze solution to control the temperature without direct contact with the electrolyte.
2.2.4. Purification System
The purification system is intended to eliminate residual electrolyte from the oxyhydrogen gas produced during electrolysis. Due to the high temperatures inside the electrolyser, the formation of electrolyte microdroplets and vapour is unavoidable. If these contaminants are not properly filtered out, they could affect the quality and efficiency of the processes that use the gas. The system includes four main parts: the primary bubbler, vapour trap, dryer, and secondary bubbler. Water conductance was measured with a conductivity meter (Conductronic PC45) with a measurement range 0.1 - 200 mS cm-1.
The primary bubbler is the initial stage following the phase separator. In this device, gas is introduced at the bottom of a container filled with deionised water. Its main role is to trap microdroplets of electrolyte, thus preventing them from advancing to the drying stage. The internal design features a coiled structure that promotes condensation and captures any residual electrolyte vapour after phase separation. Because the gas has a lower density, it rises to the next part, the dryer.
The vapour trap is placed downstream of the primary bubbler to collect any residual electrolyte vapour. It works by encouraging condensation using a polypropylene mesh fabric. The device features a bottom cap that functions as a drainage outlet for the condensed liquid.
The dryer consists of a container filled with silica gel, a desiccant that absorbs residual moisture from the oxyhydrogen gas. By this point, most electrolyte contaminants have been eliminated, but since the gas has traversed water-containing devices, removing any remaining moisture is essential to maintain gas purity. Ultimately, the secondary bubbler serves to confirm electrolyte carryover before the gas is used.
The secondary bubbler checks for electrolyte carryover before de-gassing by measuring water conductivity. The conductivity should remain below 50 µS cm-1 for 8 hours, indicating water quality comparable to rainwater or drinking water [54].
2.2.5. Flowmeter
An Alicat mass flowmeter with a 0–20 SLPM range measures oxyhydrogen gas production by tracking the volumetric flow rate passing through the system and calculating the hydrogen and oxygen generated during electrolysis. It also adjusts data to standard conditions, accounting for altitude and temperature variations. This device is essential because its data is used to determine the system’s overall efficiency.
2.2.6. Characterisation Protocol for Alkaline Electrolysers
A standard characterisation protocol, described below, was implemented to obtain a rectified and reproducible performance curve.
A sequence of current pulses was applied to obtain the I–V curve, with the current intensity varying at specific times. During each pulse, the system’s voltage response was recorded. The current range was based on parameters summarized in Figure 5. The protocol starts with a 10 A current for 25 minutes to activate the system, then gradually increases until reaching 50 A. This step is crucial to prevent the “Champagne effect,” which occurs when a rapid increase in current causes excessive gas production, risking electrolyte expulsion like opening a pressurised liquid bottle [55]. The overall electrolyser characterisation protocol and its graphical behaviour are shown in Figure 6.
Once the maximum current of 50 A is achieved, the system maintains this level until the electrolyte temperature hits 70 °C. Then, the current is gradually decreased in 5 A increments, stopping at 0 A. Each current level is held for 5 minutes or until a stable voltage is reached. During each step, the voltage and gas flow rate are recorded to develop the I–V curve and determine the electrolyser efficiency.
A direct reduction from 50 A to 0 A isn’t feasible because a swift current decrease creates a pressure difference between the phase separator and the bubbler, resulting in a vacuum. This vacuum causes water from the bubbler to be sucked into the separator, which dilutes and contaminates the electrolyte. To ensure repeatability, each curve is measured three times. In later tests, the current is increased by 5 A increments until the maximum is reached.
3. Results
The pilot plant is a small-scale setup used to test, validate, and optimize industrial processes before scaling up. It allows assessment of performance, safety, and the technical and economic feasibility of prototypes. Figure 7(a) illustrates the 0.5–5 kW pilot plant for oxyhydrogen gas production, with components previously described, which was used for all testing. Figure 7(b) displays the process diagram of the pilot plant’s operation.
Each electrolyser’s performance was evaluated individually. However, since the pilot plant requires all three units to operate simultaneously, three configurations were tested by temporarily excluding one unit and operating only two at a time. The first setup included EA1 & EA2; the second, EA2 & EA3; and the third, EA1 & EA3. The characteristic curves for each configuration are shown in Figure 8(a). The EA2 & EA3 configuration showed the lowest resistance, needing a lower voltage at the same current compared to the others. However, as seen in Figure 8(b), this is because EA2 & EA3 stayed in the activation stage, while the other combinations were already in the production phase. This is mainly due to EA2’s lower gas output, caused by slower gas removal. Ultimately, the EA1 & EA3 setup performed the best, likely thanks to its internal design optimized for gas evacuation, leading to higher efficiency in oxyhydrogen gas production.
Figure 9(a) depicts a section of the process diagram, highlighting the parallel connection of electrolyte circuits from three electrolysers. This setup ensures that gases produced flow directly to the phase separator.
Two temperature sensors are visible—one at the inlet and one at the outlet of the phase separator—used to measure and control the electrolyte temperature. When temperatures surpass 80 °C, the cooling system activates; it deactivates once the temperature drops to 70 °C. This control strategy stabilizes the system and prevents efficiency loss. Figure 9(b) shows the series configuration of the direct current power supply supplying the three electrolysers. This arrangement was chosen to keep the same current through all units while monitoring the overall voltage required.
Figure 10(a) presents the data obtained and the overall performance curve of the pilot plant, reaching an energy consumption of 5 kW and a maximum oxyhydrogen gas production of 10 SL min-1 at 45% of energetic efficiency. The optimal and stable production rate is 6 SL min-1 at 50% of efficiency. The total operating time of the pilot plant exceeded 100 hours. However, these tests were conducted under two different configurations (series and parallel) and at various operating points (0.3, 0.5, and 0.55 A cm-1) in order to observe temperature variations and assess the response of the temperature control system, as well as the overall stability of the system under these changing conditions. Each test was carried out for a minimum duration of 4 hours and up to a maximum of 12 hours, until the cumulative total of 100 hours was reached. The most representative tests are presented in Figure 10(c). Figure 10(d) shows the pilot plant operating at 0.5 A cm-2 for a duration of seven hours, maintaining a stable production rate. After four hours of operation, a modification was made to the cooling system, which is reflected in the data; however, the system eventually re-stabilized. Following the start-up phase, the voltage-to-flow ratio of the oxygen-hydrogen mixture stabilized and remained constant throughout the test, allowing the identification of optimal operating conditions for pilot plant.
As a final observation, it was found that at the optimal current density of 0.5 A cm-2 (equivalent to 37.5 A), a gas flow rate of 7 SL min-1 was achieved. However, after 100 hours of continuous operation, increasing the current density to approximately 0.65 A cm-2 (48 A) was necessary to maintain the same production rate, Figure 10(b). This increase in current is attributed to the previously described cathode passivation phenomenon, which reduces the active surface area and requires a higher current supply to sustain the oxyhydrogen gas generation rate.
At the current stage of the project—corresponding to Technology Readiness Level (TRL) 6—the 5 kW alkaline electrolysis pilot plant operates as an integrated test bench, where product and manufacturing technologies converge within the same environment. The unit cell, cooling system, temperature instrumentation, and drying line have been assembled using the exact materials, tolerances, and inspection plans that would be applied in a future semi-commercial production line. This approach ensures that all aspects related to manufacturability, from machining of the plates and electrodes to the nickel-plating procedures, are assessed under industrial, rather than merely laboratory, conditions.
The alignment between the new product and manufacturing technologies is further supported by the deliberate selection of processes already mastered by the supply chain, including laser cutting, CNC machining of bipolar plates, mechanical processing of inlet/outlet nozzles, and electrolytic nickel coating on stainless steel. For the latter, the critical current parameter was set at 40 A for 20 minutes, following a correlation between theoretical efficiency and deposited mass. In this way, the cell requirements have been matched to existing production capabilities, thereby avoiding bottlenecks during scale-up to larger production batches.
External users—including the Puebla Technologic University, the Interdisciplinary Professional Engineering Unit, Hidalgo Campus (UPIIH-IPN), and Higher School of Mechanical and Electrical Engineering, Culhuacan Unit (ESIME Culhuacán-IPN) have successfully conducted tests on these pilot units without significant complications. Feedback from these users is expected to help identify opportunities for improvement. Simultaneously, the operational structure has been redefined to meet the needs of this development phase. The team will conduct marketing segmentation studies and will calculate the levelized cost of hydrogen at 30 bar, while also ensuring the traceability of electrode and electrolyte batches. The APQP methodology will be applied to document risks and critical controls. In parallel, ISO 9001 certification of the pilot plant will be initiated in order to validate testing protocols and formally certify the results obtained. Collectively, these advancements demonstrate that the technology has transcended the laboratory stage, operates through real production processes, involves external users, and is undergoing formal certification procedures, thus fulfilling the criteria established for TRL 6.
4. Discussion
The results obtained during the development and operation of the 5 kW alkaline electrolysis pilot plant confirm that the scaling of these systems cannot be addressed solely by increasing electrical power or the number of cells. An integrated consideration of electrochemical, geometric, thermal, and fluid dynamic aspects is required. In this context, the application of the Advanced Product Quality Planning (APQP) methodology allowed the design and validation process to be structured, enabling the early identification of critical failures, particularly those related to electrolyte carryover. One of the main contributions of this work is the adaptation of the internal geometry of the electrode support and the internal volumes, which allowed the reduction of electrolyte carryover toward the gas outlets. This phenomenon is common in membrane-free alkaline systems and tends to intensify during scaling due to increased gas flow rates and gas–liquid interaction in confined spaces. The implemented geometric modifications demonstrated that this effect can be mitigated without resorting to complex external solutions, resulting in a more compact and robust design.
From an electrochemical perspective, the use of pure nickel electrodes showed stable behavior under the established operating conditions (40 A and 80 V), in agreement with reports in the literature for concentrated alkaline media. The overall efficiency achieved, close to 42%, reflects both the inherent losses of the alkaline electrolysis process and the limitations of a pilot-scale system. However, this value is relevant considering that the main objective was the validation of the scaling strategy and operational stability with three electrolysers operating simultaneously. The oxyhydrogen production flow rate of 10 L min−1 shows a consistent relationship between the supplied electrical power and gas production, validating the correct application of Faraday’s law during the design stage. In addition, the stability of the measured flow suggests that thermal management and electrolyte circulation were adequate, preventing significant fluctuations during operation.
Finally, although the system presents limitations inherent to its membrane-free configuration, the results demonstrate that an appropriate geometric design, supported by a structured methodological planning approach, allows stable and reproducible performance to be achieved at the pilot-plant level, providing a solid basis for higher-power developments.
5. Conclusions
The primary objective was to meticulously design, simulate, and subsequently fabricate three distinct alkaline electrolysers, each incorporating a modified internal geometry for their electrode supports. This approach is intended to unequivocally demonstrate how precise alterations in this fundamental design parameter can significantly affect the overall electrochemical performance and system efficiency. A crucial ambition of this study is to elevate the technological readiness level (TRL) of these electrolyser designs from TRL5 to TRL6, thereby bridging the crucial gap between controlled laboratory validation and a demonstration in a relevant operational environment. This advancement is essential for scaling up the developed electrolysers towards a production system capable of generating up to 5 kW of hydrogen, marking a significant step towards commercial viability and providing a solid foundation for the refinement and adoption of this technology in large-scale industrial environments.
A pilot plant for high-purity oxyhydrogen gas production was successfully tested, as evidenced by the near-complete removal of electrolyte carryover from the gas stream. This shows that the proposed system can provide oxyhydrogen flows capable of supporting larger-scale operations. To assess the effects of internal design, three alkaline electrolysers with different internal configurations were designed, simulated, and constructed. Testing revealed that small variations in internal diameters notably affected the applied voltage, temperature, and gas flow rate, highlighting the importance of meticulous design to maximise efficiency. Among the options, EA2 performed the worst due to inadequate gas removal, resulting in higher internal temperatures, higher voltages, and lower efficiency.
Additionally, the serial and combined tests aimed to achieve a production rate of 10 L min-1 at 5 kW power, but the system maintained a stable output of about 6 L min-1 for over 100 hours. These results support the potential to scale up the system for industrial use, where higher production rates and longer operational periods are essential.
6. Patents
Industrial design registration title No. 73935, 72723 and 73936. IMPI
Author Contributions
Conceptualisation and Writing, A.W.-F.; methodology, R. M.-S.; resources, J.M.S.-P. and R.G.G.-H.; formal analysis, R.G.G.-H.; review and editing, L.A.F.-H. and R.R.-B.; supervision, I. T.-O.; validation, J.M.S.-P. and R.G.G.-H.; All authors have read and agreed to the published version of the manuscript.
Funding
The authors thank SECIHTI for recognising the LANH2 project and for funding ApoyoLN-2025-I-26, and the Instituto Politécnico Nacional for supporting the following projects: ProRed 20254750, SIP innovation 20254896, multidisciplinary 2388 and SIP 20253687.
Acknowledgments
The Authors acknowledge the Instituto Politécnico Nacional (IPN), the Secretaría de Ciencia, Humanidades, Tecnología e Innovación (SECIHTI) and the Comisión de Operación y Fomento de Actividades Académicas (COFAA) del IPN, for their contribution to the development of this academic research. The authors have reviewed and edited the output and take full responsibility for the content of this publication.
Conflicts of Interest
The authors declare no conflicts of interest. The funders had no role in the design of the study; in the collection, analyses, or interpretation of data; in the writing of the manuscript; or in the decision to publish the results.
References
- Candra, O.; Chammam, A.; Alvarez, J. R. N.; Muda, I.; Aybar, H. Ş. “The Impact of Renewable Energy Sources on the Sustainable Development of the Economy and Greenhouse Gas Emissions”. Sustainability 2023, 15, 2104. [Google Scholar] [CrossRef]
- Mehrpooya, M.; Asadnia, M.; Hossein Karimi, A.; Allahyarzadeh-Bidgoli, A. “How to use renewable energy sources in polygeneration systems?”. In Hybrid Energy Systems Series, Hybrid Poly-Generation Energy Systems; Academic Press, 2024; pp. 11–123. ISBN 9780323983662. [Google Scholar] [CrossRef]
- Qazi, A.; Hussain, F.; ABD. Rahim, N.; Hardaker, G.; Alghazzawi, D.; Shaban, K. “Towards Sustainable Energy: A Systematic Review of Renewable Energy Sources, Technologies, and Public Opinions”. IEEE Access 2019, 7, 63837–63851. [Google Scholar] [CrossRef]
- Jayachandran, M.; Kumar Gatla, R.; Flah, A.; H. Milyani, A.; M. Milyani, H.; Blazek, V. “Challenges and Opportunities in Green Hydrogen Adoption for Decarbonizing Hard-to-Abate Industries: A Comprehensive Review”. IEEE Access 2024, 12, 23363–23388. [Google Scholar] [CrossRef]
- Henao, C.; Agbossou, K.; Hammoudi, M.; Dubé, Y.; Cardenas, A. “Simulation tool based on a physics model and an electrical analogy for an alkaline electrolyser”. Journal of Power Sources, Volume 2014, 250, Pages 58–67. [Google Scholar] [CrossRef]
- Gambou, F.; Guilbert, D.; Zasadzinski, M.; Rafaralahy, H. “A Comprehensive Survey of Alkaline Electrolyser Modeling: Electrical Domain and Specific Electrolyte Conductivity”. Energies 2022, 15, 3452. [Google Scholar] [CrossRef]
- Ley de la industria eléctrica 2025. Published in the DIARIO OFICIAL DE LA FEDERACIÓN. 18 March 2025. Available online: https://www.diputados.gob.mx/LeyesBiblio/ref/lse/LSE_orig_18mar25.pdf.
- PRODESEN 2024-2038, SENER. 26 January 2026. Available online: https://www.cenace.gob.mx/Docs/16_MARCOREGULATORIO/Prodecen/20%202024-2038%20Cap%C3%ADtulos%201%20al%206.pdf.
- Iwakura, C.; Inoue, H.; Nohara, S. “Hydrogen–Metal Systems: Electrochemical Reactions (Fundamentals and Applications)”. In Encyclopedia of Materials: Science and Technology; Buschow, K.H. Jürgen, Cahn, Robert W., Flemings, Merton C., Ilschner, Bernhard, Kramer, Edward J., Mahajan, Subhash, Veyssière, Patrick, Eds.; Elsevier, 2001; pp. 3923–3941. ISBN 9780080431529. [Google Scholar] [CrossRef]
- Zhang, S.; Zhu, X.; Qiu, J.; Xu, C.; Wang, Y.; Feng, X. “Modeling and Simulation of a Gas-Exhaust Design for Battery Thermal Runaway Propagation in a LiFePO4 Module”. Batteries 2024, 10, 176. [Google Scholar] [CrossRef]
- Silich, S.; Tenorio-Tagle, G. “Gas expulsion versus gas retention in young stellar clusters–II. Effects of cooling and mass segregation”. Monthly Notices of the Royal Astronomical Society 2018, 478, 5112–5122. [Google Scholar] [CrossRef]
- Hammoudi, M.; Henao, C.; Agbossou, K.; Dubé, Y.; Doumbia, M. L. New multi-physics approach for modelling and design of alkaline electrolysers. Int J Hydrogen Energy 2012, 37, 13895–13913. [Google Scholar] [CrossRef]
- Sandeep, K. C.; Kamath, S.; Mistry, K.; Kumar M, A.; Bhattacharya, S.K.; Bhanja, K.; Mohan, S. Experimental studies and modeling of advanced alkaline water electrolyser with porous nickel electrodes for hydrogen production. Int J Hydrogen Energy 2017, 42, 12094–12103. [Google Scholar] [CrossRef]
- Haug, P.; Koj, M.; Turek, T. Influence of process conditions on gas purity in alkaline water electrolysis. Int J Hydrogen Energy 2017, 42, 9406–9418. [Google Scholar] [CrossRef]
- Soriano Moranchell, F. A.; Sandoval Pineda, J. M.; Hernández Pérez, J. N.; Silva-Rivera, U. S.; Cortes Escobedo, C. A.; González Huerta, R. de G. Electrodes modified with Ni electrodeposition decrease hexavalent chromium generation in an alkaline electrolysis process. Int J Hydrogen Energy 2020, 45, 13683–13692. [Google Scholar] [CrossRef]
- d’Amore-Domenech, R.; Santiago, Ó.; Leo, T. J. Multicriteria analysis of seawater electrolysis technologies for green hydrogen production at sea. Renewable and Sustainable Energy Reviews 2020, 133, 110166. [Google Scholar] [CrossRef]
- Li, C.; Baek, J. B. The promise of hydrogen production from alkaline anion exchange membrane electrolysers. Nano Energy 2021, 87, 106162. [Google Scholar] [CrossRef]
- Grigoriev, S. A.; Fateev, V. N.; Millet, P. “Alkaline Electrolysers”. In Comprehensive Renewable Energy; Jan 2022; pp. 459–472. ISBN 9780128197349. [Google Scholar] [CrossRef]
- Liu, H.; Shen, W.; Jin, H.; Xu, J.; Xi, P.; Dong, J.; Zheng, Y.; Qiao, S. Z. “High-Performance Alkaline Seawater Electrolysis with Anomalous Chloride Promoted Oxygen Evolution Reaction”. Angew Chem Int Ed Engl. 2023, 62, e202311674. [Google Scholar] [CrossRef]
- Allam, M.; Benaicha, M.; Dakhouche, A. Electrodeposition and characterization of NiMoW alloy as electrode material for hydrogen evolution in alkaline water electrolysis. Int J Hydrogen Energy 2018, 43, 3394–3405. [Google Scholar] [CrossRef]
- Gomez Vidales, A.; Choi, K.; Omanovic, S. “Nickel-cobalt-oxide cathodes for hydrogen production by water electrolysis in acidic and alkaline media”. Int J Hydrogen Energy 2018, 43, 12917–12928. [Google Scholar] [CrossRef]
- Gillespie, M. I.; Kriek, R. J. “Scalable hydrogen production from a mono-circular filter press Divergent Electrode-Flow-Through alkaline electrolysis stack”. J Power Sources 2018, 397, 204–213. [Google Scholar] [CrossRef]
- de Radiguès, Q.; Thunis, G.; Proost, J. “On the use of 3-D electrodes and pulsed voltage for the process intensification of alkaline water electrolysis”. Int J Hydrogen Energy 2019, 44, 29432–29440. [Google Scholar] [CrossRef]
- Liu, S.; Li, S.; Sekar, K.; Li, R; Zhu, Y.; Xing, R.; Nakata, K.; Fujishima, A. “Hierarchical ZnS@C@MoS2 core-shell nanostructures as efficient hydrogen evolution electrocatalyst for alkaline water electrolysis”. Int J Hydrogen Energy 2019, 44, 25310–25318. [Google Scholar] [CrossRef]
- Jiang, X.G.; Zhang, Y.P.; Song, C.; Xie, Y.C.; Liu, T.K.; Deng, C.M.; Zhang, N.N. “Performance of nickel electrode for alkaline water electrolysis prepared by high pressure cold spray”. Int J Hydrogen Energy 2020, 45, 33007–33015. [Google Scholar] [CrossRef]
- Mutlu, R. N.; Kucukkara, I.; Gizir, A. M. “Hydrogen generation by electrolysis under subcritical water condition and the effect of aluminium anode”. Int J Hydrogen Energy 2020, 45, 12641–12652. [Google Scholar] [CrossRef]
- Feng, Z.; Zhang, H.; Gao, B.; Lu, P.; Li, D.; Xing, P. “Ni–Zn nanosheet anchored on rGO as bifunctional electrocatalyst for efficient alkaline water-to-hydrogen conversion via hydrazine electrolysis”. Int J Hydrogen Energy 2020, 45, 19335–19343. [Google Scholar] [CrossRef]
- Poimenidis, I. A.; Tsanakas, M. D.; Papakosta, N.; Klini, A.; Farsari, M.; Moustaizis, S. D.; Loukakos, P. A. “Enhanced hydrogen production through alkaline electrolysis using laser-nanostructured nickel electrodes”. Int J Hydrogen Energy 2021, 46, 37162–37173. [Google Scholar] [CrossRef]
- Bhavanari, M.; Lee, K. R.; Tseng, C. J.; Tang, I. H.; Chen, H. H. “CuFe electrocatalyst for hydrogen evolution reaction in alkaline electrolysis”. Int J Hydrogen Energy 2021, 46, 35886–35895. [Google Scholar] [CrossRef]
- Horri, B. A.; Choolaei, M.; Chaudhry, A.; Qaalib, H. A highly efficient hydrogen generation electrolysis system using alkaline zinc hydroxide solution. Int J Hydrogen Energy 2019, 44, 72–81. [Google Scholar] [CrossRef]
- Speckmann, F. W.; Bintz, S.; Birke, K. P. “Influence of rectifiers on the energy demand and gas quality of alkaline electrolysis systems in dynamic operation”. Appl Energy 2019, 250, 855–863. [Google Scholar] [CrossRef]
- Purnami, P.; Hamidi, N.; Sasongko, M. N.; Widhiyanuriyawan, D.; Wardana, I. N. G. “Strengthening external magnetic fields with activated carbon graphene for increasing hydrogen production in water electrolysis”. Int J Hydrogen Energy 2020, 45, 19370–19380. [Google Scholar] [CrossRef]
- Haverkort, J. W.; Rajaei, H. “Voltage losses in zero-gap alkaline water electrolysis”. J Power Sources 2021, 497, 229864. [Google Scholar] [CrossRef]
- Jang, D.; Cho, H. S.; Kang, S. “Numerical modeling and analysis of the effect of pressure on the performance of an alkaline water electrolysis system”. Appl Energy 2021, 287, 116554. [Google Scholar] [CrossRef]
- Dukić, A.; Firak, M. “Hydrogen production using alkaline electrolyser and photovoltaic (PV) module”. Int J Hydrogen Energy 2011, 36, 7799–7806. [Google Scholar] [CrossRef]
- Ziems, C.; Tannert, D.; Krautz, H. J. “Project presentation: Design and installation of advanced high pressure alkaline electrolyser-prototypes”. Energy Procedia 2012, 29, 744–753. [Google Scholar] [CrossRef]
- de Fátima Palhares, D. D’A.; Martins Vieira, L. G.; Ribeiro Damasceno, J. J. “Hydrogen production by a low-cost electrolyser developed through the combination of alkaline water electrolysis and solar energy use”. Int J Hydrogen Energy 2018, 43, 4265–4275. [Google Scholar] [CrossRef]
- Amikam, G.; Nativ, P.; Gendel, Y. “Chlorine-free alkaline seawater electrolysis for hydrogen production”. Int J Hydrogen Energy 2018, 43, 6504–6514. [Google Scholar] [CrossRef]
- Kovač, A.; Marciuš, D.; Budin, L. “Solar hydrogen production via alkaline water electrolysis”. Int J Hydrogen Energy 2019, 44, 9841–9848. [Google Scholar] [CrossRef]
- Demirdelen, T.; Ekinci, F.; Mert, B. D.; Karasu, İ.; Tümay, M. “Green touch for hydrogen production via alkaline electrolysis: The semi-flexible PV panels mounted wind turbine design, production and performance analysis”. Int J Hydrogen Energy 2020, 45, 10680–10695. [Google Scholar] [CrossRef]
- Amores, E.; Rodríguez, J.; Carreras, C. “Influence of operation parameters in the modeling of alkaline water electrolysers for hydrogen production”. Int J Hydrogen Energy 2014, 39, 13063–13078. [Google Scholar] [CrossRef]
- Sánchez, M.; Amores, E.; Rodríguez, L.; Clemente-Jul, C. “Semi-empirical model and experimental validation for the performance evaluation of a 15 kW alkaline water electrolyser”. Int J Hydrogen Energy 2018, 43, 20332–20345. [Google Scholar] [CrossRef]
- Sánchez, M.; Amores, E.; Abad, D.; Rodríguez, L.; Clemente-Jul, C. “Aspen Plus model of an alkaline electrolysis system for hydrogen production”. Int J Hydrogen Energy 2020, 45, 3916–3929. [Google Scholar] [CrossRef]
- Lee, J.; Alam, A.; Ju, H. “Multidimensional and transient modeling of an alkaline water electrolysis cell”. Int J Hydrogen Energy 2021, 46, 13678–13690. [Google Scholar] [CrossRef]
- Jang, D.; Choi, W.; Cho, H. S.; Cho, W. C.; Kim, C. H.; Kang, S. “Numerical modeling and analysis of the temperature effect on the performance of an alkaline water electrolysis system”. J Power Sources 2021, 506, 230106. [Google Scholar] [CrossRef]
- Sakas, G.; Ibáñez-Rioja, A.; Ruuskanen, V.; Kosonen, A.; Ahola, J.; Bergmann, O. “Dynamic energy and mass balance model for an industrial alkaline water electrolyser plant process”. Int J Hydrogen Energy 2022, 47, 4328–4345. [Google Scholar] [CrossRef]
- Coskun Avci, A.; Toklu, E. A new analysis of two phase flow on hydrogen production from water electrolysis. Int J Hydrogen Energy 2022, 47, 6986–6995. [Google Scholar] [CrossRef]
- Ren, Z.; Wang, J.; Yu, Z.; Zhang, C.; Gao, S.; Wang, P. “Experimental studies and modeling of a 250-kW alkaline water electrolyser for hydrogen production”. J Power Sources 2022, 544, 231886. [Google Scholar] [CrossRef]
- Horcasitas-Verdiguel, M.; Sandoval-Pineda, J. M.; Grunstein-Ramírez, B. A.; Terán-Balaguer, L. F.; González-Huerta, R. de G. “Design and manufacture of ice test module to reduce gasoline consumption using oxyhydrogen gas from an alkaline electrolyser”. Energy & Fuels 2016, 30, 6640–6645. [Google Scholar] [CrossRef]
- Trujillo-Olivares, I.; Soriano-Moranchel, F.; Álvarez-Zapata, L. A.; González-Huerta, R. de G.; Sandoval-Pineda, J. M. “Design of alkaline electrolyser for integration in diesel engines to reduce pollutants emission”. International Journal of Hydrogen Energy 2019, 44, 25277–25286. [Google Scholar] [CrossRef]
- Xia, Y.; Cheng, H.; He, H.; Wei, W. “Efficiency and consistency enhancement for alkaline electrolysers driven by renewable energy sources”. Commun Eng 2023, 2, 22. [Google Scholar] [CrossRef]
- Zeng, K.; Zhang, D. “Recent progress in alkaline water electrolysis for hydrogen production and applications”. Progress in Energy and Combustion Science 2010, 36, 307–326. [Google Scholar] [CrossRef]
- Nagai, N.; Takeuchi, M.; Kimura, T.; Oka, T. “Existence of optimum space between electrodes on hydrogen production by water electrolysis”. International Journal of Hydrogen Energy 2003, 28, 35–41. [Google Scholar] [CrossRef]
- Trujillo-Olivares, I.; Wintergerst-Felipe, A.; Gutiérrez-Paredes, G. J.; González-Huerta, R. de G.; Sandoval-Pineda, J. M. “Dual combustion oxyhydrogen-diesel: Effects on internal components of engine”. International Journal of Hydrogen Energy 2024, 49, 178–192. [Google Scholar] [CrossRef]
- Godula Jopek, A. “Hydrogen Production: by Electrolysis”; Wiley-VCH: Weinheim, Germany, 2015. [Google Scholar]
Figure 1.
Methodologies Integration used in the development of the alkaline electrolyser.
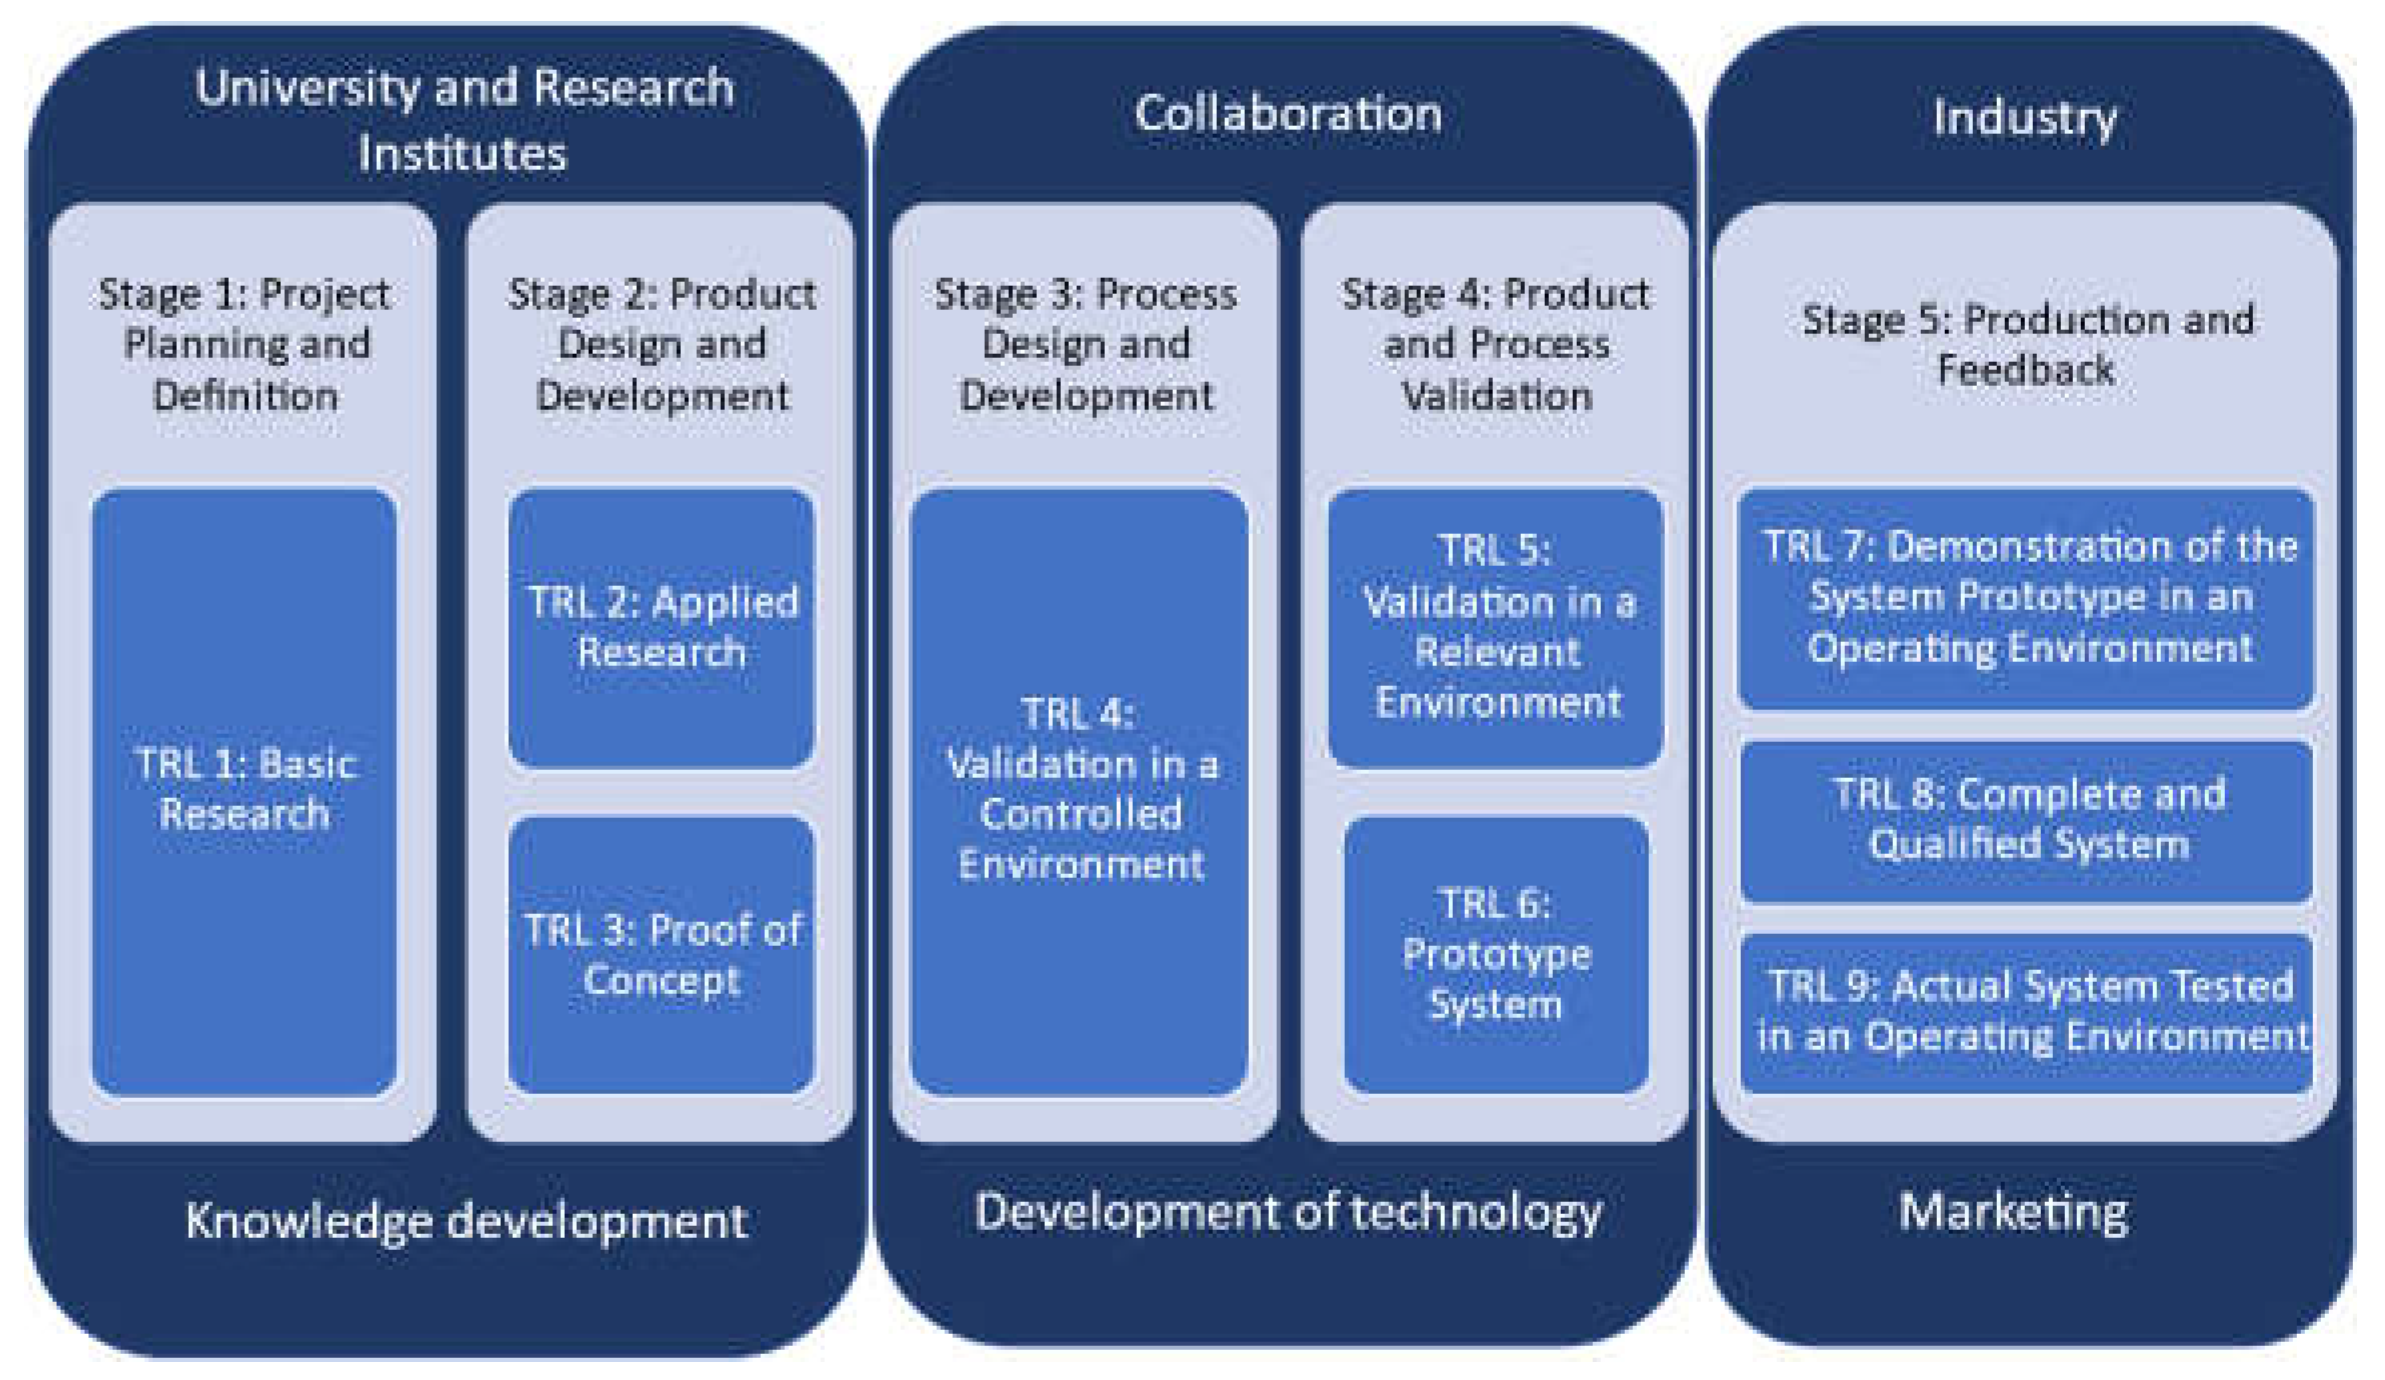
Figure 2.
Electrochemical reactions and ionic transport in alkaline water electrolysis.
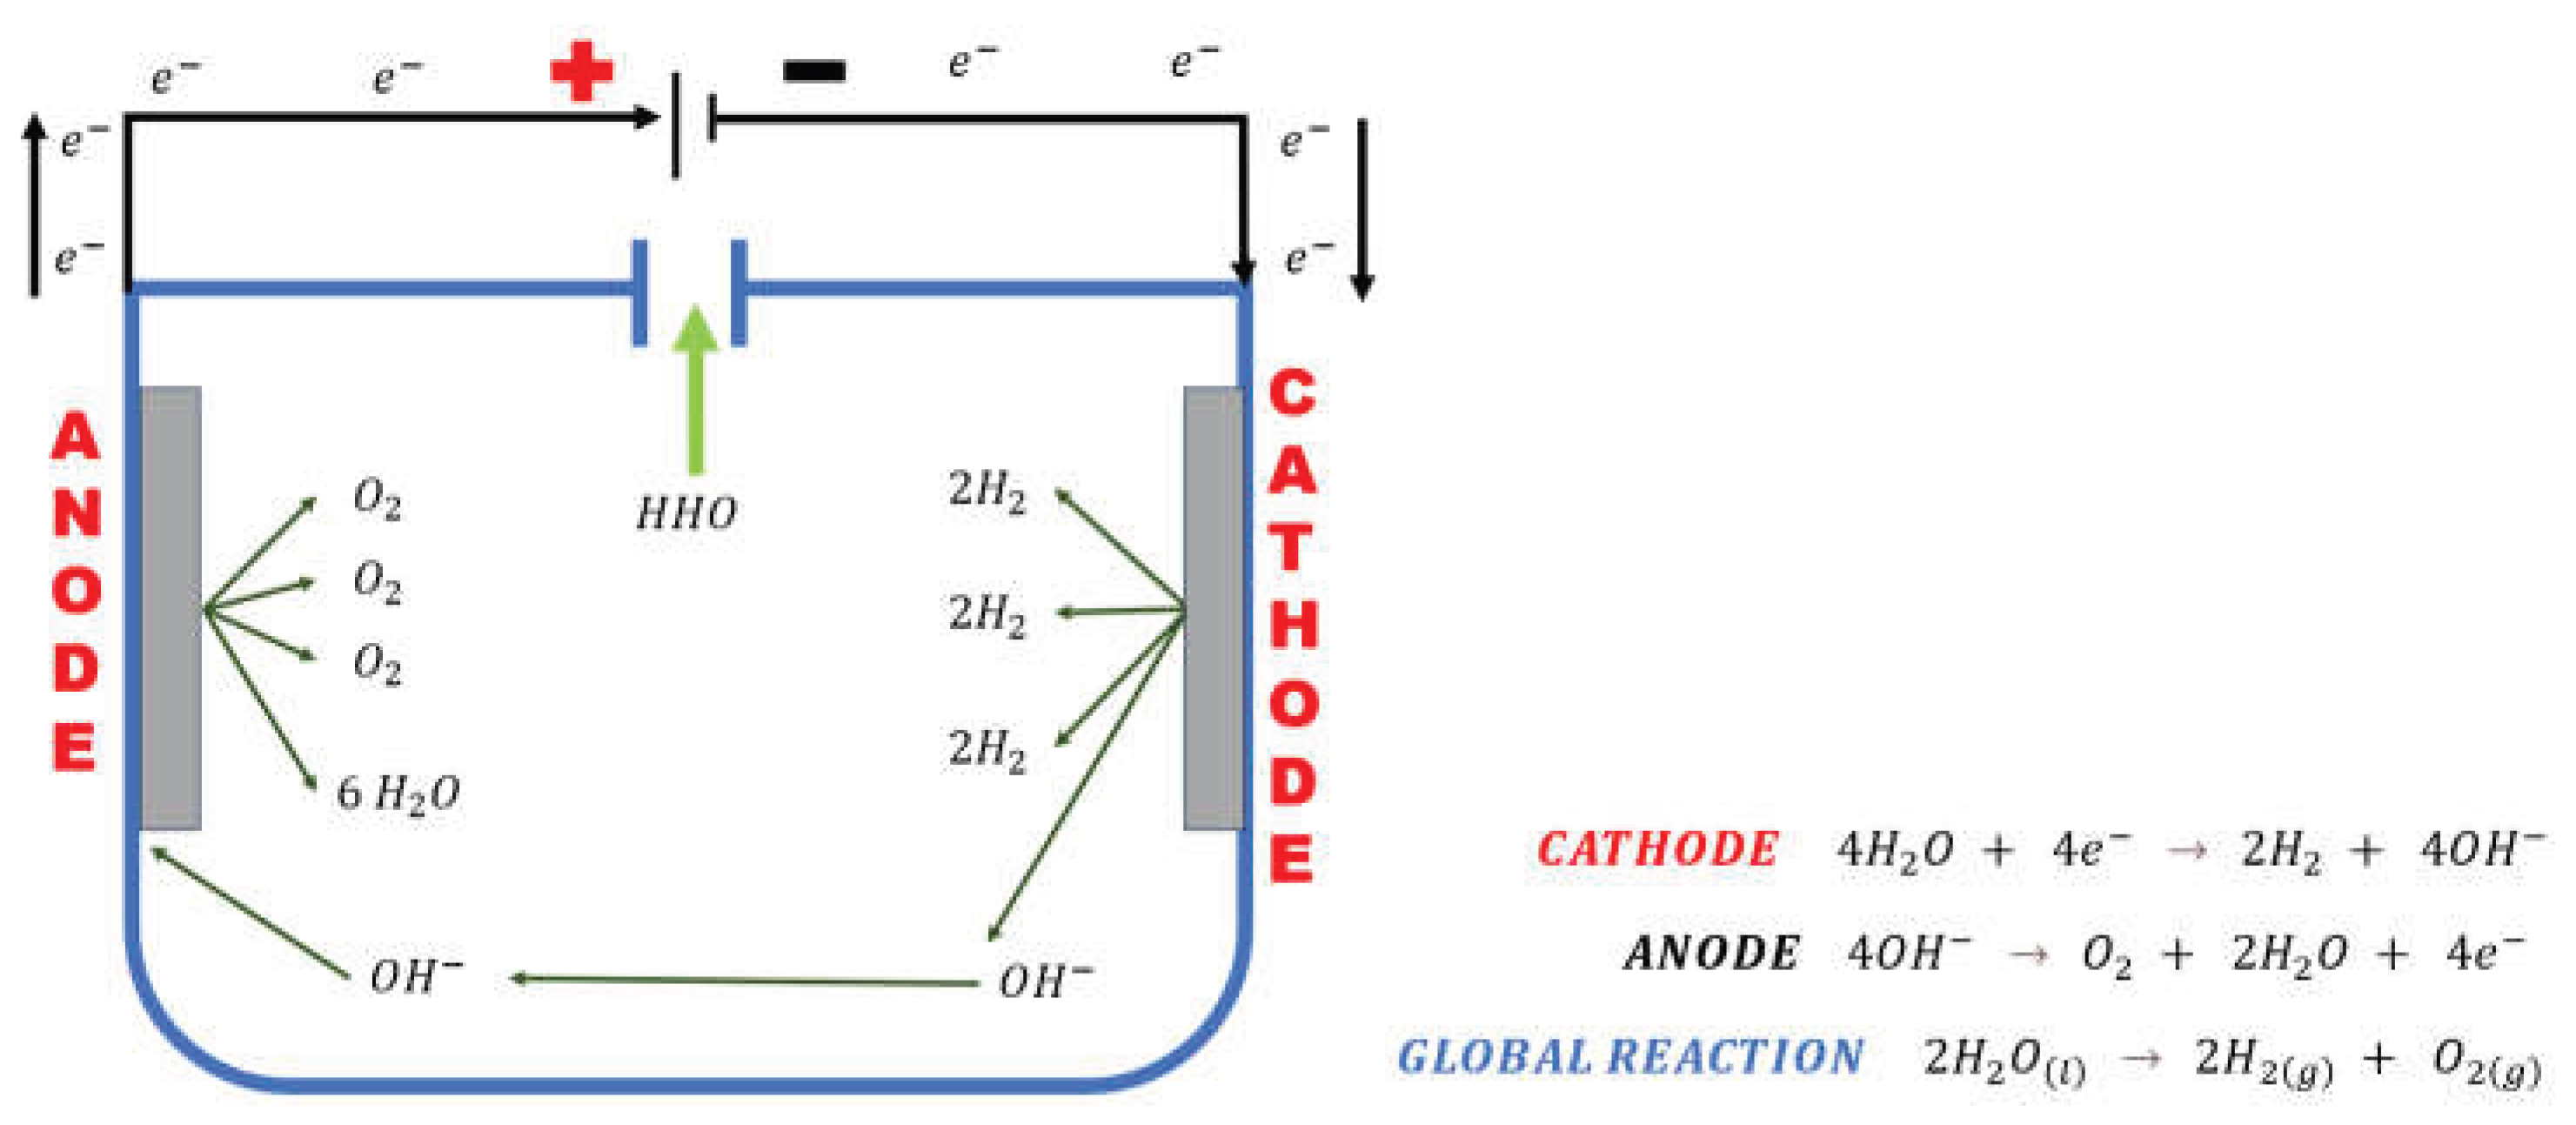
Figure 3.
Adapted APQP-based development framework applied to the design and assembly process of an alkaline electrolyser for a pilot-scale plant.
Figure 3.
Adapted APQP-based development framework applied to the design and assembly process of an alkaline electrolyser for a pilot-scale plant.
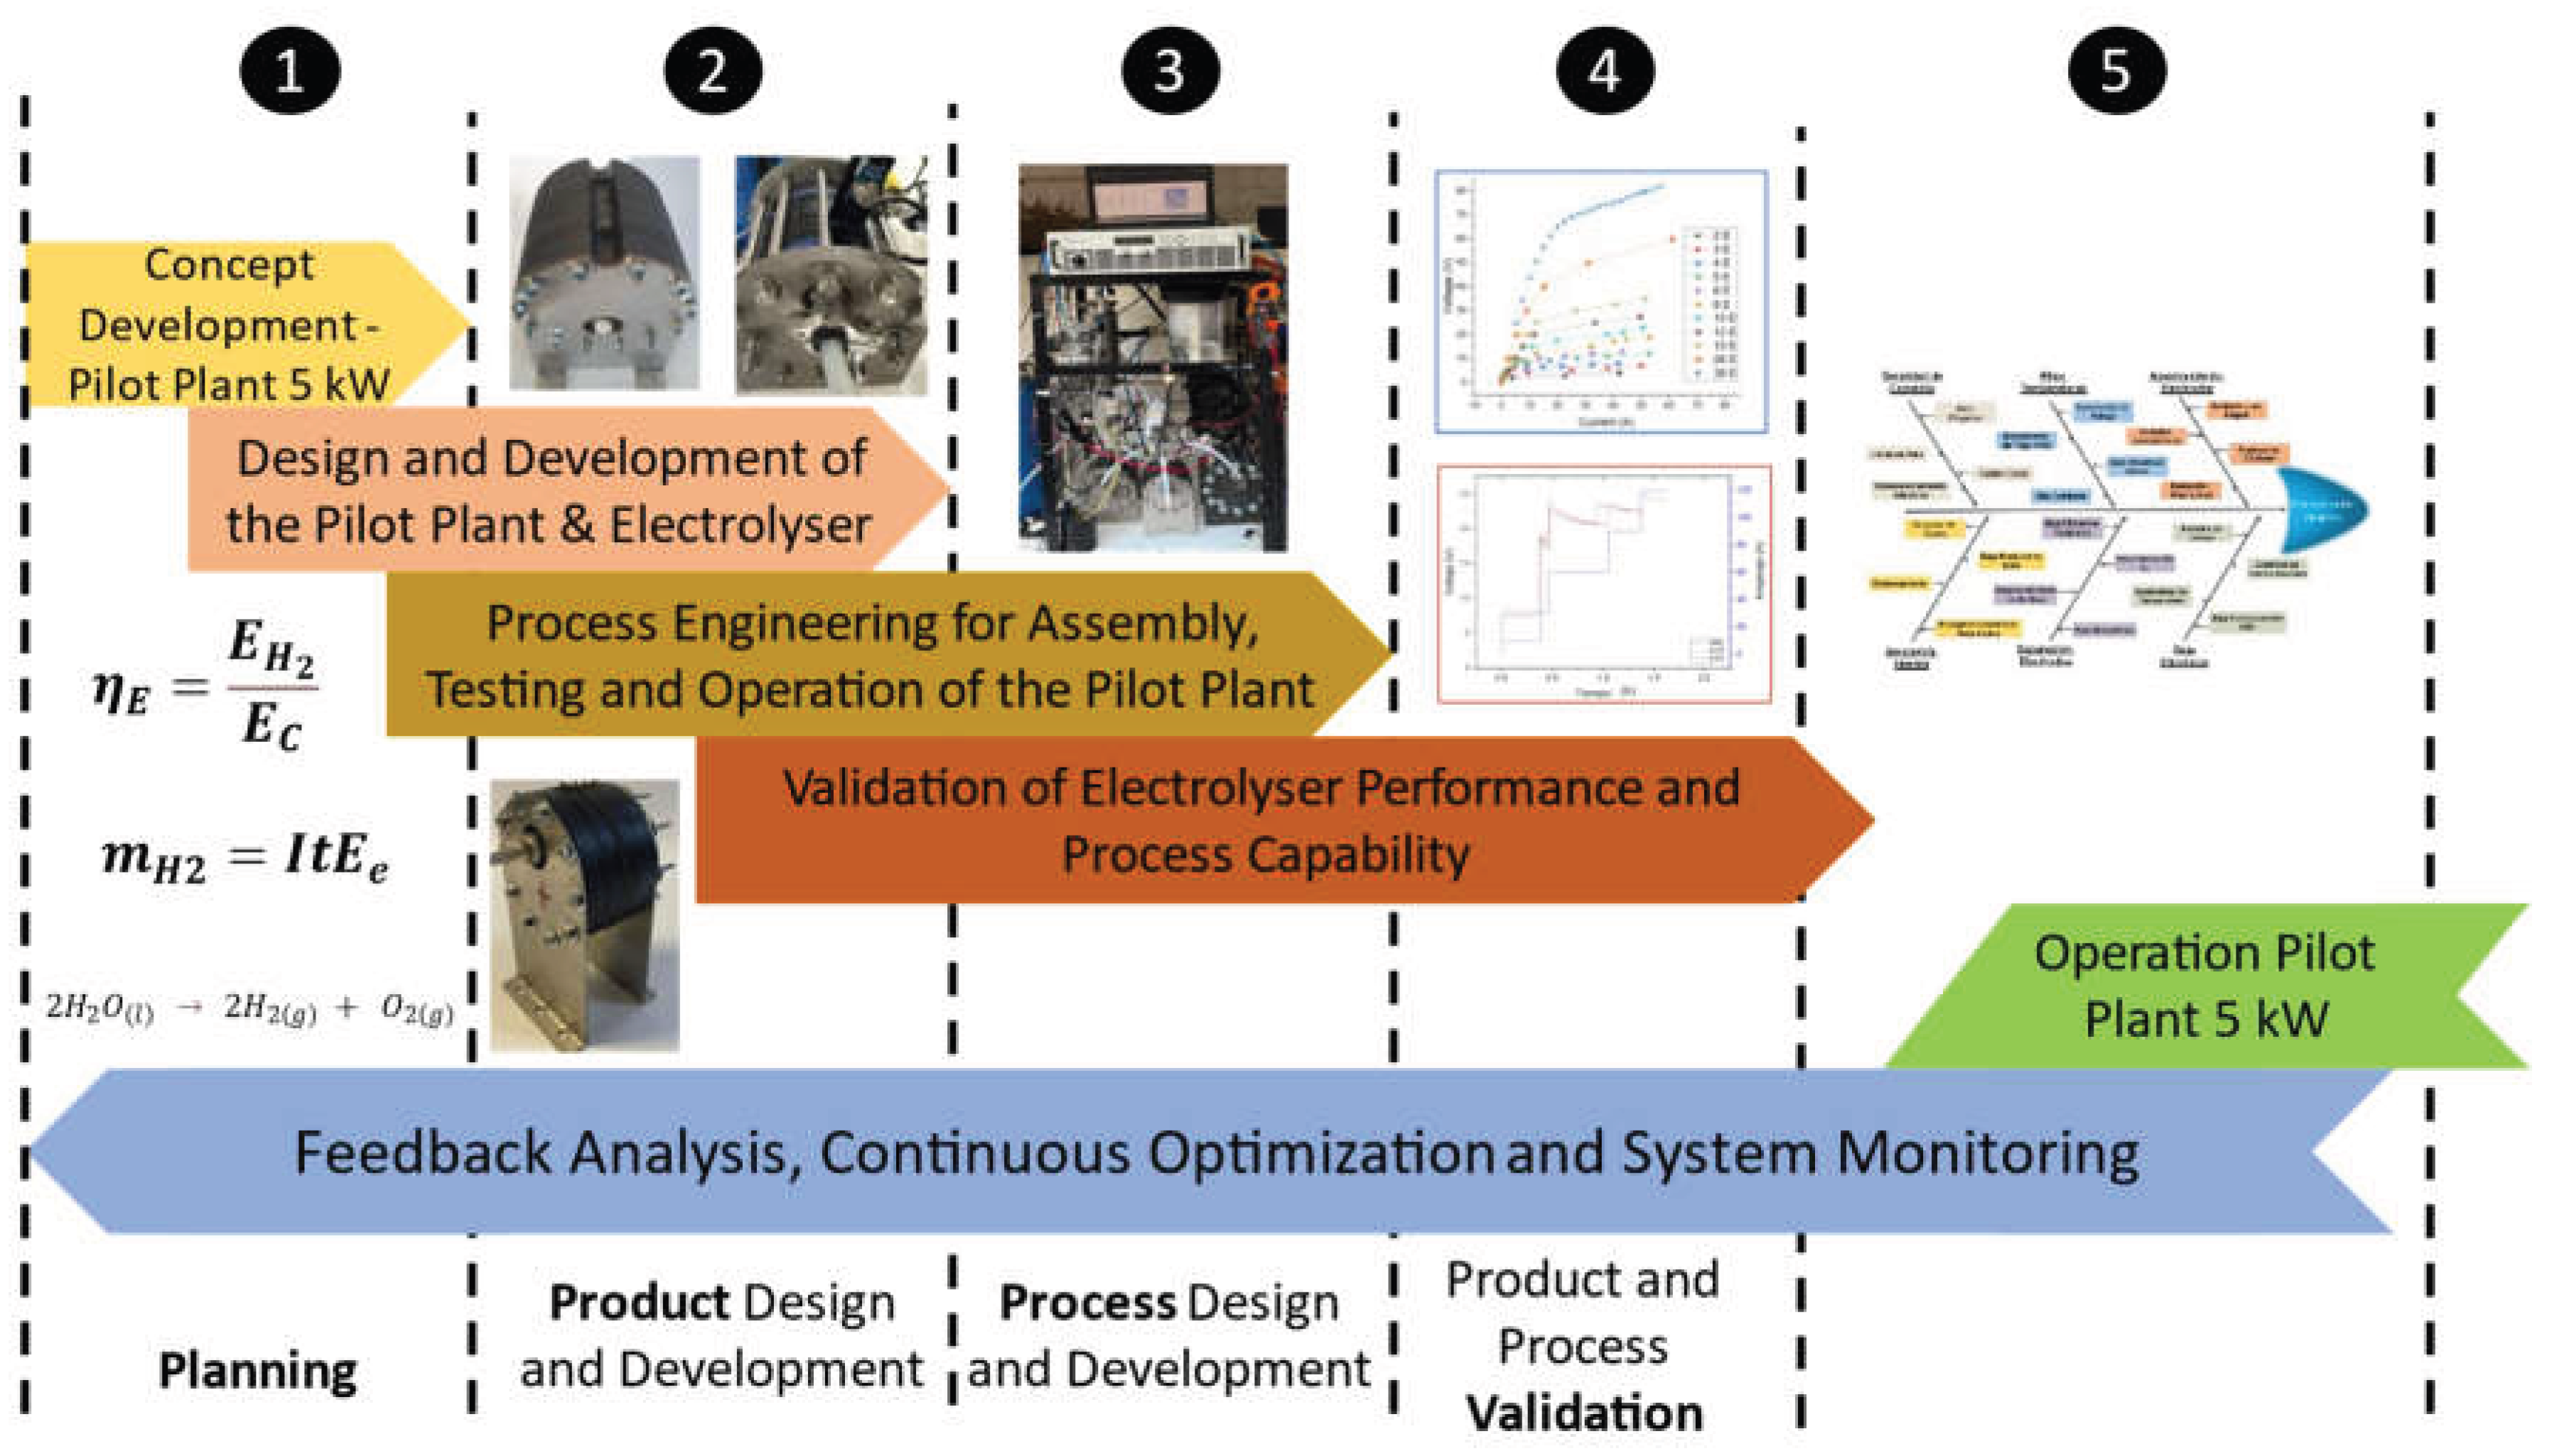
Figure 4.
3-cell electrolyser, featuring two monopolar electrodes and two bipolar electrodes.
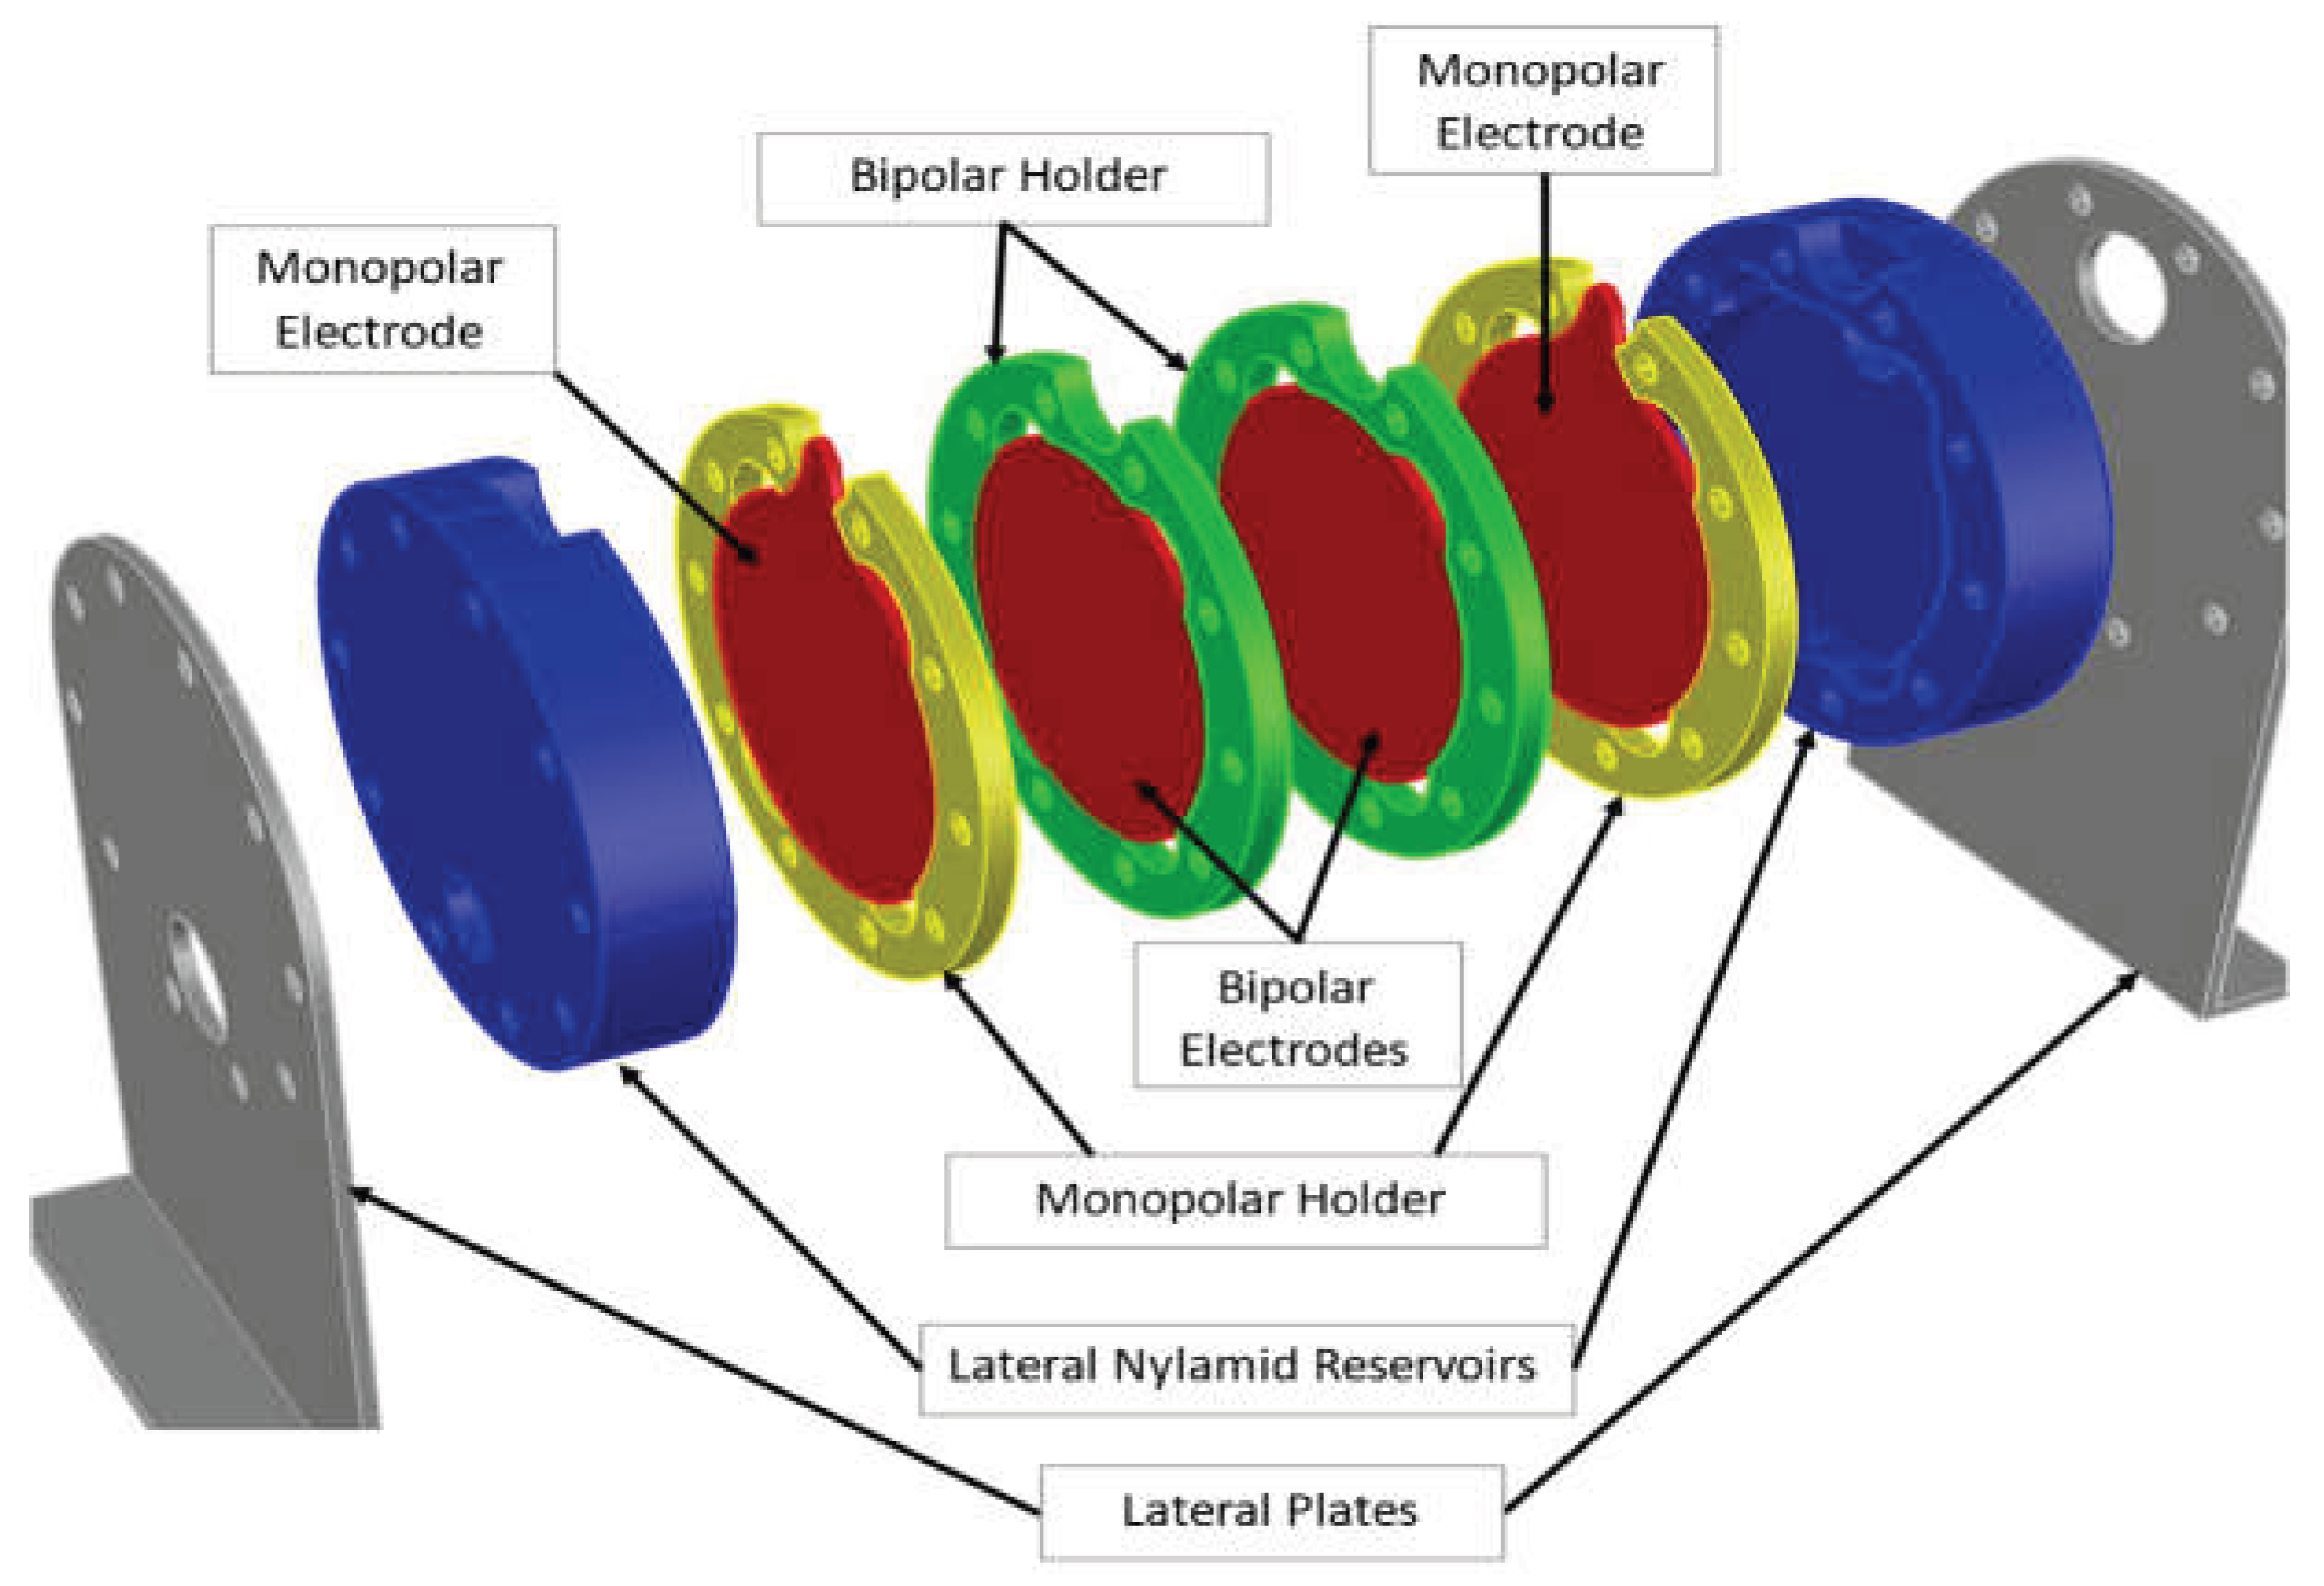
Figure 5.
Comparison the three different electrode holder configurations, area for gas-electrolyte venting and the internal geometry of the electrode after 100 hours of operation. (a) EA1, gas-electrolyte venting is observed at the level of the upper half-moons. (b) EA2, it is observed that nearly 50% of the electrode’s active area is underutilized. (c) EA3, the full active area of the electrode is effectively utilized.
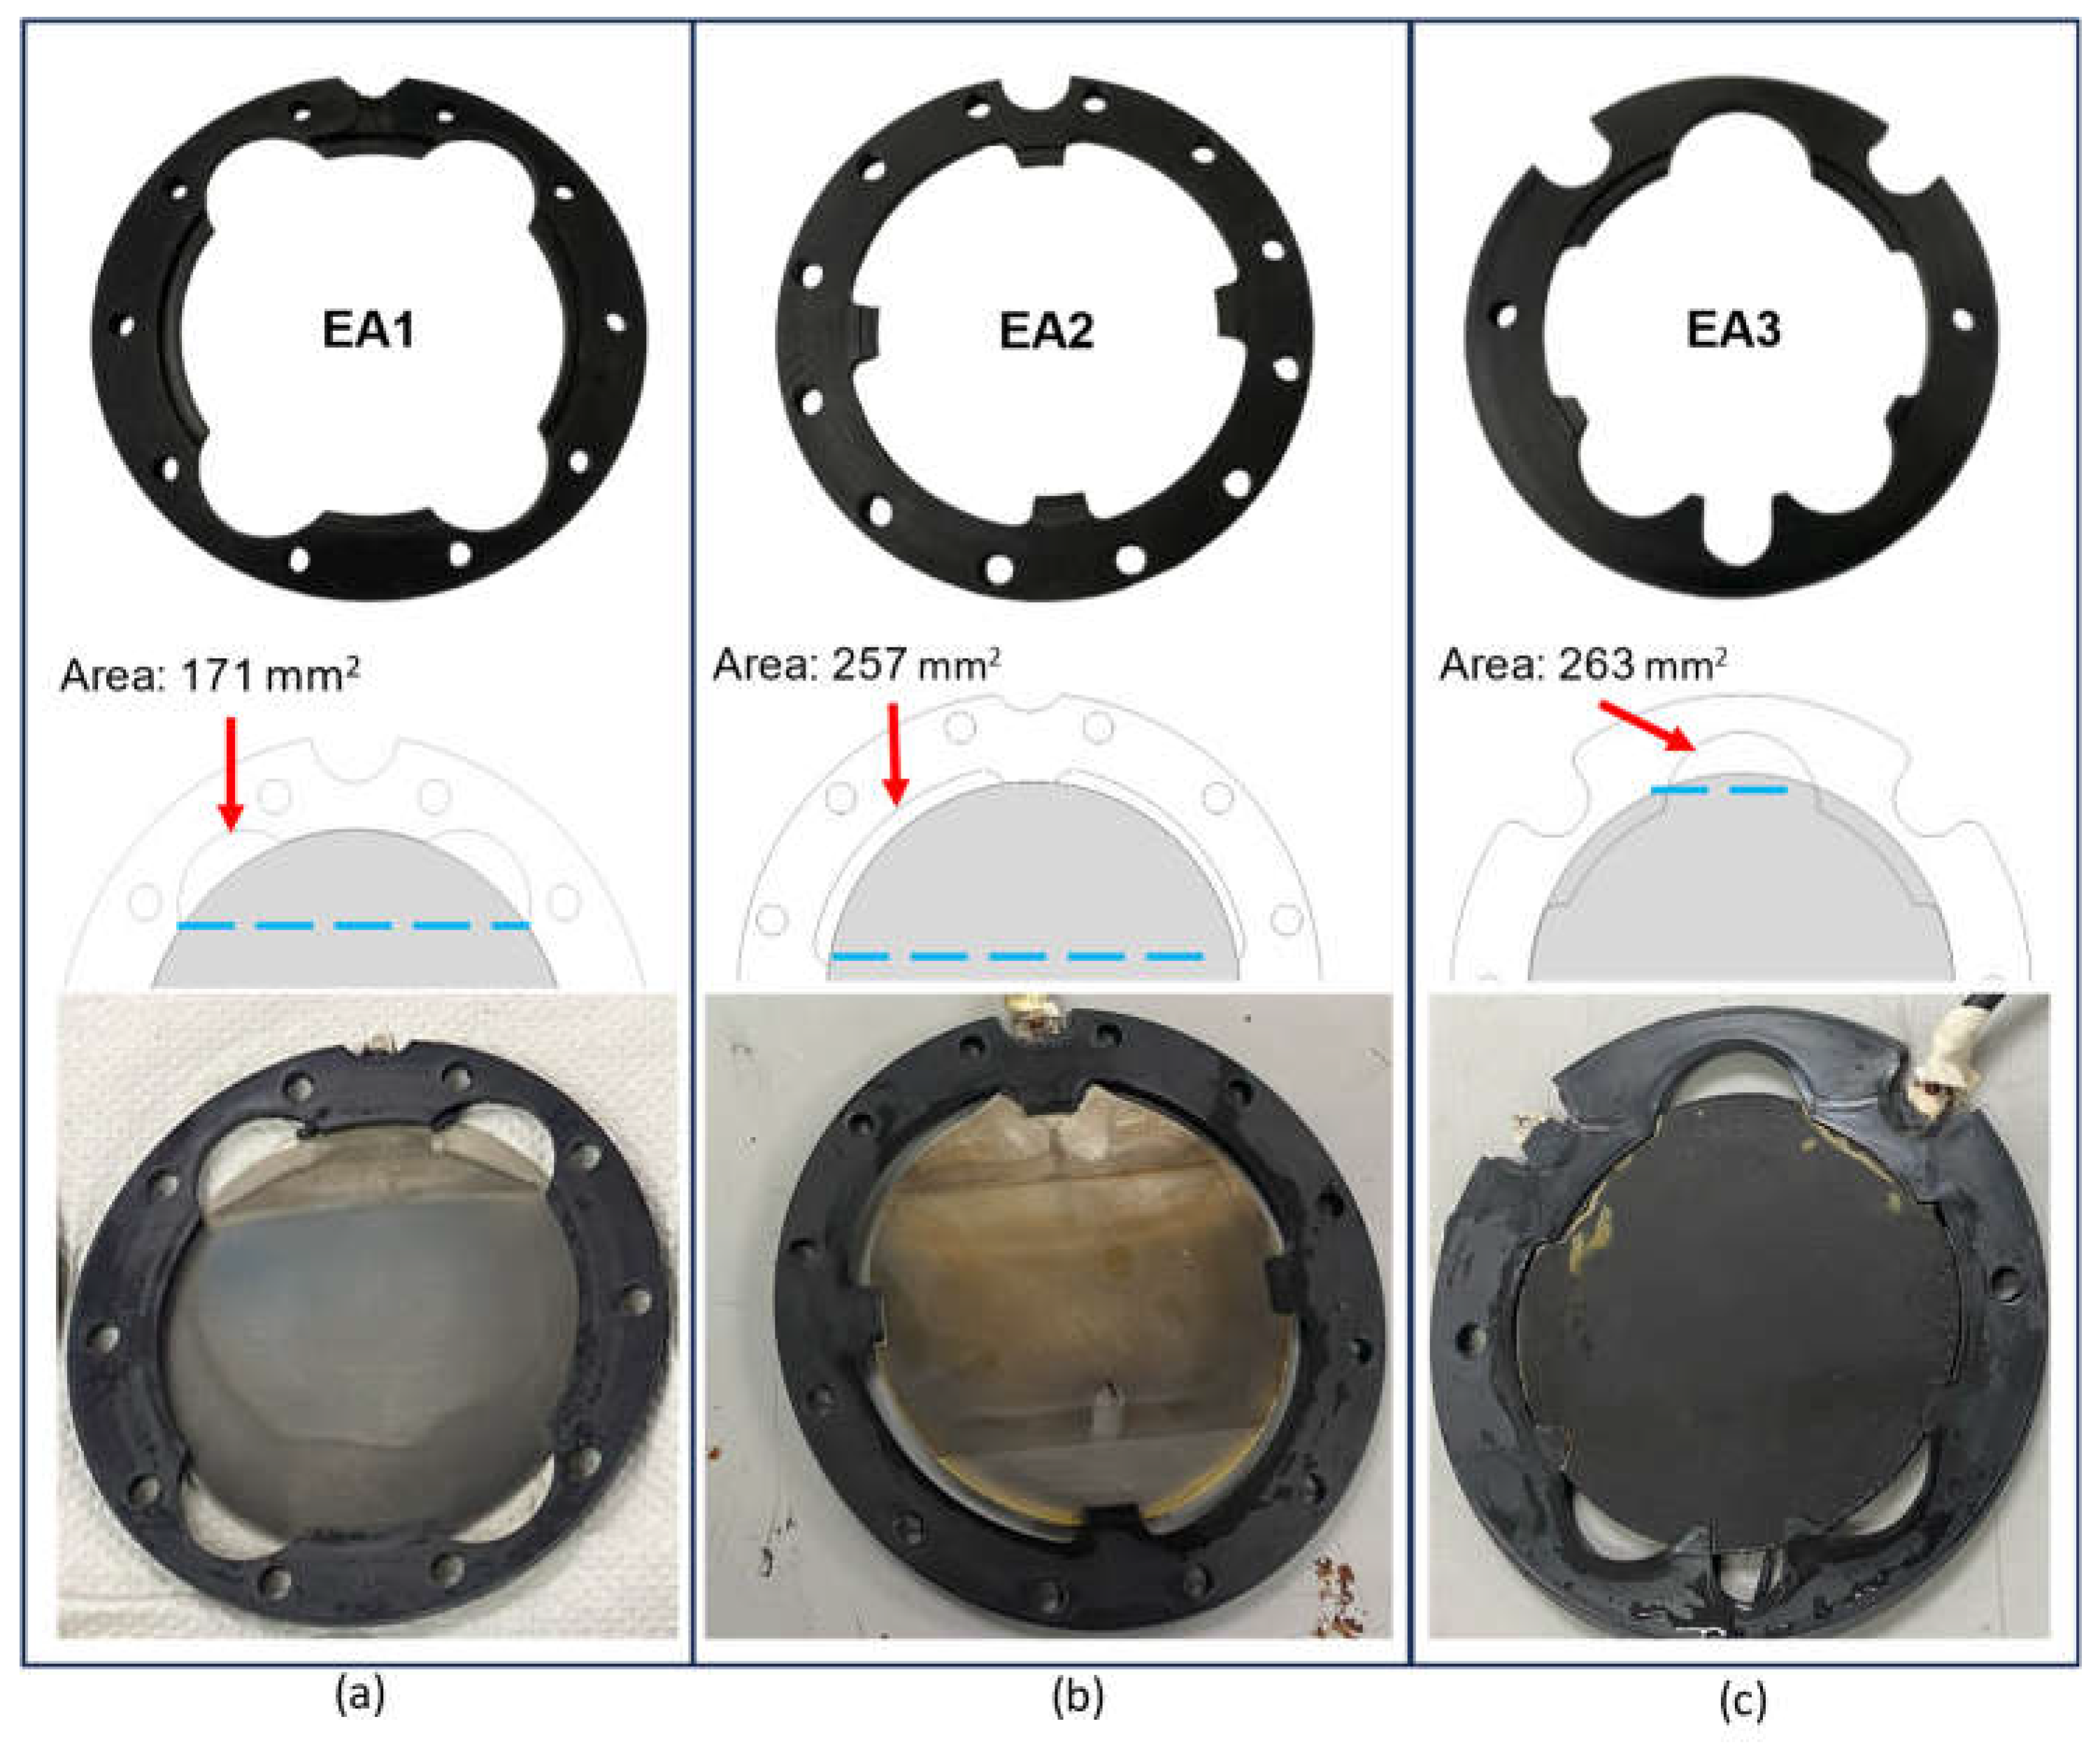
Figure 6.
Characterisation Protocol test of electrolyser.
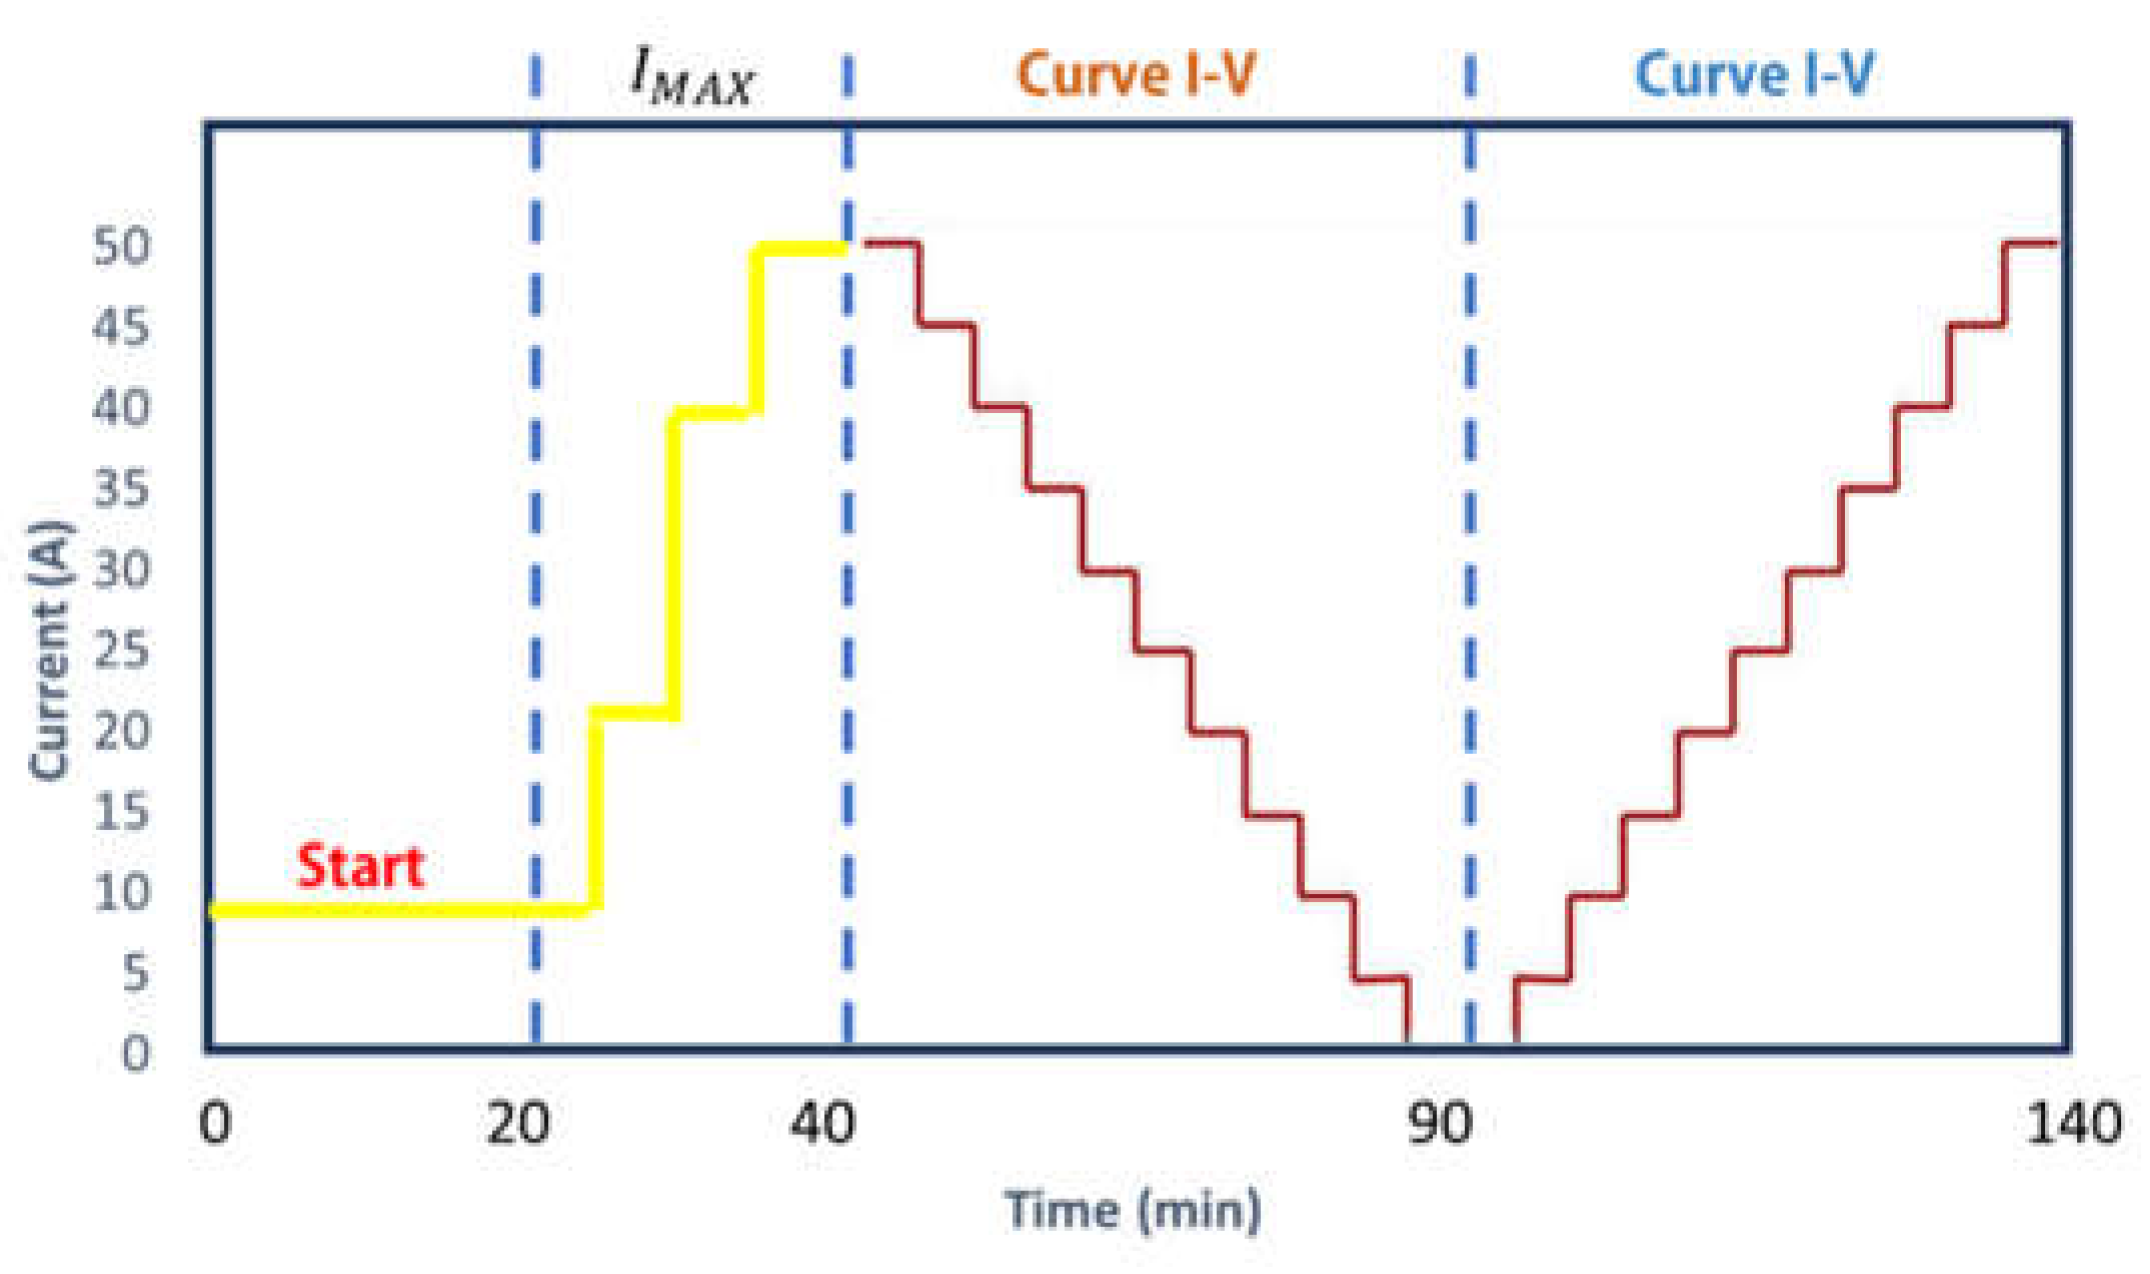
Figure 7.
a) Pilot Plant, b) Process Diagram.
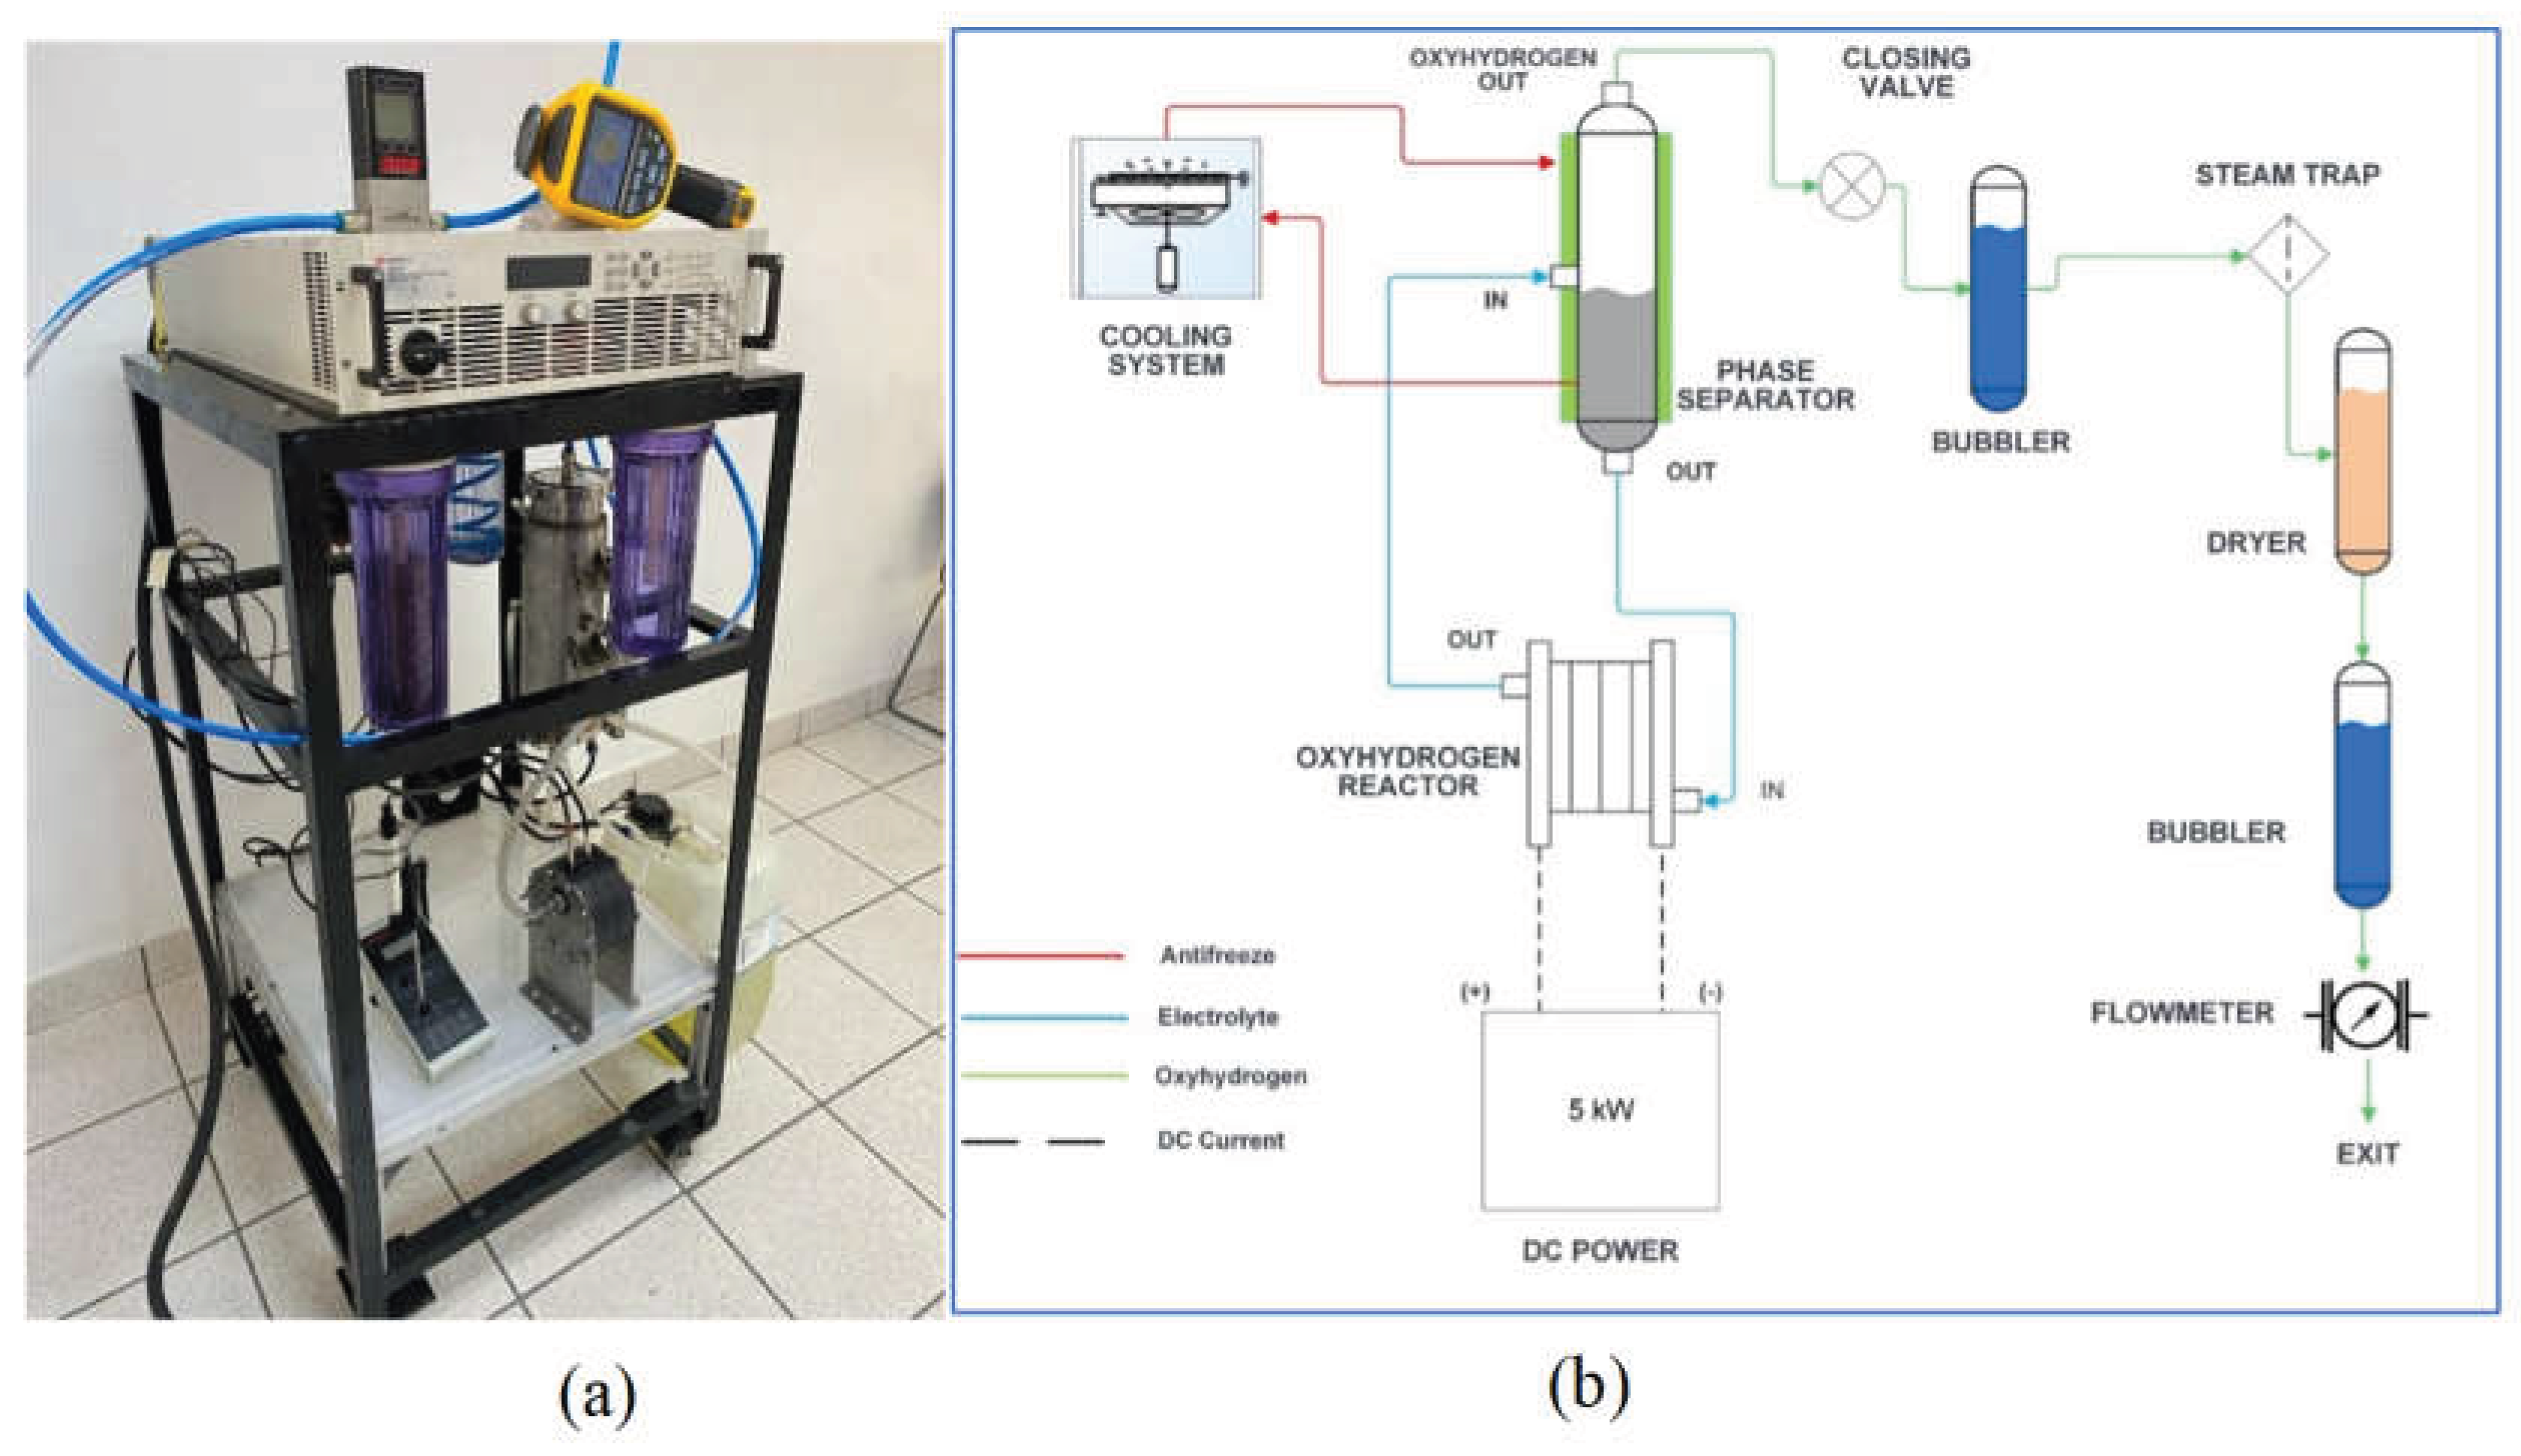
Figure 8.
(a) Characteristic curve under different configurations; (b) flow performance as a function of the applied current density.
Figure 8.
(a) Characteristic curve under different configurations; (b) flow performance as a function of the applied current density.
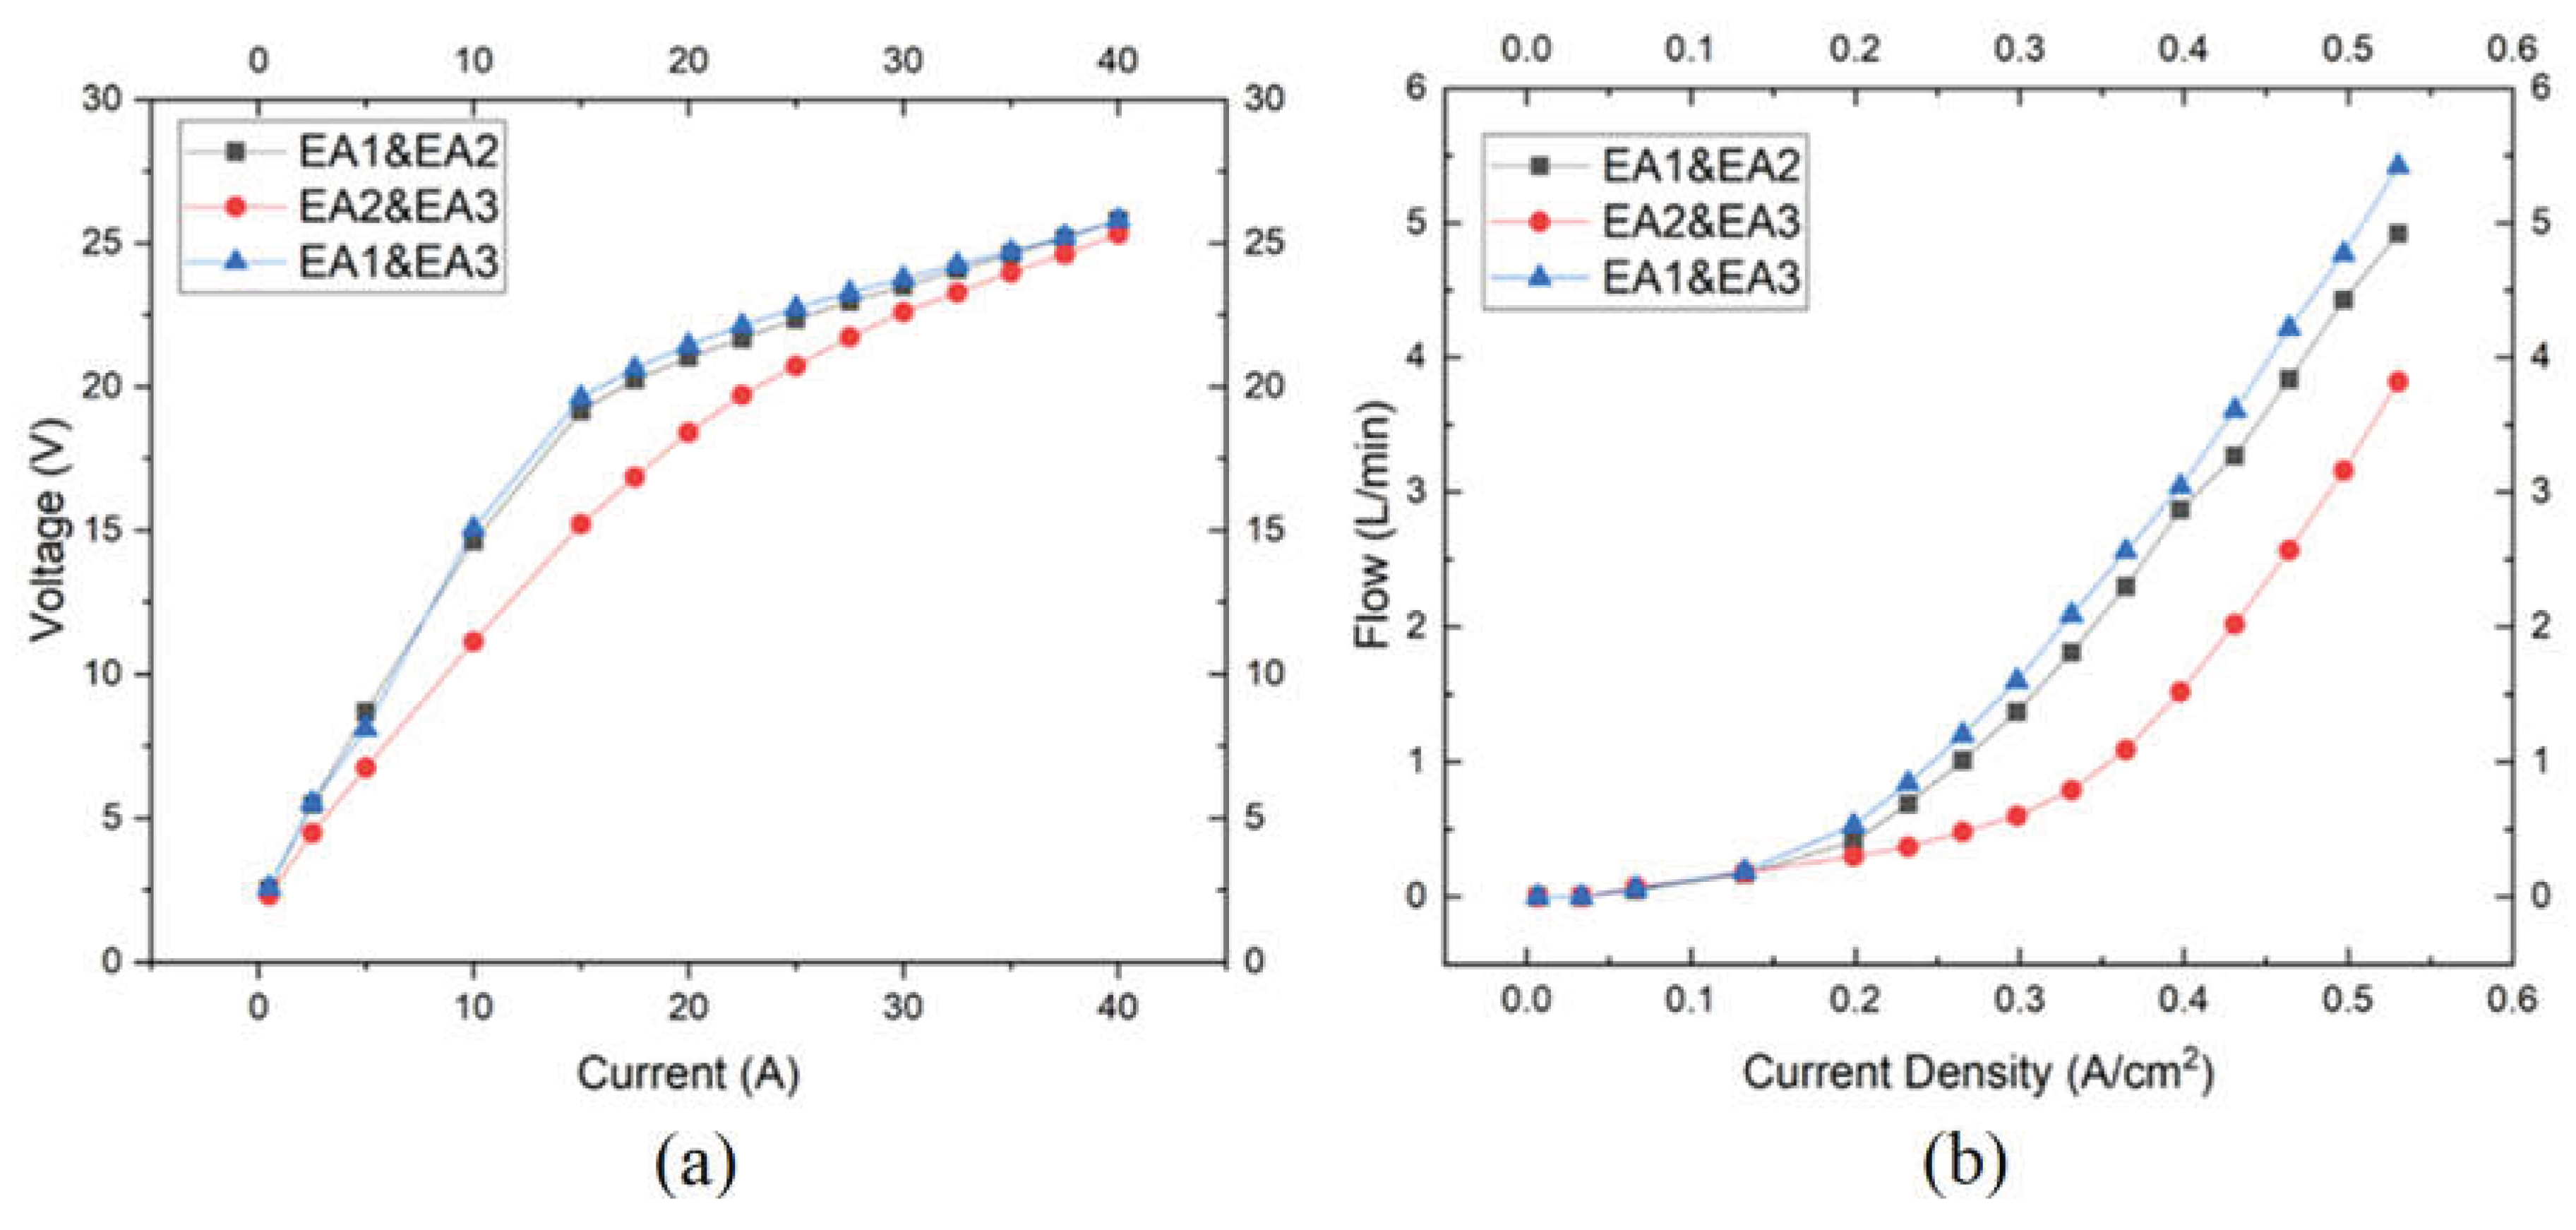
Figure 9.
(a) Parallel configuration for electrolyte flow; (b) series connection for the applied current configuration in the system.
Figure 9.
(a) Parallel configuration for electrolyte flow; (b) series connection for the applied current configuration in the system.
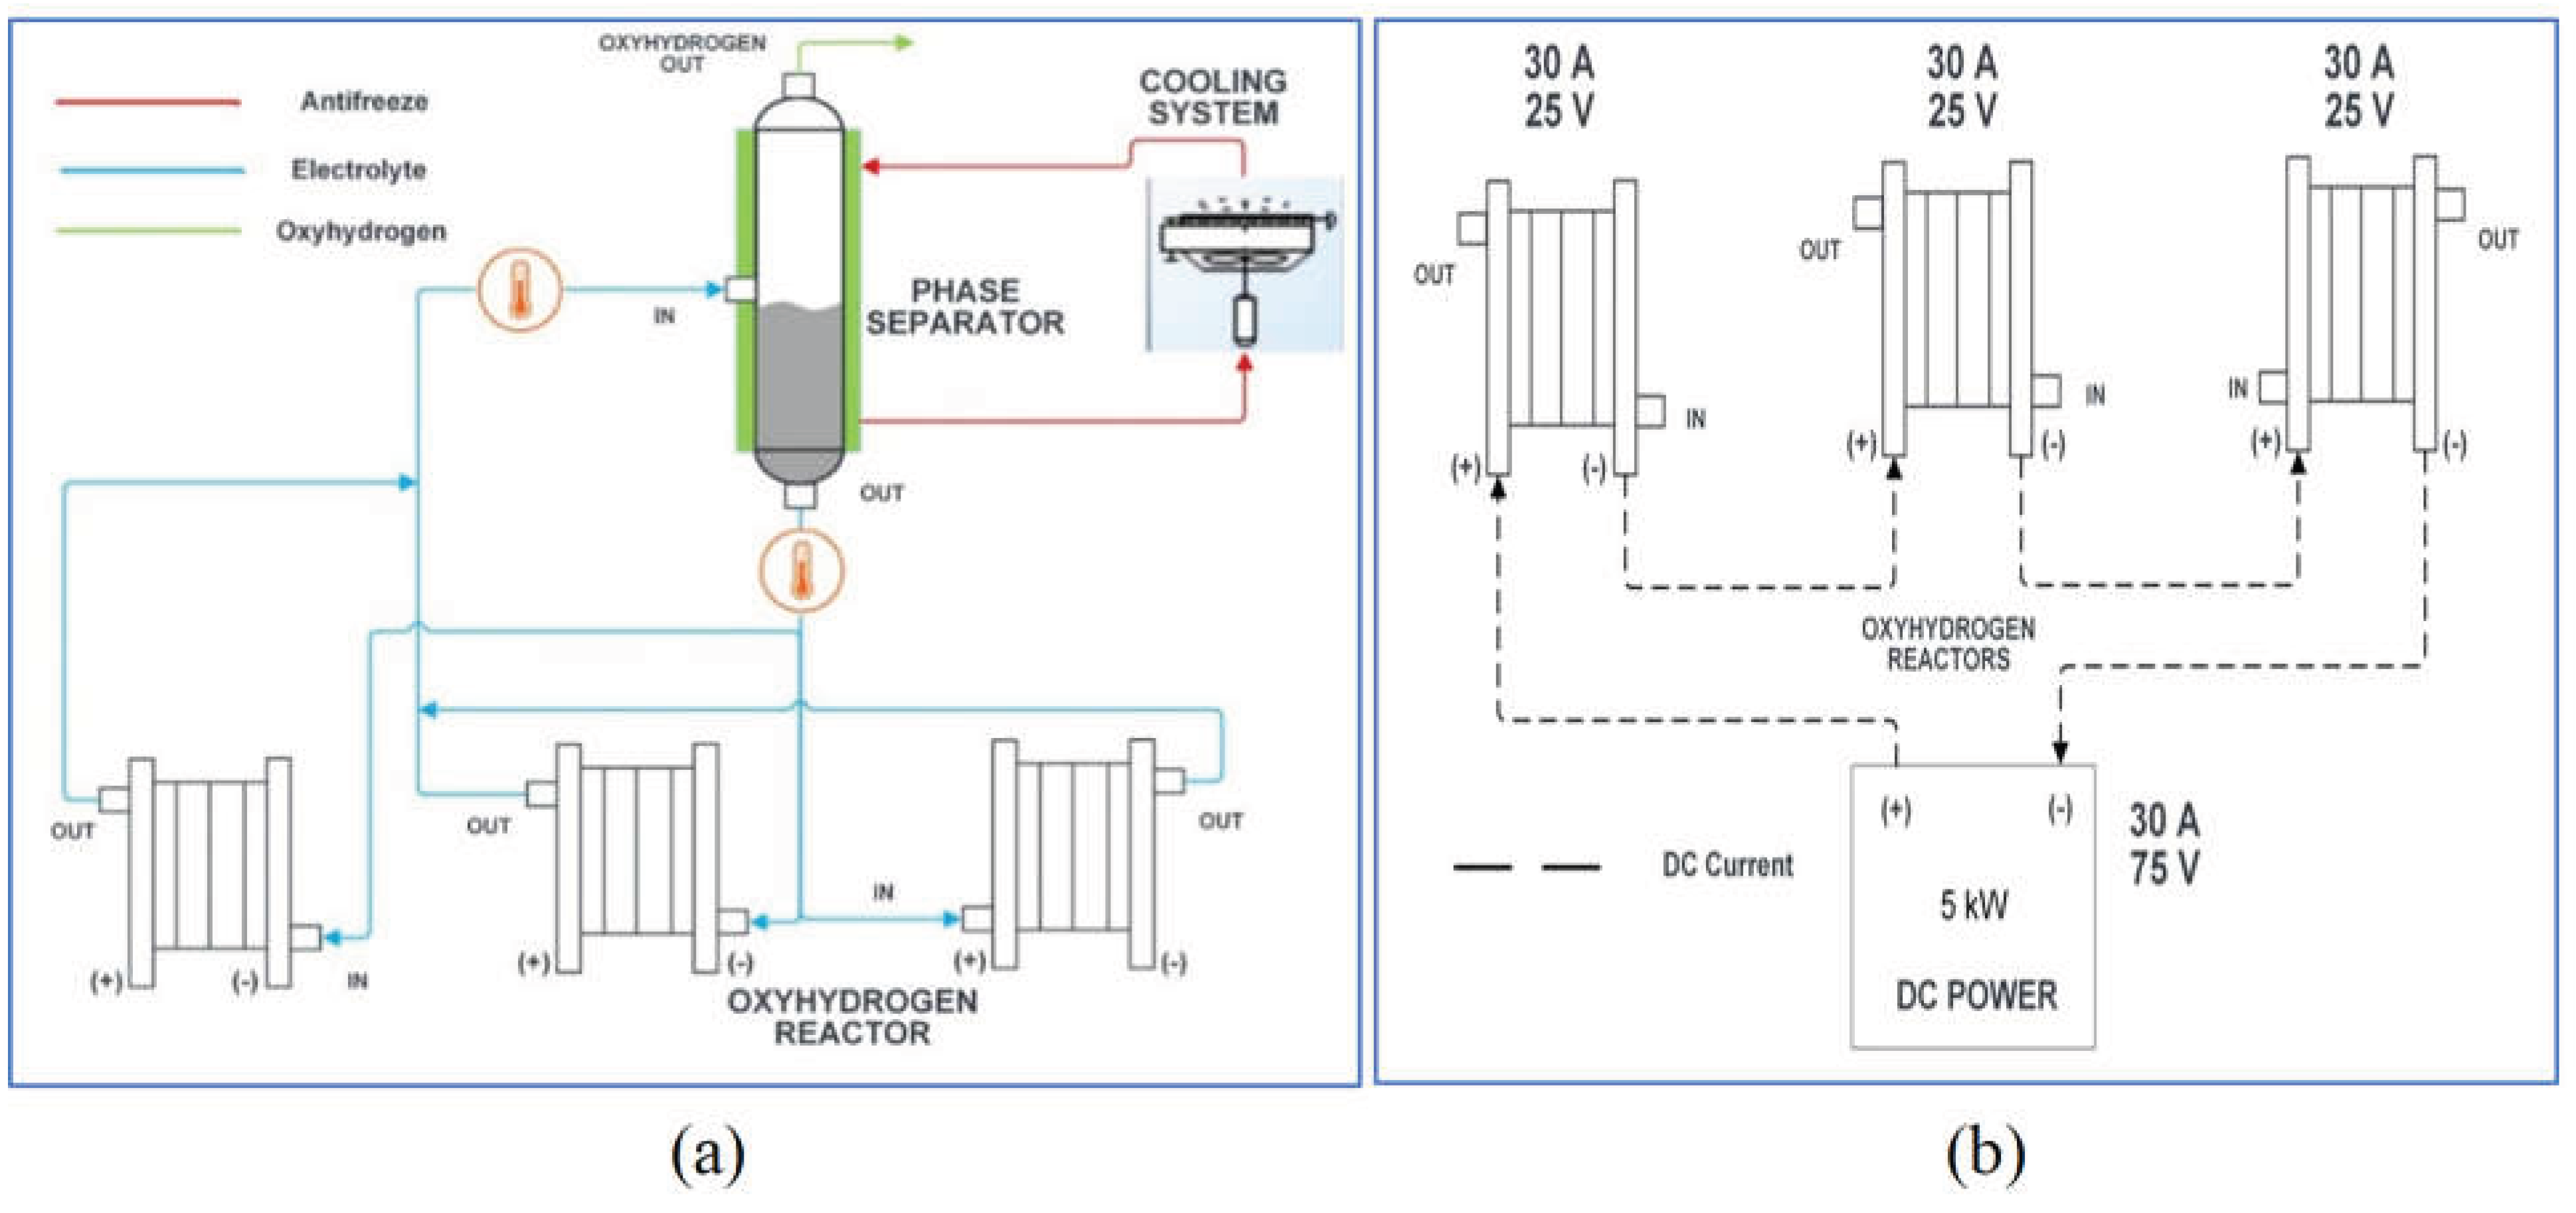
Figure 10.
(a) current vs voltage characteristic curve of the 5 kW pilot plant. (b) Production test (L min-1) versus the applied current density (A cm-2) at the beginning of the test and after 100 hours of operation. (c) Tests time vs voltage at different current densities; (b) Stability test for 7 hours at 0.5 A cm-2.
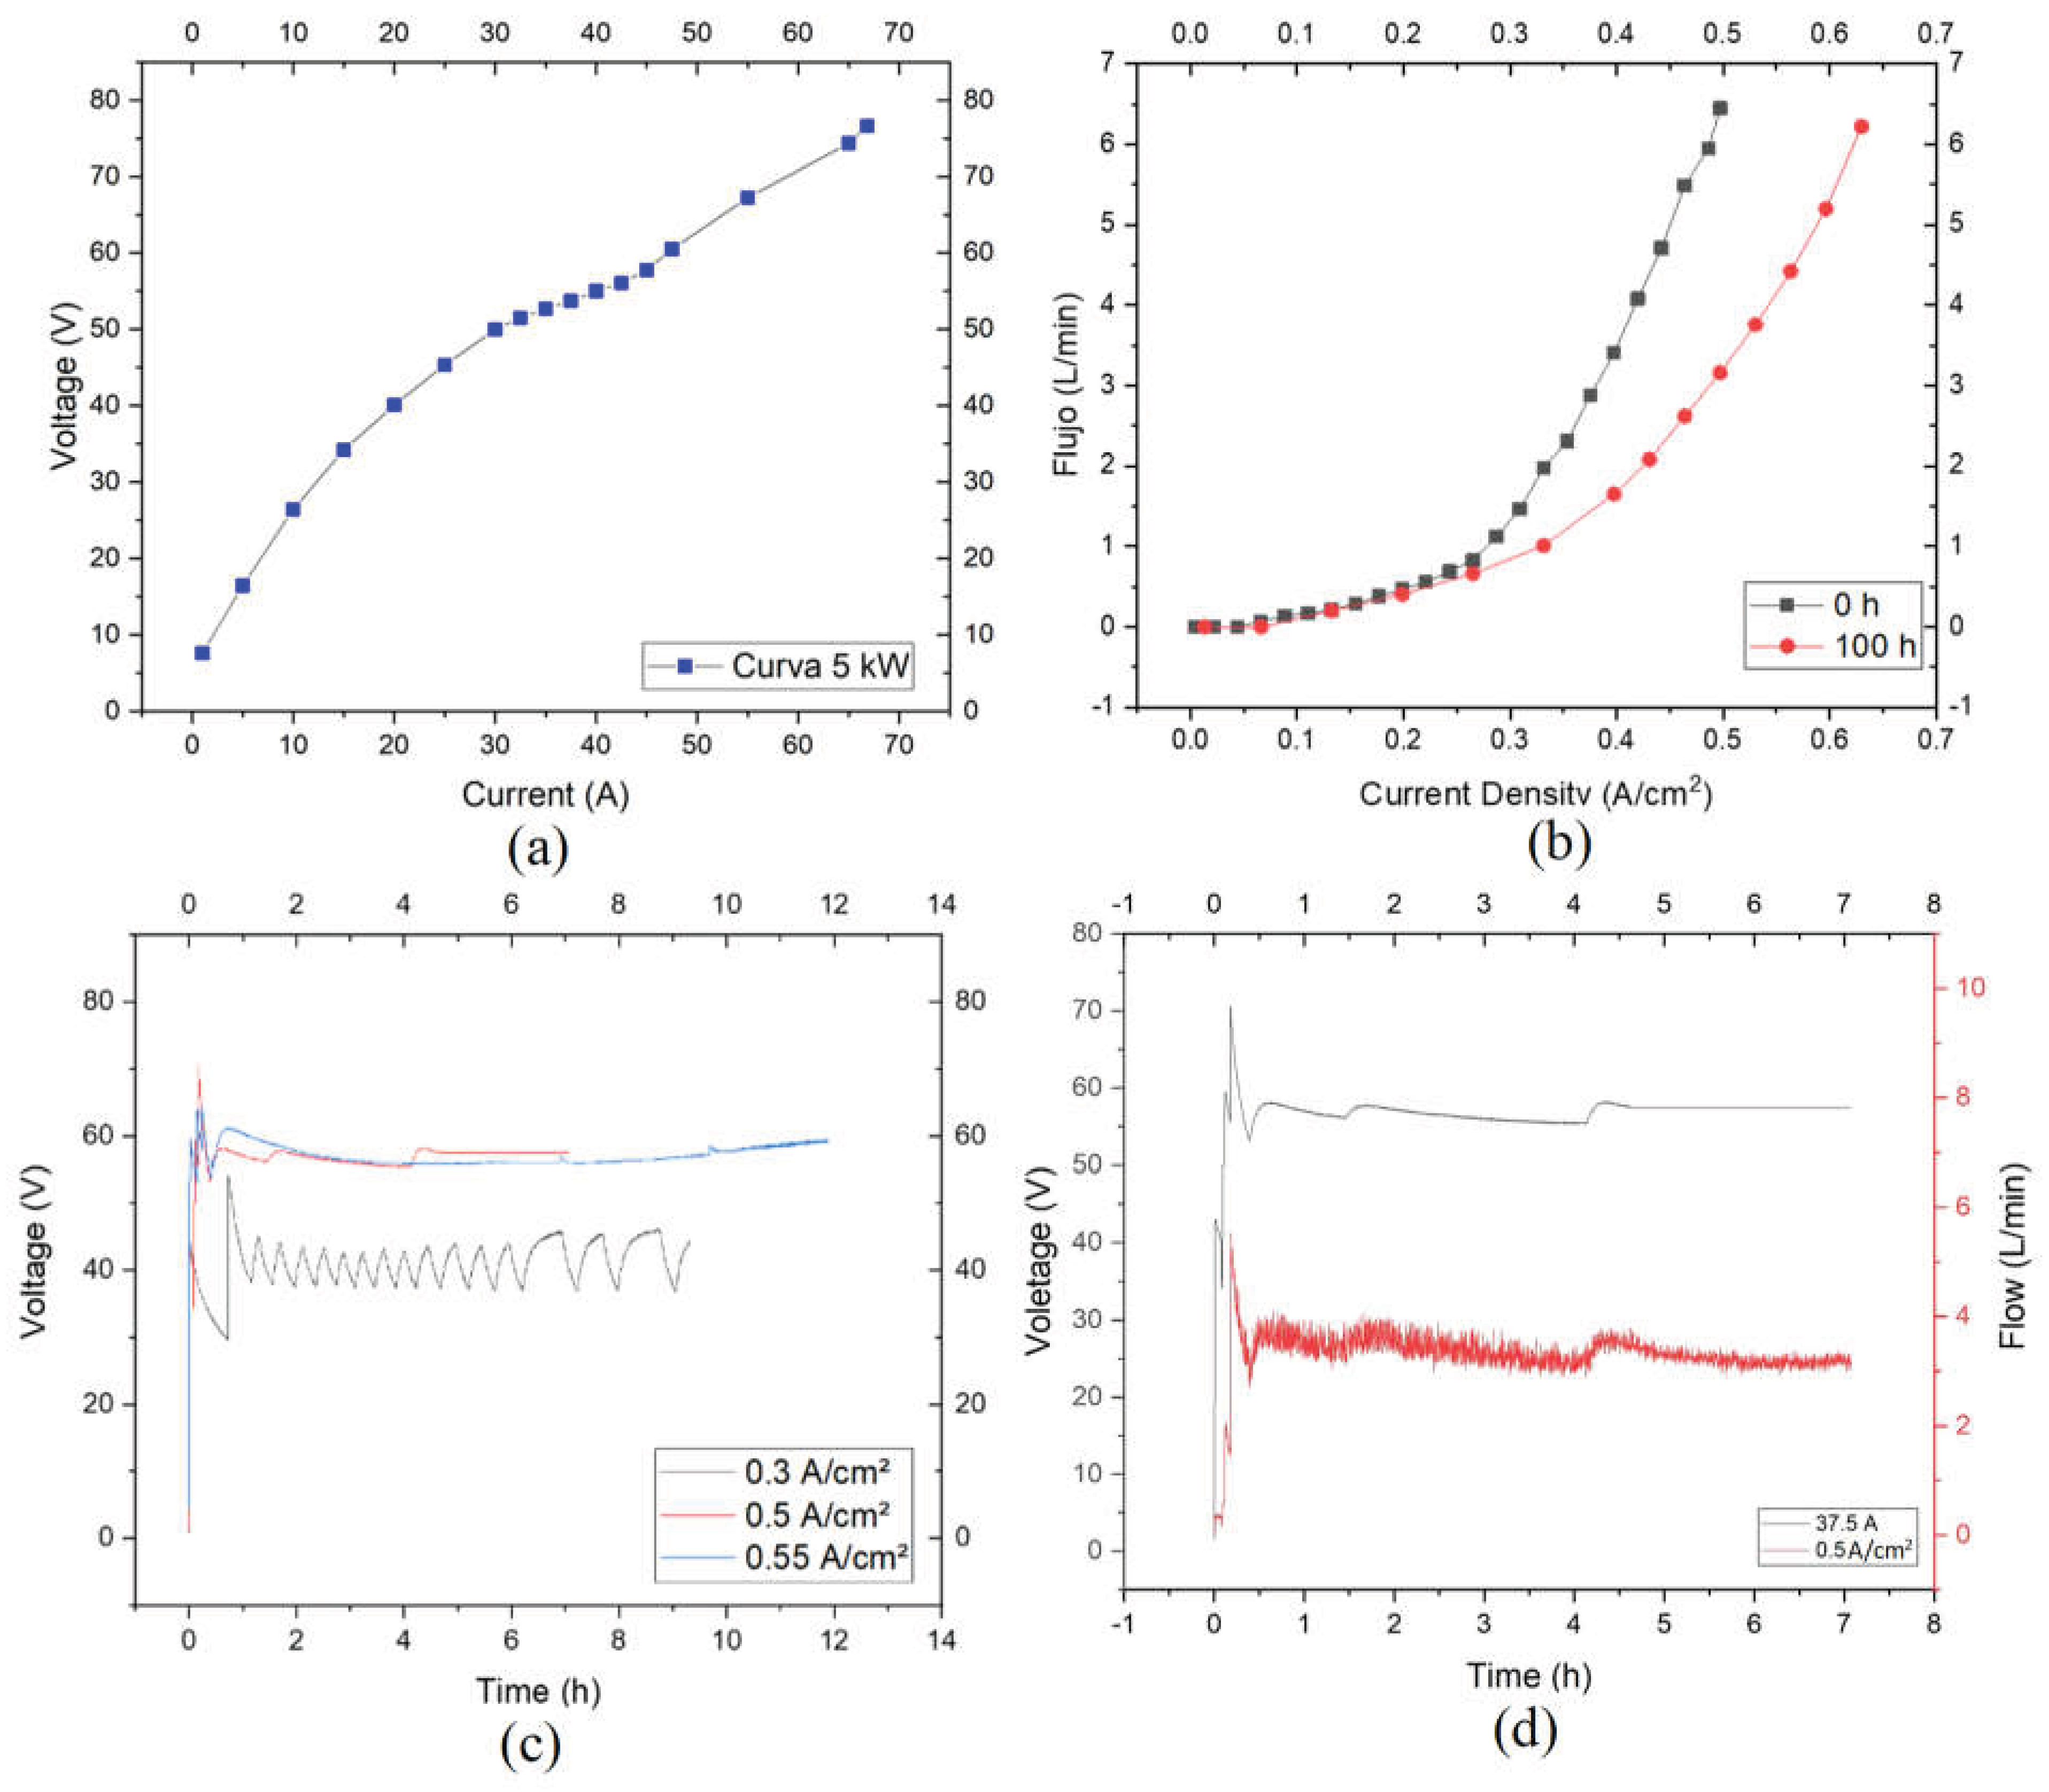

Table 1.
Basic parameters for sizing the electrolyser.
| Design parameter | Data | Unit |
| Electrolyser power | 5 | kW |
| Efficiency | 50 | % |
| Current density | 0.5 | A cm-2 |
| Electrodes diameter | 10 | cm |
| Number of electrodes | 36 | Part |
| H2 density @ 1 atm y 25 °C | 0.0823 | g L -1 |
| Higher heating value of H2 | 39.4 | Wh g-1 |
| PMH2 | 2 | g mol-1 |
| Faraday constant | 96,485 | C mol-1 |
| Operation time | 1 | h |
Disclaimer/Publisher’s Note: The statements, opinions and data contained in all publications are solely those of the individual author(s) and contributor(s) and not of MDPI and/or the editor(s). MDPI and/or the editor(s) disclaim responsibility for any injury to people or property resulting from any ideas, methods, instructions or products referred to in the content. |
© 2026 by the authors. Licensee MDPI, Basel, Switzerland. This article is an open access article distributed under the terms and conditions of the Creative Commons Attribution (CC BY) license (http://creativecommons.org/licenses/by/4.0/).
Copyright: This open access article is published under a Creative Commons CC BY 4.0 license, which permit the free download, distribution, and reuse, provided that the author and preprint are cited in any reuse.


