Submitted:
11 February 2026
Posted:
12 February 2026
You are already at the latest version
Abstract
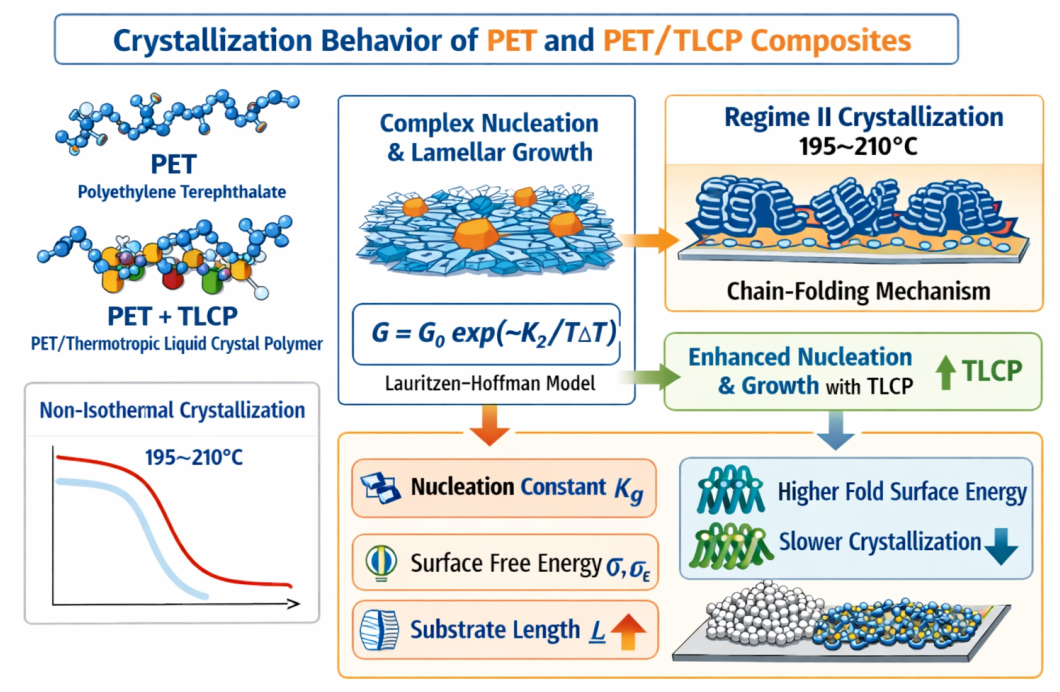
The crystallization behavior of polyethylene terephthalate (PET) and PET/Thermotropic liquid crystalline polymer (TLCP) composites was analyzed under nonisothermal conditions using calorimetric kinetic data, with thermodynamic parameters derived from the Lauritzen–Hoffman (L-H) model. The crystal growth process, dominated by secondary nucleation, deviates from simple spherulitic radial growth, instead reflecting a complex interplay of nucleation and lamellar growth phenomena. The temperature dependence of the linear crystal growth rate (G) follows a biexponential form as per the L-H relation, integrating both segmental transport and thermodynamic driving forces. Through kinetic modelling, values of nucleation constants (Kg), pre-exponential growth factors (G0), and surface free energies (σ and σe) were obtained.The analysis confirmed crystallization in Regime II across all compositions and temperatures studied (195–210°C), characterized by a chain-folding mechanism where growth occurs on pre-existing crystalline substrates. The substrate length (L), estimated via the Lauritzen Z test, increases with TLCP content and crystallization temperature,indicating enhanced nucleation and hindered chain folding in composites. PET/TLCP blends exhibited higher fold surface energy and work of chain folding compared to neat PET, revealing the inhibitory effect of TLCP on PET crystallization kinetics. These findings offer a comprehensive understanding of the crystallization regime transitions and underlying thermodynamics in PET/TLCP systems.
Keywords:
nonisothermal crystallization
; differential scanning calorimetry (DSC)
; liquid crystalline polymers
1. Introduction
PET has been studied extensively due to its commercial importance and chemically flexible nature. Poly (Ethylene Terephthalate) (PET) is widely used in the manufacture of beverage bottle, textile fiber, and packaging film. Historically, it has not been considered for application involving high-speed processing because it crystallizes or solidifies very slowly from melt. However, crystallization can be increased by the addition of polymeric nucleating agents. The first paper on the non-isothermal crystallization of Poly (Ethylene Terephthalate) (PET) dates back to 1971, when Ozawa [1] proposed a new method to analyze data for the solidification of polymers cooled at a constant rate. The cooling crystallization function of PET at different temperatures decreased with increasing temperature, in agreement with the findings of Ozawa. It has an important application in the textile industry [2] and has been a promising engineering thermoplastic [3], Jabarin [4] reported a study of the crystallization behavior of PET under non-isothermal conditions as a function of molecular mass. Following the path traced by Jabarin [4], Fann et al. [5] showed that the DSC cooling mode can be used to optimize the conditions for keeping the crystallinity to a minimum during the production of PET bottles. The determination of kinetic parameters for PET crystallization indicated that the competing processes of nucleation and growth of PET spherulites during the cooling process were the controlling factors that determined the degree of crystallinity in the final products. The non-isothermal crystallization of PET blended with the liquid crystalline polymer (LCP) Rodrun 3000, with compositions of PET/LCP was studied by Incarnato et al. [6]. In fact, crystallization kinetics of PET has been investigated by many investigators by using DSC [7,8]. The crystallization behavior of unoriented PET has also been the subject of a number of investigations [9,10,11,12,13,14]. Crystallization kinetics of unoriented PET has been studied by many methods including differential scanning calorimetry [14]. It is known that crystallization in PET occurs through sporadic or heterogeneous nucleation and subsequent crystal growth [14].
The Lauritzen-Hoffman parameters are estimated from non-isothermal DSC data using the effective activation energy equation proposed by Vyazokin and Sbirrazzuoli [15]. The effect of the TLCP blending on crystallization regime transition is investigated and discussed.
2. Materials and Methods
Materials
Poly (Ethylene Terepthalate) (PET) used in this investigation was procured from Reliance Industries Ltd, Patalganga, India. The melting temperature (Tm) observed from DSC of PET is 260 °C. The TLCP used in present investigations is a Vectra A950, a commercial product, supplied by Polyplastic, Japan. This TLCP (Vectra A950) is a semicrystalline random aromatic copolyester of 4-hydoxy benzoic acid and 2-hydroxy-6-naphthoic acid with a monomer ratio of 3/7. The melting point, Tm of the as-received TLCP granules is 284 °C. The TLCP (Vectra A950) forms a nematic melt above this temperature. For simplicity, the TLCP Vectra A950 is hereafter denoted as only TLCP.
Composite Preparation
Prior to melt blending, pure components of PET and TLCP wt/wt% with requisite ratios (100/00, 90/10, 80/20, 70/30, 60/40 and 50/50) were kept in an air circulating oven at 100 °C for 18 hrs. After drying, physical mixing of PET/TLCP were mixed in Maris TM 20 lab corotating, intermeshing and self wiping twin screw extruder (Specifications: screw diameter 20 mm, L/d ratio 46, process central zone 7, Motor power 2.3 kW, screw speed: upto 600 rpm, side feeding screw speed: upto 400 rpm) at screw speed of 100 rpm and the barrel temperatures (from the feeding zone to the die) of (240, 270, 275, 280, 285, 290, 280 °C). MARIS TM 20 lab twin screw extruder . The strands, obtained from the extruder were cut into small pellets in a pelletizer. These melt blended pellets of PET/TLCP composites then injection molded in Engel injection molding machine . All these samples were taken for DSC measurements from these injection molded specimens. Injection molding parameters of PET/TLCP composites are illustrated in Table 1.
Differential Scanning Calorimetry Measurements:
Nonisothermal crystallization was performed in a Perkin-Elmer, DSC-7 differential scanning calorimeter operating on a Pyris-1 manager platform. The calorimeter is well equipped with an intercooling unit capable of maintaining the chamber temperature at room temperature (20 °C). This helps to achieve more reliability in collecting data even at high cooling rates and over the temperature range of experiments. The instrument was calibrated for temperature scale using a high purity indium standard to ensure accuracy and reliability of the nonisothermal data obtained. The consistency of the temperature calibration was checked for every alternate run to ensure the reliability of the data obtained. Because these has been serious concern for the accuracy of DSC measurements under dynamic conditions because of thermal lags between the sample and the DSC furnace, particularly at fast rates because of comparatively low thermal diffusivity of polymer samples, the low mass samples (7.0 ± 0.20) mg, which is cut from the large sample already prepared, were used in crystallization experiments.
It is assumed that in this case, this thermal lag is minimal.It is important to mention that each sample was used only once.For nonisothermal crystallization experiments, each sample was first melted at 290 °C for a melt annealing period of 5 min to ensure complete melting As this temperature is much above the equilibrium melting temperature of PET, the melting of the sample at 290 °C for 5 min is enough to completely melt any crystalline residues, thus avoiding predetermined athermal nucleation sites during subsequent cooling. The sample then cooled to perform crystallization at a desired constant cooling rate (ϕ), ranging from 10, 20, 30, 40, 50, and 60 °C/min. The nonisothermal crystallization exothermal curves of heat flow as a function of temperature were recorded for further analysis based on the several
kinetics models. To prevent thermal scan degradation of samples, all the thermal scans were carried out under a nitrogen atmosphere. Each experiment was performed twice with fresh sample. Basically, the crystallization kinetics were obtained by integrating crystallization peaks from DSC thermograms, considering a proportionality between the crystallization rate and the heat flux measured. The relative crystallinity at a particular temperature was calculated by using software of DSC–7 for further analysis of different macrokinetic models.
Results & Discussion
Non-isothermal Crystallization behavior of neat PET and PET/TLCP Composites:
From dynamic crystallization experiments, the crystallization exotherms as a function of temperature are obtained for neat PET and different PET/TLCP composites. The exotherms for different cooling rates (10, 20,30,40,50 and 60 °C/min) are presented in Figure 1. These exotherms are obtained for the crystallization by initially heating each sample to 300 °C and then cooling it at different cooling rates. The data (,,) from these exotherms are shown in Table 2.
As can be seen from Figure 1, the crystallization exotherm of neat PET as well as of PET/TLCP composites becomes broader and it shifts to lower temperature with increasing cooling rate. The values of characteristic parameters (,,),
listed in Table 2, decreases with increasing cooling rate, indicating that the higher the cooling rate the later the crystallization process starts and completed both in neat PET and PET/TLCP composites. It is observed that in general the degree of supercooling (ΔT=Tm-Tonset) required for the PET crystallization in composites is found to decreases with increasing TLCP content when it is compared to neat PET, indicating to some extent the acceleration of nucleation process in composites. However, the exotherms of composites and reduction in the heat of crystallization with increasing TLCP content clearly indicates the overall reduction in PET chains due to gradual increase in TLCP content in composites. This could be attributed to the mobility constraints on PET due to gradual increase in TLCP content in composites.
Melting behavior of neat PET and PET/TLCP composites after nonisothermal crystallization :
Figure 2 represents the melting behavior of neat PET and various PET/TLCP composites after nonisothermal crystallization. In this case, the sample was first heated from 50 °C to 290 °C at different heating rates. The sample melt was kept for 5 min at this temperature (290 °C) and then the sample was cooled to 50 °C at the same rate. Keeping crystallized sample for a one minute at temperature (50 °C) and then subsequently it was heated to obtain melting behavioral curve at the chosen heating rate. A wide number of heating/cooling rates were applied in present case, namely 10, 20, 30, 40, 50 and 60 °C.min-1. The melting peak temperatures are summarized in Table 2.
It is observed that although the non-isothermal crystallization (Figure 1) occurred over a wide range of temperatures, which is wider in temperature range for fast cooling rates and quite narrow for slow ones. However, particularly for the lower heating rates a characteristic bimodal melting is observed for neat PET ( ≤ 30 °C. -1) and PET/TLCP (for 10,20,30,40 and 50 wt/wt% of TLCP ≤ 10 °C.min-1 ).
The multiple-trimodal melting behavior of isothermally crystallized neat PET and PET/TLCP is described and interpreted as a continuous melting - recrystallization - remelting process. In the present case of non-isothermal process the bimodal behavior showing neat PET and PET/TLCP composites is very similar to that of isothermally crystallized sample.
The noniosthermal melting endotherm peak temperatures of peak I and peak II can be compared with the peak II and peak III respectively of the isothermal melting endotherm . The remarkable difference is in the intensities of these two set of peaks. It is observed that in melting traces after nonisothermal crystallization, the high temperature exotherms (II) are comparatively always larger than in the corresponding highest temperature exotherms (III) after isothermal crystallization. Also in the case of the nonisothermally crystallized composites, as well as in neat PET. The recrystallization exotherms (II) are broader compared to isothermally crystallized exotherm (III). This clearly indicates that after nonisothermal crystallization the resulting morphology is always more than imperfect and defective. However examining the nonisothermal exotherms, it seems that extended crystal perfection processes takes place during the subsequent high heating rate due to the suppressed recrystallization – remelting of PET.

Table 3.
Melting peak temperature of PET/TLCP composites.
| Rate of heating (°C/min) | PET/TLCP | |||||||||||
| 100/00 | 90/10 | 80/20 | 70/30 | 60/40 | 50/50 | |||||||
| I | II | I | II | I | II | I | II | I | II | I | II | |
| 2 | 244 | 254 | 243 | 251 | 243 | 253 | 238 | 250 | 238 | 250 | 238 | 250 |
| 5 | 239 | 251 | 238 | 250 | 237 | 249 | 234 | 248 | 236 | 248 | 232 | 246 |
| 10 | 237 | 248 | 237 | 249 | 235 | 248 | 234 | 247 | 235 | 247 | 234 | 246 |
| 20 | 232 | 245 | 232 | 246 | - | 245 | - | 243 | - | 243 | - | 243 |
| 30 | 229 | 244 | - | 246 | - | 244 | - | 242 | - | 242 | - | 241 |
| 40 | - | 246 | - | 246 | - | 245 | - | 242 | - | 242 | - | 240 |
| 50 | - | 245 | - | 246 | - | 244 | - | 242 | - | 241 | - | 240 |
| 60 | - | 247 | - | 247 | - | 245 | - | 243 | - | 243 | - | 242 |
Interfacial free energy and regime kinetics:
Hoffman described an approach whereby the three growth regimes could be distinguished from growth rate versus nonisothermal crystallization temperature data. He first wrote a generic equation for the linear growth rate which included a transport term (later based on reptation) and a free energy term. Hoffman and Lauritzen [42,43] introduced the concept of regime transition in polymer crystallization in 1973 .This is a function of secondary nucleation rate on the substrate and the consequent surface spreading.
Use of the equation
Taking natural logarithm of both sides of equation (9), yields
and are best fit by a single straight line. Figure 3 illustrates plot based on the equation (2) (data from Table 4).The slopes of the least – square lines drawn through these plots equal nucleation constant .The results of are collected in Table 5.
In the present study, range covered for the PET and PET/TLCP blends fall in the range (138.86 - 189.73 °C) which is associated with regime II and regime III.
In regime II, the crystallization occurs at moderate supercooling temperature and i and g are the same order of the magnitude; multiple chains are crystallizing at a time and adjacent re-entry takes place and for regime III the crystallization occurs at relative high supercooling temperature range. Each chain only makes a few folds before re-entering the amorphous phase, then they may go back into the crystal following a switchboard type model or they may join onto the next lamella and i >>g. As temperature is decreased from Regime II to III, the rate that the chain is laying down (g) decreases but the number of chains crystallizing at one time increases. Therefore the overall growth rate G goes through a maximum, hence linear lamellar growth rate (G) facilitates estimation of the product of the lateral (σ) and end surface (σe) free energies [18].
The regime theory predicts rather sharp transitions between the growth rates in different regimes yet data shows more gradual transitions. It is difficult to observe regimes since: crystallization is too slow in regimes I and III, deep quenches are difficult to achieve instantaneously, i.e. without going through some crystallization in Regime II, rate of crystallization is very slow in regime I (and III).
Figure 3 presents the Lauritzen-Hoffman plot of PET/TLCP composites in terms of equation (2). As seen in Figure 3, graphical analysis indicates that experimental data reasonably fits with two straight lines for the neat PET and PET/TLCP composites. The slope ratio i.e., Kg(III)/Kg(II), which indicates a transition from regime II to III. It can be found that the regime transition temperatures for PET is less than PET/TLCP 90/10, 80/20 and 70/30 composites but higher than PET/TLCP 60/40 and 50/50 composites. There are probably two reasons to cause the reduction in experimental transition temperature of the present PET sample. One of them probably arises from the difference in molecular weight of different samples [19]. The other is likely from the different values of equilibrium melting temperatures whereas nucleation constant Kg in equation (2) is quite sensitive to the value.
From graphical analysis of Figure 4, indicates that there is continuously increase in crystallization transition temperature with the addition of TLCP content from 10 to 30 wt/wt %, where the II to III transition observed located around (165 to 172)°C, a temperature range higher than the II to III transition temperature (163 °C) of neat PET. These analysis indicates that the crystallization temperature range of regime III becomes broader in PET/TLCP 90/10, 80/20 and 70/30 wt/wt % , whereas in 40
and 50% TLCP in neat PET, transition temperature is lower than that of neat PET which indicates that the crystallization temperature range of regime II becomes broader. Thus relative rates of secondary nucleation and surface spreading are changed. The values of transition temperatures are given in Table 5, the nucleation constant are obtained from the plots of Figure 3 and are used to calculate the fold surface free energy (σe) of neat PET and PET/TLCP composites from equation (4).
Assuming the PET folding along (010) planes, in the equation (11), Layer thickness b is estimated to be 5.53 A° and The density d of the perfectly crystalline phase is equal to 1.335 gm cm-3.
Using experimentally observed and = 140 J/g [20].
The product σσe is calculated for PET/TLCP blends by employing
and is allowed for these calculations, the free energy of formation per unit area of the lateral surface, σ, has been estimated from the following Thomas–Staveley empirical relationship [21].
Where is empirical constant and assumed to be ~ 0.25.
The values of for neat PET and PET/TLCP composites are shown in Table 5. For the neat PET, the value of varies in the range of 208.2-272.3 ergs.cm-2 which is higher than PET/TLCP composites. Thus addition of TLCP into neat PET gives rise to the decrease in of PET. As a result value of is reduced, thereby giving rise to an increase in crystallization rate, similar behavior is observed for work of chain folding for PET/TLCP composites to fold polymer chain as compared to neat PET.
Conclusion
Differential scanning calorimetry has been used to investigate the overall kinetics of melt-crystallization of PET and PET/TLCP composites under nonisothermal quiescent conditions and subsequent melting behavior. The nonisothermal melt crystallization exothermic peak temperature of PET and PET/TLCP composites was found to shift to lower temperatures when the cooling rates were increased. For triple-melting phenomenon, it was postulated that the occurrence of peak I was a result of the melting of the primary crystallites, peak II was a result of the melting of crystallites formed on recrystallization, and peak III was a result of the melting of reformed crystallites of different stabilities. Lastly, analysis of the melting temperature of the primary crystallites according to the linear Hoffman–Weeks extrapolative methods to obtain the equilibrium melting temperatures of these composites was conducted. In terms of the modified Lauritzen and Hoffman regime nonisothermal crystallization analysis exhibited a significant regime transition for both resins. It is believed that the transition that is observed is the regime II to III transition. The ratios of the regime III to regime II slopes were roughly 2.2, 1.9 and 2.2 for 10, 20 and 30 wt/wt% of TLCP into PET, respectively; compared with the theoretical value of 2.0. For loading of TLCP ≤ 30% in PET, regime transition temperature is higher as compared to neat PET.
Conflicts of Interest
Declare conflicts of interest or state “The authors declare no conflicts of interest.”.
References
- Ozawa T. Polymer 12:150, 1971.
- Wu, J.; Schultz, J. M.; Samon, J. M.; Pangelinan, A. B.; Chuah, H. H. Polymer 42, 7141, 2001.
- Grande, J. A. Mod Plast 12, 97, 1997.
- Jabarin SA. J Appl Polym Sci 34:97–102,1987.
- Fann DM, Huang SK, Lee JY. Polym Engng Sci 38:265–273., 1998.
- Incarnato L, Motta O, Acierno D. Polymer 39:5085–5091, 1998.
- C. C. Lin, Polym. Eng. Sci., 23, 113,1983.
- S. A. Jabarin, J. Appl. Polym. Sci., 34, 85,1987..
- W. H. Cobbs and R L. Burton, J. Polym Sci, 10, 275,1953.
- F. D. Hartley, F. W. Lord, and L. B. Morgan, PhiLfans. Roy. Soc. London, 7.23, 1954.
- B. Gunther and H. G. Zachmann, Polymer, 24, 85, 1983.
- R. Bianchi, P. Chivacci, R Vosa, and G. Guerra, J. AppL Polym Sci, 43, 1087 1991.
- T. Asano, A. Dzeick-Picuth. and H. G. Zachmann, J. Mater. Sci, 24. 1967,1989.
- S. A. Jabarin, J. AppL Pobm Sci, 34.85 ,1987.
- S. Vyazovkin, N. Sbirrazzuoli, J. Phys. Chem. B 107,882, 2003.
- S.C.Tjong,Mater Sci Eng.: R: Reports 41,1,2003.
- M.Lai,H.Yang ,Y.Luan,Y.Yang and J.Lin , J. Appl. Pol.y Sci., 86, 436,2002.
- Hoffman, J.D.; Miller, R.L, Polymer 38, 3151-3212, 1997..
- Cheng, S.Z.D., Janimak, J. J.; Zhang, A. Q. Cheng H. N. Macromolecules 23,298-303, 1990.
- J. Runt, D.M. Miley, X.Zhang, K.P.Gallangher, K.M.Featers, and J. Fishburn, Macromolecules, 25, 1929, 1992.
- S.C.Tjong, Mater Sci Eng.: R: Reports 41, 1, 2003.
Figure 1.
Crystallization exotherms at different cooling rates for PET/TLCP composites : (a) 100/00, (b) 90/10. Crystallization exotherms at different cooling rates for PET/TLCP composites: (c) 80/20, (d) 70/30. Crystallization exotherms at different cooling rates for PET/TLCP composites: (e) 60/40, (f) 50/50.
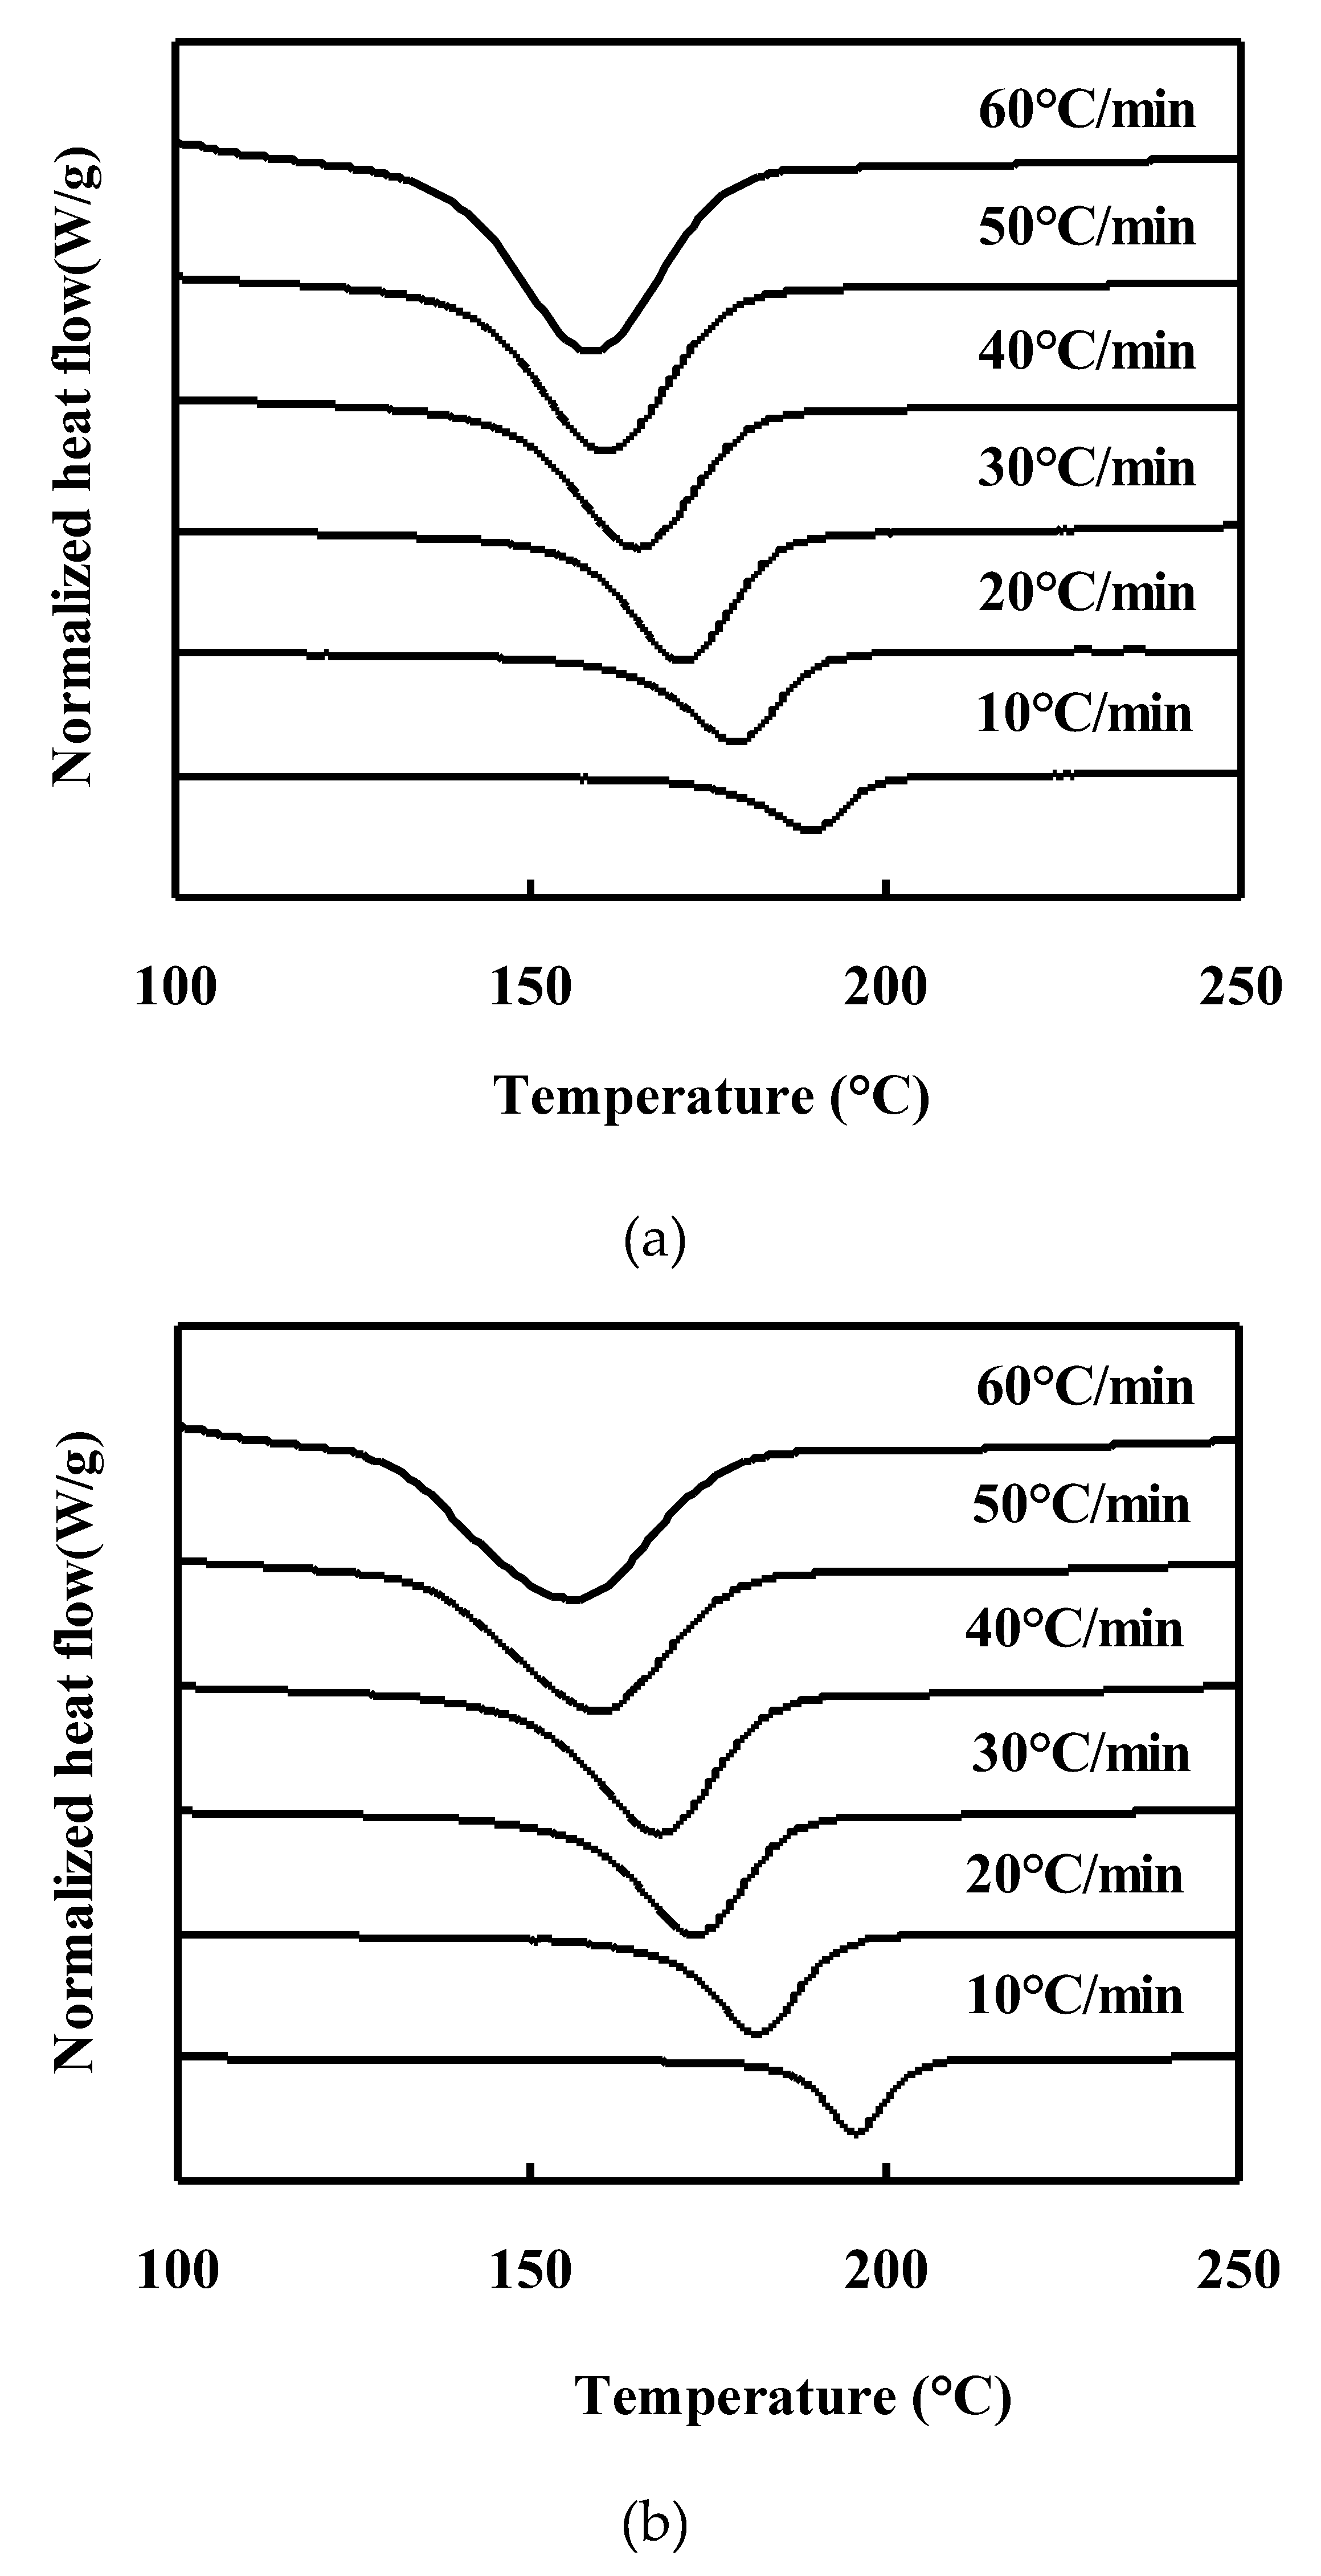
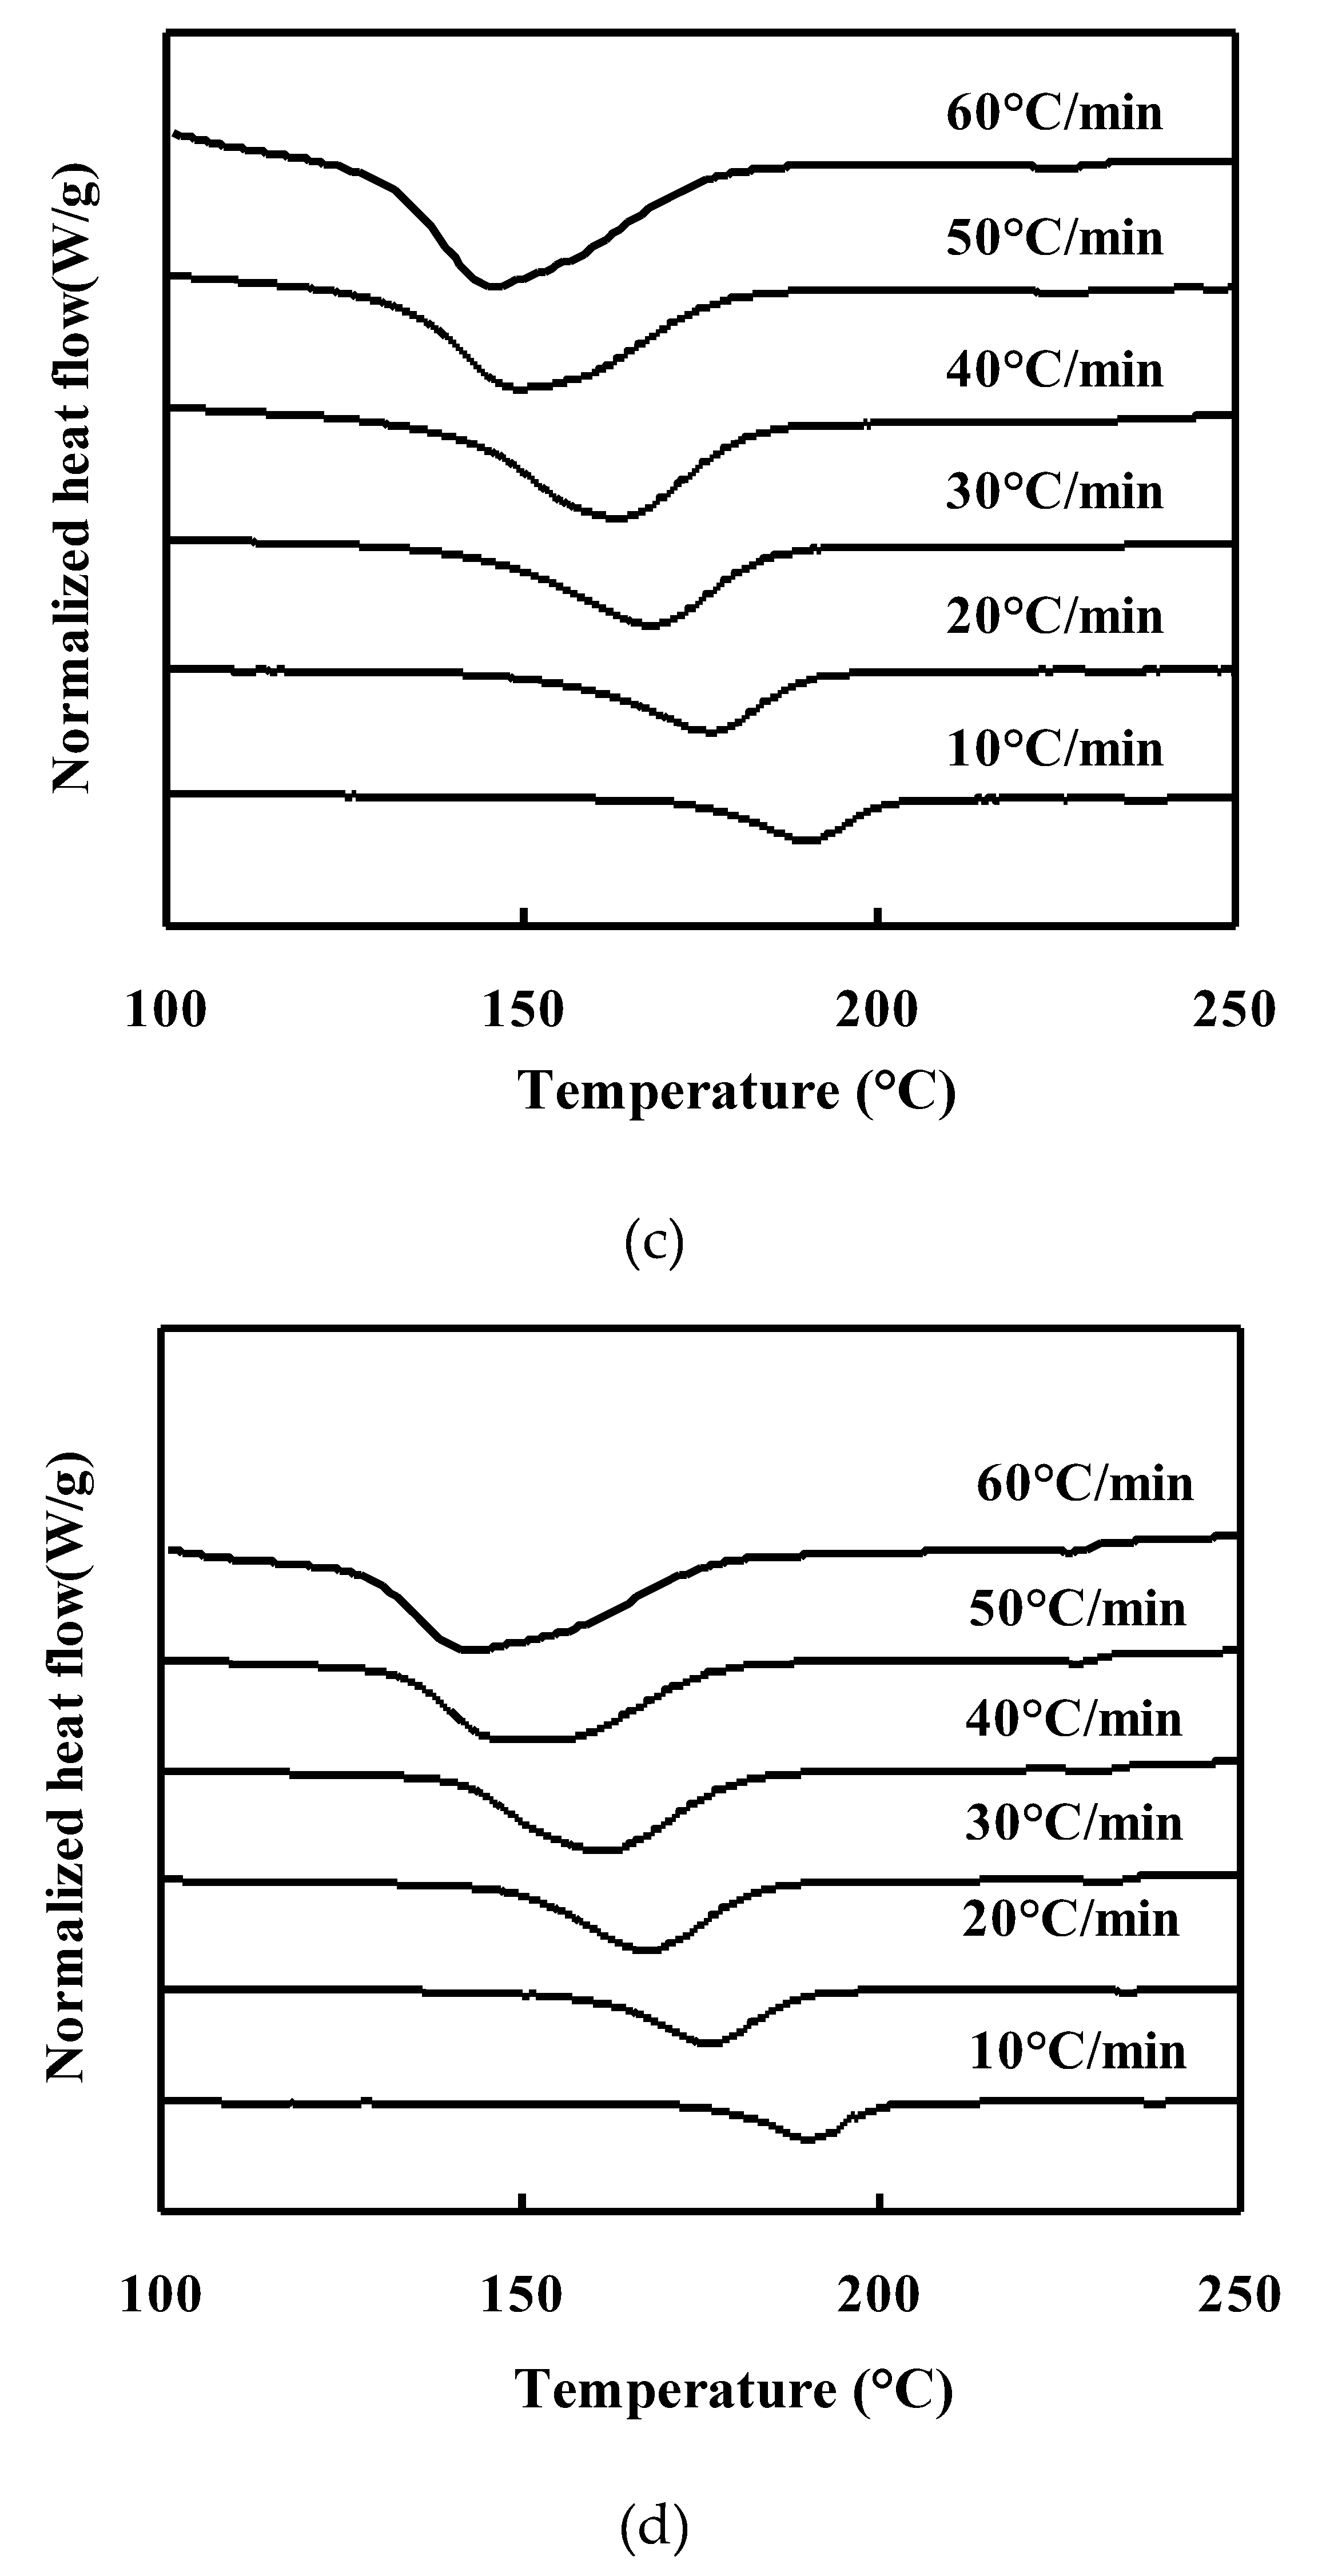
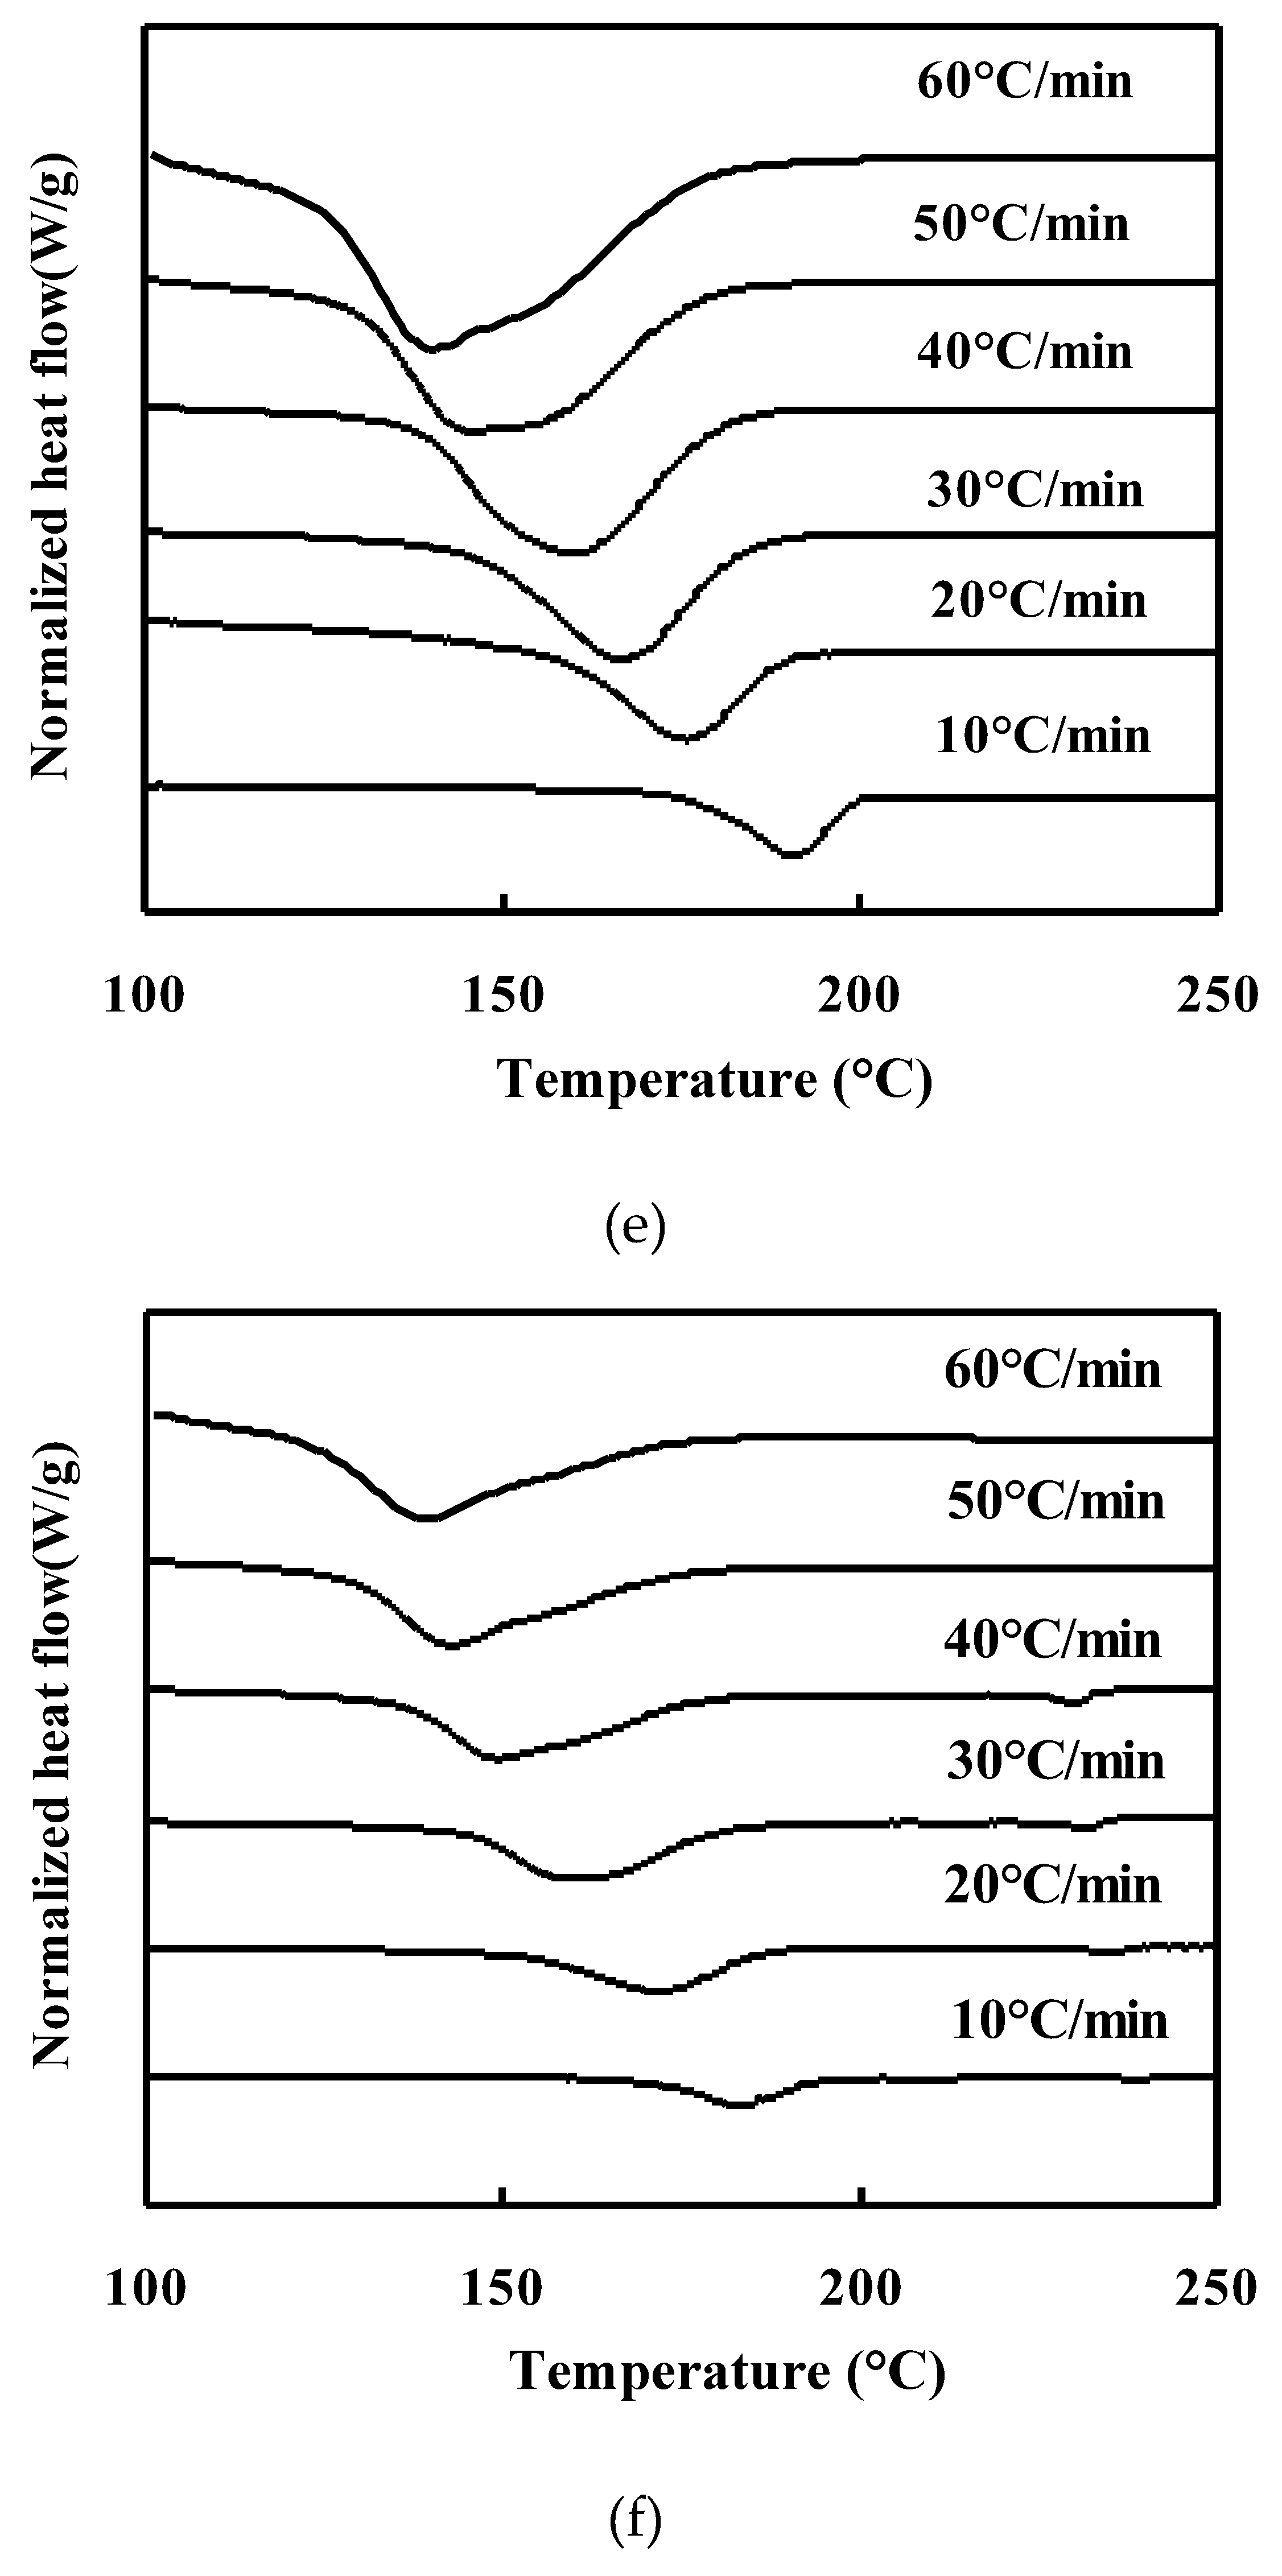
Figure 2.
Nonisothermal melt crystallization exotherms of PET/TLCP composites: (a) 100/00, (b) 90/10. (c) 80/20, (d) 70/30. (e) 60/40, (f) 50/50.
Figure 2.
Nonisothermal melt crystallization exotherms of PET/TLCP composites: (a) 100/00, (b) 90/10. (c) 80/20, (d) 70/30. (e) 60/40, (f) 50/50.
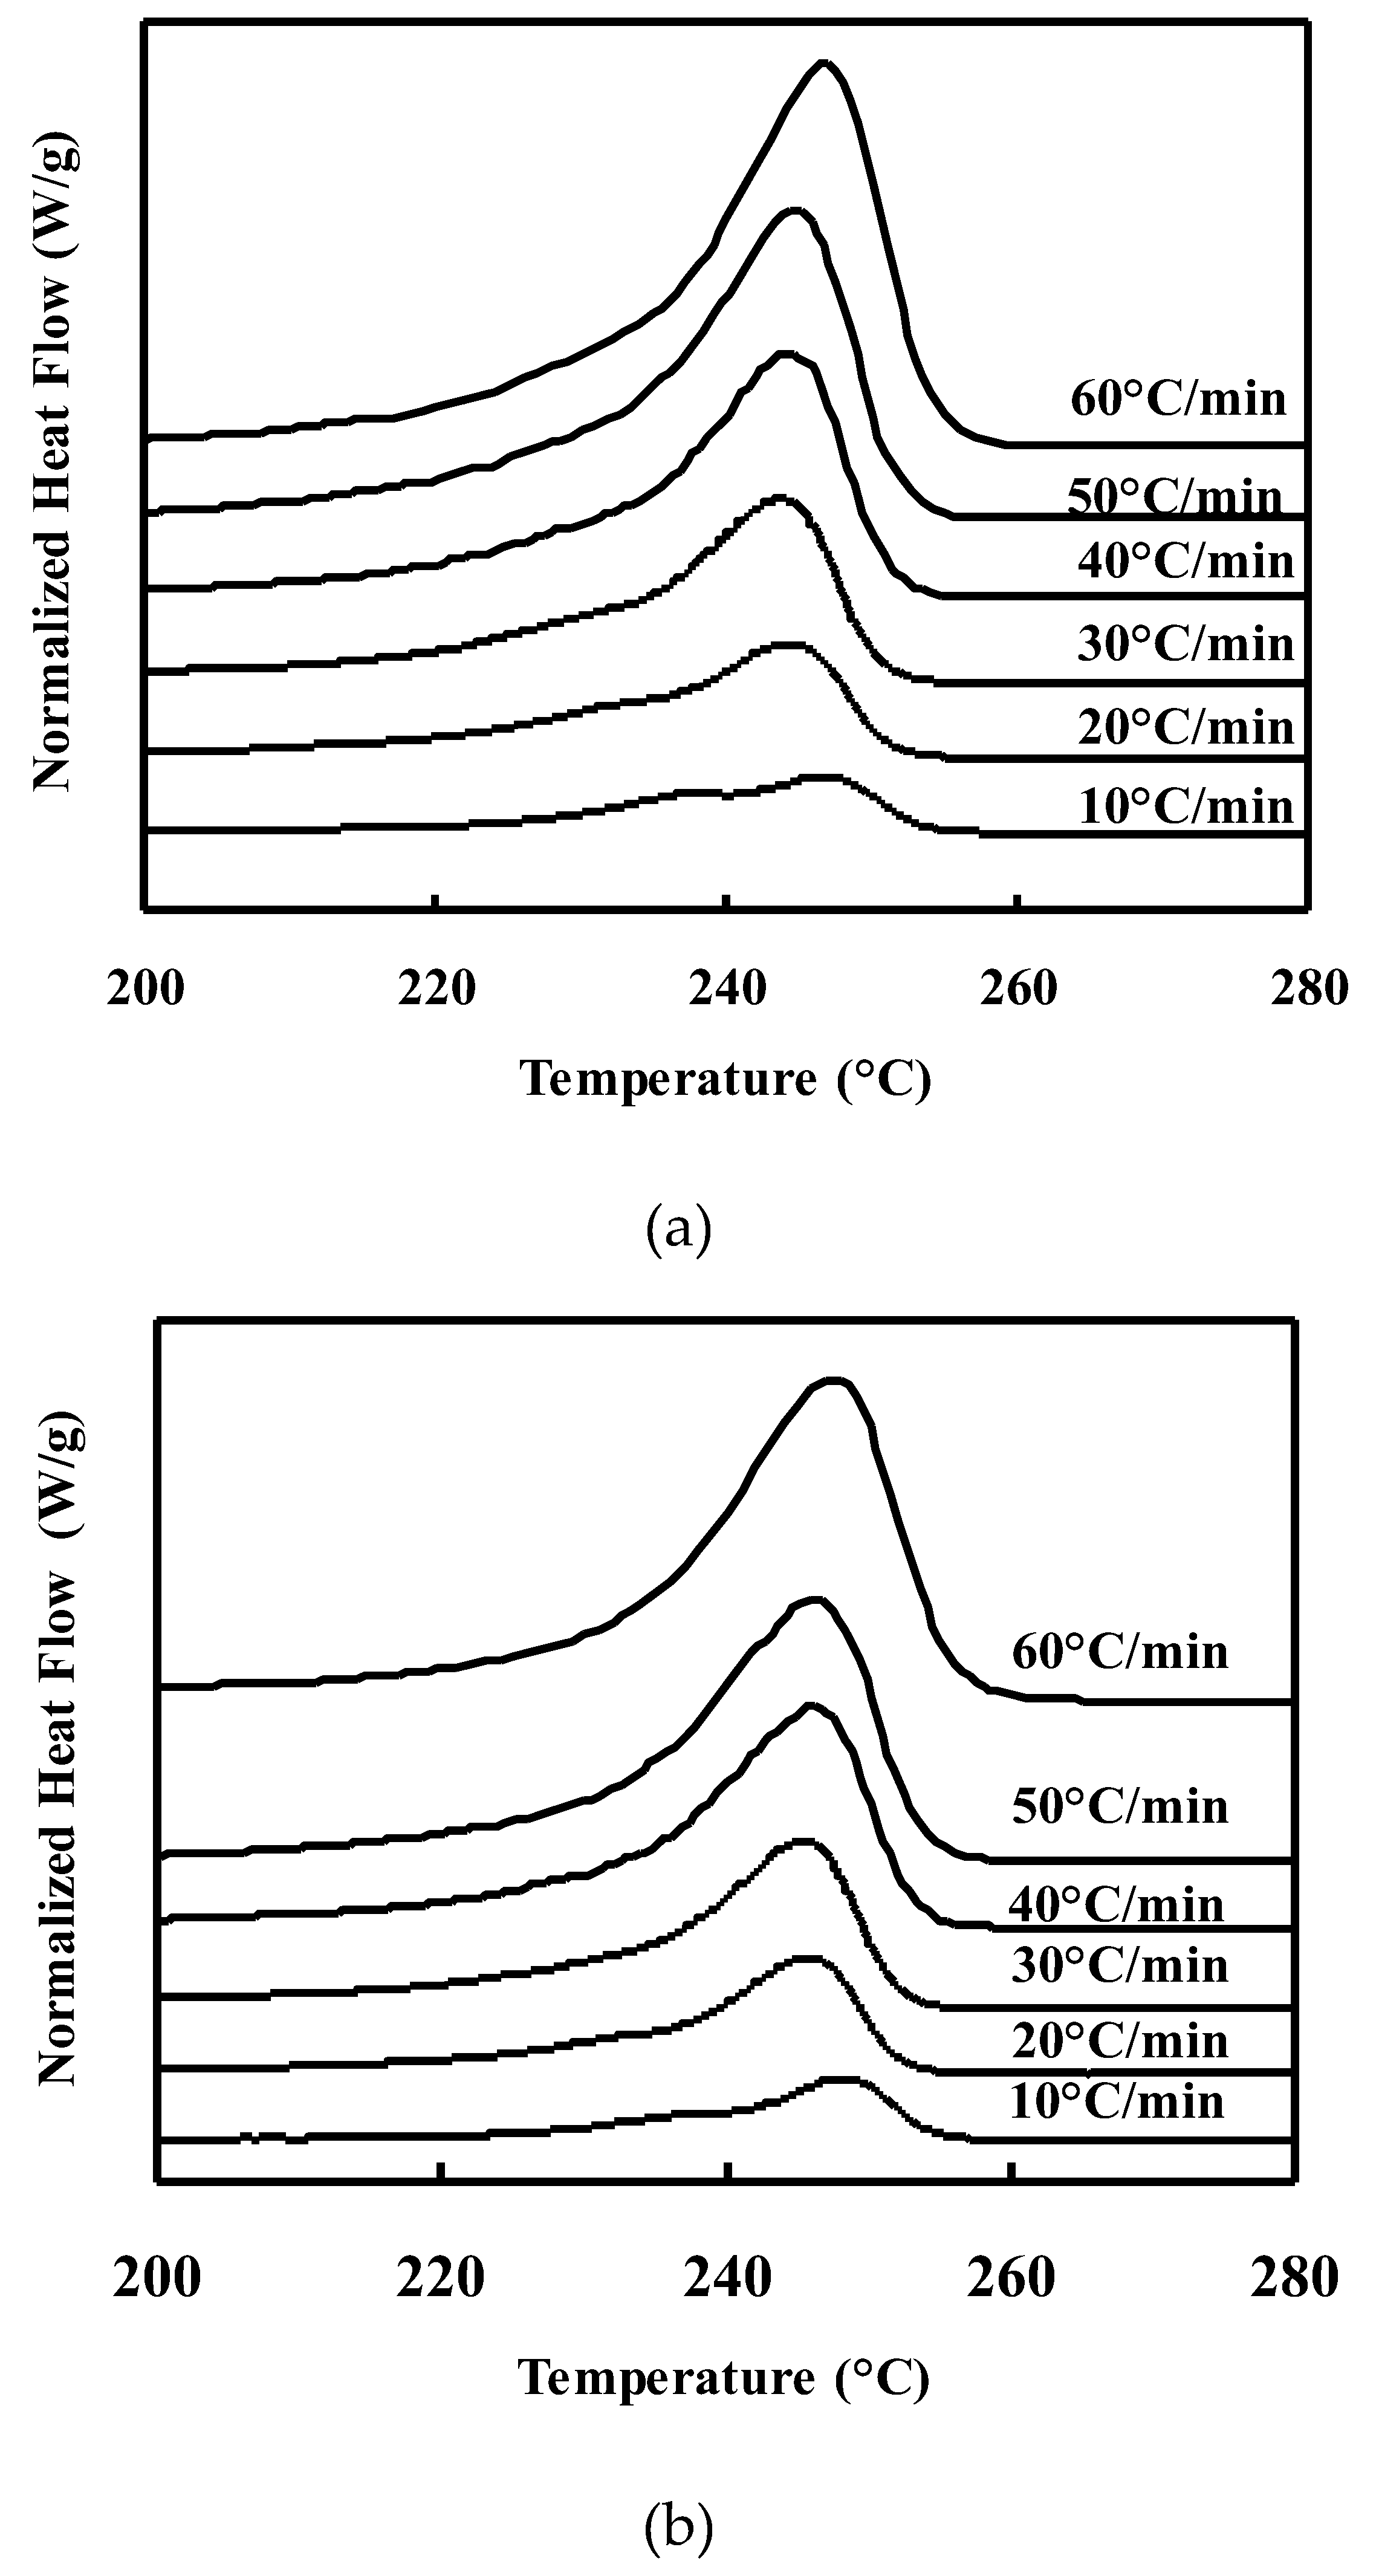
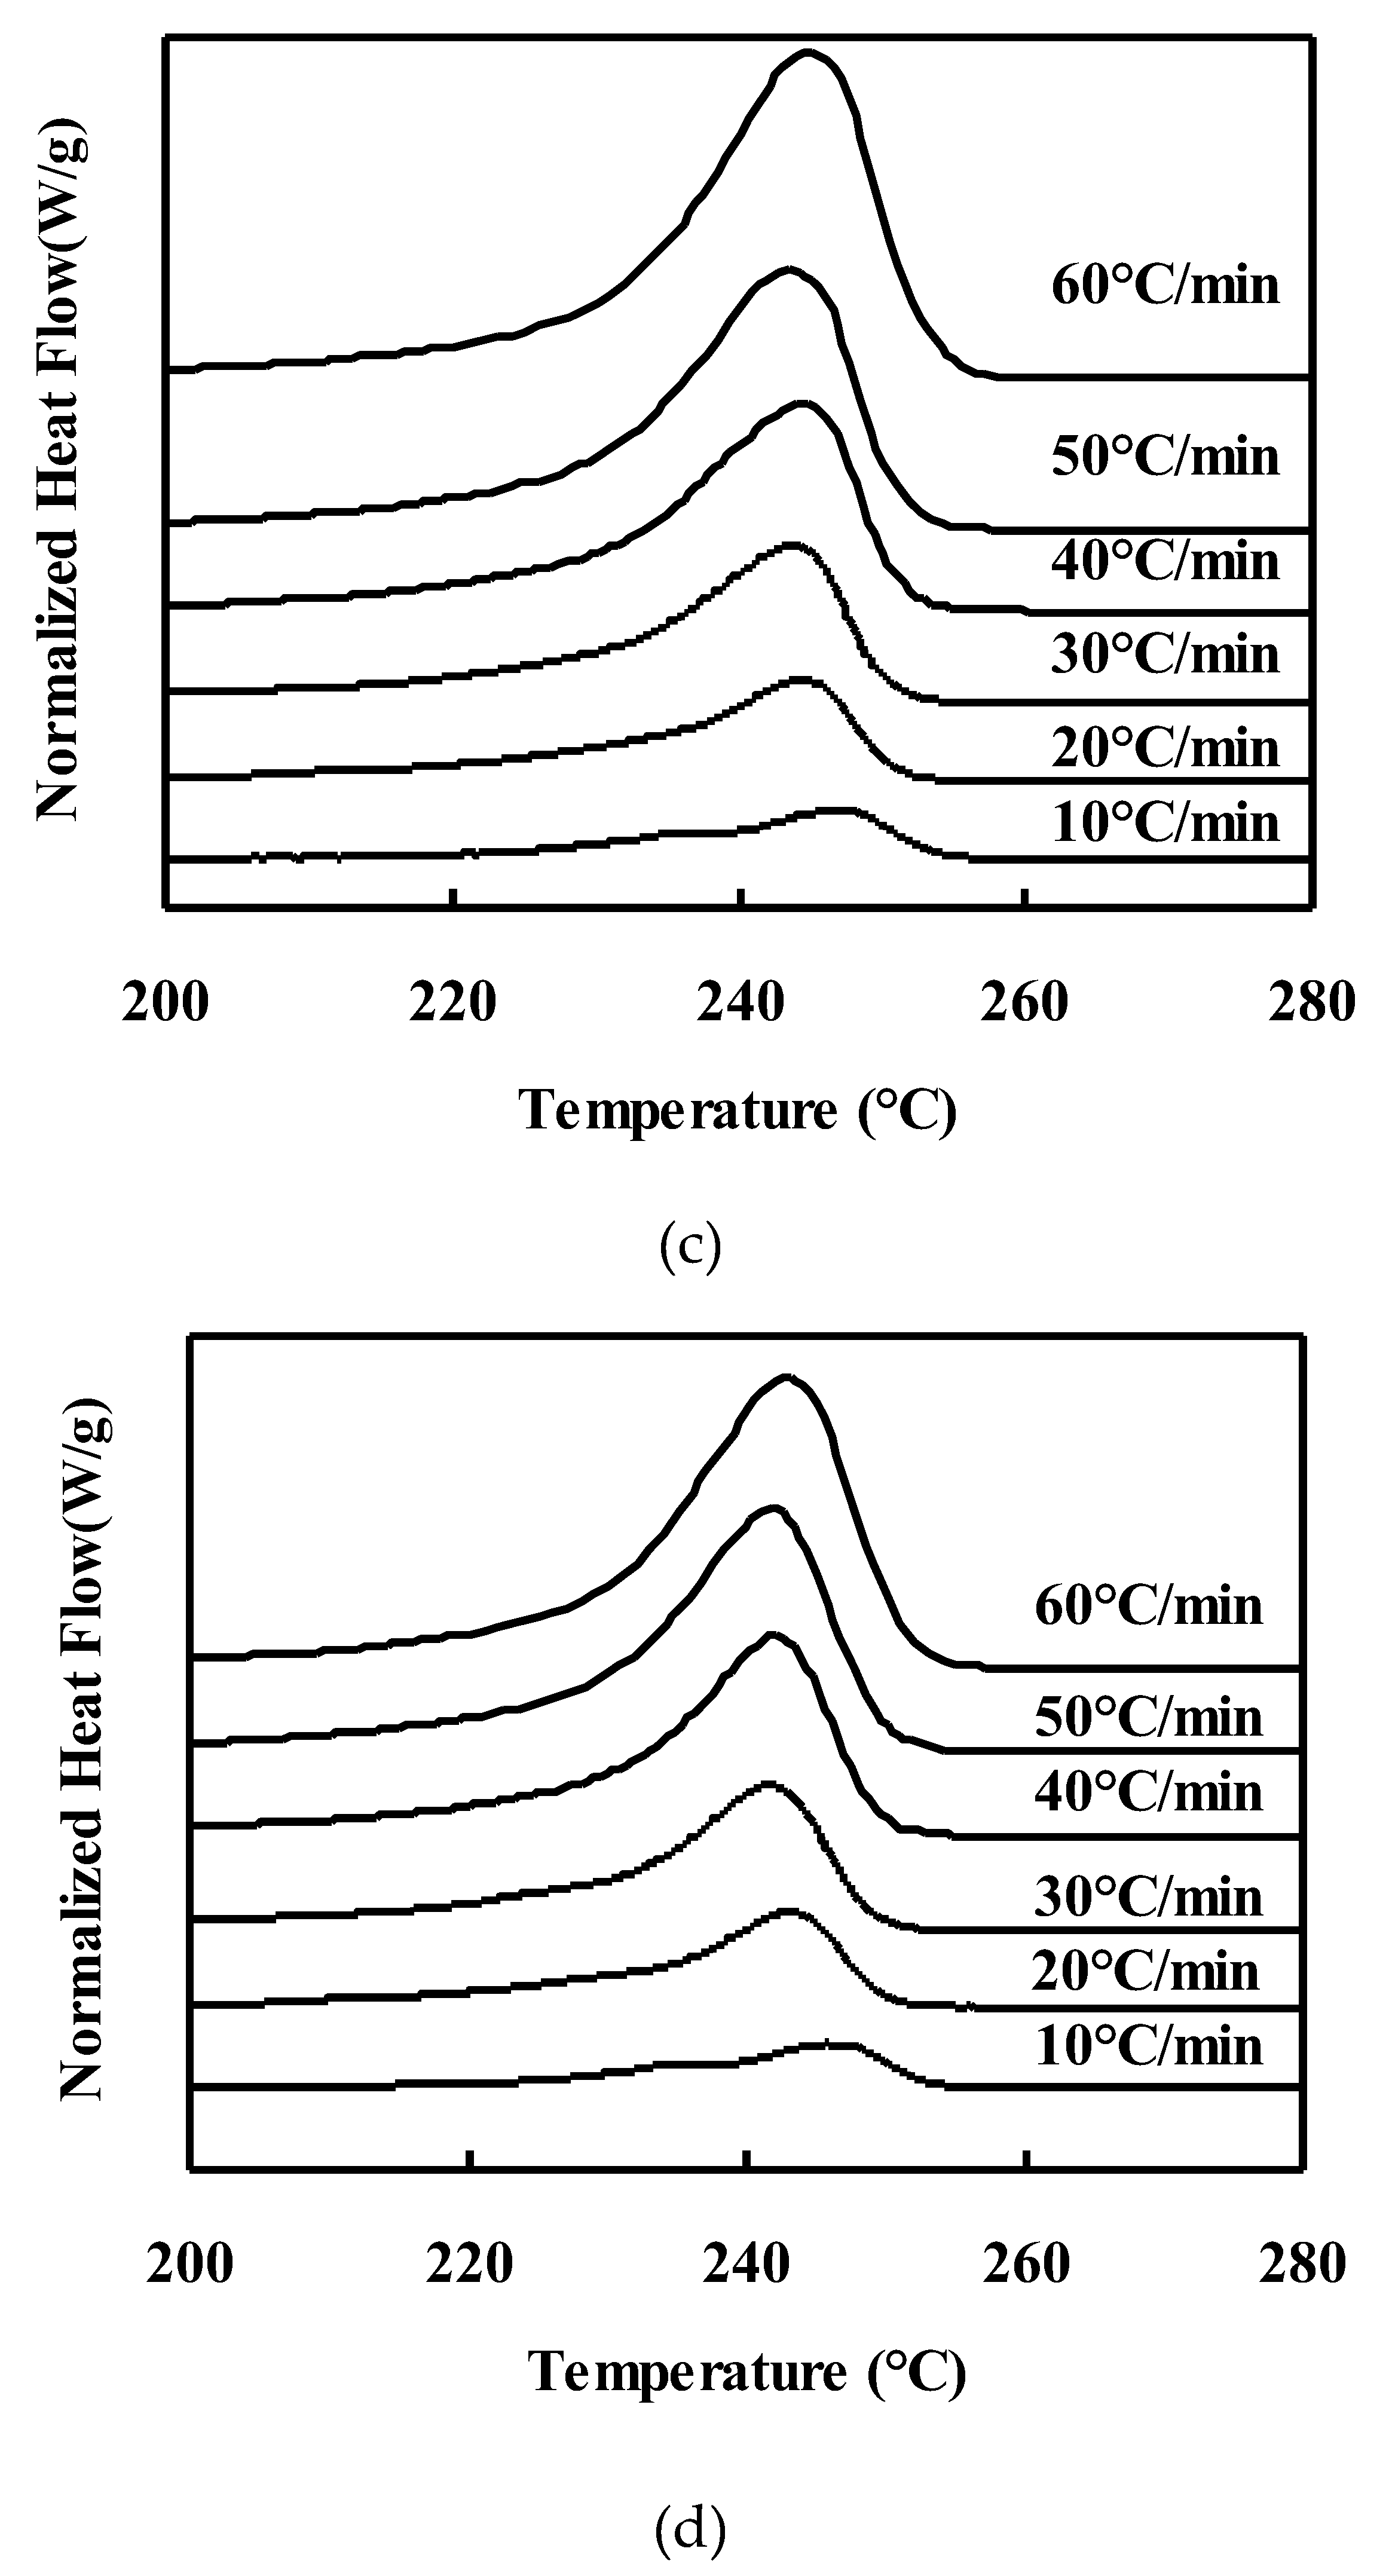
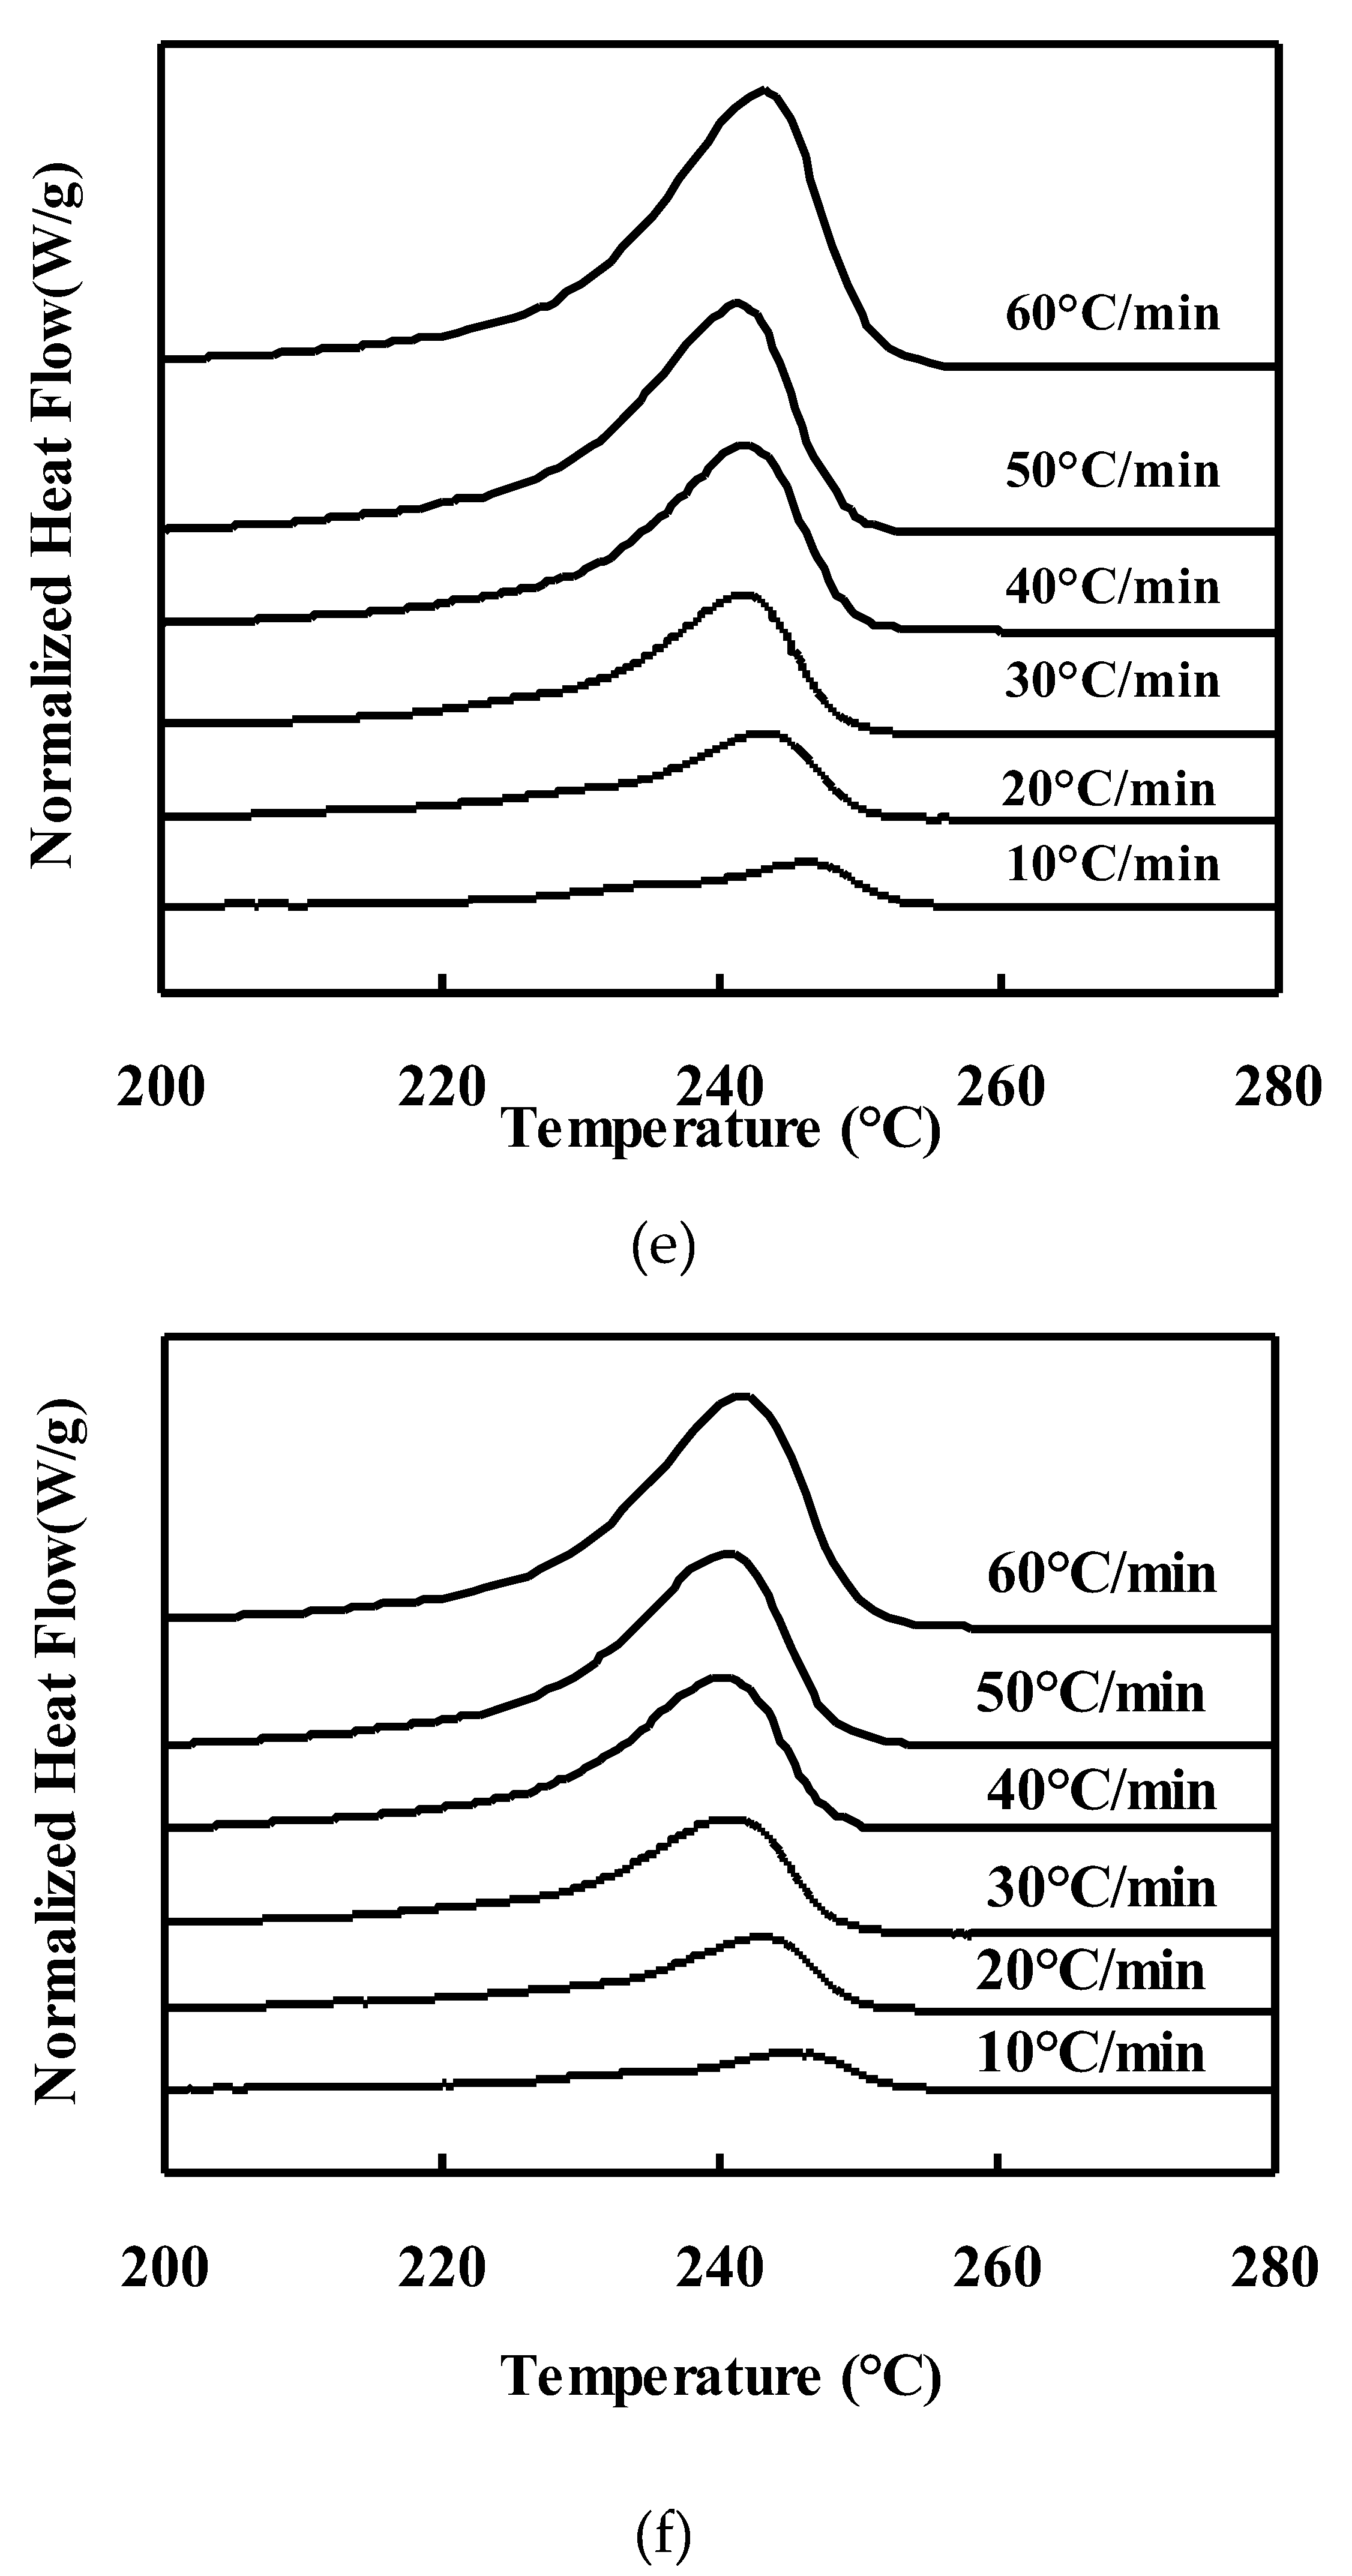
Figure 3.
Hoffman-Lauritzen plots for PET/TLCP composites for : (a) 100/00, (b) 90/10. (c) 80/20, (d) 70/30. (e) 60/40, (f) 50/50.
Figure 3.
Hoffman-Lauritzen plots for PET/TLCP composites for : (a) 100/00, (b) 90/10. (c) 80/20, (d) 70/30. (e) 60/40, (f) 50/50.
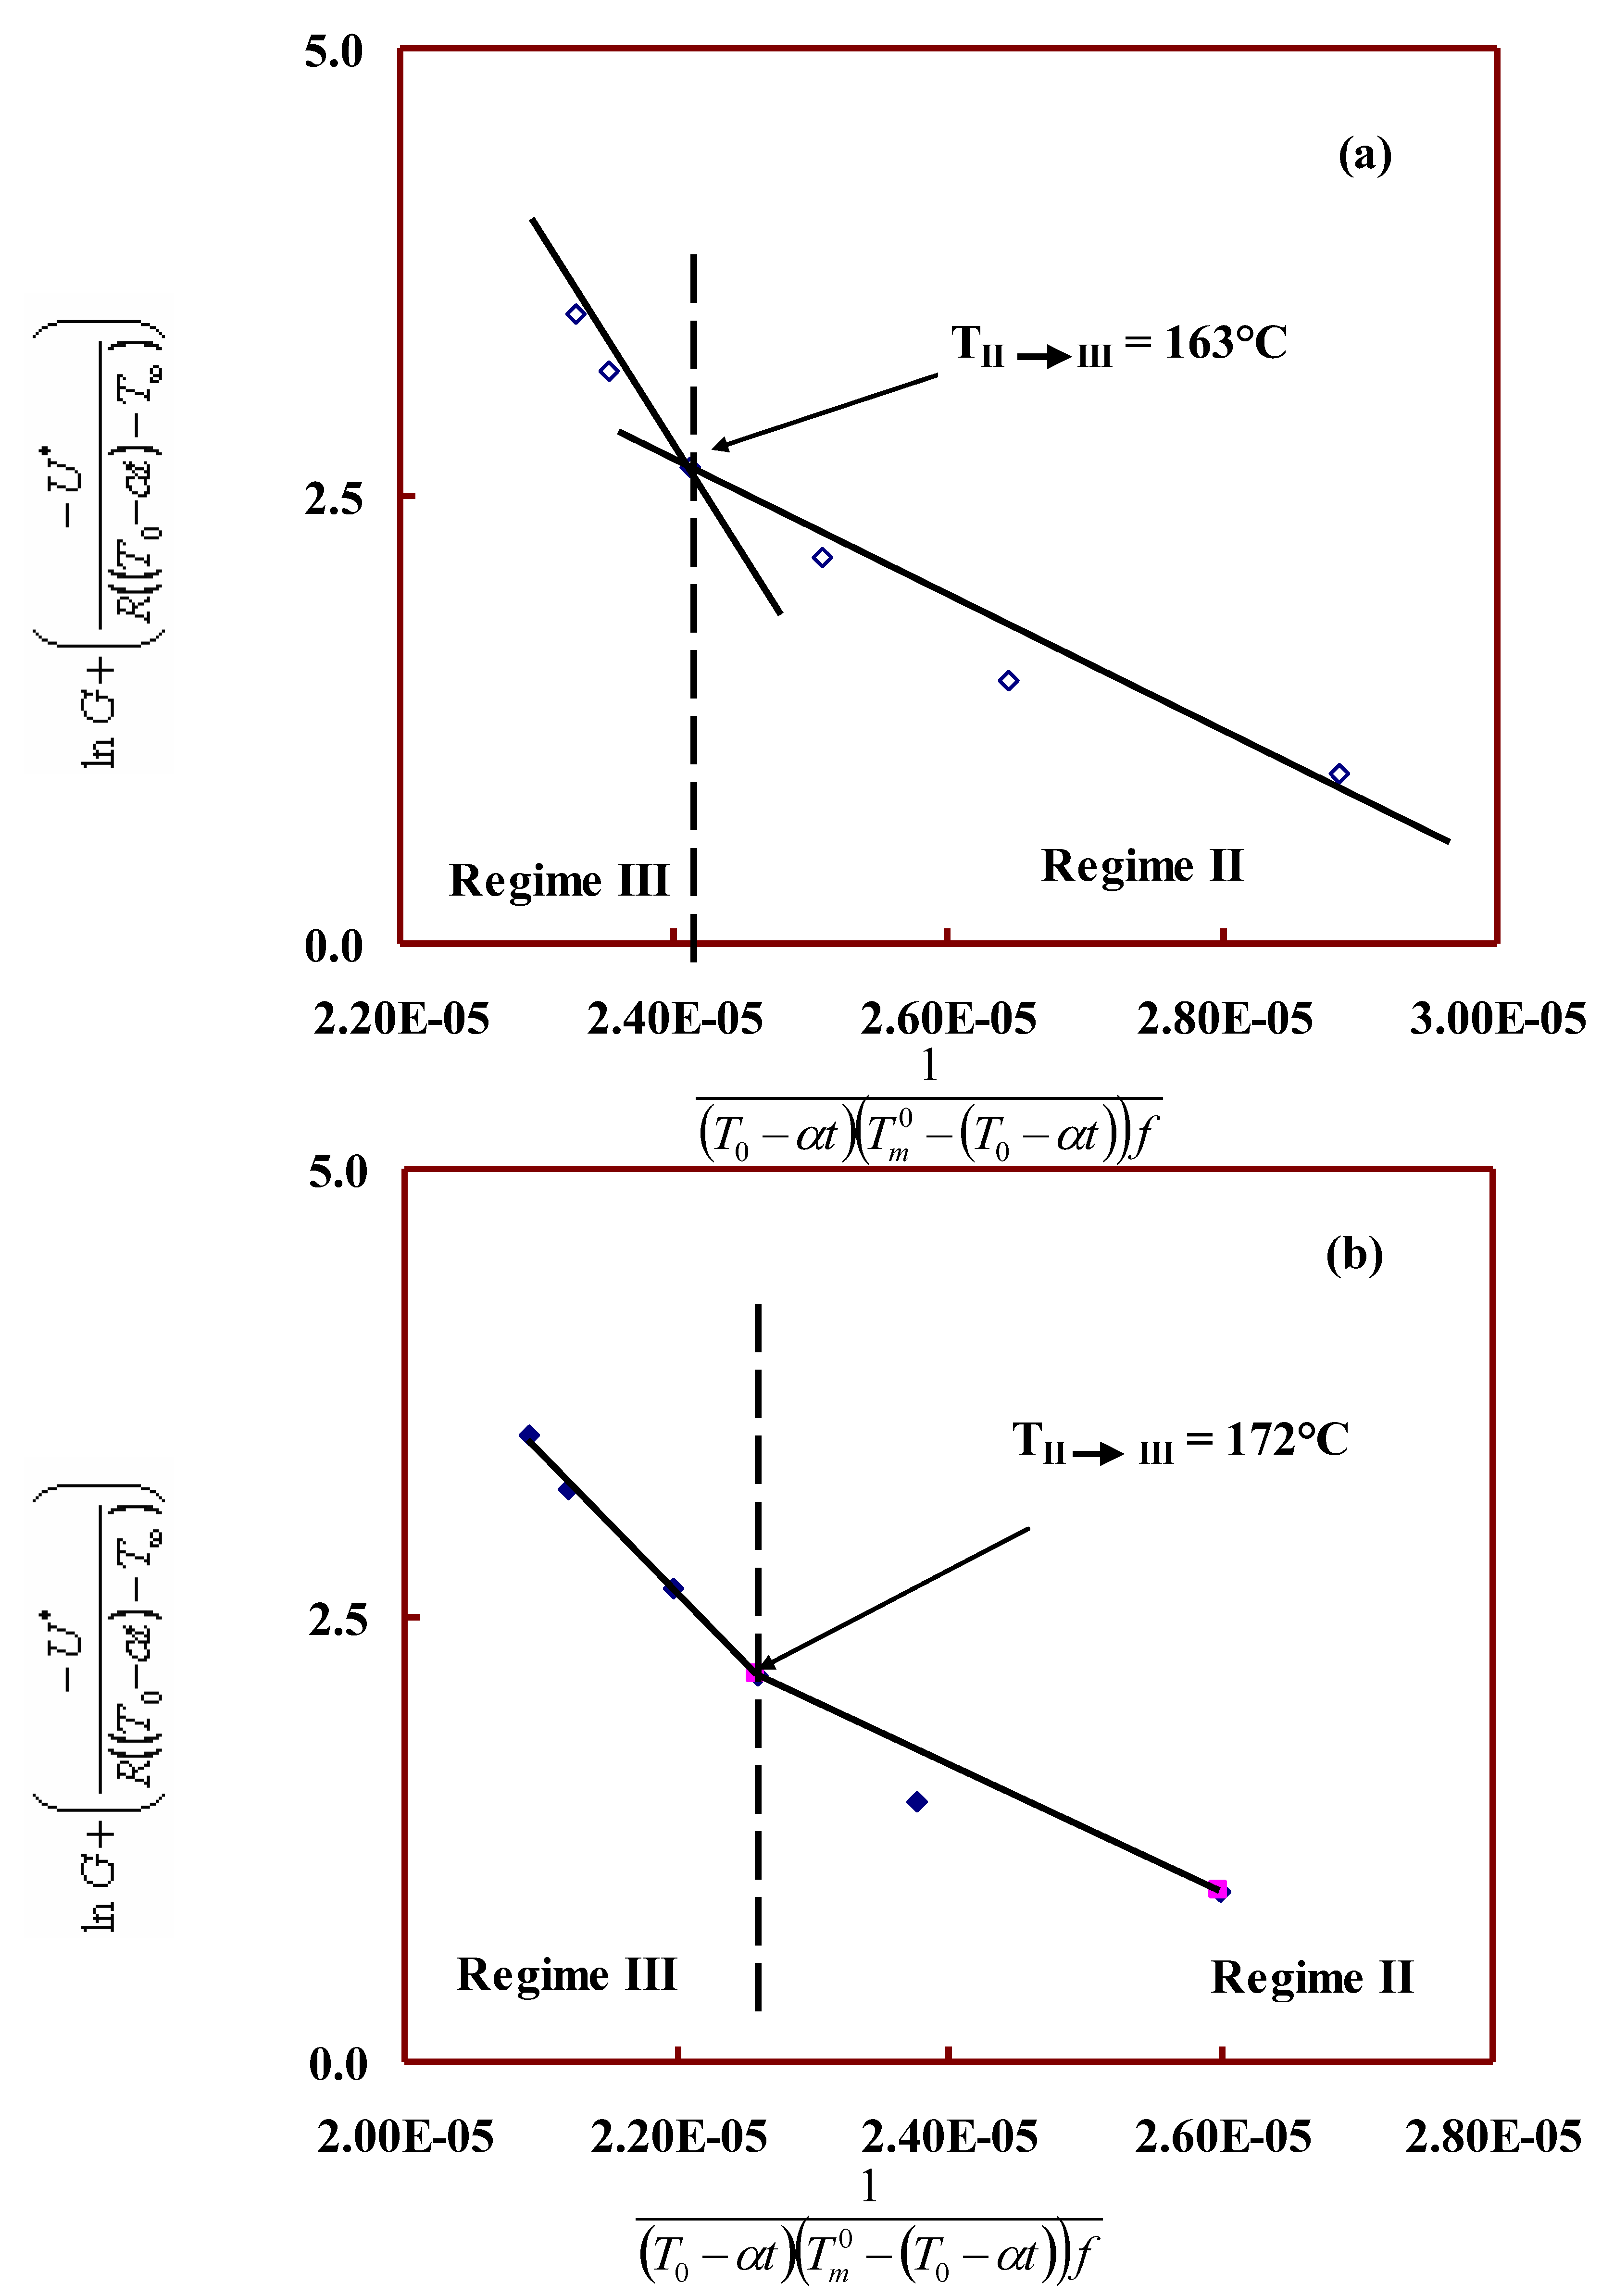
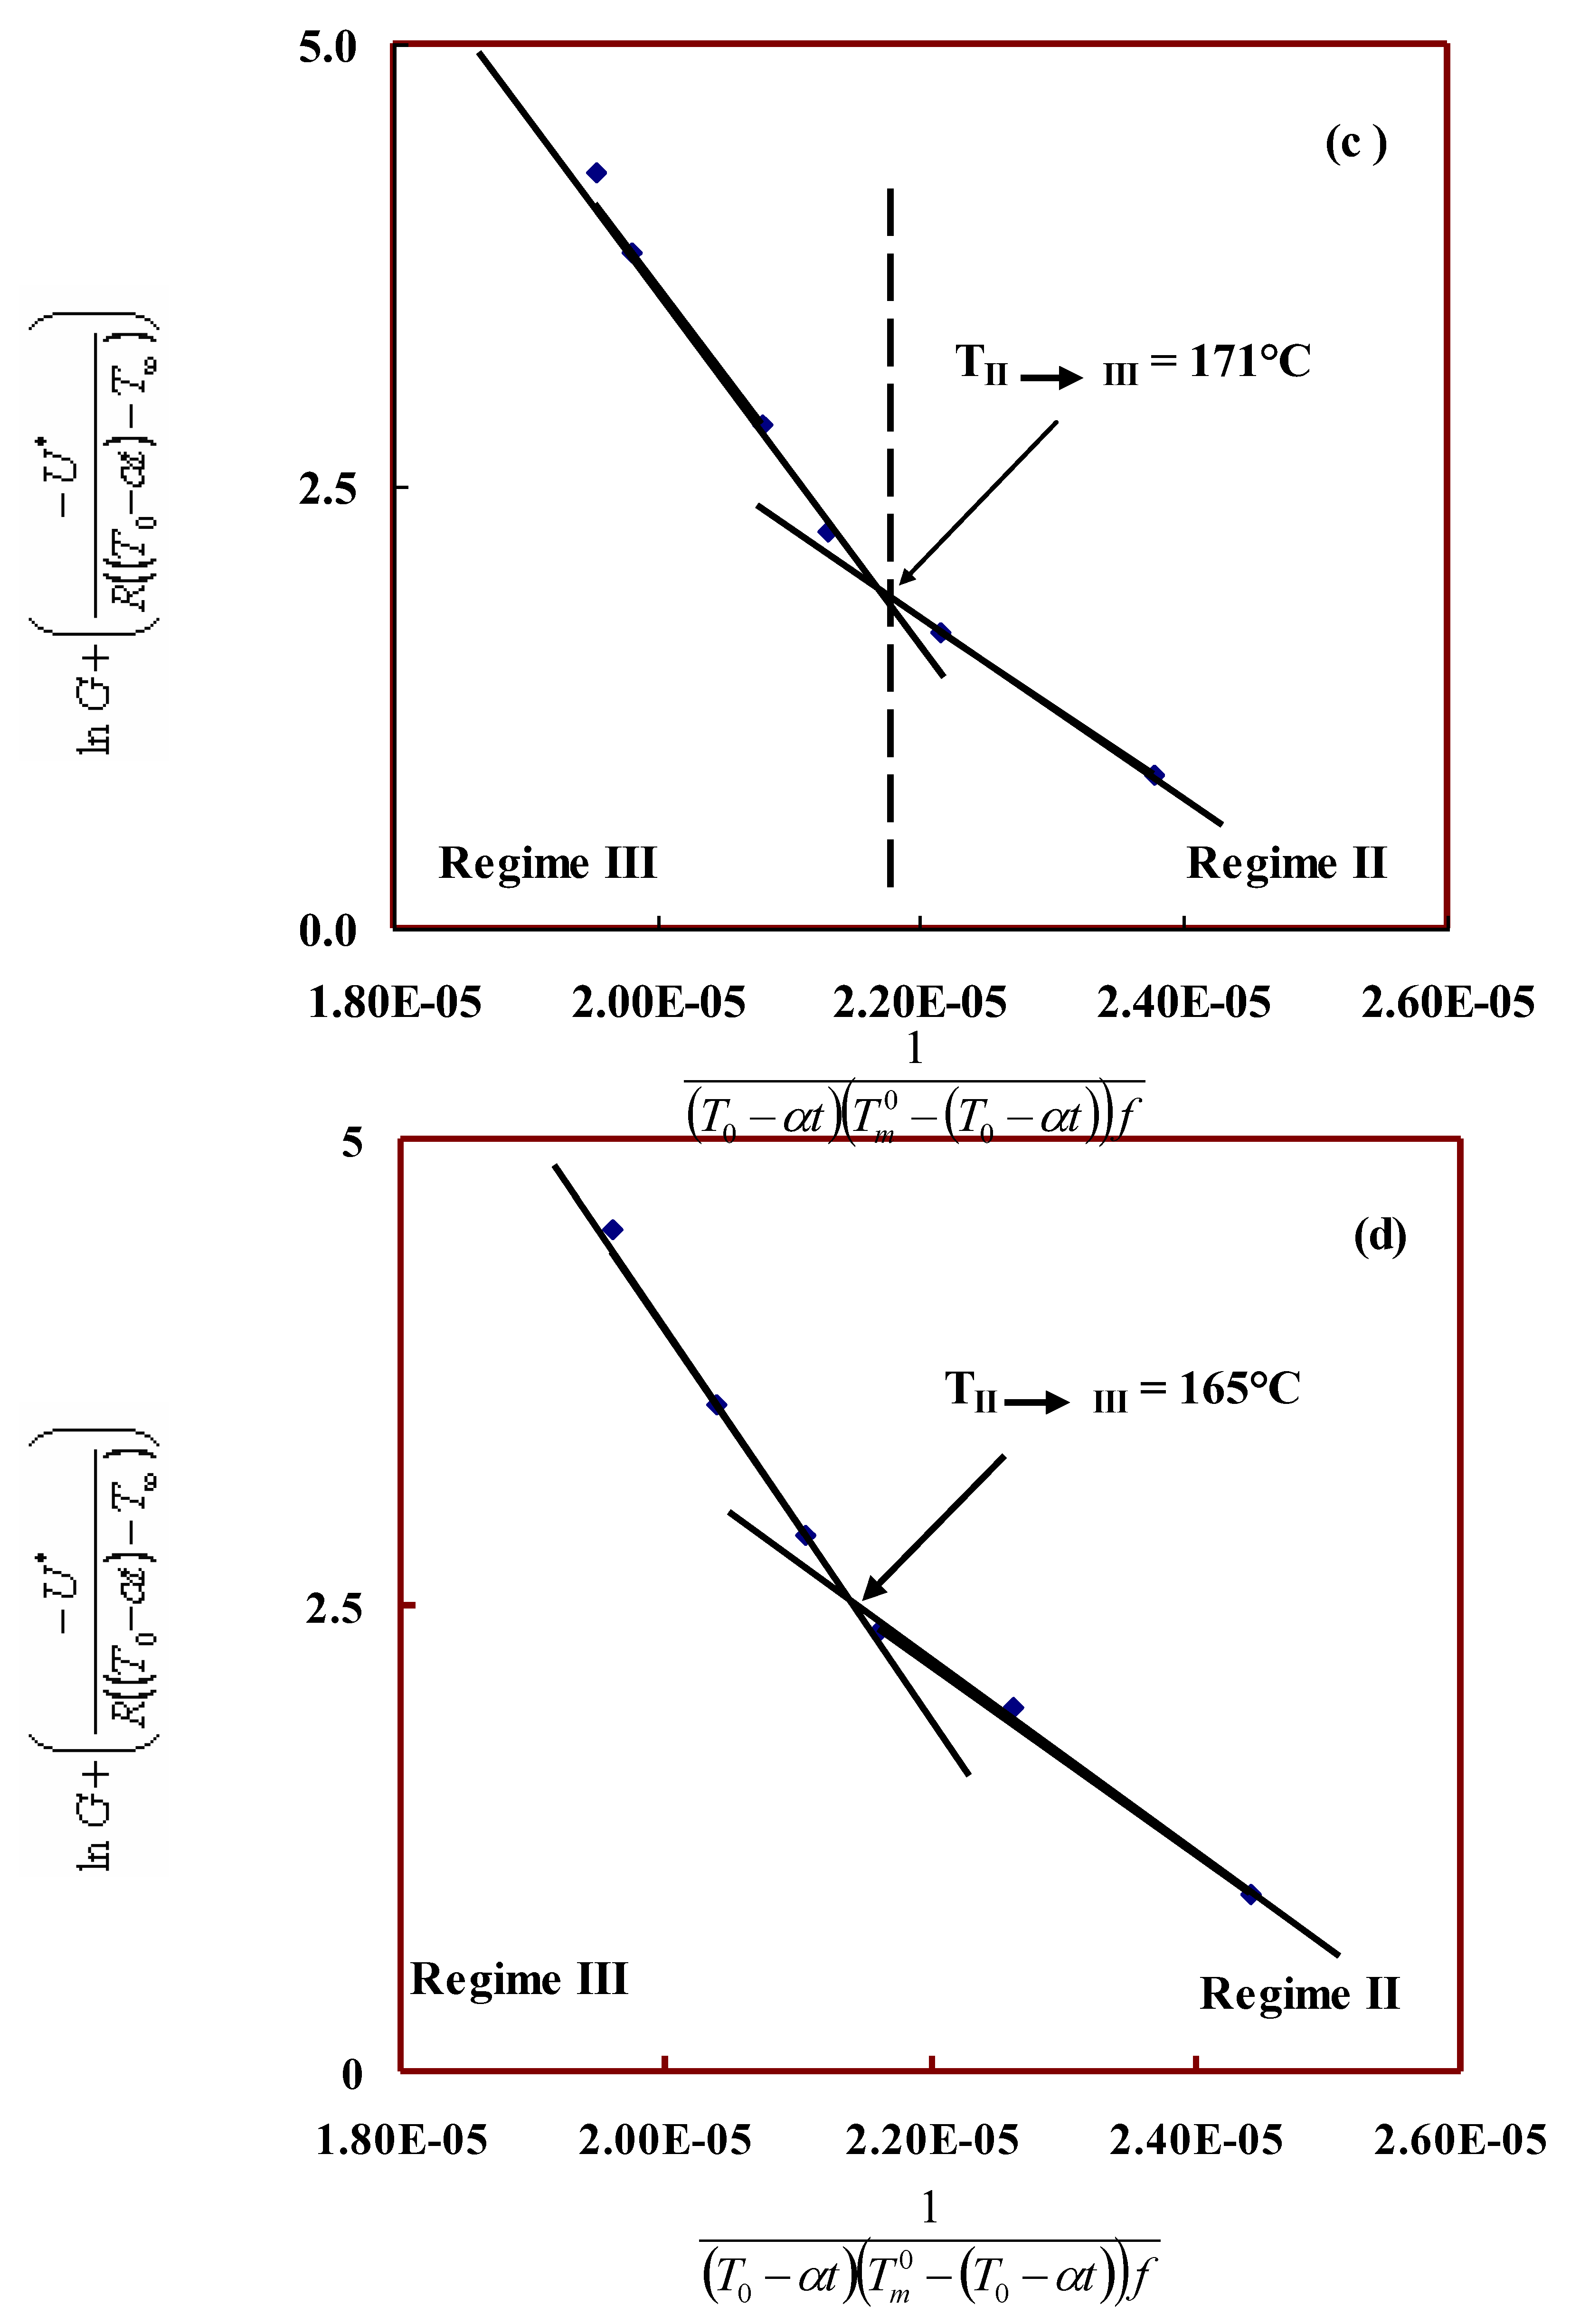
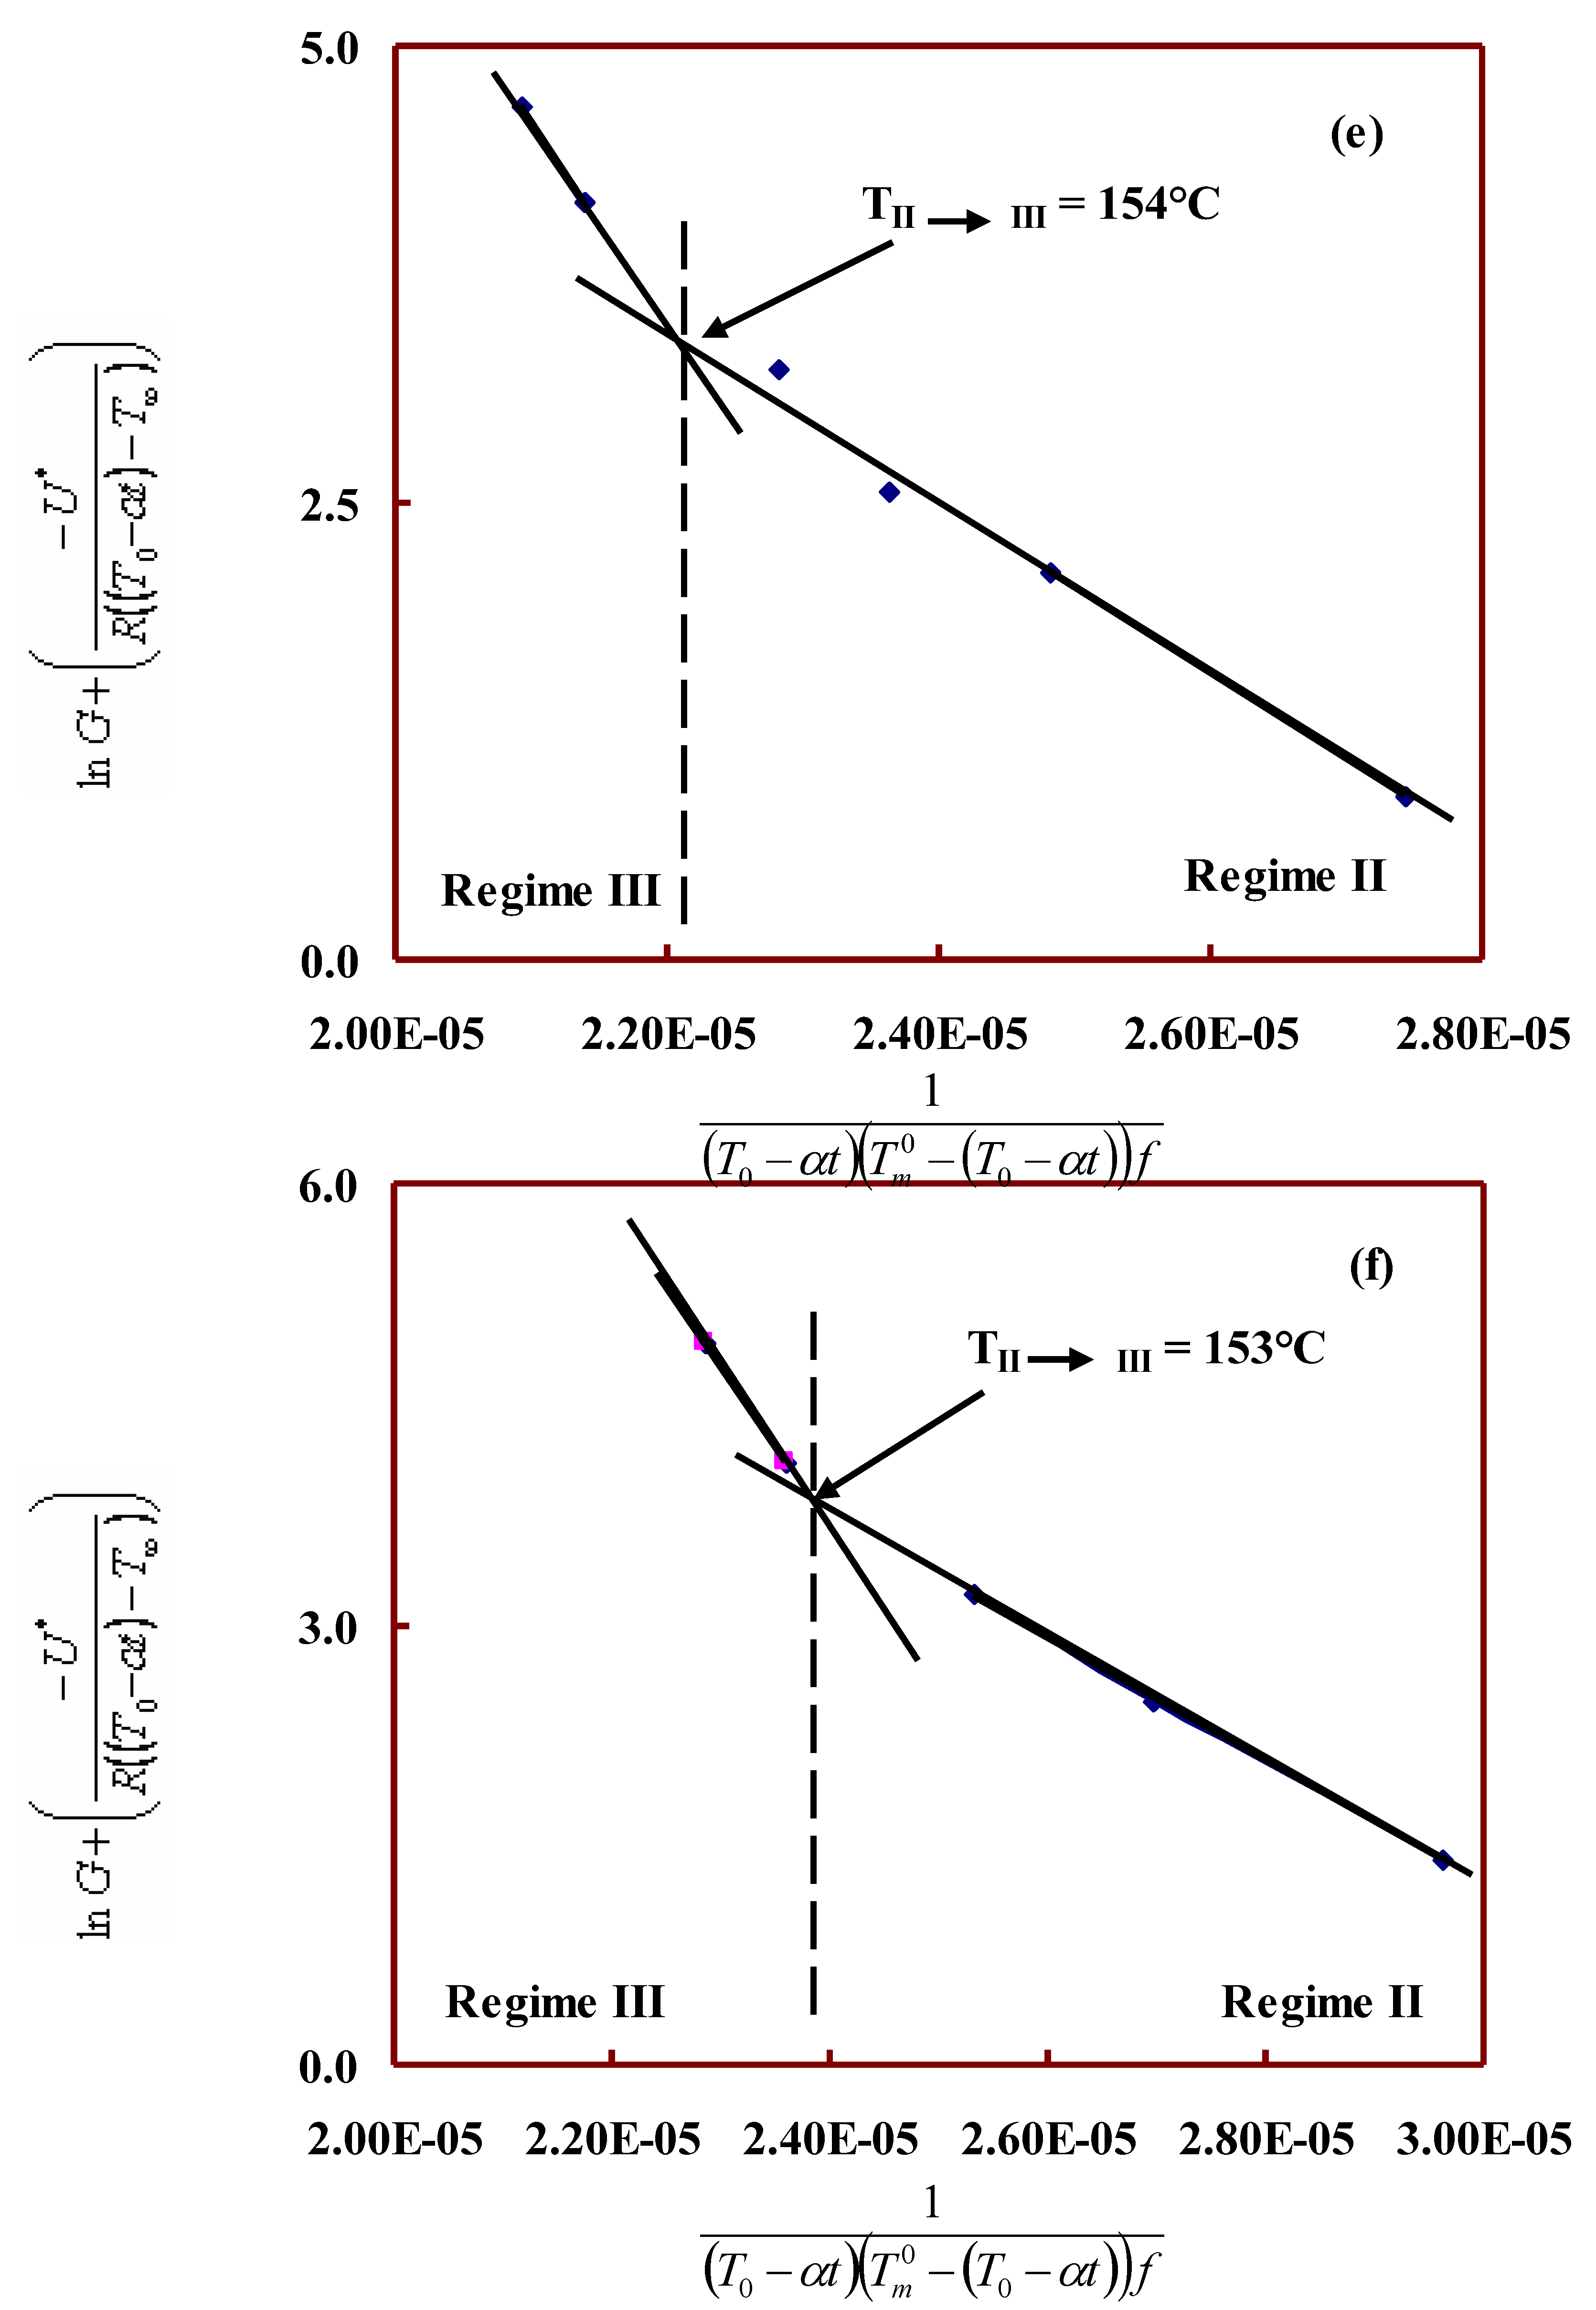
Figure 4.
Variation of regime transition temperature (°C) with TLCP % in PET.
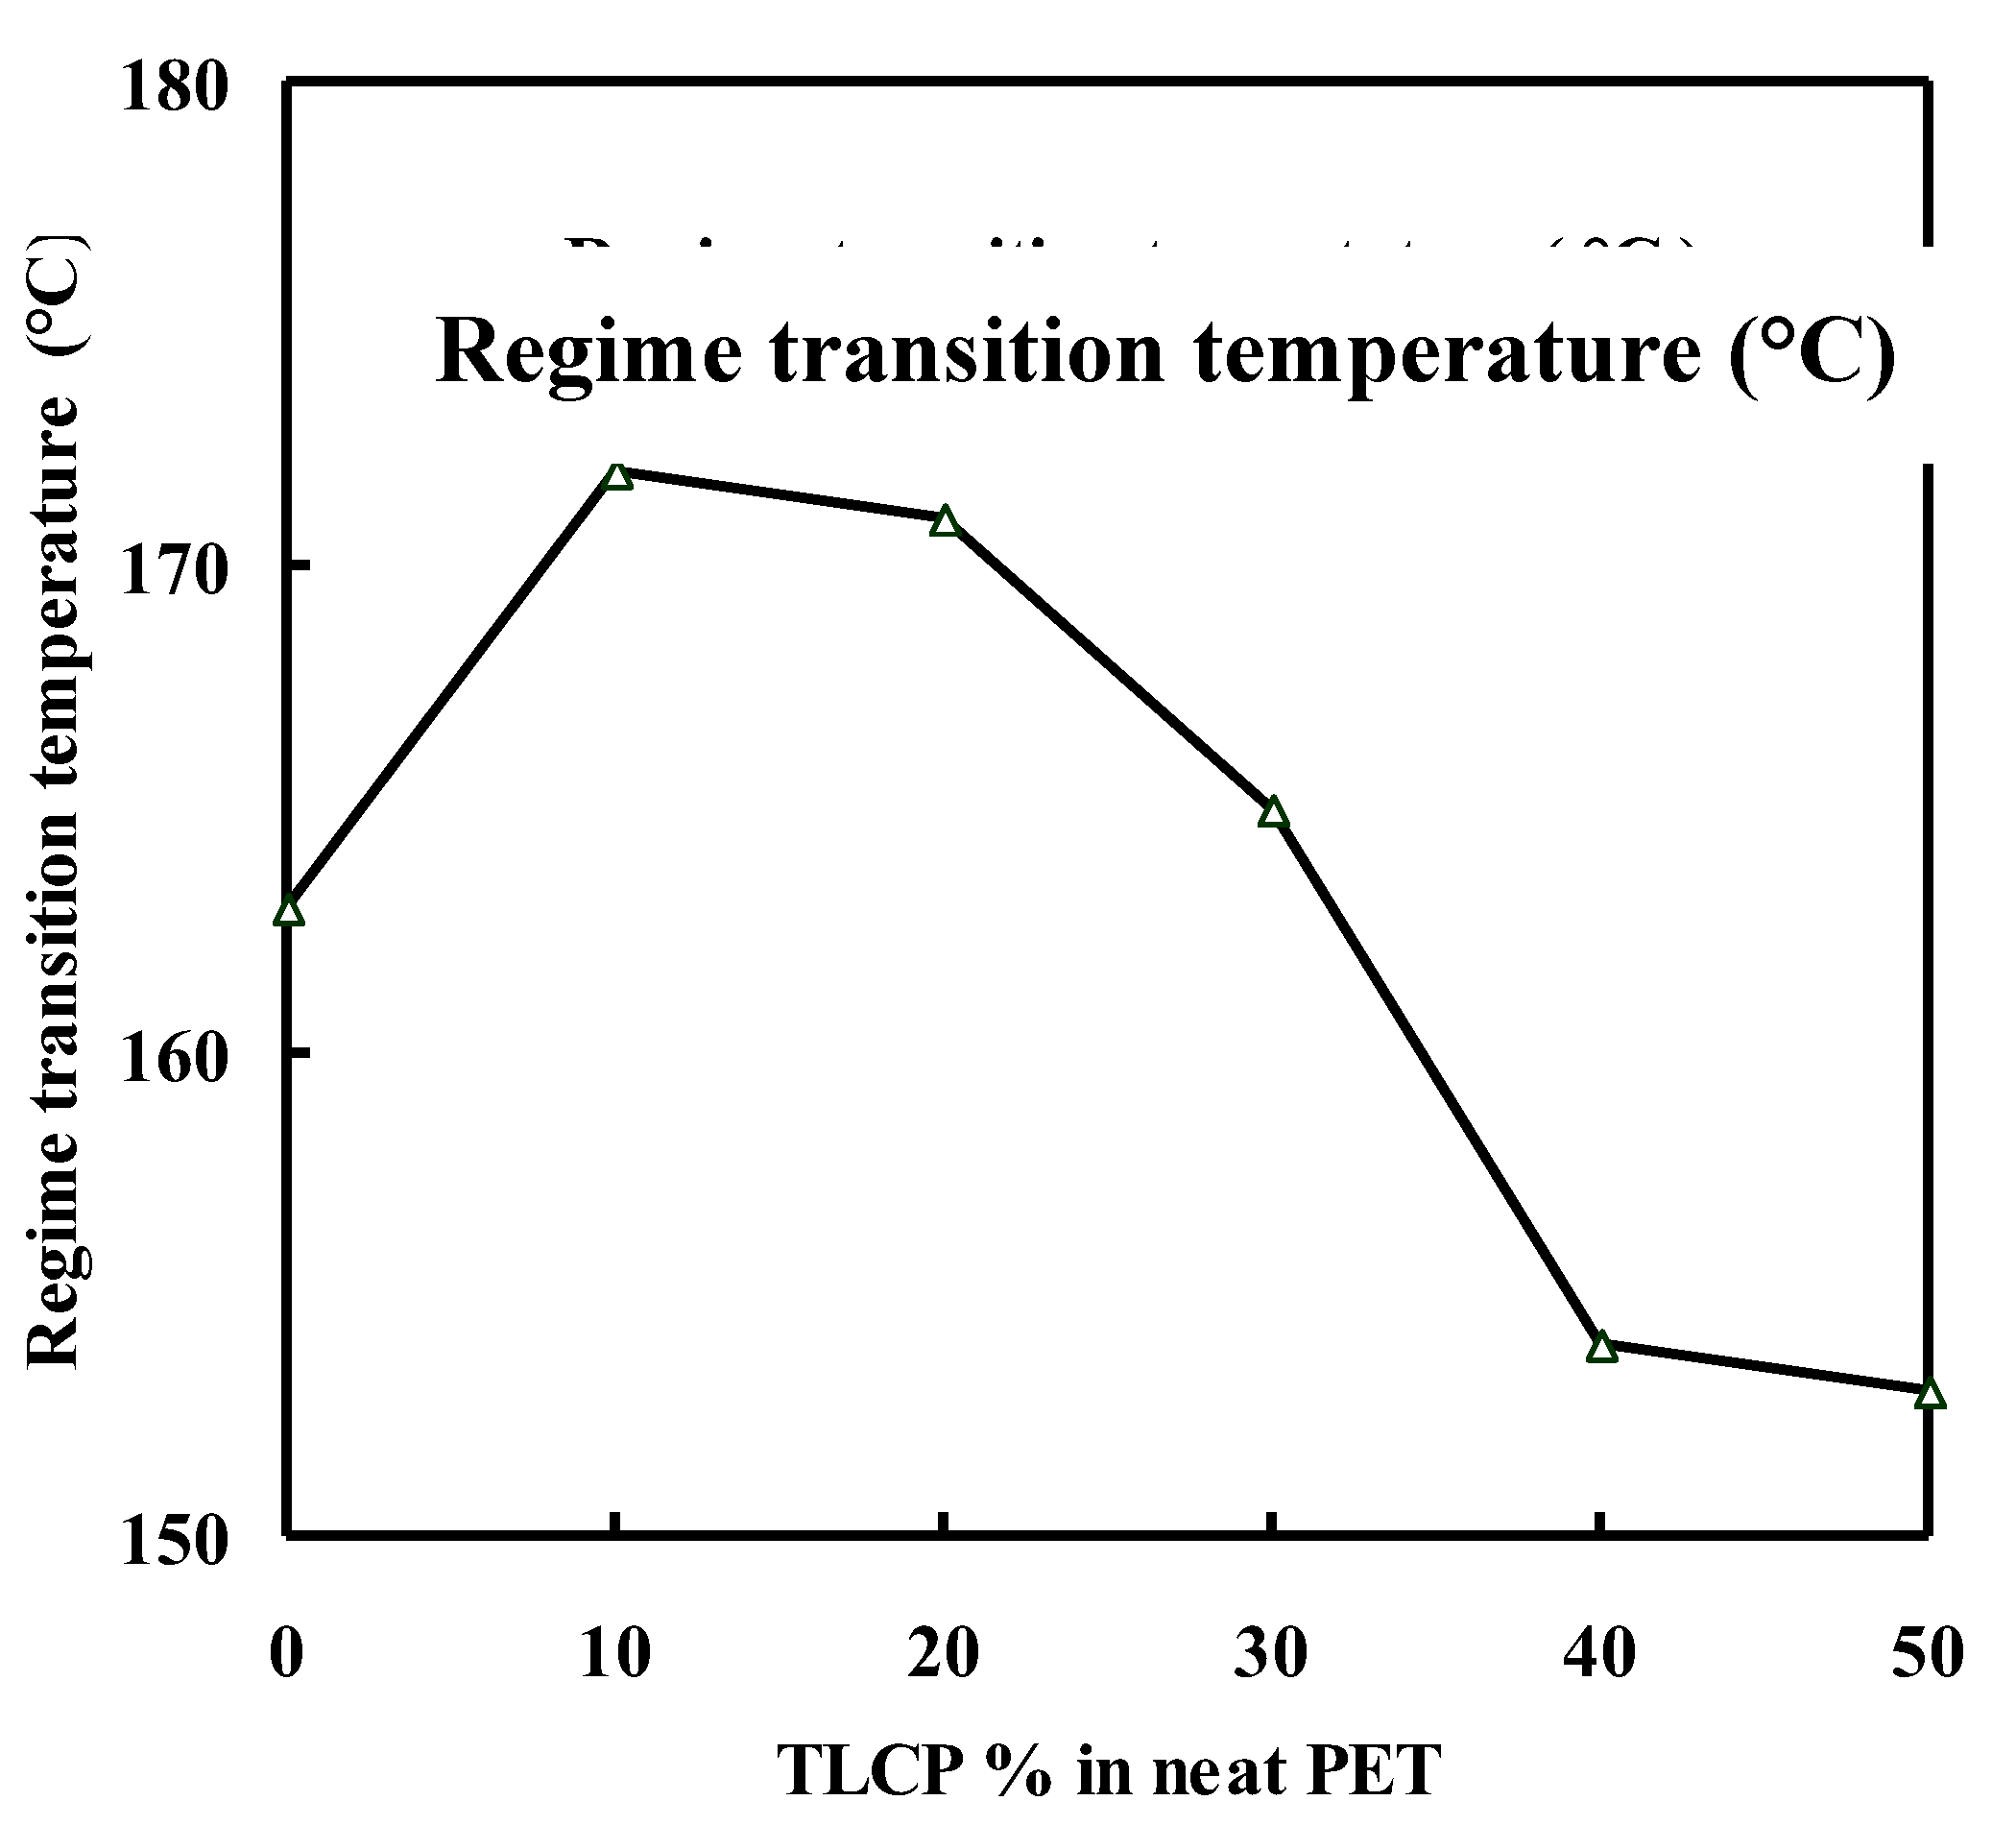
Table 1.
Injection molding parameters of PET/TLCP composites.
| PET/TLCP wt/wt % | 100/00 | 90/10 | 80/20 | 70/30 | 60/40 | 50/50 |
| Nozzle Temperature (°C) | 290 | 285 | 285 | 270 | 270 | 270 |
| Barrel Temperature (°C) | 285 | 275 | 275 | 265 | 265 | 265 |
| Barrel Temperature (°C) | 275 | 275 | 275 | 255 | 255 | 255 |
| Barrel Temperature (°C) | 230 | 230 | 230 | 225 | 225 | 225 |
| Pressure (MPa) | 100 | 100 | 100 | 70 | 70 | 70 |
| Speed (mm/sec) | 91 | 91 | 91 | 91 | 91 | 91 |
| Plasticization (%) | 80 | 80 | 80 | 80 | 80 | 80 |
| Stroke (mm) | 30 | 30 | 30 | 30 | 30 | 30 |
Table 2.
Nonisothermal crystallization data of PET/TLCP composites.
| PET/ TLCP |
Rate of cooling | Onset of cooling temp. | Crystallization Peak temp. | Heat of crystallization |
| (°C/min) | (Tonset)°C | Tc(°C) | ΔHc(J/g) | |
| 100/00 | 10 | 197.76 | 189.73 | -41.721 |
| 20 | 190.36 | 179.07 | -39.295 | |
| 30 | 184.54 | 171.48 | -37.235 | |
| 40 | 181.03 | 165.20 | -35.495 | |
| 50 | 177.63 | 160.68 | -32.644 | |
| 60 | 176.74 | 158.86 | -32.713 | |
| 90/10 | 10 | 201.53 | 193.53 | -37.954 |
| 20 | 191.61 | 180.60 | -37.838 | |
| 30 | 185.56 | 171.98 | -36.532 | |
| 40 | 182.38 | 166.54 | -34.483 | |
| 50 | 177.75 | 159.00 | -33.667 | |
| 60 | 176.72 | 155.86 | -32.839 | |
| 80/20 | 10 | 196.81 | 186.90 | -27.632 |
| 20 | 186.76 | 175.00 | -29.165 | |
| 30 | 182.64 | 167.08 | -29.397 | |
| 40 | 181.20 | 161.87 | -29.318 | |
| 50 | 175.26 | 149.01 | -22.116 | |
| 60 | 175.63 | 144.86 | -27.545 | |
| 70/30 | 10 | 197.70 | 188.57 | -25.875 |
| 20 | 186.94 | 176.27 | -24.404 | |
| 30 | 182.47 | 167.58 | -25.124 | |
| 40 | 179.38 | 161.87 | -22.938 | |
| 50 | 176.71 | 154.01 | -23.331 | |
| 60 | 175.11 | 142.86 | -23.900 | |
| 60/40 | 10 | 195.91 | 188.67 | -18.464 |
| 20 | 186.50 | 175.00 | -18.596 | |
| 30 | 181.52 | 167.08 | -18.394 | |
| 40 | 179.28 | 160.54 | -18.710 | |
| 50 | 175.82 | 146.51 | -19.156 | |
| 60 | 175.15 | 140.86 | -20.529 | |
| 50/50 | 10 | 185.28 | 182.97 | -17.176 |
| 20 | 184.34 | 171.47 | -17.904 | |
| 30 | 179.65 | 162.28 | -17.202 | |
| 40 | 174.74 | 149.87 | -14.357 | |
| 50 | 166.93 | 143.17 | -16.478 | |
| 60 | 159.86 | 138.86 | -14.375 |
Table 4.
Kinetic parameters based on LH analysis for PET/TLCP composites.
| PET/ TLCP |
Rate of cooling (°C/min) |
Tc (°C) |
× 105 |
|
| 100/00 | 10 | 190 | 0.9548 | 2.88 |
| 20 | 179 | 1.4727 | 2.64 | |
| 30 | 171 | 2.1726 | 2.51 | |
| 40 | 165 | 2.6675 | 2.41 | |
| 50 | 161 | 3.2083 | 2.35 | |
| 60 | 159 | 3.5164 | 2.33 | |
| 90/10 | 10 | 194 | 0.9548 | 2.60 |
| 20 | 181 | 1.4727 | 2.38 | |
| 30 | 172 | 2.1726 | 2.26 | |
| 40 | 167 | 2.6675 | 2.20 | |
| 50 | 159 | 3.2083 | 2.12 | |
| 60 | 156 | 3.5164 | 2.09 | |
| 80/20 | 10 | 187 | 0.8650 | 2.38 |
| 20 | 175 | 1.6793 | 2.22 | |
| 30 | 167 | 2.2378 | 2.13 | |
| 40 | 162 | 2.8453 | 2.08 | |
| 50 | 149 | 3.8285 | 1.98 | |
| 60 | 145 | 4.2764 | 1.95 | |
| 70/30 | 10 | 189 | 0.9498 | 2.44 |
| 20 | 176 | 1.9521 | 2.26 | |
| 30 | 168 | 2.3711 | 2.16 | |
| 40 | 162 | 2.8815 | 2.11 | |
| 50 | 154 | 3.5830 | 2.04 | |
| 60 | 143 | 4.5248 | 1.96 | |
| 60/40 | 10 | 189 | 0.9033 | 2.74 |
| 20 | 175 | 2.1291 | 2.48 | |
| 30 | 167 | 2.5618 | 2.36 | |
| 40 | 161 | 3.2341 | 2.28 | |
| 50 | 147 | 4.1428 | 2.14 | |
| 60 | 141 | 4.6789 | 2.09 | |
| 50/50 | 10 | 183 | 1.4088 | 2.96 |
| 20 | 171 | 2.4792 | 2.70 | |
| 30 | 162 | 3.2134 | 2.53 | |
| 40 | 150 | 4.1100 | 2.36 | |
| 50 | 143 | 4.9273 | 2.28 | |
| 60 | 139 | 5.4913 | 2.24 |
Table 5.
The regime parameters (for regime II and regime III) of nonisothermal crystallization kinetics of PET/TLCP composites based on the Hoffman- Lauritzen theory.
Table 5.
The regime parameters (for regime II and regime III) of nonisothermal crystallization kinetics of PET/TLCP composites based on the Hoffman- Lauritzen theory.
| PET/ TLCP |
(C) | Regime transition temp. (°C) |
Nucleation constant Kg x 105 (K2) |
Kg(III) / Kg (II) |
Fold surface free energy (ergs/cm2) |
Work of chain folding q (kcal/mol) |
|||
| II | III | II | III | II | III | ||||
| 100/00 | 271 | 163 | 5.2 | 13.5 | 2.6 | 208.2 | 272.3 | 15.1 | 19.8 |
| 90/10 | 284 | 172 | 3.6 | 7.8 | 2.2 | 141.3 | 154.7 | 10.3 | 11.2 |
| 80/20 | 289 | 171 | 5.1 | 9.8 | 1.9 | 198.4 | 191.1 | 14.4 | 13.9 |
| 70/30 | 287 | 165 | 4.7 | 10.4 | 2.2 | 200.2 | 204.9 | 14.5 | 14.9 |
| 60/40 | 275 | 154 | 4.4 | 11.6 | 2.6 | 177.2 | 233.4 | 12.9 | 17.0 |
| 50/50 | 264 | 153 | 4.5 | 11.6 | 2.6 | 183.7 | 238.5 | 13.3 | 17.3 |
Disclaimer/Publisher’s Note: The statements, opinions and data contained in all publications are solely those of the individual author(s) and contributor(s) and not of MDPI and/or the editor(s). MDPI and/or the editor(s) disclaim responsibility for any injury to people or property resulting from any ideas, methods, instructions or products referred to in the content. |
© 2026 by the authors. Licensee MDPI, Basel, Switzerland. This article is an open access article distributed under the terms and conditions of the Creative Commons Attribution (CC BY) license (http://creativecommons.org/licenses/by/4.0/).
Copyright: This open access article is published under a Creative Commons CC BY 4.0 license, which permit the free download, distribution, and reuse, provided that the author and preprint are cited in any reuse.


