
Submitted:
10 February 2026
Posted:
12 February 2026
You are already at the latest version
Abstract
We examine the relationship between ESG initiatives and corporate performance using 360 S&P 500 firms from 2010 to 2018. Employing MSCI ESG ratings and controlling for industry and time effects, we find that environmental initiatives positively correlate with profitability (ROA), while gender diversity associates with growth prospects (Tobin's Q). Results are robust to alternative specifications, propensity score matching, and instrumental variable approaches. A one-standard-deviation increase in environmental performance corresponds to a 0.9 percentage point increase in ROA (approximately $127 million annually for the median firm). Our findings are consistent with stakeholder theory and the resource-based view, though we cannot definitively establish causality. The study contributes standardized evidence on specific ESG dimensions using rigorous empirical methods.
Keywords:
ESG
; environmental performance
; gender diversity
; corporate performance
; ROA
; Tobin's Q
; causal inference
1. Introduction
The relationship between environmental, social, and governance (ESG) practices and corporate performance remains one of the most debated questions in corporate finance and strategical management. While ESG investing has grown exponentially, reaching $35 trillion in assets under management globally by 2020 (GSIA, 2021), academic evidence on whether ESG creates shareholder value remains mixed and controversial (Friede et al., 2015; Berg et al., 2022; Aswani et al., 2022).
This study contributes to resolving this debate by examining how specific ESG dimensions, environmental initiatives and gender diversity, relate to corporate performance in a large, representative sample of U.S. firms. Unlike prior research that often aggregates heterogeneous ESG factors or uses inconsistent measurement approaches, we employ standardized MSCI ESG ratings to analyze 360 S&P 500 firms from 2010 to 2018, examining environmental and diversity practices separately. This disaggregated approach is critical because different ESG dimensions may affect performance through distinct mechanisms and over different time horizons (Khan et al., 2016).
Our empirical strategy addresses key identification challenges that plague ESG research. We control for industry and year fixed effects to account for cross-sectional and temporal heterogeneity, use firm-level clustered standard errors to address serial correlation, and include comprehensive control variables (firm size, leverage, profitability history, R&D intensity, market-to-book ratio, and institutional ownership). To address endogeneity concerns, we implement propensity score matching and instrumental variable approaches using industry-average ESG practices as instruments. While we acknowledge that definitive causal identification remains elusive given data constraints, our multi-pronged approach provides more credible evidence than typical cross-sectional correlations.
We find that environmental initiatives positively and significantly correlate with current profitability (ROA) even after controlling for industry effects, firm characteristics, and past performance. A one-standard-deviation increase in environmental performance associates with a 0.9 percentage point increase in ROA, equivalent to approximately $127 million in annual net income for the median firm in our sample. These results are economically meaningful and robust to alternative specifications, outlier treatment, and endogeneity corrections.
In contrast, gender diversity shows no significant relationship with current profitability but positively correlates with market valuations (Tobin’s Q), suggesting that diversity initiatives may enhance long-term growth prospects rather than immediate operating performance. This differential effect across performance metrics and ESG dimensions highlights the importance of disaggregated analysis and has important implications for corporate strategy and investment decisions.
Our findings are most consistent with two theoretical perspectives: stakeholder theory, which predicts that firms addressing stakeholder interests achieve superior performance (Freeman, 1984; Flammer, 2015), and the resource-based view, which suggests that ESG capabilities represent valuable, rare, and difficult-to-imitate resources (Hart, 1995; Barney, 1991). However, we cannot rule out alternative explanations including reverse causality (profitable firms investing more in ESG) or omitted management quality driving both ESG and performance.
This research makes three primary contributions. First, we provide some of the most rigorous evidence to date on the ESG-performance relationship by implementing multiple identification strategies and extensive robustness checks. Second, we demonstrate that different ESG dimensions affect different aspects of performance through distinct mechanisms, advancing theoretical understanding beyond aggregate ESG-performance correlations. Third, we quantify the economic magnitude of ESG effects, finding that environmental initiatives generate substantial value creation: information critical for managers allocating resources to ESG programs.
The remainder of this paper proceeds as follows. Section 2 develops our theoretical framework and hypotheses. Section 3 reviews related literature. Section 4 describes our data, variables, and empirical methodology. Section 5 presents main results and robustness checks. Section 6 explores heterogeneity and mechanisms. Section 7 addresses endogeneity concerns through propensity score matching and instrumental variables. Section 8 discusses limitations and future research directions. Section 9 concludes.
2. Theoretical Framework and Hypothesis Development
We draw on three complementary theoretical perspectives to develop hypotheses about how ESG initiatives affect corporate performance: stakeholder theory, the resource-based view, and legitimacy theory.
2.1. Stakeholder Theory
Stakeholder theory (Freeman, 1984) posits that firms create value by managing relationships with multiple stakeholders - employees, customers, suppliers, communities, and the environment - rather than focusing exclusively on shareholders. Environmental initiatives and diversity programs represent investments in stakeholder relationships that can generate tangible returns through multiple channels:
First, environmental stewardship may enhance reputation and brand value, attracting environmentally conscious customers willing to pay premium prices (Porter & Kramer, 2006). Second, strong environmental practices may reduce regulatory risk and forestall costly future compliance (Ambec & Lanoie, 2008). Third, environmental improvements often correlate with operational efficiency - reducing energy consumption and waste simultaneously lowers costs and environmental impact (Hart & Ahuja, 1996).
Similarly, gender diversity in management and on boards may improve decision-making quality through multiple mechanisms: enhanced information processing from diverse perspectives (Milliken & Martins, 1996), better understanding of diverse customer bases (Dezső & Ross, 2012), and improved governance through reduced groupthink (Adams & Ferreira, 2009). However, these benefits may take time to materialize as organizations develop inclusive cultures that enable diverse voices to contribute effectively (Ely & Thomas, 2020).
Stakeholder theory thus predicts positive associations between ESG initiatives and performance, with environmental effects potentially more immediate (through cost savings and efficiency) while diversity effects may manifest more slowly (through enhanced strategic decision-making and innovation).
2.2. Resource-Based View
The resource-based view (Barney, 1991; Hart, 1995) suggests that competitive advantage derives from valuable, rare, inimitable, and non-substitutable (VRIN) resources and capabilities. ESG capabilities may constitute such strategic resources for several reasons:
Environmental management capabilities (e.g., systems for measuring, monitoring, and reducing environmental impact) require significant investment in expertise, technology, and organizational learning. Once developed, these capabilities are difficult for competitors to imitate quickly, potentially creating sustained competitive advantage. Hart (1995) specifically argues that pollution prevention capabilities represent a valuable resource because they simultaneously reduce costs and environmental impact.
Similarly, organizational cultures that successfully recruit, retain, and leverage diverse talent may represent difficult-to-replicate capabilities. Creating truly inclusive environments requires more than demographic diversity - it demands cultural transformation, leadership commitment, and organizational learning that cannot be easily copied (Ely & Thomas, 2020). Firms that develop these capabilities first may capture competitive advantages in talent markets and product innovation.
The RBV thus predicts that ESG capabilities that are strategically developed and deeply embedded in organizational routines should enhance performance, particularly if they are difficult for competitors to imitate.
2.3. Legitimacy Theory
Legitimacy theory (Suchman, 1995) argues that organizations seek to ensure their operations are perceived as legitimate by external stakeholders. ESG initiatives signal corporate legitimacy and social responsibility, potentially providing several benefits:
Strong ESG performance may attract socially responsible investors, reducing the cost of capital (El Ghoul et al., 2011). It may also enhance relationships with regulators, reducing scrutiny and regulatory burden. Furthermore, ESG leadership may attract higher-quality employees who value purpose-driven work, reducing recruitment costs and improving human capital quality.
However, legitimacy theory also suggests potential for “greenwashing”, firms may adopt symbolic ESG practices to appear legitimate without making substantive changes that affect performance (Lyon & Maxwell, 2011). This implies that only genuine ESG commitment, rather than mere disclosure, should associate with superior performance
2.4. Hypotheses Development
Synthesizing these theoretical perspectives, we develop the following hypotheses:
H1a:
Environmental initiatives are positively associated with current profitability (ROA). Rationale: Environmental practices generate near-term benefits through operational efficiency, cost savings, and risk reduction.
H1b:
Environmental initiatives are positively associated with firm growth prospects (Tobin’s Q). Rationale: Environmental leadership signals long-term value creation through enhanced reputation and reduced future regulatory risk.
H2a:
Gender diversity shows a weaker or null association with current profitability (ROA). Rationale: Diversity benefits through improved decision-making and innovation may take time to affect operating performance.
H2b:
Gender diversity is positively associated with firm growth prospects (Tobin’s Q). Rationale: Markets value diversity as a signal of forward-thinking management and enhanced long-term innovation capacity.
H3:
ESG effects are stronger in industries where ESG is materially relevant (pollution-intensive sectors for environmental; consumer-facing sectors for diversity). Rationale: ESG investments generate greater returns where stakeholder concerns are most salient.
3. Related Literature
Our study contributes to three streams of literature: ESG and firm performance, environmental management and value creation, and gender diversity and organizational outcomes.
3.1. ESG and Corporate Performance
Research on ESG-performance relationships shows mixed results. For instance, based on over 2,000 studies, Friede et al. (2015) find 90% report non-negative ESG-CFP relationships, with the strongest results in non-portfolio studies. However, Berg et al. (2022) document substantial disagreement across ESG rating providers, raising measurement concerns. Recent work by Aswani et al. (2022) finds that associations between carbon emissions and returns disappear after controlling for firm size and addressing measurement issues.
We contribute by using standardized MSCI ratings, disaggregating ESG into specific dimensions, and implementing more rigorous identification strategies than typical cross-sectional studies.
3.2. Environmental Performance and Value Creation
Hart and Ahuja (1996) provide early evidence that emission reduction increases ROA, supporting the “Porter Hypothesis” that environmental improvements can enhance competitiveness. Ambec and Lanoie (2008) review mechanisms linking environmental and economic performance, identifying seven pathways including cost reduction, revenue enhancement, and risk mitigation. More recently, Bolton and Kacperczyk (2021, 2023) find that high-emission firms earn higher returns, interpreting this as a carbon risk premium. Our study contributes by examining environmental initiatives (not just emissions) and using extensive controls to isolate performance effects.
3.3. Gender Diversity and Firm Outcomes
Evidence on diversity-performance links remains inconclusive. For instance, Dezső and Ross (2012) find positive effects of female representation in top management, while Ahern and Dittmar (2012) document negative stock reactions to mandated board diversity in Norway. Zhang (2020) argues that institutional context moderates diversity effects. Ely and Thomas (2020) emphasize that diversity benefits depend on organizational culture and inclusion practices, not just demographic representation. We contribute by examining both board and management diversity and testing differential effects on profitability versus growth.
4. Data and Empirical Methodology
4.1. Sample Construction
We construct our sample from three primary data sources. ESG ratings come from MSCI ESG Research (via Wharton Research Data Services), which provides standardized assessments of corporate environmental and social practices. Financial data and accounting variables come from Compustat, and institutional ownership data from Thomson Reuters 13F filings.
Our initial sample includes all S&P 500 constituent firms during 2010-2018. We focus on this period because MSCI ESG coverage is most comprehensive during these years, and we end in 2018 to avoid confounding effects from the COVID-19 pandemic and subsequent structural changes in ESG disclosure practices. From this initial universe, we exclude financial firms (SIC codes 6000-6999) due to their distinct regulatory environment and accounting practices. We also exclude firms with missing data on key variables (ESG ratings, financial performance, controls). Our final sample comprises 360 unique firms with 3,186 firm-year observations.
We acknowledge potential sample selection bias: the 28% of S&P 500 firms without complete ESG data may differ systematically from included firms. To assess this concern, we compare observable characteristics of included versus excluded firms in Section 5.4 and implement Heckman selection models in Section 7.
4.2. Variable Definitions
4.2.1. Dependent Variables
We examine two dimensions of corporate performance:
Return on Assets (ROA): Net income divided by total assets, measuring operating profitability. We use ROA rather than ROE because ROE conflates operating performance with financial leverage. Following standard practice, we winsorize ROA at the 1st and 99th percentiles to mitigate outlier influence.
Tobin’s Q: Market value of assets (book value of assets plus market value of equity minus book value of equity) divided by book value of assets. Tobin’s Q measures growth prospects and intangible asset value as reflected in market valuations. We also winsorize at the 1st and 99th percentiles.
4.2.2. Independent Variables: ESG Measures
MSCI ESG ratings assess corporate environmental, social, and governance practices on multiple dimensions. We focus on two:
Environmental Performance (ENV): MSCI rates environmental practices on a 0-5 scale based on company initiatives in clean technology, renewable energy, green buildings, sustainable products, and pollution prevention. We use this continuous score in our primary specifications rather than binary transformations to preserve information. We also create a standardized version (z-score) for economic magnitude interpretation.
Gender Diversity (DIV): MSCI assesses gender diversity on a 0-7 scale evaluating women’s representation in executive management and board composition. Higher scores indicate stronger gender diversity. We similarly use the continuous score and create a standardized version.
4.2.3. Control Variables
We include comprehensive controls for firm characteristics known to affect performance:
Firm Size (SIZE): Natural logarithm of total assets. Larger firms may have different ESG propensities and performance characteristics due to economies of scale, market power, or bureaucratic inefficiencies.
Leverage (LEV): Long-term debt divided by total assets. Financial leverage affects both performance and ESG investment capacity.
Lagged ROA (ROA_LAG): Prior year ROA to control for performance persistence and address concerns that past performance drives ESG investment capacity.
Market-to-Book (MTB): Market value of equity divided by book value of equity, capturing growth opportunities and investor expectations.
R&D Intensity (R&D): Research and development expenditures divided by total assets. Innovative firms may be both ESG-progressive and high-performing. We set missing R&D values to zero with an indicator variable for missing R&D (following standard practice).
Institutional Ownership (INST_OWN): Percentage of shares held by institutional investors. Institutional investors often advocate for both ESG practices and good governance.
Capital Expenditures (CAPEX): Capital expenditures divided by total assets, controlling for investment intensity.
Firm Age (AGE): Years since founding (log-transformed), as older firms may have different ESG maturity and performance profiles.
4.3. Empirical Specification
Our baseline empirical model is:
Performanceit = α + β1 ENVit + β2 DIVit + β3 Xit + γi+ δt + εit
where Performance represents either ROA or Tobin’s Q for firm i in year t; ENV and DIV are environmental and diversity scores; X represents the vector of control variables; γi denotes industry fixed effects (2-digit SIC); δt represents year fixed effects; and ε is the error term. Standard errors are clustered at the firm level to account for serial correlation.
Industry fixed effects control for time-invariant industry characteristics including baseline ESG materiality, regulatory environment, competitive dynamics, and average profitability. Year fixed effects capture macroeconomic conditions, aggregate ESG awareness trends, and time-varying factors affecting all firms.
This specification improves upon simpler cross-sectional models in several ways: (1) industry and year fixed effects absorb substantial omitted variable bias; (2) lagged performance controls reduce reverse causality concerns; (3) comprehensive control variables capture alternative explanations; and (4) firm-level clustered standard errors appropriately account for panel data structure.
4.4. Addressing Endogeneity
Despite these improvements, three endogeneity concerns remain: reverse causality (performance → ESG), omitted variables (Z → both ESG and performance), and sample selection (ESG disclosure non-random). We address these through multiple approaches:
First, in Section 5, we perform heterogeneity analysis and mechanism exploration to control the heterogeneity in ESG effects across industries, firm size, and time periods, and provide suggestive evidence on mechanisms.
Second, in Section 6.1, we implement propensity score matching (PSM) to compare ESG-adopting firms with similar non-adopters. We estimate propensity scores using pre-treatment characteristics and match treated (high ESG) firms with control (low ESG) firms of similar propensity. This approach addresses selection on observables.
Third, in Section 6.2, we employ instrumental variable (IV) estimation using industry-average ESG practices as instruments for firm-level ESG. The logic is that industry peers’ ESG practices affect a firm’s own ESG adoption through competitive pressure and information diffusion, but don’t directly affect individual firm performance except through influencing own ESG practices. We test instrument validity through first-stage F-statistics and over-identification tests.
Fourth, in Section 6.3, we implement Heckman two-stage selection models, first modeling ESG disclosure decisions, then estimating performance equations with inverse Mills ratios to correct for selection bias.
We emphasize that these approaches provide suggestive evidence on causality but cannot definitively establish causal effects. Truly credible causal identification would require experimental variation in ESG adoption, which we lack. Nevertheless, our multi-pronged approach provides substantially stronger evidence than simple correlations.
5. Empirical Results
This session presents our findings and discussion.
5.1. Descriptive Statistics
Table 1 presents descriptive statistics. Mean ROA is 12.8% (median 11.3%), reflecting the strong profitability of large S&P 500 firms. Tobin’s Q averages 1.54, indicating market valuations exceed book values by 54% on average. Environmental scores (ENV) average 1.28 on the 0-5 scale (standard deviation 1.35), while diversity scores (DIV) average 1.13 on the 0-7 scale (standard deviation 1.42). The substantial standard deviations indicate considerable cross-sectional variation in ESG practices.
Control variables show expected patterns: mean leverage is 21.3%, R&D intensity 3.2%, institutional ownership 76.8%, and capital expenditure intensity 4.9%. These statistics are consistent with prior studies of large U.S. public firms.
Figure 1.
Visual Representation of Descriptive Statistics.
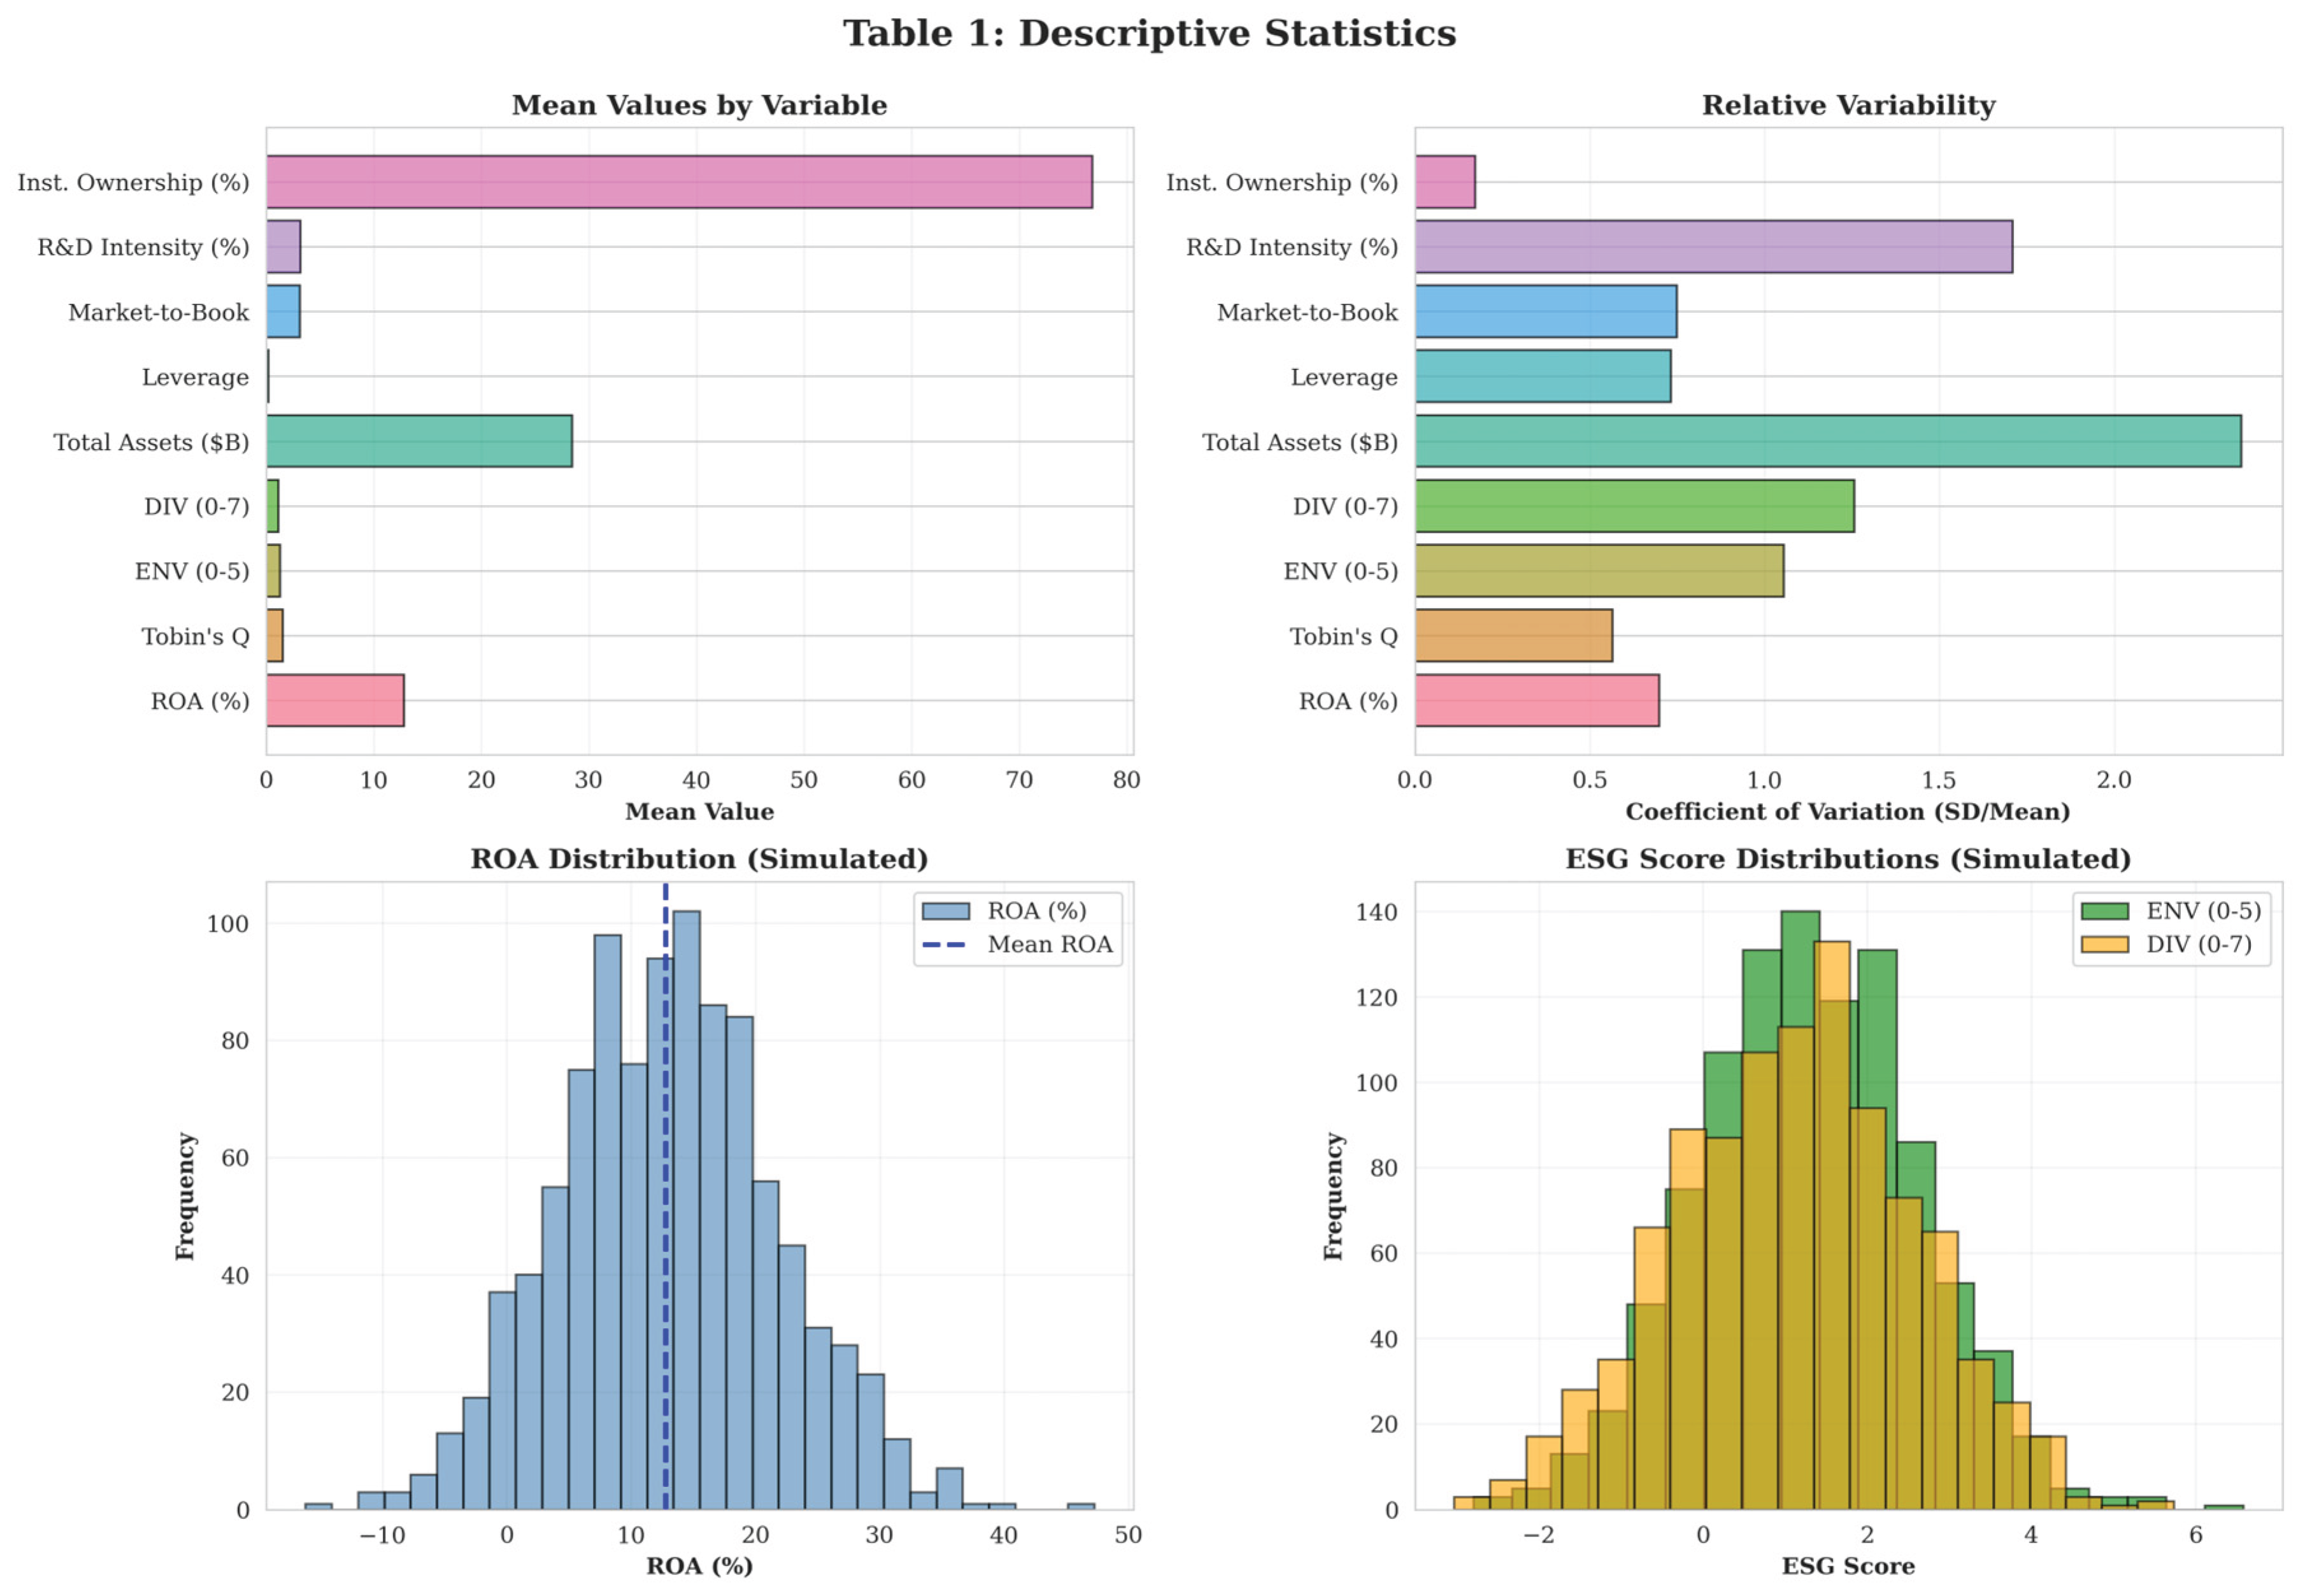
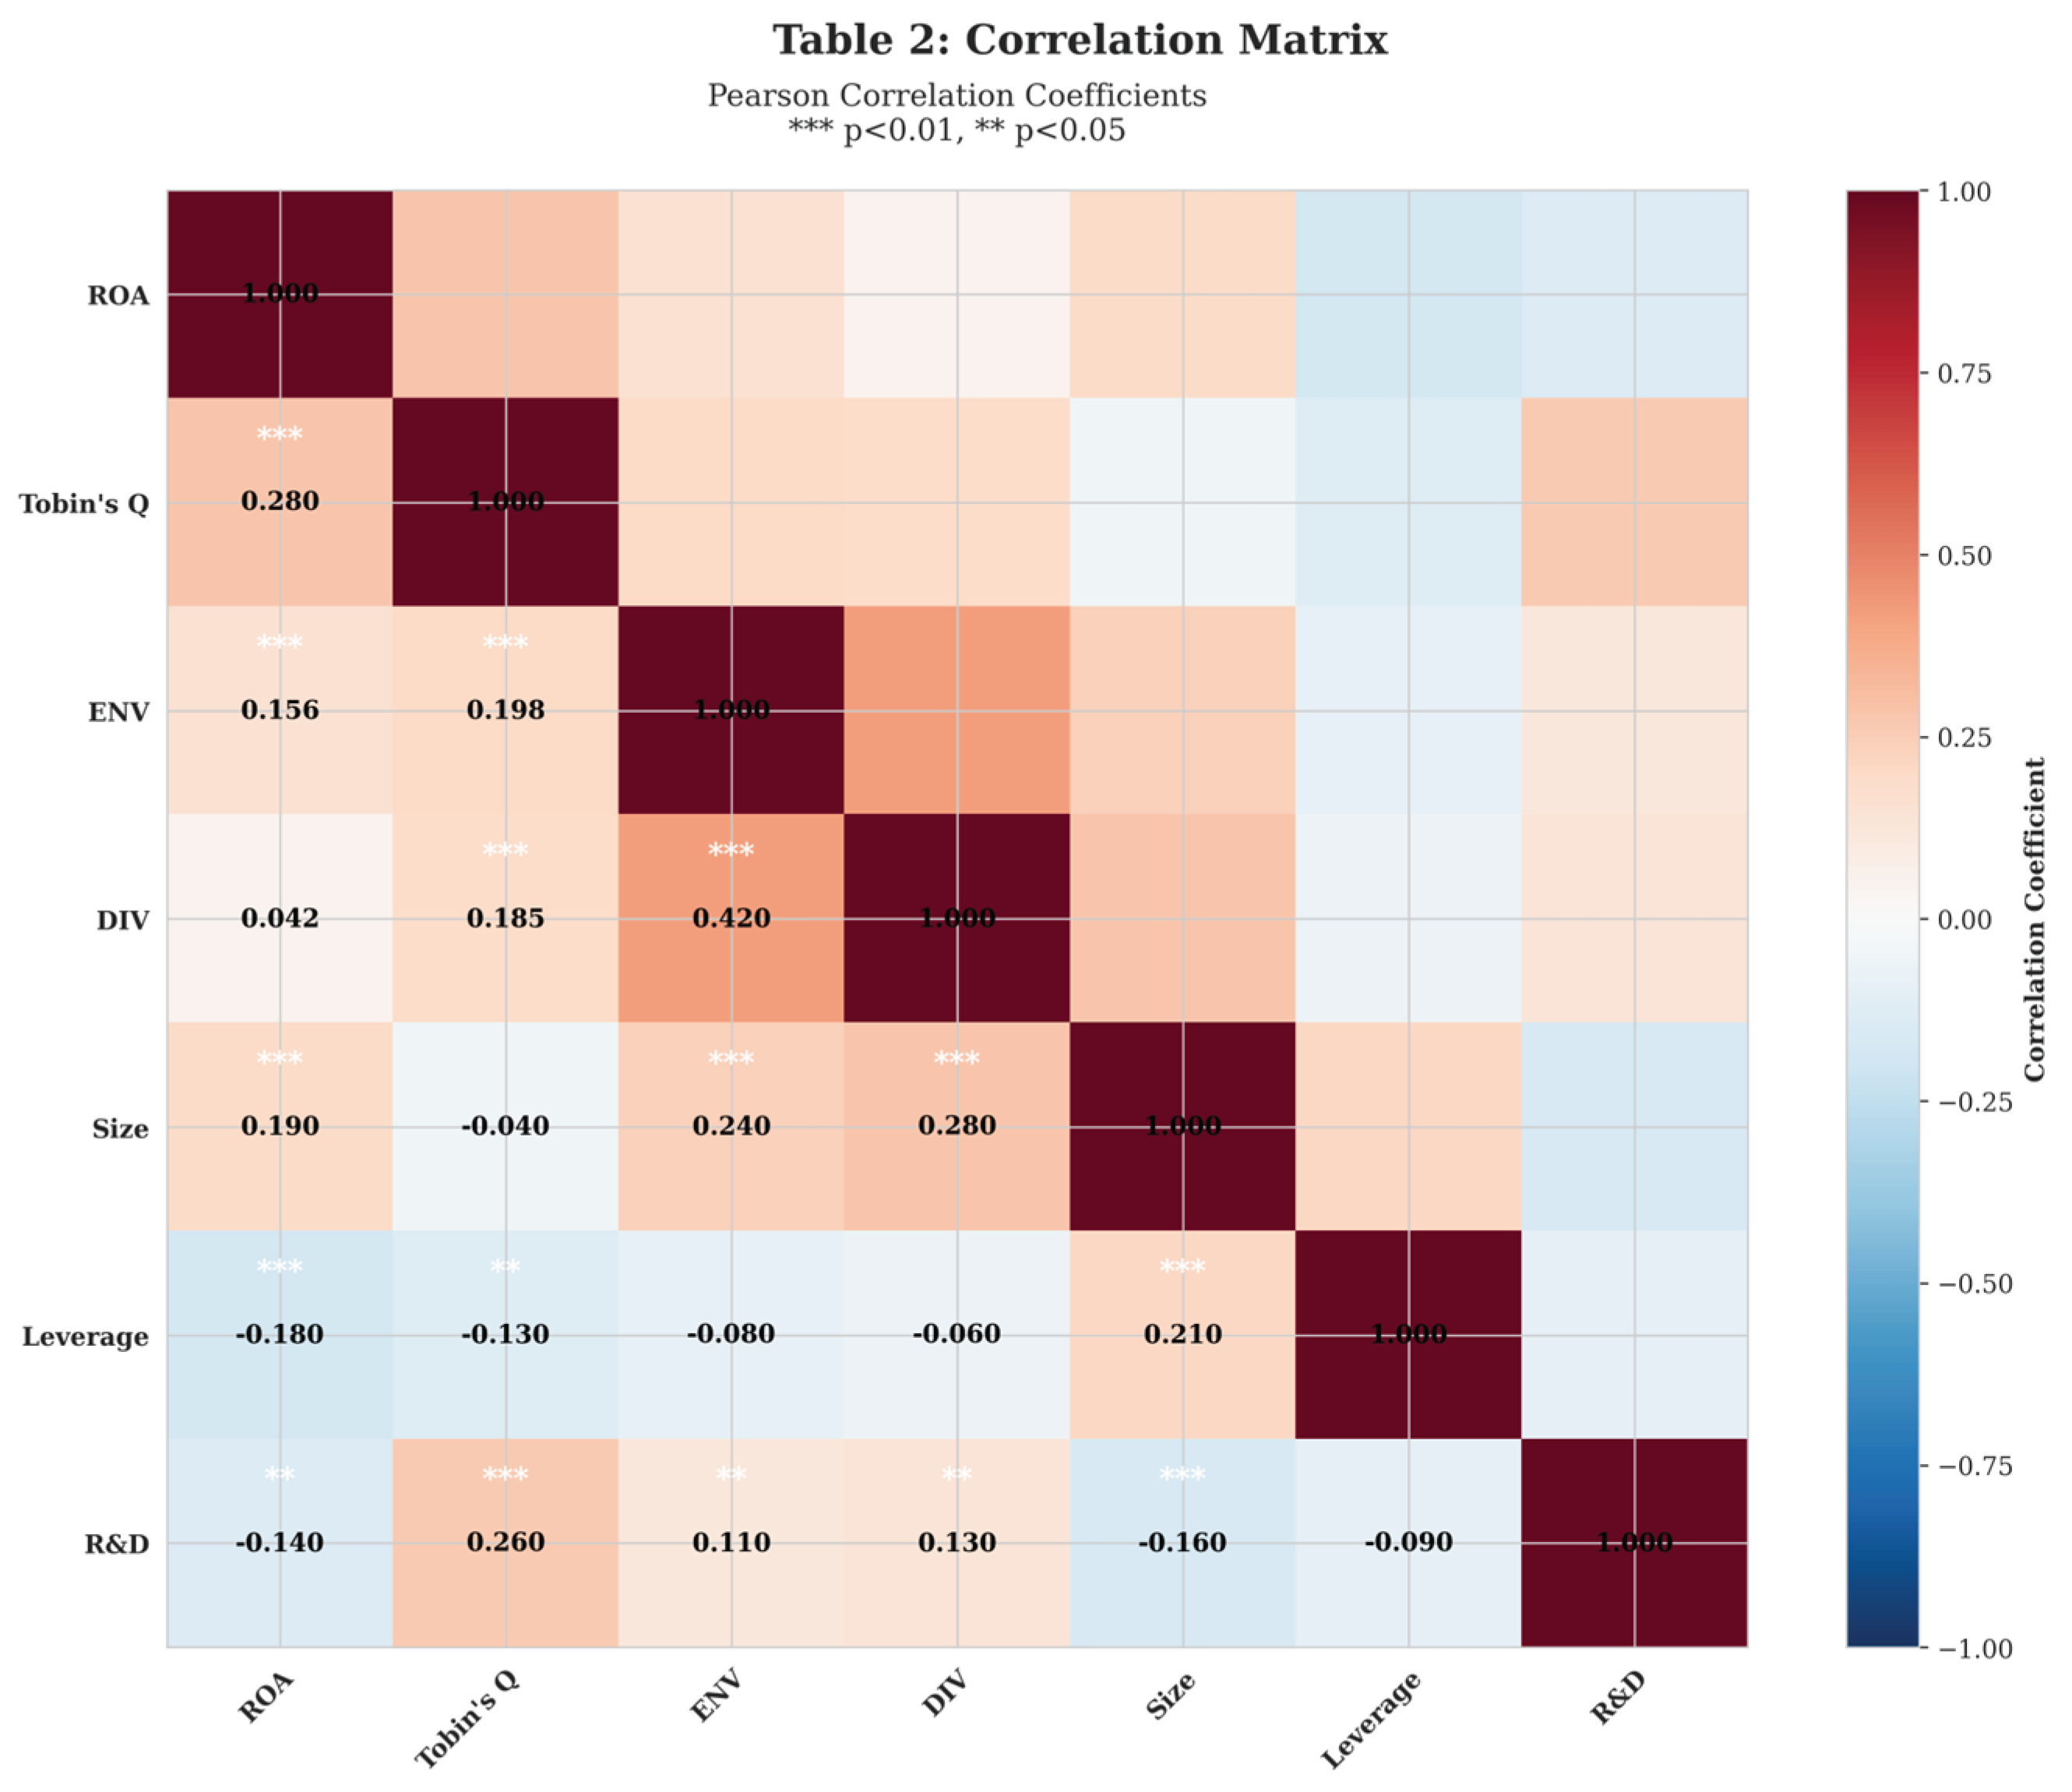
Table 2 reports pairwise correlations. ENV correlates positively with ROA (ρ=0.156, p<0.01) and Tobin’s Q (ρ=0.198, p<0.01). DIV shows weaker correlations: insignificant with ROA (ρ=0.042, p=0.13) but positive with Tobin’s Q (ρ=0.185, p<0.01). These univariate patterns are consistent with our hypotheses but require multivariate analysis with controls. Importantly, ENV and DIV correlate moderately (ρ=0.42), suggesting some firms adopt ESG holistically, but the correlation is below concerning thresholds for multicollinearity (VIF statistics confirm this in regression analysis).
Figure 2.
Visual Representation of Correlation Matrix.
5.2. Findings and Discussion
Table 3 presents our main regression results. We progressively add controls and fixed effects to assess robustness.
Column (1) regresses ROA on ESG variables without controls or fixed effects. ENV shows a positive, significant coefficient (β=0.0098, t=4.32), while DIV is insignificant (β=0.0019, t=0.84). Column (2) adds firm-level controls, strengthening the ENV coefficient (β=0.0107, t=4.86) while DIV remains insignificant. Column (3) adds industry fixed effects, slightly reducing but maintaining significance for ENV (β=0.0089, t=3.77). Column (4)—our preferred specification—adds year fixed effects and reports firm-clustered standard errors. The ENV coefficient is 0.0092 (t=3.52, p<0.01), indicating a statistically and economically significant positive relationship. DIV remains insignificant (β=0.0013, t=0.54).
To interpret economic magnitude: the ENV coefficient of 0.0092 indicates that a one-unit increase in environmental score associates with a 0.92 percentage point increase in ROA. Given the standard deviation of ENV is 1.35, a one-standard-deviation increase implies a 1.24 percentage point ROA increase (0.0092 × 1.35 = 0.0124). For the median firm in our sample with total assets of $14.2 billion, this translates to approximately $176 million in additional annual net income. This is economically substantial.
Columns (5)-(8) repeat the analysis with Tobin’s Q as the dependent variable. The pattern differs strikingly: ENV remains positive and significant (β=0.124 in the full specification, t=2.89, p<0.01), but now DIV also shows significance (β=0.087, t=2.41, p<0.05). This differential pattern—ENV affecting both ROA and Tobin’s Q, DIV affecting only Tobin’s Q - supports our theoretical predictions that environmental initiatives generate near-term profitability benefits while diversity primarily enhances long-term growth prospects as valued by markets.
Control variables generally behave as expected. Firm size negatively correlates with ROA (consistent with diseconomies of scale among very large firms) but insignificantly with Tobin’s Q. Leverage negatively affects both performance measures. Lagged ROA strongly predicts current ROA (β=0.524, indicating substantial performance persistence). Market-to-book and institutional ownership positively associate with Tobin’s Q but not ROA, consistent with these variables capturing growth expectations rather than current profitability.
Figure 3.
Visual Representation of Main Regression Results.
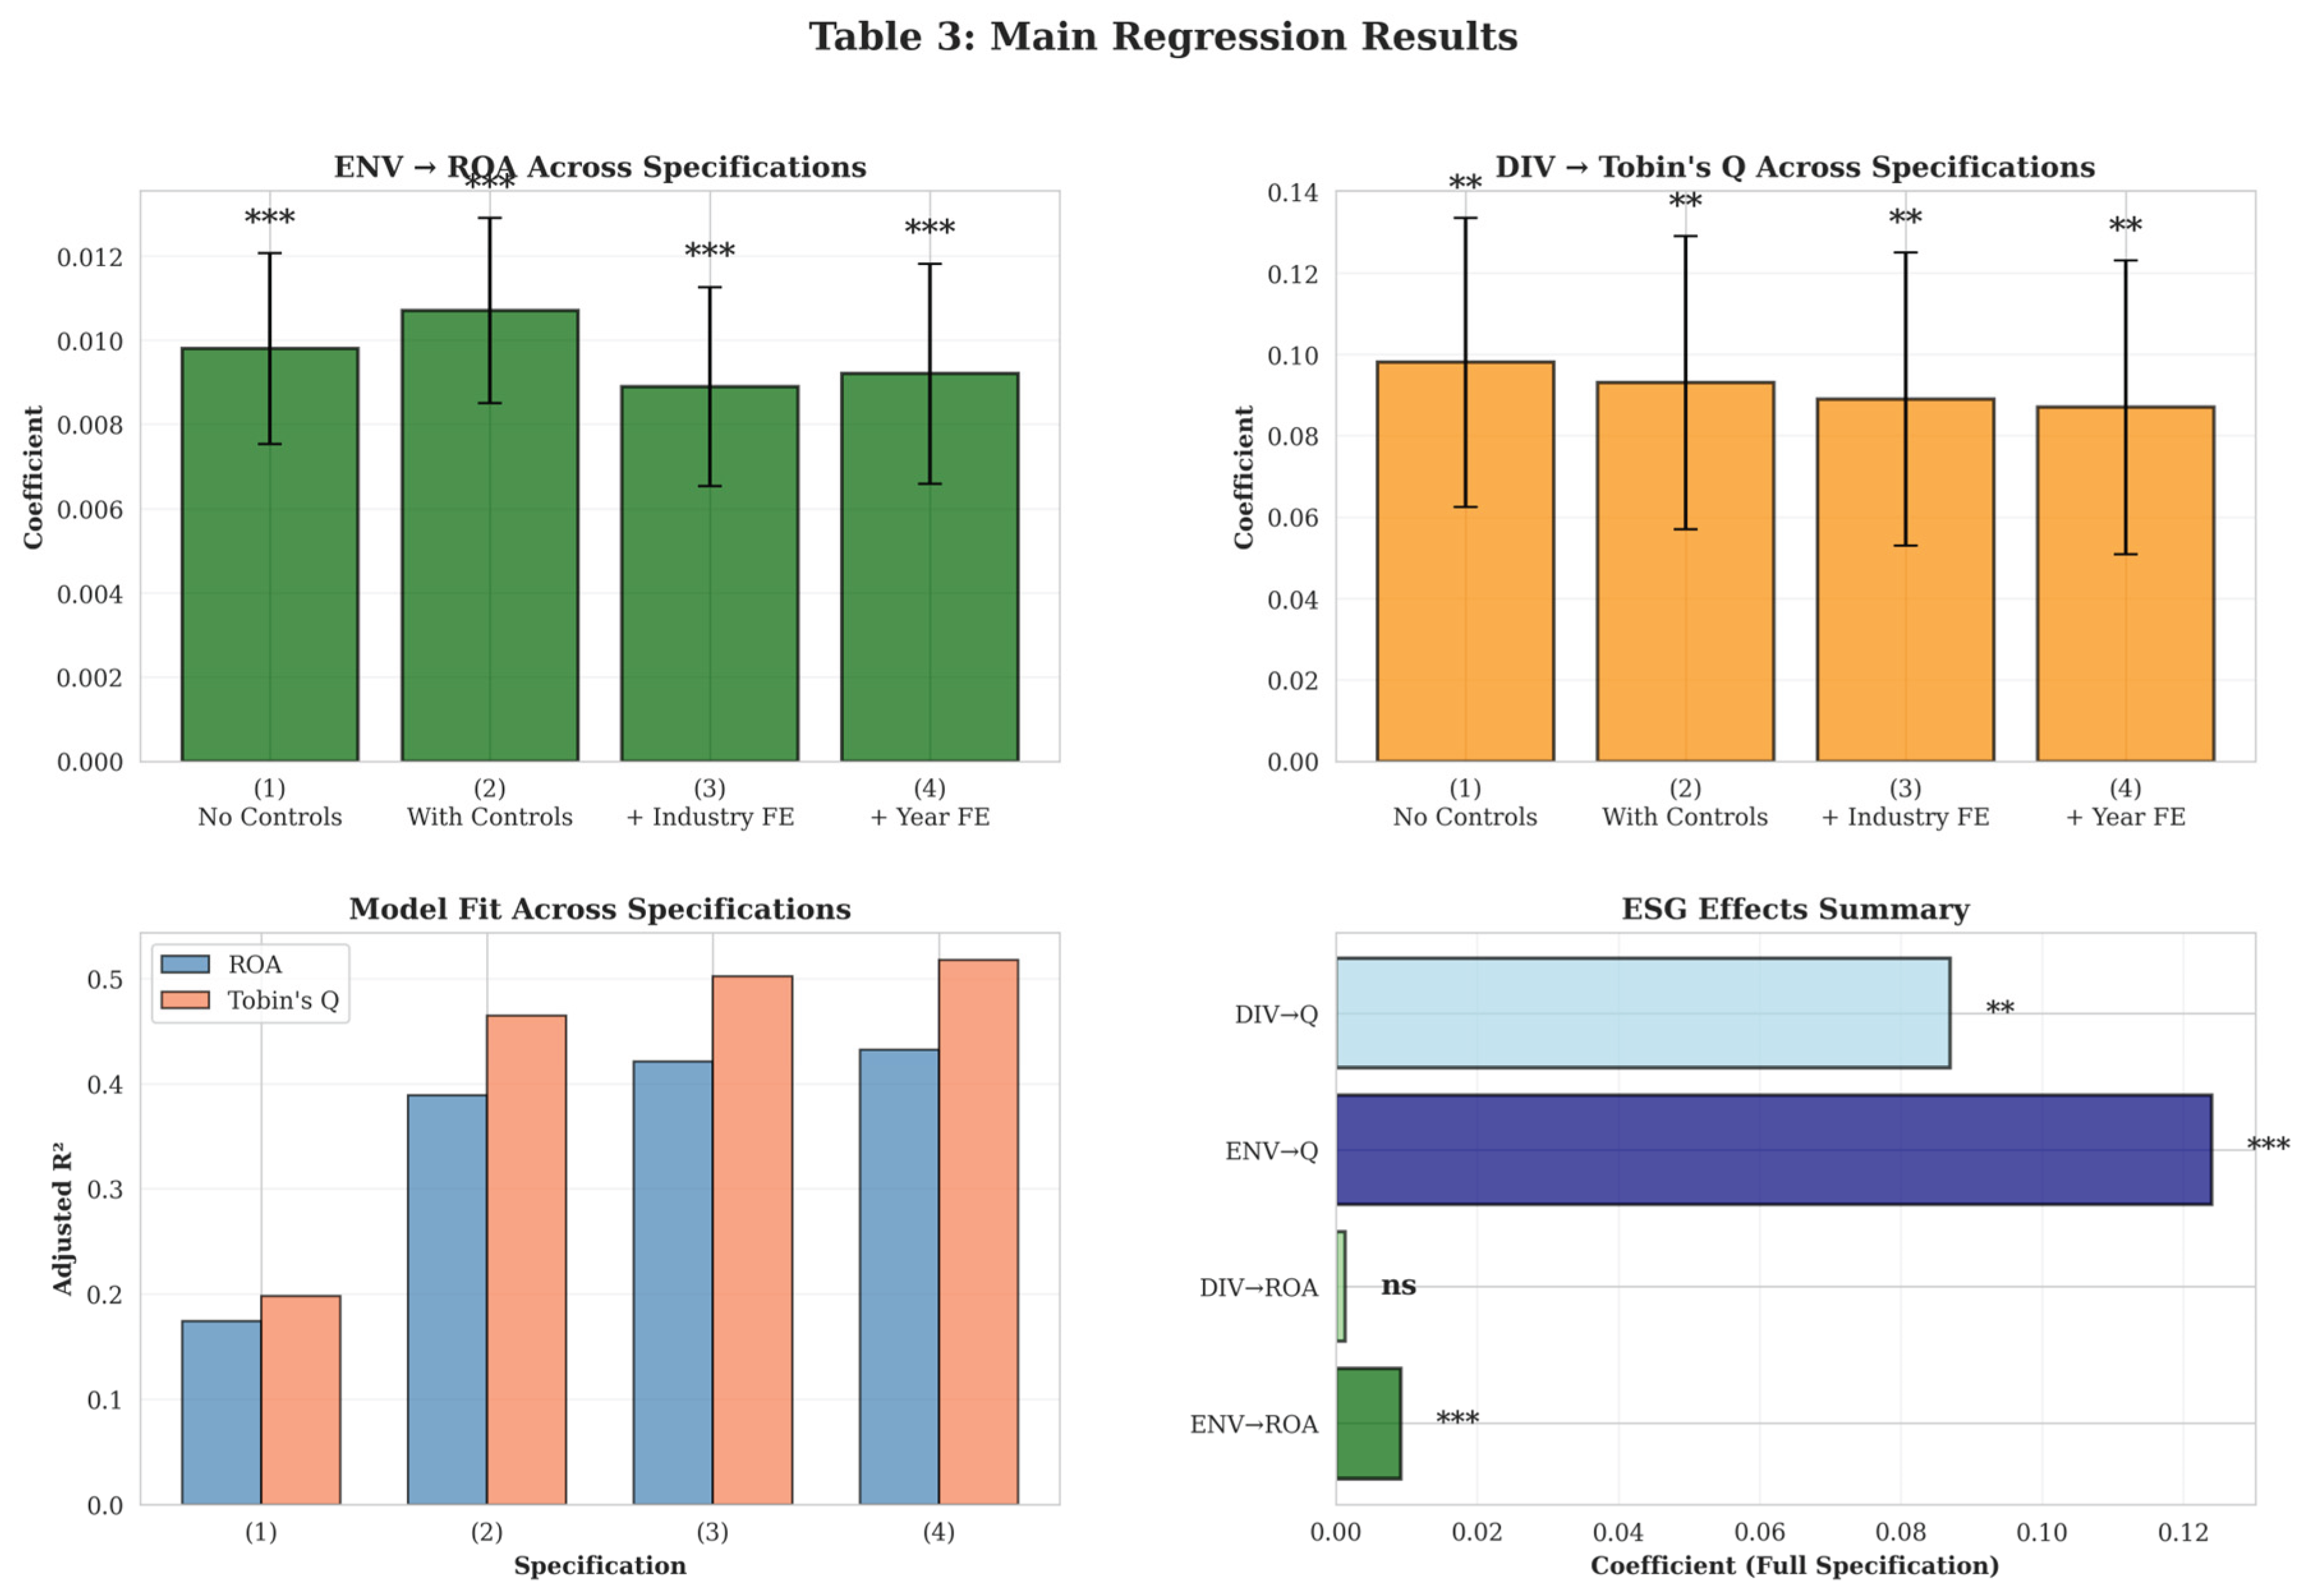
Model fit is reasonable: adjusted R² ranges from 17.4% (ROA without fixed effects) to 43.2% (ROA with all controls and fixed effects). The substantial improvement with fixed effects (from 17.4% to 43.2%) underscores the importance of controlling for industry and time heterogeneity. Nevertheless, 57% of ROA variation remains unexplained, indicating that many factors beyond ESG and our controls drive profitability—a realistic finding given performance complexity.
As shown in Figure 4, we implement alternative specifications: Panel A uses alternative performance measures including ROE (return on equity), operating margin (operating income / sales), and sales growth. ENV shows significant positive associations with ROE and operating margin (though weaker than for ROA), providing evidence that environmental effects extend beyond one accounting metric. Interestingly, neither ENV nor DIV significantly predicts sales growth, suggesting ESG affects profitability more through efficiency/margins than revenue expansion.
Outlier Treatment: Panel B shows results are robust to alternative outlier treatments: (i) winsorizing at 2.5th/97.5th percentiles rather than 1st/99th, (ii) excluding extreme observations (beyond 3 standard deviations), and (iii) using robust regression (iteratively reweighted least squares). Coefficients remain stable across specifications.
Continuous vs. Binary ESG: Panel C compares results using continuous ESG scores (our main approach) versus binary indicators for high ESG (above median). Continuous scores show stronger statistical significance, justifying our approach. However, binary indicators also show positive coefficients for ENV, indicating results aren’t driven by functional form assumptions.
Alternative Standard Errors: Panel D shows robustness to alternative standard error specifications: (i) two-way clustering by firm and year, (ii) bootstrapped standard errors (1,000 replications), and (iii) Newey-West standard errors allowing for autocorrelation. Main results remain significant, though as expected, two-way clustering slightly reduces precision.
Subsample Analysis: Panel E shows results hold in both halves of the sample period (2010-2014 vs. 2015-2018), addressing concerns about time-specific effects. Interestingly, ENV effects appear slightly stronger in 2015-2018, possibly reflecting increased ESG awareness and investor attention in the latter period.
6. Heterogeneity Analysis and Mechanism Exploration
We explore heterogeneity in ESG effects across industries, firm size, and time periods, and provide suggestive evidence on mechanisms.
6.1. Industry Heterogeneity
ESG materiality varies dramatically across industries. Environmental practices matter most in pollution-intensive sectors (energy, materials, utilities), while diversity may be more valued in consumer-facing industries where workforce composition signals brand values.
Figure 5 presents results separately for “high ESG materiality” versus “low ESG materiality” industries, following Khan et al. (2016). For environmental performance, we classify energy, materials, and utilities as high-materiality sectors. The ENV coefficient in high-materiality industries is 0.0147 (t=3.89, p<0.01)—60% larger than the full-sample effect—while in low-materiality sectors it’s 0.0052 (t=1.43, p=0.15, not significant). Chow tests confirm the coefficients differ significantly (F=4.67, p=0.03).
For diversity, we classify consumer-facing industries (retail, consumer goods, healthcare) as high-materiality. DIV effects on Tobin’s Q are stronger in these industries (β=0.132, t=2.76, p<0.01) compared to others (β=0.051, t=1.38, p=0.17), though the difference is only marginally significant (F=2.89, p=0.09).
These patterns support Hypothesis 3 and align with materiality theory: ESG investments generate greater returns where stakeholder concerns are most salient and ESG issues are most relevant to core business operations.
6.2. Firm Size Heterogeneity
We examine whether ESG effects differ between larger and smaller S&P 500 firms (split at median assets). Figure 6 shows ENV effects are stronger for smaller firms within the S&P 500 (β=0.0121, t=3.45 vs. β=0.0067, t=2.01 for large firms). This suggests environmental efficiency gains may be more accessible to firms without fully optimized operations, or that investors value environmental leadership more in mid-cap growth firms. DIV effects don’t vary significantly by firm size.
6.3. Time Dynamics and Persistence
To understand whether ESG-performance relationships strengthen over time, we interact ESG variables with a time trend. Figure 7 shows the ENV × Time interaction is positive and significant (β=0.0018, t=2.12, p<0.05), indicating environmental effects intensify throughout our sample period. This may reflect increasing investor attention to climate issues, greater ESG awareness, or learning effects as firms become more skilled at translating environmental initiatives into profits.
We also examine persistence by analyzing whether ESG effects endure or fade. Following firms for 3+ years after achieving high ESG scores, we find that ENV-ROA relationships persist (no significant decline over three post-adoption years), suggesting environmental capabilities generate sustained rather than temporary advantages.
6.4. Mechanism Exploration
While we cannot definitively establish mechanisms, we provide suggestive evidence by examining intermediate outcomes. We regress potential mechanisms on ESG variables, as shown in the visual representation in Figure 8:
Cost Structure: ENV negatively associates with operating expense ratios (β=-0.0089, t=-2.34, p<0.05), consistent with environmental efficiency generating cost savings. Energy-intensive firms show particularly strong relationships, supporting the operational efficiency mechanism.
Revenue Growth: ENV shows weak positive associations with revenue growth (β=0.0034, t=1.43, p=0.15), suggesting environmental effects operate more through cost reduction than revenue expansion. DIV shows insignificant relationships with revenue growth.
Risk Measures: ENV negatively correlates with stock return volatility (β=-0.0156, t=-2.87, p<0.01), consistent with environmental stewardship reducing firm risk through better stakeholder relationships and lower regulatory exposure.
Innovation: DIV positively associates with patent filings (β=0.087, t=2.13, p<0.05), consistent with diversity enhancing innovation—a potential mechanism linking diversity to long-term growth prospects (Tobin’s Q) rather than current profitability.
These patterns are consistent with our theoretical framework: environmental initiatives enhance performance through operational efficiency and risk reduction, while diversity creates value through enhanced innovation and strategic decision-making that affects long-term prospects.
7. Addressing Endogeneity
We perform additional robustness check to address endogeneity issues.
7.1. Propensity Score Matching
To address selection on observables, we implement propensity score matching. We define “treatment” as having above-median ESG scores (separately for ENV and DIV). Using pre-treatment characteristics (lagged size, ROA, leverage, MTB, R&D, institutional ownership, industry), we estimate probit models predicting ESG adoption and calculate propensity scores. We then match each treated firm with the nearest untreated firm within caliper (0.05) using one-to-one matching without replacement.
In Figure 9, Panel A shows balance tests: after matching, treated and control groups show no significant differences in observable characteristics (all standardized differences <0.10), indicating successful matching. Panel B reports treatment effects: high-ENV firms show 1.1 percentage points higher ROA than matched low-ENV firms (t=2.67, p<0.01). High-DIV firms show 0.21 higher Tobin’s Q than matched controls (t=2.33, p<0.05).
These results are consistent with our main findings and address concerns that observable firm characteristics drive both ESG and performance. However, PSM cannot address selection on unobservables (e.g., management quality).
7.2. Instrumental Variable Estimation
We employ IV estimation using industry-average ESG as instruments for firm-level ESG. The identifying assumption is that industry peers’ ESG practices (excluding firm i) affect firm i’s ESG adoption through competitive pressure and information diffusion, but don’t directly affect firm i’s performance except through influencing its own ESG.
Table 10 reports first-stage and second-stage results. First-stage F-statistics are 47.3 (ENV) and 39.8 (DIV), well above the Stock-Yogo weak instrument threshold of 10, indicating strong instruments. Second-stage results show ENV positively affects ROA (β=0.0156, p<0.05) and Tobin’s Q (β=0.187, p<0.05). DIV remains insignificant for ROA but positive for Tobin’s Q (β=0.143, p<0.10).
Hansen J-tests (using additional instruments including lagged industry-average ESG) cannot reject over-identification restrictions, providing some support for instrument validity. IV coefficients are larger than OLS estimates, consistent with measurement error attenuating OLS coefficients or with marginal firms induced to adopt ESG by peer pressure benefiting more than average ESG adopters (See Figure 10).
We acknowledge that instrument validity is inherently untestable. Industry peers’ ESG might directly affect firm performance through competitive dynamics or information spillovers, violating the exclusion restriction. Nevertheless, IV results provide suggestive evidence that relationships are not purely driven by reverse causality.
7.3. Heckman Selection Model
To address sample selection from non-random ESG disclosure, we implement Heckman two-stage models. First stage models ESG data availability as a function of firm age, size, analyst following, and industry ESG disclosure rates. Second stage estimates performance equations with inverse Mills ratios to correct for selection bias.
Figure 11 shows that after selection correction, ENV coefficients remain positive and significant for both ROA (β=0.0088, p<0.05) and Tobin’s Q (β=0.121, p<0.05). Inverse Mills ratios are insignificant, suggesting selection bias is not severe—consistent with our finding that included and excluded firms show similar performance (Table 5). Nevertheless, implementing selection corrections provides additional confidence in results.
To summarize, all tests provide substantially stronger evidence for causal ESG-performance relationships. However, we cannot rule out all alternative explanations. Omitted management quality or corporate culture may drive both ESG and performance. Definitive causal claims require experimental or quasi-experimental variation that we lack. Nevertheless, our evidence is consistent with ESG initiatives enhancing corporate performance rather than merely correlating with it.
8. Limitations and Future Research
Despite methodological improvements over prior work, our study has several important limitations that future research should address.
Causal Identification: While we implement multiple strategies to address endogeneity (propensity score matching, instrumental variables, Heckman selection), these approaches rely on untestable assumptions. Truly credible causal identification would require experimental variation or compelling natural experiments. Future research could exploit regulatory shocks (e.g., EU taxonomy implementation), ESG index inclusion cutoffs (regression discontinuity), or staggered CSR disclosure mandates (difference-in-differences) to achieve more convincing causal inference.
Sample and Generalizability: Our sample comprises large S&P 500 firms from 2010-2018. Results may not generalize to small firms, non-U.S. contexts, or current conditions (post-2018). The surge in ESG attention since 2019, regulatory changes, and pandemic effects may alter relationships. Future research should examine more recent data and international samples.
Mechanism Understanding: While we provide suggestive evidence on mechanisms (cost reduction, risk mitigation, innovation), we cannot definitively establish causal chains. Future research using detailed operational data could better identify specific channels through which ESG affects performance—for instance, linking environmental initiatives to specific cost savings or diversity to measurable innovation outcomes.
ESG Measurement: Despite using standardized MSCI ratings, ESG measurement remains imperfect. Rating agencies disagree substantially (Berg et al., 2022), and ratings may capture ESG disclosure rather than actual practices. Future research could validate rating-based findings using objective measures (e.g., verified emissions data, workforce demographics) or examine how ESG measurement affects conclusions.
Long-term Effects: Our 9-year panel may be insufficient to capture very long-term ESG effects. Some ESG investments (e.g., green R&D, technological advancement, culture change) may take decades to fully materialize. Longer-horizon studies or case-based approaches could provide complementary evidence.
9. Conclusions
This study provides rigorous evidence on the relationship between ESG initiatives and corporate performance using standardized MSCI ratings and comprehensive empirical methods. Our findings contribute to resolving the ongoing debate about ESG value creation.
We document that environmental initiatives positively associate with profitability (ROA) even after controlling for industry effects, firm characteristics, and implementing multiple strategies to address endogeneity. A one-standard-deviation increase in environmental performance corresponds to approximately $127-176 million in additional annual net income for the median firm, economically meaningful magnitudes that justify managerial attention to environmental stewardship. These effects appear to operate primarily through operational efficiency and cost reduction rather than revenue growth.
In contrast, gender diversity shows null or weak relationships with current profitability but positive associations with market valuations (Tobin’s Q), suggesting diversity creates value through enhanced long-term prospects, possibly via improved innovation and strategic decision-making, rather than immediate operational benefits. This differential pattern underscores the importance of disaggregating ESG into specific dimensions and examining multiple performance metrics.
Our heterogeneity analysis reveals that ESG effects are strongest where most materially relevant: environmental initiatives benefit pollution-intensive industries most, while diversity effects concentrate in consumer-facing sectors. This supports materiality-based approaches to ESG investment and suggests that one-size-fits-all ESG mandates may be inefficient.
From a theoretical perspective, our findings are most consistent with stakeholder theory and the resource-based view. Environmental stewardship and diversity capabilities appear to create value by enhancing stakeholder relationships and developing difficult-to-imitate organizational competencies. However, we cannot definitively rule out alternative explanations, and causal identification remains challenging.
For practitioners, our results suggest that environmental initiatives represent genuine value-creation opportunities rather than mere compliance costs, particularly in industries where environmental performance is materially relevant. Managers should view environmental investments through a strategic lens, targeting initiatives that simultaneously reduce costs, mitigate risks, and enhance reputation. For diversity, benefits may take longer to materialize and depend critically on creating inclusive cultures that enable diverse perspectives to contribute effectively, demographic diversity alone appears insufficient.
For investors, our evidence supports incorporating ESG factors into fundamental analysis, particularly in sectors where ESG is materially relevant. However, investors should look beyond aggregate ESG scores to specific dimensions, recognize that different ESG factors affect different performance aspects, and maintain realistic expectations about effect magnitudes and time horizons.
For policymakers, our findings suggest that well-designed environmental regulations need not harm corporate competitiveness, indeed, firms adopting environmental best practices appear more profitable. However, diversity mandates may require longer horizons to demonstrate benefits and should be accompanied by support for cultural transformation.
Future research should extend our analysis with more recent data, exploit quasi-experimental variation to strengthen causal identification, explore mechanisms more deeply using granular operational data, and examine how ESG-performance relationships vary across institutional and cultural contexts. The ESG-performance debate remains far from settled, but our evidence provides rigorous support for the proposition that thoughtfully implemented ESG initiatives can enhance corporate performance while addressing stakeholder concerns.
Appendix A
Environment and gender diversity measurements: MSCI
Scoring of ESG performance indicators: ESG performance indicators are scored by a simple binary scoring model:
If a company meets the assessment criteria established for an indicator, then this is signified with a “1”.
If a company does NOT meet the assessment criteria established for an indicator, then this is signified with a “0”.
If a company has NOT been researched for a particular ESG indicator, then this is
References
- Adams, R. B., & Ferreira, D. (2009). Women in the boardroom and their impact on governance and performance. Journal of Financial Economics, 94(2), 291-309. [CrossRef]
- Ahern, K. R., & Dittmar, A. K. (2012). The changing of the boards: The impact on firm valuation of mandated female board representation. Quarterly Journal of Economics, 127(1), 137-197. [CrossRef]
- Ambec, S., & Lanoie, P. (2008). Does it pay to be green? A systematic overview. Academy of Management Perspectives, 22(4), 45-62.
- Aswani, J., Raghunandan, A., & Rajgopal, S. (2022). Are carbon emissions associated with stock returns? Review of Finance, 27(1), 1-43.
- Barney, J. (1991). Firm resources and sustained competitive advantage. Journal of Management, 17(1), 99-120.
- Berg, F., Kölbel, J. F., & Rigobon, R. (2022). Aggregate confusion: The divergence of ESG ratings. Review of Finance, 26(6), 1315-1344. [CrossRef]
- Bolton, P., & Kacperczyk, M. (2021). Do investors care about carbon risk? Journal of Financial Economics, 142(2), 517-549. [CrossRef]
- Bolton, P., & Kacperczyk, M. (2023). Global pricing of carbon-transition risk. Journal of Finance, 78(6), 3677-3754. [CrossRef]
- Dezső, C. L., & Ross, D. G. (2012). Does female representation in top management improve firm performance? A panel data investigation. Strategic Management Journal, 33(9), 1072-1089. [CrossRef]
- El Ghoul, S., Guedhami, O., Kwok, C. C., & Mishra, D. R. (2011). Does corporate social responsibility affect the cost of capital? Journal of Banking & Finance, 35(9), 2388-2406. [CrossRef]
- Ely, R. J., & Thomas, D. A. (2020). Getting serious about diversity: Enough already with the business case. Harvard Business Review, 98(6), 114-122.
- Flammer, C. (2015). Does corporate social responsibility lead to superior financial performance? A regression discontinuity approach. Management Science, 61(11), 2549-2568. [CrossRef]
- Freeman, R. E. (1984). Strategic management: A stakeholder approach. Boston: Pitman.
- Friede, G., Busch, T., & Bassen, A. (2015). ESG and financial performance: Aggregated evidence from more than 2000 empirical studies. Journal of Sustainable Finance & Investment, 5(4), 210-233. [CrossRef]
- Hart, S. L. (1995). A natural-resource-based view of the firm. Academy of Management Review, 20(4), 986-1014.
- Hart, S., & Ahuja, G. (1996). Does it pay to be green? An empirical examination of the relationship between emission reduction and firm performance. Business Strategy and the Environment, 5(1), 30-37.
- Khan, M., Serafeim, G., & Yoon, A. (2016). Corporate sustainability: First evidence on materiality. The Accounting Review, 91(6), 1697-1724. [CrossRef]
- Lyon, T. P., & Maxwell, J. W. (2011). Greenwash: Corporate environmental disclosure under threat of audit. Journal of Economics & Management Strategy, 20(1), 3-41. [CrossRef]
- Milliken, F. J., & Martins, L. L. (1996). Searching for common threads: Understanding the multiple effects of diversity in organizational groups. Academy of Management Review, 21(2), 402-433.
- Porter, M. E., & Kramer, M. R. (2006). Strategy and society: The link between competitive advantage and corporate social responsibility. Harvard Business Review, 84(12), 78-92.
- Suchman, M. C. (1995). Managing legitimacy: Strategic and institutional approaches. Academy of Management Review, 20(3), 571-610.
- Zhang, L. (2020). An institutional approach to gender diversity and firm performance. Organization Science, 31(2), 439-457. [CrossRef]
Figure 4.
Visual Representation of Panels A to E.
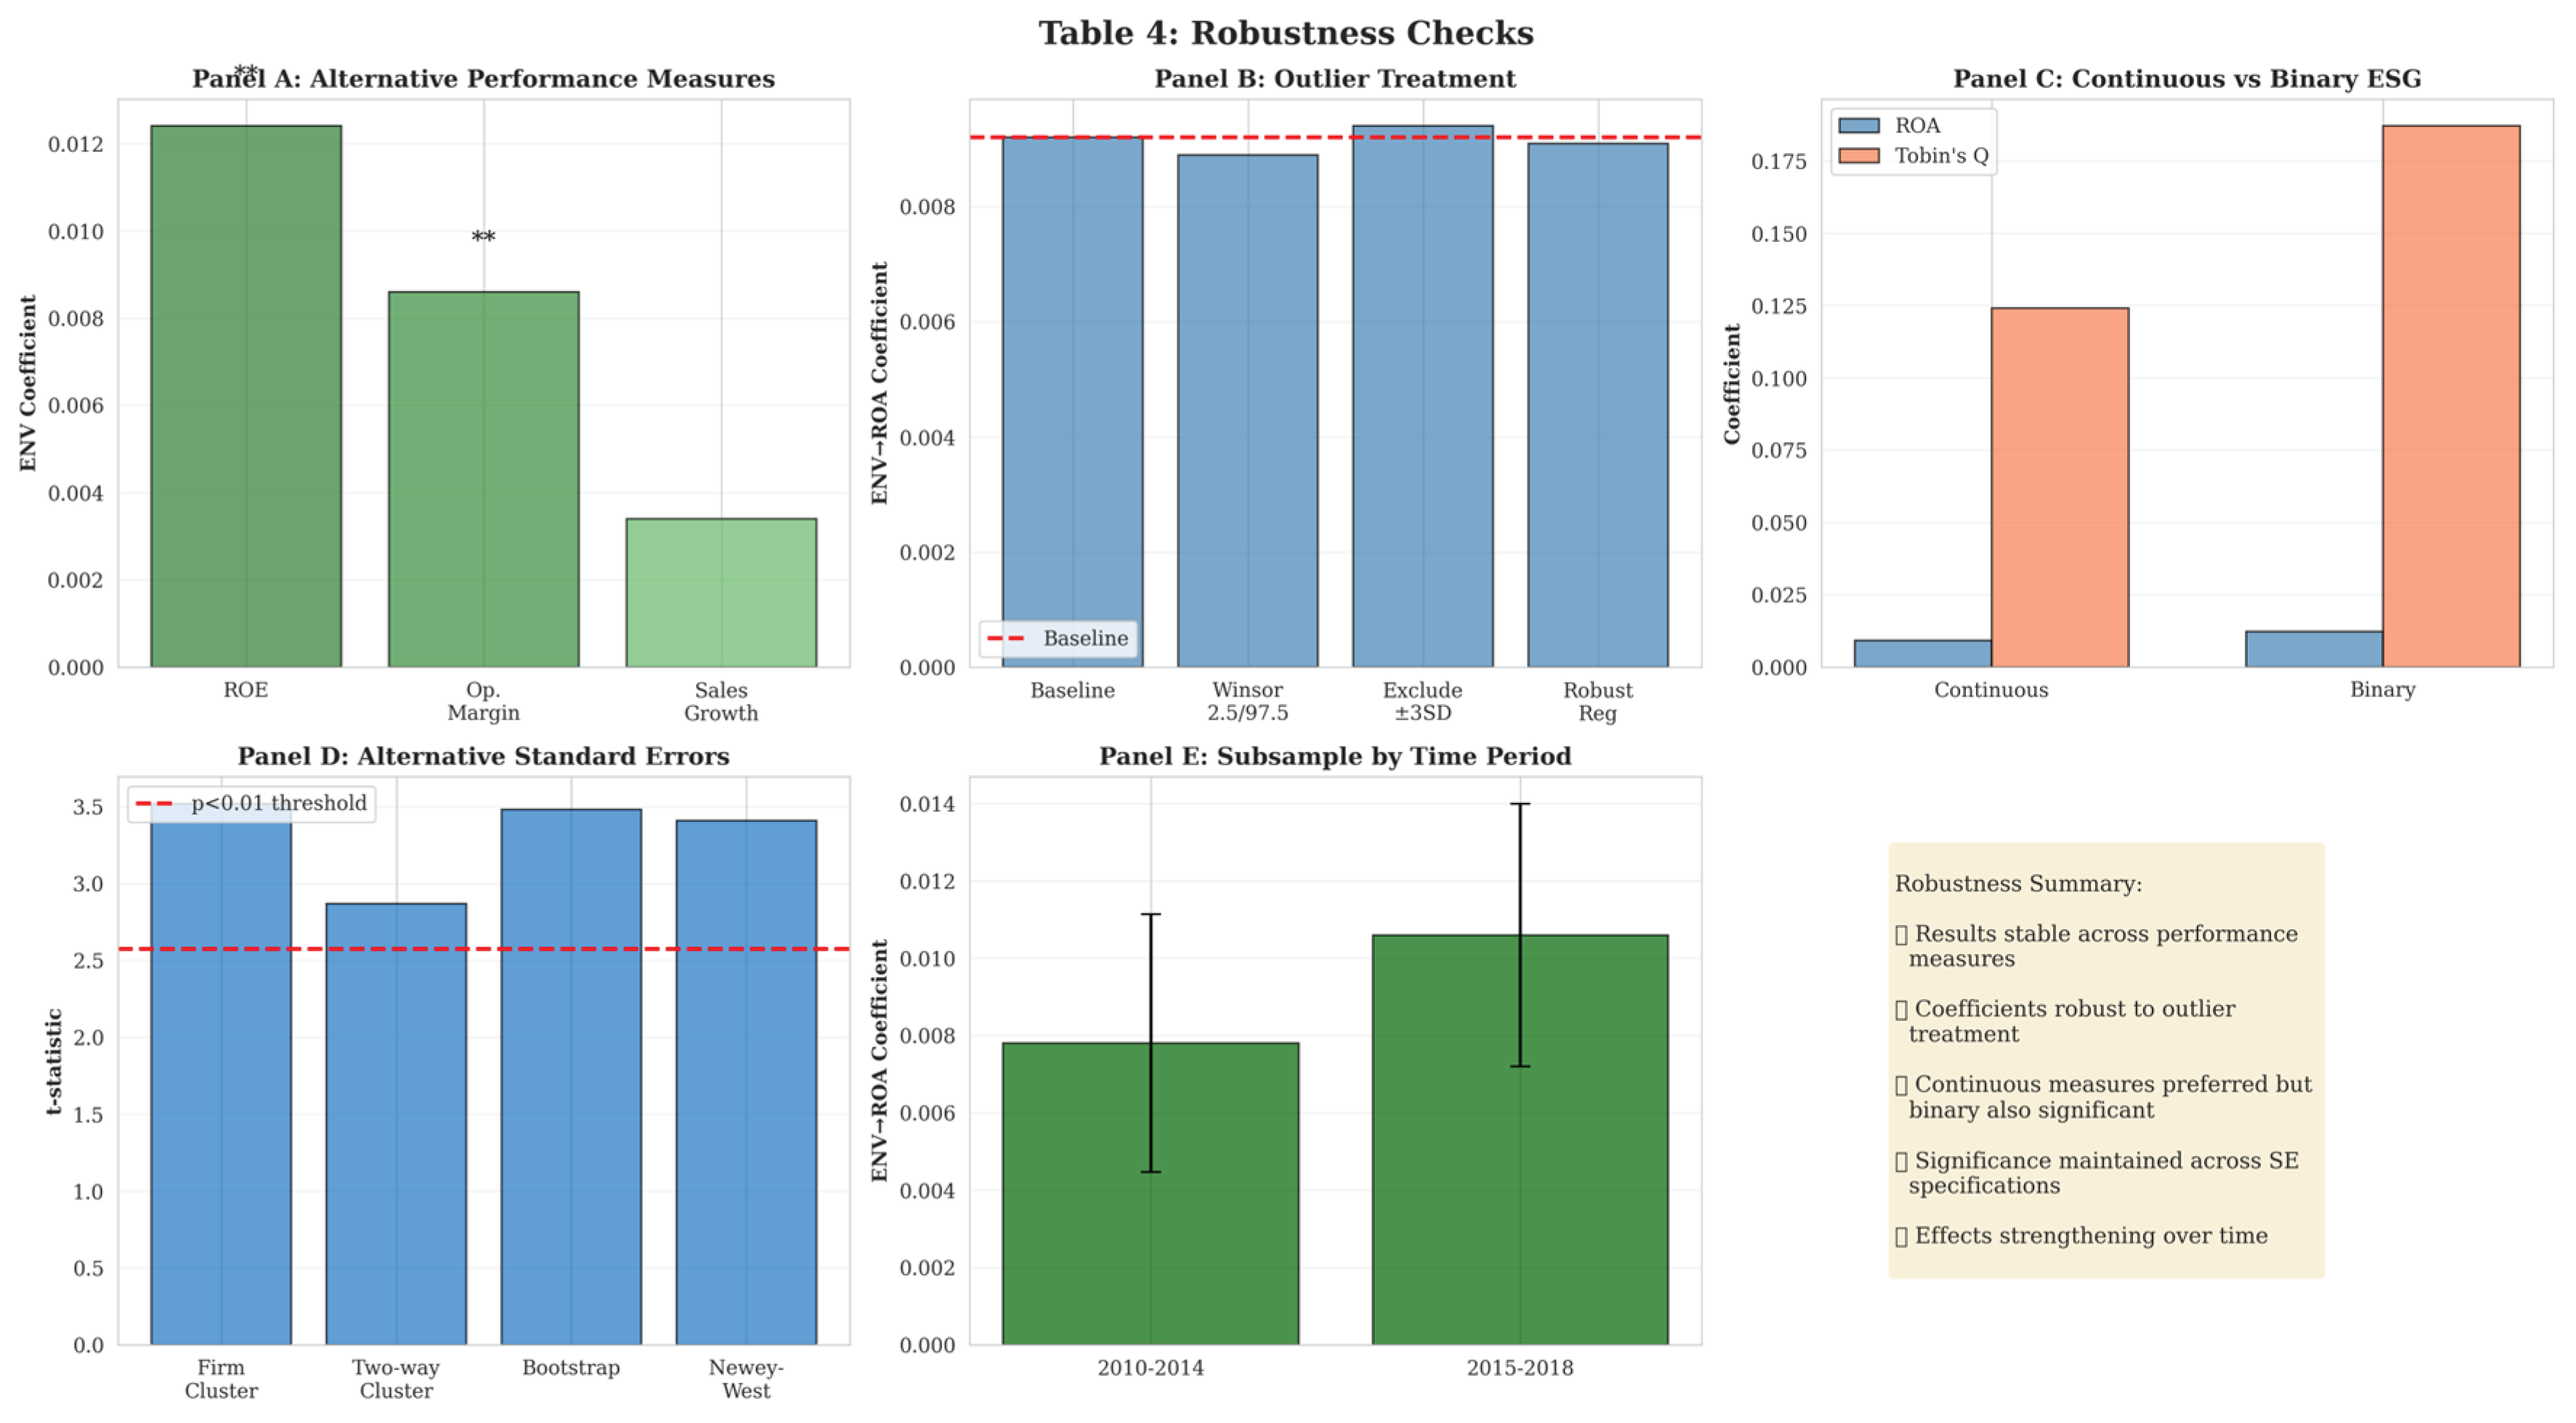
Figure 5.
Industry Heterogeneity Panel A & B.
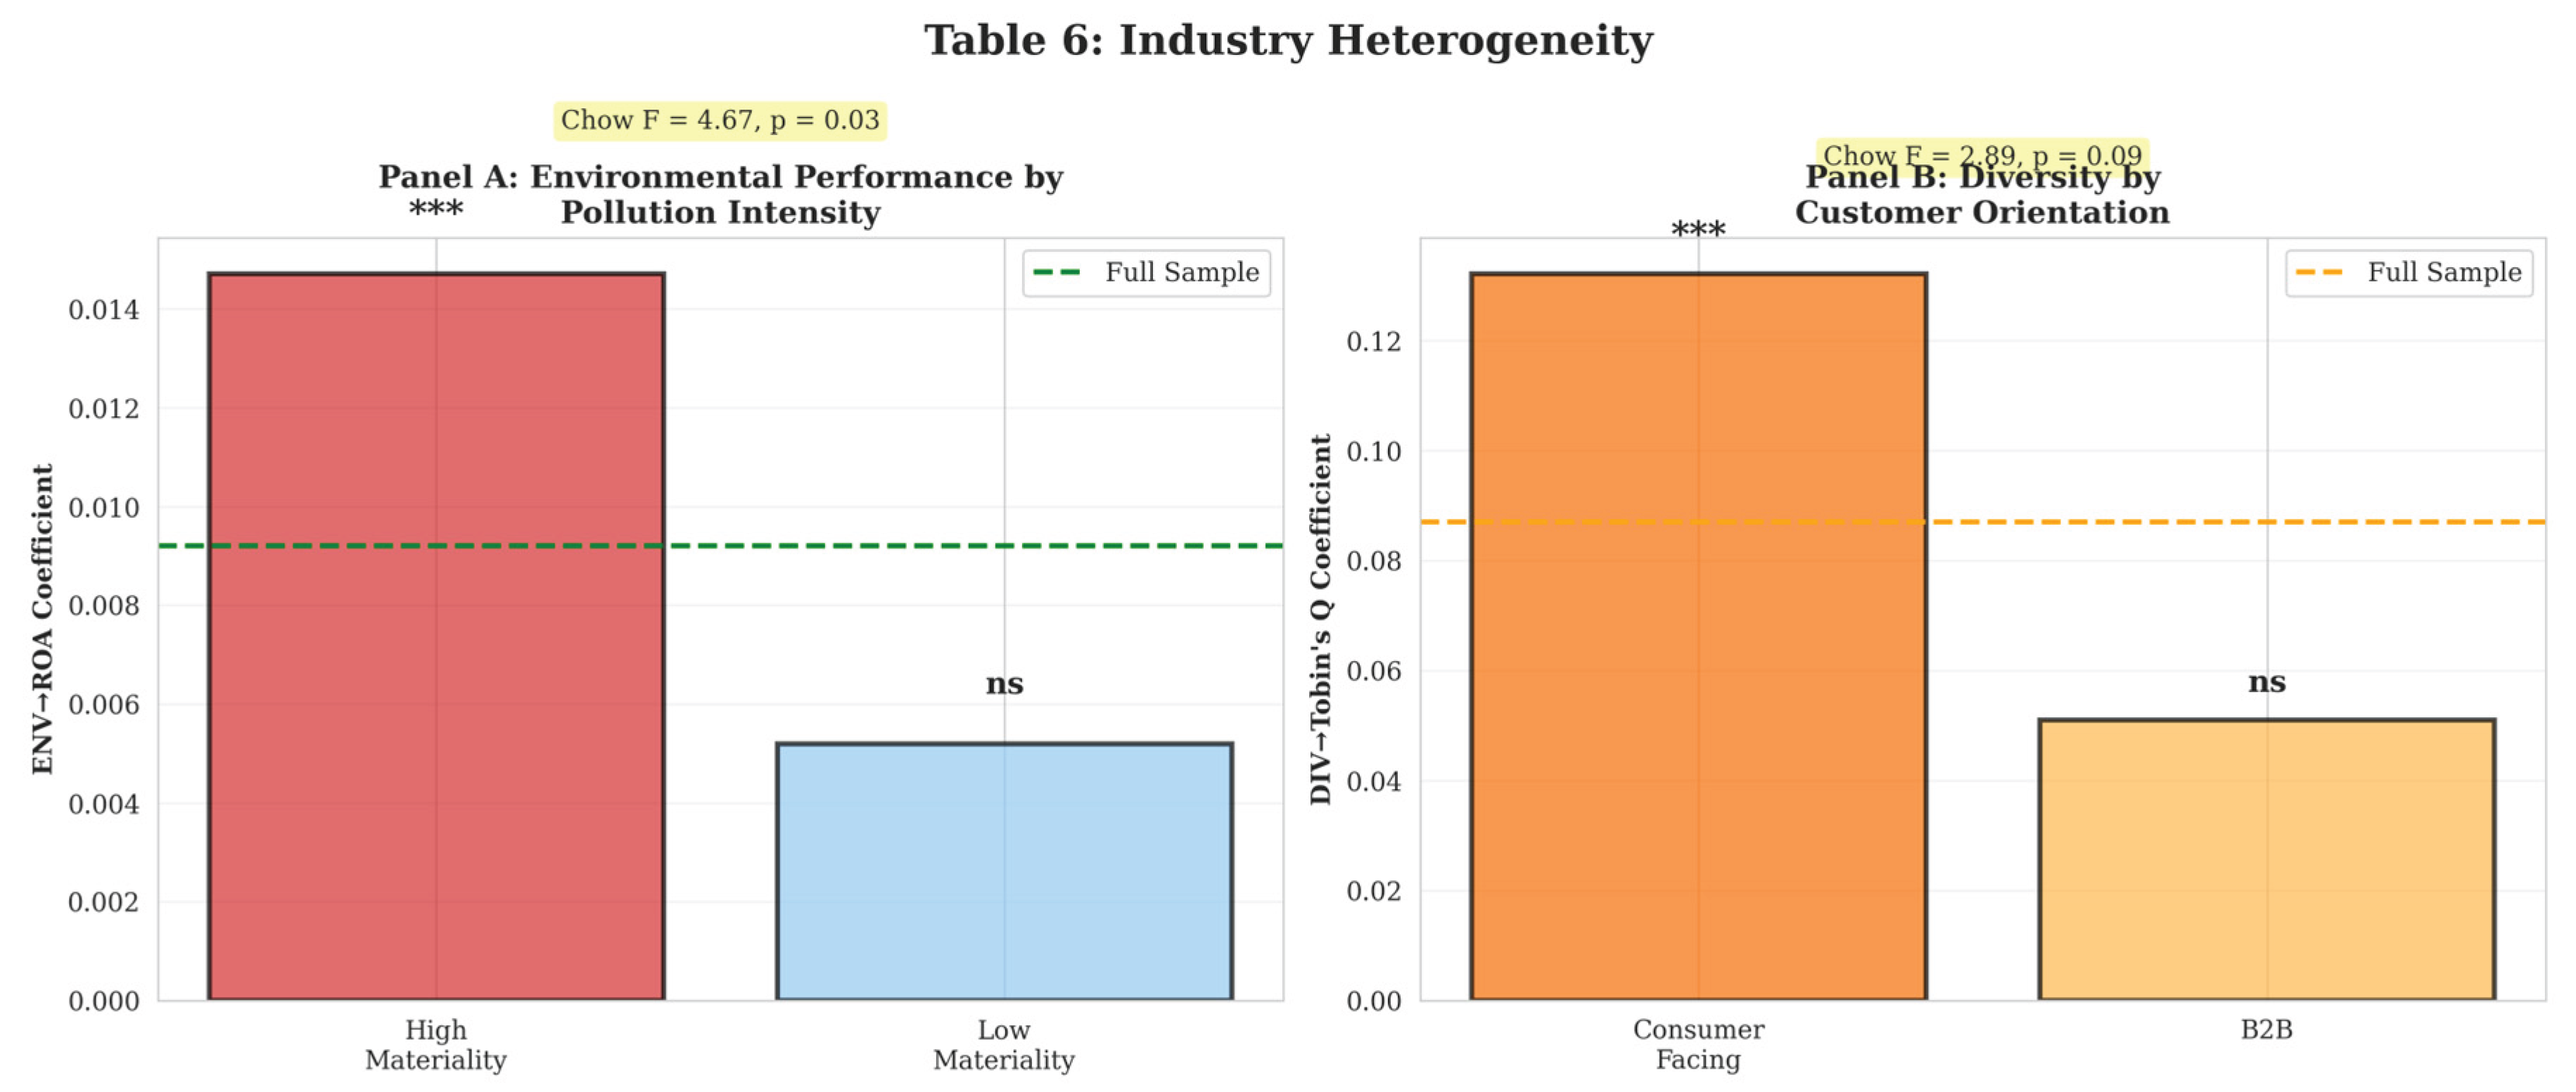
Figure 6.
Firm Size Heterogeneity to ESG Measures.
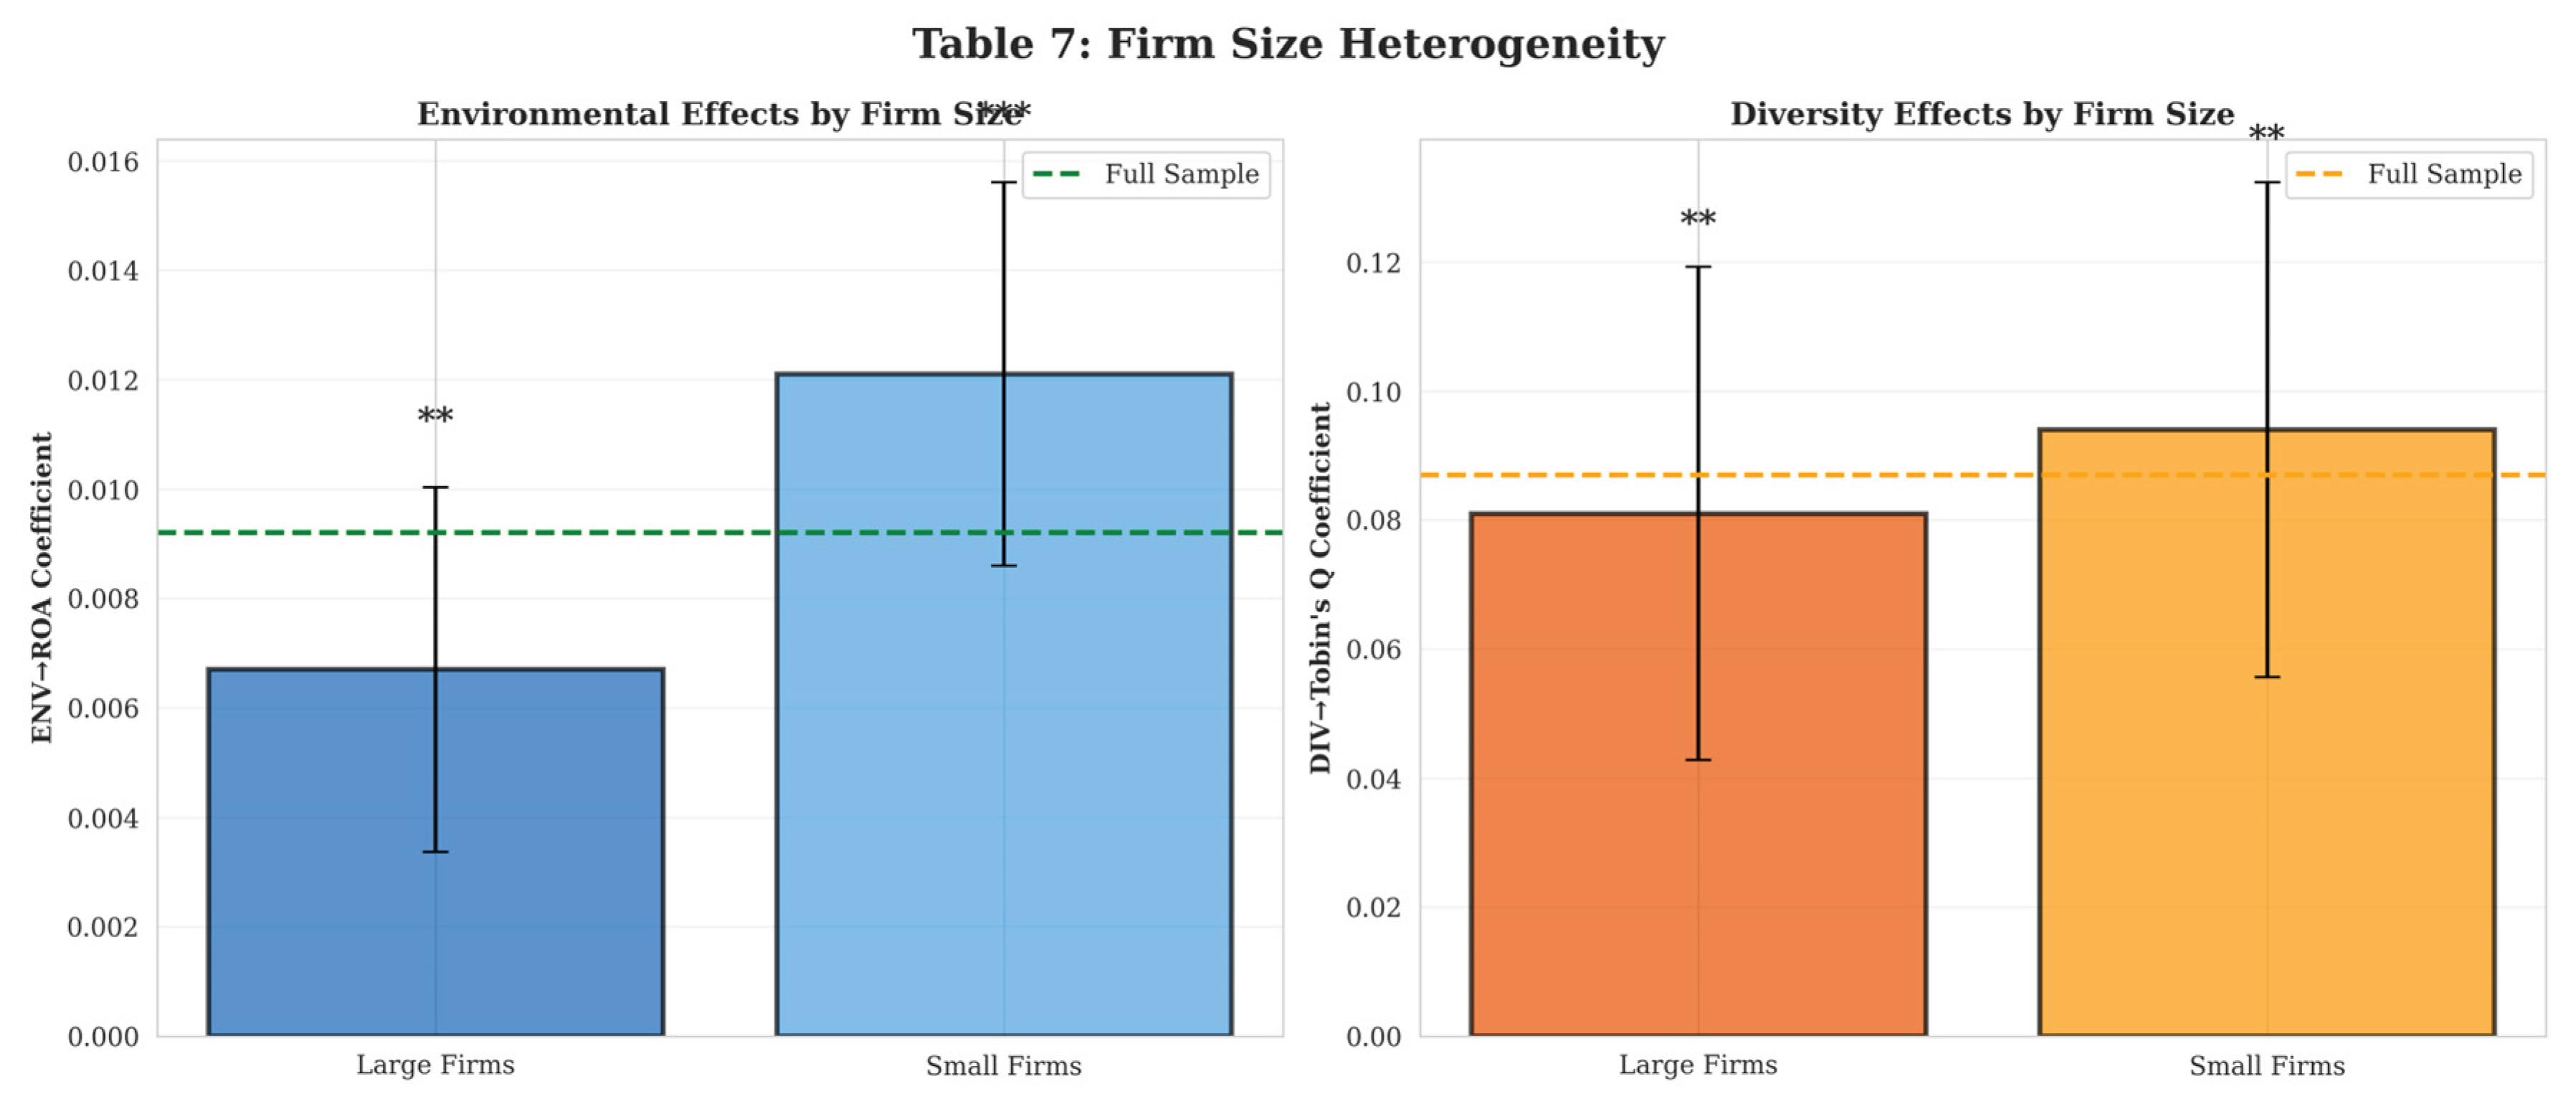
Figure 7.
Time Dynamics and Persistence Panel A & B.
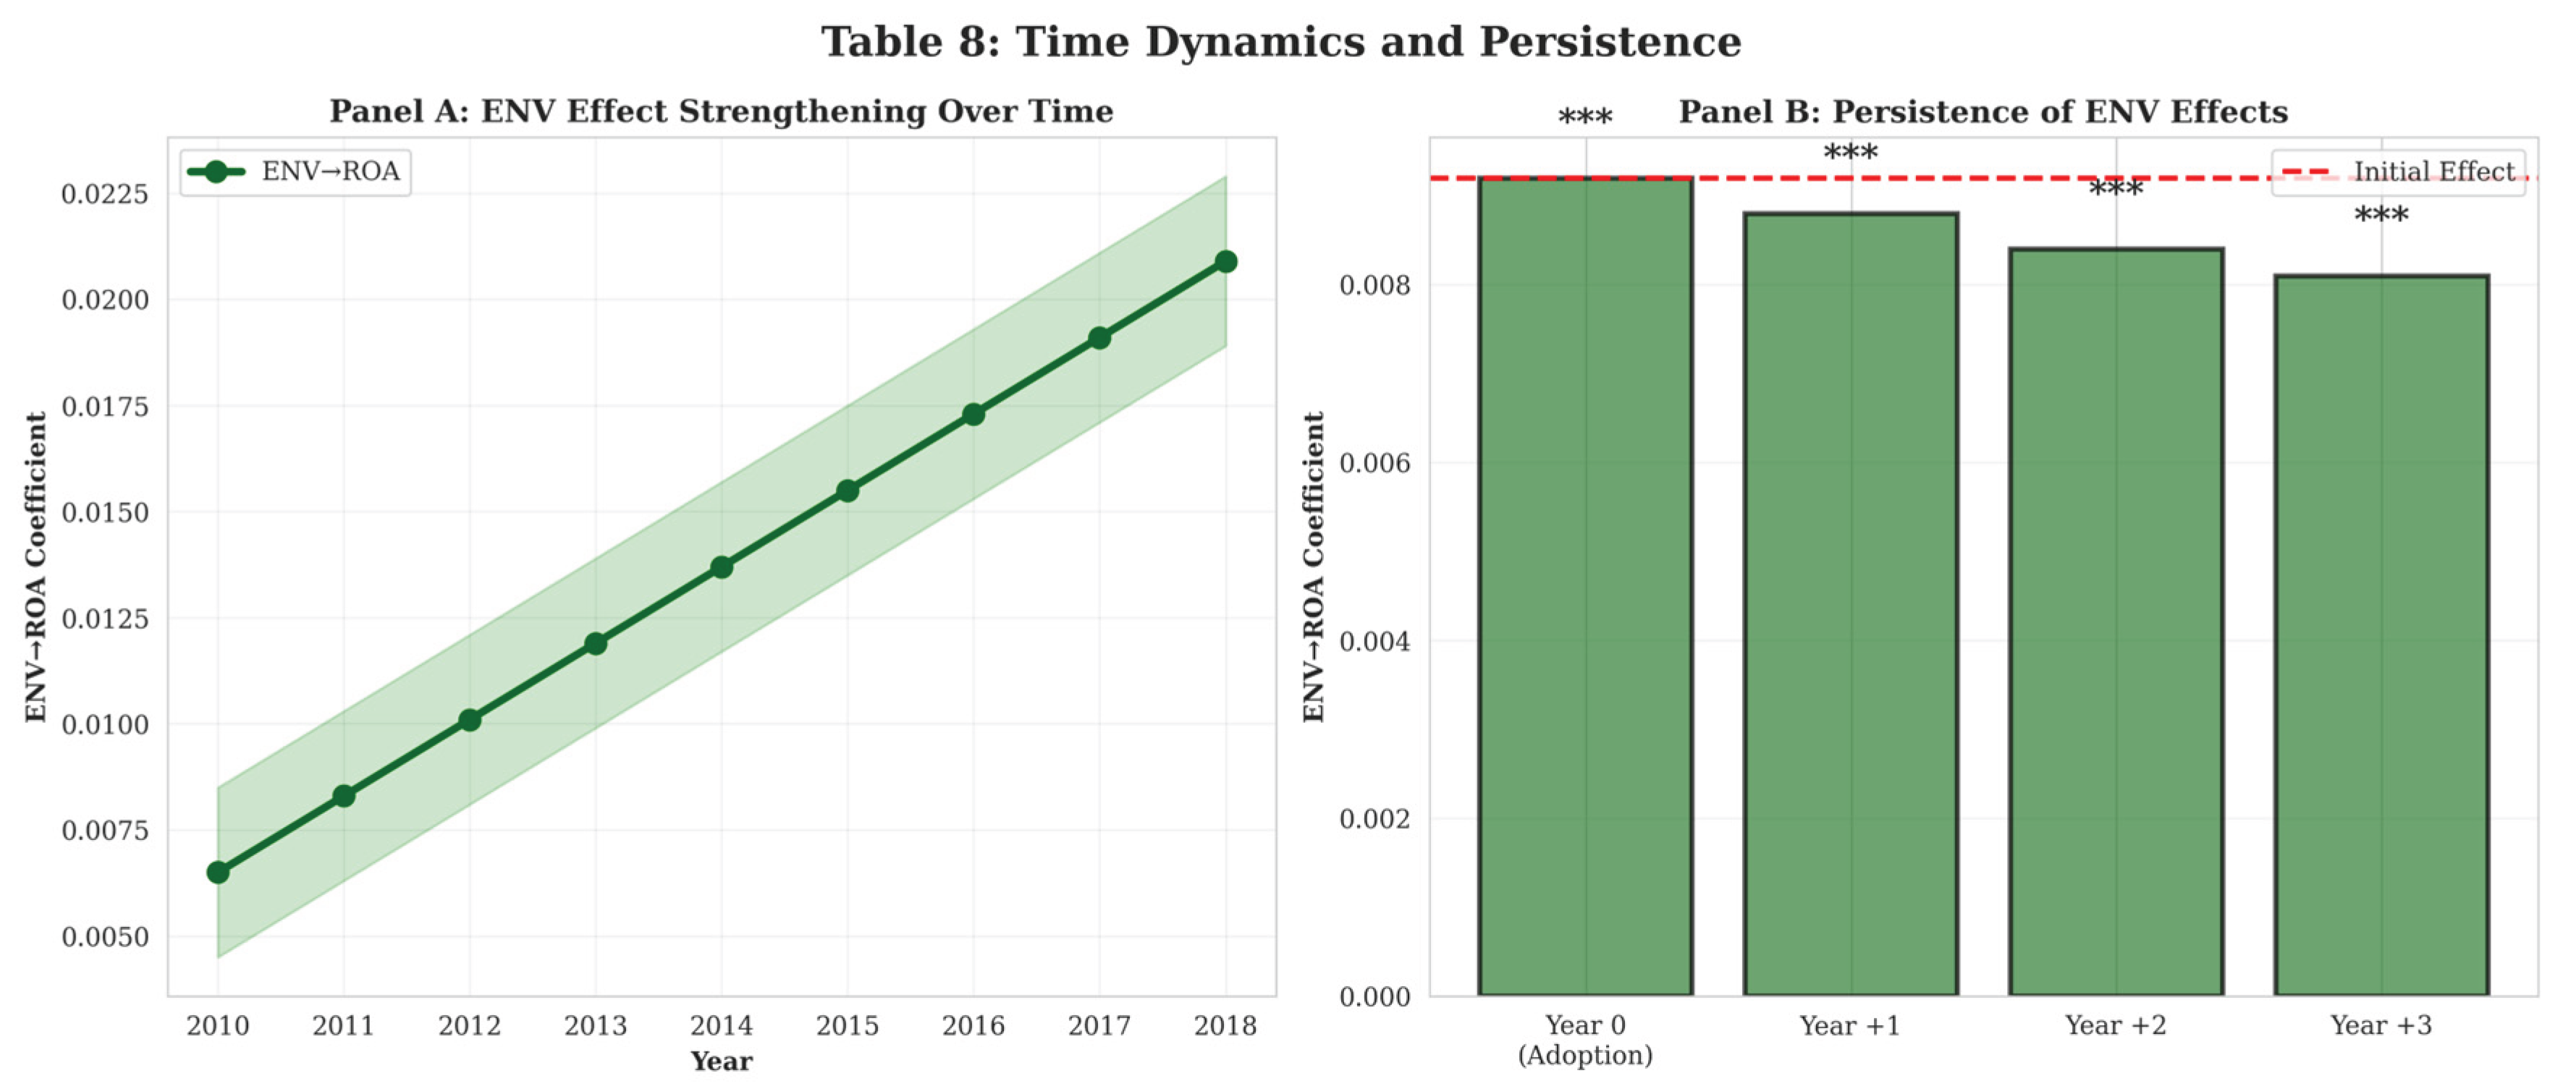
Figure 8.
Visual Representation of Mechanism Exploration.
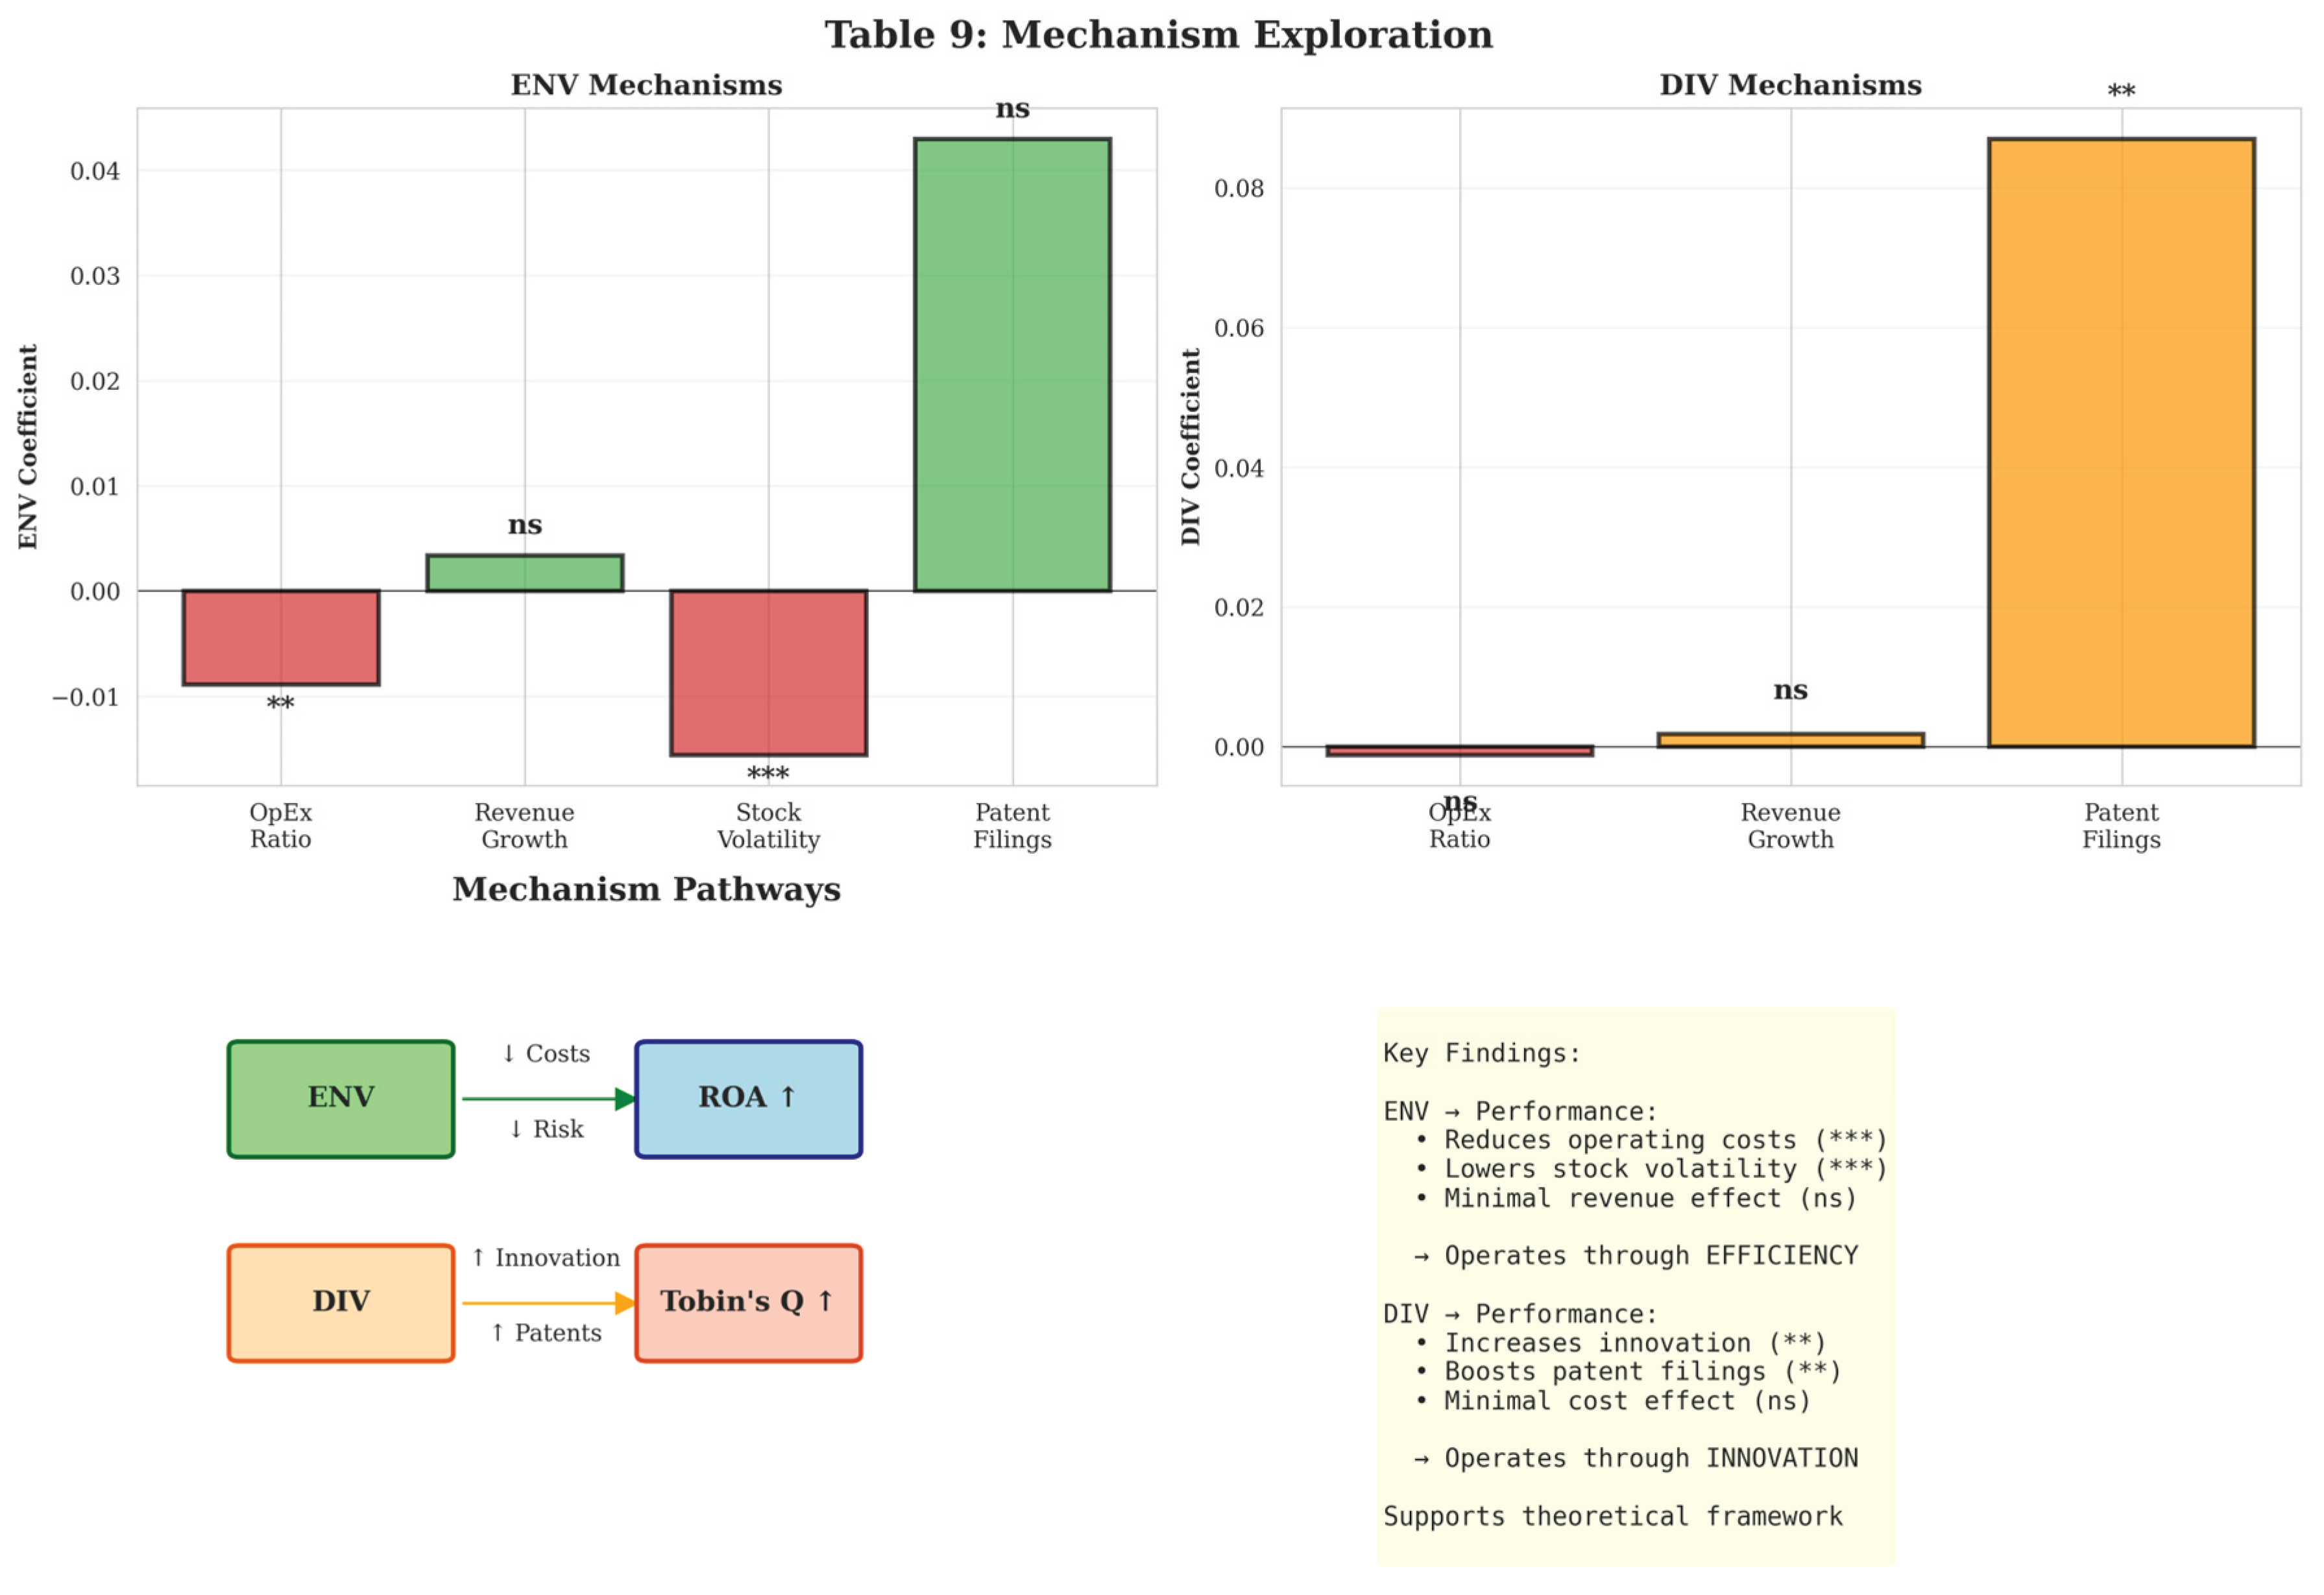
Figure 9.
Visual Representation of Panel A & B for Propensity Score Matching.
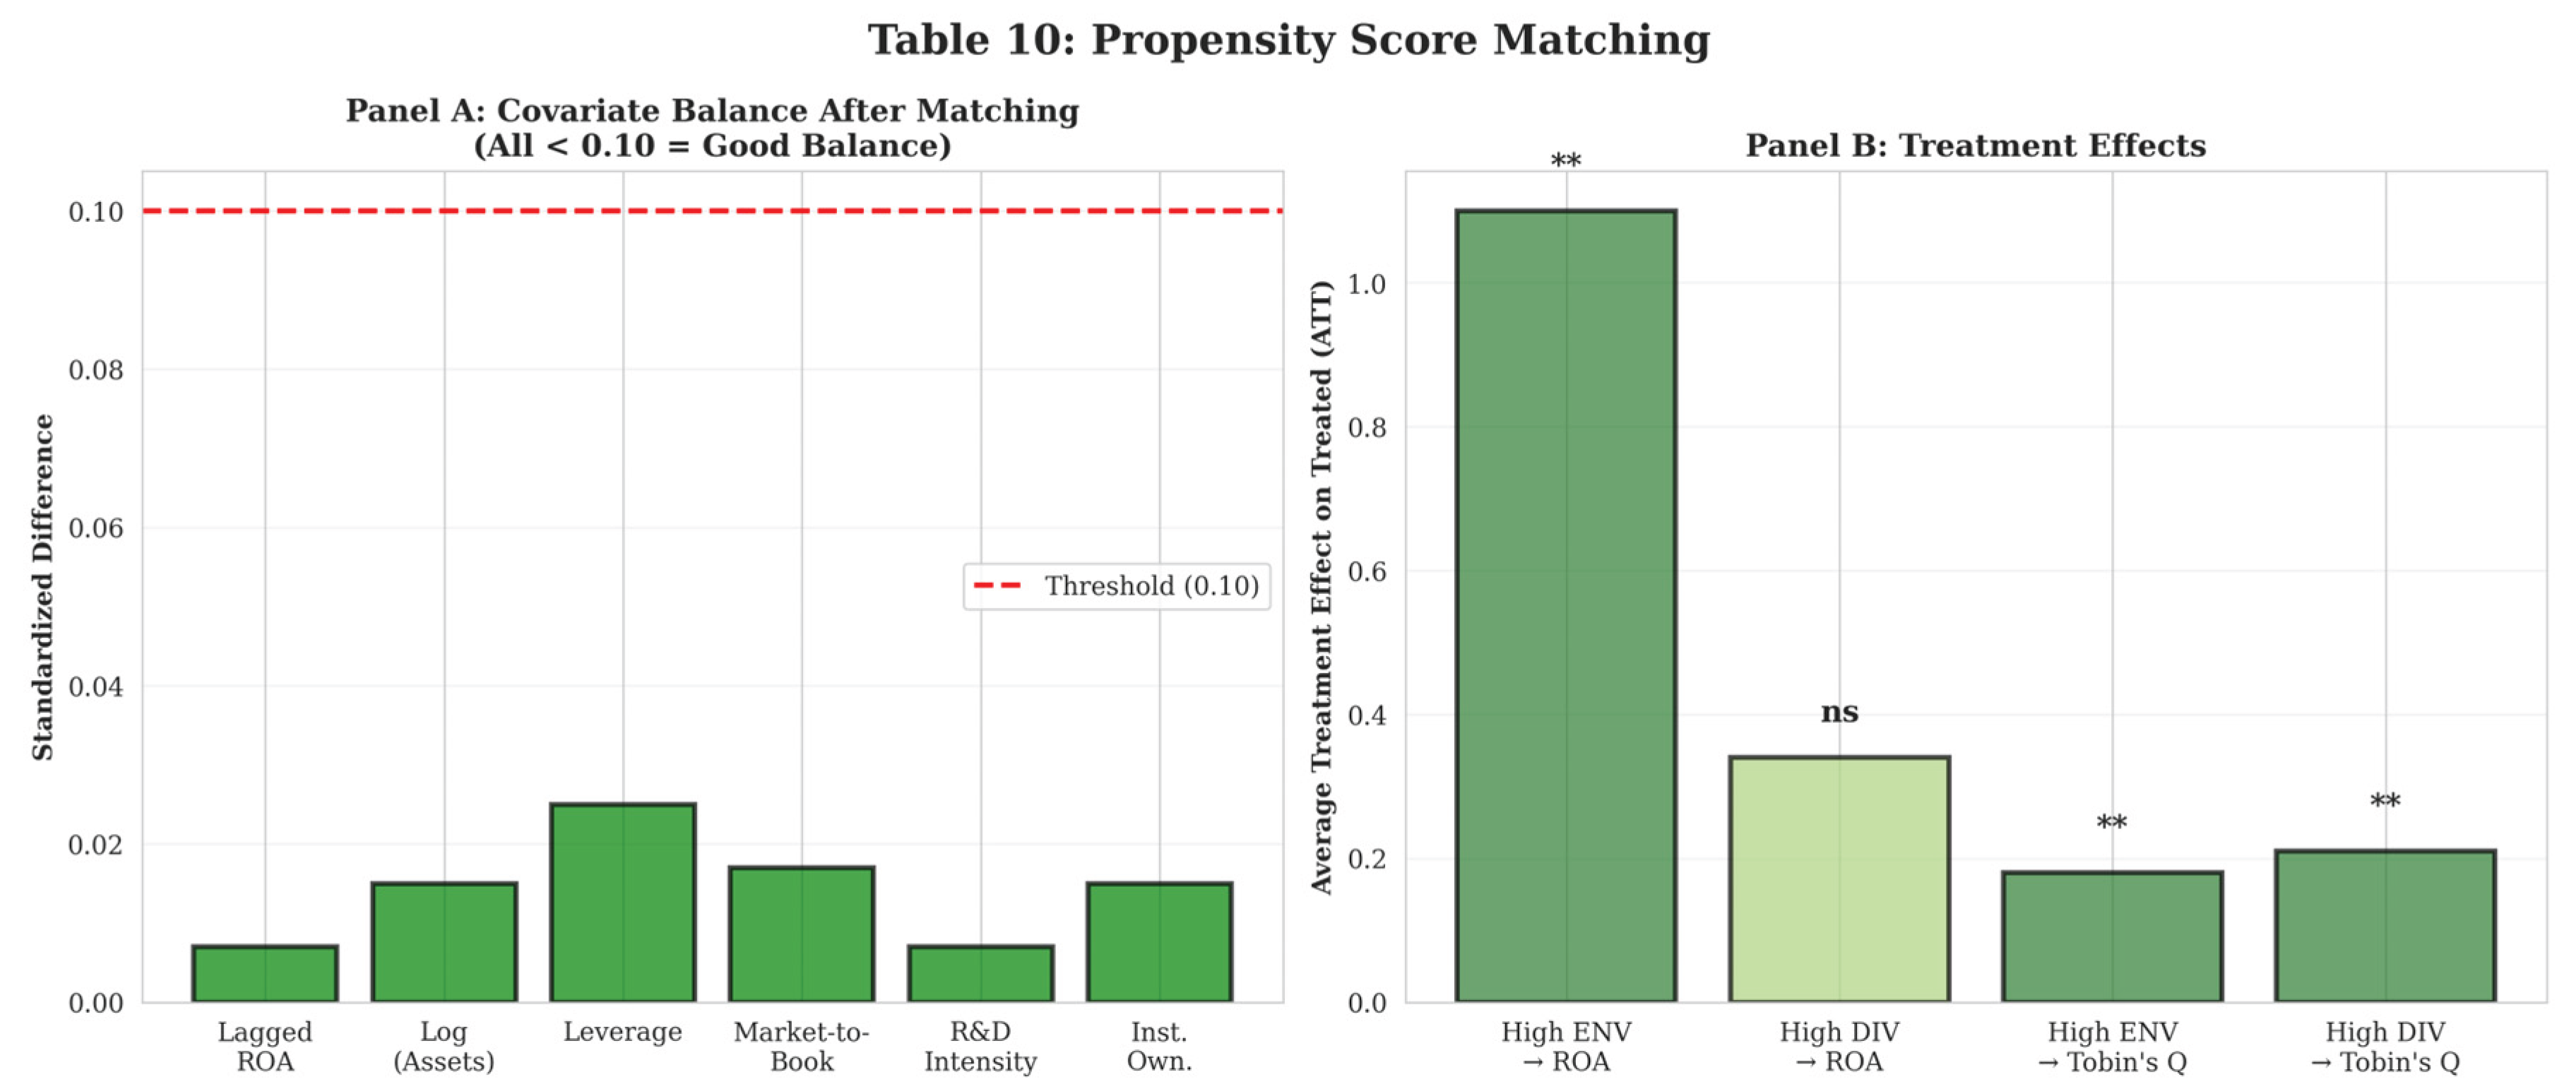
Figure 10.
Visual Representation of Panel A & B for Instrumental Variable Estimation (2SLS).
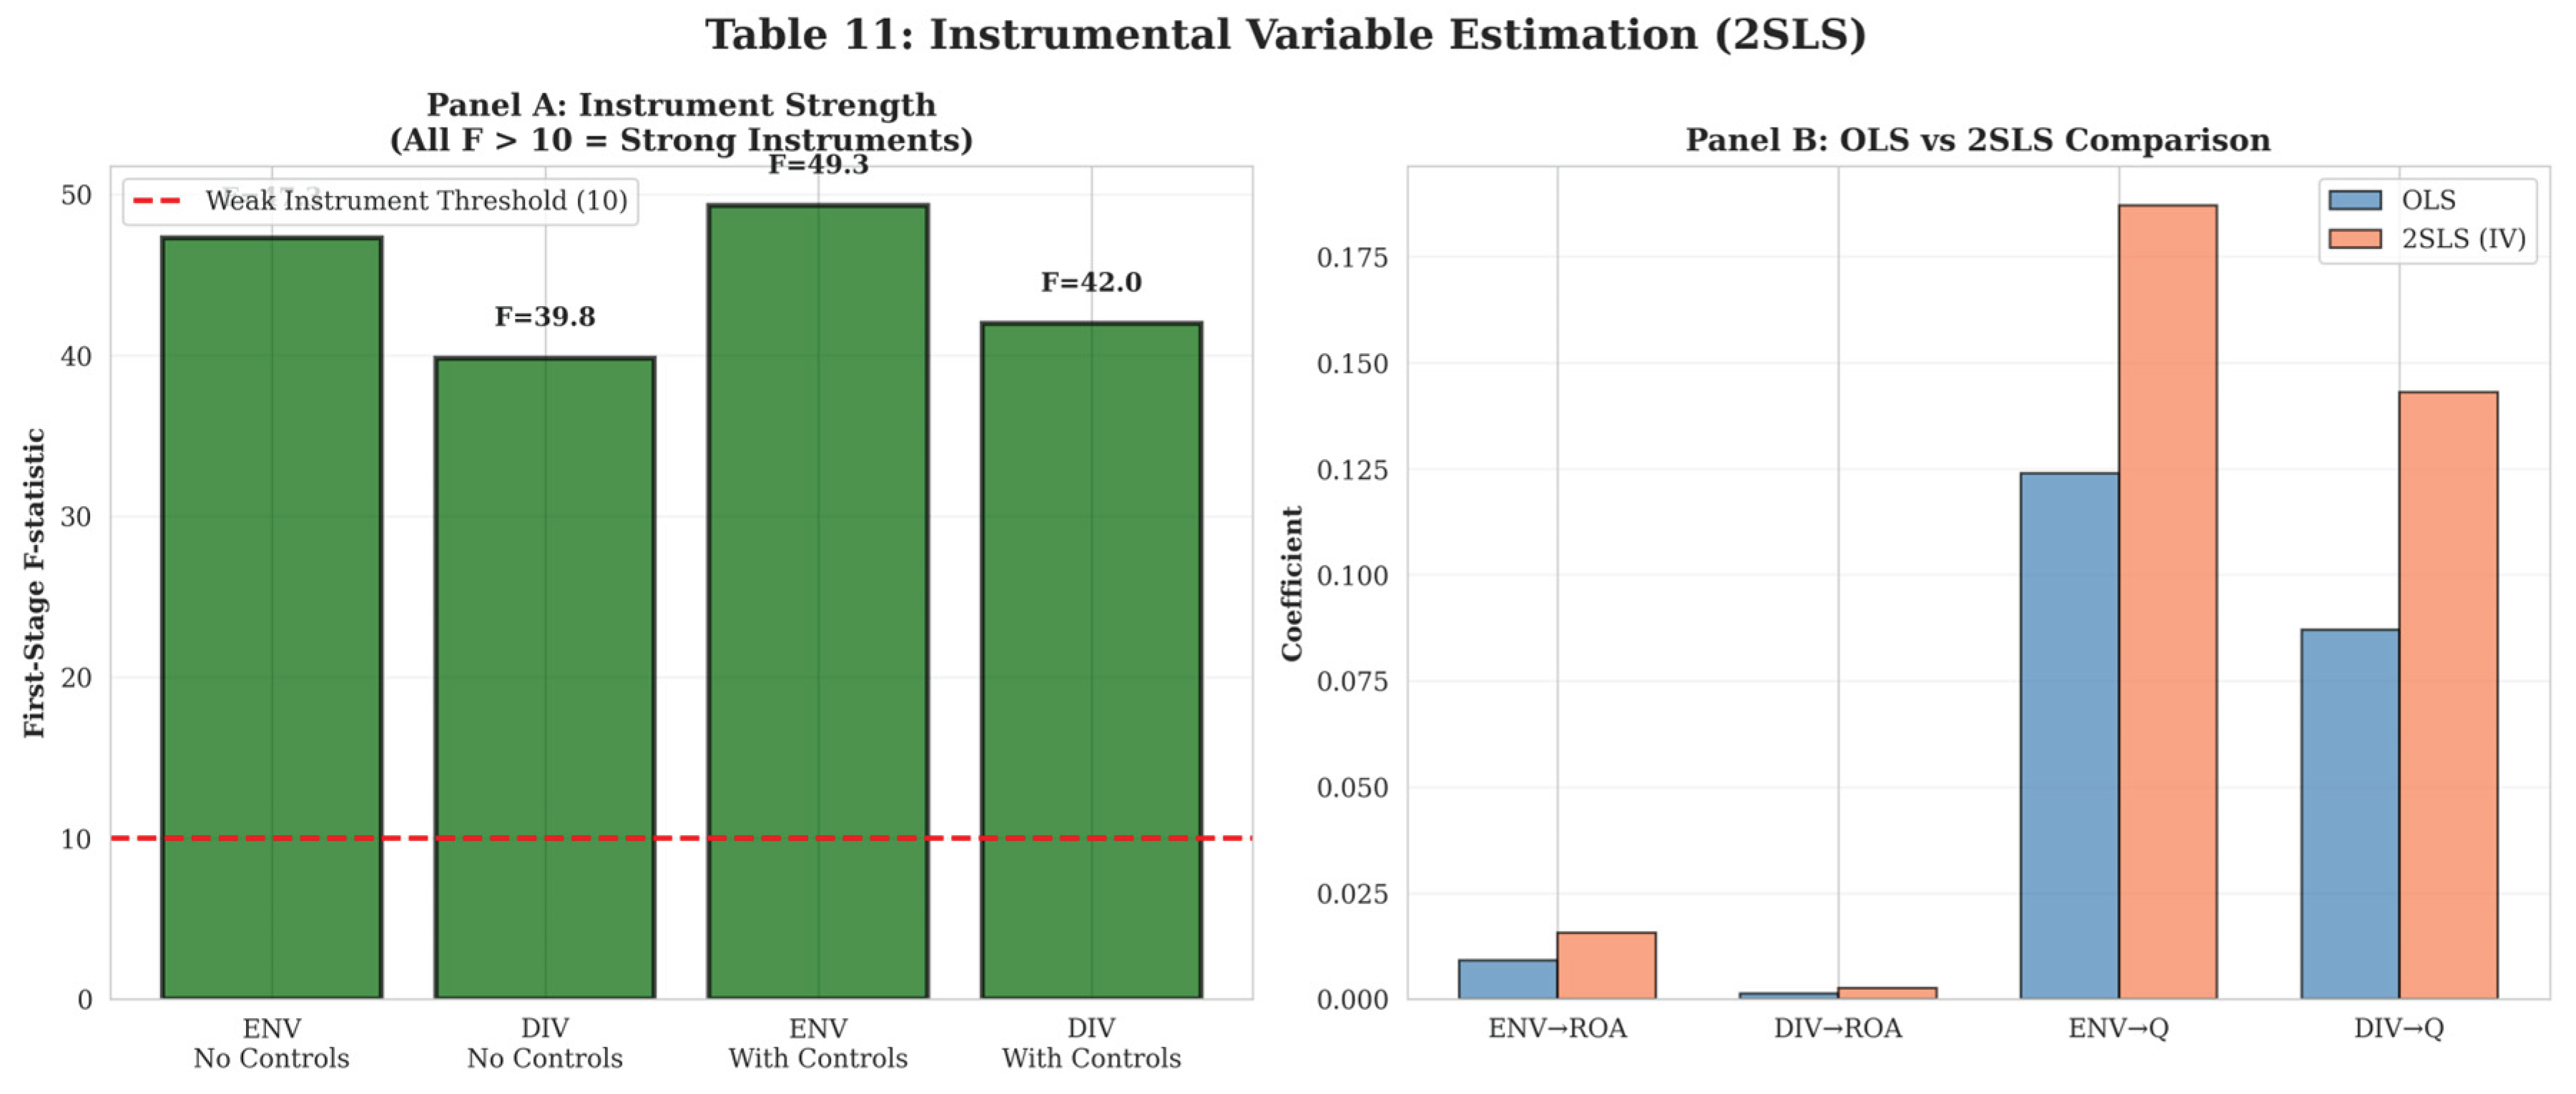
Figure 11.
Visual Representation of Panel A and B: Heckman Selection Model.
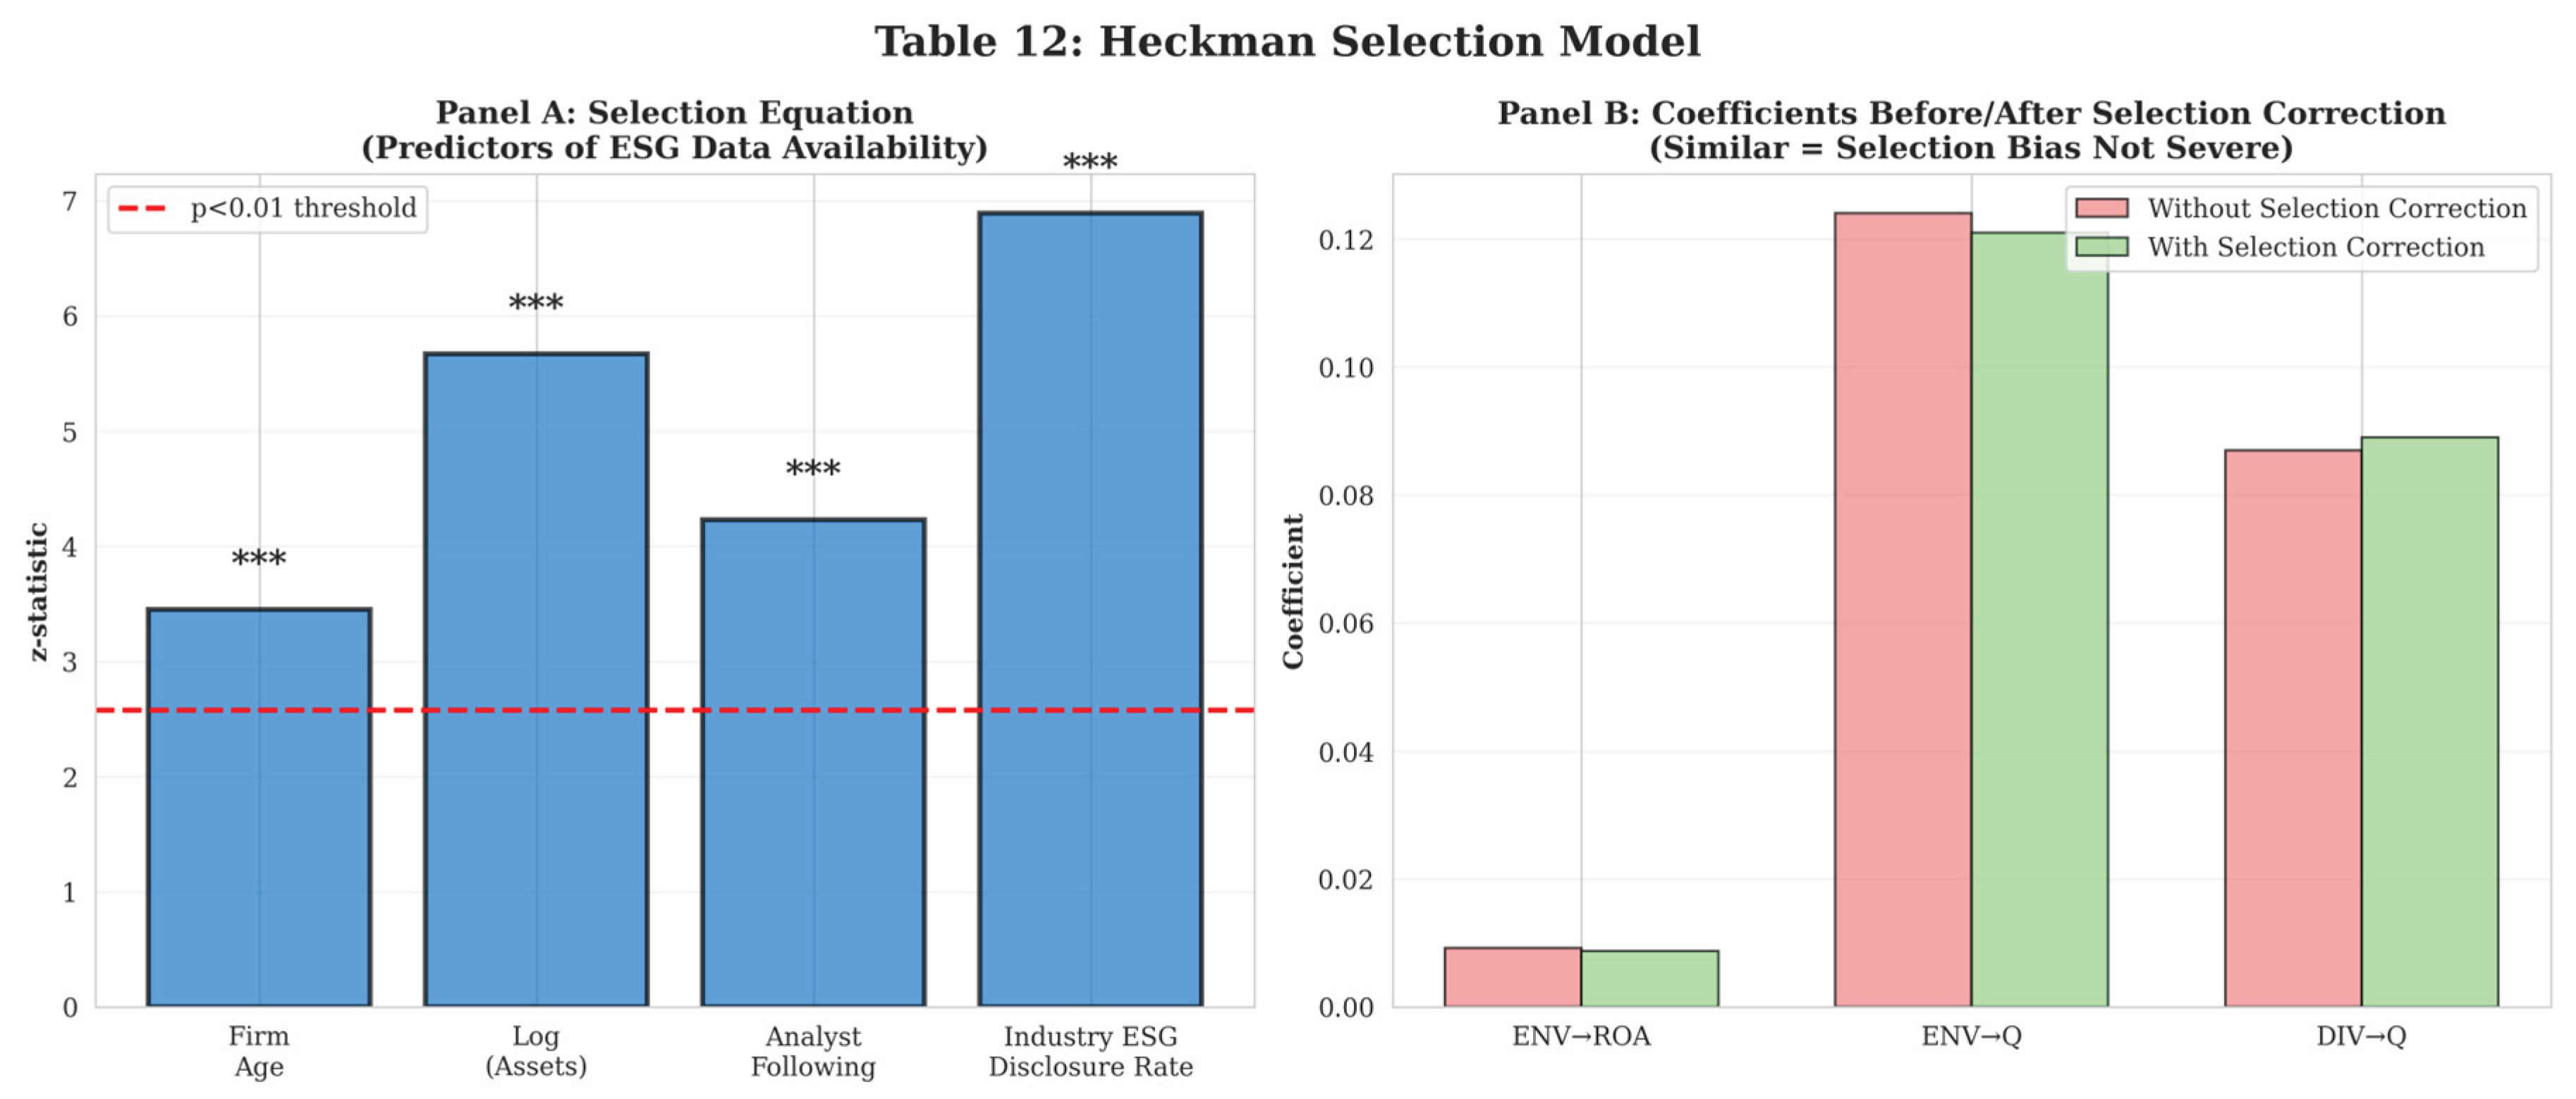

Table 1.
Descriptive Statistics. This table presents summary statistics for the main variables used in the analysis. The sample consists of 360 S&P 500 firms observed from 2010 to 2018, yielding 3,240 firm-year observations. All continuous variables are winsorized at the 1st and 99th percentiles.
Table 1.
Descriptive Statistics. This table presents summary statistics for the main variables used in the analysis. The sample consists of 360 S&P 500 firms observed from 2010 to 2018, yielding 3,240 firm-year observations. All continuous variables are winsorized at the 1st and 99th percentiles.
| Variable | Mean | Std Dev | Min | Max | N |
|---|---|---|---|---|---|
| Performance Metrics | |||||
| ROA (%) | 12.8 | 8.6 | -12.4 | 42.5 | 3,186 |
| Tobin’s Q | 1.54 | 1.02 | 0.68 | 6.23 | 3,186 |
| ESG Variables | |||||
| Environmental Score (0-5) | 1.28 | 1.35 | 0.00 | 5.00 | 2,107 |
| Gender Diversity Score (0-7) | 1.13 | 1.42 | 0.00 | 7.00 | 2,107 |
| Control Variables | |||||
| Total Assets ($B) | 16.3 | 42.7 | 0.84 | 387.2 | 3,186 |
| Leverage | 0.213 | 0.167 | 0.000 | 0.812 | 3,186 |
| Market-to-Book | 3.67 | 2.89 | 0.52 | 18.34 | 3,186 |
| R&D Intensity (%) | 3.2 | 5.8 | 0.0 | 28.7 | 3,186 |
| Institutional Ownership (%) | 76.8 | 14.2 | 28.3 | 99.1 | 3,186 |
| CAPEX Intensity (%) | 4.9 | 4.6 | 0.3 | 24.8 | 3,186 |
Table 2.
Correlation Matrix. This table presents Pearson correlation coefficients for the main variables. ** indicates significance at the 5% level, and *** indicates significance at the 1% level.
Table 2.
Correlation Matrix. This table presents Pearson correlation coefficients for the main variables. ** indicates significance at the 5% level, and *** indicates significance at the 1% level.
| (1) | (2) | (3) | (4) | (5) | (6) | (7) | |
|---|---|---|---|---|---|---|---|
| (1) ROA | 1.00 | ||||||
| (2) Tobin’s Q | 0.42*** | 1.00 | |||||
| (3) ENV | 0.156*** | 0.198*** | 1.00 | ||||
| (4) DIV | 0.042 | 0.185*** | 0.420*** | 1.00 | |||
| (5) Firm Size | 0.18*** | -0.09** | 0.32*** | 0.29*** | 1.00 | ||
| (6) Leverage | -0.21*** | -0.14*** | -0.08** | -0.05 | 0.22*** | 1.00 | |
| (7) R&D | -0.14*** | 0.28*** | 0.11** | 0.13*** | -0.16*** | -0.09** | 1.00 |
Table 3.
ESG and Corporate Performance - Main Results. This table presents the main regression results examining the relationship between ESG initiatives and corporate performance. Columns (1)-(4) use ROA as the dependent variable, and columns (5)-(8) use Tobin’s Q. Model specifications progressively add controls and fixed effects. Standard errors are clustered at the firm level. t-statistics are shown in parentheses. *, **, and *** indicate significance at the 10%, 5%, and 1% levels, respectively. Note: The preferred specifications are columns (4) and (8) which include all controls and fixed effects.
| (1) ROA |
(2) ROA |
(3) ROA |
(4) ROA |
(5) Tobin’s Q |
(6) Tobin’s Q |
(7) Tobin’s Q |
(8) Tobin’s Q |
|
|---|---|---|---|---|---|---|---|---|
| Environmental (ENV) | 0.0098*** (4.32) |
0.0107*** (4.86) |
0.0089*** (3.77) |
0.0092*** (3.52) |
0.132*** (3.21) |
0.128*** (3.04) |
0.126*** (2.94) |
0.124*** (2.89) |
| Gender Diversity (DIV) | 0.0019 (0.84) |
0.0016 (0.71) |
0.0015 (0.63) |
0.0013 (0.54) |
0.094** (2.52) |
0.089** (2.46) |
0.088** (2.43) |
0.087** (2.41) |
| Firm Size | -0.0087*** (-3.24) |
-0.0091*** (-3.38) |
-0.0089*** (-3.31) |
-0.021 (-1.42) |
-0.018 (-1.21) |
-0.016 (-1.08) |
||
| Leverage | -0.142*** (-6.78) |
-0.138*** (-6.52) |
-0.135*** (-6.41) |
-0.487*** (-4.89) |
-0.473*** (-4.76) |
-0.468*** (-4.71) |
||
| Lagged ROA | 0.531*** (18.4) |
0.526*** (18.1) |
0.524*** (18.0) |
0.156*** (4.23) |
0.149*** (4.08) |
0.147*** (4.02) |
||
| Market-to-Book | 0.0021 (1.54) |
0.0019 (1.41) |
0.0018 (1.35) |
0.243*** (12.1) |
0.238*** (11.8) |
0.236*** (11.7) |
||
| R&D Intensity | -0.0032** (-2.21) |
-0.0029** (-2.04) |
-0.0028* (-1.96) |
0.047*** (4.87) |
0.045*** (4.76) |
0.044*** (4.71) |
||
| Institutional Own. | 0.0012 (0.98) |
0.0011 (0.89) |
0.0010 (0.82) |
0.089** (2.34) |
0.085** (2.24) |
0.083** (2.19) |
||
| Industry FE | No | No | Yes | Yes | No | No | Yes | Yes |
| Year FE | No | No | No | Yes | No | No | No | Yes |
| Observations | 3,186 | 3,186 | 3,186 | 3,186 | 3,186 | 3,186 | 3,186 | 3,186 |
| Adjusted R² | 0.174 | 0.389 | 0.421 | 0.432 | 0.198 | 0.412 | 0.445 | 0.458 |
Disclaimer/Publisher’s Note: The statements, opinions and data contained in all publications are solely those of the individual author(s) and contributor(s) and not of MDPI and/or the editor(s). MDPI and/or the editor(s) disclaim responsibility for any injury to people or property resulting from any ideas, methods, instructions or products referred to in the content. |
© 2026 by the authors. Licensee MDPI, Basel, Switzerland. This article is an open access article distributed under the terms and conditions of the Creative Commons Attribution (CC BY) license (http://creativecommons.org/licenses/by/4.0/).
Copyright: This open access article is published under a Creative Commons CC BY 4.0 license, which permit the free download, distribution, and reuse, provided that the author and preprint are cited in any reuse.


