
Submitted:
11 February 2026
Posted:
11 February 2026
You are already at the latest version
Abstract
The problem of environmental pollution due to emissions of carbon monoxide, sulfur, or dust is not only ecological, but also economic in nature — losses from environmental degradation impact nearly all aspects of life. Monitoring of positive changes resulting from research and corrective actions seems appropriate in terms of their use and optimization. In this article, the goal is to identify the periodic and seasonal fluctuations in pollutant emissions and their corresponding levels over 10 years. Częstochowa, a medium-sized town in the Silesian Voivodeship of Poland, was used as a research area. It is assumed that the changes – reducing emissions-are the result, among other things, of environmental actions of local governments. The study utilized data from a measurement station located in the city center and employed statistical analysis and econometric modeling to analyze the data. The results show statistically significant differences in weekly and monthly emissions, as well as their constant limitation.
Keywords:
sulfur oxides
; carbon dioxide
; suspended dust
; emission reduction
; environmental management
1. Introduction
Air pollution is one of the most significant environmental issues in the modern world. It affects almost every geographical area, with the highest incidence generally found among the most urbanized. With the development of the economy and the emergence of amenities for residents' lives, pollution appears as a side effect, and these are essentially those that we cannot directly verify the existence of. Among the many substances released into the atmosphere, sulfur oxides (SOₒ), carbon dioxide, and suspended dust occupy a special place due to their negative impact on ecosystems, climate, and human health. Some of them are formed not only as a result of burning fossil fuels and industrial processes, but also naturally, through events such as volcanic eruptions or animal emissions. These pollutants, although they move to some extent, even over long distances, nevertheless interact to the greatest extent in the place of their formation. For this reason, from the perspective of local policy and environmental management, measures to reduce these emissions are crucial.
As the economy grows and demand for electricity increases, the level of pollutants generated during energy production also increases [1]. The identification of this problem has led to some policy changes in the international arena, albeit not yet to a significant extent, but to some coordinated actions to reduce emissions in the absence of curbing economic growth [2]. Overall, economic growth is associated with increased emissions of pollutants; however, recent studies, particularly in specific sectors [3], have shown this to be especially true. Thus, it is possible to direct appropriate actions and strategies to optimize and minimize the environmental burden. In this regard, decision-makers can positively influence society and the economy through effective management, organizational, and legislative actions.
2. Pollution Standards in Response to Rising Pollution Emissions
Among the previously mentioned pollutants, sulfur oxides take the place of those whose emissions are dependent on human activities. The burning of coal, oil, and other fossil fuels is a significant source of SO₂ emissions. Energy, metallurgy, and cement production are particularly problematic. In addition to anthropogenic sources, natural sources of emissions include volcanic eruptions, which can emit large amounts of SO₂ in a short period. Sulfur oxides in the atmosphere undergo complex chemical reactions leading to the formation of sulfuric acid (HSso₄). This is the primary cause of acid rain, which has a devastating impact on soils, surface water, plants, and buildings. Long-term exposure to acid rain on the soil leads to disruption of water relations, and due to acidification, the development of algae, which often deplete oxygen in lakes, causing the death of fauna. For the flora, this causes leaf damage, suppression of photosynthesis, and weakening of trees. so₂ can also contribute to the formation of sulfate aerosols, which affect the Earth's albedo by lowering the air temperature. As for infrastructure, it negatively affects buildings and structures made with lime components.
Carbon dioxide (CO₂) is one of the primary greenhouse gases contributing to global warming and climate change. In cities, its emissions are particularly high due to the high population density, developed transport infrastructure, and intensive industrial and energy activities [4]. Retention of the sun's CO2 rays, which causes an increase in temperature, destabilizes the established situation on the planet. At the local level, it affects health; its high concentrations in the atmosphere contribute to the formation of urban heat islands, which can lead to an increase in the incidence of respiratory and cardiovascular diseases. And here we move on to the other contamination mentioned – suspended dust. In the image under study, we analyze PM10 dust, consisting of particles with a diameter of no more than 10 micrometers, which are small enough to enter the respiratory system and cause various health problems. The primary sources of human production are:
* burning of fossil fuels (especially in high-emission power plants and household stoves),
* transport emissions (car exhaust, tire, and road surface abrasion) [5],
* industry (metallurgy, cement plants, production facilities),
* construction and agriculture (raising dust during earthworks and field cultivation).
The direct effect of suspended dust emissions is an increase in the incidence of lung diseases and chronic obstructive pulmonary disease (COPD).
Each of the mentioned pollutants harms a person, the closer the emission point is to the person's place of residence, and the greater the density of these points. In economic terms, this leads to a decrease in agricultural and water resource productivity, which directly affects income from the farming sector and tourism, as well as resource security. In connection with the above, it became necessary, along with eliminating negative consequences and preventing them, to control the situation. For this purpose, measuring stations are used, which are located almost all over the world and in most urban agglomerations. Due to the different data collection method and measurement range, the current study was limited to the measuring station in Częstochowa, at the central point. The station has been operating for several years and collects data on emissions of nitric oxide, nitrogen oxides, carbon dioxide, and sulfur oxides at different frequencies.
Measures to reduce emissions are also of an organizational and strategic nature, which does not detract from their effectiveness [6]. This may relate, for example, to traffic control and various exhaust emissions resulting from vehicle loads [7]. Due to the threat to humanity, several programs and documents aimed at reducing exhaust gas emissions and air pollution have been implemented in Europe and Poland:
Directive 2016/2284 of the European Parliament and of the Council of 14 December 2016 aimed at reducing national emissions of certain types of atmospheric pollutants. The Directive obliges Member States to limit emissions of major air pollutants, such as nitrogen oxides (NOx), sulfur dioxide (SO₂), ammonia (NH₃), volatile organic compounds (NMVOC), and particulate matter (PM2.5).
Vehicle exhaust emission standards (Euro 1-6) have been introduced to reduce emissions of pollutants from road transport. As a result of specific actions, several directives have been adopted that define acceptable emission levels for various categories of vehicles, including passenger cars, light commercial vehicles, trucks, buses, and motorcycles. The current Euro 6 standard sets emission limits for substances such as nitrogen oxides and particulate matter. In terms of vehicle exhaust emissions, given that it is almost impossible to replace them quickly, several measures have been taken to reduce their impact. It turns out that with quite large success rates [8].
In Poland, a National Program for Air Conservation is planned until 2020 (with a view to 2030), aimed at improving the air quality in Poland by reducing emissions of pollutants. This program involves the implementation of activities in three time horizons: short-term (until 2018), medium-term (until 2020), and long-term (until 2030). Activities include m.in. reducing emissions from the housing and utilities sector, as well as transport and industry [9].
Another document defining environmental policy in Poland was the National Energy and Climate Plan for 2021-2030, which aimed to achieve climate goals and improve air quality in Poland, primarily by increasing the share of renewable energy sources and enhancing energy efficiency.
Of course, the simple adoption of individual programs without their implementation does not contribute anything to the environmental situation. Programs should be followed by concrete actions and measures necessary for their implementation [10]. Monitoring of exhaust gas emissions after the implementation of specific programs, such as those in the United States, has shown clearly positive results [11]. It is important to note that there are developments that indicate the viability of the activity. This is due to the lower costs of reducing emissions compared to the costs of addressing their effects on public health, soil quality, and agricultural production, as well as the benefits of reduced emissions.
To reduce the level of suspended dust, it is necessary to implement effective strategies, such as:
* improving filtration technologies in industrial plants,
* restriction of gas transportation in favor of public transport and bicycle transport,
* use of renewable energy sources,
* urban greening and the use of plants to absorb pollutants.
Studies conducted in different regions of the world show that vehicles are among the largest emitters of pollutants in cities [12], but at the same time, their emissions can be reduced through coordinated actions [13]. Modern technologies are often developed and monitored today in terms of potential exhaust emissions [14]. This applies not only to car exhaust gases, but also to methods that are considered environmentally friendly, such as energy production. Interestingly, even when burning biomass and other CO2-emitting fuels, it is possible to significantly reduce emissions with the right materials [15].
3. Measures to Reduce Pollution on Local Land
At the local level, caring for the community is one of the primary responsibilities of local authorities. In the European Union, where considerable attention is paid to decentralization and support for regions and their self-determination, this is all the more evident. Against this background, we studied the northern part of the Silesian Voivodeship, specifically the capital of the microregion, Częstochowa. The Silesian Voivodeship is one of the most polluted regions in Europe. Due to its industrial character, the area's industry includes mines, power plants, and steel mills. Some cities in the region annually occupy Inglorious places among the most polluted not only in Poland, but also in Europe.
Of the 50 cities most polluted with PM2.5 dust in Europe identified by the WHO, 21 are located in Poland (up from 36 three years ago), and 14 are in the Silesian Voivodeship. In turn, a study by the European Environment Agency on PM2.5 fine dust pollution .5 in the period from 2021 to 2022, indicates 12 cities (Figure 1), 10 out of 20, with Czestochowa ranked 13th (www.eea.europa.eu). Moreover, it seems appropriate to consider this object as a research area.
Source: https://www.eea.europa.eu/en/topics/in-depth/air-pollution/european-city-air-quality-viewer [1-10-2025]
To reduce carbon dioxide emissions in cities, including Częstochowa, it is proposed to take the following measures:
- Public transport development, including investments in eco-friendly electric buses, trams, and urban railways, reduces CO₂ emissions. In the fleet of 132 vehicles of the Czestochowa Municipal Transport Enterprise in 2023, 44 buses with non–internal combustion engines had already traveled: 20 with electric, 15 with hybrid, and 9 with a CNG engine (that is, with compressed natural gas). In 2025, a contract was signed for the purchase of 10 more articulated electric buses. The system comprises three daily city tram lines, 26 daily city bus lines, eight daily commuter bus lines, and 1 night city bus route. Apart from the commissioning of the third tram line a few years ago, the number of routes served has been constant for 20 years.
- Promoting bicycle and pedestrian transportation by building infrastructure for cyclists and pedestrians can reduce their reliance on internal combustion vehicles. In 2000, Czestochowa had only 13 km of bike paths; currently, it has 105 km of them. In addition, they were linked to tourist bike routes throughout the City.
- Renewable energy investments in solar, wind, and geothermal energy reduce the need for fossil fuels. Most of the activities in this area are supra-regional in nature.
- Energy efficiency in buildings, through thermal modernization, improved insulation, and the use of modern heating systems, can reduce energy consumption and, consequently, environmental pollution [16]. The City is actively involved in various local and central programs to support the modernization of thermal systems and the development of zero-emission buildings.
- Urban greening-Planting trees and creating green areas helps absorb CO₂ and reduces the urban heat island effect. In the City, green areas (forests and parks) account for only 5%, and with the prevailing demand for residential areas, it is difficult to predict the growth of this indicator.
- A circular economy, where materials are recycled and reused, reduces the consumption of raw materials and the CO₂ emissions associated with their processing. Like other cities in Poland, Częstochowa implements government and EU strategies for achieving a circular economy [17].
Regarding these opportunities, the paper demonstrates their impact on reducing pollution from 2015 to 2024. The data for the article was obtained from the website: https://powietrze.gios.gov.pl/pjp/current [1-10-2025].
Figure 2 shows the average hourly emissions of nitrogen oxides in Częstochowa in 2015 and 2024. On each of the days studied, we observe two peaks of emissions - morning and afternoon, more pronounced on working days and significantly weaker on Saturdays and Sundays. Although the cyclicity itself is close, all levels in 2024 are lower than in 2015. The decrease is from 1.9% to 84.1%. On average, they accounted for more than 40%, allowing us to discuss the actual reduction in nitrogen oxide emissions during the studied years. The most significant reduction occurs during daytime peaks on weekdays, as well as on Saturday and Sunday mornings, during sewing.
In most cases, PM 10 particulate matter emissions were reduced (Figure 3). On average, this is 29.5%. Unfortunately, there are also periods (usually 0 hours) with a higher intensity of dust precipitation. We see the most significant decrease on Thursdays and Fridays, and the largest increase (although minimal and not all-day) on Sundays. Recent studies aimed at monitoring and predicting dust deposition have indicated the likely shape of the distribution of pollution levels and their dynamic changes [18]. In the future, the information could be used practically.
In terms of carbon dioxide emissions, we see (Figure 4) a decrease; however, the rate of decline has been less impressive in recent years, with the average amount of CO2 emissions decreasing by 22%. Obviously, this is noticeable on Friday. We see no changes (growth of less than 1.5%), only on Wednesday at 15/16.
4. Pollution Models for the City of Częstochowa
During the study, three models were proposed that account for the temporal structure of pollution data. This recognition is one of those considered earlier, with the assumption that it captures either cycles of varying severity or differences in the level of the phenomenon under study at different specific periods [19]. NO, CO2, and PM10 dust were proposed as explained-endogenous (Y). The independent variables in the models were originally the same set.
where:
Y = a0 + a1AD +a2AW +a3M +a4DW +a5H +a6SUN +…+ a12SAT +
+ a13JAN +…+a24DEC +a25Z0 +…+ a48Z23 + є,
AD - another day (1-3806)
AW – another week (1-544)
M – month (1-12)
DW – day of week (1-7)
H – hour (0-23)
SUN, MON, … SAT- zero-one variables taking one on a given day of the week
JAN, FEB…DEC - zero-one variables taking one in a given month of the year
Z0, Z1, … Z23 - zero-one variables taking one at a given hour of the day.
The results obtained for models (Table 1) that show changes in CO2 and other pollutants over time, excluding the effects of days of the week, consecutive months or weeks, clearly indicate that:
- hour by hour during the day (theoretically), CO2 emissions are reduced by 0.002 units,
- from January to March, due to weather factors, CO2 emissions are higher, and from May to September, lower than the average for the year,
- from Monday to Thursday, CO2 emissions are lower than the average for the week,
- at 20-23 hours, CO2 emissions are higher than at other hours
- overnight, CO2 emissions are theoretically reduced by 0.029 units.
For nitrogen oxides:
- hour per hour during the day (theoretically) NO emissions are reduced by 0.292 units,
- from January to September, due to weather factors, NO emissions are lower than the annual average,
- at 18-0 and 5-9 hours, NO emissions are higher than during other hours,
- from Monday to Thursday, the output will be lower than the weekly average,
- overnight, NO emissions are theoretically reduced by 8,415 units.
As for PM10:
- from January to March, due to weather factors, PM10 emissions are higher, and from May to October, lower than the average for the year,
- in the hours of 21-23, PM10 emissions are higher than in other hours,
- from Monday to Thursday, PM10 emissions are lower than the weekly average,
- hour by hour during the day (theoretically), PM10 emissions are reduced by 0.097 units,
- overnight, CO2 emissions are theoretically reduced by 3,074 units.
The results obtained significantly help decision-makers introduce incentives for actions to reduce emissions on specific days or months. Taking into account some seasonality (also confirmed in other studies for other areas [20]) is essential and valuable. After a period of stable abatement of excess emissions, it is now possible, with some savings on limited resources, to aim to reduce emissions in specific periods.
Similar comparison studies have also been conducted for several other locations regarding nitrogen oxide admixtures. Two measuring stations were considered in Katowice (Kossuth, Plebiscitowa), one in Sosnowiec, and several other cities outside the Silesian Voivodeship. In all directions, the changes were very similar, with varying intensities of exposure on specific months or days. The exception is Sosnovets. Here, from January to June, there was neither a decrease in the average annual indicators nor growth. This situation, in the case of Sosnovets, is not an isolated observation [21]. Sosnowiec is the closest to Częstochowa in size and the closest City in the voivodeship (with similar potential). Moreover, environmental activities in Częstochowa are clearly going in a better direction. In addition, it is worth noting that the estimates of changes (drops) in emissions in January-February in Częstochowa were the highest among the respondents, which is understandable. In the following months, higher drops were recorded only at the Katowice – Plebiscitowa station.
5. Discussion
In the presented studies, several pollutant emissions were analyzed. However, omitting any of the measures is not a big mistake, because the links between pollutants (especially particulate matter of different densities) are so strong that some of them are pretty good approximations of other [22]. For example, the analyzed factor (PM10) is a key factor from the perspective of residents' health; hence, its reduction is of great importance for residents' health and, at the same time, for health care costs [23]. Numerical estimates indicate a potential reduction in mortality from reduced PM2.5 and NO2 levels. These studies draw attention to the importance of these reductions for countries such as Poland, the Czech Republic, or Italy [24] Studies confirm that even small adverse changes in pollutant concentrations can affect people's well-being [25], all the more so you can count on an improvement in this well-being along with a reduction in pollution (with the constancy of other conditions). Decision-makers encourage people to live in specific locations. At the same time, research shows that movement in 'fresh' air encourages movement. Meanwhile, exceeding emission standards also causes, as has been proven [26], the benefits of being and exercising outdoors under normal conditions to be nullified, and even to become risks. Therefore, any actions to reduce them deserve recognition.
In this paper, a stochastic model is proposed to study temporal changes. This allowed us to diagnose changes and draw certain conclusions for the future. The proposed model is only one of many [27,28] proposed solutions to support pro-environmental management by monitoring and reducing pollutants emitted into the atmosphere. Models that interact with AI [29] are increasingly used for this. The need to use science not only for urban and pro-environmental purposes but also for ecological ones has been recognized much earlier. Currently, research is carried out in almost all countries. Unfortunately, it is difficult to find universal models for the indicated problem [30]. Each city has unique conditions resulting from geographical and climatic factors, as well as legal, economic, and even cultural factors. While legal conditions can be solved from above (as has already been mentioned), cultural changes, as well as changes in habits – for example, the possibility of heating, cooking, and transport, have already been noticed [31] and are being exploited. Ecological issues postulated years ago are also being raised again. The momentum of permanent development has been somewhat stalled, among other things, thanks to long-term analyses that point to the need for sustainable development. The greening of cities, which has also begun to be implemented again in Poland, has been justified by detailed studies, for example, in relation to the direct reduction of CO2 emissions absorbed by pedestrians [32]. Solutions such as regreening cities also have a basis in the research results [33]. At the same time, we are observing an increasing awareness of the impact of air pollution on our lives, especially among city dwellers [34] directly exposed to it. This is noticeable both in smaller cities [35] and weaker economies [36], where particulate matter can be responsible for 20% of hospitalizations with lung ailments, but also unresolved in developed economies and metropolises [37]
6. Conclusions
We are seeing an increasing awareness among decision-makers, as well as consumers, of the consequences of environmental pollution and how it can be minimized through proper environmental management. Actions in this area – legislation – and the support of EU funds and national (as well as local) funds can accelerate the energy transition and, consequently, reduce emissions of harmful substances.
The presented results clearly indicate a long-term reduction in emissions of individual pollutants. In principle, this can be seen as systemic changes resulting from the actions of individual Governments and local authorities. The situation is improving compared to the one analyzed in previous periods [38]. This is probably due to the greater availability of external funds to co-finance changes. Knowledge of peak emissions in daily or monthly terms can also be important information for decision makers of various types and assumptions about the future implementation of regional policies. It is unclear whether the actions of local authorities are the primary reason for the changes, or whether they merely support or are part of the broader environmental action package. The fact is that the observed effects of reducing emissions are secondary in time to the actions taken. Some of the restrictions are also the result of increased public awareness and revenue growth (ecology is not cheap). Still, this awareness is also indirectly linked to decisions promoted by politicians. The changes, although not particularly dynamic, are sustainable and confirm the correct path of environmental management implemented at the local level.
Author Contributions
For research articles with several authors, a short paragraph specifying their individual contributions must be provided. The following statements should be used “Conceptualization, M.S. and M.Z.; methodology, M.S. and M.Z; software, M.S.; validation, M.S. and M.Z.; formal analysis, M.S.; investigation, M.S.; resources, M.S.; data curation, M.S.; writing—original draft preparation, M.S.; writing—review and editing, M.S. and M.Z; visualization, M.S.; supervision, M.S. and M.Z; project administration, M.S.; funding acquisition, M.S. and M.Z All authors have read and agreed to the published version of the manuscript.
Funding
This research received no external funding.
Institutional Review Board Statement
Not applicable.
Informed Consent Statement
Not applicable.
Data Availability Statement
The data for the article was obtained from the website: https://powietrze.gios.gov.pl/pjp/current.
Conflicts of Interest
The authors declare no conflicts of interest.
References
- Tsilingiridis, G.; Sidiropoulos, C.; Pentaliotis, A. Reduction of Air Pollutant Emissions Using Renewable Energy Sources for Power Generation in Cyprus. Renew. Energy 2011, 36. [CrossRef]
- Amann, M.; Klimont, Z.; Wagner, F. Regional and Global Emissions of Air Pollutants: Recent Trends and Future Scenarios. Annu. Rev. Environ. Resour. 2013, 38. [CrossRef]
- Fujii, H.; Managi, S. Economic Development and Multiple Air Pollutant Emissions from the Industrial Sector. Environmental Science and Pollution Research 2016, 23. [CrossRef]
- Nakhjiri, A.; Kakroodi, A.A. Air Pollution in Industrial Clusters: A Comprehensive Analysis and Prediction Using Multi-Source Data. Ecol. Inform. 2024, 80. [CrossRef]
- Włodarczyk, A.; Mesjasz-Lech, A. Development of Road Transport Logistic Infrastructure and Air Pollution in the Visegrad Group Countries. Journal of Economic and Social Development (JESD) 2019, 6.
- Wang, Y.; Wang, C.; Miller, C.J.; McElmurry, S.P.; Miller, S.S.; Rogers, M.M. Locational Marginal Emissions: Analysis of Pollutant Emission Reduction through Spatial Management of Load Distribution. Appl. Energy 2014, 119. [CrossRef]
- Coelho, M.C.; Farias, T.L.; Rouphail, N.M. Effect of Roundabout Operations on Pollutant Emissions. Transp. Res. D Transp. Environ. 2006, 11. [CrossRef]
- McCormick, R.L. The Impact of Biodiesel on Pollutant Emissions and Public Health. In Proceedings of the Inhalation Toxicology; 2007; Vol. 19.
- Grondys, K.; Kott, I.; Sukiennik, K. Initiatives to Reduce Transport-Related Pollution in Selected Polish Cities. In Proceedings of the Transportation Research Procedia; 2016; Vol. 16.
- Włodarczyk, A.; Mesjasz-Lech, A. Modelling of Air Micropollutant’s Fluctuations on the Background of the Primary Air Pollutants Emission as a Tool Supporting Environmental Management in Thermal Power Plant. Desalination Water Treat. 2016, 57. [CrossRef]
- Jiang, Z.; McDonald, B.C.; Worden, H.; Worden, J.R.; Miyazaki, K.; Qu, Z.; Henze, D.K.; Jones, D.B.A.; Arellano, A.F.; Fischer, E. V.; et al. Unexpected Slowdown of US Pollutant Emission Reduction in the Past Decade. Proc. Natl. Acad. Sci. U. S. A. 2018, 115. [CrossRef]
- Aydin, H.; Ilkiliç, C. Air Pollution Pollutant Emissions and Harmfull Effects. J. Eng. Technol. Manage 2017, 28.
- Parrish, D.D.; Kuster, W.C.; Shao, M.; Yokouchi, Y.; Kondo, Y.; Goldan, P.D.; de Gouw, J.A.; Koike, M.; Shirai, T. Comparison of Air Pollutant Emissions among Mega-Cities. Atmos. Environ. 2009, 43. [CrossRef]
- Scribano, G.; Solero, G.; Coghe, A. Pollutant Emissions Reduction and Performance Optimization of an Industrial Radiant Tube Burner. Exp. Therm. Fluid Sci. 2006, 30. [CrossRef]
- Tong, D.; Zhang, Q.; Davis, S.J.; Liu, F.; Zheng, B.; Geng, G.; Xue, T.; Li, M.; Hong, C.; Lu, Z.; et al. Targeted Emission Reductions from Global Super-Polluting Power Plant Units. Nat. Sustain. 2018, 1. [CrossRef]
- Duque, L.; Relvas, H.; Silveira, C.; Ferreira, J.; Monteiro, A.; Gama, C.; Rafael, S.; Freitas, S.; Borrego, C.; Miranda, A.I. Evaluating Strategies to Reduce Urban Air Pollution. Atmos. Environ. 2016, 127. [CrossRef]
- Zawada, M.; Starostka-Patyk, M. Energy Efficiency in the Context of Low-Stack Emissions Reduction on the Example of the City of Czestochowa. In Proceedings of the Transportation Research Procedia; 2016; Vol. 16.
- Ozel, G.; Cakmakyapan, S. A New Approach to the Prediction of PM10 Concentrations in Central Anatolia Region, Turkey. Atmos. Pollut. Res. 2015, 6. [CrossRef]
- Mayer, H. Air Pollution in Cities. Atmos. Environ. 1999, 33, 4029–4037. [CrossRef]
- Liu, Y.; Wu, J.; Yu, D.; Ma, Q. The Relationship between Urban Form and Air Pollution Depends on Seasonality and City Size. Environmental Science and Pollution Research 2018, 25. [CrossRef]
- Rodrigues, V.; Gama, C.; Ascenso, A.; Oliveira, K.; Coelho, S.; Monteiro, A.; Hayes, E.; Lopes, M. Assessing Air Pollution in European Cities to Support a Citizen Centered Approach to Air Quality Management. Science of the Total Environment 2021, 799. [CrossRef]
- Tabassum, S.; Khan, M.I.H.; Islam, M.S.; Shemul, M.R.H.; Rahat, A. Mapping Air Pollution in Rajshahi City: Spatio-Temporal Analysis of Air Quality in High-Risk Areas. In Proceedings of the ICCEI 2025; Rajshahi University of Engineering & Technology: Bangladesh, December 2025; pp. 1–6.
- Cohen, A.J.; Ross Anderson, H.; Ostro, B.; Dev Pandey, K.; Krzyzanowski, M.; Künzli, N.; Gutschmidt, K.; Arden Pope III, C.; Romieu, I.; Samet, J.M.; et al. World Health Organization Report Part Title: Urban Air Pollution Report Part Title: Comparative Quantification of Health Risks Report Subtitle: Global and Regional Burden of Disease Attributable to Selected Major Risk Factors Report Editor(s); 2004;
- Khomenko, S.; Cirach, M.; Pereira-Barboza, E.; Mueller, N.; Barrera-Gómez, J.; Rojas-Rueda, D.; de Hoogh, K.; Hoek, G.; Nieuwenhuijsen, M. Premature Mortality Due to Air Pollution in European Cities: A Health Impact Assessment. Lancet Planet. Health 2021, 5. [CrossRef]
- Zivulovic, S.; Török, L.; Török, Zs. ASSESSING THE RELATIONSHIP BETWEEN AIR POLLUTANTS AND PUBLIC HEALTH SENSITIVITY IN LOW-POLLUTION ENVIRONMENTS: A MULTI-CITY STUDY FROM FINLAND. Research Journal of Agricultural Science 2025, 57, 530–542. [CrossRef]
- Pasqua, L.A.; Damasceno, M.V.; Cruz, R.; Matsuda, M.; Martins, M.G.; Lima-Silva, A.E.; Marquezini, M.; Saldiva, P.H.N.; Bertuzzi, R. Exercising in Air Pollution: The Cleanest versus Dirtiest Cities Challenge. Int. J. Environ. Res. Public Health 2018, 15. [CrossRef]
- Kumar, K.; Pande, B.P. Air Pollution Prediction with Machine Learning: A Case Study of Indian Cities. International Journal of Environmental Science and Technology 2023, 20. [CrossRef]
- Enciso-Díaz, W.C.; Zafra-Mejía, C.A.; Hernández-Peña, Y.T. Global Trends in Air Pollution Modeling over Cities Under the Influence of Climate Variability: A Review. Environments - MDPI 2025, 12.
- Srikanth, V.; Arpitha, K.; Akbar, S.; Patil, S.; Bhosale, Y.H.; Pathak, M. Artificial Intelligence-Based Monitoring and Forecasting of Urban Air Pollution in Smart Cities. Int. J. Environ. Sci. 2025, 11, 2025.
- Alkayal, S.; Almisbahi, H.; Baowidan, S.; Alkayal, E. Air Pollution Trends and Predictive Modeling for Three Cities with Different Characteristics Using Sentinel-5 Satellite Data and Deep Learning. Atmosphere (Basel). 2025, 16. [CrossRef]
- Krzyzanowski, M.; Apte, J.S.; Bonjour, S.P.; Brauer, M.; Cohen, A.J.; Prüss-Ustun, A.M. Air Pollution in the Mega-Cities. Curr. Environ. Health Rep. 2014, 1. [CrossRef]
- Amorim, J.H.; Valente, J.; Cascão, P.; Rodrigues, V.; Pimentel, C.; Miranda, A.I.; Borrego, C. Pedestrian Exposure to Air Pollution in Cities: Modeling the Effect of Roadside Trees. Advances in Meteorology 2013, 2013. [CrossRef]
- Sicard, P.; Pascu, I.S.; Petrea, S.; Leca, S.; Marco, A. De; Paoletti, E.; Agathokleous, E.; Calatayud, V. Effect of Tree Canopy Cover on Air Pollution-Related Mortality in European Cities: An Integrated Approach. Lancet Planet. Health 2025, 9. [CrossRef]
- Skylodimou, L.; Lytoudi, P.; Metaxas, T. Air Pollution and Urban Environment: Residents Approach in the Wider Area of Volos City, Greece. Urban Science 2025, 9. [CrossRef]
- Ivan, P.; Schwarz, M.; Mikušová, M. Assessment of Health Risks Associated with PM10 and PM2.5 Air Pollution in the City of Zvolen and Comparison with Selected Cities in the Slovak Republic. Environments - MDPI 2025, 12. [CrossRef]
- Dimitrova, R.; Georgiev, S.; Dzhambov, A.M.; Ivanov, V.; Panev, T.; Georgieva, T. Study of the Relationship Between Urban Microclimate, Air Pollution, and Human Health in the Three Biggest Cities in Bulgaria. Urban Science 2026, 10, 69. [CrossRef]
- Mananga, E.S.; Lopez, E.; Diop, A.; Dongomale, P.J.T.; Diane, F. The Impact of the Air Pollution on Health in New York City. J. Public Health Res. 2023, 12.
- Zawada, M.; Szajt, M. Application of Statistical and Econometric Tools in The Analysis of Air Pollution Level on The Example of Czestochowa. Folia Oeconomica Stetinensia 2018, 18. [CrossRef]
Figure 1.
The 50 most polluted cities in Europe.
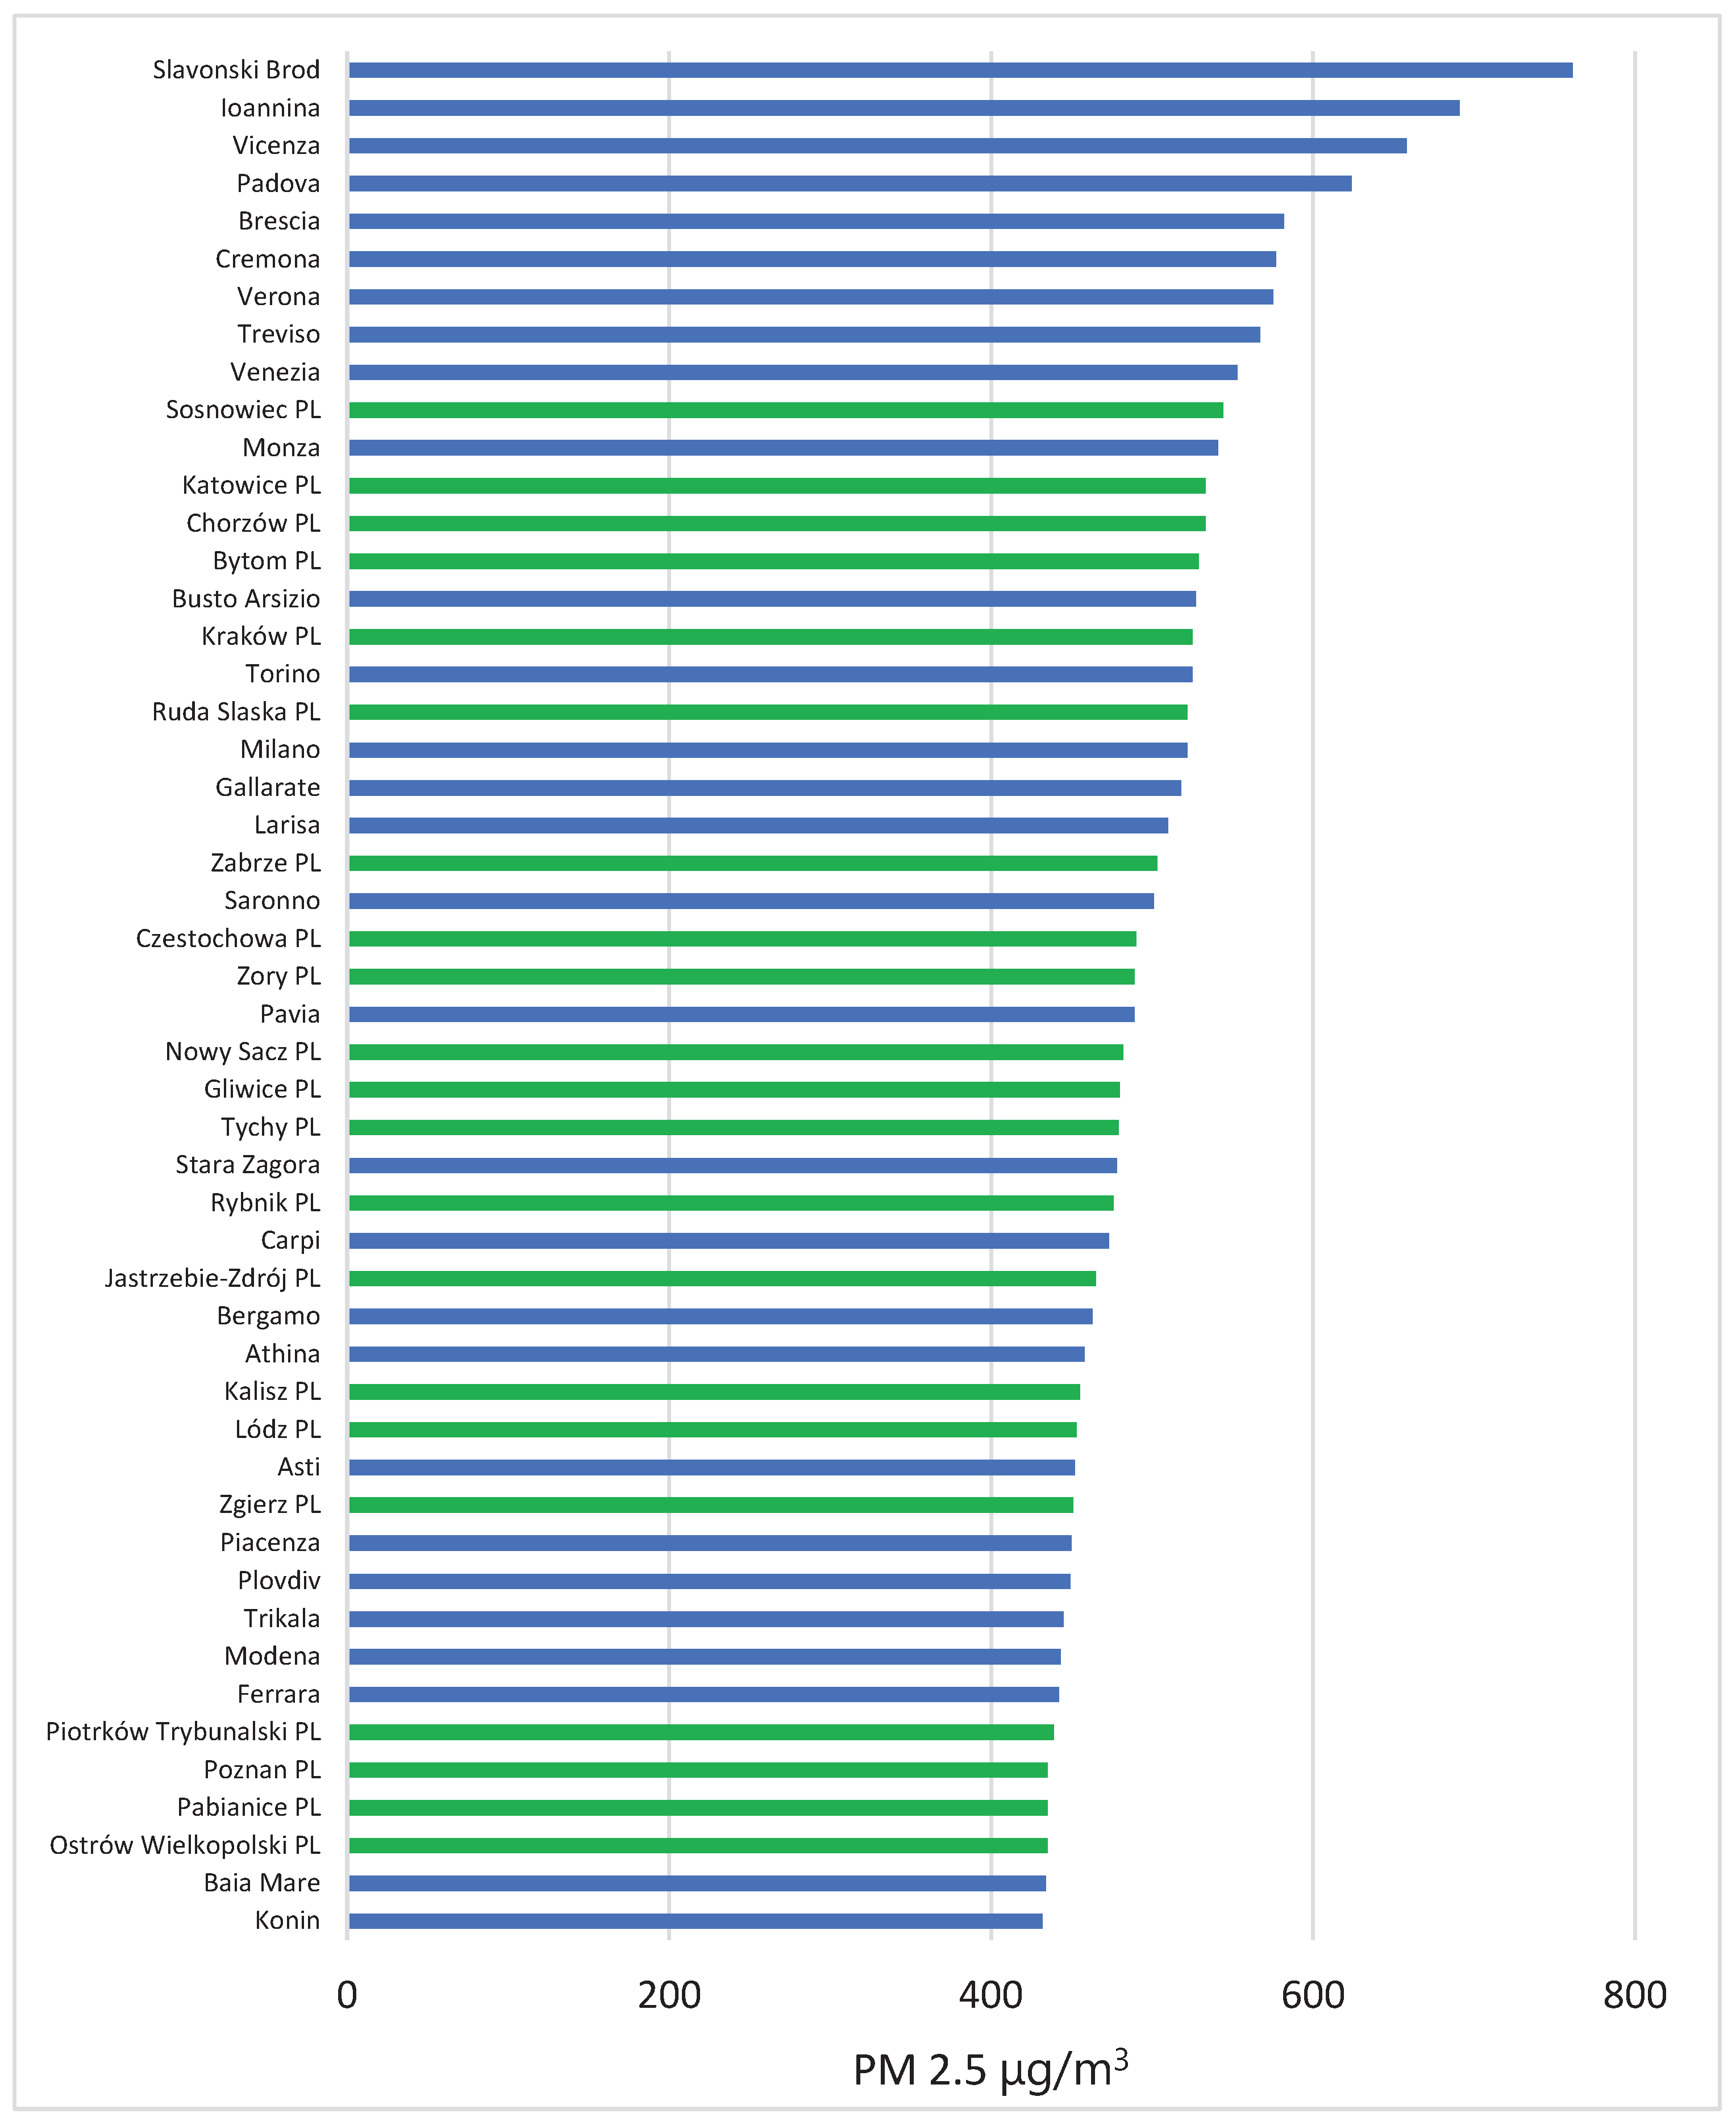
Figure 2.
Average hourly nitrogen oxide emissions per week in 2015 and 2024.
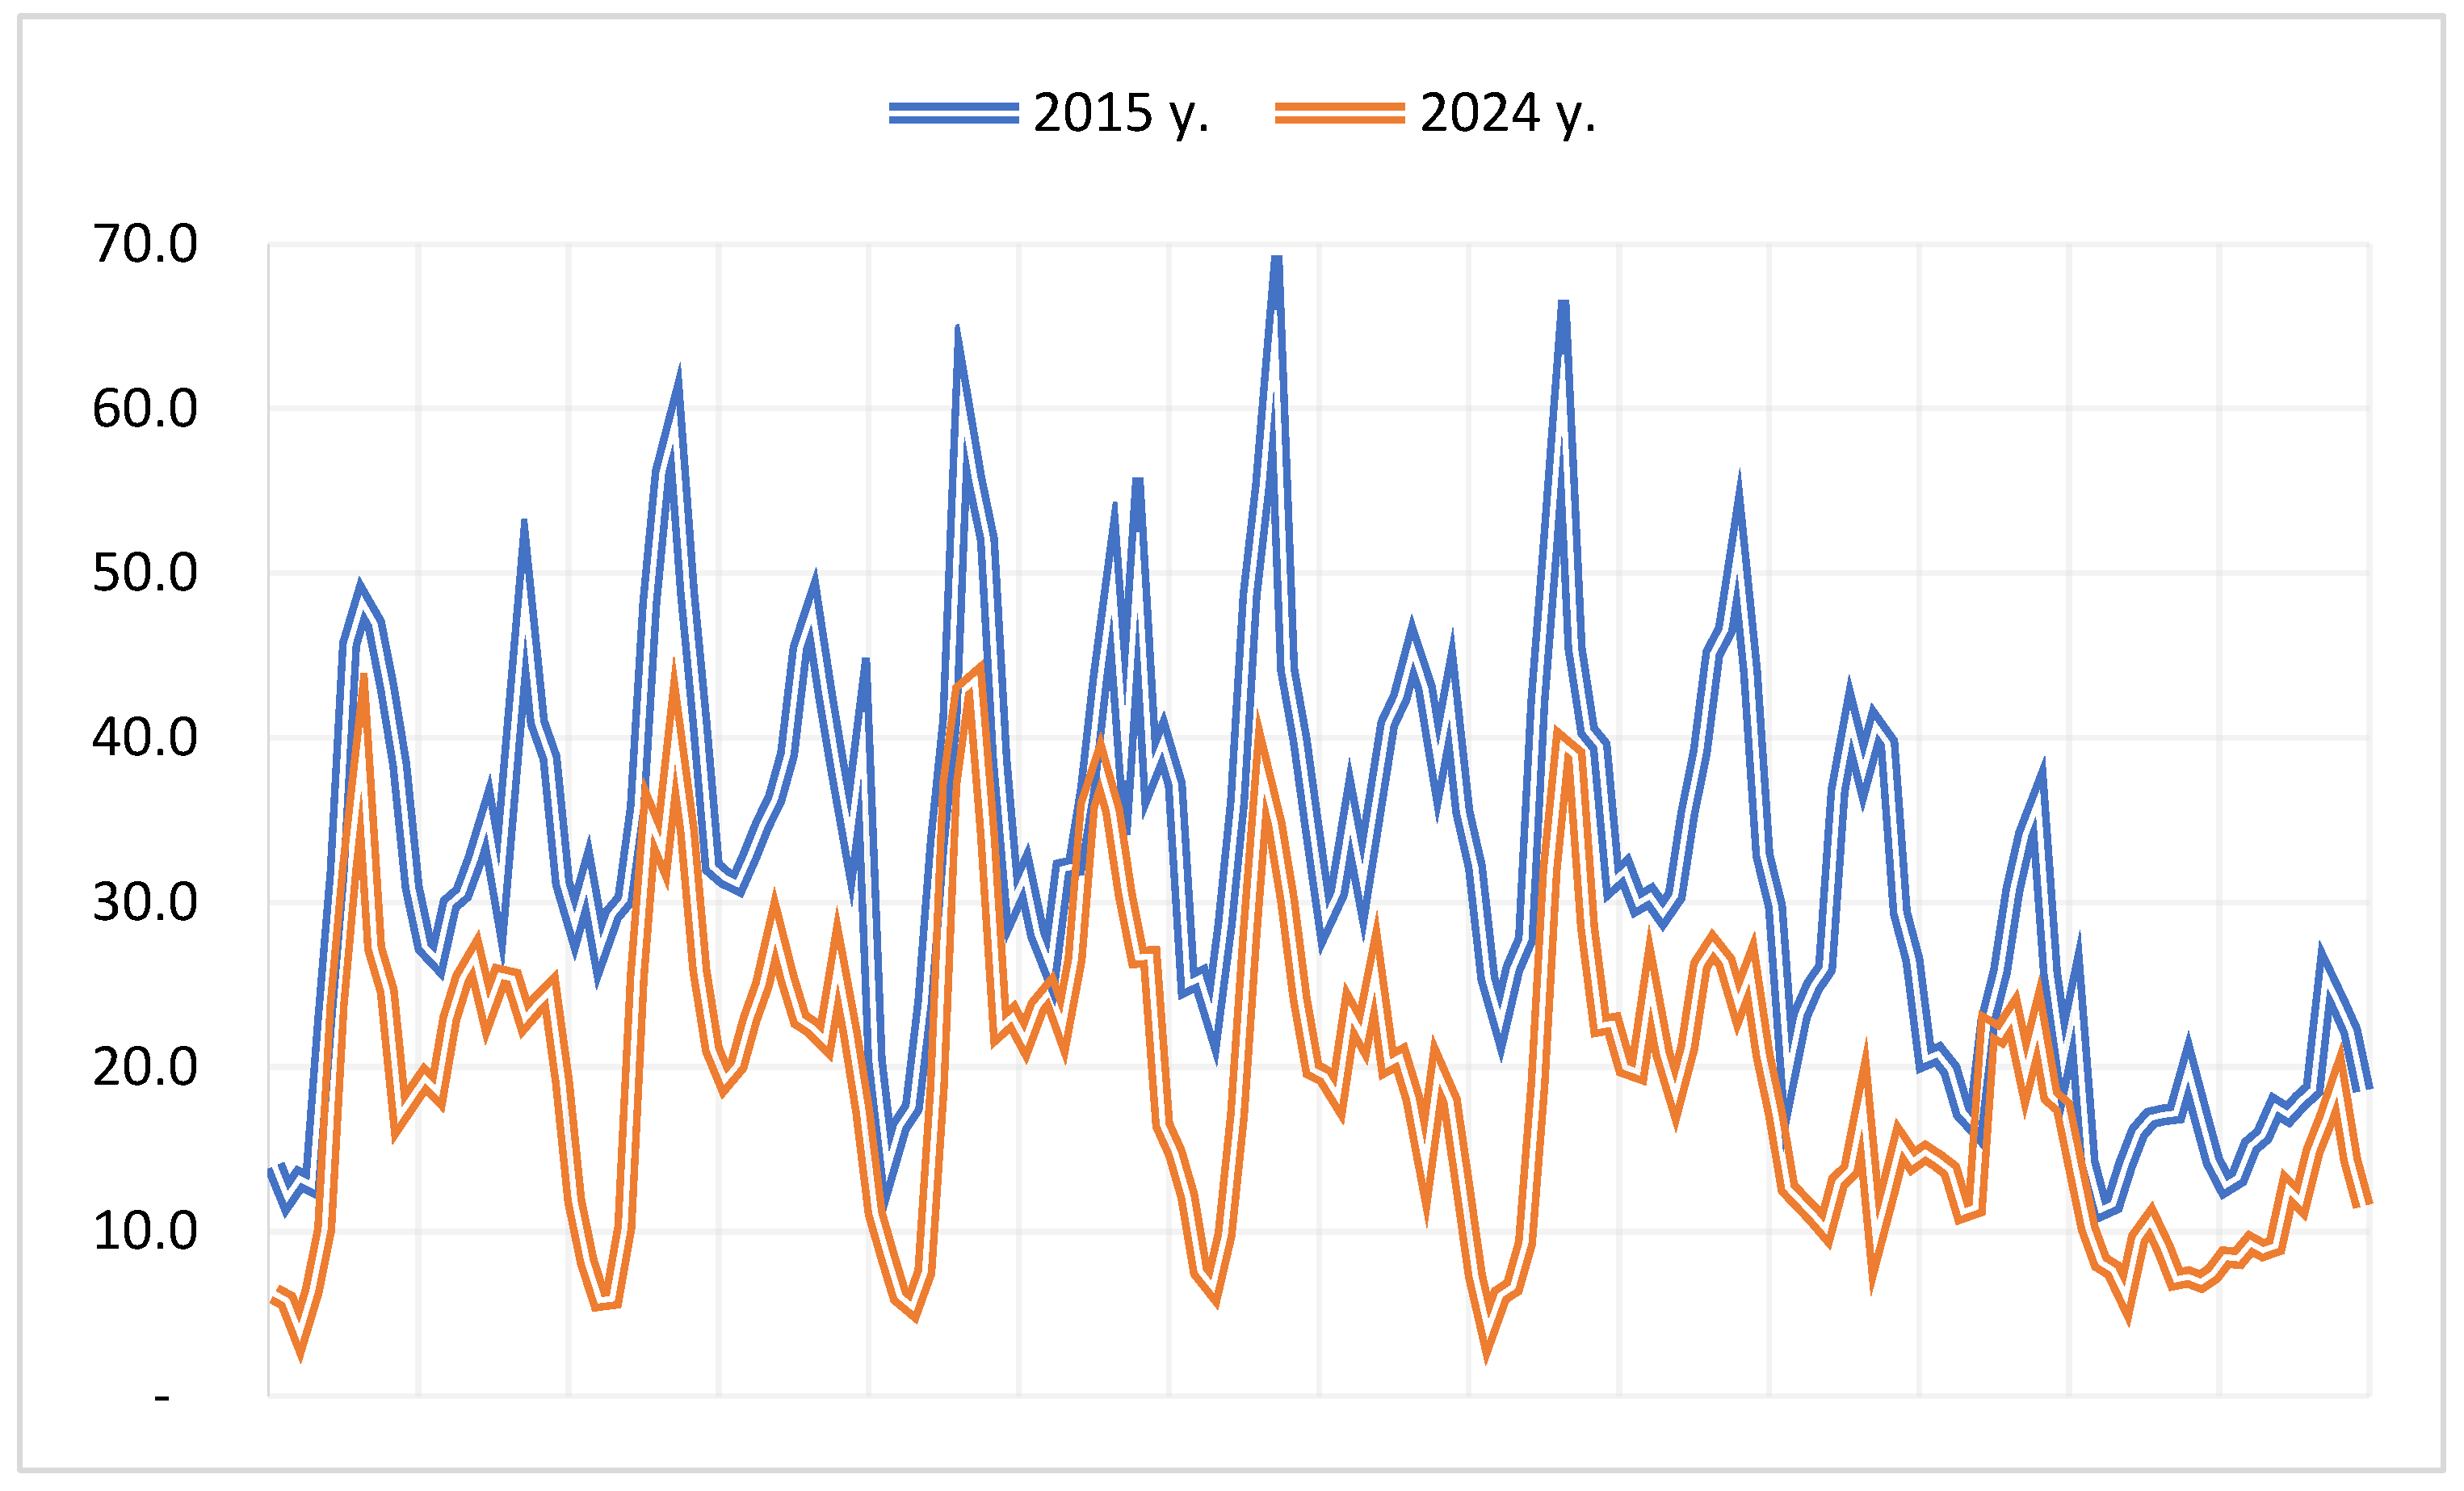
Figure 3.
Average hourly PM10 dust emissions per week in 2015 and 2024.
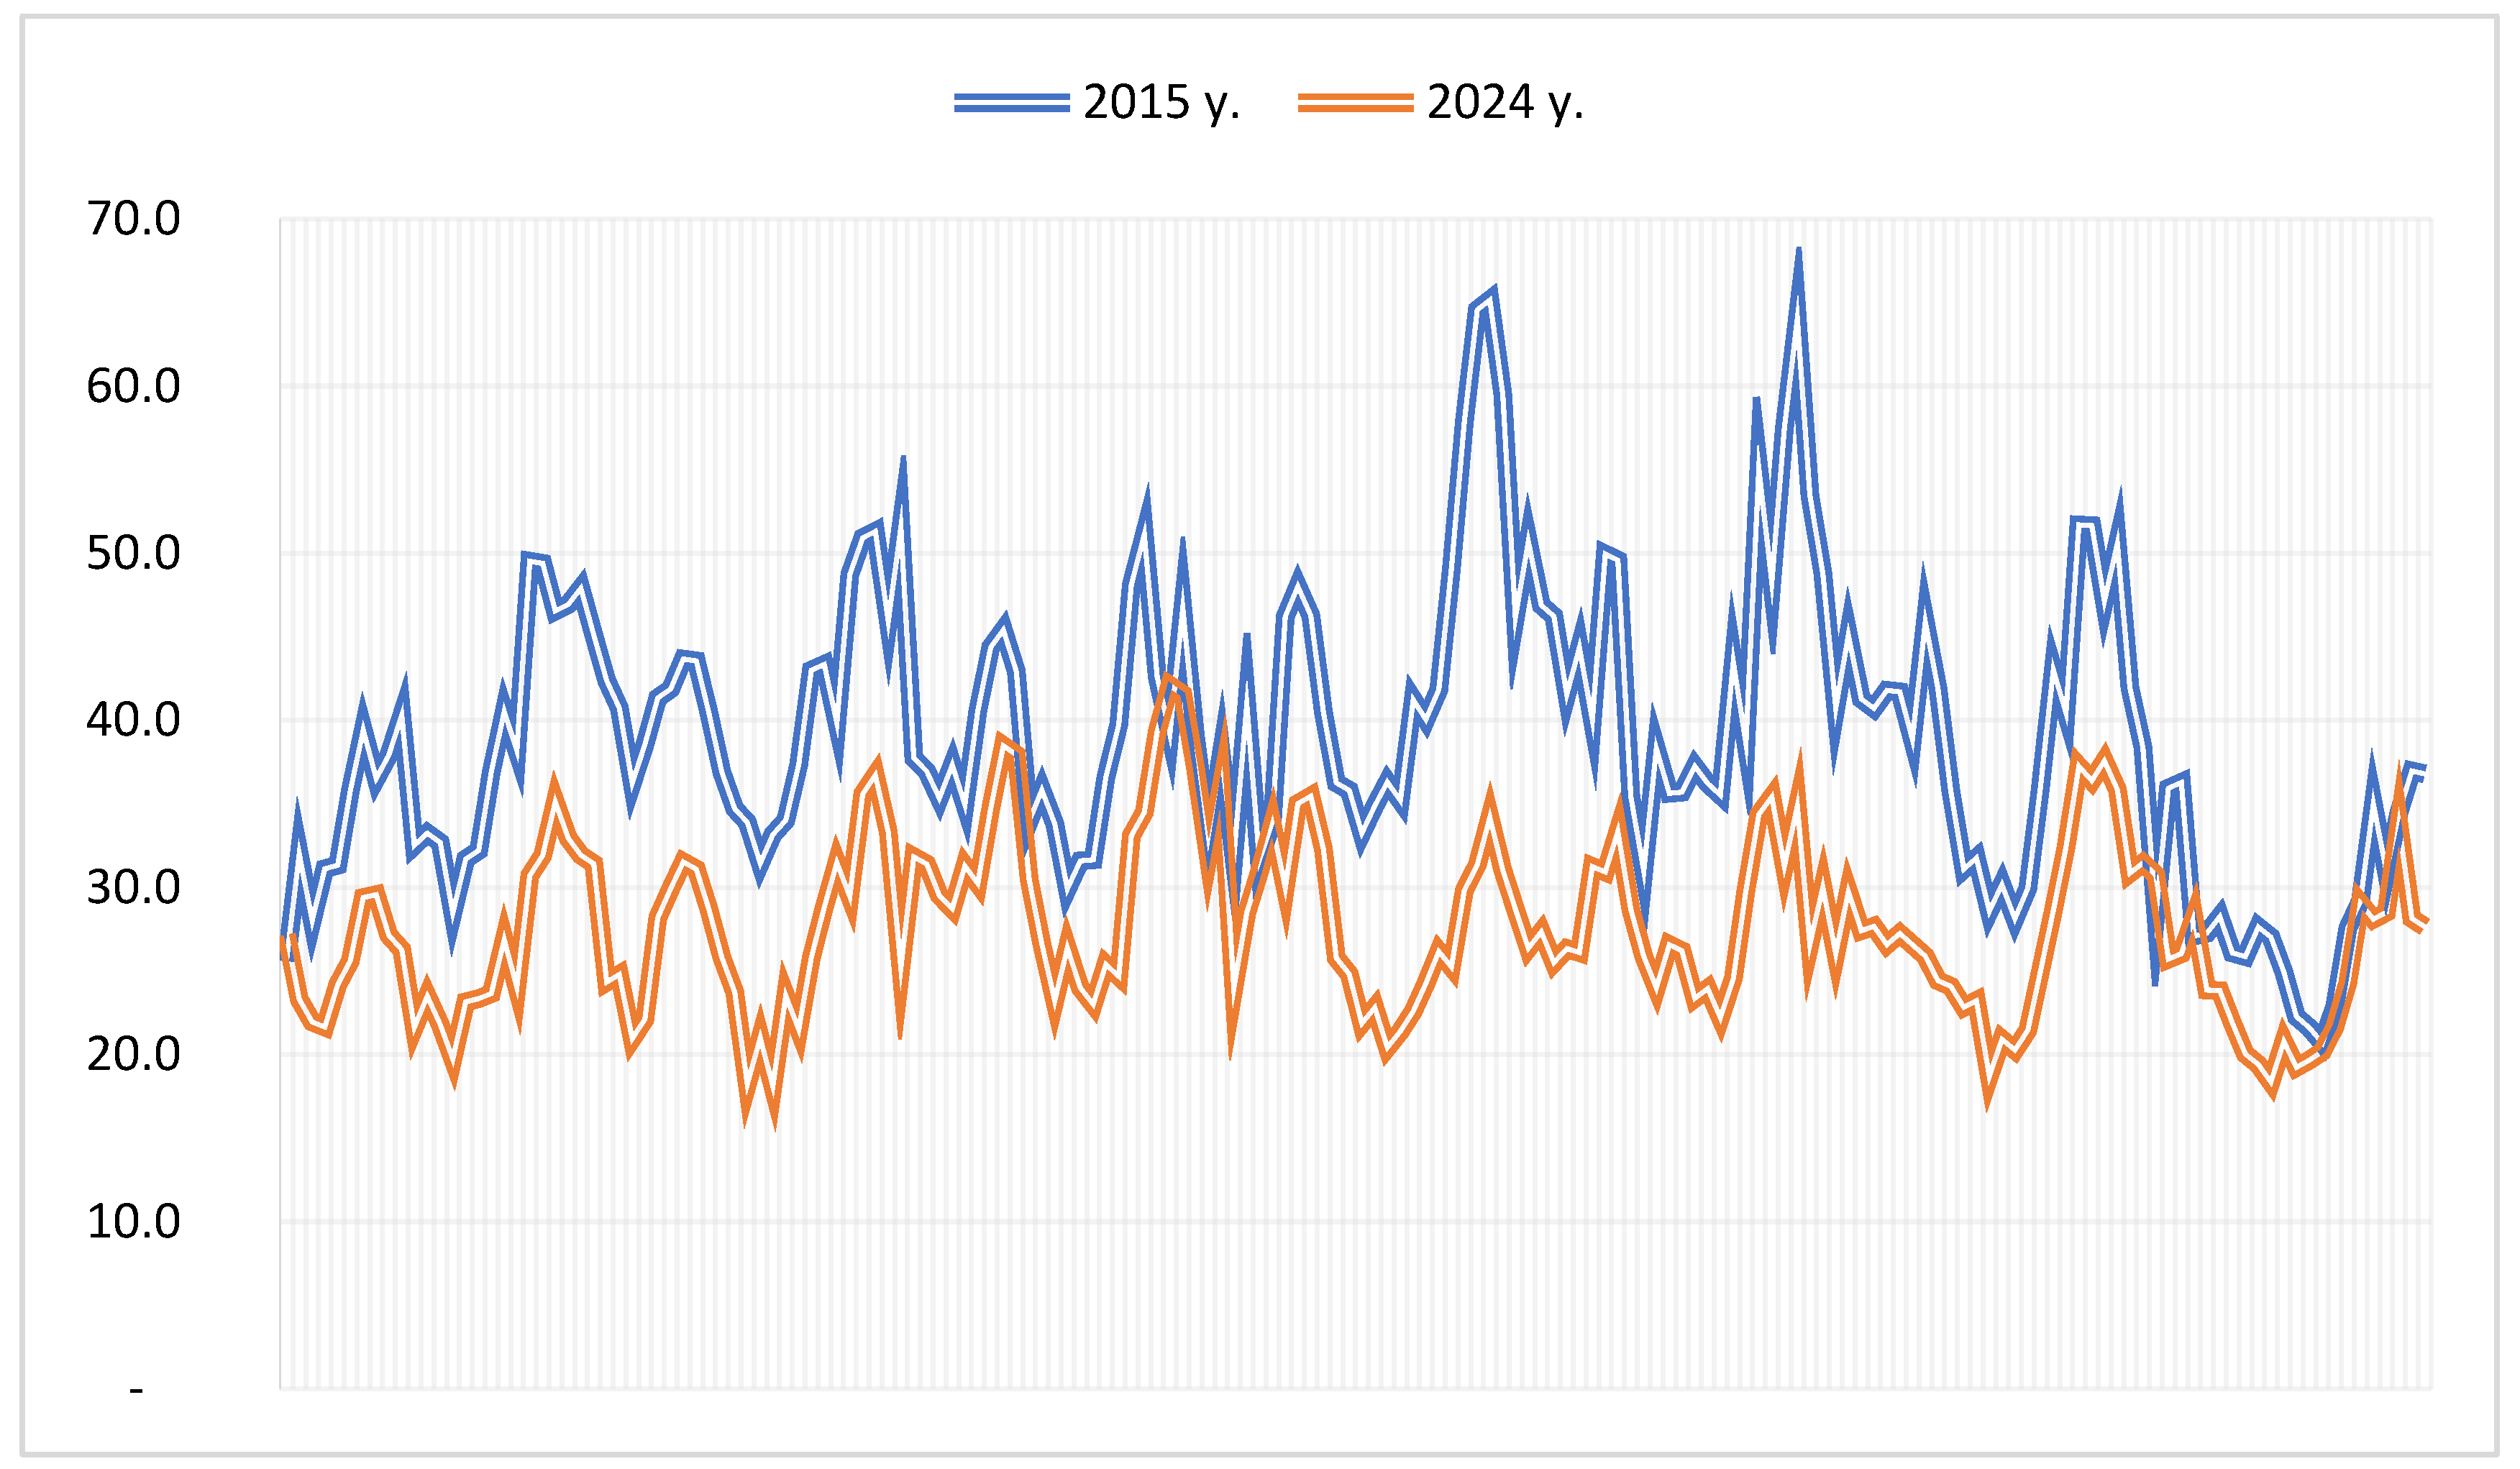
Figure 4.
Average hourly CO2 emissions per week in 2015 and 2024.
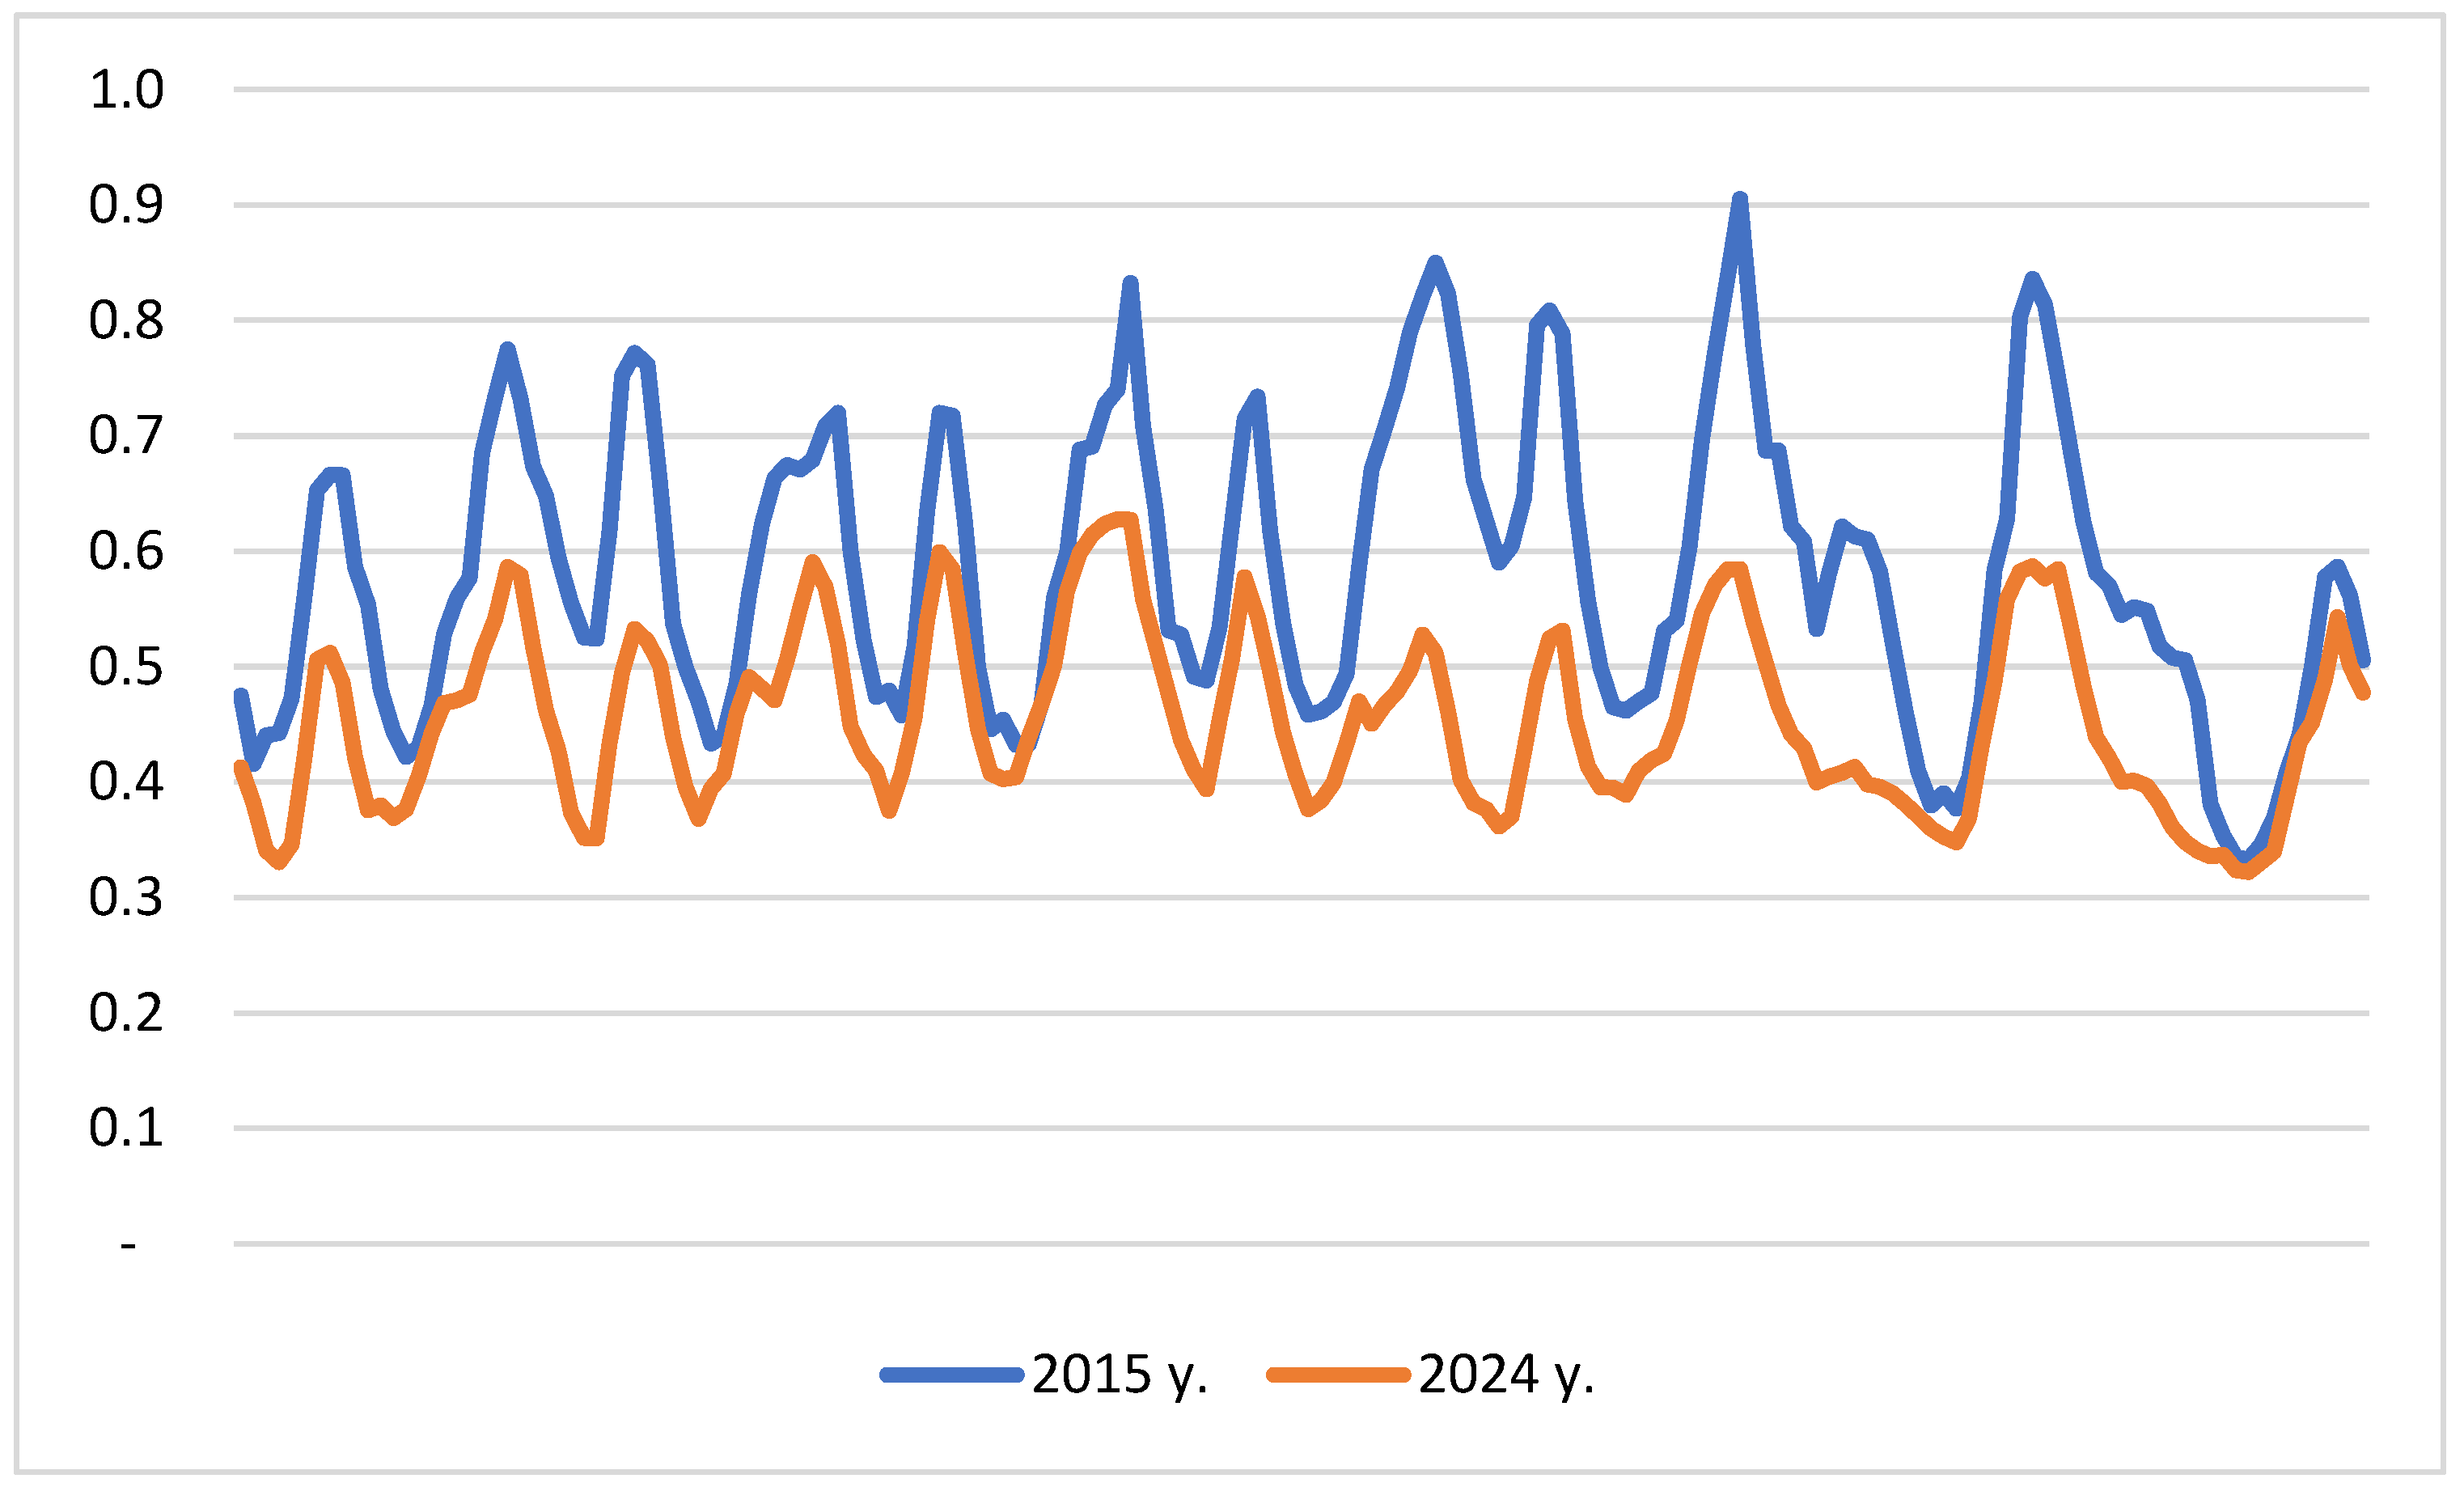

Table 1.
Estimation values of structural parameters for CO2, NO, and PM10 impurity models.
| Variable | NO | CO2 | Suspended dust |
|---|---|---|---|
| Const | 108.596 | 0.492 | 43.149 |
| AD | - 8.415 | - 0.029 | - 3.074 |
| AW | 58.872 | 0.199 | 21.489 |
| M | - 6.797 | 0.021 | 0.962 |
| MW | 0.099 | 0.001 | 0.035 |
| H | 0.292 | 0.002 | 0.097 |
| MON | - 34.272 | - 0.122 | - 14.696 |
| TUE | - 24.349 | - 0.085 | - 10.065 |
| WED | - 15.694 | - 0.063 | - 6.465 |
| THU | - 7.960 | - 0.035 | - 3.369 |
| JAN | - 74.250 | 0.269 | 16.728 |
| FEB | - 68.222 | 0.211 | 14.807 |
| MAR | - 60.540 | 0.156 | 14.301 |
| APR | - 61.619 | - | - |
| MAY | - 59.837 | - 0.110 | - 9.885 |
| JUN | - 55.441 | - 0.172 | - 13.630 |
| JUL | - 48.137 | - 0.202 | - 16.135 |
| AUG | - 37.803 | - 0.193 | - 14.473 |
| SEP | - 21.491 | - 0.144 | - 11.976 |
| OCT | - | - | - 1.012 |
| Z0 | - 7.613 | - 0.059 | - 2.438 |
| Z1 | - 13.094 | - 0.103 | - 4.891 |
| Z2 | - 15.683 | - 0.141 | - 7.691 |
| Z3 | - 15.349 | - 0.163 | - 9.228 |
| Z4 | - 11.726 | - 0.172 | - 9.802 |
| Z5 | - | - 0.127 | - 8.524 |
| Z6 | 10.777 | - 0.068 | - 6.877 |
| Z7 | 14.845 | - 0.042 | - 5.858 |
| Z8 | 12.709 | - 0.058 | - 6.273 |
| Z9 | 5.506 | - 0.115 | - 8.432 |
| Z10 | - 2.145 | - 0.170 | - 11.723 |
| Z11 | - 5.666 | - 0.203 | - 14.222 |
| Z12 | - 7.608 | - 0.223 | - 16.070 |
| Z13 | - 8.036 | - 0.228 | - 17.196 |
| Z14 | - 6.977 | - 0.215 | - 17.483 |
| Z15 | - 6.031 | - 0.192 | - 17.129 |
| Z16 | - 4.303 | - 0.158 | - 15.506 |
| Z17 | - 2.072 | - 0.127 | - 12.188 |
| Z18 | - | - 0.084 | - 8.111 |
| Z19 | 2.309 | - 0.040 | - 4.042 |
| Z20 | 3.309 | - | - 1.208 |
| Z21 | 1.934 | - | - |
Disclaimer/Publisher’s Note: The statements, opinions and data contained in all publications are solely those of the individual author(s) and contributor(s) and not of MDPI and/or the editor(s). MDPI and/or the editor(s) disclaim responsibility for any injury to people or property resulting from any ideas, methods, instructions or products referred to in the content. |
© 2026 by the authors. Licensee MDPI, Basel, Switzerland. This article is an open access article distributed under the terms and conditions of the Creative Commons Attribution (CC BY) license (http://creativecommons.org/licenses/by/4.0/).
Copyright: This open access article is published under a Creative Commons CC BY 4.0 license, which permit the free download, distribution, and reuse, provided that the author and preprint are cited in any reuse.


