
Submitted:
26 October 2024
Posted:
28 October 2024
You are already at the latest version
Abstract
In order to improve the energy, operational and ecological efficiency of District Heating Systems (DHS) powered by a Combined Heat and Power (CHP) plant or a Heating Plant, Thermal Energy Storages (TES) should be used. Improvement of energy efficiency is primarily associated with greater operational efficiency of energy generation, improvement of operational efficiency and fewer start-ups and number of operating hours of peak boilers. Improving ecological efficiency is associated with lower emissions of pollutants into the atmosphere. The presented paper examines the impact of the use and operation of a TES built in a CHP plant supplying a large DHS on the amount of particulates emission to the atmosphere. Detailed research was carried out for Siekierki-Warsaw and Białystok CHP plants in Poland. The analysis allowed to determine the factors affecting the reduction of pollutant emissions and the volume of the energy effect of using a TES in the CHP plant. In order to objectify the results of the comparative analysis of the impact of TES in CHP plant on the emission of particulates, the so-called Comparative Index (CI) was in-troduced, which takes into account the volume of electricity and heat production and climatic conditions in the analyzed time periods. The CI for the analyzed years, should have a similar value so that the results of the comparative analysis are fully representative. This condition is met for the selected base and comparative year for the CHP plant and DHS of Białystok, so the detailed results of analysis are presented for this facility. As a result of the application of TES in Białystok CHP plant, significant environmental effects related to the reduction of particulates emission have been achieved, for example, the total amount of annual Particulate Matters (PM) emission (PM10 and PM2.5) has been reduced by 27% and the maximum emission by 29%. On the other hand, the average decrease in particulates emission in the heating season varied in the range of 10 - 50%, while in the summer season the values of particulates emission were at a comparable level. A significant decrease in annual and one-hour average concentrations for PM10 and PM2.5 and particulates fallout for these two analyzed years was also found. The use of TES to reduce the occurrence and nuisance of the smog phenomenon, the main components of which are PM, is proposed, and selected models of forecasting concentrations of pollutants in the air, including particulates emission, are presented in order to implement this type of activities.
Keywords:
Thermal Energy Storage
; Combined Heat and Power plant
; District Heating System
; Particulates emission into the atmosphere
; Smog phenomenon
1. Introduction
The use of Thermal Energy Storages (TES) in District Heating Systems (DHS) enables effective operation of the energy source, i.e. it allows for stable operation of generating units (boilers, turbine sets) with high efficiency and reduces the number of peak-load boiler start-ups to a minimum. TES also enable the integration and more efficient use of renewable energy sources, especially weather-dependent ones, as well as waste heat from various technological processes [1,2,3]. Thus, the implementation of TES technology in DHS offers great opportunities to improve the operating conditions of heating systems as well as the economics of heat and electricity production (by increasing heat production in cogeneration, and increasing electricity production in periods when its prices are high), as well as reducing emissions of pollutants into the atmosphere and increasing the security of energy supply to consumers.
In the last dozen or so years, the EU has adopted a number of Directives of the European Parliament and the Council, which create a real basis for achieving the objectives of the EU energy strategy and environmental protection in the short and long term.
These directives are subject to subsequent amendments and additions and are extremely important for the heating sectors in the EU countries, they condition their development and modernization, efficiency and competitiveness, as well as less burdensome for the natural environment. Thus, increasing the efficiency of heat generation and transmission, maximizing cogeneration and better use and integration of renewable sources and waste heat from various technological processes require the widespread use of TES in DHSs [2].
In addition, with a view to protecting human health and the environment as a whole, it is particularly important to combat emissions of pollutants at their source and to identify and implement at local, national and EU level the most effective measures to reduce pollutant emissions, i.e. to prevent or reduce emissions of harmful air pollutants and to set appropriate air quality targets, taking into account appropriate standards, guidelines and programs of the World Health Organization (WHO).
The impact of the use of a TES in DHSs on the state of the natural environment, and in particular the amount of emissions into the atmosphere of gaseous pollutants and Particulate Matters (PM) generated during the combustion of fuels in CHP plants, has not been the subject of many studies and scientific publications so far. A number of scientific publications indicate the obtained (or achievable) energy, operational and economic effects in the studied district or industrial heating systems after the installation of a TES [4,5,6]. These energy, operational and economic effects are obvious due to more stable and even operation in terms of thermal and electrical power of generating units, the possibility of avoiding the operation or limiting the operating time of peak-load boilers, or increasing the production of electricity generated in cogeneration [7,8]. For example, the authors of the study [6] indicate for the analyzed DHS of the city of Turin that after the installation of the TES, the energy effects obtained in the form of reduced fuel consumption amounted to 12%, and the total costs of energy generation decreased by 5%.
The ecological effects of the use of a TES in district and industrial heating systems were most often studied in terms of reducing CO2 emissions [9,10,11], and only a few studies indicated a reduction in the emission of gaseous pollutants into the atmosphere such as SO2, NOx, CO and particulates obtained after the installation of a TES [2,12,13].
Bogdan and Kopiar [14] determined the amount of reduction in CO2 and SO2 emissions as a result of the installation of a TES in the CHP plant using in the calculations the amount of fuel saved and unit emission factors for the year in which the CHP plant operated without the TES and with the TES. The calculations resulted in a reduction in annual CO2 emissions of 6.4% and SO2 of 16.9%.
Denholm and Holloway [12] determined the ecological effect in the form of the expected reduction of gaseous pollutants, i.e. CO2, SO2 and NOx, after the use of energy storage in the form of compressed air tanks for Norton Energy Company. The results of the calculations are presented in the form of a reduction in the emission factors of these pollutants for the state before and after the installation of energy storage facilities. The values of these emissions are as follows:
- for CO2, 950 – before, 825 kg CO2/MWh – after the storage facility is built;
- for SO2, 0.6 – before, 0.4 kg SO2/MWh - after;
- for NOx, 0.4 – before, 0.3 kg NOx/MWh - after.
Independent studies conducted for five different TES installations in California, Texas and Wisconsin, and presented in [13], showed a significant reduction in the emission of gaseous pollutants, i.e. SO2 and NOx at the level of 5% - 29%, and CO2 in the range of 5% - 24%.
However, all the above-mentioned works did not contain a research methodology, and the environmental effects obtained, i.e. reductions in the emission pollutants, resulted from a simple comparison of the emission of these pollutants generated before and after the installation of the TES in the energy system under consideration, or were calculated as the result of fuel savings, using standard emission indicators of individual gaseous pollutants for a given type fuel burned. In none of these cases were individual years before and after the installation of the TES, for example in terms of the amount of energy generated in the energy source in question, or in terms of climatic similarity, e.g. through the number of degree days for these compared periods of time. Thus, the results of reducing gaseous pollutants obtained by this method are not fully reliable.
2. Emission of PM into the Atmosphere and the Problem of Smog
The basic gaseous and particulate pollutants introduced into the atmosphere during combustion processes are: CO2, SO2, NOx, CO and PMs. Of course, primary particulates emissions, i.e. from natural and anthropogenic sources, and secondary emissions are of key importance for the formation of the smog phenomenon.
The problem of smog in the world is a serious environmental issue that has a significant impact on people's lives. Smog is a type of air pollution that is formed as a result of the combination of various substances emitted into the atmosphere, mainly by industrial activities, burning fossil fuels in energy sector and transport. There are also natural sources of smog formation, e.g. as a result of volcanic eruptions. Depending on the components and conditions causing smog, there are two main types: London smog and photochemical smog. London smog occurs in Europe. It is most often formed as a result of the release of products of coal combustion and other fossil fuels into the atmosphere. These are sulfur oxides, nitrogen oxides, PMs and soot. The most dangerous component of smog is particulates aerosol with a diameter not exceeding 2.5μm (PM2.5), which includes inorganic and organic compounds. Particulates with such a small particle size can easily enter the lungs and blood of humans, causing respiratory and cardiovascular diseases [15]. Smog occurs in winter periods, especially in conditions of low outside air temperature. Additional conditions conducive to the formation of London smog are: low wind speed, high air humidity and geographical location of cities, e.g. in valleys.
For obvious reasons, the paper deals with the emission of particulates from anthropogenic sources (in this case CHP plants) and, in a sense, secondary emission, resulting from transformations and reactions occurring in the atmosphere.
In Total Suspended Particulates (TSP), the following PM fractions are distinguished:
- PM10 – fine PM (d < 10μm),
- PMc – intermediate fine PM (2.5μm < d < 10μm),
- PM2.5 – very fine PM (d < 2.5μm),
- PM1 – submicron PM (d < 1μm),
- PM0.1 – ultrafine PM (d < 0.1μm).
It should be emphasized that air quality monitoring stations in Poland in terms of PMs concentration transmit TSP, PM10 and PM2.5 values to the National Centre for Emissions Management (KOBiZE) [16].
Anthropogenic particulate emissions are mainly associated with fuel combustion processes. In the paper [17], five categories of PM emission sources were distinguished, i.e.:
- Professional power engineering,
- Industrial power engineering,
- Industrial technologies,
- Other stationary sources (local boilers, domestic boilers, agriculture, etc.),
- Mobile sources.
The annual emissions of PM, including anthropogenic particulates, in Poland in individual sectors of the economy in the years 1990-2020 are presented in Table 1 [18].
On the other hand, for the energy sector, the amount of particulate emissions resulting from fuel combustion and fugitive emissions from fuels is presented in Table 2.
An analysis of the presented data for Poland in the years 1990-2020 indicates a more than twofold decrease in the emission of these PM in all categories (TSP, PM10 and PM2.5). A strong decrease in PM emissions was observed in the first decade presented here. In the EU and in Poland, air quality standards are established for two PM fractions, i.e. PM10 and PM2.5. Their values are given in Table 3.
On the other hand, the course of annual average concentrations of PM2.5 and PM10 in the years 2012-2022 in selected cities in Poland is presented in Figure 1 and Figure 2 [19].
The exposure of the urban population in Poland to air polluted with PM10 and PM2.5 in 2010-2022 is shown in Figure 3 [19].
The presented figure 1, figure 2 and figure 3 clearly show that the values of annual average concentrations of PM2.5 and PM10 in selected cities in Poland in the years 2010-2022 drop significantly, in some cases even 2 times. Also, the exposure of the urban population to air polluted with PM10 and PM2.5 has been steadily decreasing in the analyzed period.
3. Materials
The analysis of the annual emission of PMs was carried out for the Siekierki-Warsaw and Białystok CHP plants in both, before and after the installation of the TES.
The Siekierki CHP plant is the largest CHP plant in Poland and the second largest in the EU. The thermal power of this plant is 2,078 MWth, while the electrical power is 625 MWel. The Siekierki CHP Plant was launched in 1961. It consists of [3]:
- Block part – each block consists of its own boiler and turbine (number of blocks – 3, electrical power – 110 MWel each, thermal power – 175 MWth each),
- Collector part – boilers supply a common steam collector, from which steam is directed to the turbines (total thermal power – 669 MWth, total electrical power – 170 MWel),
- Condensing turbine with steam extraction (electrical power – 125 MWel),
- Water boilers (number of boilers – 6, total thermal power – 884 MWth).
In turn, the Białystok CHP plant is several times smaller than the Siekierki CHP plant. The thermal power of this plant is 530MWth, while the electrical power is 198MWel. The Białystok CHP plant was launched in 1978. It consists of [20]:
- 4 steam boilers, including: 2 fluidized bed biomass boilers in blocks 1 and 2 pulverized coal boilers in blocks 2 and 3,
- 4 turbines: in block 1 with a electrical power of 65 MWel, in blocks 2 and 3 with a electrical power of 55 MWel each and a condensing turbine with a electrical power of 23.15 MWel;
- 2 water boilers with a thermal power of 81.5 MWth each.
Both analyzed CHP plants have TES systems in the form of tanks storing non-latent heat (network water), where the separation of the supply (hot) network water from the return (cold) network water is carried out in a natural way through the thermocline layer.
A view of the CHP plant with a TES in Siekierki-Warsaw and Białystok is shown in Figure 4.
The TES at the Siekierki plant was commissioned in 2009. The TES has been integrated into the DHS by means of discharging pumps (DP) - Figure 5. In turn, the TES at the Białystok plant was launched in 2011. The TES has been integrated into the DHS by means of both discharging (DP) and charging (CP) pumps – Figure 6.
The basic technical parameters of TES in the Siekierki and the Białystok CHP plants are presented in Table 4 [21].
4. Methodology
Below the methodology for determining the impact of TES operation on emissions of particulates and efficiency of energy generation was described.
4.1. Factors Affecting the Reduction of Emissions of Pollutants
The factors related to the use and operation of TES in CHP plants, affecting the reduction of emissions of pollutants into the atmosphere generated in the process of combustion of fuels in boilers, include:
- Increase in the operational efficiency of generating units through their stable operation, with an even thermal load.
- Covering the peak demand for heat, i.e. the possibility of avoiding the temporary start-up of peak boilers and their possible shorter operation, to cover the increased demand for heat by consumers.
- Increasing the amount of electricity generated in cogeneration, i.e. the possibility of generating additional electricity in the CHP plant during periods of peak demand and its high prices.
All three of the above-mentioned energy factors directly translate into lower fuel consumption in order to generate a certain amount of energy in the CHP with built-in TES compared to the same CHP without TES. Lower fuel consumption results in lower emissions of pollutants, which is the so-called ecological effect of the use of TES in CHP. The first two factors mentioned above have a direct impact on the reduction of emission of pollutants resulting from the combustion of fuels in boilers in the analyzed CHP The third factor is global in terms of the so-called avoided emissions related to the generation of additional electricity in the analyzed CHP in the combined process, which means that this amount of electricity may not be generated in any conventional power plant, the so-called condensing power plant supplying the national power system.
The impact of the second of the above-mentioned factors on the amount of pollutant emissions can be taken into account by determining the so-called operational efficiency of the entire CHP plant.
4.1.1. Increase in the Operational Efficiency of Units Generating Heat and Electricity
The operational thermal efficiency of boilers may differ significantly from the nominal efficiency of these units [22]. A decisive role in achieving high thermal efficiency of steam and hot water boilers is played by the operating time of these units in areas of high efficiency and at even, stable loads close to the nominal load. Usually, most boilers show a significant dependence of their efficiency on the current heat output, reaching maximum efficiency values for heat loads close to the nominal ones. In addition, the operational efficiency of the entire heat source (CHP, Heating Plant) is significantly affected by the operating time and the number of start-ups of peak boilers.
In addition, operating efficiencies may also differ significantly for individual boilers, depending on the role that a given boiler plays in the technological system of the heat source, whether it is a so-called basic boiler or a peak boiler. For example, the authors examining the operating efficiencies of steam boilers in a heating plant for boilers with a nominal efficiency of approx. 92% obtained operating efficiency values for a basic steam boiler on average approx. 84.9%, and for a peak boiler on average approx. 76.2%. The boiler tests were carried out for 18 months, dividing this time period into 44 equal balance periods. The operating efficiency of the basic boiler ranged from 81.5% to 86.5%, and the peak boiler from 41% to 87.2% [22].
The results of calculations of the average daily operating efficiency for boiler K7 before installation (2010) and after installation (2013) of the TES are presented in Figure 7. In 2013, these efficiencies increased significantly in the vast majority of days, i.e. from a few to even several dozen percent compared to 2010, which is undoubtedly the result of the installation of the TES and the operation of the K7 boiler in more stable conditions and with equal heat output, as well as its continuous operation (a small number of hours of boiler operation in transient conditions).
Both in 2010 and 2013, the K7 boiler was the basic unit in the technological system of the CHP plant generating heat throughout the heating season and operated the highest number of hours among all CHP boilers in these years.
4.1.2. Covering Peak Heat Demand – Fewer Start-Ups and Shorter Operating Time of Peak Boilers
Low operating efficiencies of peak load boilers are influenced by long start-up and shutdown times. For this type of power boilers that are in operation in the Siekierki and Białystok CHP plants, these times, depending on whether these boilers are currently in hot or cold reserve, usually range from approximately 100 to 600 minutes [23]. During the start-up of up to 600 minutes and during the shutdown of the boiler from the operation of several hundred minutes, the boiler operates in unsteady conditions with an efficiency much lower than the nominal value. After the installation of a TES in the CHP plant, the number of start-ups of peak boilers usually decreases very significantly, which results in the avoidance of peak heat production with such low operating efficiencies. Ultimately, this results in a reduction in the emission of pollutants into the atmosphere.
In the analyzed case, the number of start-ups of the peak-load boiler was 25% lower in the system with a TES than in the operation of the CHP plant without the TES [20].
4.1.3. Generation of Additional Electricity in the CHP Plant During Periods of Peak Demand and High Prices
Increasing the amount of electricity generated in cogeneration, i.e. the possibility of generating additional electricity in the CHP plant during periods of peak demand and its high prices, also has an environmental effect, in addition to the energy and financial effects. The energy effect is related to the increased energy efficiency of the combined process compared to the efficiency of the separate heat and electricity generation processes. It is associated with a corresponding ecological effect resulting from a smaller amount of fuel burned in order to produce the same amount of energy in the combined and separate processes. By increasing the amount of electricity produced in cogeneration, the amount needed to generate electricity in existing condensing power plants, which only produce electricity, is reduced.
The above-mentioned ecological effects are not the subject of analysis in this paper and should be the subject of detailed studies at a later stage of research.
4.2. Determination of the Energy Effect of the Use of a TES in the CHP Plant
The preliminary analysis of the environmental impact of the operation of the TES system was carried out on the basis of operational data for the selected CHP plant for the years 2008 - 2009, i.e. before and after the installation of the TES in the Siekierki CHP plant.
The calculations of the average annual overall efficiency of CHP Siekierki plant were carried out in accordance with Directive (EU) 2018/2002 [24] on energy efficiency and the Regulation of the Minister of Energy of 10 April 2017 which provides an appropriate formula [25]. The overall efficiency of the plant translates directly into the energy effect.
The results of calculations of the average annual overall efficiency of Siekierki plant indicate an increase in its efficiency from 86.6% in 2008 to 87.3% in 2009 [2]. Although this is not a very significant change (2009 was the implementation year for the TES and the overall efficiency of the CHP plant was already very high), it is a change that gives a concrete effect. Significant effects, including economic ones, of the use of TES in the CHP plant have also been defined in their papers [6,26].
4.3. Comparison of the Emission of PM10 in the Siekierki CHP Plant Before and After the Installation of the TES
The results of measurements of PM10 emissions in 2008, i.e. in the last year of operation of the Siekierki CHP plant without a TES, and in 2009, i.e. in the first year of operation of the plant with a TES are presented in Figure 8.
The graph shows a significant decrease in PM emissions in 2009 compared to 2008. This decrease in particulate emissions is primarily the result of a much smaller number of start-ups peak boilers, as well as stabilized thermal efficiency (operation with practically constant thermal power) on a daily basis of generating units, i.e. boilers and heat exchangers, which is the result of the use of a TES in the plant. The operation of peak-load boilers is usually short-lived, and the unstable operating conditions of these boilers at the time of start-up and at shutdown cause a decrease in the efficiency of particulates removal of dedusting equipment as a result of highly variable flue gas streams.
When comparing the amount of PM10 emissions to the atmospheric air in 2008 and 2009, the annual volume of energy production in the Siekierki CHP plant, climatic conditions (length of the heating season, outside air temperatures), as well as operating conditions and technical condition of energy production equipment and flue gas dedusting installations in these two analyzed years were not taken into account.
4.4. Comparative Analysis of the Impact of the Use and Operation of TES in the CHP Plant on the Emission of Pollutants
The basic task enabling the performance of a comparative analysis of the impact of the use of TES in the CHP plant on the emission of pollutants into the atmosphere is the selection of the compared years before and after the installation of the TES, so that these years are characterized by similarity in terms of the volume of electricity and heat production and climatic similarity, i.e. the selection of such years that will enable the determination of the objective difference in the emission of pollutants before and after the implementation of TES in the CHP plant, i.e. choice of "base" and "comparative" years. An important issue in the selection of these years is the use of the same energy generation technologies and fuels used for its production, which means that, for example, even modernization activities in the boiler increasing its energy efficiency carried out in the "comparative" year may to some extent distort the result of this analysis. For this reason, the analysis should compare these years as closely as possible, but characterized by a similar amount of total heat and electricity production under comparable climatic conditions (similar values of the degree days). Another issue is the selection of a model of the spread of pollutants, enabling the use of the same meteorological characteristics for both compared time periods in terms of parameters entered into the calculation model.
In the presented comparative analysis, the so-called Comparative Index (CI) was introduced, which allows to objectify the results obtained. This indicator includes both the amount of energy production in a given year and the climatic characteristics of that year expressed by the annual number of heating degree days. Thus, the CI for the analyzed years should have a similar value in order for the results of the comparative analysis to be fully representative.
The Comparative Index is defined as follows:
where
CI = (Pe,tot + Ph,tot) / Sd
Pe,tot : total production of electricity, GJ
Ph,tot : total production of heat, GJ
Sd : annual number of heating degree days
The values of the CI for the analyzed years for the Siekierki and the Białystok CHP plants are as follows:
Siekierki CHP plant:
CI (2008) = 10094 GJ/Sd
CI (2009) = 8830 GJ/Sd
Białystok CHP plant:
CI (2008) = 1531 GJ/Sd
CI (2009) = 1597 GJ/Sd
Thus, the results of the comparative analysis for Siekierki CHP plant are not fully representative. On the other hand, the CI has practically the same value (the difference between the indexes is 4%) for Białystok CHP plant in 2010 and in 2013, i.e. before and after the installation of the TES.
5. Results
In view of the values of CI, only the results of measurements and calculations for Białystok CHP plant for the base and the comparative years were presented as representative results of the analysis.
5.1. Particulates Emissions
The results of measurements of PM10 emission on individual days of 2010 and in 2013 are presented in Figure 9.
The results of the measurements clearly show the positive impact of the TES installation on the amount of PM10 emissions into the atmosphere. The average decrease in the emission of PM10 in the heating season ranges from 10 to 50%, while in the summer season the values of particulates emissions in these two analyzed years are at a comparable level.
5.2. Quantities of Emission of Particulates
Reference values and limit levels for the analyzed particulates in the air for the Polish area and periods for which the reference values are averaged are presented in Table 5 [18].
The maximum values of concentrations in the receptor network in 2010 and 2013 are presented in Table 6 and Table 7.
PM10
In 2010, the highest value of one-hour concentrations of PM10 was 12.6 μg/m3, in 2013: 10.6 μg/m3. No exceedances of one-hour concentrations were found. The highest value of annual average concentrations was 0.121 μg/m3 in 2010, and in 2013: 0.090 μg/m3. These values did not exceed the permissible value (Da-R) = 40 µg/m3. Spatial distributions of PM10 concentrations in the air for 2010 are shown in Figure 10a, Figure 10b, and for 2013 in Figure 11a, Figure 11b.
PM2.5
In 2010, the highest value of one-hour concentrations of PM2.5 was 7.6 μg/m3, in 2013: 6.3 μg/m3. In 2010, the highest value of annual average concentrations was 0.072 μg/m3 and did not exceed the permissible value (Da-R) = 29 μg/m3, while in 2013 it amounted to 0.054 μg/m3 and did not exceed the permissible value (Da-R) = 26 μg/m3. Spatial distributions of PM2.5 concentrations in the air for 2010 are presented in Figure 12a, Figure 12b, and for 2013 in Figure 13a, Figure 13b
5.3. Total Annual and Maximum Emissions of PM10 and PM2.5 in the Analyzed Periods
The total annual emission [Mg] and the maximum hourly emission [kg/h] for PM10 and PM2.5 determined by the calculation program Operat FB [27] are presented in Table 8.
The calculations show that the level of reduction of the total annual and maximum emissions of PM10 and PM2.5 in 2013 compared to 2010 were at a high level, i.e. about 27-29%.
6. Predicting the Possibility of Smog Occurrence
Activities aimed at reducing atmospheric pollution, and in particular two critical components causing the formation of smog, i.e. PM2.5 and PM10 particles, have a particular impact on improving people's living conditions and reducing the number of deaths [28]. One of the methods of reducing the concentration of particulates in the air generated by CHP plants using fossil fuels or biomass as the basic fuel is the use of TES. The role of TES in reducing particulates emission is the possibility of introducing rational control of the heat source during periods of increased concentration of PM2.5 and PM10 particles in the air. In periods when there is a high risk of smog, heat should be directed to consumers from the TES, and the boilers will be out of service or their load will be significantly reduced during this time. Anticipating the occurrence of smog, the TES should be fully charged in the period preceding its occurrence. The boiler control algorithm must be coupled with a short-term forecasting system in terms of the level of pollutant concentrations in the atmosphere.
Air quality forecasting models are used to predict conditions conducive to smog. Most often, these models use a register of historical data on air quality parameters such as: concentration of PM2.5, PM10, O3, CO, NO2, SO2 as well as temperature, humidity, wind speed, atmospheric pressure. Information about the location of sources of pollutant emissions in the area, such as industrial plants, temporary traffic intensity (transport) and natural sources, is also important.
Air quality forecasting models often use a combination of atmospheric modeling, machine learning, and data analysis techniques. The effectiveness of forecasting depends on the availability and quality of input data, the accuracy of measurements, algorithms and analysis methods. An important parameter of the effectiveness of models is their territorial range. Local models have a higher accuracy of air quality forecasting. They use measurement data from local stations monitoring the concentration of pollutants and changes in weather conditions in a given area of the country [29,30].
There are many models for forecasting the concentration of pollutants in the air, including PM emissions, such as:
1. ISCST3 (Industrial Source Complex Short Term Version 3) model [31]: This is one of the most commonly used models for predicting the concentration of PM from industry. It takes into account the technical parameters of emission sources, such as the type of fuel, temperature and exhaust velocity of flue gases from the chimney, etc. as well as weather conditions and terrain.
2. AERMOD (Air Quality Model) [32]: This is a model used to predict the emission of PM, as well as other pollutants such as nitrogen oxides, sulfur dioxide, and others. This model takes into account both point and linear sources of pollutant emissions. It uses atmospheric transport equations and takes into account factors such as topography, atmospheric conditions, location of emission sources and characteristics of exhaust gases.
3. CALPUFF model (California Puff model) [33]: This is a model used to predict PM emissions and the long-term spread of pollutants in the atmosphere. The CALPUFF model takes into account the sources of point and diffuse pollutant emissions.
4. TAPM Model (The Air Pollution Model) [34]: This is a model used to predict the emission of PM and other atmospheric pollutants. The TAPM model takes into account different types of emission sources, such as industry, transport, domestic boiler rooms, etc. Forecasting algorithms use data on weather conditions, topography and dispersion of pollutants.
The use of a TES in an CHP or Heating plants and its appropriate operation during periods of smog hazard and smog occurrence will not eliminate the phenomenon of smog, but it may significantly reduce its nuisance, including reducing the concentration of air pollutants and the scale of this phenomenon. Thus, all activities that can lead to the reduction of smog and its nuisance are highly pro-ecological activities. Such activities also include the installation of TES in CHP and Heating plants, and the quantification of the potential for the impact of the use of TES on reducing smog depends on many factors, primarily of a local nature, and will require further research and analysis.
7. Summary and Conclusion
Improving energy efficiency at the stage of cogeneration is one of the mechanisms for reducing the pressure of this type of energy sources on the environment and is an important element of the policy related to climate change mitigation and air protection. One of the ways to improve this energy efficiency, but also operational and ecological efficiency is to use TES systems in CHP plants supplying DHS.
The presented paper examines the impact of the use and operation of a TES built in a CHP plant supplying a large DHS on the amount of particulates emissions to the atmosphere. Detailed research and quantitative analyses were carried out for two i.e. Siekierki and Białystok CHP plants supplying heat to DHS.
Through the use of a TES in the CHP plant, the reduction of pollutant emissions is the result of:
- − increase in the operational efficiency of boilers through their stable operation, with an even heat load.
The presented results of calculations of the average daily value of operating efficiency for boiler K7 (basic boiler in the Białystok CHP Plant) before and after installation of the TES in the plant on the vast majority of days of the comparative year increased significantly, i.e. from several to even several dozen percent compared to the base year (Figure 7), which is undoubtedly the result of the installation of the TES, continuous operation of boiler K7 in more stable conditions and with equalized heat load.
- − covering the peak demand for heat, i.e. the possibility of avoiding the temporary start-up of peak boilers and their possible shorter operation.
For example, after the installation of a TES in the Białystok CHP plant, the number of start-ups the peak boiler decreased by 25%. Finally, this results in a reduction in the emission of particulates.
- − increase in the amount of electricity generated in cogeneration, i.e. the possibility of generating additional electricity in the CHP plant during periods of peak demand and high prices. The resulting ecological effects were not analyzed in this study and should be the subject of detailed studies at a later stage of research.
The volume of the energy effect of the TES installation was calculated for the Siekierki CHP plant and it resulted in an increase in the average annual overall efficiency of the CHP plant in the process of the high-efficiency cogeneration from 86.6% to 87.3%.
The annual emission of gaseous pollutants from the combustion of fuels in heat sources supplying the DHS depends on many factors. The main factors of impact in the analyzed year include the volume of electricity and heat production, climatic conditions, as well as the conditions and methods of operation of energy generating equipment, environmental protection installations and their technical condition. Thus, in order to objectify the results of the comparative analysis of the impact of TES use in CHP plant on the emission of particulates into the atmosphere, the Comparative Index (CI) was introduced. The CI for the analyzed years before and after the installation of the TES in the CHP plant should have a similar value so that the results of the comparative analysis are fully representative. This condition is met for the selected base and comparative year for the CHP Plant and DHS in Białystok, hence the results of the comparative analysis are presented for this facility.
Finally, the following environmental effects related to the reduction of particulates emissions have been achieved, i.e.:
- the total annual emission of PM10 and PM2.5 decreased by 27% and the maximum emission by 29%,
- the average decrease in the emission of PM10 as a result of the use of a TES in the heating season ranged from 10 to 50%, while in the summer season the values of emissions in these two analyzed years are at a comparable level,
-
PM10
- The highest value of one-hour concentrations was 12.6 µg/m3 (2010) and 10.6 µg/m3 (2013). No exceedances of one-hour concentrations were found.
- The highest value of annual average concentrations was 0.121 µg/m3 (2010) and 0.090 µg/m3 (2013). These values did not exceed the permissible value (Da-R) = 40 μg/m3,
-
PM2.5
- the highest value of one-hour concentrations was 7.6 µg/m3 (2010) and 6.3 µg/m3 (2013).
- the highest value of annual average concentrations was 0.072 μg/m3 (2010) and did not exceed the permissible value (Da-R) = 29 μg/m3, while in 2013 it was 0.054 μg/m3 and did not exceed the permissible value (Da-R) = 26 μg/m3,
- Particulates fallout – in 2010, the maximum particulates fallout (not taking into account the background) was 2.39 g/m2/year, while in 2013 it was 2.07 g/m2/year.
Referring to the particularly burdensome form of the presence of particulates and other pollutants in the ambient air in the form of smog, it has been proposed to use TES to reduce the occurrence and nuisance of this phenomenon. It is possible that during the risk of smog, heat is directed to consumers from the TES, and the boilers should not work during this time or their load will be significantly reduced. Anticipating the occurrence of smog, the TES should be fully charged beforehand. The CHP plant control algorithm must be coupled with a short-term forecasting system in terms of the level of pollutant concentration in the atmosphere. Models for forecasting the concentration of pollutants in the air, including particulates emissions, can also be used in these projects.
Author Contributions
Conceptualization, R.Z. and O.N.; methodology, M.Z and O.N.; formal analysis, M.Z.; investigation, M.Z. and R.Z.; resources, R.Z. and M.Z.; data curation, M.Z.; writing—original draft preparation, R.Z.; writing—review and editing, R.Z. and O.N.; visualization, M.Z.; supervision, R.Z. All authors have read and agreed to the published version of the manuscript.
Funding
This research was funded by the Warsaw University of Technology within the IDUB-Open Science Program.
Institutional Review Board Statement
Not applicable.
Informed Consent Statement
Not applicable.
Data Availability Statement
The original contributions presented in the study are included in the article, further inquiries can be directed to the corresponding author.
Conflicts of Interest
The authors declare no conflicts of interest.
Nomenclature
| Pe,tot | total production of electricity, GJ |
| Ph,tot | total production of heat, GJ |
| Sd | annual number of heating degree days |
Abbreviations
| CI | Comparative Index, |
| CHP | Combined Heat and Power |
| CP | Charging Pump |
| Da-R | annual permissible concentration of the substance in the atmosphere decreased by the background concentration |
| DHS | District Heating Systems |
| DP | Discharging Pump |
| PM | Particulate Matters, |
| TES | Thermal Energy Storage |
| TSP | Total Suspended Particulates, |
References
- Holmér, P.; Ullmark, J.; Göransson, L.; Walter, V.; Johnsson, F. Impacts of thermal energy storage on the management of variable demand and production in electricity and district heating systems: a Swedish case study. Int. J. Sustain. Energy 2020, 39, 446–464. [Google Scholar] [CrossRef]
- Zwierzchowski, R. Wpływ zastosowania akumulatora ciepła w miejskim systemie ciepłowniczym na sprawność energetyczną elektrociepłowni i emisję zanieczyszczeń pyłowych do atmosfery. 2019, 1, 5–9. [Google Scholar] [CrossRef]
- Zwierzchowski, R. Analysis of hydraulic systems in combined heat and power plants and heating plants with heat accumulator. Scientific papers. Environmental Engineering z. 64, Warsaw University of Technology, Warsaw University of Technology Publishing House, Warsaw, 2013, pp. 1-136. (in Polish) http://yadda.icm.edu.pl/baztech/element/bwmeta1.element. 8268. [Google Scholar]
- Dincer, I.; Rosen, M.A. Thermal Energy Storage. Systems and Applications. Third Edition. Hoboken, NJ: Wiley, 2021, ISBN: 978-1-119-71315-9. https://www.wiley. 9781. [Google Scholar]
- Dincer, I. On thermal energy storage systems and applications in buildings. Energy Build. 2001, 34, 377–388. [Google Scholar] [CrossRef]
- Verda, V.; Colella, F. Primary energy savings through thermal storage in district heating networks. Energy 2011, 36, 4278–4286. [Google Scholar] [CrossRef]
- Tehrani, S.S.M.; Saffar-Avval, M.; Kalhori, S.B.; Mansoori, Z.; Sharif, M. Hourly energy analysis and feasibility study of employing a thermocline TES system for an integrated CHP and DH network. Energy Convers. Manag. 2013, 68, 281–292. [Google Scholar] [CrossRef]
- Turunen, J.; Majanne, Y.; Vilkko, M. Short-term Optimization of the Operation of the CHP District Heating Plant with Heat Accumulator. IFAC-PapersOnLine 2020, 53, 13236–13241. [Google Scholar] [CrossRef]
- Cabeza, L.F.; Miró, L.; Oró, E.; de Gracia, A.; Martin, V.; Krönauer, A.; Rathgeber, C.; Farid, M.M.; Paksoy, H.O.; Martínez, M.; et al. CO 2 mitigation accounting for Thermal Energy Storage (TES) case studies. Appl. Energy 2015, 155, 365–377. [Google Scholar] [CrossRef]
- Denholm, P.; Kulcinski, G.L. Life cycle energy requirements and greenhouse gas emissions from large scale energy storage systems. Energy Convers. Manag. 2004, 45, 2153–2172. [Google Scholar] [CrossRef]
- Sarbu, I.; Sebarchievici, C. A Comprehensive Review of Thermal Energy Storage. Sustainability 2018, 10, 191. [Google Scholar] [CrossRef]
- Denholm, P.; Holloway, T. Improved Accounting of Emissions from Utility Energy Storage System Operation. Environ. Sci. Technol. 2005, 39, 9016–9022. [Google Scholar] [CrossRef]
- Patterson, J.; Kulkarni, P.; Smith, M. Source Energy and Environmental Impacts of Thermal Energy Storage. 1996, California: California Energy Commission, Technical Report No. P500-95-005. https://www.pcmproducts.net/files/500_95_005_tes_report.
- Bogdan, *!!! REPLACE !!!*; Kopjar, D. Improvement of the cogeneration plant economy by using heat accumulator. Energy 2006, 31, 2285–2292. [Google Scholar] [CrossRef]
- Boldo, E.; Medina, S.; Le Tertre, A.; Hurley, F.; Mücke, H.-G.; Ballester, F.; Aguilera, I.; Daniel Eilstein on behalf of the Apheis group. Apheis: Health Impact Assessment of Long-term Exposure to PM2.5 in 23 European Cities. Eur. J. Epidemiol. 2006, 21, 449–458. [Google Scholar] [CrossRef] [PubMed]
- National Centre for Emissions Management (KOBiZE) (in Polish); https://www.kobize.
- Juda-Rezler, K.; Toczko, B. Fine particulate matter in the atmosphere. Compendium of knowledge about air pollution by particulate matter in Poland. Environmental Monitoring Library, 2016 (in Polish). https://powietrze.gios.gov.pl/pjp/documents/download/102507.
- National Emission Balance of SO2, NOx, CO, NH3, NMVOC, dust, heavy metals and POPs for the years 1990 – 2020, Ministry of Climate and Environment, 2022, pp. 17-23. (in Polish) https://bip.mos.gov.pl/fileadmin/user_upload/bip/rejestry_ewidence_archiwa/DPM/Bilans_emisji_za_lata_1990-2021.
- The state of the environment in Poland, Report 2022, Chief Inspectorate of Environmental Protection, Environmental Monitoring Library, 2022, pp. 47, (in Polish) https://www.teraz-srodowisko.pl/media/pdf/aktualnosci/14100-stan-srodowiska-w-Polsce-raport-2022.
- Ziomacka, M. Impact of the use of the Heat Accumulator in the CHP Plant on the emission of air pollutants. PhD Thesis, 2023, Warsaw University of Technology. (in Polish) https://is.pw.edu.pl/wp-content/uploads/2024/06/streszczenie_M.Ziomacka.
- Zwierzchowski, R. Characteristics of large thermal energy storage systems in Poland.CONFERENCE NAME, LOCATION OF CONFERENCE, COUNTRYDATE OF CONFERENCE; p. 00206.
- Bujak, J.; Majkowski, S.; Okoński, R. Thermal operating efficiency of a steam boiler room. Instal 2020, 11/2020, 14–18. [Google Scholar] [CrossRef]
- Węglowski, B. Operation of power boilers in transient conditions. Cracow University of Technology Publishing House, 2019, ISBN 978-83-65991-45-4. (in Polish). https://wydawnictwo.pk.edu.pl/produkt/praca-kotlow-energetycznych-w-warunkach-nieustalonych.
- Directive (EU) 2018/2002 of The European Parliament and of The Council of 11 December 2018, 2018, https://eur-lex.europa.eu/legal-content/EN/TXT/PDF/?uri=CELEX:32018L2002.
- Regulation of the Minister of Energy of 10 April 2017, Journal of Laws of 2017, 2017, item 834. (in Polish) https://isap.sejm.gov.pl/isap.nsf/DocDetails.xsp?id=WDU20170000834.
- Self, S.; Koohi-Faye, S.; Rosen, M.; Reddy, B. Effects on Environmental Impact and Economics of Component Efficiencies for a Heating System with Seasonal Thermal Storage. Res. J. Environ. Sci. 2017, 11, 5–17. [Google Scholar] [CrossRef]
- Software Operat FB by Proeko, R.S. https://www.proekors.
- Kowalski, M.; Kowalska, K.; Kowalska, M. Health benefits related to the reduction of PM concentration in ambient air, Silesian Voivodeship, Poland. Int. J. Occup. Med. Environ. Heal. 2015, 29, 209–217. [Google Scholar] [CrossRef]
- Hamed, H.H.; Jumaah, H.J.; Kalantar, B.; Ueda, N.; Saeidi, V.; Mansor, S.; Khalaf, Z.A. Predicting PM2.5 levels over the north of Iraq using regression analysis and geographical information system (GIS) techniques. Geomatics, Nat. Hazards Risk 2021, 12, 1778–1796. [Google Scholar] [CrossRef]
- Tian, J.; Liu, Y.; Zheng, W.; Yin, L. Smog prediction based on the deep belief - BP neural network model (DBN-BP). Urban Clim. 2022, 41. [Google Scholar] [CrossRef]
- Sharma, S.; Chandra, A. Simulation of Air Quality using an ISCST3 Dispersion Model. CLEAN – Soil, Air, Water 2008, 36, 118–124. [Google Scholar] [CrossRef]
- Katika, K.; Karuchit, S. Estimation of Urban Air Pollutant Levels using AERMOD: A Case Study in Nakhon Ratchasima, Thailand. IOP Conf. Series: Earth Environ. Sci. 2018, 164, 012024. [Google Scholar] [CrossRef]
- Rzeszutek, M. Parameterization and evaluation of the CALMET/CALPUFF model system in near-field and complex terrain - Terrain data, grid resolution and terrain adjustment method. Sci. Total. Environ. 2019, 689, 31–46. [Google Scholar] [CrossRef]
- Hurley, P.J.; Physick, W.L.; Luhar, A.K. TAPM: a practical approach to prognostic meteorological and air pollution modelling. Environ. Model. Softw. 2005, 20, 737–752. [Google Scholar] [CrossRef]
Figure 1.
The course of annual average concentrations of particulate matter PM2.5 in selected cities in Poland in the years 2010-2022.
Figure 1.
The course of annual average concentrations of particulate matter PM2.5 in selected cities in Poland in the years 2010-2022.

Figure 2.
The course of annual average concentrations of particulate matter PM10 in selected cities in Poland in the years 2010-2022.
Figure 2.
The course of annual average concentrations of particulate matter PM10 in selected cities in Poland in the years 2010-2022.
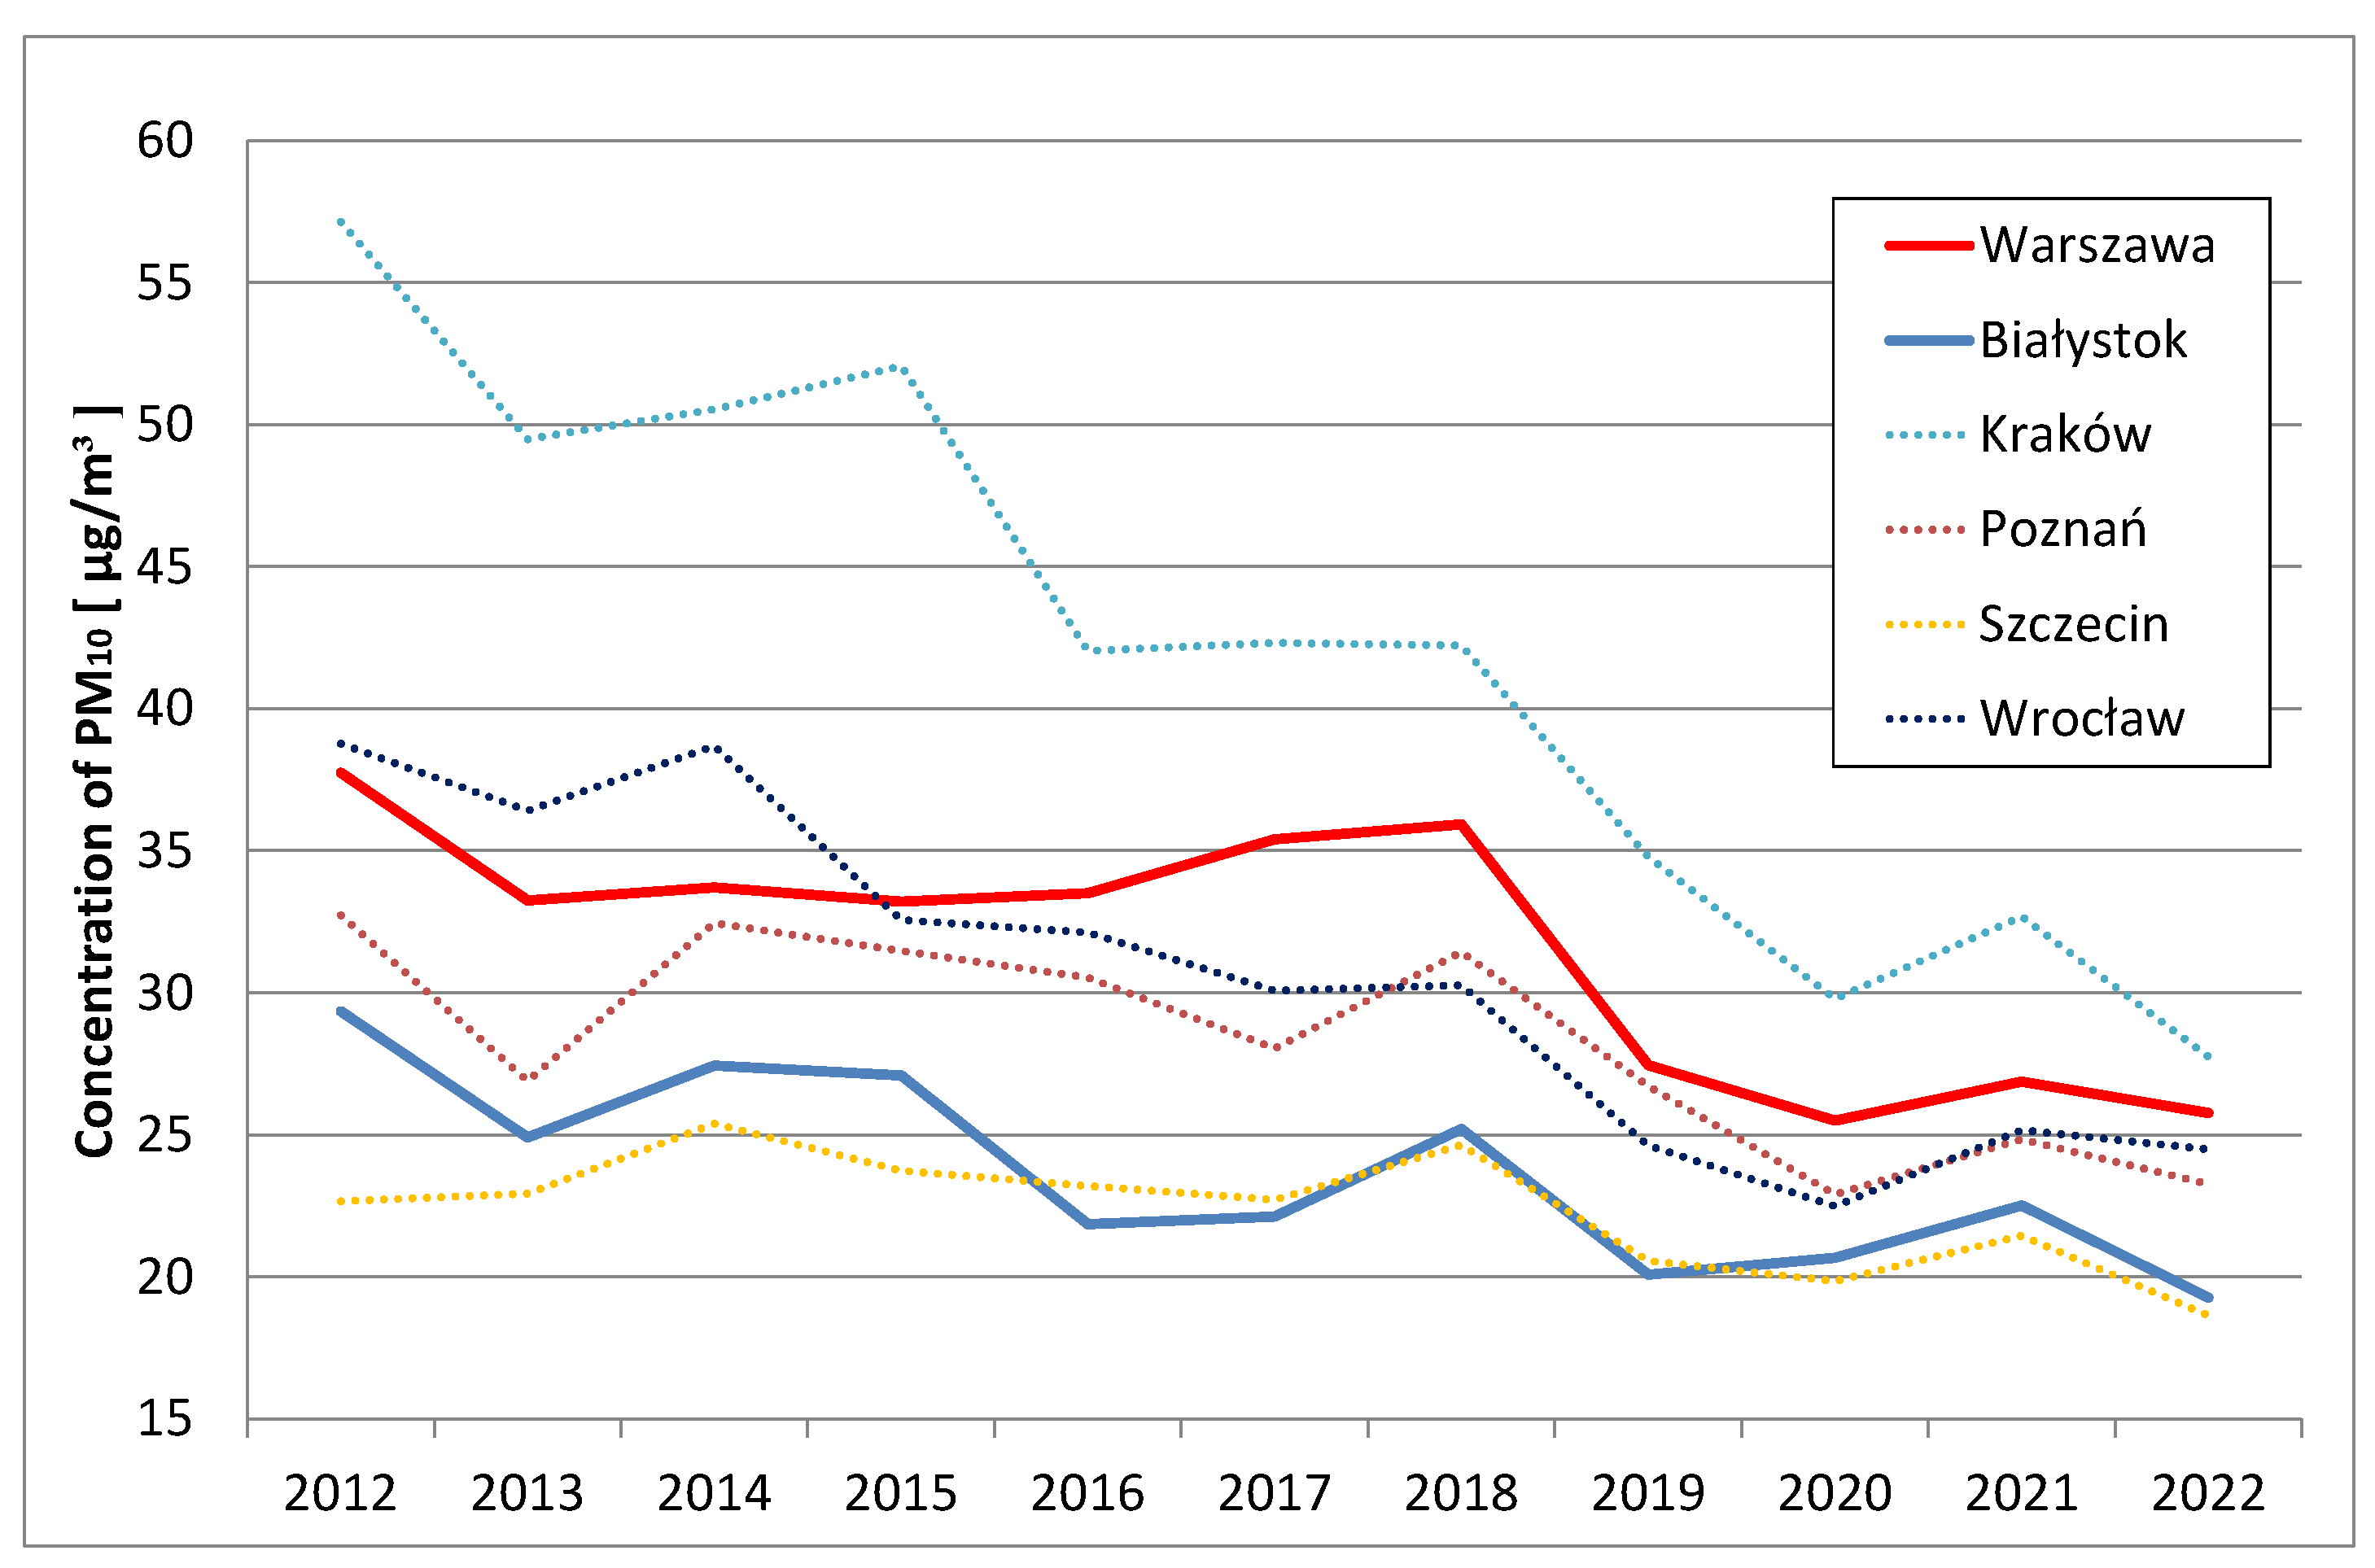
Figure 3.
Exposure of the urban population in Poland to air polluted with PM10 and PM2.5 in 2010-2022.
Figure 3.
Exposure of the urban population in Poland to air polluted with PM10 and PM2.5 in 2010-2022.
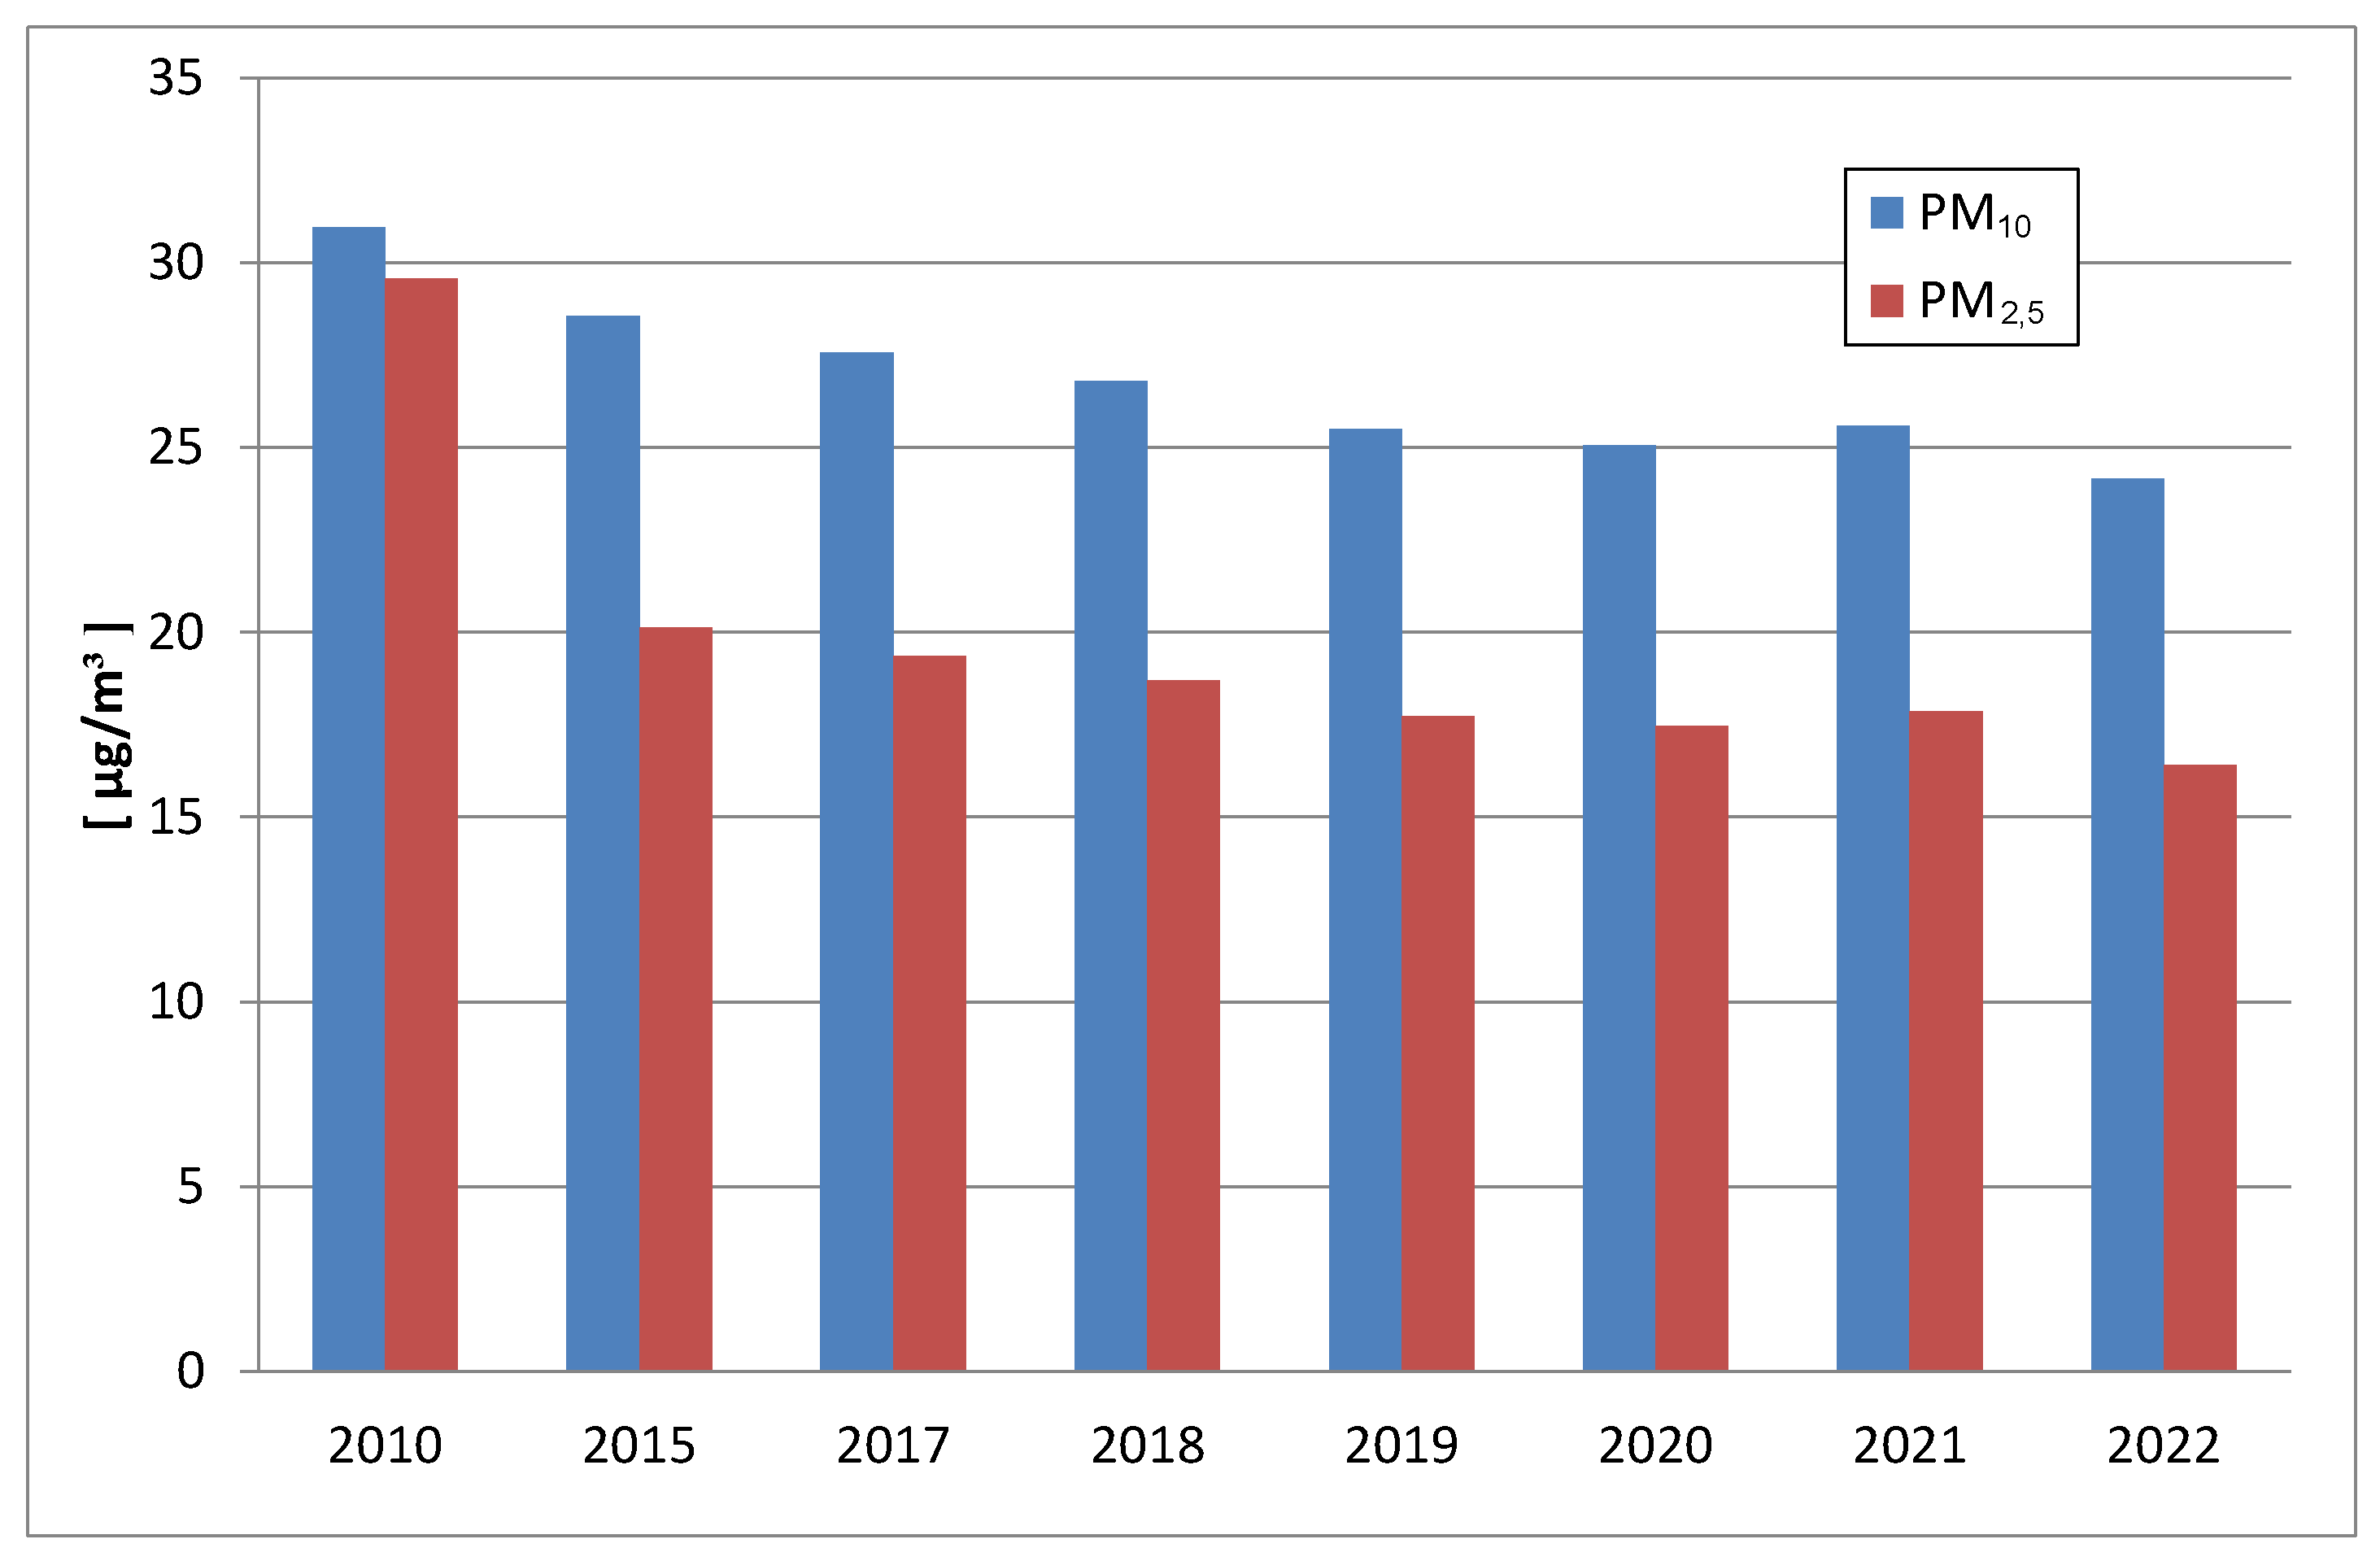
Figure 4.
View of the TES tank in: (a) the Siekierki-Warsaw CHP plant, (b) Białystok CHP plant.
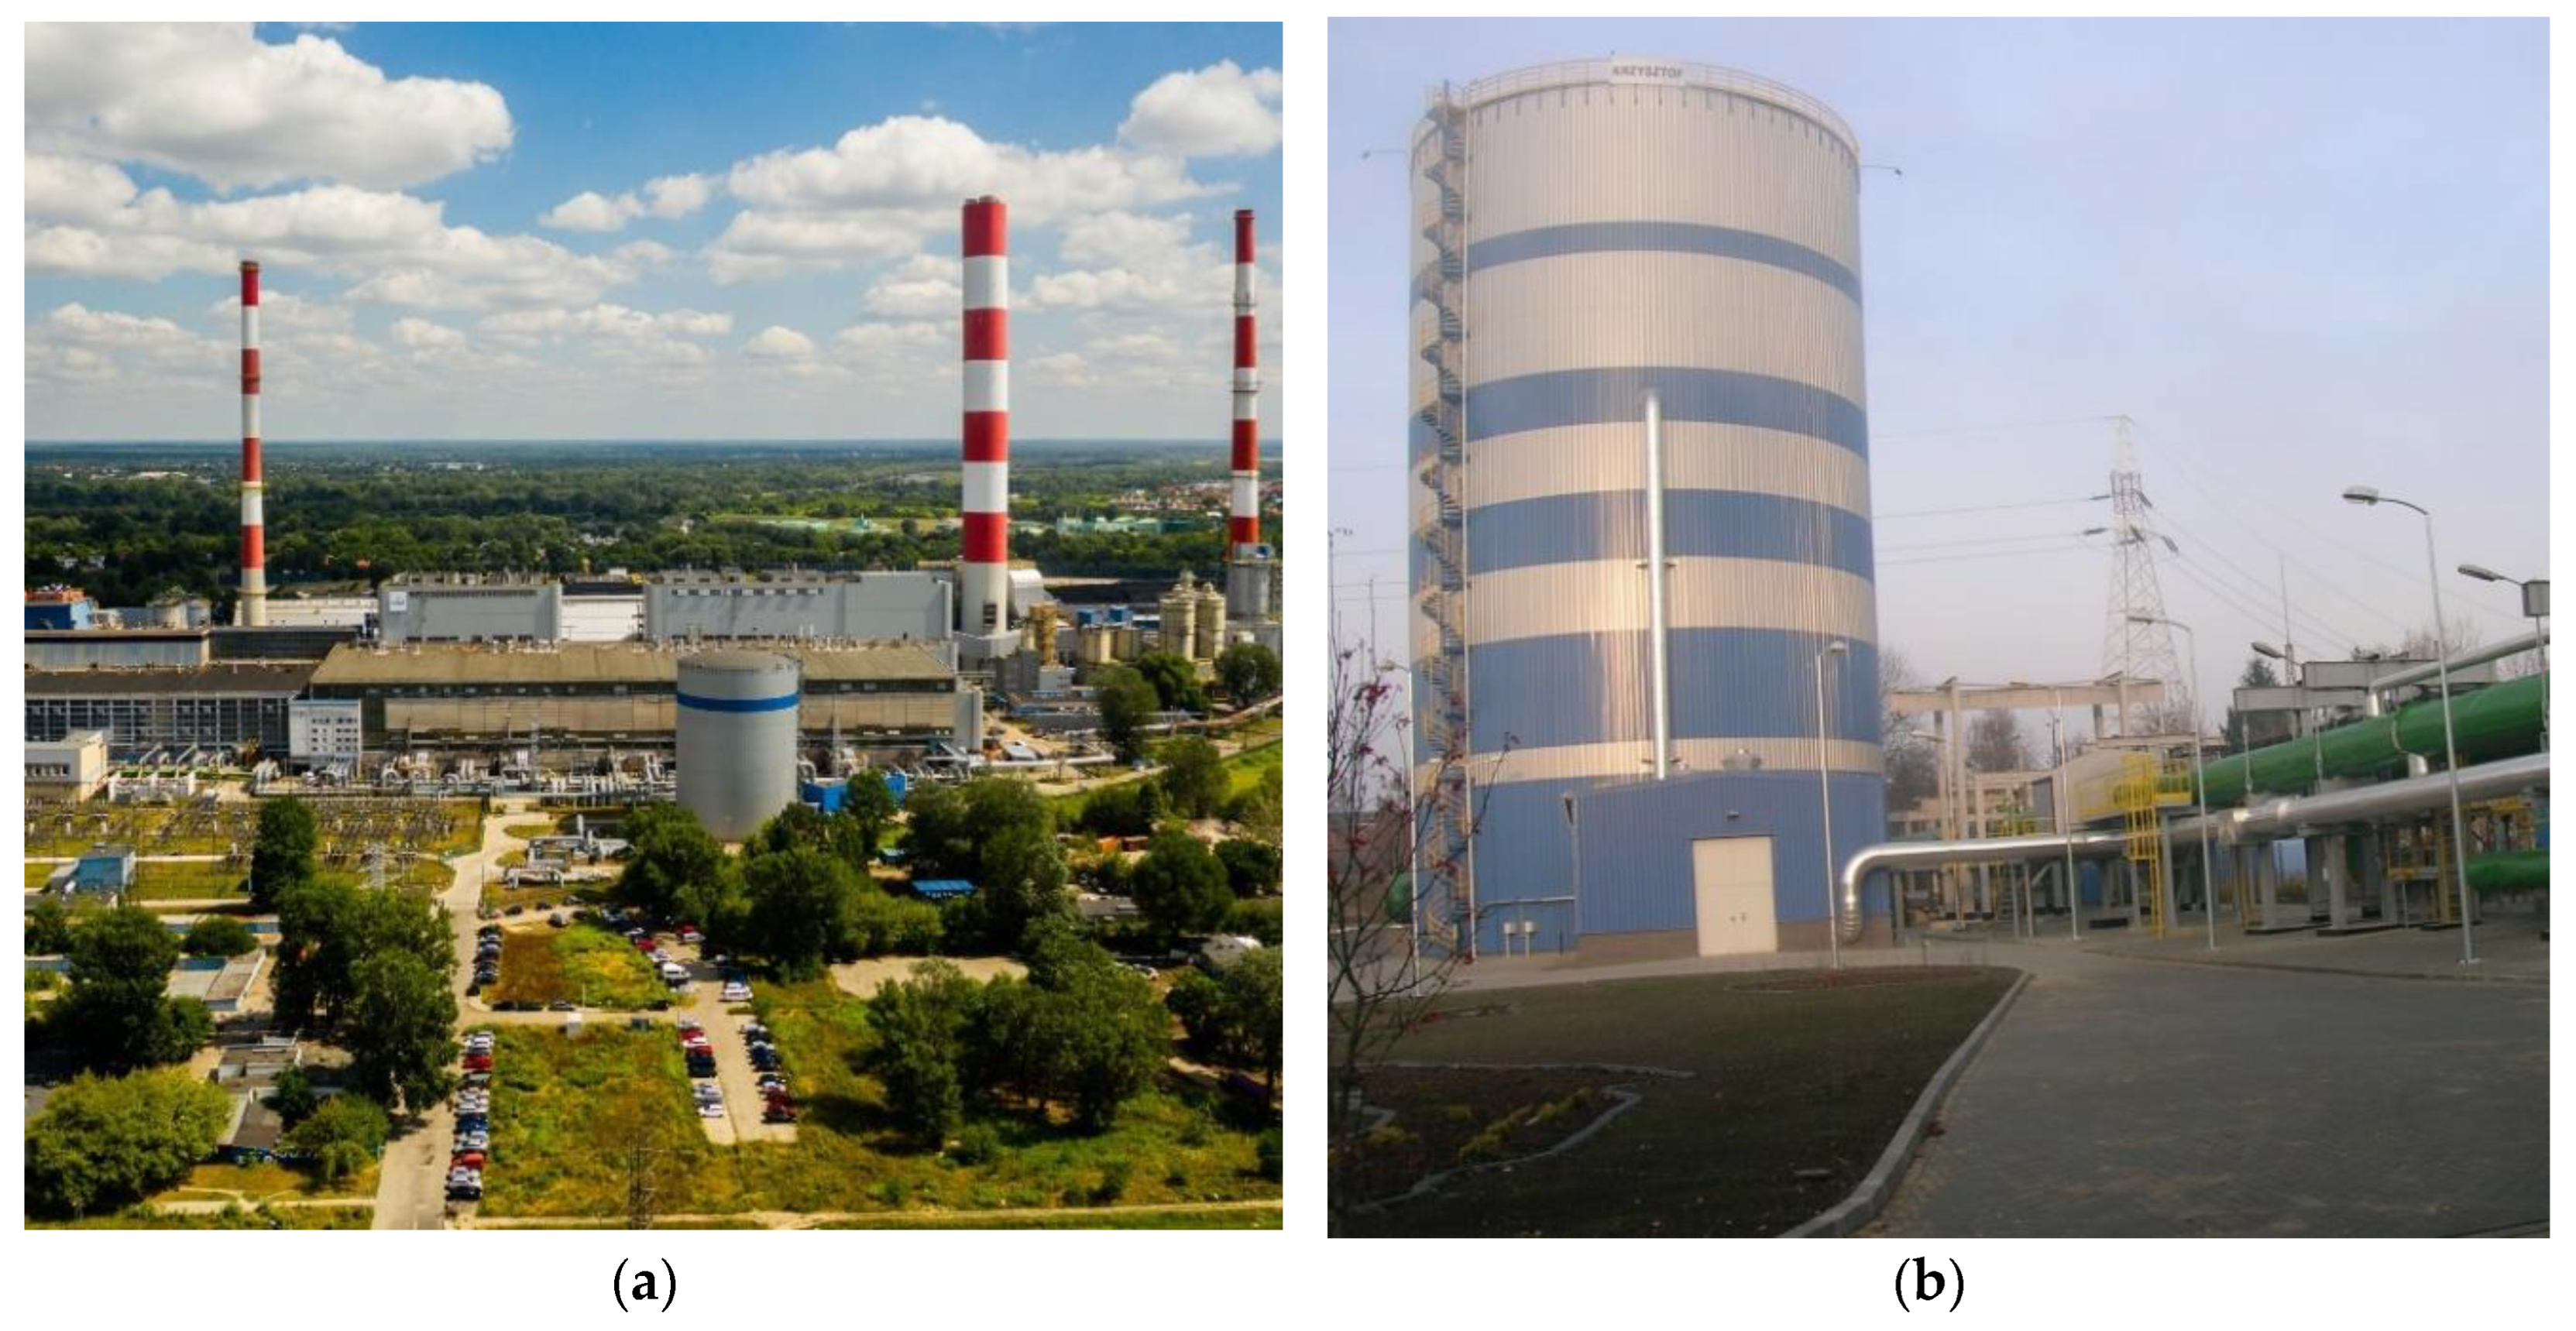
Figure 5.
TES hooked-up in the technological system of the Siekierki CHP plant.
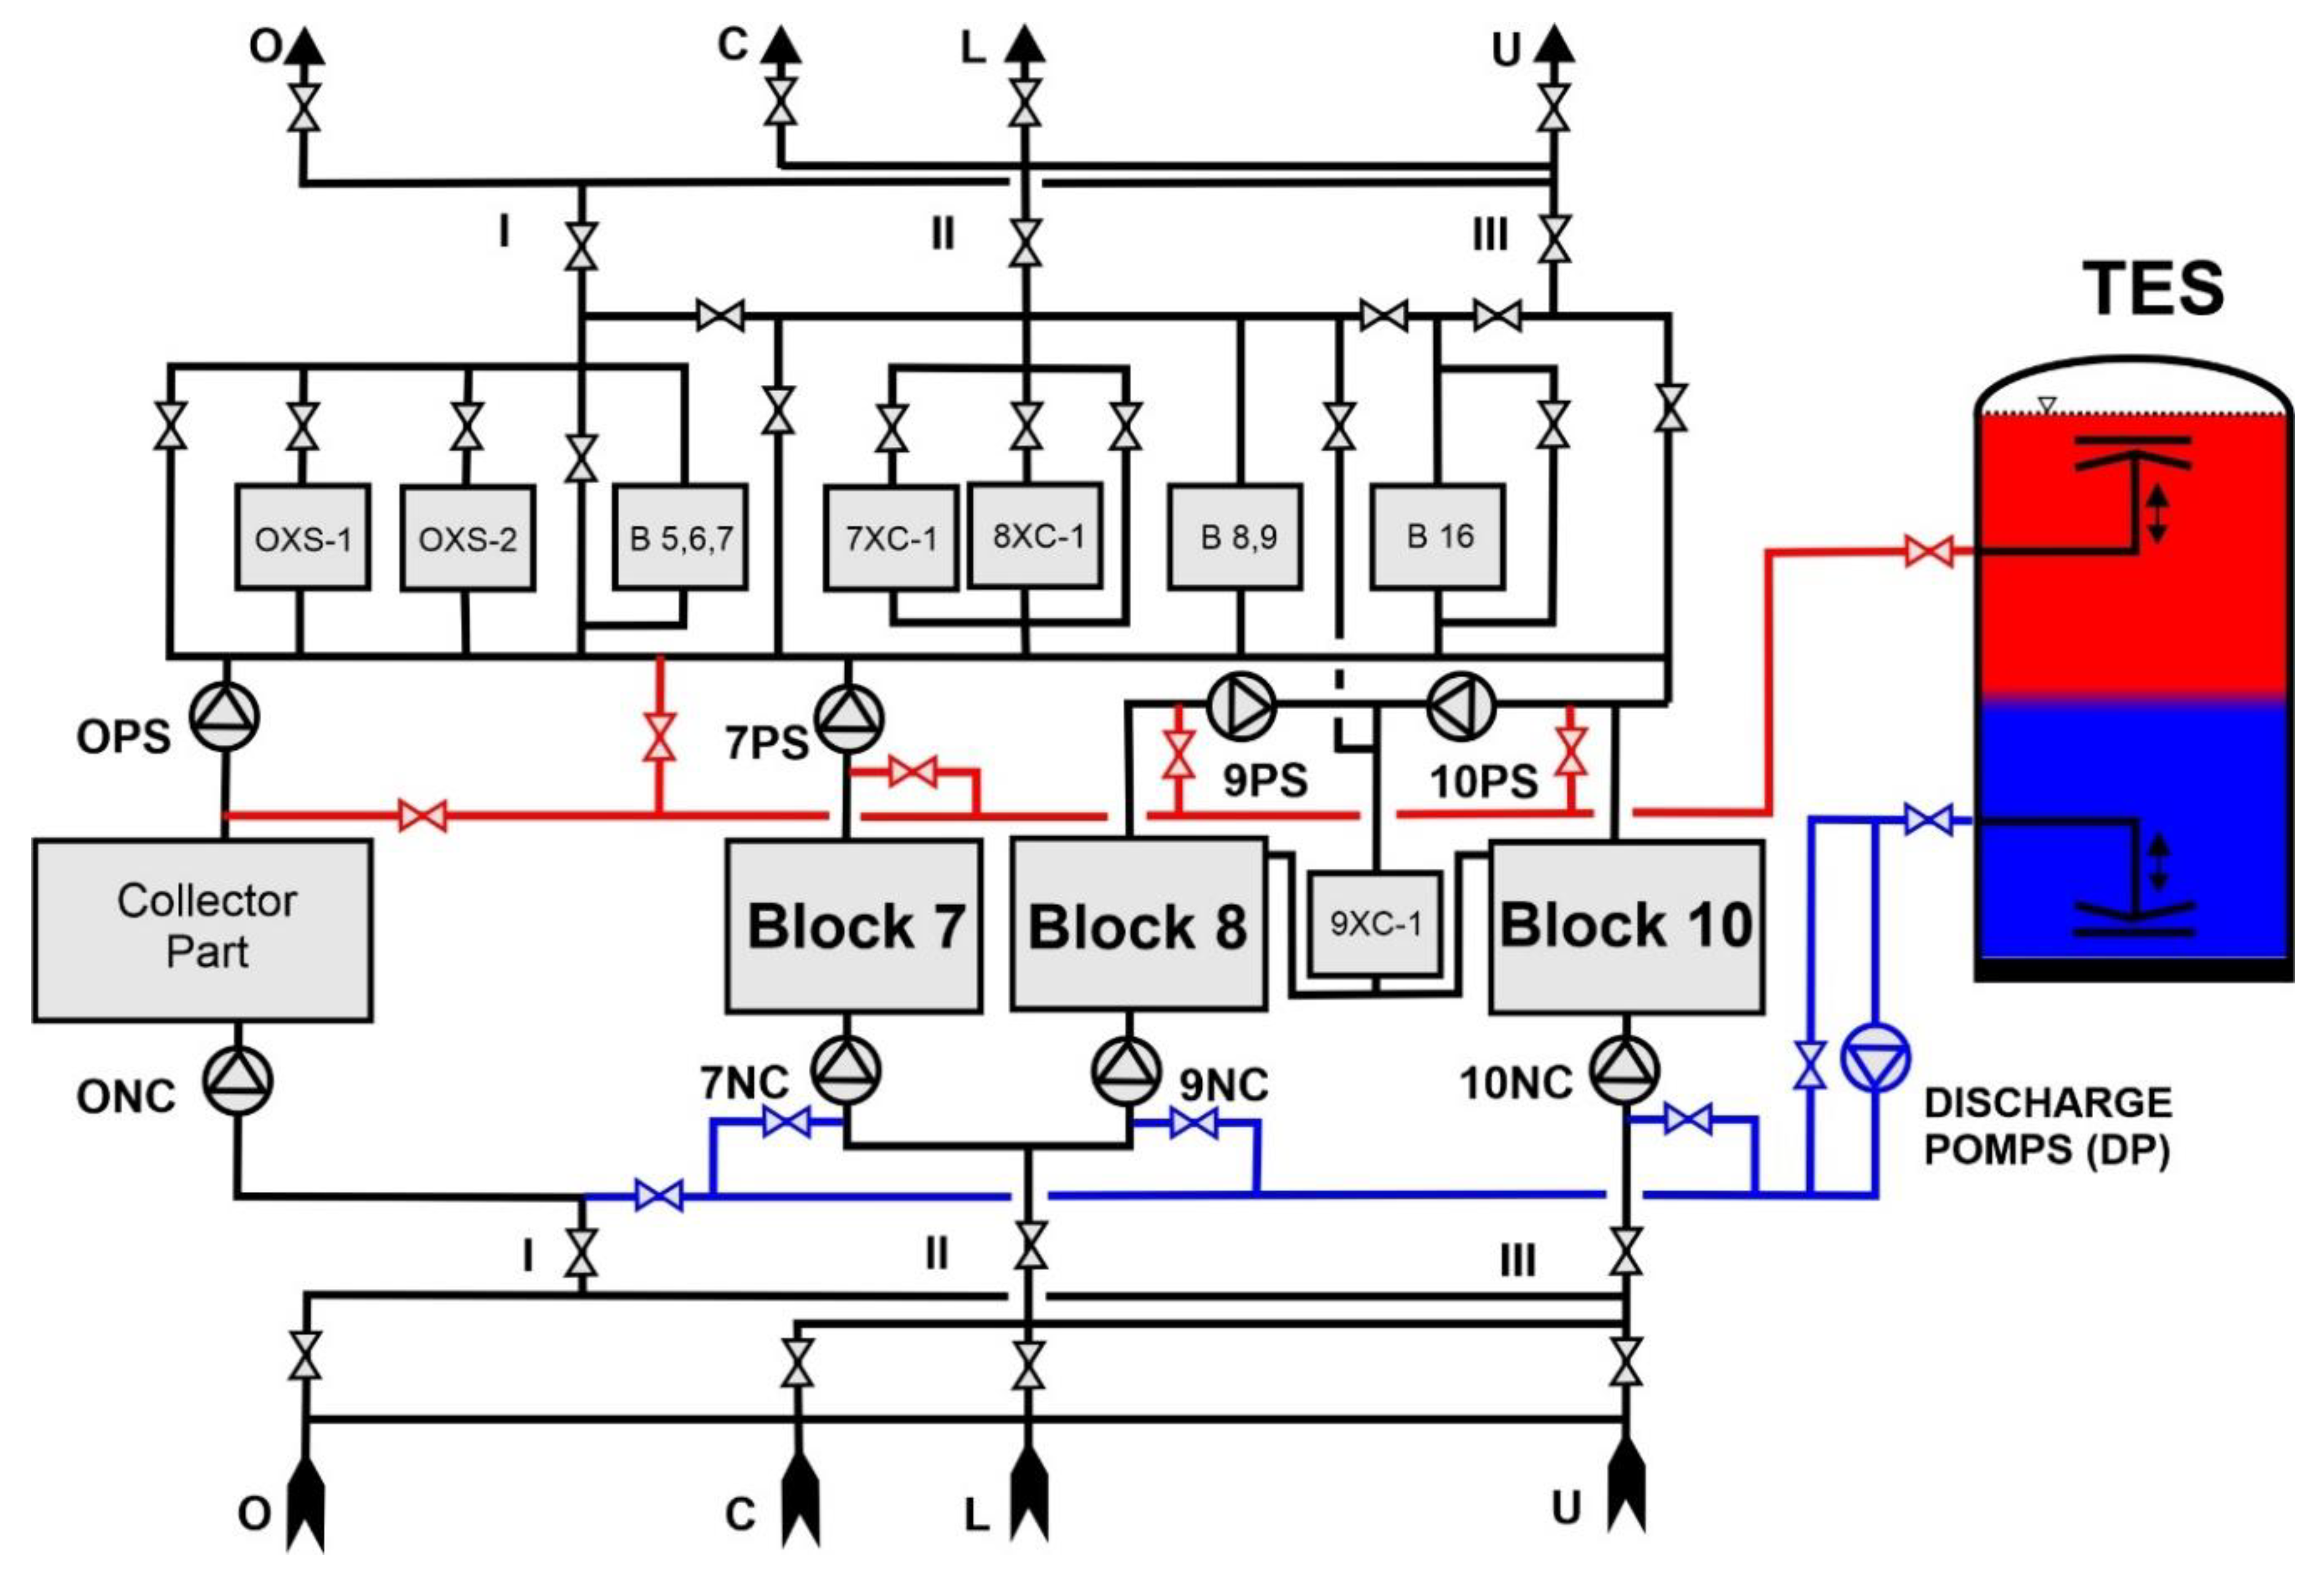
Figure 6.
Flow diagram of network water when charging the TES with a network water with a temperature exceeding 98°C.
Figure 6.
Flow diagram of network water when charging the TES with a network water with a temperature exceeding 98°C.
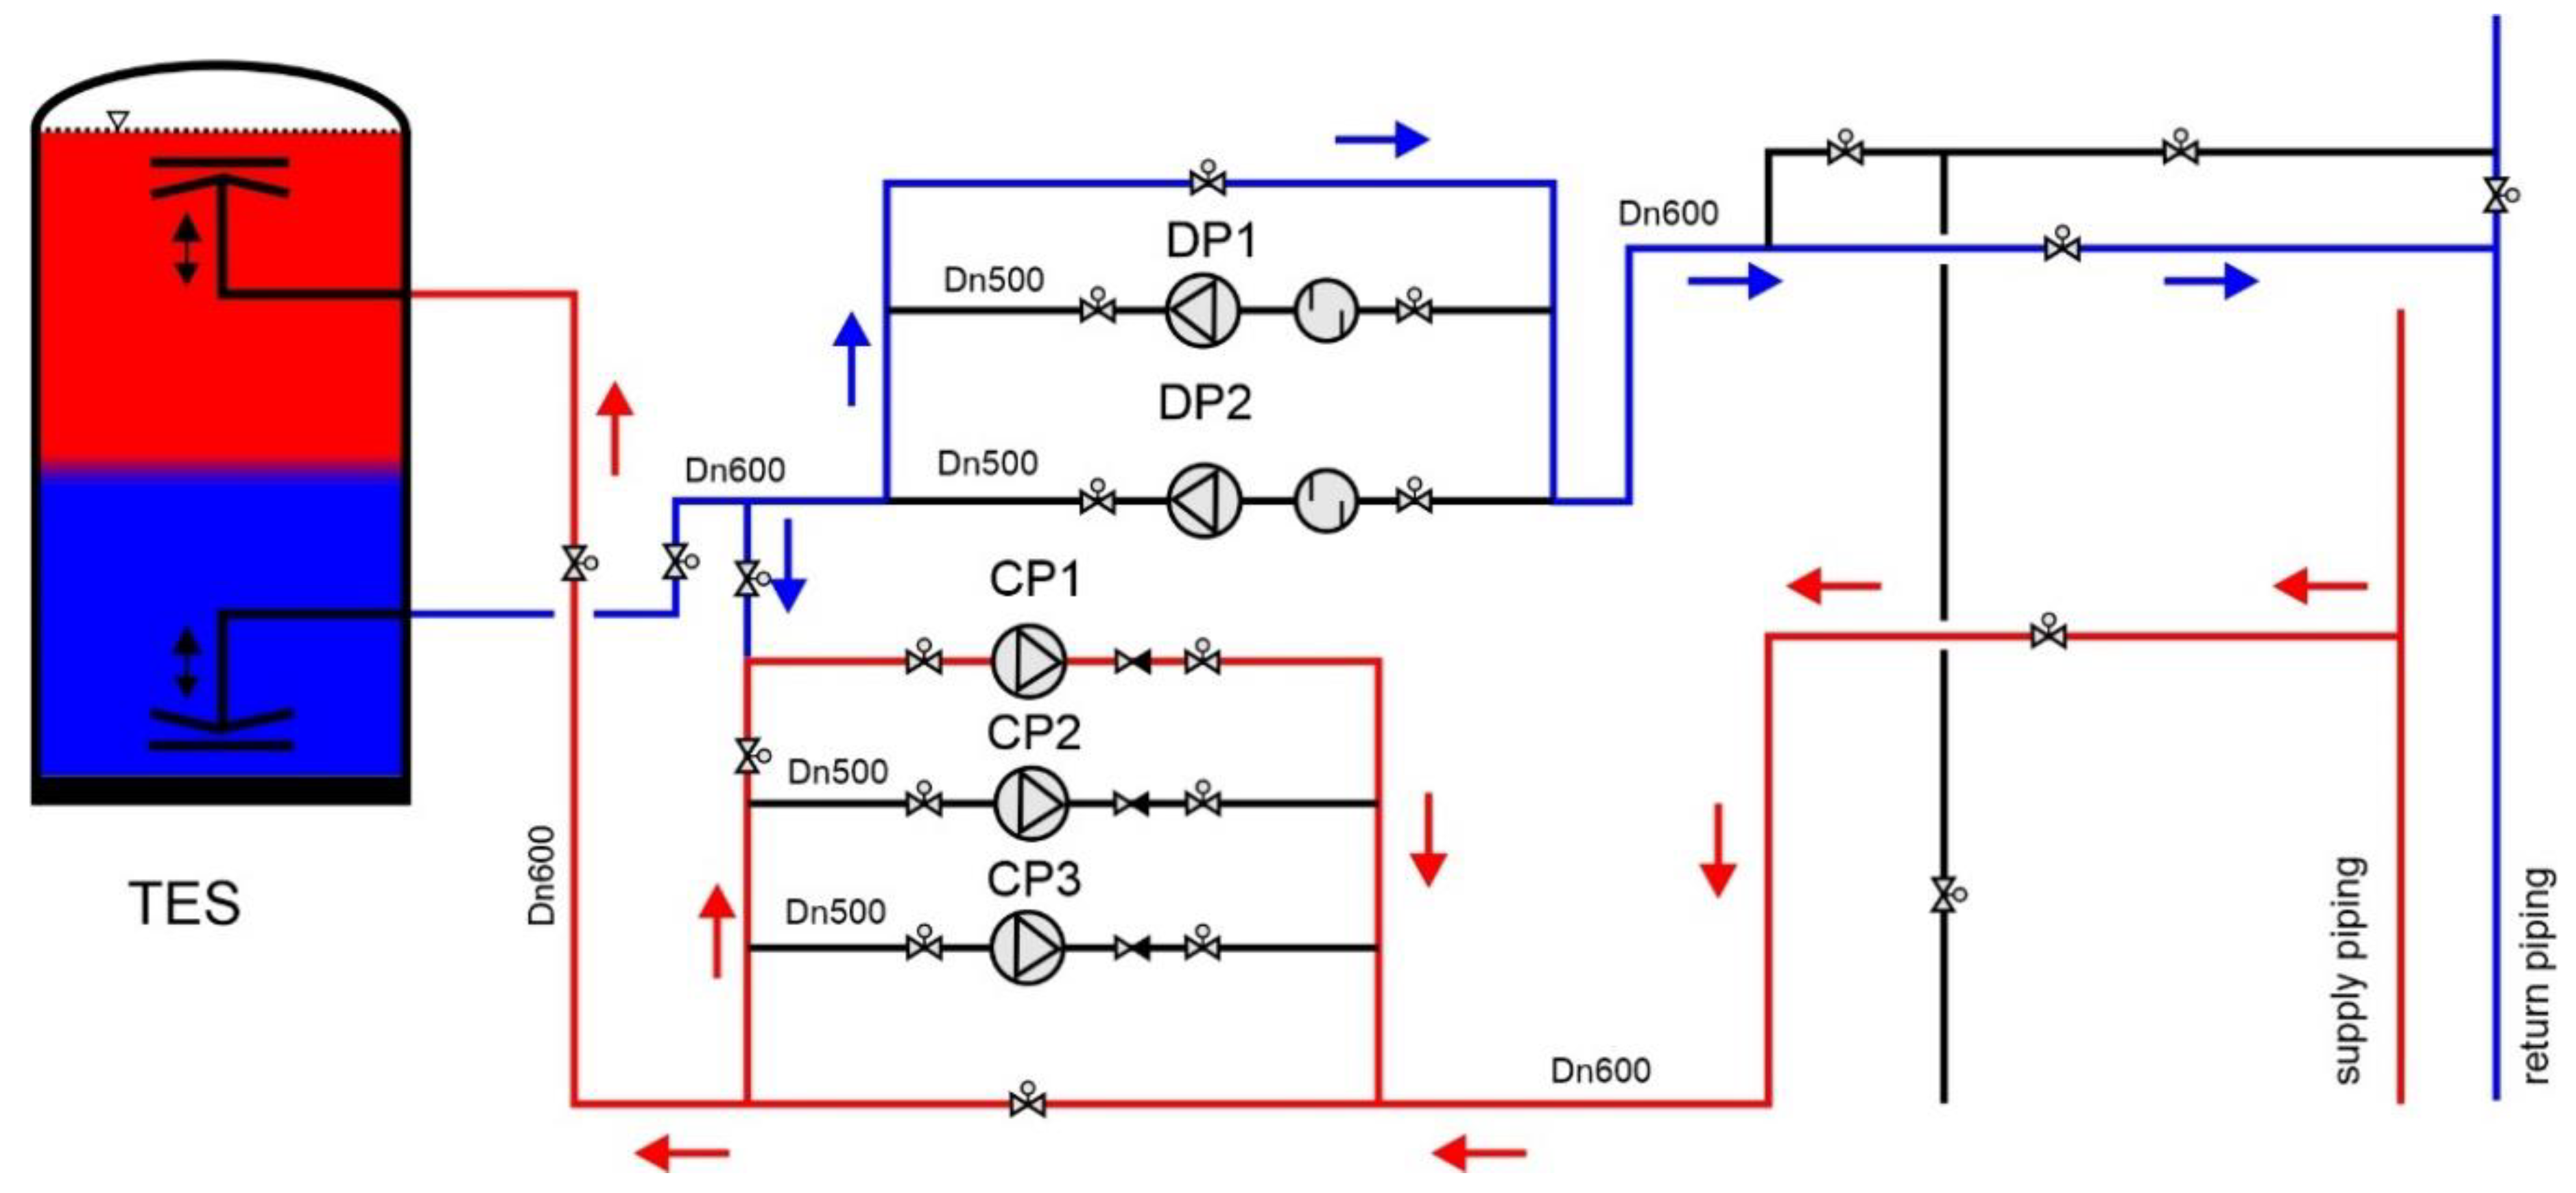
Figure 7.
Average daily efficiency of boiler K7 in 2010 and in 2013.
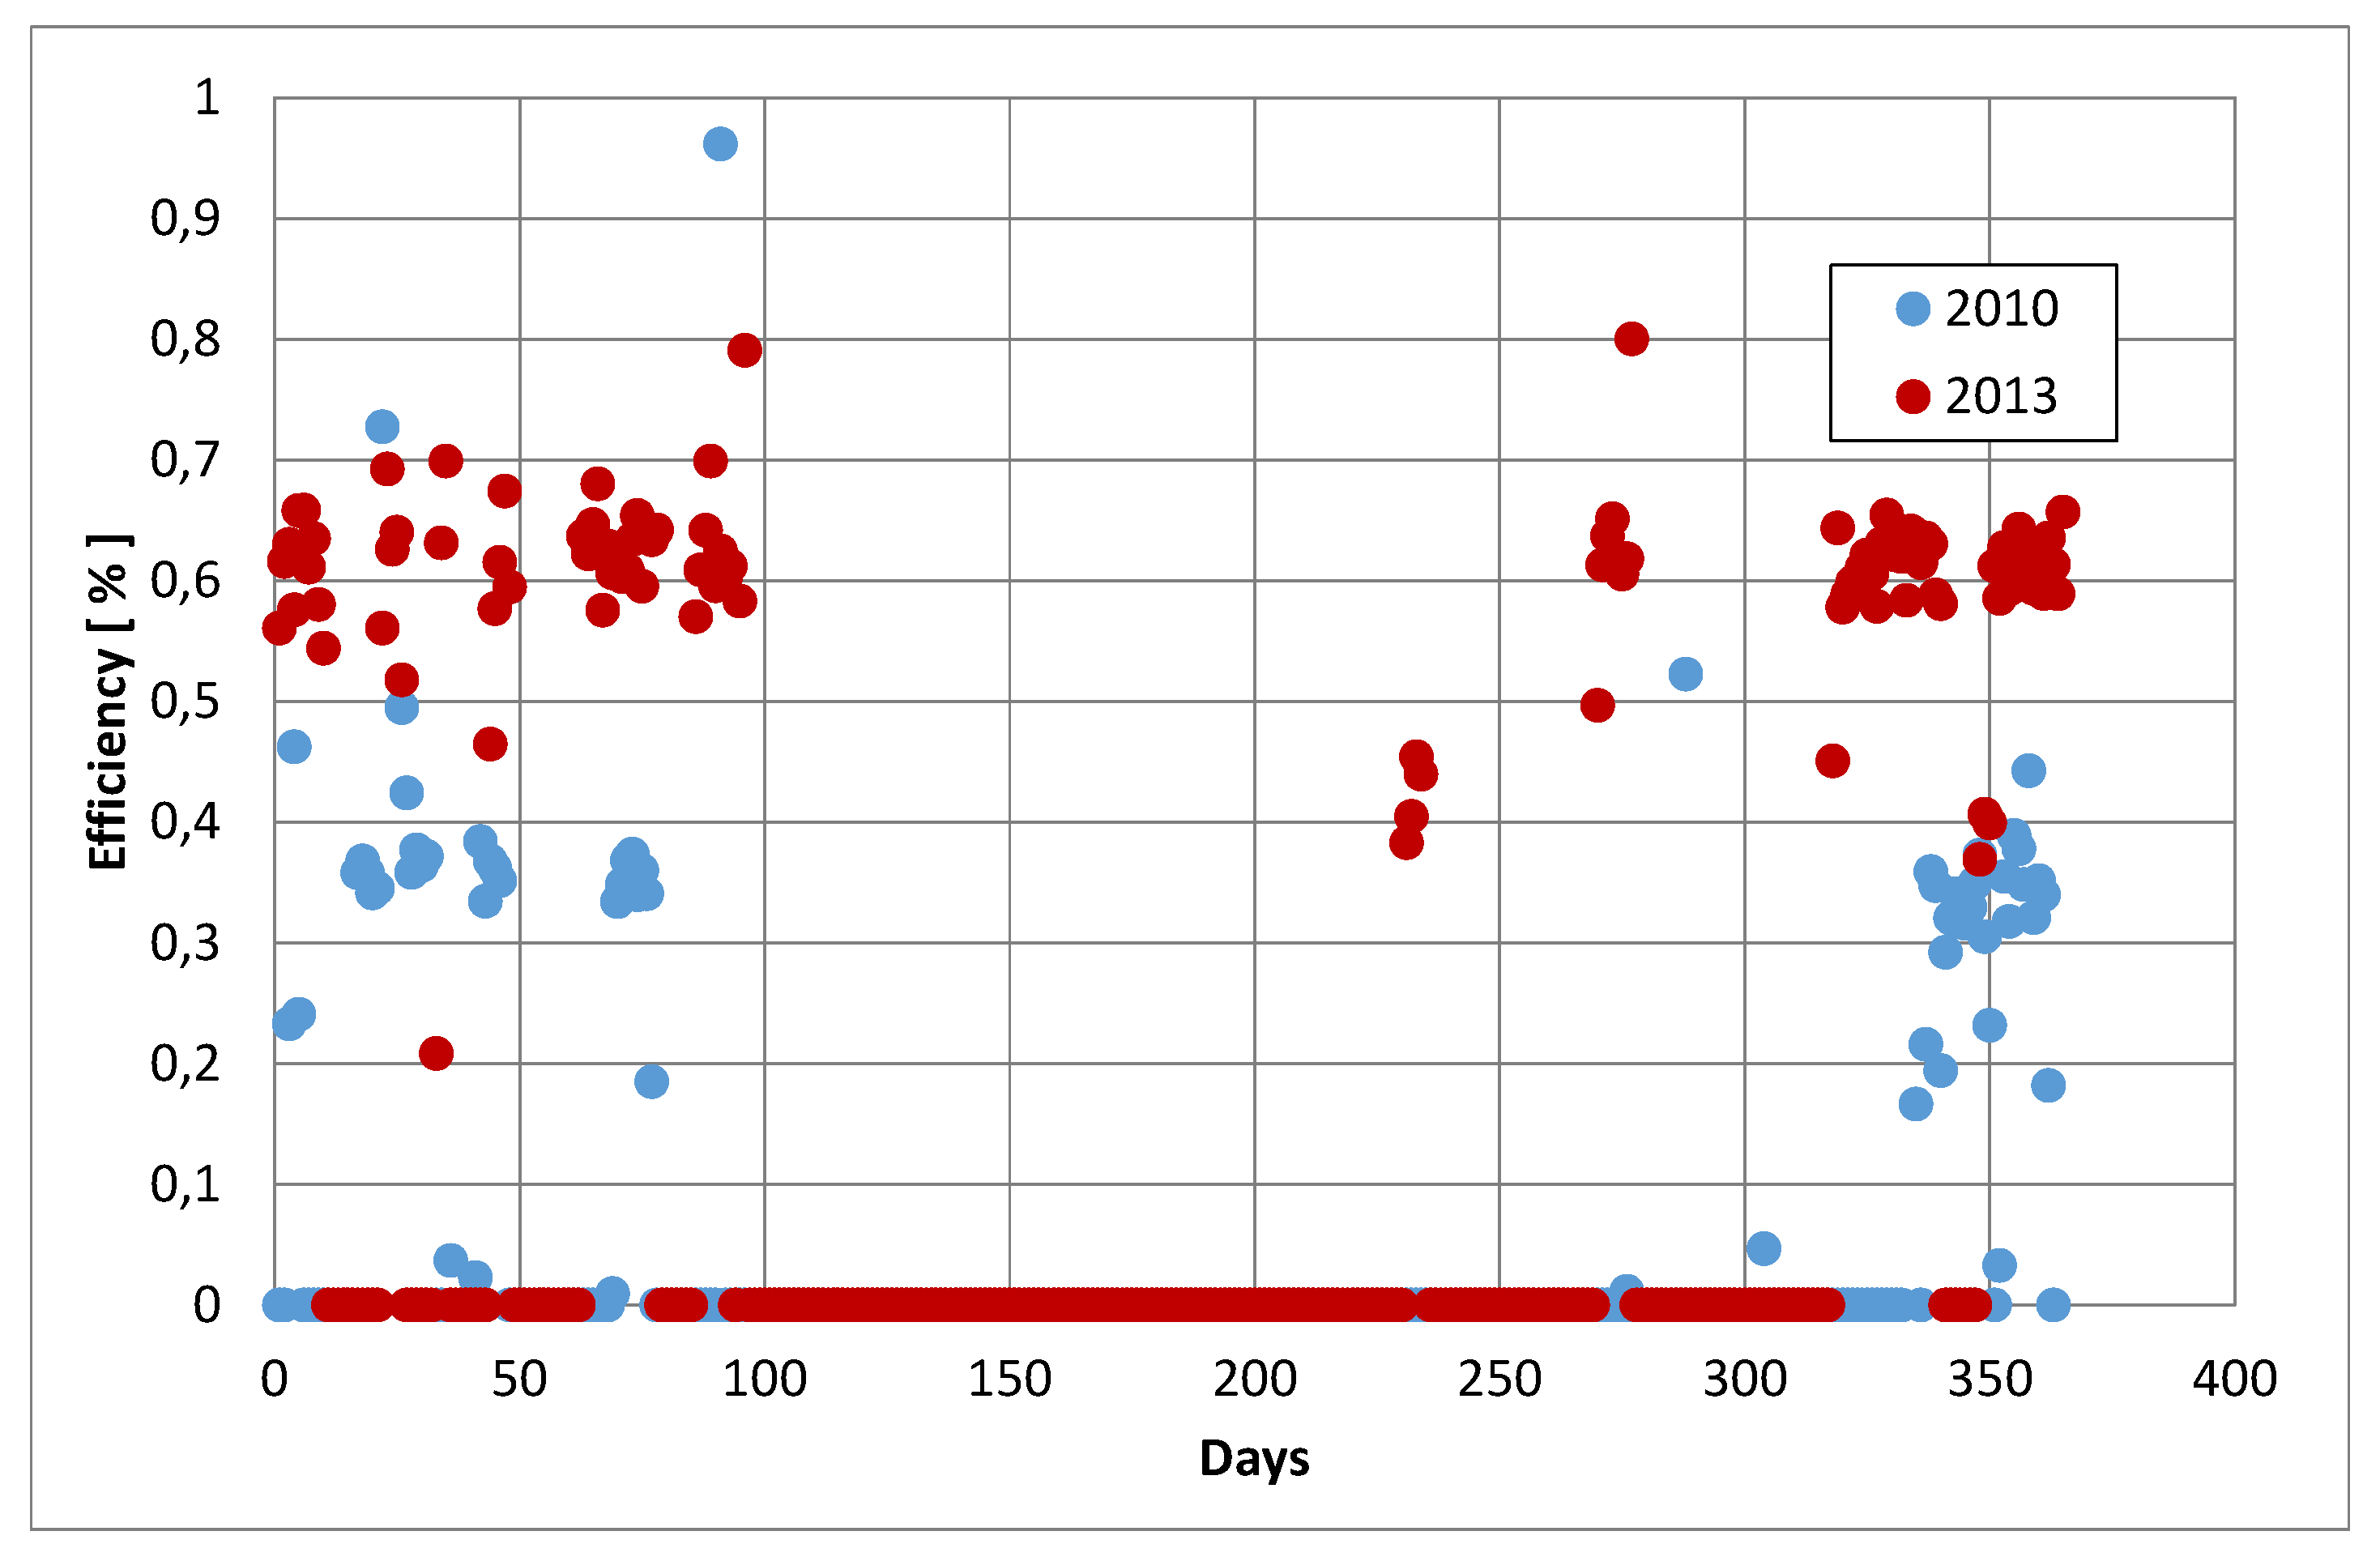
Figure 8.
The relationship between the emission of PM10 into the atmosphere in 2008 and 2009.
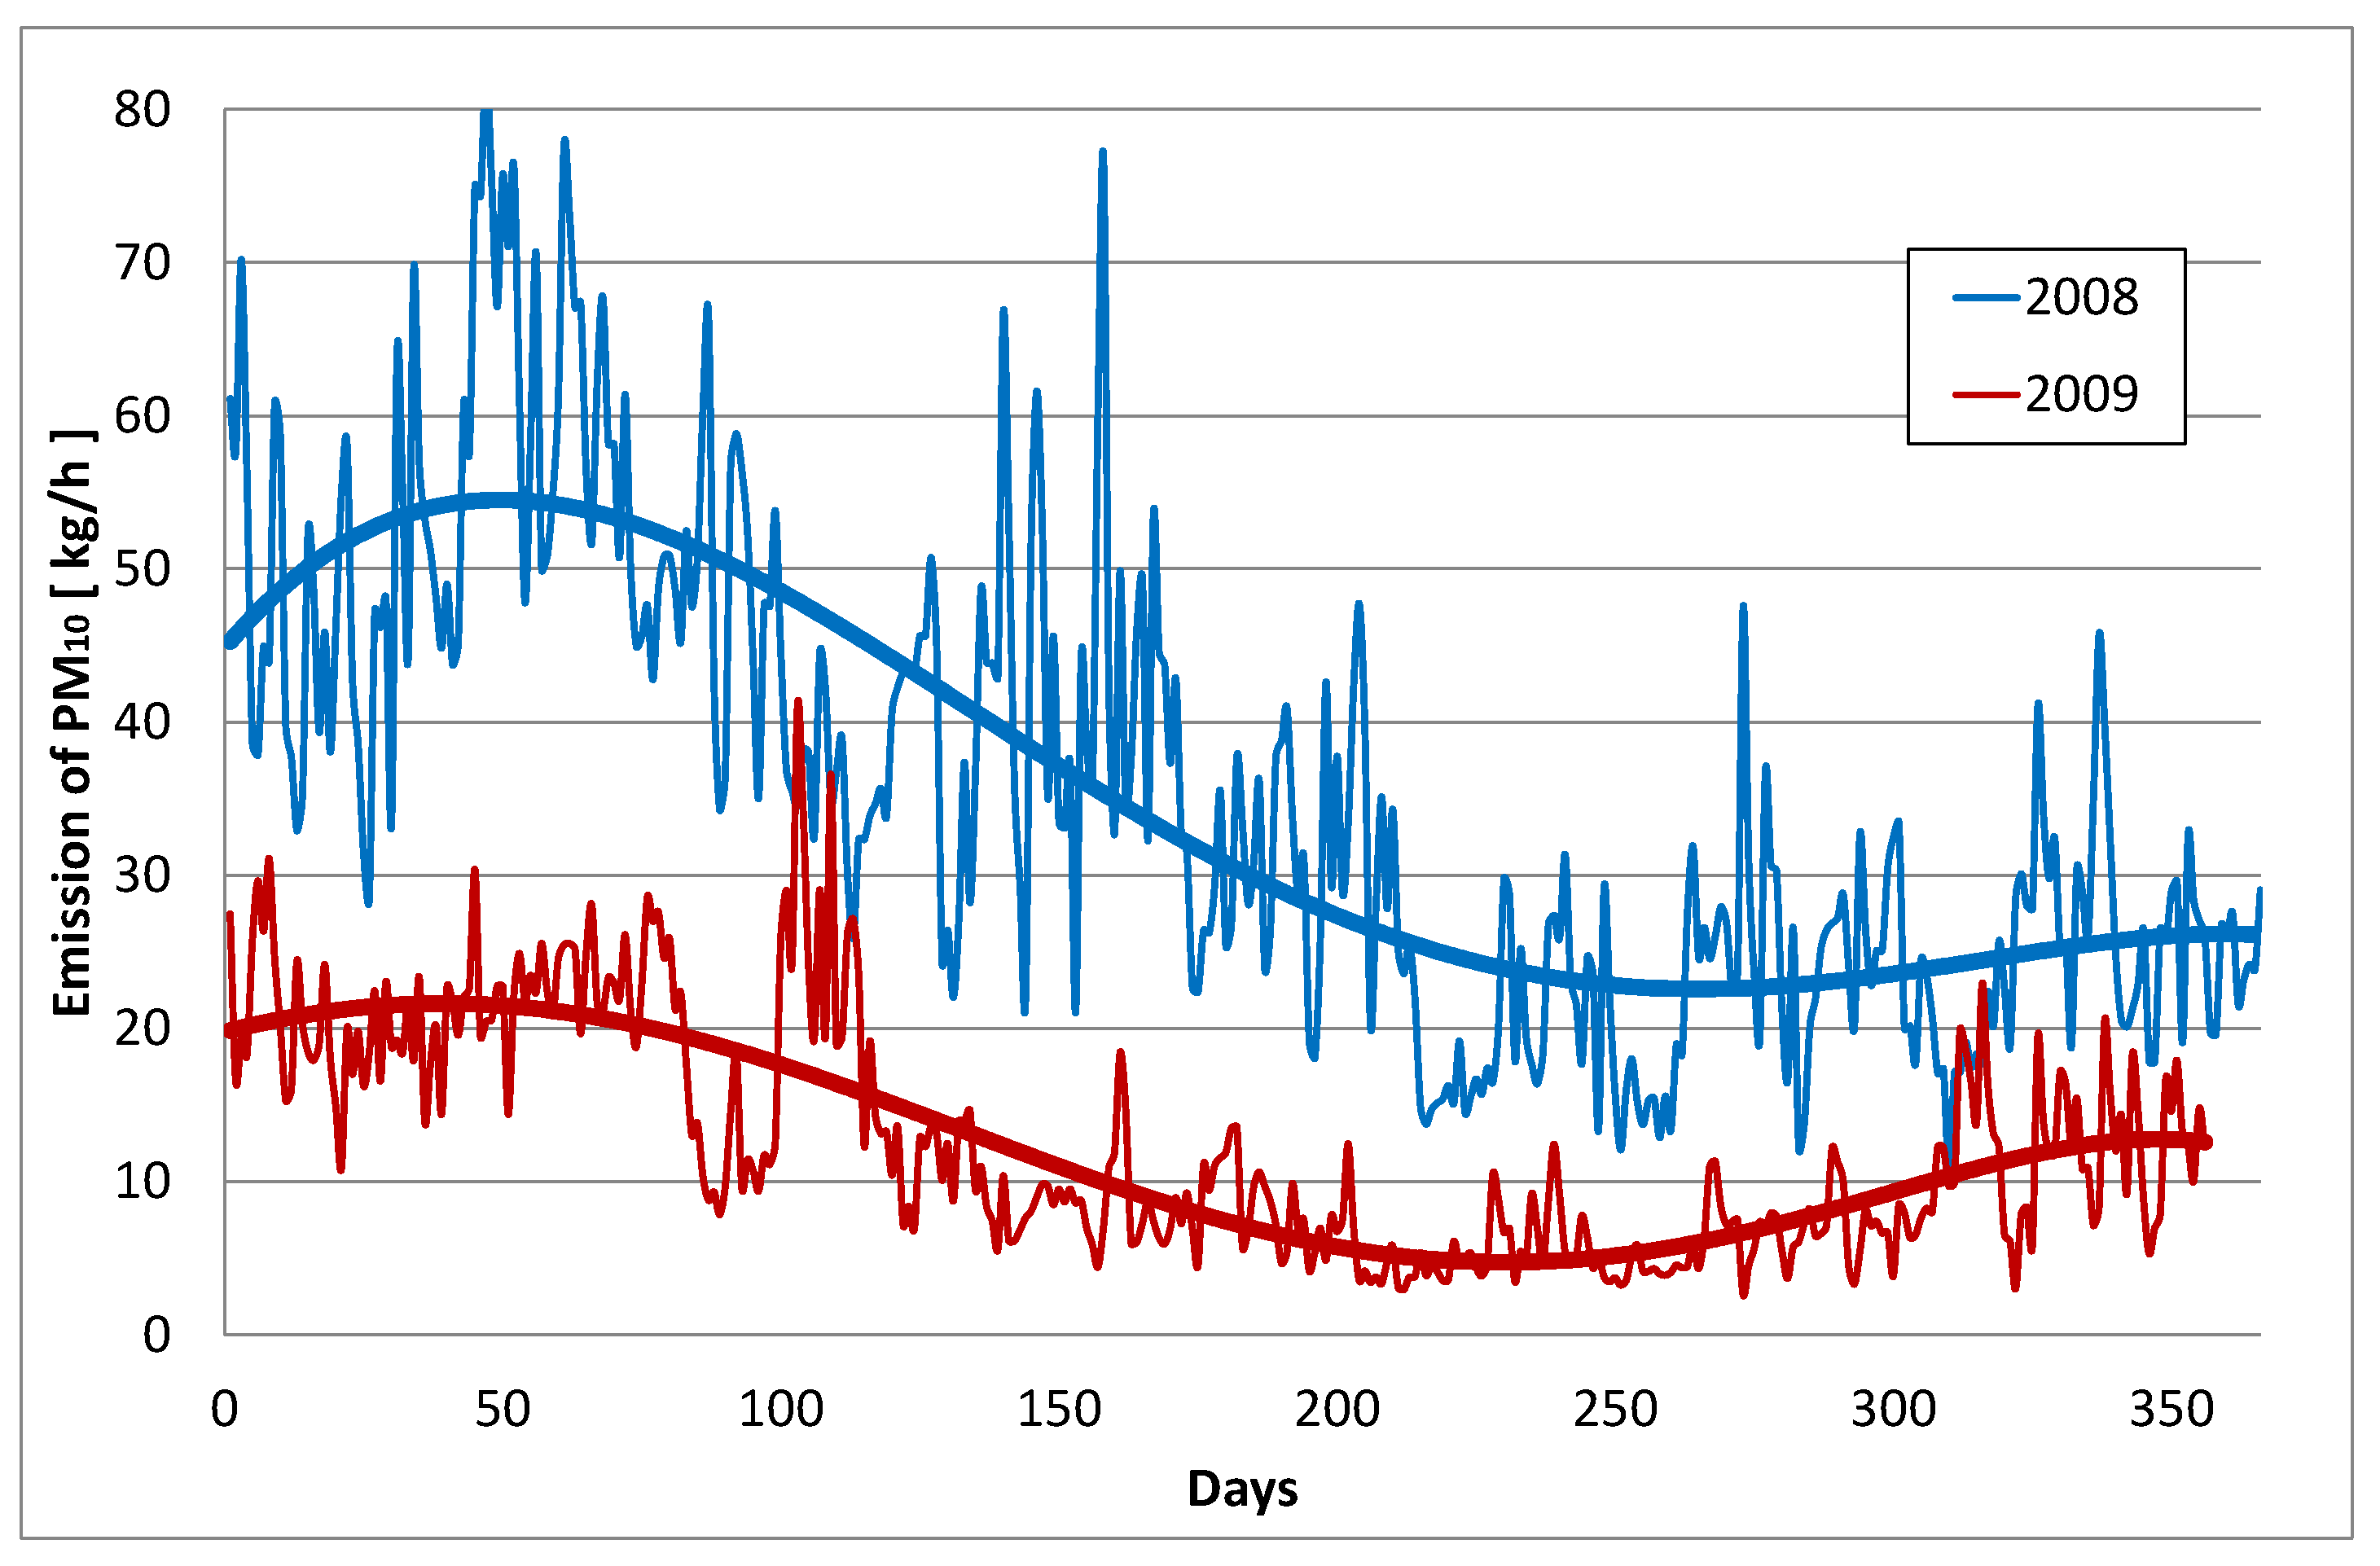
Figure 9.
PM10 emissions in 2010 and 2013.
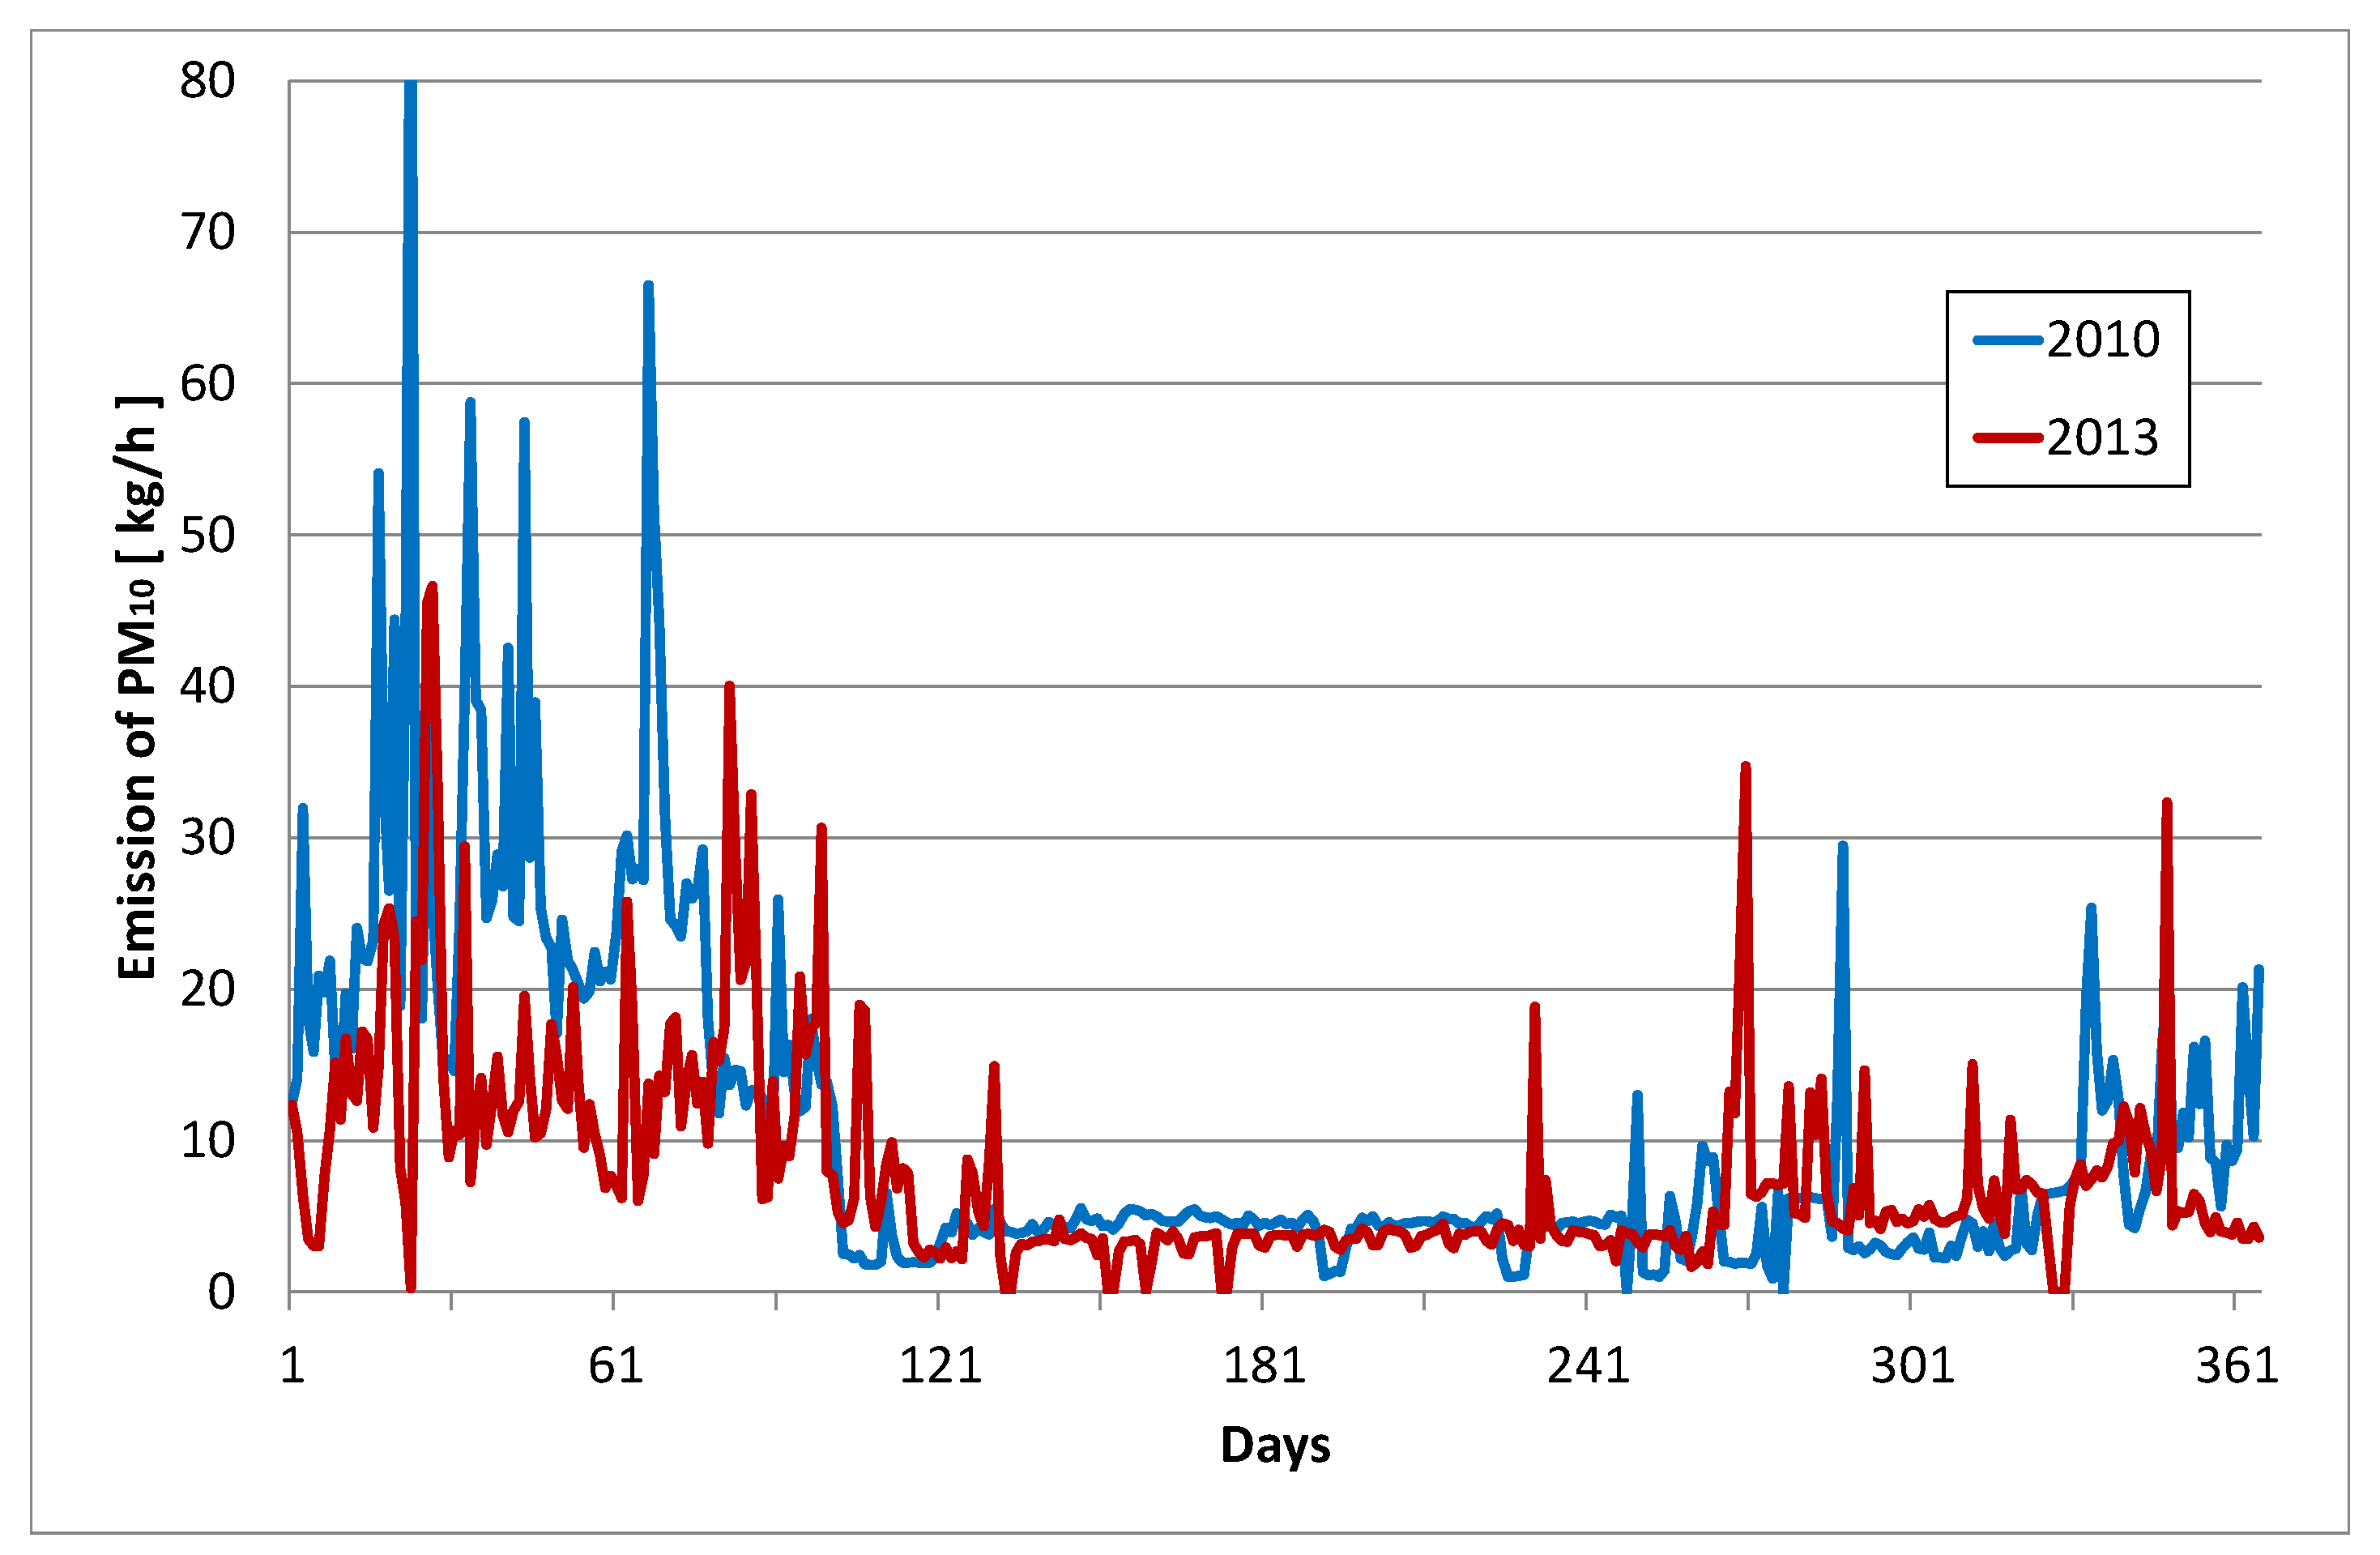
Figure 10.
Distribution of PM10 at ground level in 2010: (a) one-hour concentrations, (b) annual average concentrations.
Figure 10.
Distribution of PM10 at ground level in 2010: (a) one-hour concentrations, (b) annual average concentrations.
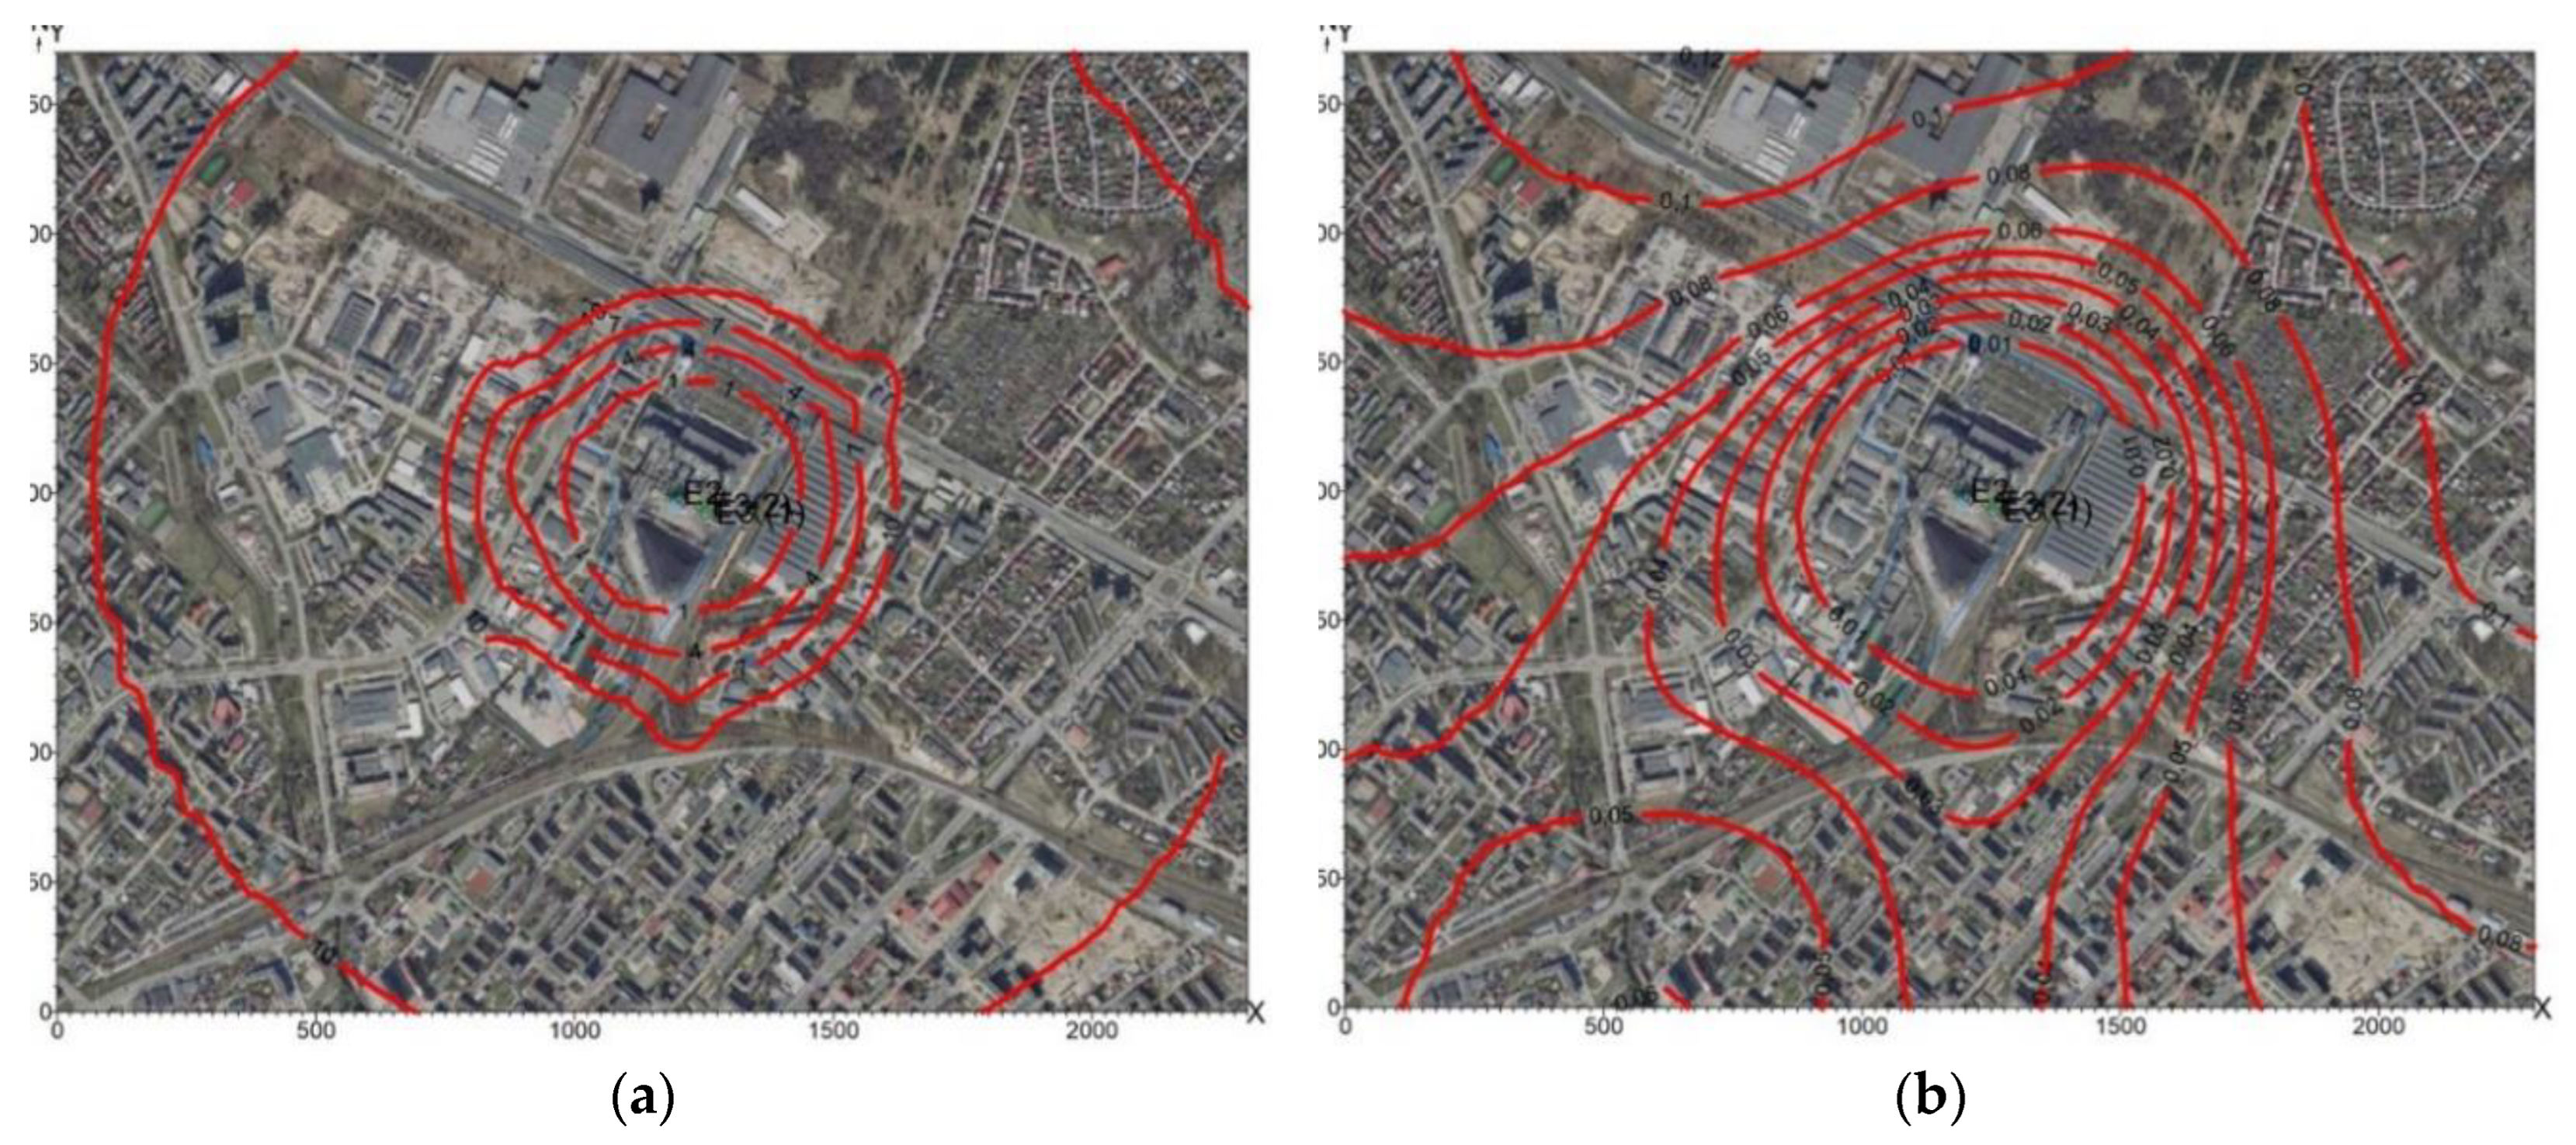
Figure 11.
Distribution of PM10 at ground level in 2013: (a) one-hour concentrations, (b) annual average concentrations.
Figure 11.
Distribution of PM10 at ground level in 2013: (a) one-hour concentrations, (b) annual average concentrations.
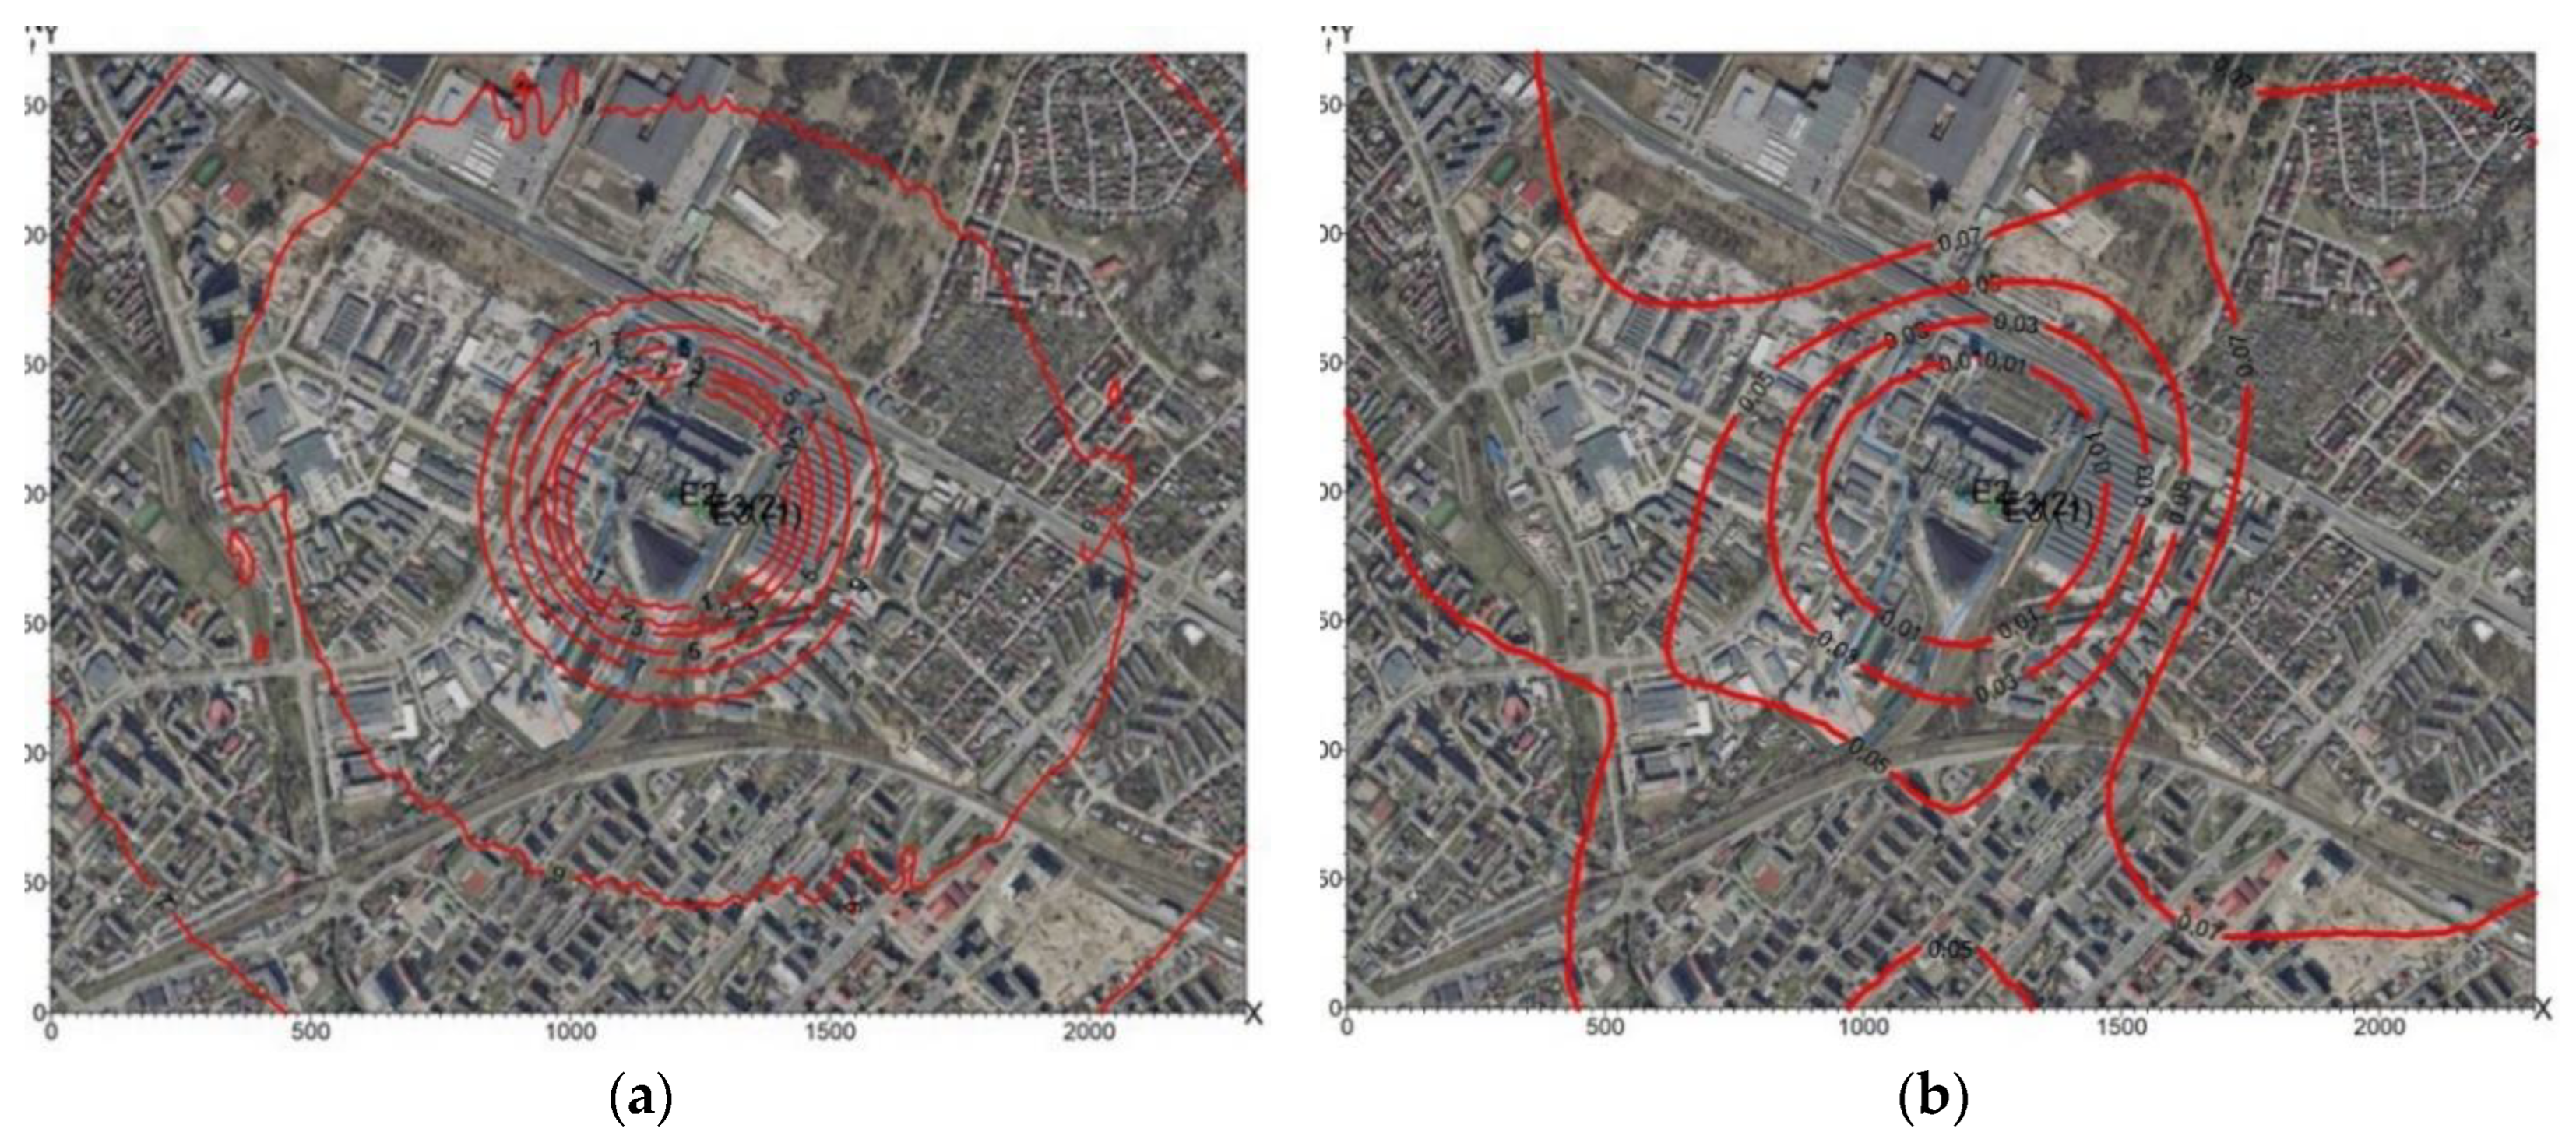
Figure 12.
Distribution of PM2.5 at ground level in 2010: (a) one-hour concentrations, (b) annual average concentrations.
Figure 12.
Distribution of PM2.5 at ground level in 2010: (a) one-hour concentrations, (b) annual average concentrations.
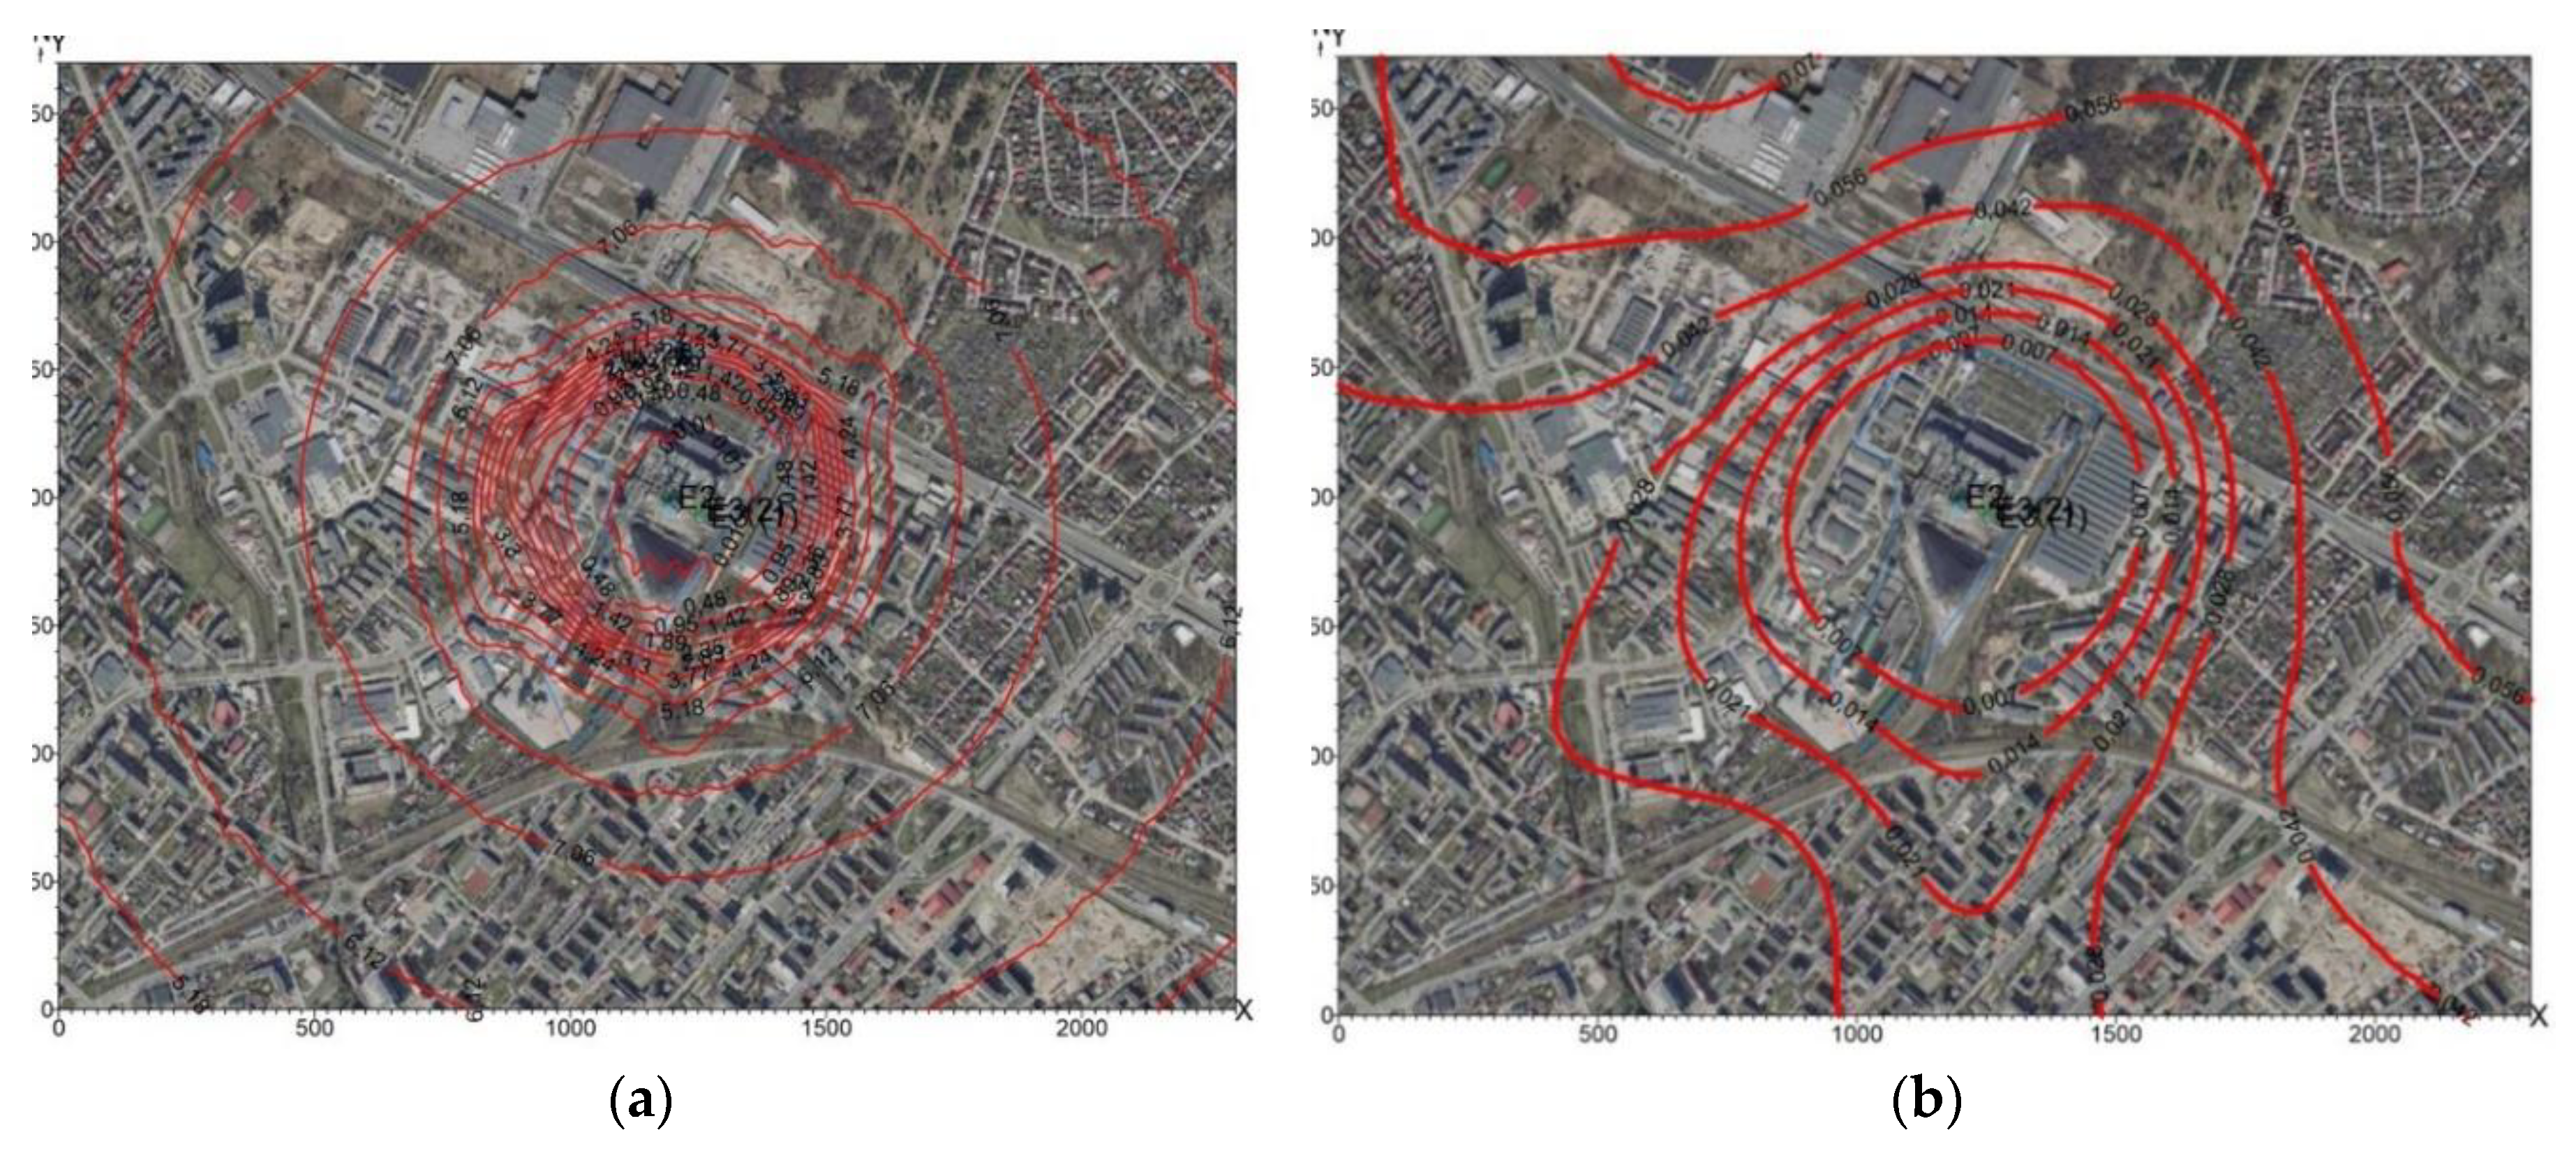
Figure 13.
Distribution of PM2.5 at ground level in 2013: (a) one-hour concentrations, (b) annual average concentrations.
Figure 13.
Distribution of PM2.5 at ground level in 2013: (a) one-hour concentrations, (b) annual average concentrations.
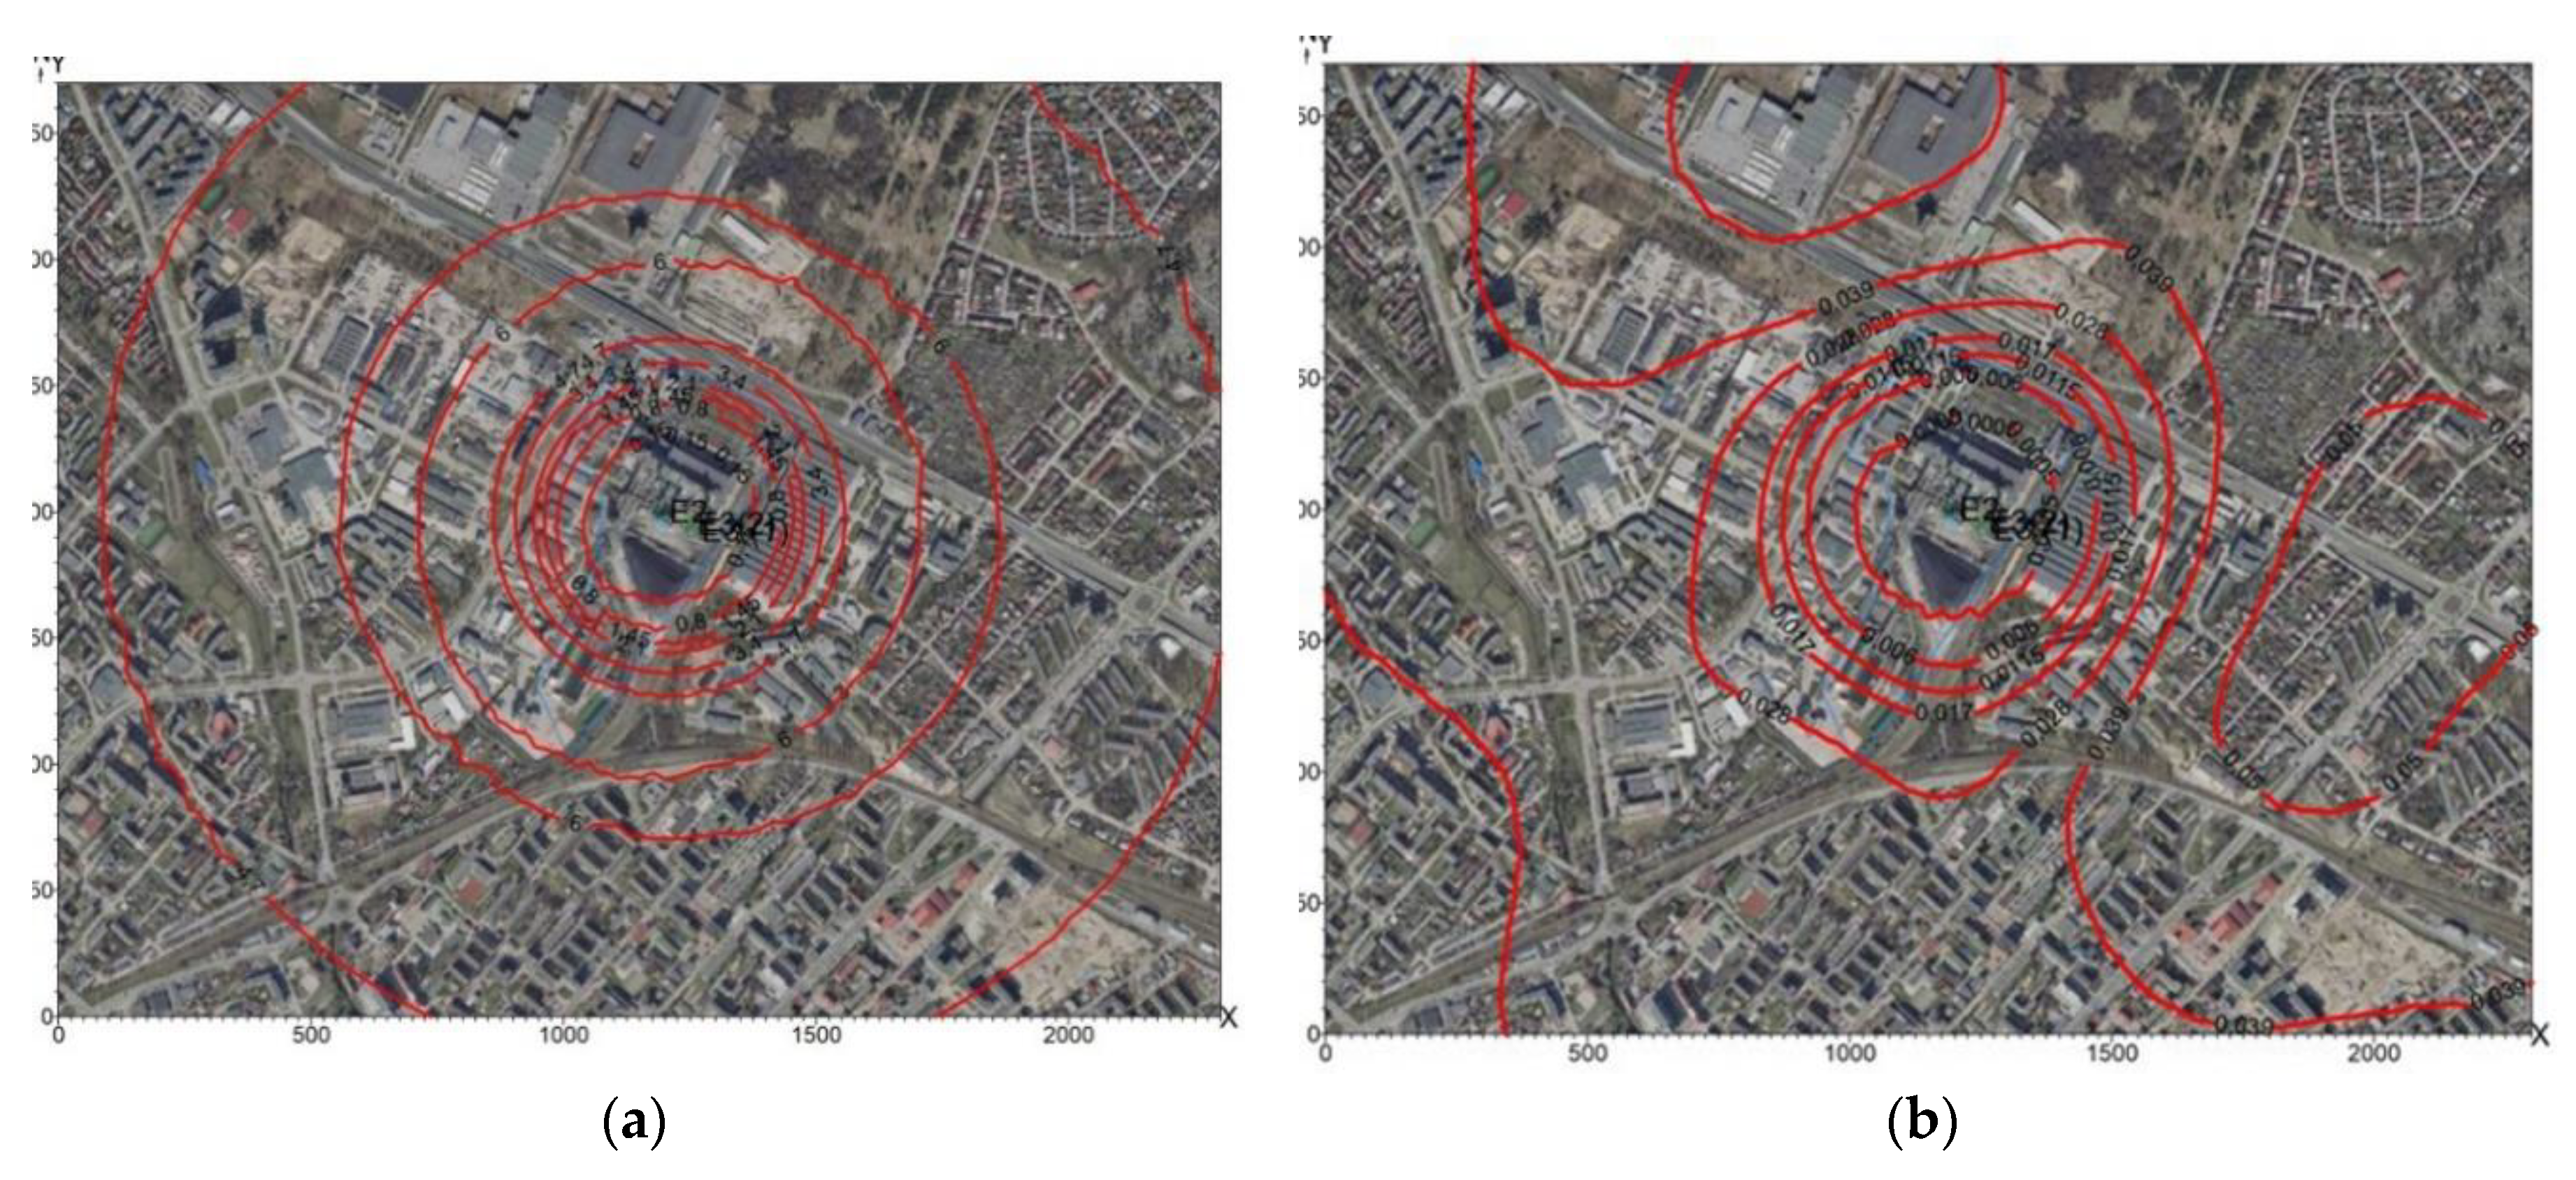
Figure 14.
Particulates fallout in (a) 2010 and in (b) 2013.
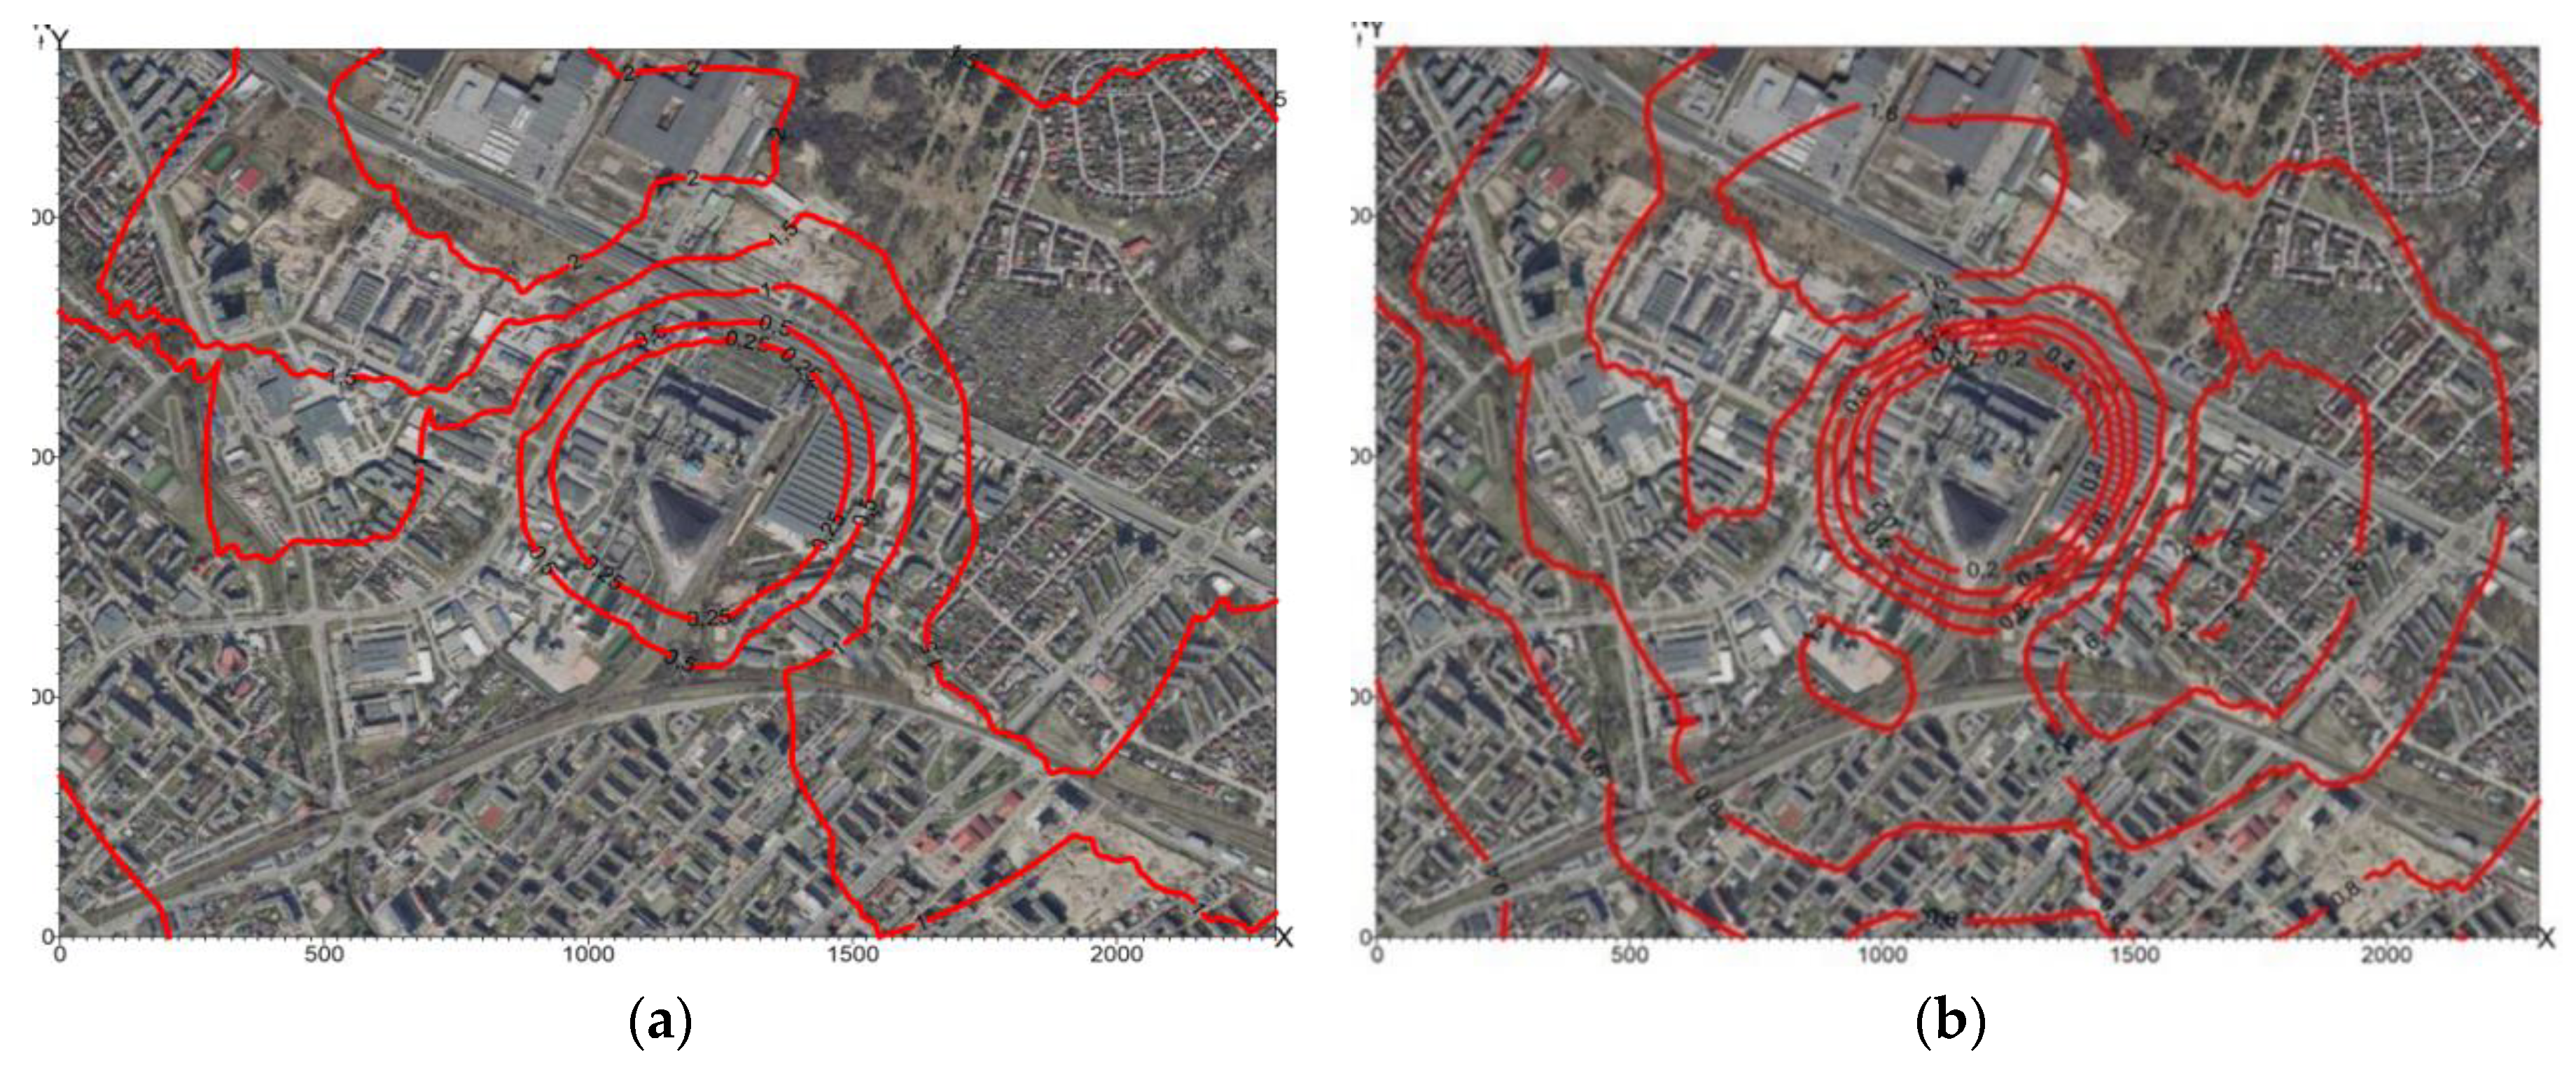

Table 1.
Annual emission of particulates, including anthropogenic particulates, in Poland in 1990-2020.
Table 1.
Annual emission of particulates, including anthropogenic particulates, in Poland in 1990-2020.
| Emission source by NFR category | Particulate emissions amount [Gg·a-1] | ||||||||
| Year | 1990 | 2010 | 2020 | ||||||
| Anthropogenic particulates | TSP | PM10 | PM2.5 | TSP | PM10 | PM2.5 | TSP | PM10 | PM2.5 |
| Sector | |||||||||
| Energy | 1110,0 | 796,7 | 510,1 | 470,9 | 415,1 | 353,1 | 313,0 | 276,6 | 238,4 |
| Industrial processes | 142,4 | 91,3 | 41,9 | 73,9 | 27,4 | 8,3 | 80,7 | 29,6 | 8,3 |
| Agriculture | 66,8 | 39,0 | 4,7 | 47,2 | 26,2 | 2,8 | 50,7 | 29,6 | 3,3 |
| Waste (open incineration, waste incineration) | 3,4 | 3,3 | 3,2 | 4,1 | 4,1 | 4,0 | 4073,0 | 4,7 | 4,5 |
| Together | 1322,5 | 930,3 | 559,9 | 596,0 | 472,7 | 368,1 | 449,1 | 340,4 | 254,5 |
Table 2.
Annual emission of particulates resulting from fuel combustion and fugitive emissions from fuels in the energy sector in Poland in 1990-2020.
Table 2.
Annual emission of particulates resulting from fuel combustion and fugitive emissions from fuels in the energy sector in Poland in 1990-2020.
| Emission source by NFR category | Particulate emissions amount [Gg·a-1] | ||||||||
| Year | 1990 | 2010 | 2020 | ||||||
| Anthropogenic particulates | TSP | PM10 | PM2.5 | TSP | PM10 | PM2.5 | TSP | PM10 | PM2.5 |
| Fuel combustion | |||||||||
| Energy industry | 714,3 | 455,4 | 228,7 | 28,3 | 18,0 | 9,6 | 9,6 | 6,3 | 3,6 |
| Manufacturingand construction | 26,8 | 25,4 | 23,6 | 23,6 | 22,3 | 21,0 | 26,1 | 24,8 | 23,5 |
| Transport | 13,9 | 12,6 | 11,5 | 19,7 | 16,0 | 12,7 | 20,3 | 15,4 | 11,0 |
| Other sectors | 307,8 | 282,9 | 243,4 | 371,6 | 346,8 | 308,0 | 236,2 | 221,1 | 198,8 |
| Together | 1062,8 | 776,4 | 507,2 | 443,2 | 403,1 | 351,2 | 292,3 | 267,5 | 236,9 |
| Fugitive Emissions from Fuels | |||||||||
| Volatile emissions from solid fuels | 47,0 | 20,3 | 2,9 | 27,3 | 11,8 | 1,8 | 20,3 | 8,8 | 1,4 |
| Volatile emissions from the gas and oil system | 0,2 | 0,1 | 0,1 | 0,4 | 0,2 | 0,1 | 0,4 | 0,3 | 0,1 |
| Together | 47,2 | 20,4 | 3,0 | 27,7 | 12,1 | 1,9 | 20,7 | 9,1 | 1,5 |
Table 3.
Air quality standards for two PM fractions, i.e. PM10 and PM2.5, in force in Poland and the EU [19].
Table 3.
Air quality standards for two PM fractions, i.e. PM10 and PM2.5, in force in Poland and the EU [19].
| Annual standard [µg·m-3] | Average daily norm [µg·m-3] | Permissible number of exceedances [ - ] | |
|---|---|---|---|
| PM10 | 40 | 50 | 35 |
| PM2.5 | 25 | - | - |
Table 4.
Basic technical parameters of TES in the Siekierki CHP Plant and the Białystok CHP Plant.
| Parameter | Siekierki CHP | Białystok CHP | Unit |
|---|---|---|---|
| Total Tank Volume | 30,400 | 12,800 | m3 |
| Tank diameter | 30 | 21 | m |
| Tank shell height | 43 | 37 | m |
| Radius of Tank Dome | 45 | 31.5 | m |
| Insulation thickness | 0.5 | 0.5 | m |
| Charge/Discharge Flow Rate | 1,250 | 417 | kg/s |
| Temperature of stored water | 98/40 | 98/40 | °C |
| Total weight of the tank (without insulation) | 53,000 | 33,850 | kg |
Table 5.
Reference values and limit levels for the particulates in the air.
| Name of the substance | Reference values in (μg/m3) averaged over the period | ||
|---|---|---|---|
| one hour | calendar year | ||
| PM10 | 280 | 40 | |
| PM2.5 | - | Year 2010 | 29 |
| Year 2013 | 26 | ||
Table 6.
Summary of maximum values of concentrations in the receptor network, μg/m3 in 2010.
| Particulates | 30 min. | 1 hour | 8 hours | 24 hours |
|---|---|---|---|---|
| PM10 | 14,7 | 12,6 | 8,0 | 6,3 |
| PM2.5 | 8,8 | 7,6 | 4,8 | 3,8 |
Table 7.
Summary of maximum values of concentrations in the receptor network, μg/m3 in 2013.
| Particulates | 30 min. | 1 hour | 8 hours | 24 hours |
|---|---|---|---|---|
| PM10 | 12,3 | 10,6 | 6,7 | 5,2 |
| PM2.5 | 7,3 | 6,3 | 4,0 | 3,1 |
Table 8.
Total annual and maximum emissions in 2010 and 2013.
| Pollution Name | Annual emission [Mg] | Reduction level | Maximum emission [kg/h] | Reduction level | ||
|---|---|---|---|---|---|---|
| Year | 2010 | 2013 | 2010 | 2013 | ||
| PM10 | 92,2 | 67 | 27 % | 15 | 10,7 | 29 % |
| PM2.5 | 55,1 | 40,1 | 27 % | 8,97 | 6,4 | 29 % |
Disclaimer/Publisher’s Note: The statements, opinions and data contained in all publications are solely those of the individual author(s) and contributor(s) and not of MDPI and/or the editor(s). MDPI and/or the editor(s) disclaim responsibility for any injury to people or property resulting from any ideas, methods, instructions or products referred to in the content. |
© 2024 by the authors. Licensee MDPI, Basel, Switzerland. This article is an open access article distributed under the terms and conditions of the Creative Commons Attribution (CC BY) license (http://creativecommons.org/licenses/by/4.0/).
Copyright: This open access article is published under a Creative Commons CC BY 4.0 license, which permit the free download, distribution, and reuse, provided that the author and preprint are cited in any reuse.


