
Submitted:
10 February 2026
Posted:
12 February 2026
You are already at the latest version
Abstract
Deep metamorphic rock reservoir permeability prediction faced great challenge due to strong heterogeneity. Fractures were widely developed, but the traditional models did not involve into the contribution of fractures. To establish an effective model to predict permeability, parameters related to fracture needed to be taken into account. In this study, taking the Archaeozoic Formation in BZ 19-6 Region - a typical deep metamorphic rock reservoir and located in southwestern Bohai Bay Basin - as an example, the porosity frequency spectra were first extracted from electrical imaging logging, and relationships between the shape of porosity frequency spectrum and rock pore structure were analyzed. Two parameters, which were defined as the logarithmic mean (φgm) and standard deviation between two golden section points (φgsr), were used to reflect the main position and wide of porosity frequency spectrum, and a novel model to predict permeability was established. After the target formations were classified into two types based on the difference of pore type and pore-fracture configuration relationship, the involved model coefficients were calibrated. Consecutive permeability curves were derived from our raised model in the intervals with which porosity frequency spectra were acquired. Comparisons of predicting permeabilities with core-derived results illustrated that this proposed model was much reasonable, and the resolution of predicted permeability curve was high. Except for the deep metamorphic rock reservoirs, the estimated model could be widely used in other types of formations (e.g., volcanic rock reservoirs, carbonate rock reservoirs) where secondary pores were developed.
Keywords:
permeability
; fractured reservoirs
; Bohai Bay basin
; porosity frequency spectrum
; golden section points
1. Introduction
Permeability played an important role in indicating formation productivity [1]. Generally, reservoirs with high permeability always had better filtration capacity and higher hydrocarbon production. On the contrary, if a formation contained ultra-low permeability, the effectiveness would be worst, and it would be low-yield or dry layer. Precisely predicting permeability was indispensable in reservoir evaluation and effectiveness characterization, especially in ultra-low to tight reservoirs [2,3].
In generation, total porosity was always used as a single input parameter to predict permeability after power function or exponential function was applied by using plenty of routine core analysis data [4,5]. This method was available only in formations with relatively simple pore structure, and the relationship between total porosity and permeability could be easily expressed. Permeability prediction faced great challenge in formations with complicated pore structure, such as low-permeability to tight sandstone or carbonate reservoirs [6]. Factors affecting formation permeability in such types of reservoirs were multiple. Besides total porosity, the ratio of movable pores, the pore morphology, the irreducible water saturation and so on, also heavily affected formation permeability. Hence, many models, e.g., the Timur -Coates model, the Schlumberger Doll Research Center (SDR) based model, the Swanson based model, and the R10 (defined by the pore-throat radius corresponding to 10% mercury injection saturation) based model, were proposed to involve these parameters and used to predict permeability [7,8,9,10,11,12,13]. In addition, the hydraulic flow unit (HFU) approach was introduced to classify formations into several clusters, and relationships between total porosity and permeability were established to extract permeability from total porosity for every cluster of formation [14,15]. These methods played great important roles in estimating permeability in formations with relatively simple pore structure. In such type of formation, the pore spaces were dominated by intergranular pores, and the main flow paths were pores and throats, and the throat-to-pore coordination number was positive to permeability [16]. However, in reservoirs with secondary pores, e.g., carbonate, volcanic rock or metamorphic rock, all the current methods could not operate. This is because there were two to three types of pore spaces in such types of reservoirs [17,18,19,20]. Apart from the intergranular pores, secondary pores, such as fractures or caves, were widely developed in these types of formations. Although the fracture porosities were not high, they could effectively connect the intergranular pores, thereby enhancing rock permeability. To effectively predict permeability in fractured reservoirs, the contribution of secondary pores should be considered.
For permeability evaluation in fractured formations, various types of models have been proposed based on electrical imaging logging [21,22,23,24,25,26]. The most classic one is the slab model [27]. In the slab model, formations were cracked and classified into several parallel clusters by fractures, and relationship between fracture aperture and permeability were established based on exponential function. Formation permeabilities were overestimated in many fractured reservoirs based on the slab model, the reason was that the fracture surface was considered smooth and parallel. The real form of fracture surface was complex and irregular, this would reduce rock permeability. In addition, the calculation of fracture aperture from electrical imaging logging was a worldwide challenge, all these limited the widely applicability of slab model. Li et al. (2024) raised a model to predict permeability from porosity frequence spectrum based on the morphological method [23]. In this model, the porosity frequency spectrum was classified into two parts based on the shape, and a normal distribution function was used to simulate the distribution of matrix pore. The ratio of the area of the distribution of matrix pore to total area of porosity frequency spectrum was defined as an input parameter in this model. This model had been verified to be valuable in fractured tight sandstone reservoirs in Ordos Basin. However, the operability of this model was questionable. Because fractures were random and widely developed in metamorphic rock reservoirs, especially the reticular fractures. This made the sharp of porosity frequency spectra was multimodal, it was difficult to extract the distribution of matrix pore from total porosity frequency spectrum. Xiao et al. (2000) pointed out that the porosity frequency spectrum could be first translated as pseudo capillary pressure (Pc) curve to characterize formation pore structure, and then the Swanson based model or R10 based model were applied to calculate permeability [3]. The applicability of this method was determined by the accuracy of extracting pseudo-Pc curve from porosity frequency spectrum. This resulted in this model being effective only in formations where intergranular pores were developed. The array acoustic logging was considered to be effective in indicating the development of fracture, and the corresponding permeability prediction model based on the Stoneley wave was raised and widely used all over the world in the last several decades [28]. This model was usable in oil-bearing or water saturated layers. However, the effect of pore fluids could not be removed in gas-bearing reservoirs, this made that the predicted permeability was underestimated. Comparing with nuclear magnetic resonance (NMR0 logging, the electrical imaging logging was considered to have advantages in reservoir characterization in the following three aspects: (1) the extracted parameters did not be affected by the pore fluids; (2) the high longitudinal resolution enabled the effective identification of thin layers; (3) the effectiveness was high in fractured reservoir evaluation [29].
The purpose of this study was to raise a novel model to directly predict permeability from porosity frequency spectrum in deep metamorphic rock reservoirs after the shapes of porosity frequency spectra in various types of formations were compared. Two parameters of the logarithmic mean and standard deviation between two golden section points were extracted, and relationships among these two parameters and permeability were established. After this raised model was applied in field applications in the Archaeozoic Formation in BZ 19-6 Region of southwestern Bohai Bay Basin, much reasonable permeability was predicted.
2. Geological Setting
The Bohai Bay Basin was a superimposed basin developed on the ancient Paleozoic cratonic basement of North China, formed through strike-slip and rifting processes [30]. The BZ Sag was a primary structural unit of the Bohai Bay Basin and represented the largest hydrocarbon-bearing sag in the Bohai Bay Basin. BZ 19-6 Region was located in southwestern Bohai Bay Basin, characterized by an anticline structure formed between the southwestern sub-sag and the southern sub-sag. The geological reserves of natural gas in BZ 19-6 Region had been verified to exceed 1.0×10¹¹ m3, making it the largest gas field discovered in eastern China [31]. The BZ Sag was located on the basement rocks, with complete absence of Paleozoic and Proterozoic strata, and partial absence of Mesozoic strata. From top to bottom, formations encountered during drilling contain the Quaternary Pingyuan Zone, the Neogene Minghuazhen Zone and Guantao Zone, the Paleogene Dongying Zone, Shahejie Zone, and Kongdian Zone, as well as the Mesozoic Zone and the Archean metamorphic basement (Figure 1). Our target formation was the Archaeozoic metamorphic rock formation. The average burial depth was higher than 4400 m,and the formation temperature was higher than 140 ℃, belonging to typical deep metamorphic rock reservoir. The main lithology contained gneiss, ganite, cataclasite and granodiorite. The pore types could be classified into three major categories, namely fracture type, fracture-pore type and pore-fracture type. Complicated lithology and pore types made formation evaluation facing great challenge in the Archaeozoic metamorphic rock reservoirs. In many regions, formations with low porosity but high hydrocarbon production were frequently found. The relationship between core-derived porosities and permeabilities was unusual. As the porosities increased, permeabilities did not significantly rise (Figure 2). It was urgent to predict permeability in fractured formations.
3. Analysis of Morphological Characteristics of Porosity Frequency Spectrum
3.1. Extraction of Porosity Frequency Spectrum from Electrical Imaging Logging
The electrical imaging logging had plenty of button electrodes evenly distributed within a 360-degree range around the wellbore (e.g., formation micro-resistivity scanning image logging (FMI) tool had 192 electrodes, star II tool had 144, whereas the number of electrodes for electrical resistivity micro imaging (ERMI) tool was 150). These button electrodes divided formation (pores) into several small units. For each unit, its conductivity followed the inter-granular flow law. Meanwhile, electrical imaging logging had a relatively shallow invasion radius, the measured results only reflected the conductivity of flushed zone [32]. Generally, the pore fluids were mud filtrate and small amount of negligible residual hydrocarbons in flush zone. Hence, the Archie’s equation, which was raised based on the inter-granular flow law, could be used to reflect the relationships of conductivity, porosity and water saturation in flushed zone [33]. The Archie’s equation was transformed and expressed as follow:
Where, φ was the formation total porosity in v/v. Rmf and Rxo were the resistivity of mud filtrate and flushed zone, separately. The unit of them was Ω.m. Sxo was the water saturation in flushed zone in v/v. a, b, m and n were the constants related to conductivity, and they were named as the rock resistivity parameters.
If Rxo was replaced by conductivity, based on the theoretical relationship between resistivity and conductivity (eq. 2), we could derive a transformed equation from eq. 1:
Where, Cxo was the measured conductivity in flushed zone in S/m.
Combining with eq.s 2 and 3, and we inserted the measured conductivities from button electrodes, a derived formulate was:
Where, φ(i) was the calculated ith imaging porosity in v/v. Cxo(i) was the extracted conductivity from ith button electrode in S/m. g was a constant, and its value was determined by m.
Eq. 4 illustrated that if our target formation was homogeneity, the measured conductivities Cxo (i) within a 360-degree range around the wellbore would be a fixed value, and the values of φ(i) would be equal to φ. However, true formation was strong heterogeneity, especially for low permeability to tight reservoirs, the measured Cxo (i) were various. This caused the values of φ(i) were not fixed, but fluctuated around total porosity. If we conducted a statistical analysis of the calculated φ(i) with given range of porosities, we would get the porosity frequency spectrum [34,35]. The x-axis of the porosity frequency spectrum would be the given range of porosities, whereas the y-axis was the statistical distribution frequency. The principle of obtaining porosity frequency spectrum from electrical imaging logging was exhibited in Figure 3.
3.2. Analysis of the Morphological Characteristics of Porosity Frequency Spectrum
As was expressed in eq. 4, the morphological characteristics of porosity frequency spectrum was determined by the measured conductivities Cxo(i) from electrical imaging logging. For formations with simple pore shape, e.g., intergranular pore or fracture, the measured conductivities were fixed or fluctuated within a very narrow range, and the extracted porosity frequency spectrum would exhibit as unimodality. However, once the pore type and the configuration relationship of pore and fracture were complicated, e.g., fracture-pore type or pore-fracture type, the rock conductivity would be entirely different. Because the mud filtrate easily invaded into the fractured pore space to improve the conductivity, this made the measured conductivity for every button electrode varied in a wide range, and the extracted porosity frequency spectrum would exhibit as bimodality or multimodality.
The cast thin sections of core sample illustrated that the pore spaces of our target Archaeozoic Formation in BZ 19-6 Region, southwestern Bohai Bay Basin, contained three clusters, which were single fracture type, fracture-pore type and pore-fracture type (Figure 4). In Figure 5a to c, we exhibited the pore frequency spectra of three types of formations. For every type of formations exhibited in this figure, they contained similar porosity but different lithology. Comparisons of the morphologies of porosity frequency spectra for different types of formations illustrated following characteristics: (1) Formations with single pore type (fractured formations with ultra-low porosity) exhibited as unimodal distributions in the porosity frequency spectra, even they contained various lithology. For example, four porosity frequency spectra displayed in Figure 5a, the corresponding formations covered four types of lithologies, but their morphologies were similar. The reason was that they contained similar porosities. (2) Once formation pore types were diverse, the shapes of porosity frequency spectra were absolute different. They exhibited as bimodal or multimodal distributions, and the larger the matrix porosity, the wider the porosity frequency spectrum (Figure 5b and c). (3) The shapes of porosity frequency spectra were solely determined by the pore type, but were independent of lithology. Like the respectively exhibited results in Figure 5a, b and c, formations with similar porosities but four different types of lithologies had similar porosity frequency spectra.
4. Establishment of Permeability Prediction Model Based on Porosity Frequency Spectrum
4.1. Extraction of Input Parameters from Porosity Frequency Spectrum
Figure 5a to c notably illustrated that the shapes of porosity frequency spectra were heavily associated with the pore type and pore-fracture configuration relationship. Formations with diverse pore types, such as fracture-pore type or pore-fracture type, often had better pore connectivity, more superior pore structure, and correspondingly better permeability, and vice versa. Hence, the shapes of porosity frequency spectra can be used to reflect rock permeability. The wider the porosity frequency spectra, the higher the permeability.
In order to quantify the correlation between porosity frequency spectrum and permeability, we extracted two parameters from porosity frequency spectrum to characterize the form, and defined them as the logarithmic mean and standard deviation between two golden section points (GSP). The physical significance and calculation method of these two parameters for different types of porosity frequency spectra were exhibited in Figure 6 and expressed in eq.s 5 and 6, separately.
where, φgm was the logarithmic mean of porosity frequency spectrum in %. Its value represented the position of the main peak of the porosity frequency spectrum. For example, formation had a more superior pore structure, and the position of the porosity frequency spectrum was relatively to the right, with the corresponding logarithmic mean value being larger. φgsr was the standard deviation between two golden section points in %. Its value represented the width of porosity frequency spectrum. The more complex the pore structure of the formation was, the wider the distribution of the porosity frequency spectrum would be, and the larger the corresponding φgsr would be.
After electrical imaging logging was processed, the porosity frequency spectra could be consecutive acquired, and φgm and φgsr were calculated. To analyze the relationship among these two parameters with permeability, we extracted them corresponding to the same depth with core samples, and crossed them with permeability, as were shown in Figure 7.
Comparison of Figure 2 and Figure 7 clearly indicated that φgm and φgsr had a much stronger correlation with permeability, and both of them were all positively correlated. As the φgm and φgsr increased, the corresponding permeability also raised. They were two sensitive parameters in indicating the change of permeability.
4.2. Establishment of Permeability Prediction Model in Fractured Metamorphic Rock Reservoirs
Figure 7 had clearly exhibited the positive correlation among φgm, φgsr and permeability. Hence, we choose φgm and φgsr as the input parameters to establish a permeability prediction model, and this model was expressed as:
Where, K was the rock permeability in mD. C, p and q were the involved model constants, and their values needed to be first calibrated by using the experimented results of core samples.
It needed to noted that, comparing with porosity, φgm and φgsr were much positively associated with permeability, but the correlation that displayed in Figure 7 was not high enough. The reason was that the displayed core samples in Figure 7 were all collected from different types of reservoirs in the Archaeozoic Formation in BZ 19-6 Region, the pore space type was not separated.
4.3. Calibration of the Involved Model Constants Based on Reservoir Classification
To observe the correlation among φgm, φgsr and permeability, we classified the data sets that exhibited in Figure 7 into three clusters based on the difference of pore space type. Figure 8 exhibited the cross-plot of φgsr and permeability for three different types of formations. Comparison of Figure 7 and Figure 8 indicated that the relationship φgsr and permeability was absolutely different for different types of formations, formations should be first classified to calibrate reasonable input constants of C, p and q. Meanwhile, in reservoirs with fracture-pore type and pore-fracture type, the variation tendency between φgsr and permeability was similar, there is no need to further divide these two types of formations to calibrate the involved model constants.
Based on above analysis, we classified the exhibited data sets in Figure 7 into two categories, which were single fracture type and double-pore type (contained fracture-pore type and pore-fracture type), and they were used to determine the involved input constants in eq. 7. The calibrated models were expressed as follow:
5. Case Study
To use eq.s 8 and 9 to consecutively predict formation permeability, the formation pore type identification was a key. As was well known to all that the most direct data for indicating reservoir type was the cast thin section of core samples [36]. However, the limited number of core samples had restricted the use of them to continuously indicate reservoir types. In this study, we employed the method of core calibration logging, and analyzed the response characteristics of porosity frequency spectrum for different types of formations that indicated by the cast thin section. Finally, we found that the cross-plot of φgm and φgsr was the optimal indicator for formation type in the Archaeozoic Formation in BZ 19-6 Region (Figure 9). By using Figure 9, our target formations can be precisely classified into three types. For single fracture-type formations, eq. 6 can be used for permeability prediction, and for formations with double-pore type (fracture-pore type and pore-fracture type), unified model that expressed in eq. 7 should be used.
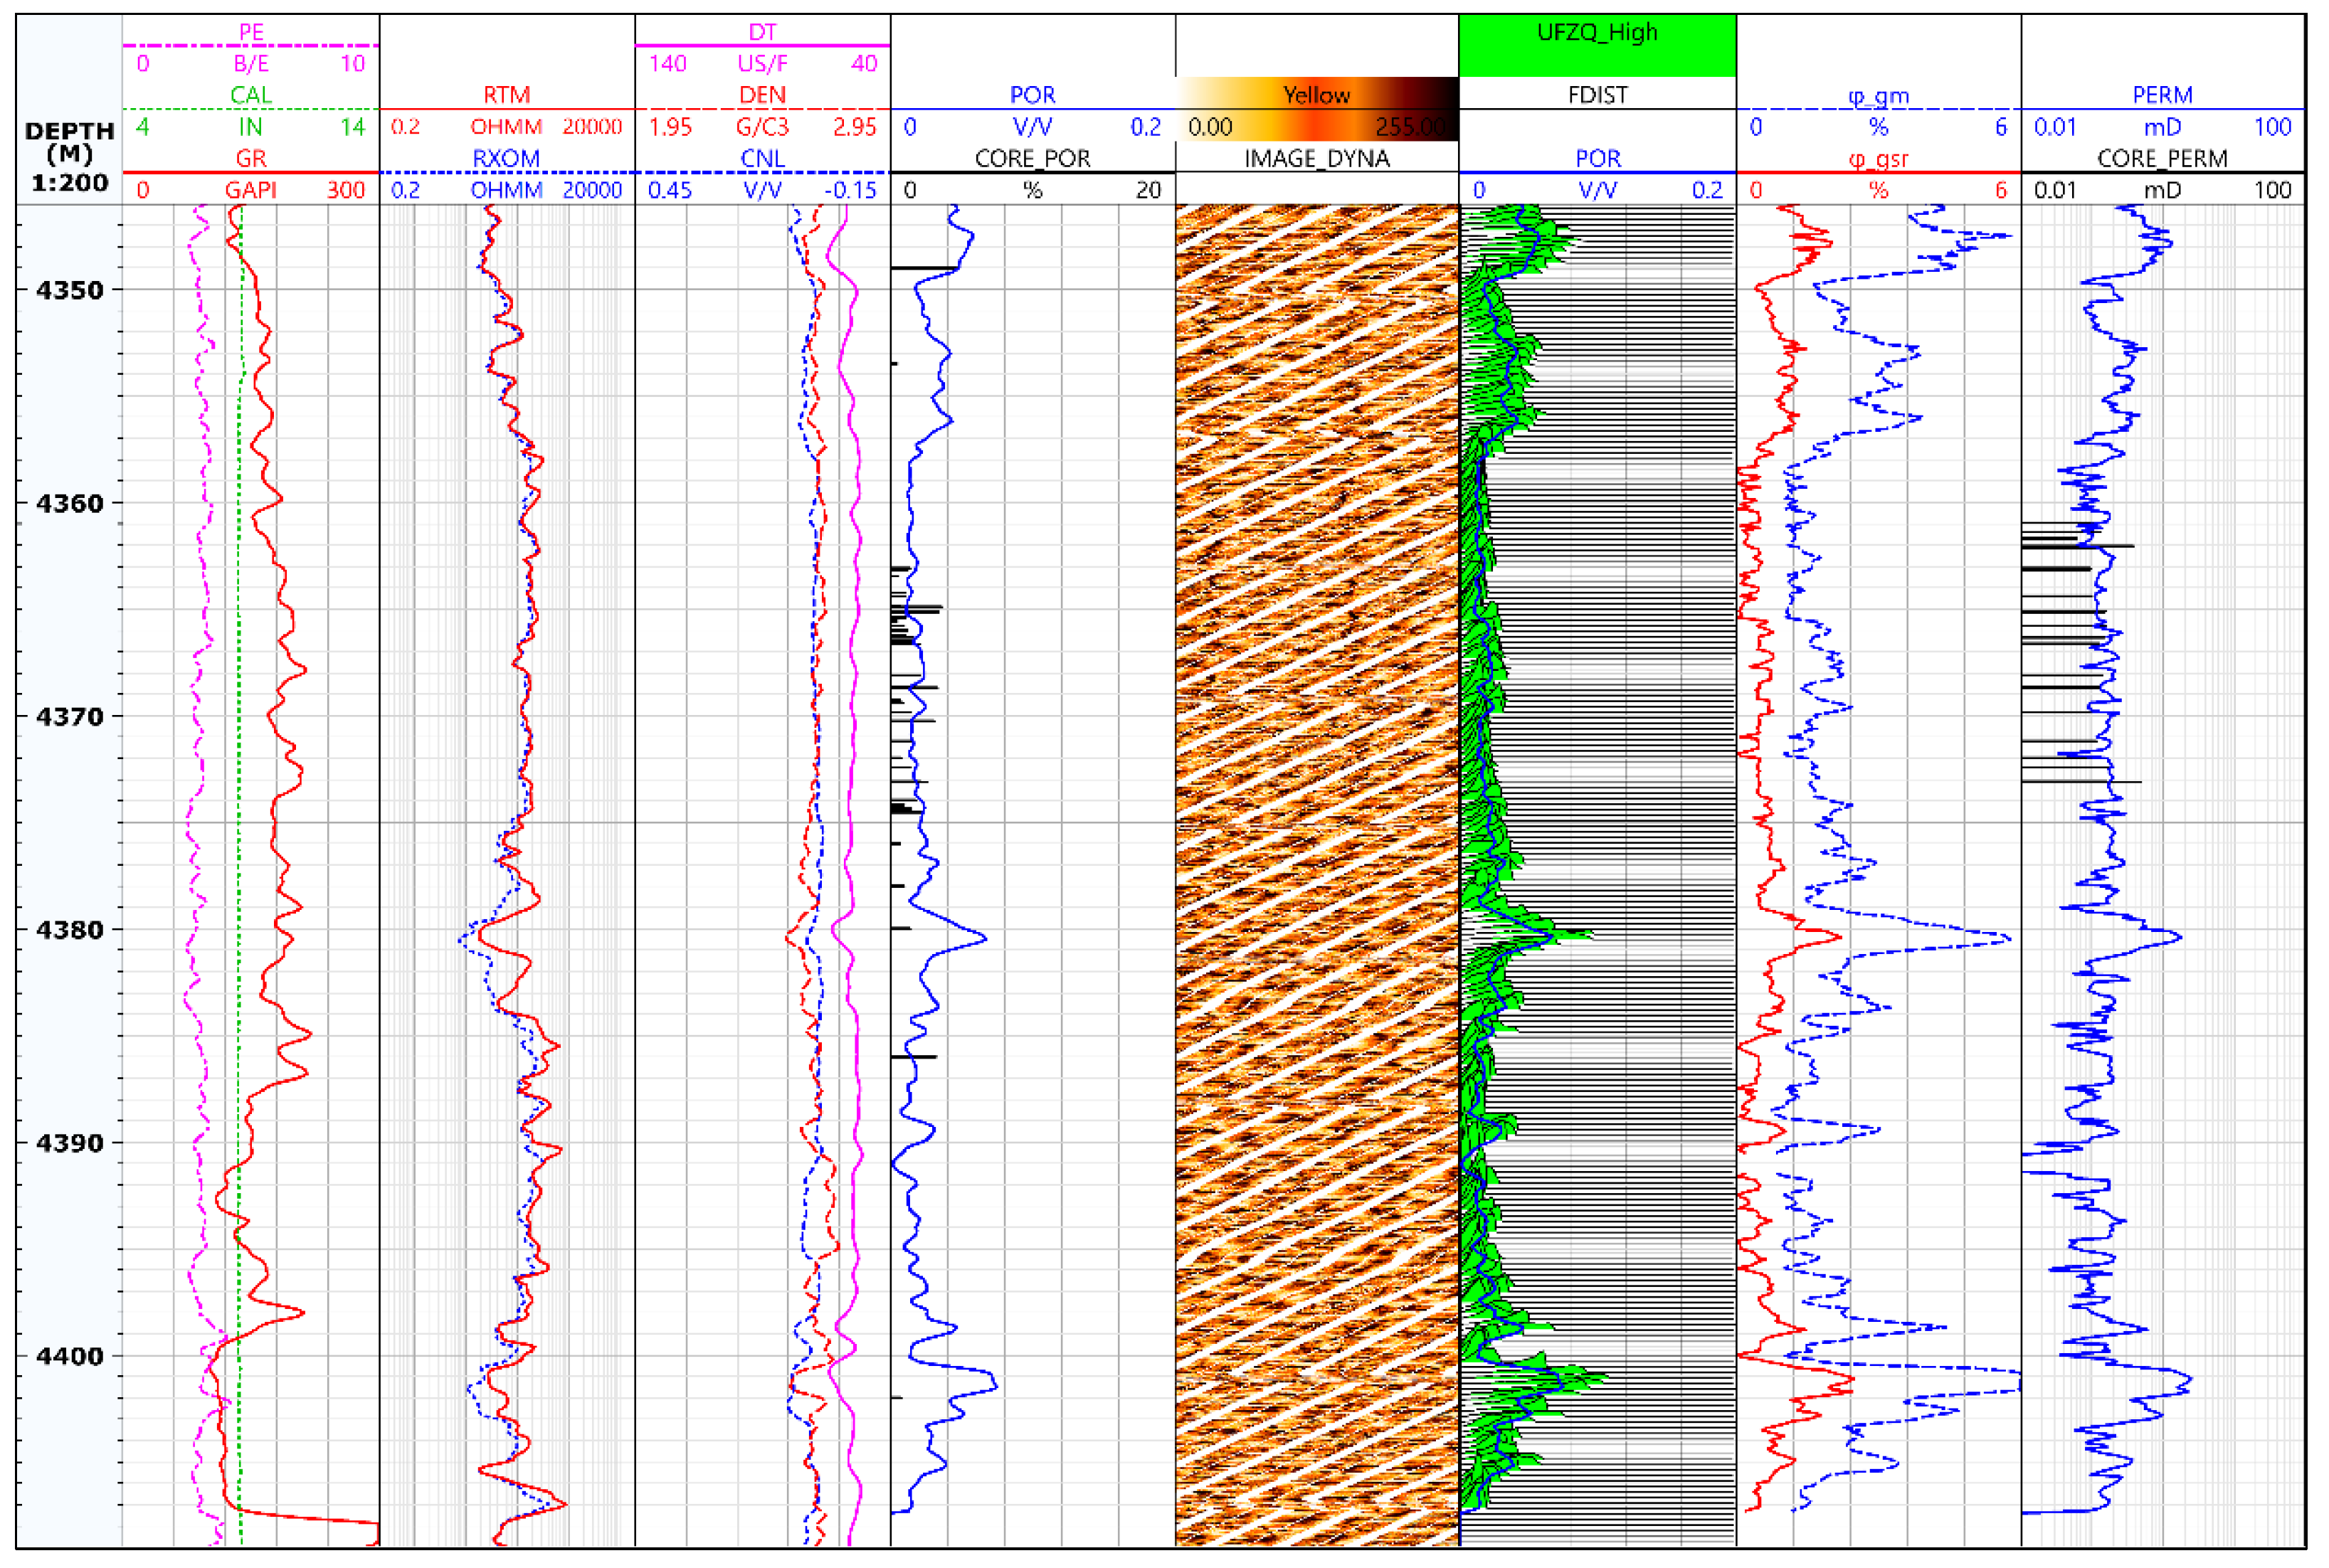
Combining with Figure 9 and eq.s 8 and 9, we processed the electrical imaging logging in several wells in BZ19-6 Region, consecutive porosity frequency spectra were acquired, and the permeability curves were predicted. Figure 10 exhibited the comparison of predicted permeabilities with core-derived results in a well. In this figure, electrical imaging logging acquiring from the Schlumberger’s FMI tool was displayed in the sixth track, and the extracted porosity frequency spectra were displayed in the seventh track. Meanwhile, we also displayed the extracted φgm and φgsr from porosity frequency spectra in the eighth track. Observation of the shapes of electrical imaging logging and corresponding porosity frequency spectra indicated that the interval of 4594.0-4600.0m belonged to pore-fracture type, the intervals of 4620.0-4623.0m and 4649.0-4653.0m were fracture-pore types, and the other intervals could be categorized as fractured reservoirs. The corresponding permeability prediction models were respectively used to consecutively calculate a permeability curve, as was displayed in the ninth track. Comparison of predicted permeability (PERM) with core-derived results (CPERM) exhibited a high consistency. The reliability of our raised model was verified. In addition, the extreme volatility of the predicted permeability curve indicated its high resolution, and this was derived from the electrical imaging logging.
6. Discussion
The shape of the porosity frequency spectrum was heavily determined by the pore space type. In formations with secondary pores (fracture and/or cave) developed, the porosity frequency spectrum exhibited as a relatively broad double-peak or multi-peak distribution, the corresponding φgm and φgsr would vary in a large range. However, in formations where only intergranular pores were present, the porosity frequency spectra exhibited as single unimodality, and their shapes were approximately that of standard normal distributions. In this case, the value of φgsr would be very close to each other in the whole intervals, even if they contained various porosities. The relationship between φgsr and permeability would be chaotic and disorderly. Hence, our raised model in this study was only valuable in formations where secondary pores had developed. In formations where the matrix intergranular pores play a dominant role, it would lose its stage.
7. Conclusion
Our target deep metamorphic rock reservoirs in the BZ19-6 Region contained three different types of pore spaces, which were single fracture type, fracture-pore type and pore-fracture type. This leaded to complicated pore structure and extremely strong heterogeneity. The relationship between core-derived porosities and permeabilities lost its role in permeability prediction. The electrical imaging logging could play an important role in these types of reservoirs. The extracted porosity frequency spectrum could well reflect the pore structure in fractured formations.
Based on the analysis of the morphological characteristics, two parameters, which were named as the logarithmic mean and the standard deviation between two golden section points of porosity frequency spectrum, were extracted. The relationships among these two parameters and permeability were analyzed, and a novel model to predict permeability in deep metamorphic rock reservoirs was established. The involved input coefficients were calibrated after formations were classified into two clusters.
Field applications in the Archaeozoic Formation in BZ 19-6 Region clearly indicated that our raised model was valuable in predicting permeability in fractured reservoirs. The predicted permeabilities matched well with core-derived results. Besides the metamorphic rock reservoirs, this model would also play a good role in any types of fractured reservoirs, e.g., the volcanic rock reservoirs, the carbonate rock reservoirs and fractured tight sandstone reservoirs.
Author Contributions
Yunjiang Cui was involved in funding acquisition, processing electrical imaging logging data and writing original draft. Peichun Wang was involved in establishing the permeability prediction model and processing several wells in field application. Yi Qi was involved in classifying formation types and calibrating the involved parameters in the model. Ruihong Wang was involved in evaluating the reliability of the raised model and revising the draft. Liang Xiao is the supervisor, and he was involved in writting the initial draft.
Data Availability Statement
Data will be made available on request.
Acknowledgments
This research was supported by the innovation funds of CNOOC “Research on quantitative evaluation technology of key parameters in buried-hill fractured reservoirs” (KJZH-2024-2101).
Conflicts of Interest
The authors declare no conflict of interest.
References
- Liu, D; Xiao, L; Li, J R; Jin, Y. Method of Predicting Tight Gas Deliverability from Conventional Well Logging Data Based on Experimental Simulation. Arabian Journal for Science and Engineering 2018, 43(5), 2615–2623. [Google Scholar] [CrossRef]
- Mao, ZQ; Xiao, L; Wang, ZN; Jin, Y; Liu, XG; Xie, B. Estimation of permeability by integrating nuclear magnetic resonance (NMR) logs with mercury injection capillary pressure (MICP) data in tight gas sands. Applied Magnetic Resonance 2013, 44(4), 449–468. [Google Scholar] [CrossRef]
- Xiao, L; Liu, XP; Zou, CC; Hu, XX; Mao, ZQ; Shi, YJ; Guo, HP; Li, GR. Comparative study of models for predicting permeability from nuclear magnetic resonance (NMR) logs in two Chinese tight sandstone reservoirs. Acta Geophysica 2014, 62(1), 116–141. [Google Scholar] [CrossRef]
- Jennings, JJW; Lucia, FJ. Predicting permeability from well logs in carbonates with a link to geology for interwell permeability mapping. SPE Reservoir Evaluation and Engineering 2003, 6(4), 215–225. [Google Scholar] [CrossRef]
- Bust, VK; Oletu, JU; Worthington, PF. The challenges for carbonate petrophysics in petroleum resource estimation. SPE Reservoir Evaluation and Engineering 2011, 14(1), 25–34. [Google Scholar] [CrossRef]
- Adolfo, DW. Reservoir zonation and permeability estimation: A Bayesian approach. Paper UUU presented at the SPWLA 48th Annual Logging Symposium, Austin, USA, 3-6 June 2007. [Google Scholar]
- Timur, A. Producible porosity and permeability of sandstone investigated through nuclear magnetic resonance principles. The Log Analyst 1969, 10(1), 3–11. [Google Scholar]
- Swanson, BF. A simple correlation between permeabilities and mercury capillary pressures. Journal of Petroleum Technology 1981, 33(12), 2498–2504. [Google Scholar] [CrossRef]
- Coates, GR; Xiao, LZ; Prammer, MG. NMR Logging: Principles and Applications; Haliburton Energy Services: Houston, 1999; pp. 1–234. [Google Scholar]
- Dunn, KJ; Bergman, DJ; Latorraca, GA. Nuclear Magnetic Resonance: Petrophysical and Logging Applications. Handbook of Geophysical Exploration 2002, 1–176. [Google Scholar]
- Guo, BY; Ghalambor, A; Duan, SK. Correlation between sandstone permeability and capillary pressure curves. Journal of Petroleum Science and Engineering 2004, 43(3-4), 239–246. [Google Scholar] [CrossRef]
- Lafage, SI. An alternative to the Winland R35 method for determining carbonate reservoir quality. M.Sc. Thesis, Texas A&M University, USA, 2008; pp. 1–52. [Google Scholar]
- Rezaee, R; Saeedi, A; Clennell, B. Tight gas sands permeability estimation from mercury injection capillary pressure and nuclear magnetic resonance data. Journal of Petroleum Science and Engineering 2012, 88-89, 92–99. [Google Scholar] [CrossRef]
- Abbaszadeh, M; Fujii, H; Fujimoto, F. Permeability prediction by hydraulic flow units-theory and applications. SPE Formation and Evaluation 1996, 11(4), 263–271. [Google Scholar] [CrossRef]
- Shahvar, MB; Kharrat, R; Matin, M. Applying flow zone index approach and artificial neural networks modeling technique for characterizing a heterogeneous carbonate reservoir using dynamic data: Case study of an Iranian reservoir. Paper SPE-132898-MS presented at the Trinidad and Tobago Energy Resources Conference, 27-30 June 2010. [Google Scholar] [CrossRef]
- Budi, DS; Umar, F. Analysis of the effect of coordination number on permeability of the three-dimensional (3d) rock model using the lattice Boltzmann method (LBM). Journal of Physics: Conference Series 2024, 2734, 012053. [Google Scholar] [CrossRef]
- Rashid, F; Glover, PWJ; Lorinczi, P; Collier, R; Lawrence, J. Porosity and permeability of tight carbonate reservoir rocks in the north of Iraq. Journal of Petroleum Science and Engineering 2015, 133. [Google Scholar] [CrossRef]
- Heap, MJ; Reuschlé, T; Farquharson, JI; Baud, P. Permeability of volcanic rocks to gas and water. Journal of Volcanology and Geothermal Research 2018, 354, 29–38. [Google Scholar] [CrossRef]
- Heap, MJ; Meyer, GG; Noël, C; Wadsworth, FB; Baud, P; Violay, MES. The permeability of porous volcanic rock through the brittle-ductile transition. Journal of Geophysical Research: Solid Earth 2022, 127, e2022JB024600. [Google Scholar] [CrossRef]
- Kudasik, M; Anioł, Ł; Gajda, A; Pajdak, A. Influence of confining pressure on permeability and structural properties of selected sedimentary, igneous, and metamorphic rocks. Bulletin of Engineering Geology and the Environment 2023, 82, 455. [Google Scholar] [CrossRef]
- Xiao, L; Li, JR; Mao, ZQ; Yu, HY. A method to evaluate pore structures of fractured tight sandstone reservoirs using borehole electrical image logging. AAPG Bulletin 2020, 104(1), 205–226. [Google Scholar] [CrossRef]
- Guan, LJ; Zhang, W; Zhang, P; Yang, YQ; Cui, WP; Li, Y; Meng, K; Xiao, L. Comparisons of Evaluating Fractured Tight Sandstone Reservoirs Pore Structures Based on Borehole Electrical Image and Nuclear Magnetic Resonance NMR Logs. Paper SPE-204875-MS presented at the SPE Middle East Oil & Gas Show and Conference, November 2021. [Google Scholar] [CrossRef]
- Li, GR; Yan, RH; Liu, TD; Sun, XP; Wang, PX; Xiao, L. A novel method of predicting fractured tight sandstone reservoir permeability from electrical image logging. Paper SPE-223179-MS presented at the Mediterranean Offshore Conference, Alexandria, Egypt, October 2024. [Google Scholar] [CrossRef]
- Meng, K; Yu, HY; Fan, LY; Ma, ZR; Luo, XR; Cao, BF; Zhang, YH. Developing a novel permeability prediction method for tight carbonate reservoirs using borehole electrical image logging. Geophysics 2024, 89(6), D287–D299. [Google Scholar] [CrossRef]
- Tian, X; Zhang, W; Huang, L; Li, Q; Yang, EH; Xiao, L. Comparison of Methods for Predicting Formation Permeability from Electrical Imaging Logging in Fractured Tight Reservoirs. Paper SEP-219165-MS presented at the GOTECH, Dubai, UAE, May 2024. [Google Scholar] [CrossRef]
- Li, JQ; Xiao, L; Zhang, W; Liu, TD; Xue, WF. A Morphological Method for Predicting Permeability in Fractured Tight Sandstone Reservoirs Based on Electrical Imaging Logging Porosity Spectrum. SPE Journal 2024, 29(10), 5400–5409. [Google Scholar] [CrossRef]
- Reiss, LH. The reservoir engineering aspects of fractured formations; Imprimerie Louis-Jean: Paris, 1980; pp. 1–108. [Google Scholar]
- Rostami, A; Kordavani, A; Parchekhari, S; Sarapardeh, AH; Helalizadeh, A. New insights into permeability determination by coupling Stoneley wave propagation and conventional petrophysical logs in carbonate oil reservoirs. Scientific Reports 2022, 12, 11618. [Google Scholar] [CrossRef]
- Harthy, AA; Kato, Y; Neumann, S; Lawatia, RH; Shoman, AM; Shrivastva, C. Case study: Understanding the reservoir heterogeneity in cretaceous carbonates with borehole images and NMR measurements: A methodology from Natih A, north Oman. Paper SPE-137989-MS presented at the Abu Dhabi International Petroleum Exhibition and Conference, Abu Dhabi, UAE, November 1-4, 2010. [Google Scholar] [CrossRef]
- Tong, ZG; Li, YC; He, JQ; Yao, S. Gas source of BZ19-6 condensate gas field in Bozhong Sag, Bohai Sea area. Petroleum Geology & Experiment 2022, 44(2), 324–330. [Google Scholar] [CrossRef]
- Chen, Q; Wu, JT; Liu, WC; Zhao, YJ; Bao, MY. Brittleness evaluation of metamorphic rock reservoirs based on rock mechanics characteristics and its main controlling factors: A case study of Bozhong 19-6 gas field. Geological Bulletin of China 2025, 1–17. [Google Scholar]
- Sullivan, KB; Schepel, KJ. Borehole image logs: Applications in fractured and thinly bedded reservoirs. Paper T presented at the SPWLA 36th Annual Logging Symposium, Paris, France, 26-29 June 1995. [Google Scholar]
- Archie, GE. The electrical resistivity log as an aid in determining some reservoir characteristics. Transactions of the AIME 146, 54–61. [CrossRef]
- Fu, HC; Zou, CC; Li, N; Xiao, CW; Zhang, CS; Wu, XN; Liu, RL. A quantitative approach to characterize porosity structure from borehole electrical images and its application in a carbonate reservoir in the Tazhong area, Tarim basin. SPE Reservoir Evaluation & Engineering 2016, 19(1), 18–23. [Google Scholar] [CrossRef]
- Hu, TT; Pan, T; Chen, L; Li, J; Liu, Y. Pore structure characterization and deliverability prediction of fractured tight glutenite reservoir based on geophysical well logging. Acta Geophysica 2024, 72(5), 273–286. [Google Scholar] [CrossRef]
- Xiao, L; Zou, CC; Li, GR; Zhang, W; Hu, TT. Low permeability-tight sandstone reservoir pore structure logging evaluation technology and application; Petroleum Industry Press: Beijing, 2021; pp. 1–218. [Google Scholar]
Figure 1.
The geologic age and lithology types of BZ19-6 Region, southwestern Bohai Bay Basin [31].
Figure 1.
The geologic age and lithology types of BZ19-6 Region, southwestern Bohai Bay Basin [31].
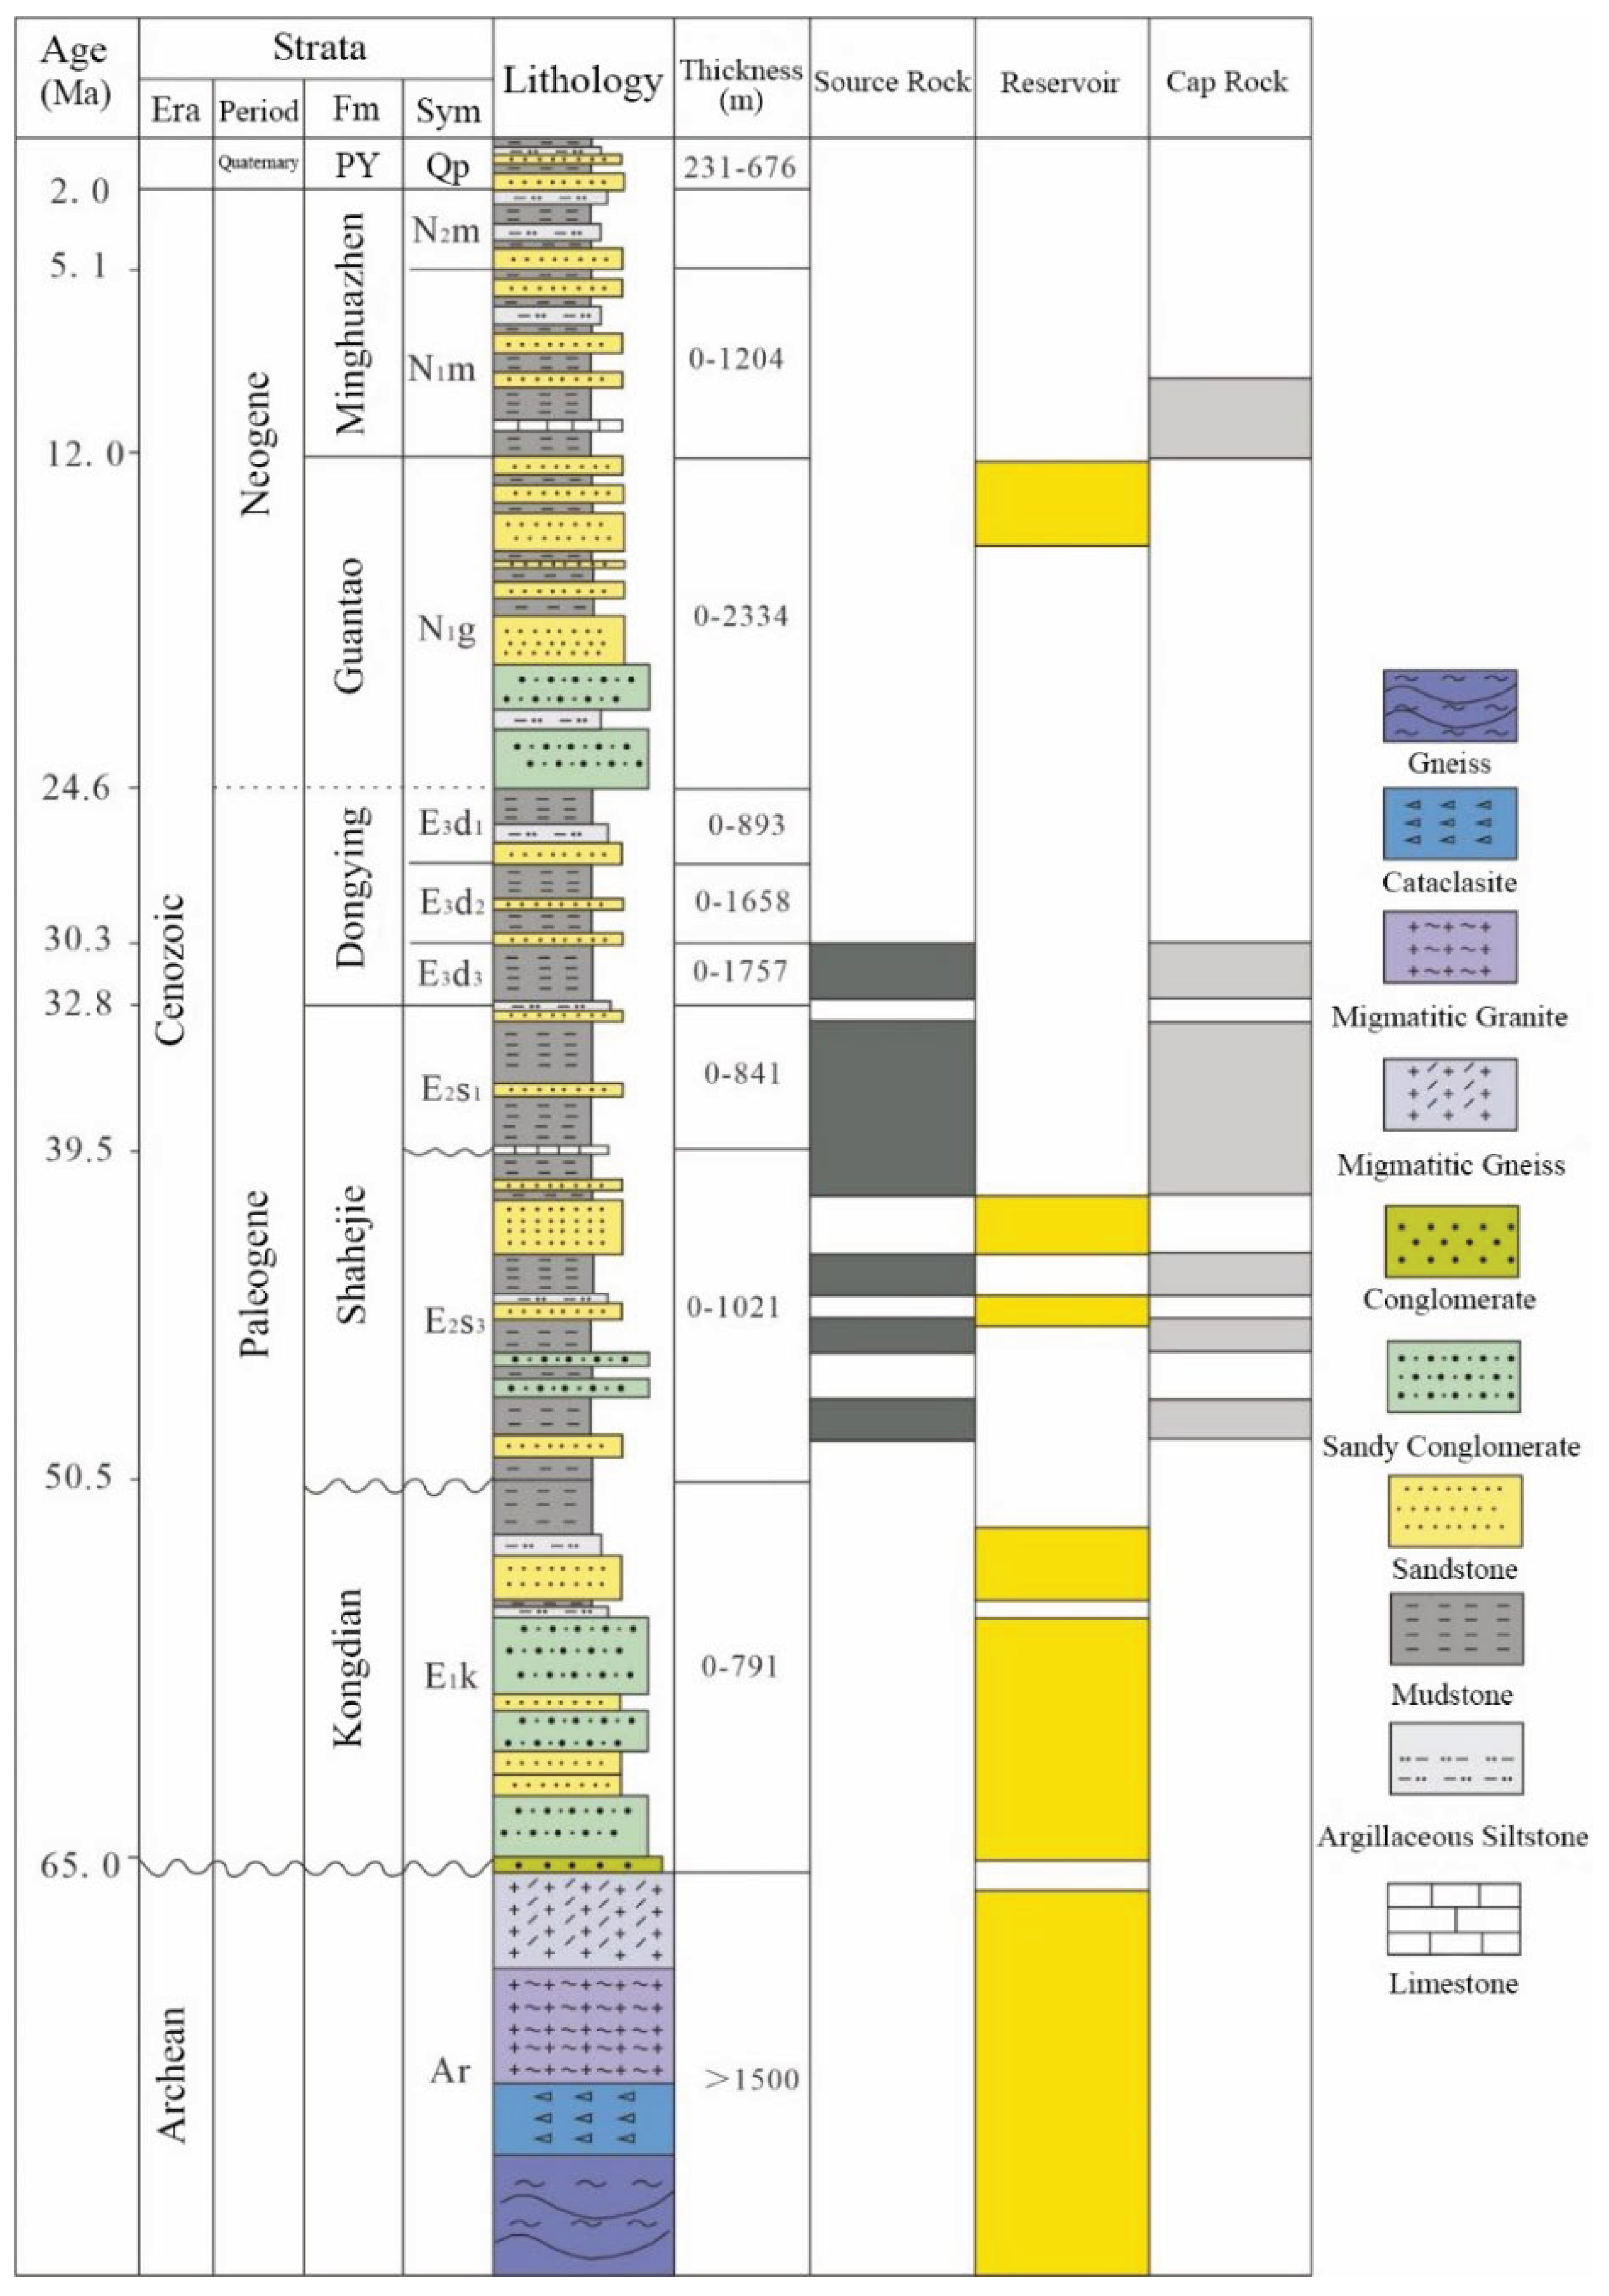
Figure 2.
Relationship between core-derived porosities and permeabilities in our target Archaeozoic Formation in BZ 19-6 Region of southwestern Bohai Bay Basin. The poor correlation made it impossible to directly calculate permeability from porosity.
Figure 2.
Relationship between core-derived porosities and permeabilities in our target Archaeozoic Formation in BZ 19-6 Region of southwestern Bohai Bay Basin. The poor correlation made it impossible to directly calculate permeability from porosity.
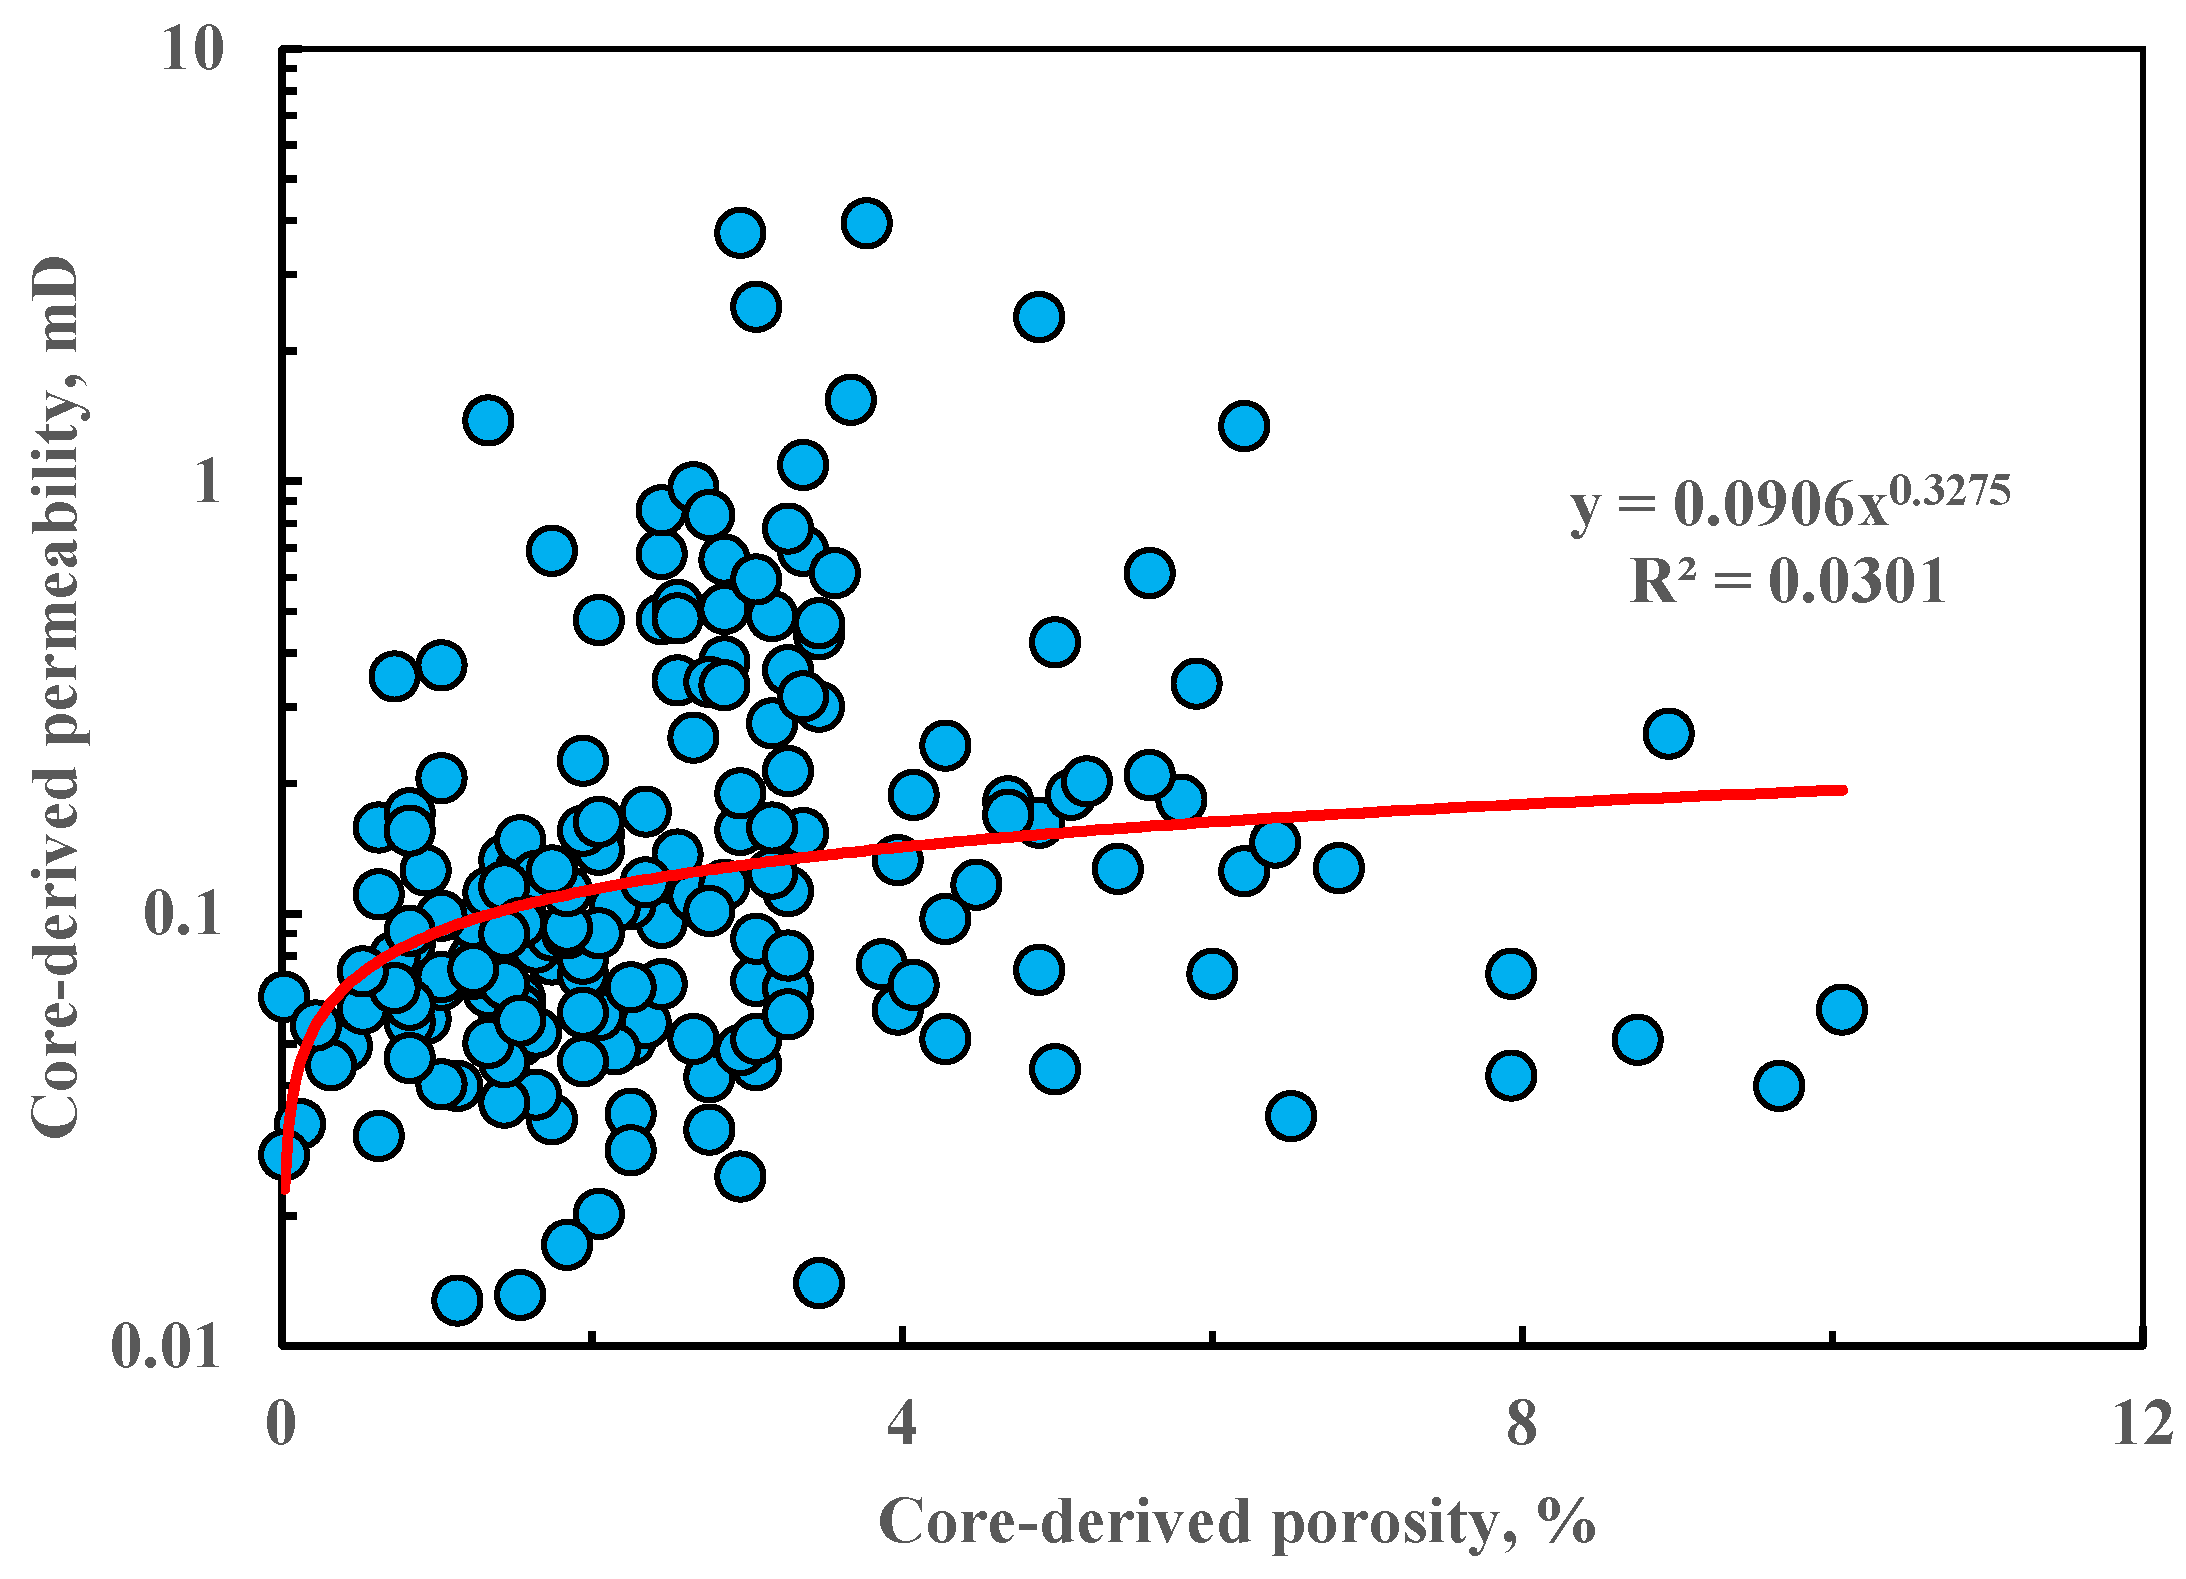
Figure 3.
Extraction of porosity frequency spectrum from electrical imaging logging based on the Schlumberger’s FMI tool [21].
Figure 3.
Extraction of porosity frequency spectrum from electrical imaging logging based on the Schlumberger’s FMI tool [21].
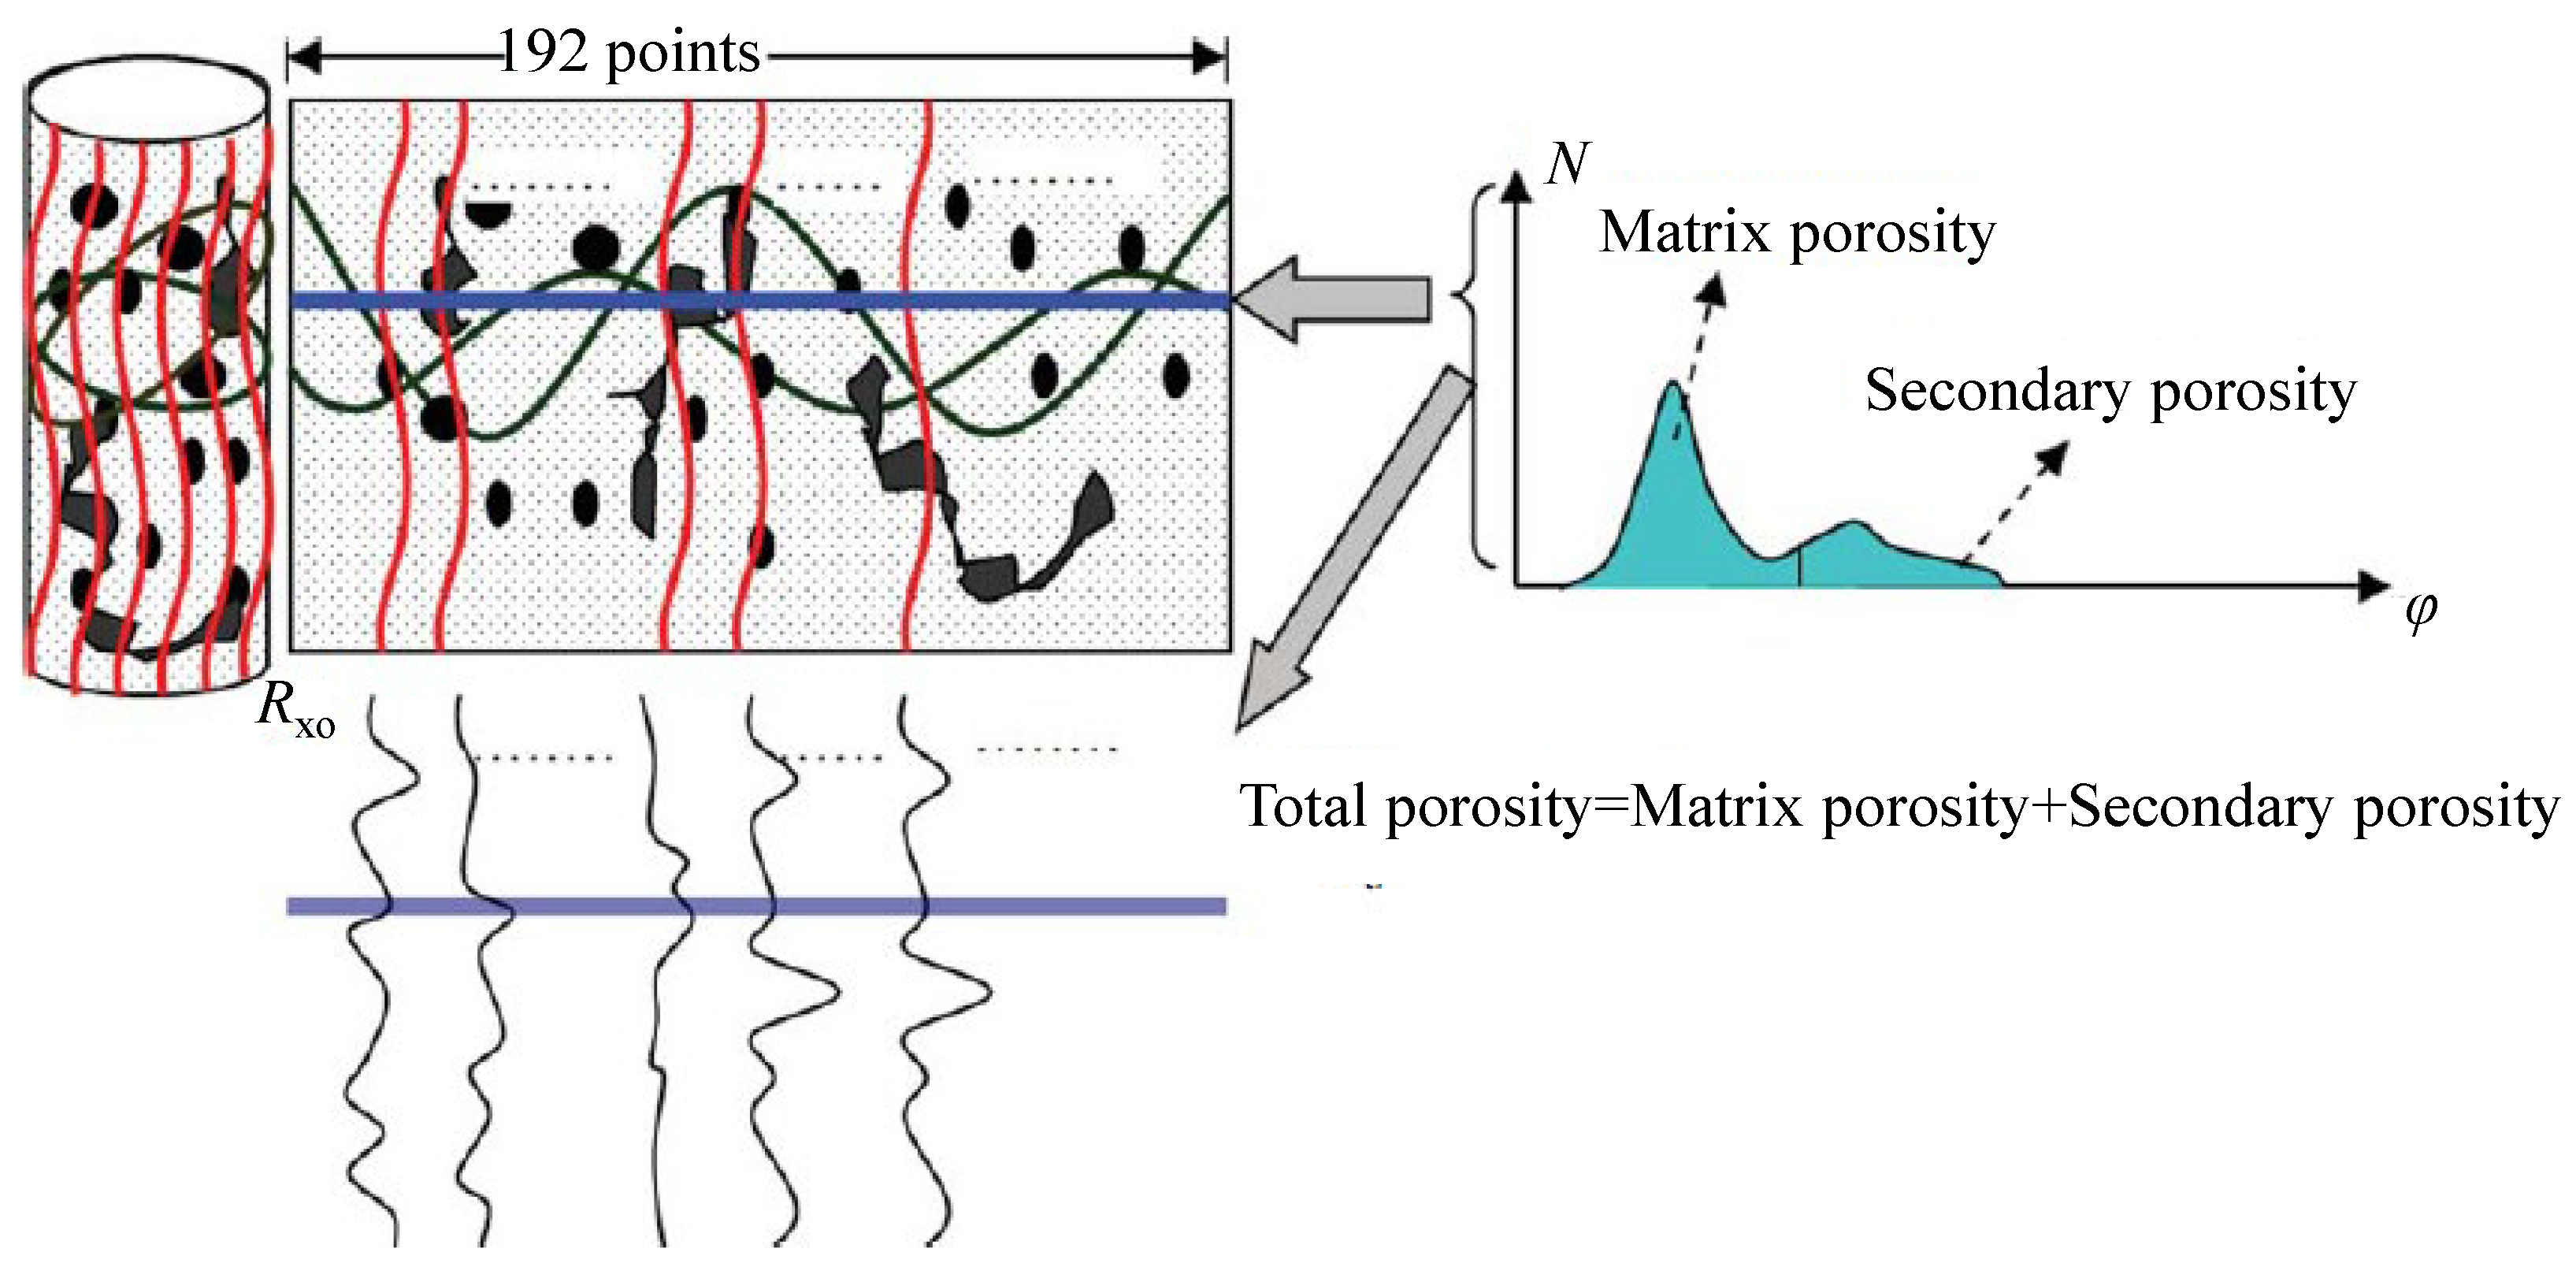
Figure 4.
The typical cast thin section of core samples for different types of formations in our target Archaeozoic Formation in BZ 19-6 Region, southwestern Bohai Bay Basin. The Archaeozoic Formations were classified into three clusters based on the configuration relationship of intergranular pore and fracture, which were single fracture type, fracture-pore type and pore-fracture type.
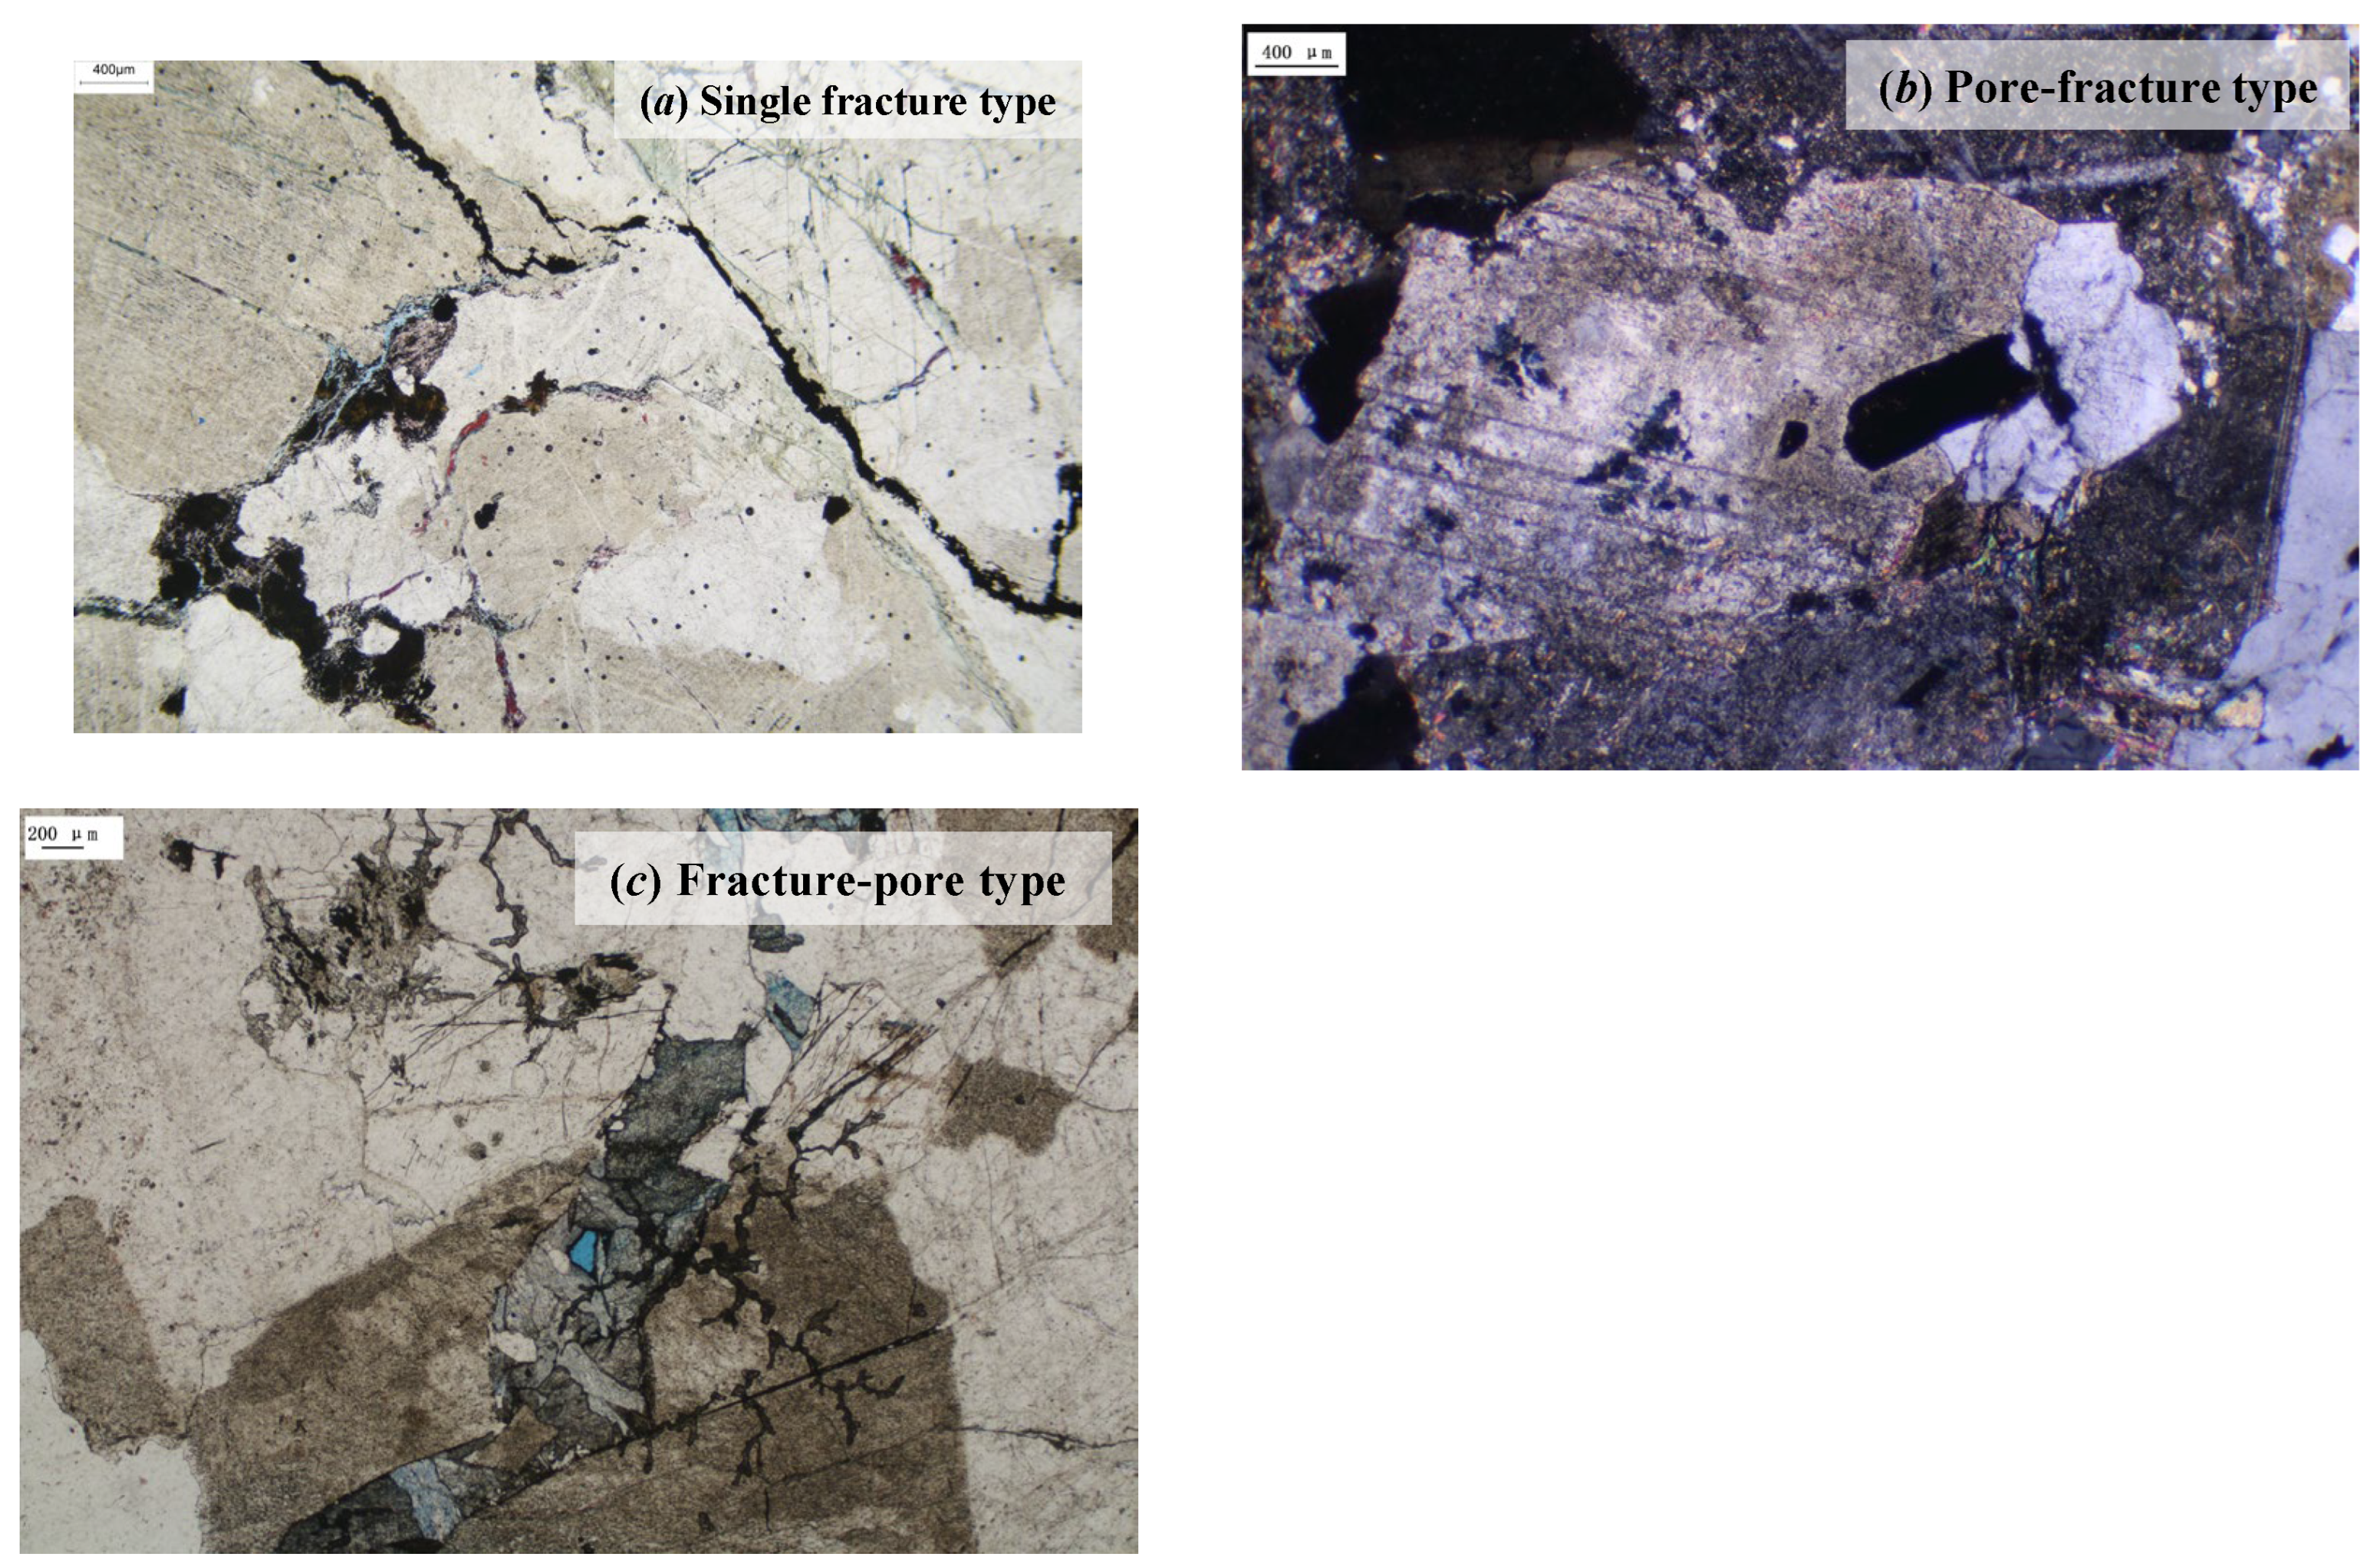
Figure 5.
Comparisons of the morphological characteristics of porosity frequency spectra for three types of formations. The porosity frequency spectra of single fractured formations exhibited as unimodal distributions, the fracture-pore type and pore-fracture type expressed as bimodal and multimodal characteristics. The main difference between these two types were the width, the porosity frequency spectra of fracture-pore type is wider. However, the shapes of porosity frequency spectra were independent of lithologies.
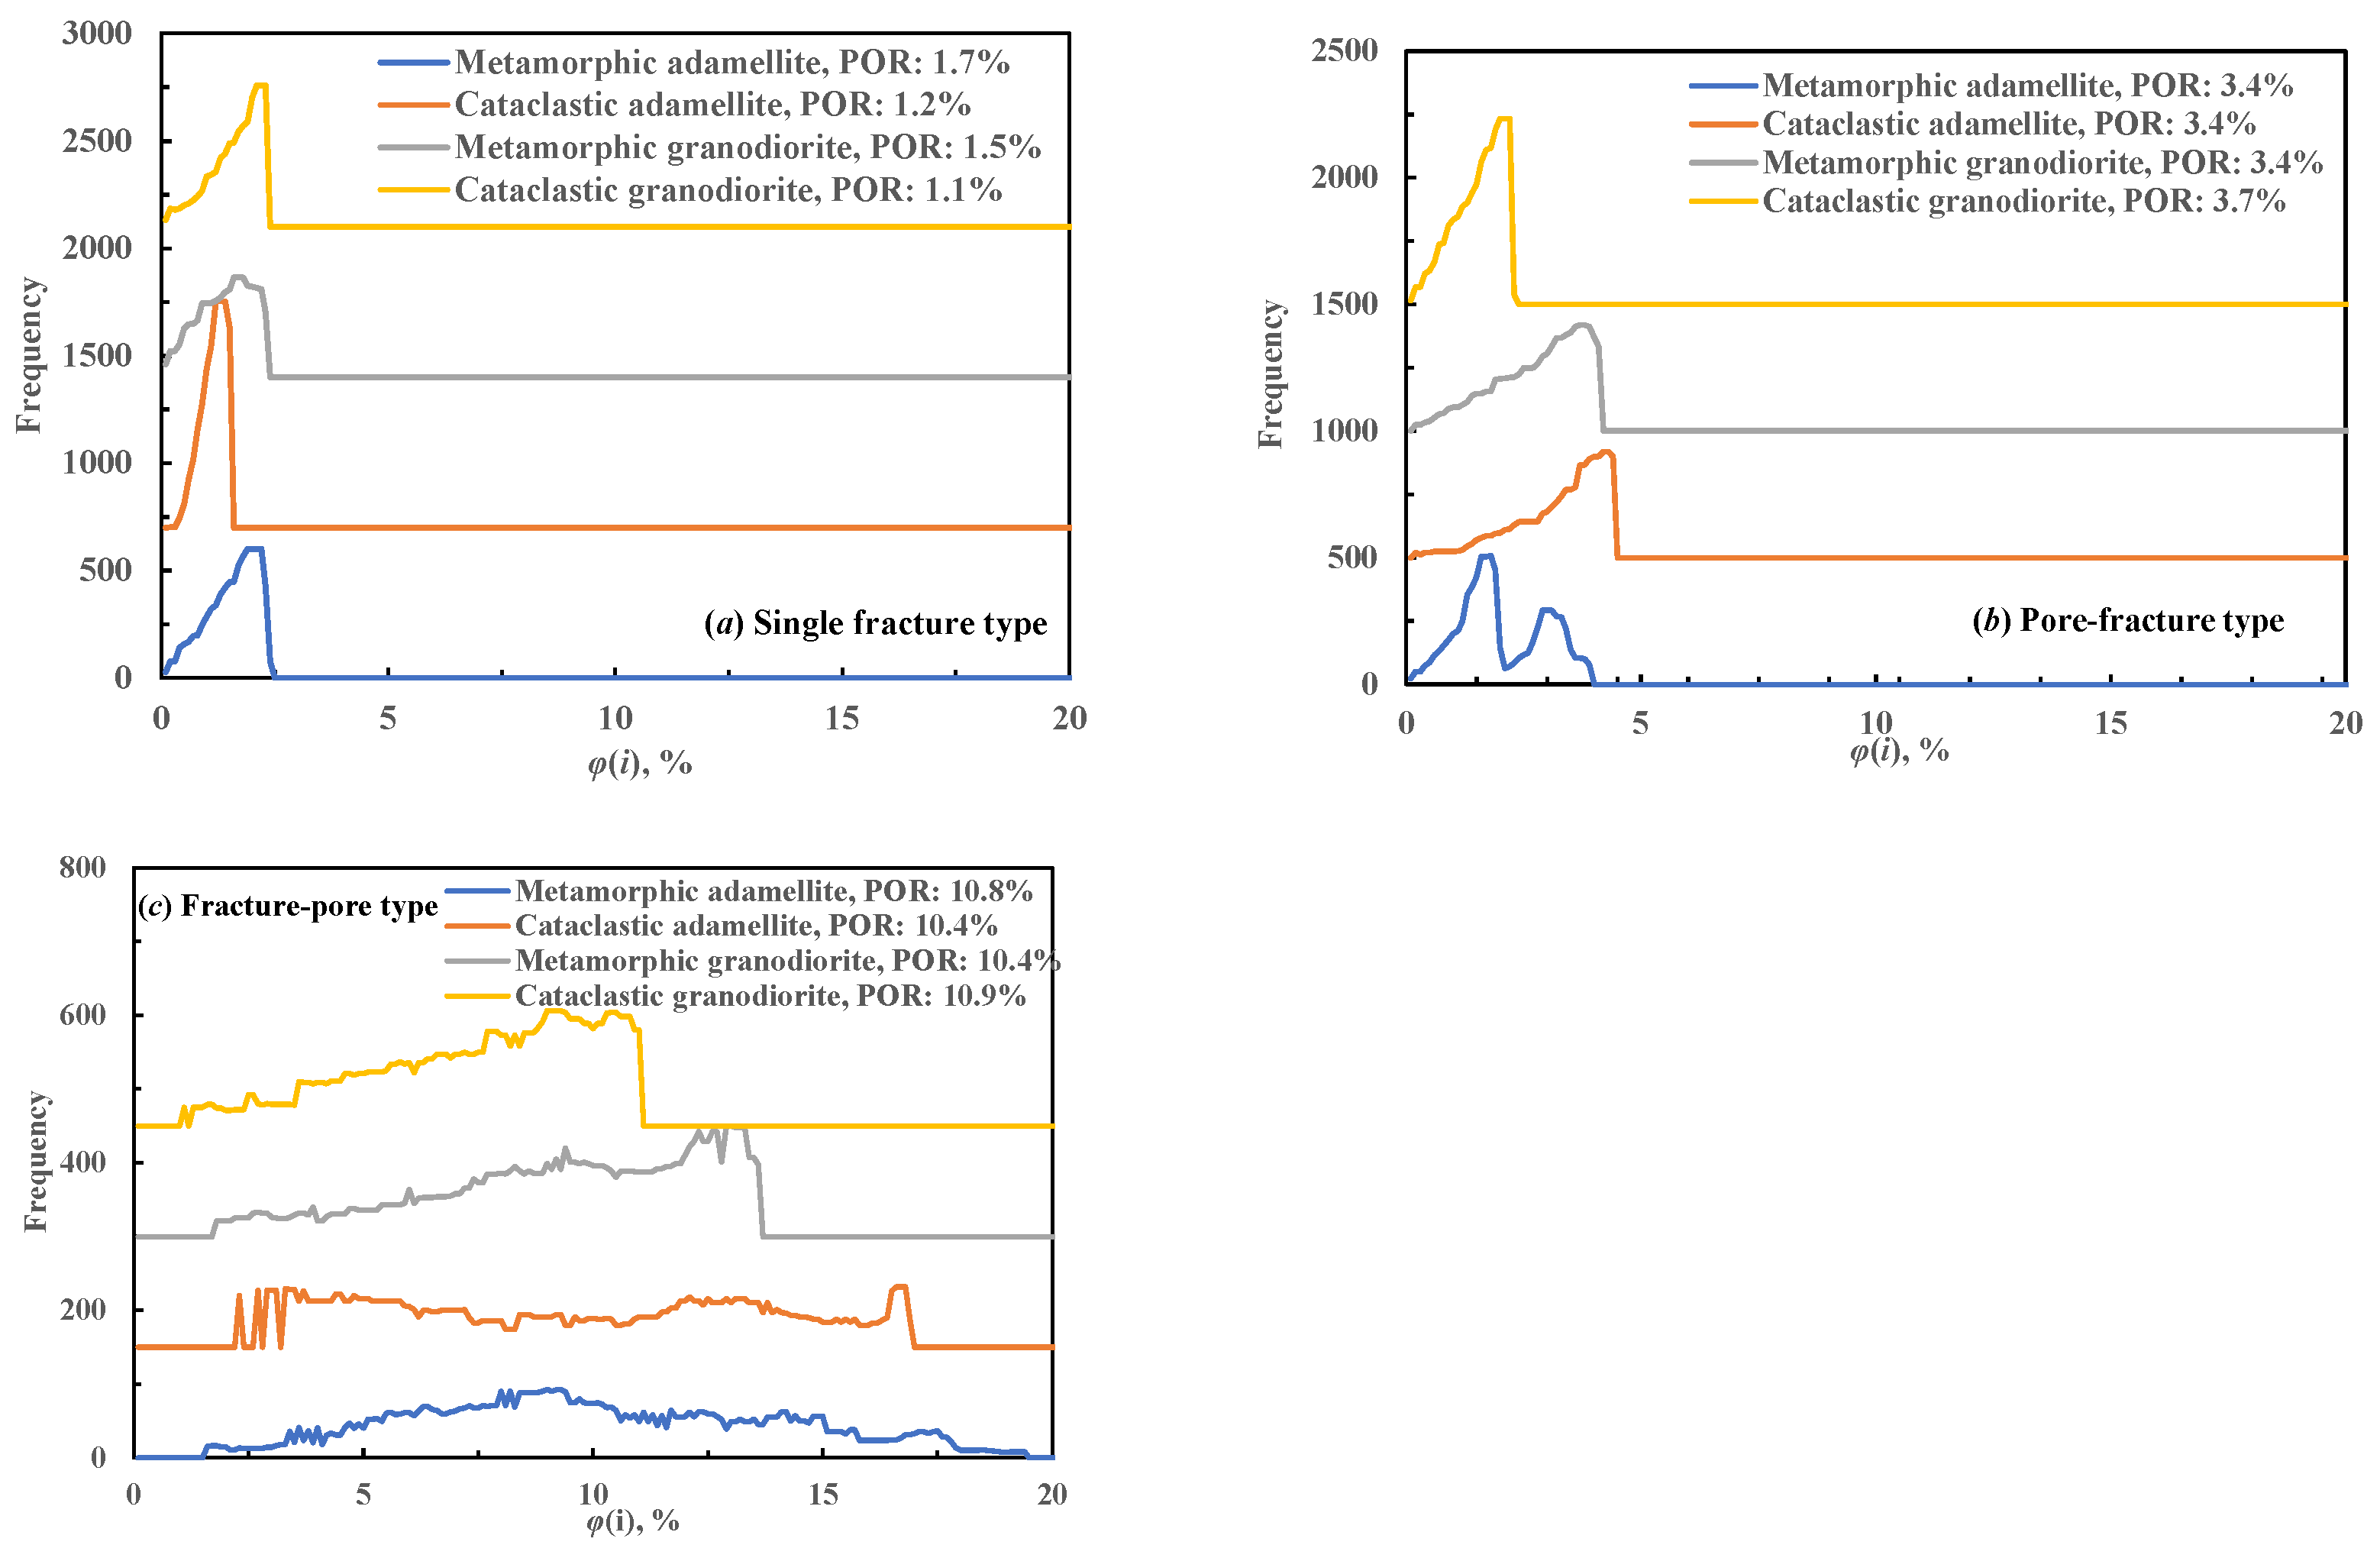
Figure 6.
Principle of extracting the logarithmic mean and standard deviation between two golden section points from porosity frequency spectrum in two different types of formations.
Figure 6.
Principle of extracting the logarithmic mean and standard deviation between two golden section points from porosity frequency spectrum in two different types of formations.
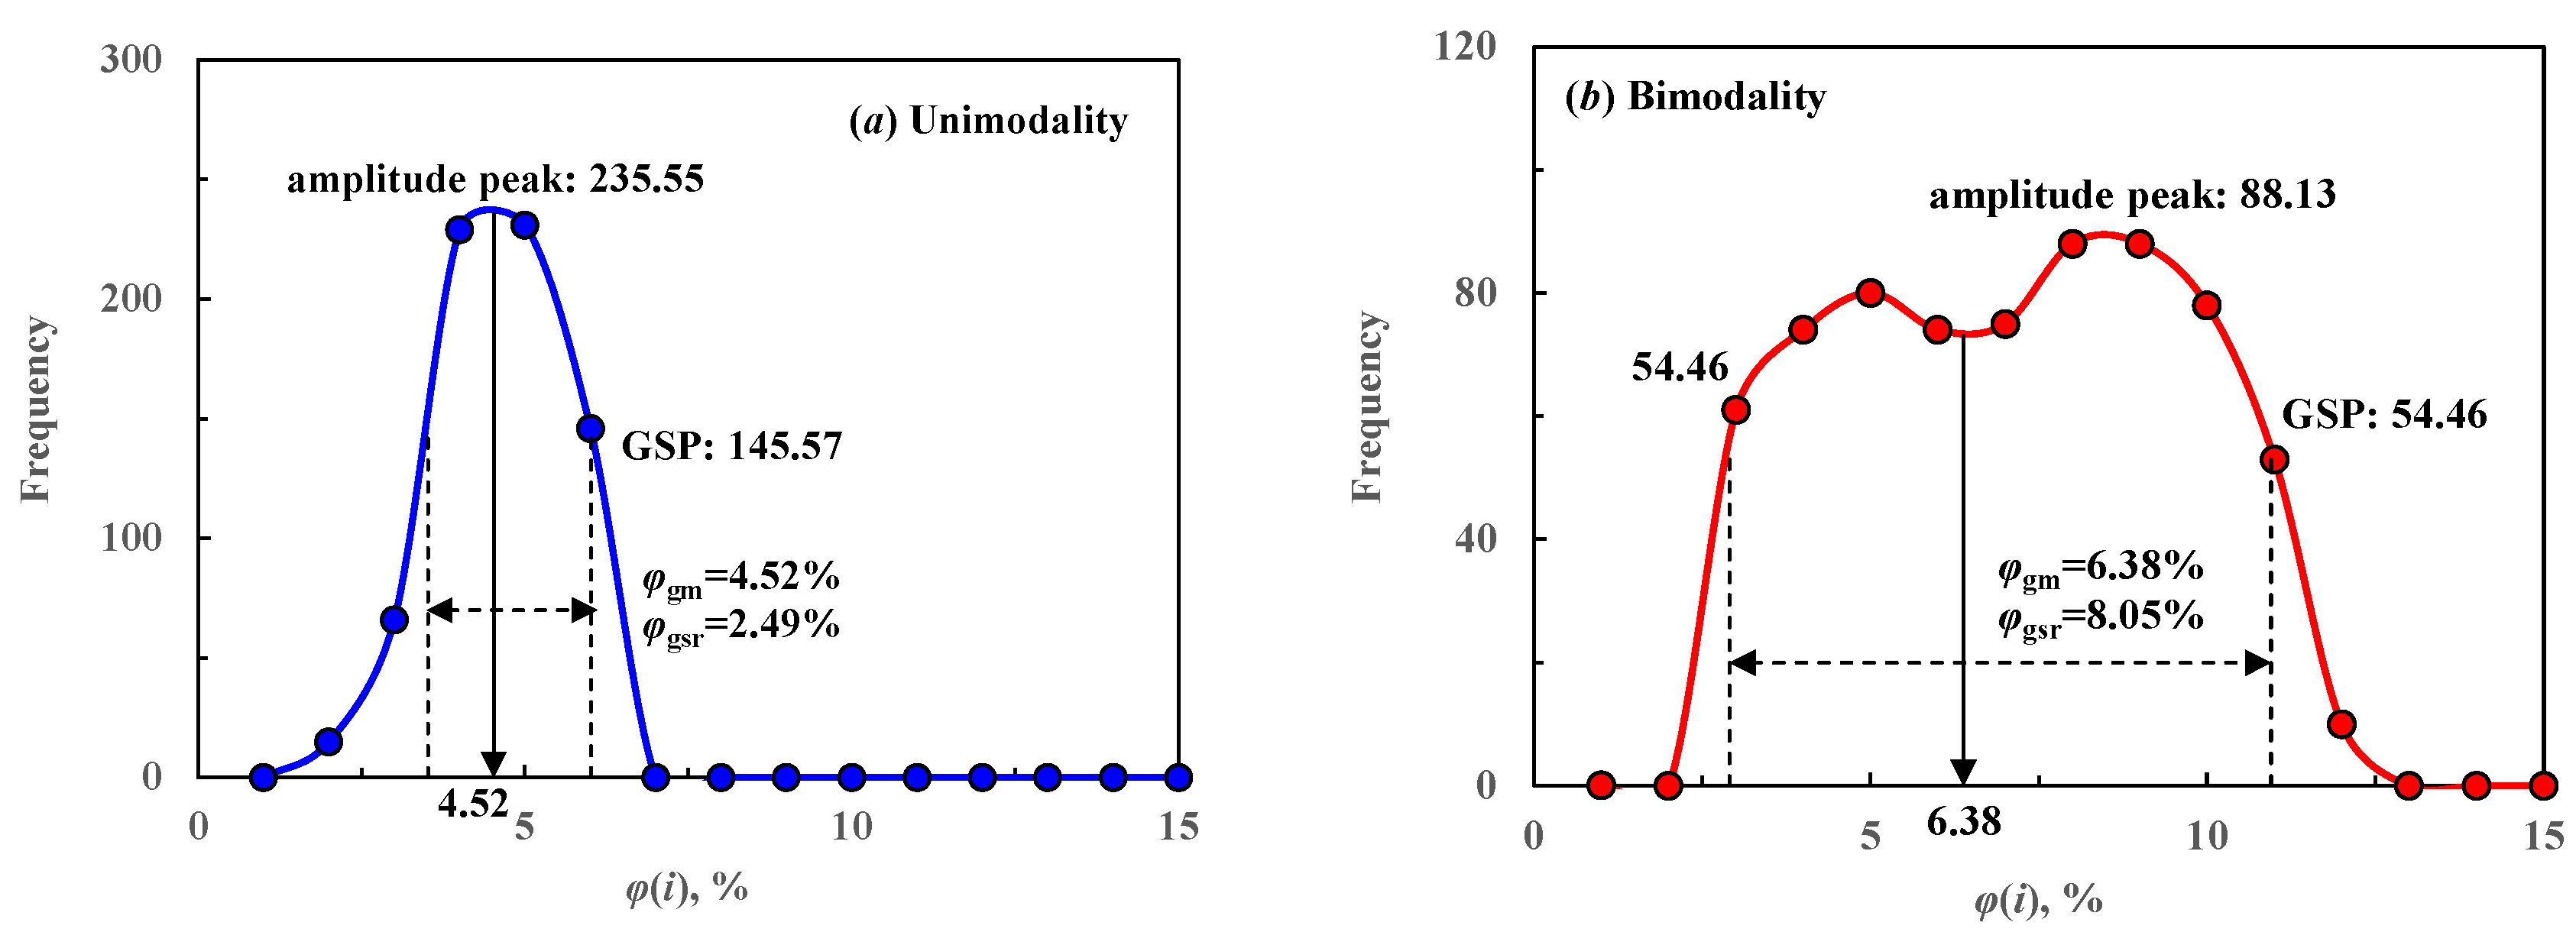
Figure 7.
Cross-plots of φgm with permeability (a) and φgsr versus permeability (b) in our target Archaeozoic Formation in BZ 19-6 Region of southwestern Bohai Bay Basin.
Figure 7.
Cross-plots of φgm with permeability (a) and φgsr versus permeability (b) in our target Archaeozoic Formation in BZ 19-6 Region of southwestern Bohai Bay Basin.
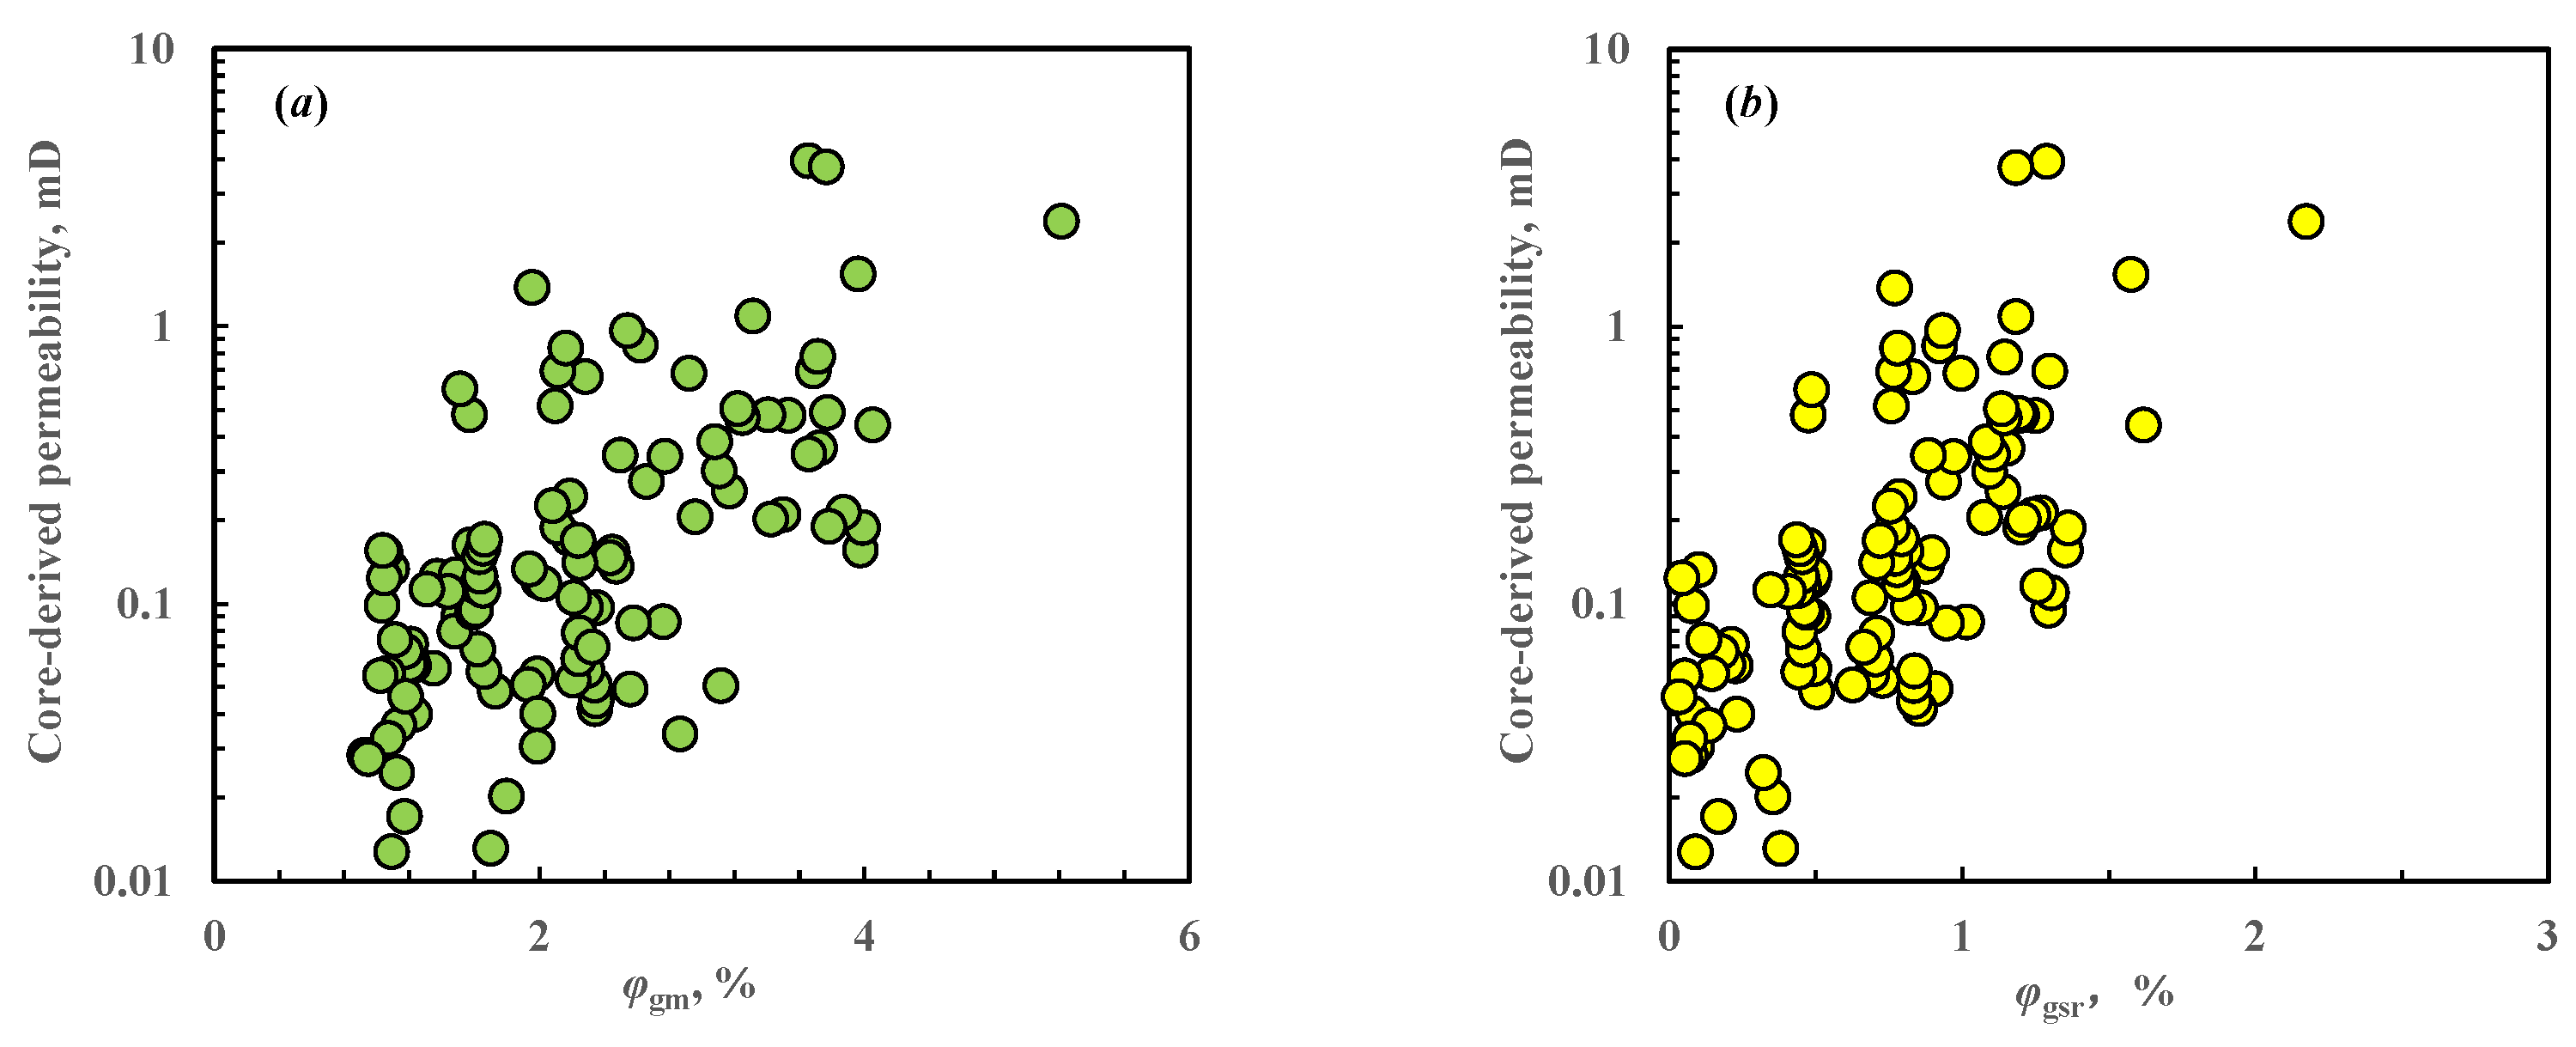
Figure 8.
Cross-plot of φgsr versus permeability for different types of reservoirs. It clearly indicated that good relationships existed after formations were classified based on the pore space type.
Figure 8.
Cross-plot of φgsr versus permeability for different types of reservoirs. It clearly indicated that good relationships existed after formations were classified based on the pore space type.
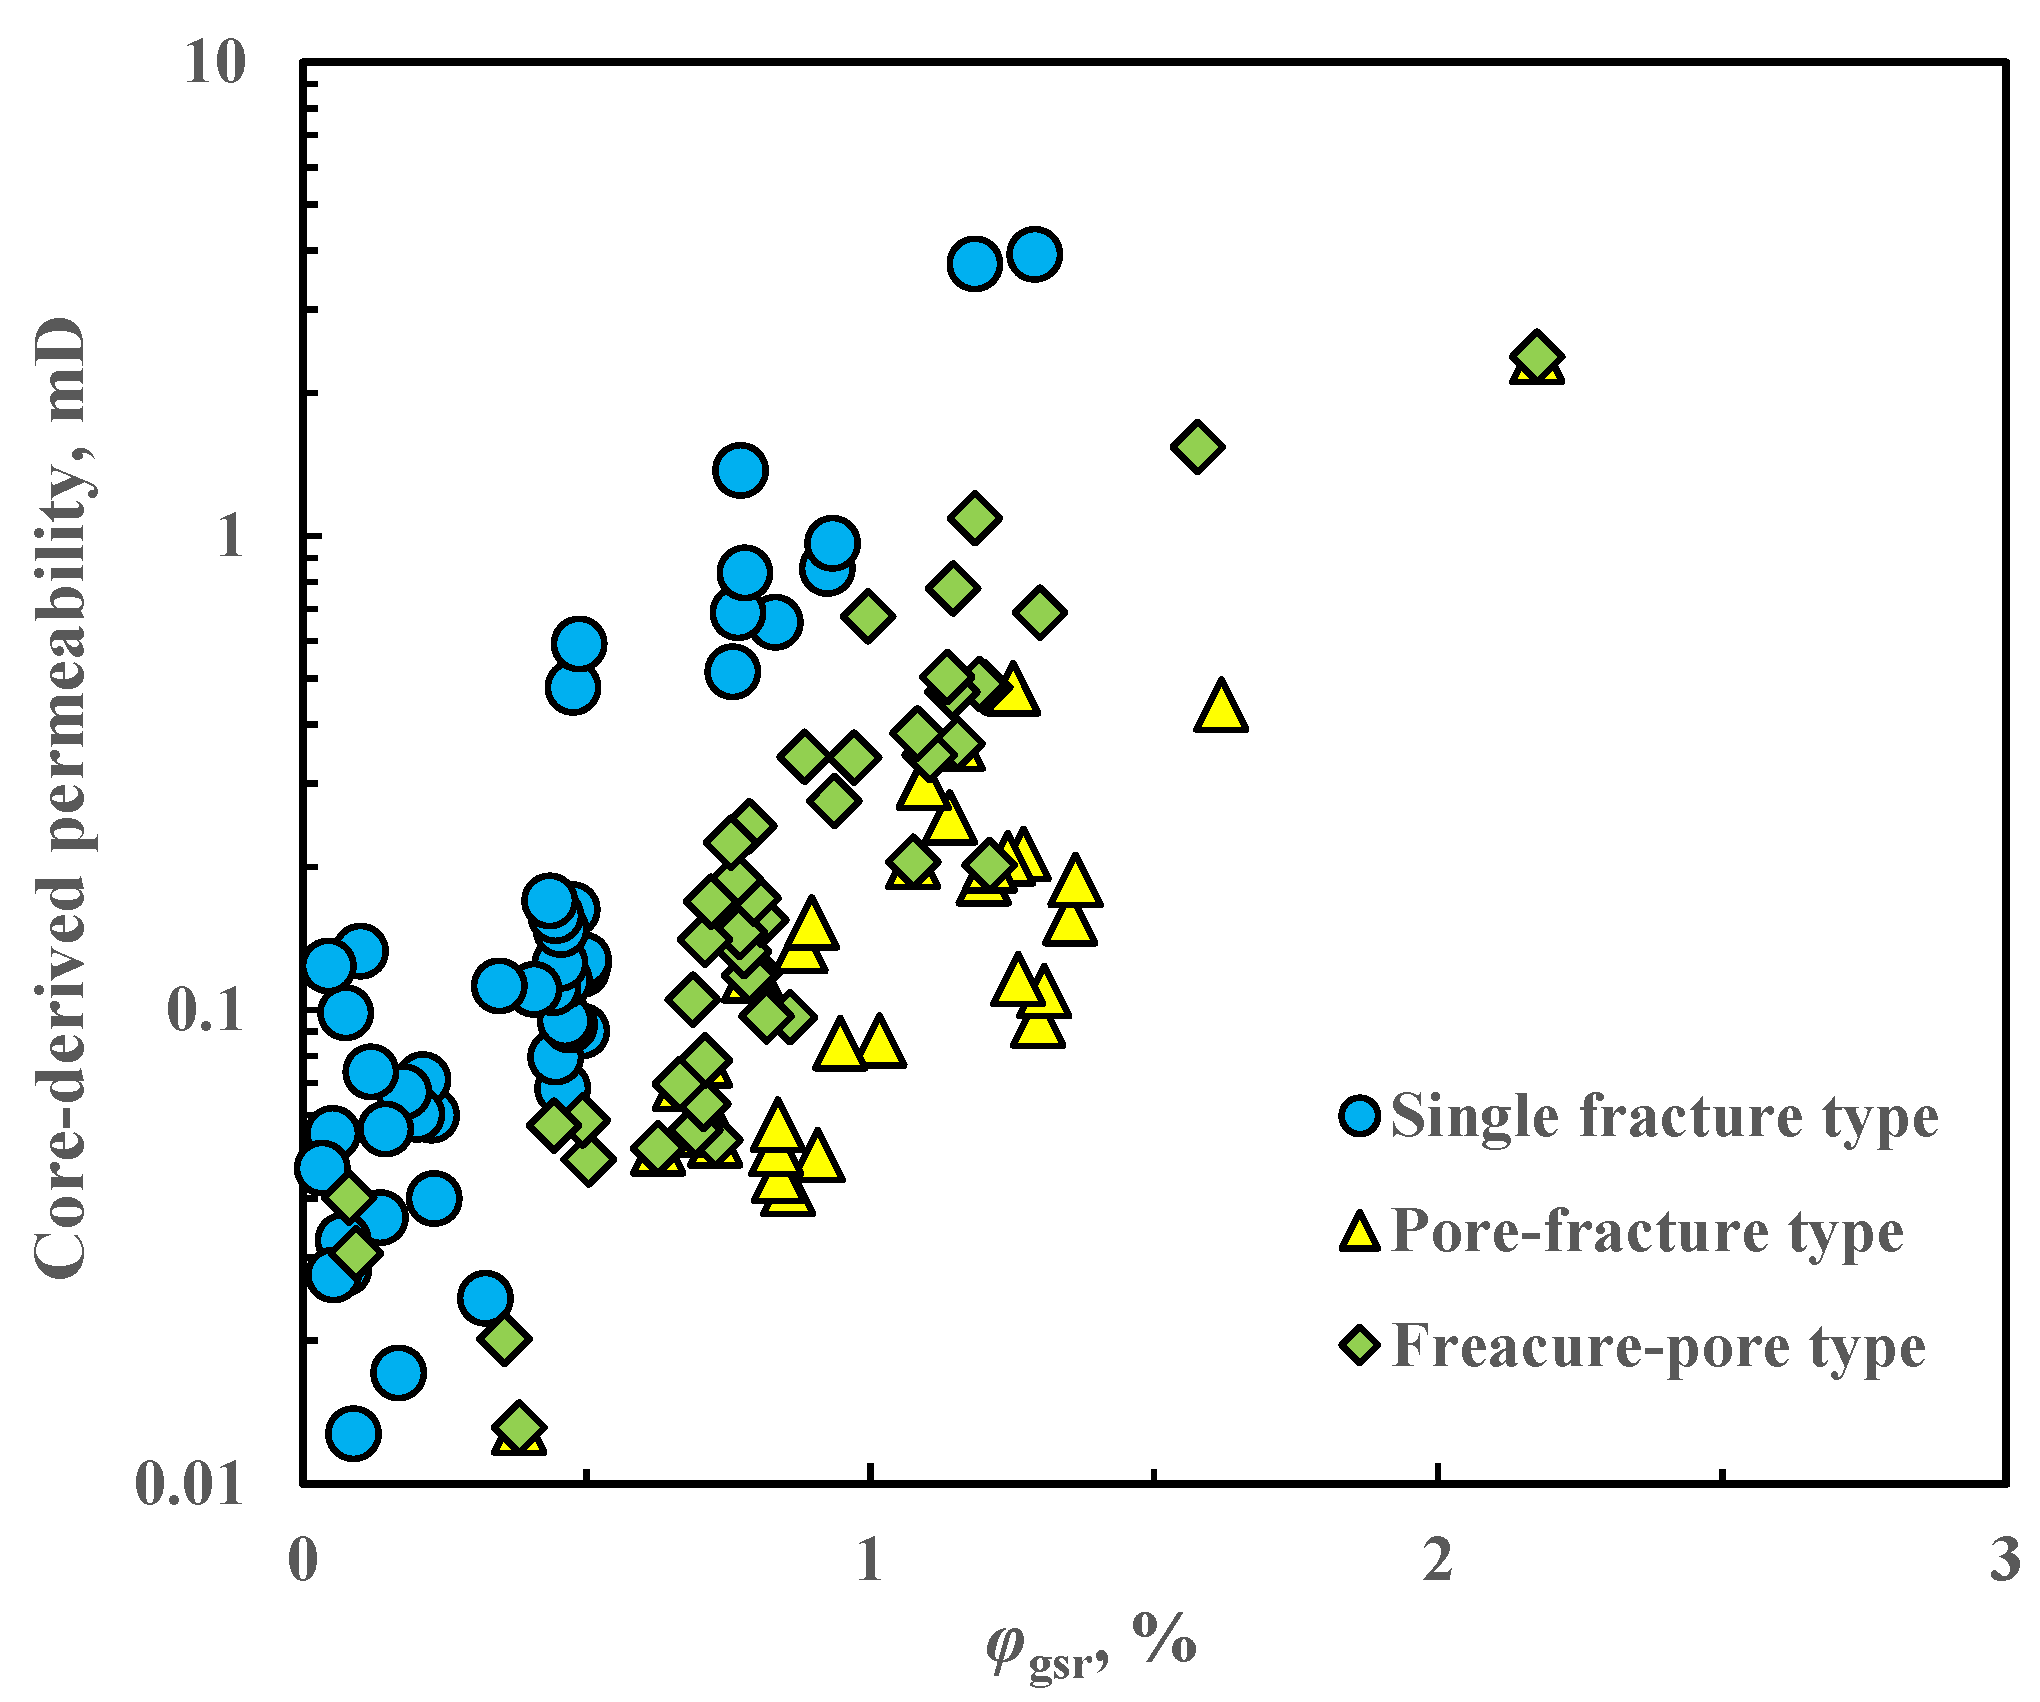
Figure 9.
Indicator of formation pore types based on the cross-plot of φgm and φgsr in the Archaeozoic Formation in BZ 19-6 Region.
Figure 9.
Indicator of formation pore types based on the cross-plot of φgm and φgsr in the Archaeozoic Formation in BZ 19-6 Region.
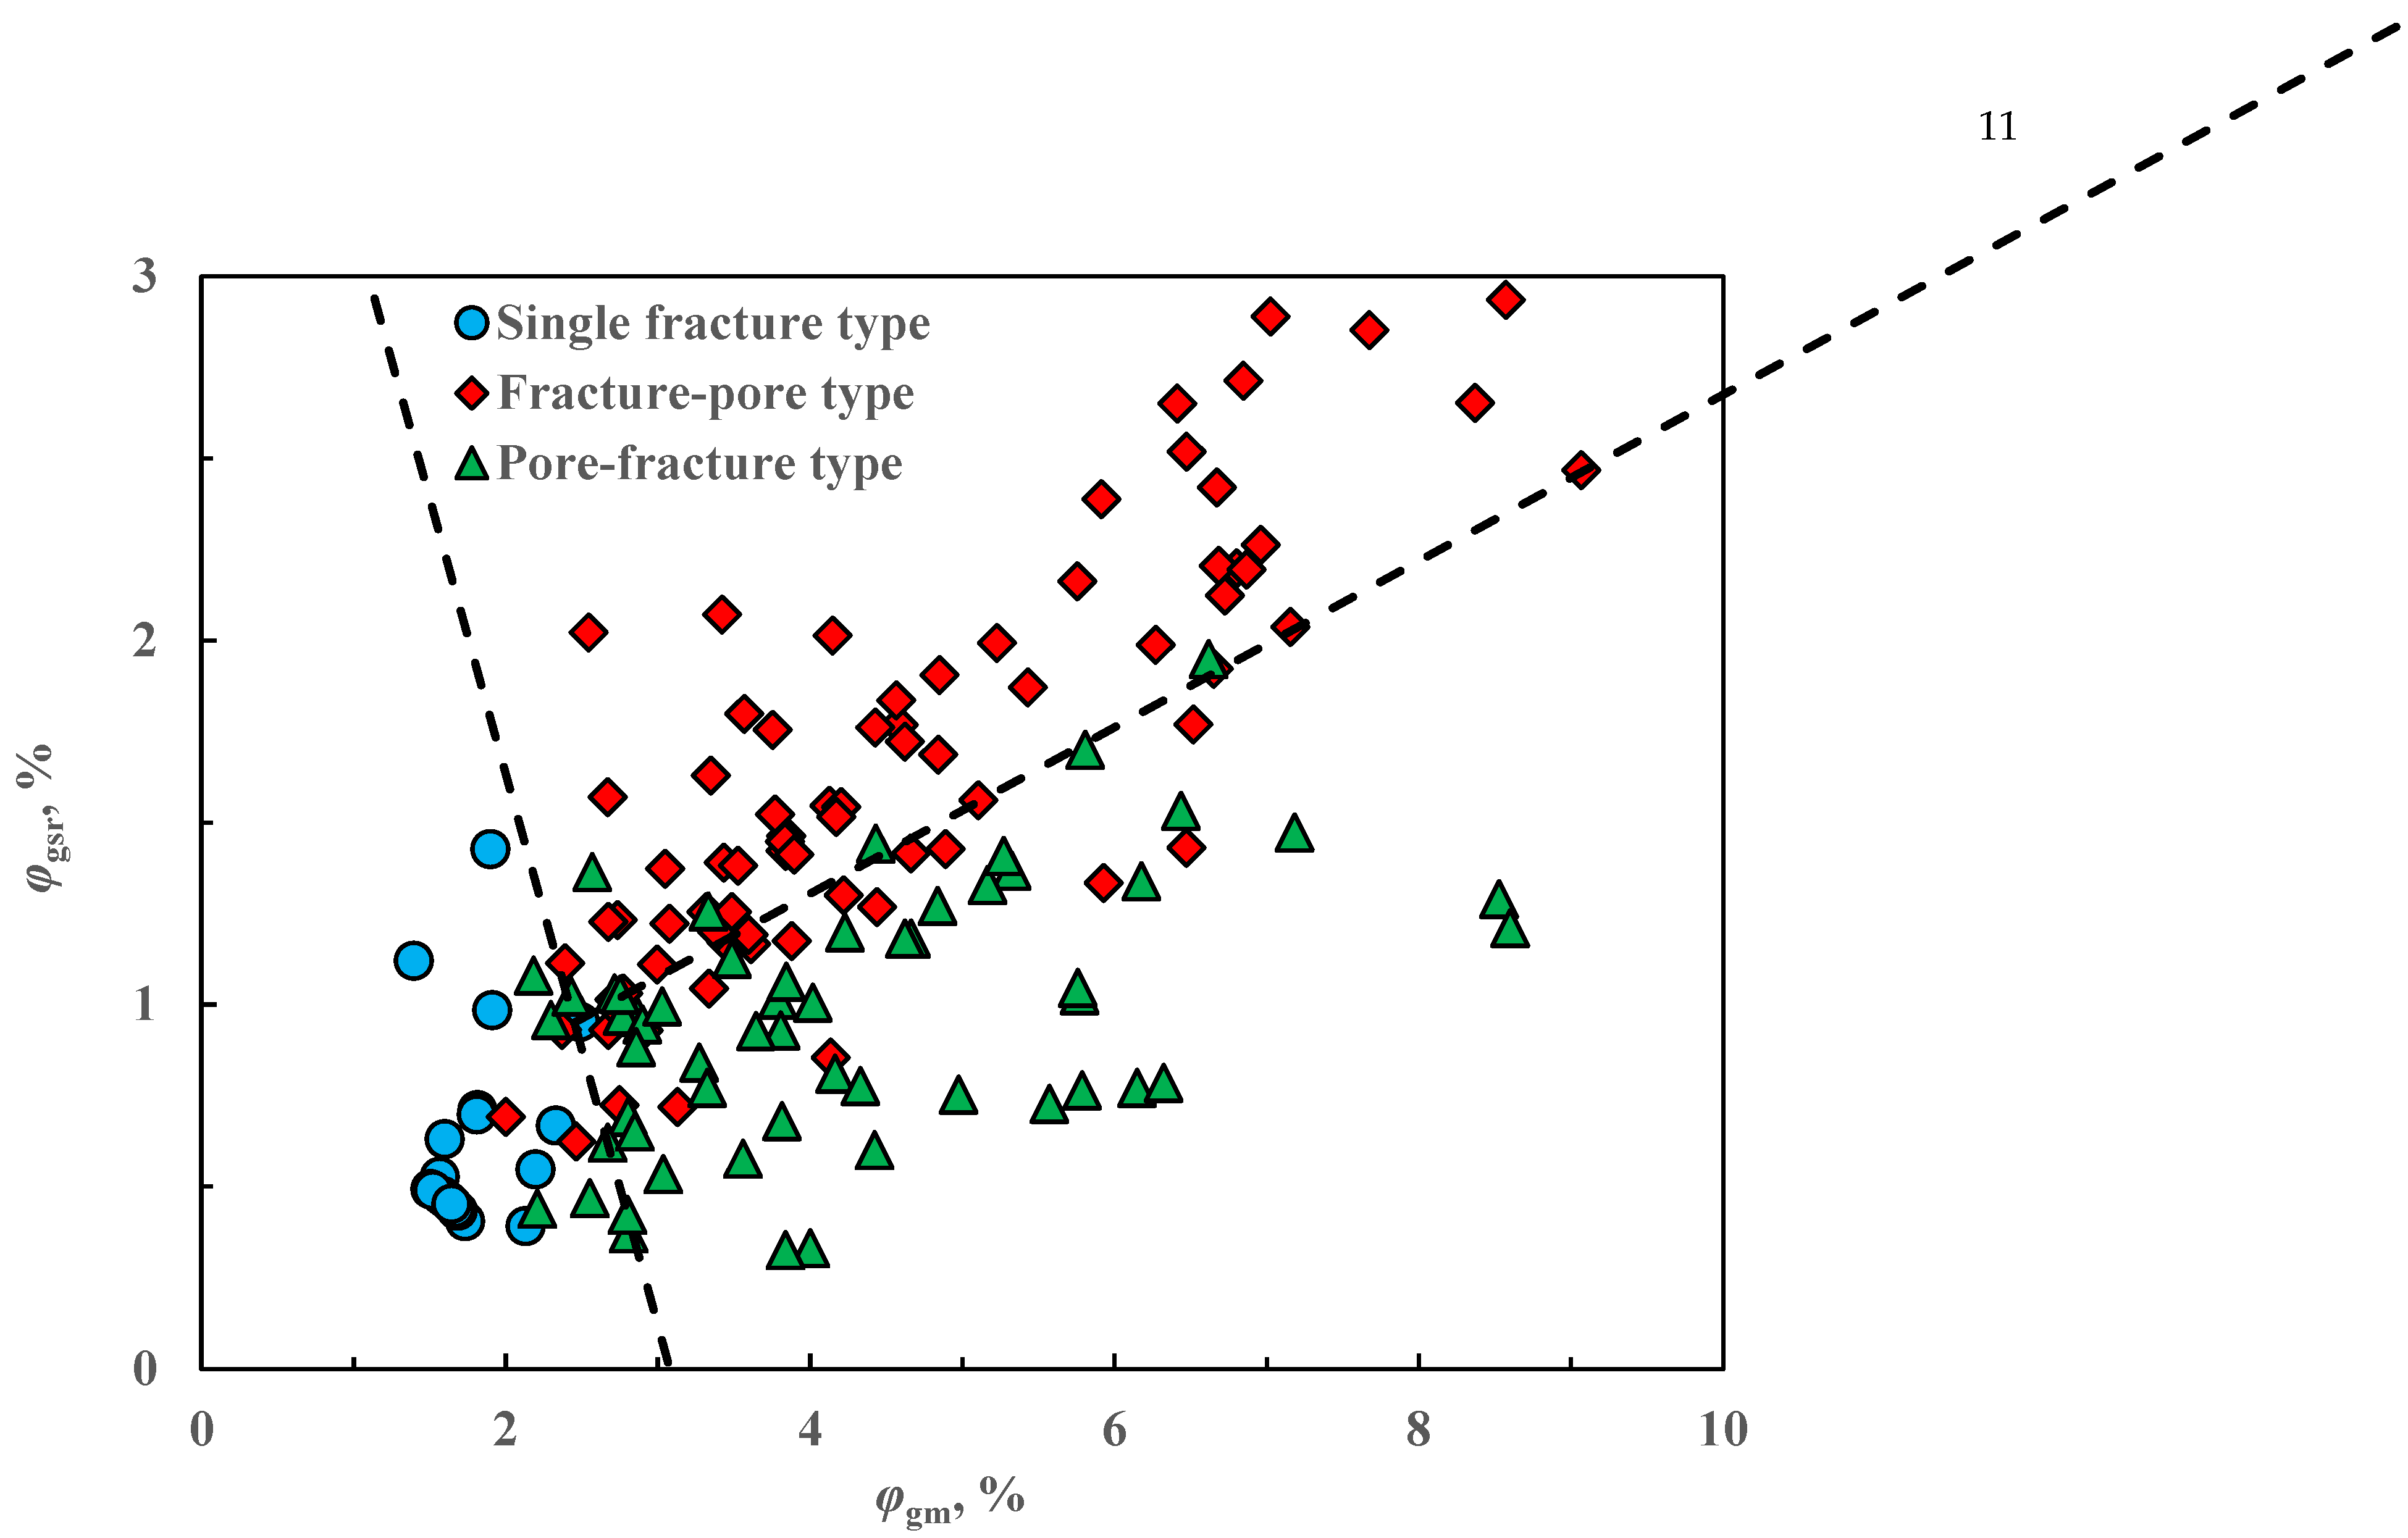
Figure 10.
A field example of predicting permeability from porosity frequency spectrum based on our raised model in the Archaeozoic Formation of BZ 19-6 Region. High consistency between predicted permeability and core-derived results verified the reliability, and the extreme volatility of the predicted permeability curve indicated its high resolution in identifying thin beds.
Disclaimer/Publisher’s Note: The statements, opinions and data contained in all publications are solely those of the individual author(s) and contributor(s) and not of MDPI and/or the editor(s). MDPI and/or the editor(s) disclaim responsibility for any injury to people or property resulting from any ideas, methods, instructions or products referred to in the content. |
© 2026 by the authors. Licensee MDPI, Basel, Switzerland. This article is an open access article distributed under the terms and conditions of the Creative Commons Attribution (CC BY) license (http://creativecommons.org/licenses/by/4.0/).
Copyright: This open access article is published under a Creative Commons CC BY 4.0 license, which permit the free download, distribution, and reuse, provided that the author and preprint are cited in any reuse.


