
Submitted:
10 February 2026
Posted:
11 February 2026
You are already at the latest version
Abstract
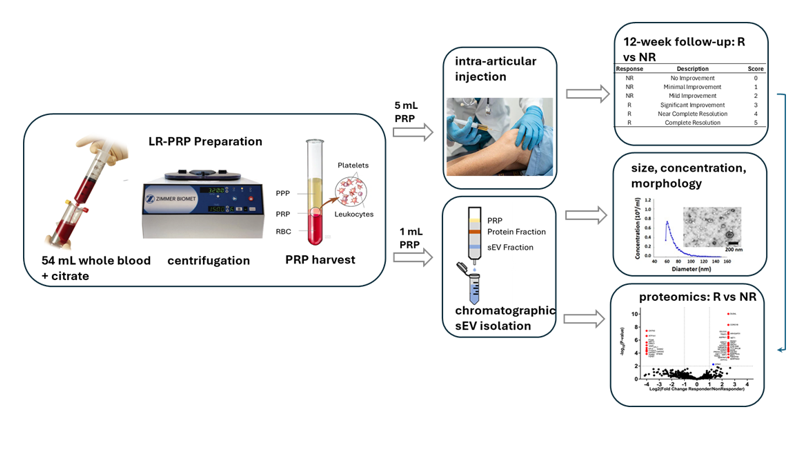
Intra-articular injection of autologous Platelet Rich-Platelet Plasma (PRP) is commonly employed as a non-surgical option for treating early-stage knee osteoarthritis (OA). Placebo-controlled clinical trials show sustained improvements in knee pain and function in most, but not all patients. Although several hypotheses have been put forward, the reasons for inconsistent responses remain unclear. Exosomes, a class of lipid membrane-bound extracellular otherwise known as small extracellular vesicles (sEVs), are a prominent component of PRP. sEVs are thought to mediate many of PRP’s therapeutic effects by carrying complex molecular cargos that regulate gene expression when taken up by cells in osteoarthritic joints. We hypothesized that patient-to-patient variations in sEV protein content correlate with patient responses to PRP. To test this, we compared the proteomes of PRP-derived sEVs from 3 patients who reported significant improvement in symptoms from baseline to 12 weeks post-injection (responders) versus 3 who did not (non-responders). 48 proteins identified by mass spectrometry were significantly different between Responders and Non-Responders. Taken together, these findings indicate that a patient’s responsiveness to PRP treatment could be associated with EV protein cargo composition.
Keywords:
osteoarthritis
; platelet-rich plasma
; extracellular vesicles
; proteomics
1. Introduction
Intra-articular platelet-rich plasma (PRP) injection is an increasingly popular option for the non-surgical symptomatic treatment of mild to moderate knee osteoarthritis (OA) due to mounting evidence of its superiority and safety over alternative therapies such as corticosteroid and hyaluronic acid injection [1,2,3]. The number of knee OA patients treated annually in the United States from 2010 to 2018 ranged from 2,489 to 5,859 per 100,000 cases of knee OA with an average increase of 12% each year [4].
While most patients experience significant pain reduction and improved joint function for months or years after PRP treatment, for unknown reasons a substantial minority (20-30%) fail to respond to the therapy [5,6,7]. One possible explanation is that efficacy is related to variations in platelet dose with higher doses leading to better outcomes and it has been suggested that a dose of 10 billion platelets is the therapeutic floor [8,9]. Interestingly, the dose effect on functional improvement was stronger than on symptomatic improvement, suggesting differences in mechanisms of action and underscoring the need for multifaceted definitions of response in evaluating PRP’s efficacy [10]. There are also reports that leukocyte doses in PRP may affect responses. Leukocyte-rich PRP (LR-PRP) was found to contain significantly more anti-inflammatory proteins (e.g. interleukin-1 receptor antagonist) than leukocyte-poor PRP (LP-PRP) but may also contain higher levels of chondro-destructive matrix metalloproteases (MMPs) [11]. Meta-analysis of clinical trial data is equivocal as to whether either preparation is superior with respect to overall patient responses to PRP [12]. Together these findings suggest that while the effects of platelet and leukocyte doses remain controversial, they should be tracked as sources of variation in PRP responses.
PRP also contains high concentrations of exosomes, a type of small extracellular vesicle (sEV), that typically range in size from 30-150 nm. sEVs carry complex molecular cargos that profoundly influence gene expression when internalized by recipient cells [13,14,15]. Our previous work revealed that sEVs differ in concentration and size in PRP isolates from different patients and that larger average sEV size correlated with treatment efficacy [16]. These findings support the hypothesis that the therapeutic effects of PRP in OA are mediated, at least in part, by sEVs. Moreover, because the composition of exosome cargos is likely to vary with exosome size [17], the apparent dependence of PRP responses on size implies that beneficial cargo components are enriched in large sEVs. As a first step toward testing this overarching hypothesis, we compared protein cargos in samples from patients who responded to LR-PRP therapy versus those who did not. Because exosome cargos typically consist of hundreds of different biologically active proteins, a proteomic approach was warranted [18,19].
In this study, we performed data dependent acquisition (DDA) via liquid chromatography tandem mass spectrometry (LC-MS/MS) on sEVs from three responders and three non-responders to determine if significant differences in protein composition exist between these groups. Our long-term goal is to identify proteins associated with positive responses to PRP therapy that could be incorporated into synthetic sEVs or other delivery vehicles, such as lipid nanoparticles, for therapeutic injections. This potential alternative to PRP will be designed to more specifically target OA symptoms and pathogenesis while obviating problems with the patient-to-patient variability of autologous PRP preparations.
2. Results
2.1. Patient Characteristics and Clinical Assessment of PRP Response
A total of 8 adult knee OA patients (Kellgren-Lawrence grades ≤ 3) were examined for symptom improvement from baseline to 12 weeks after intra-articular injection of autologous PRP. The degree of symptomatic improvement over baseline among the eight patients was graded by the treating sports medicine physician on an ad hoc 0–5-point symptom improvement scale (Table 1).
Patients reporting scores of 2 or less were designated as non-responders, whereas those reporting scores of 3 or more were classified as responders (Table 2). All PRP preparations were leukocyte-rich (i.e., LR-PRP) and no platelet-activating agents were used. One patient received 2 injections 1 week apart (Samples 1 and 4).
sEVs were isolated using size exclusion chromatography (SEC) and ultrafiltration, a method that removes non-exosomal proteins and other contaminants present in PRP [20,21,22]. Fractions 7-9 were selected for further analysis as they contained a minimal amount of non-exosomal proteins (Figure 1A). These fractions were pooled, and particle size and concentration were measured using microfluidic resistive pulse sensing (MRPS) (Figure 1B). As expected for sEVs, particle sizes varied from 50-110 nm with an average of 71.8 ± 2.48 nm. Transmission electron microscopy (TEM) revealed concave disk morphology typical of sEVs (Figure 1C). Immunoblotting confirmed the presence of exosome-specific markers (ALIX, ANAXA5, FLOT1, TSG101, CD81), while the intracellular golgi-associated protein GM130 was barely detectable (Figure 1D). Post-harvest thrombin activation had minimal effects on exosome concentrations (Figure 1E).
Mean sEV size and concentration, and platelet concentrations are shown in Table 3. sEV concentrations were highly variable, ranging from 1 to 30 x 1011/mL. The two highest concentrations (30 x 1011 and 22 x 1011/mL) were from samples collected from the same patient 1 week apart (samples 1 and 4). Platelet concentrations were far less variable, ranging from 2 to 5 x 10⁸/mL. Linear regression analyses showed there were no significant relationships between sEV concentrations and scores (p= 0.25), or sEV sizes and scores (p= 0.35). In addition, platelet concentrations were not significantly related to either scores or sEV concentrations (p = 0.184 and 0.130 respectively). Three responders (samples 1, 3, and 7) and three non-responders (samples 2, 5, and 8) were selected for comparative proteomic analysis.
2.2. Proteomic Analysis
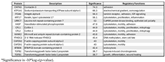
Between the two groups of Responders and Non-Responders, 612 proteins were identified. Of the 435 proteins present in both groups, only erythrocyte membrane protein band 4.1 (EPB41) was found at a significantly higher amount in Non-Responders (Figure 2). Among the 177 proteins detected exclusively in one group, 48 met significance at 1% FDR. Of those, 33 were unique to Responders (Table 4) and 15 were unique to Non-Responders (Table 5).
3. Discussion
This limited cohort study of patients treated with LR-PRP for mild to moderate knee OA revealed significant differences between the proteomes of LR-PRP-derived sEVs from Responders and Non-Responders. Although nucleic acids and lipids carried by sEVs undoubtably contribute to their effects, our findings support the hypothesis that variations in sEV protein content may also be an underlying factor in therapeutic efficacy.
Linear regression analysis indicated that average sEV size did not correlate with clinical scores. Sizes ranged from ~50-110 nm with an average of 71.8 ± 3.4, smaller than the average of 80.6 ± 2.83 nm we reported in a previous study of PRP sEVs isolated by the precipitation method [16]. Immunoblot analysis confirmed the presence of sEV-specific markers and low abundance of an intracellular protein marker [23], while transmission electron microscopy (TEM) imaging confirmed the expected cup-shaped morphology. EVs that appear smaller than 50 nm were visible by TEM but were not counted by MRPS due to inherent limitations of the nCS1 system used for nanotracking.
The three most common methods for isolating sEVs from plasma are ultracentrifugation, polymer precipitation, and SEC. Ultracentrifugation was ruled out as an appropriate method because TEM imaging revealed extensive exosome damage, an issue that has been previously reported [24]. While yields for the precipitation method are typically higher than for the SEC method, co-precipitation of non-sEV proteins can be a confounding factor in the proteomic analysis of sEV cargos [21,22,25]. Moreover, polymers used to promote precipitation such as polyethylene glycol interfere with proteome analysis [26]. The use of SEC avoids both of these problems and thus was the method of choice for the present study.
The addition of thrombin or other platelet-activating agonists to PRP has been reported to improve patient responses, possibly through the release of α-granules and by altering exosome content [14,21]. However, given that fluid shear stresses incidental to blood harvest and PRP isolation can also activate platelets, it is unclear if agonists are needed. In this study, no agonists were added to PRP isolates in the clinic before injection, and thrombin addition in the laboratory prior to sEV isolation had minimal effects on yield, a finding consistent with the hypothesis that platelets were pre-activated. However, it remains to be seen how agonists affect exosome cargos, as we did not compare the proteomes of sEVs isolated from thrombin-treated and -untreated PRP. We plan to address this important question in future research.
Proteomic analysis of Responder and Non-Responder sEVs revealed that the majority of proteins detected were shared between groups (435 proteins). An additional 177 proteins were identified exclusively in one group or the other, with 48 of those resulting in high-confidence proteins significant at p <0.01. In Non-Responders, the majority of those proteins are associated with regulation of cytoskeletal structure and motility (e.g., cofilin-1 [CFL1], cofilin-2 [CFL2], f-actin capping protein subunit alpha -2 [CAPZA-2]), cell adhesion (e.g., integrin alpha-6 [ITGA6], contactin-3 [CNTN3]). In addition, TGFβ-1 and β-2 propeptides were enriched; while these proteins support tissue regeneration, excessive exposure can also contribute to arthrofibrosis [27]. In Responders, the functional categories of significant proteins were more diverse, including several transcription factors involved in B-lymphocyte activation and apoptosis (e.g., early B-cell factors 1, 3, and 4 [EBF1, EBF3, EBF4]), inflammation (e.g., neuroepithelial cell-transforming gene 1 protein and TNF receptor-associated factor [3NET1, TRAF3]), ECM remodeling (e.g. collagen alpha-1(V) chain and serine proteinase inhibitor A3 [COL5A1, SERPINA3] and antioxidant defense (peroxiredoxin-2, [PRDX2]). Enrichment for SERPINA3 and PRDX2 was particularly noteworthy, as they have been associated with enhanced cartilage ECM formation and stability [28,29,30].
The proteomic content of plasma-derived EVs has been explored previously on healthy patients [20,31,32]. These studies indicate that factors such as patient demographics, PRP processing methods, EV purification steps, and mass spectrometer instrumentation all impact the composition of EV proteins identified. Common to each of these studies was the identification of approximately 600-700 proteins in their samples, representing numerous biological pathways. For example, Miroshnychenko et al. found approximately 600 proteins representing over 100 pathways in PRP from two healthy donors [32], while Jiang et al. found 739 proteins in PRP from young (average age 26) and old (average age 66) healthy donors [31]. Of these, 13 and 7 proteins were only found in the young and old donors, respectively. Among old donors proteins associated with cell apoptosis, angiogenesis, and complement and coagulation cascades were enriched, while IGF1, a protein associated with enhanced cell proliferation, was more abundant in young donors. In another study, LR-PRP from three healthy 30-year-old donors contained 36 proteins associated with wound healing and 4 proteins associated with collagen production, respectively. Within our dataset of 613 proteins, 13 of the 36 wound healing proteins and 3 of the 4 collagen related proteins were identified. Several additional proteins described in these previous reports (e.g., APOE) were detected in our dataset but did not meet our significance threshold after applying a 1% FDR and were therefore not retained for downstream label free quantification comparative analyses.
In this study, we employed data-dependent acquisition (DDA) to characterize the protein content of our samples. Because DDA prioritizes fragmentation of the most abundant precursor ions in each MS survey scan, it can introduce stochastic sampling across runs and incomplete quantitative coverage. Consequently, low-abundance peptides may not be detected or quantified consistently across all samples. For these reasons, the results presented here should be viewed as exploratory and hypothesis-generating. Future studies incorporating newer instrumentation and alternative acquisition strategies, such as data-independent acquisition (DIA) will enable a more comprehensive and quantitative assessment of the proteomic profiles of sEVs contained in PRP.
It should be noted that, in addition to proteins, exosome cargoes include numerous bioactive nucleic acids that undoubtably affect PRP responses. Among these, micro-ribonucleic acids (miRNAs) have emerged as promising therapeutic targets [13,33]. Future studies should include transcriptomic analysis of exosome cargos to characterize relationships between responses and miRNA profiles. One difficulty in probing the nucleic acid content of sEVs is that collected sample volumes generally do not contain enough material for next generation sequencing, which may require larger patient enrollments and pooling of patient samples.
To our knowledge, our study is the only published work correlating the proteomic content of PRP-derived sEVs with patient response. To facilitate grouping patient samples into clinically meaningful outcomes, we devised a 0–5-point scoring system for treatment responses that closely followed the 1-4-point Global Rating of Change (GROC) scale, a validated, widely used instrument for evaluating overall treatment effectiveness in OA [10,34]. Increased cohort size would allow for more refined comparisons between patients with different scores (e.g. 5 versus 4). We did not utilize the full panel of outcome measures recommended by the Orthopedic Research Society International for assessing treatment effects in knee OA [10]. The recommended panel includes GROC, measures of knee pain, activity levels, and performance in knee function tests, as well as overall well-being. These multiple alternative definitions of response can illuminate mechanisms of action and should be included in future studies.
Conclusion: Our current findings suggest that several peptides previously shown to be chondroprotective and/or anti-inflammatory in OA models were enriched in responder sEVs, while those associated with OA pathogenesis were enriched in non-responder sEVs. We believe these relationships are worth pursuing further in a larger patient cohort with more comprehensive definitions of treatment responses. Taken together, these findings suggest that differences in sEV protein cargos could influence PRP efficacy, justifying a larger confirmatory study.
4. Materials and Methods
4.1. PRP Preparation and Injection
Internal review board (University of Iowa IRB #202006118) approval for this project was obtained, and all participants provided informed consent using IRB-approved consent forms. PRP was prepared using 54 mL whole blood. The whole blood was mixed with 6 mL Citrate Dextrose Solution A (Citra Labs, Braintree, MA) and was then processed using the GPS III system (Zimmer Biomet, Warsaw, IN), yielding leukocyte-rich PRP (LR-PRP). No platelet-activating agents were added. Within 20 minutes of processing, 5 mL of PRP was injected under ultrasound guidance using a standard in-plane, superior lateral approach into the suprapatellar recess of the knee joint. Excess LR-PRP was delivered to the lab within hours of collection and sEV isolation was performed upon delivery.
4.2. Post-Injection Protocol
Participants were instructed to rest the knee for 2-3 days following injection. Normal day-to-day activities were allowed as tolerated but avoidance of vigorous exercise for 4-6 weeks following treatment was recommended. Patients were advised to avoid NSAIDs following the injection for at least 2 weeks and up to 6 weeks if tolerable.
4.3. sEVs Characterization
4.3.1. Isolation
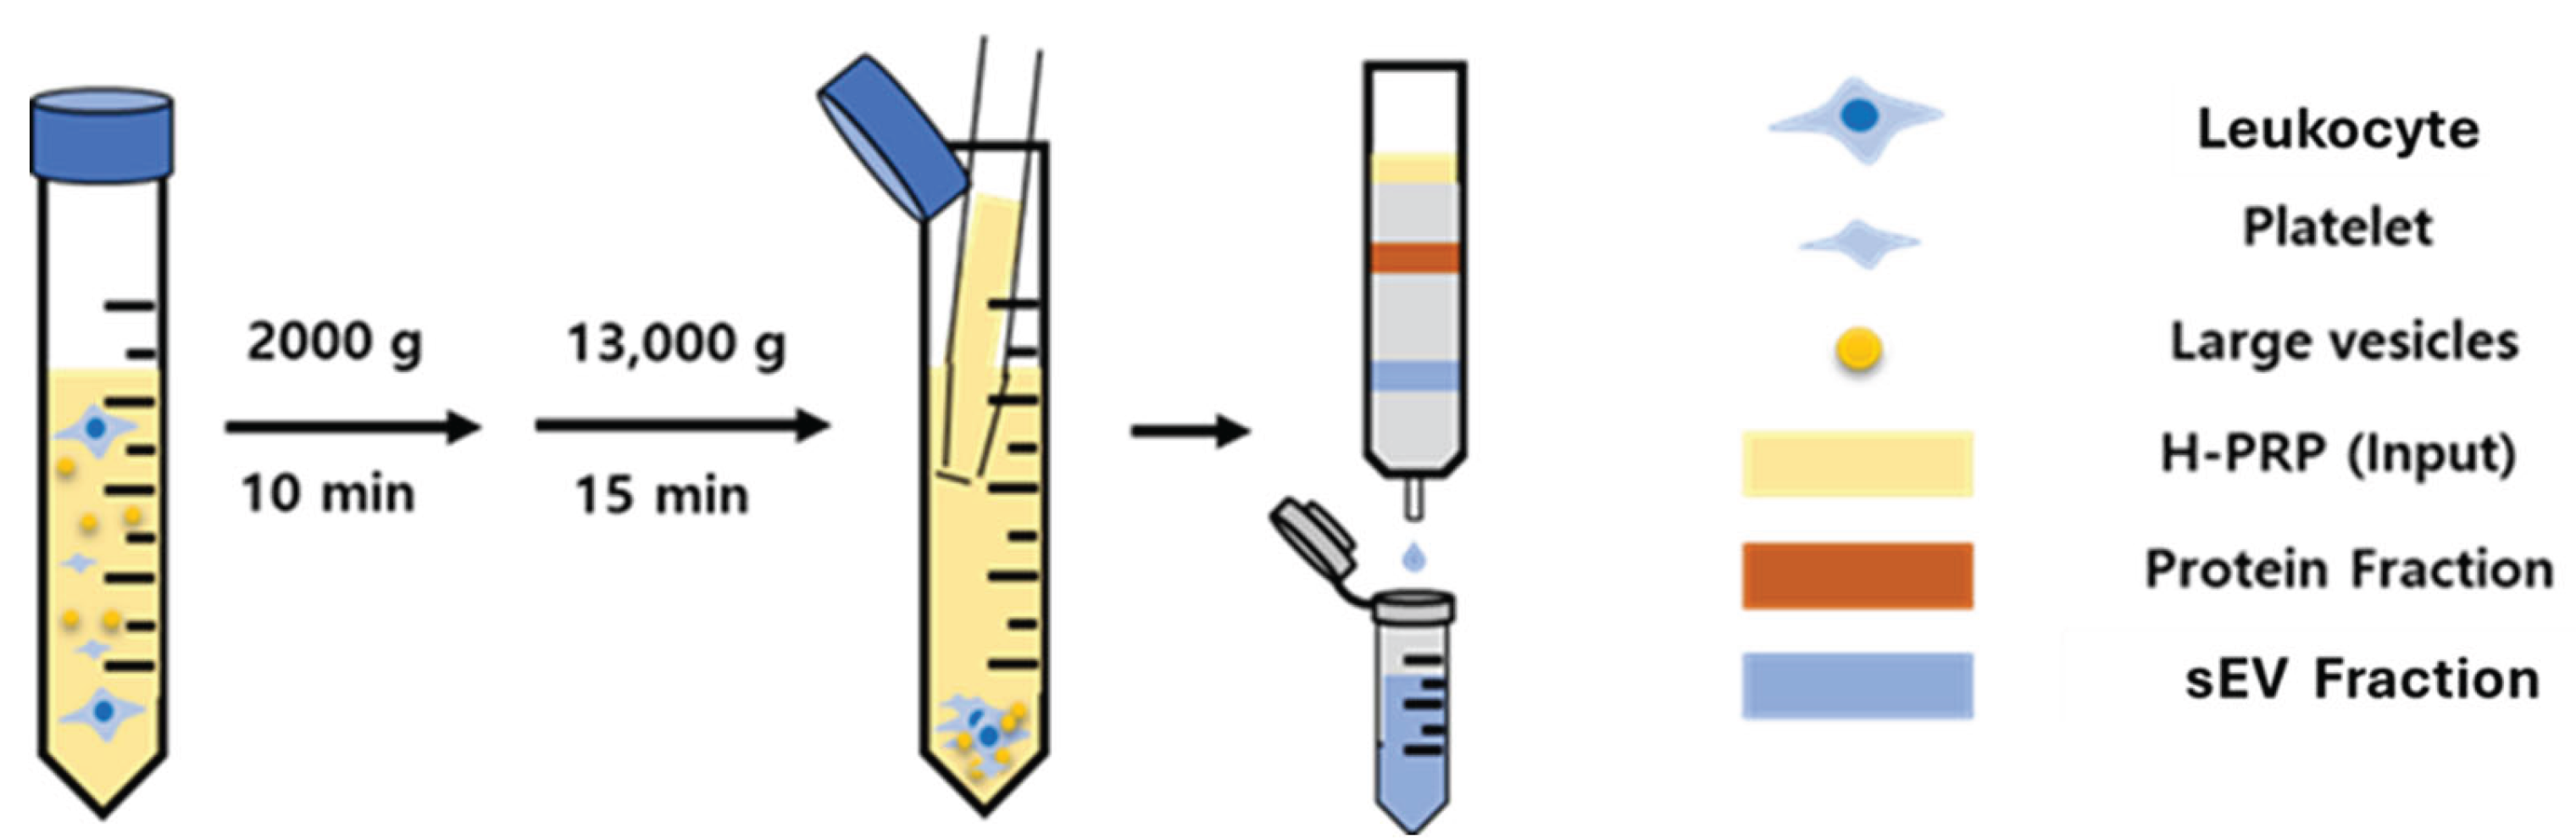
Platelet rich plasma-derived sEVs (PRP-sEVs) were isolated and purified using size exclusion chromatography (SEC). PRP was centrifuged at 2,000 g for 10 minutes and 13,000 g for 15 minutes to remove any cells, debris, and large vesicles. The supernatant was passed through an IZON qEV SEC column (IZON Science, Medford MA) and each fraction after the void volume was collected using an IZON Automatic Fraction Collector V1.
Figure 3.
Schematic of the human PRP-sEVs (H-PRP) isolation and purification using the size-exclusion chromatography method.
Figure 3.
Schematic of the human PRP-sEVs (H-PRP) isolation and purification using the size-exclusion chromatography method.
4.3.2. The Bicinchoninic Acid (BCA) Assay
The amount of protein in each fraction was measured with a Pierce™ BCA protein assay kit (ThermoFisher Scientific, Waltham, MA). Each fraction was mixed with BCA reagents and incubated at 37 °C for 30 min. Absorbance at 562 nm was measured on a plate reader with PBS as blank.
4.3.3. Nanotracking Analysis
The size and the concentration of sEVs and sEVs treated with 1 unit/mL thrombin was measured by microfluidic resistive pulse sensing (MRPS). PRP-sEVs were mixed with Nanobead NIST traceable standard beads (Polysciences, Warrington, PA) and loaded into the TS-300 cartridges (mold ID: E13), which correspond to voltage values of -2/+2 V, of a Spectradyne nCS1 particle analyzer (Spectradyne, Signal Hill, CA). The nCS1 system was primed with 0.22 µm filtered 1% Tween 20 (v/v) in DPBS. After priming, the cartridge was loaded, and the size and the concentration were measured by the instrument with nCS1 software (Version 2.5.0.275).
4.3.4. Immunoblotting
The surface markers of PRP-sEVs were identified using an Exo-CheckTM antibody array (System Biosciences, Palo Alto, CA). sEVs were incubated with the immunoblotting membrane pre-printed against the sEVs putative markers: ALG-2-interacting protein X (ALIX), tumor susceptibility gene 101 (TSG101), annexin A5 (ANXA5), CD81, flotillin 1 (FLOT1), and the GM130 cis-Golgi protein marker was used to detect cellular (non-exosomal) protein contamination. The HRP signal was developed using Advansta WesternBright Sirius HRP substrate (Advansta Inc., San Jose, CA) and enhanced chemiluminescence image was taken by Bio-Rad ChemiDoc MP Imager (Bio-Rad).
4.3.5. Transmission Electron Microscopy (TEM)
The morphology of PRP-sEVs was investigated by TEM. The PRP-sEVs were applied to the Carbon-Formvar grid (400 Mesh, Electron Microscopy Science, Hatfield, PA) followed by the 1% uranyl-acetate for the negative staining. The images were acquired with a TEM HT7800 microscope (Hitachi High-Tech America, Schaumburg, Illinois).
4.3.6. Statistics
Relationships between outcome scores, sEV size and concentration, and platelet concentration were evaluated by linear regression analysis using GraphPad Prism software (GraphPad Software, Boston, MA).
4.4. Proteome Analysis
4.4.1. Proteomic Sample Preparation
Each sEV sample (350 µL in 1× PBS) was lyophilized overnight. The dried material was lysed in 100 µL of buffer containing 6 M guanidine hydrochloride (GnHCl), 5 mM tris(2-carboxyethyl)phosphine (TCEP), and 10 mM chloroacetamide (CAA) at 98 °C for 10 min. Proteins were precipitated using the methanol–chloroform method to remove excess salts, and the resulting pellet was resuspended in 6 M GnHCl prepared in 50 mM Tris-HCl (pH 8.5). Lys-C was added at an enzyme-to-protein ratio of 1:50, and samples were incubated at 37 °C for 3 h. The GnHCl concentration was then diluted to 1 M with 25 mM Tris-HCl (pH 8.5), followed by addition of trypsin at a 1:25 ratio. Digestion proceeded overnight at 37 °C. Peptides were desalted using C18 StageTips, lyophilized, and reconstituted in 15 µL of loading buffer (3% acetonitrile, 0.1% formic acid).
4.4.2. Mass Spectroscopy
Peptide samples were analyzed in replicate on a Q Exactive Orbitrap mass spectrometer (ThermoFisher Scientific, San Jose, CA) coupled to an EASY-nLC 1200 system (ThermoFisher Scientific). Approximately 6 µL of reconstituted digest (∼0.4 µg) was loaded onto a 2 cm C18 trap column (ThermoFisher Scientific, Cat. No. 164535) via the autosampler. Peptides were desalted on the trap using 16 µL of mobile phase A over 4 min. The trap was then connected to a 50 cm Acclaim PepMap 100 C18 analytical column (Thermo Fisher Scientific, Cat. No. 164570) through a microcross assembly (IDEX, UH-752), and separation was performed at 0.3 µL/min using a 160 minute gradient. Mobile phase A consisted of 0.1% formic acid in water, and mobile phase B consisted of 90% acetonitrile with 0.1% formic acid. The gradient was programmed as follows (%B, minutes): 4% (0-3 minutes), 8% (6), 24% (85), 38% (130), 63% (150), 97% (155–160).
Data were acquired in positive ion mode using data-dependent acquisition. Full MS scans (m/z 375–1800) were collected in the Orbitrap at a resolution of 60,000 (at m/z 200), with an AGC target of 3 × 10⁶ and a maximum injection time of 100 milliseconds ms. MS1 scans were acquired every 3 s throughout the gradient. The top precursors (charge states 2–6) were selected for fragmentation with an isolation window of 1.6 Th, AGC target of 1 × 10⁵, and maximum injection time of 110 ms. Dynamic exclusion was set to 30 s. Fragmentation was performed by higher-energy collisional dissociation (HCD) at 30% collision energy. MS1 scans were recorded in profile mode, and MS2 scans in centroid mode.
4.4.3. Proteomics Searches
Mass spectrometry data were analyzed using PEAKS Studio 13 (Bioinformatics Solutions Inc.). Technical mass spectrometry replicates were combined for analysis. Searches were performed against the UniProtKB human reference proteome (UP000005640; downloaded June 2025; 20,663 entries) supplemented with the cRAP common contaminants database. The Proteome (De Novo Assist) workflow was used with the Associate Feature with Chimera option enabled. Search parameters included a precursor mass tolerance of 10 ppm and a fragment mass tolerance of 0.02 Da. Carbamidomethylation of cysteine was specified as a fixed modification, and oxidation of methionine as a variable modification. Enzyme specificity was set to semi-tryptic with up to two missed cleavages permitted. Protein quantification was performed using the Top 3 approach with modification form exclusion and outlier exclusion enabled. Normalization was based on total ion current (TIC). Within each protein group, only the top ranked protein was retained for quantification and downstream analysis, and all subsidiary protein group members were excluded to avoid redundancy. Additionally, protein groups present in only 1 of the 3 biological replicates per cohort were filtered out. Peptide-spectrum matches (PSMs) of −10Log(P-value) ≥ 20 and protein groups meeting a 1% FDR threshold were considered high confidence identifications. Protein groups passing these criteria were treated as significantly different between cohorts.
Author Contributions
Conceptualization, I.S., R.K., J.M. E.S.; Methodology, I.S., C.P., R.K., M.H., E.S.; Software, C.P., E.S.; Validation, I.S. C.P. E.S.; Formal Analysis, C.P., J.M. E.S.; Investigation, I.S., R.K.; Resources, R.K. D.S.; Data Curation, J.M., E.S.; Visualization, J.M. E.S.; Writing—original draft preparation. J.M., E.S.; Writing—review and editing, D.S., J.M., E.S., R.K., M.H.; Supervision, J.M. E.S.; Project Administration. J.M., E.S.,.
Funding
This research received no external funding.
Institutional Review Board Statement
The study was conducted in accordance with the Declaration of Helsinki and approved by Internal Review Board of the University of Iowa (protocol #202006118, approved 6/16/22). All participants provided informed consent using IRB-approved consent forms. All reported patient data was de-identified.
Data Availability Statement
All data presented in this manuscript and accompanying raw data are stored on secure servers overseen by the University of Iowa Information Technology Services and will be shared upon request.
Acknowledgments
include administrative and technical support was provided by Abigail Smith in the Department of Orthopedics.
Conflicts of Interest
The authors declare no conflicts of interest.
Abbreviations
The following abbreviations are used in this manuscript:
| MDPI | Multidisciplinary Digital Publishing Institute |
| DOAJ | Directory of open access journals |
| OA | Osteoarthritis |
| sEV | Small extracellular vesicle |
| PRP | Platelet Rich Plasma |
| PPP | Platelet Poor Plasma |
| RBC | Red Blood Cells |
| LR-PRP | Leukocyte-Rich PRP |
| GROC | Global Rating of Change |
| BCA | Bicinchoninic Acid |
| R | Responder |
| NR | Non-Responder |
| SEC | Size Exclusion Chromatography |
| miRNA | Micro Ribonucleic Acid |
| LC-MS/MS | Liquid Chromatography-Tandem Mass Spectroscopy |
| DDA | Data Dependent Acquisition |
| DIA | Data Independent Acquisition |
| PSMs | Peptide-spectrum matches |
| FDR | False Detection Rate |
| TIC | Total Ion Current |
| TCEP | tris(2-carboxyethyl)phosphine (TCEP) |
| CAA | chloroacetamide |
| TIC | Total Ion Current |
| GnHCL | Guanidine Hydrochloride |
| TEM | Transmission electron microscopy |
| MRPS | Microfluidic Resistive Pulse Sensing |
References
- McLarnon, M.; Heron, N. Intra-articular platelet-rich plasma injections versus intra-articular corticosteroid injections for symptomatic management of knee osteoarthritis: systematic review and meta-analysis. BMC Musculoskelet Disord 2021, 22(1), 550. [Google Scholar] [CrossRef] [PubMed]
- Migliorini, F.; Driessen, A.; Quack, V.; Sippel, N.; Cooper, B.; Mansy, Y.E.; Tingart, M.; Eschweiler, J. Comparison between intra-articular infiltrations of placebo, steroids, hyaluronic and PRP for knee osteoarthritis: a Bayesian network meta-analysis. Arch Orthop Trauma Surg 2021, 141(9), 1473–1490. [Google Scholar] [CrossRef] [PubMed]
- Szwedowski, D.; Mobasheri, A.; Moniuszko, A.; Zabrzynski, J.; Jeka, S. Intra-Articular Injection of Platelet-Rich Plasma Is More Effective than Hyaluronic Acid or Steroid Injection in the Treatment of Mild to Moderate Knee Osteoarthritis: A Prospective, Randomized, Triple-Parallel Clinical Trial. Biomedicines 2022, 10(5). [Google Scholar] [CrossRef] [PubMed]
- Li, A.K.; Stavrakis, A.I.; Photopoulos, C. Platelet-rich plasma use for hip and knee osteoarthritis in the United States. Knee 2022, 39, 239–246. [Google Scholar] [CrossRef]
- Diaz Haaz, D.I.; Rizo Castro, O. Efficacy and Safety of Intra-articular Platelet-Rich Plasma (PRP) Versus Corticosteroid Injections in the Treatment of Knee Osteoarthritis: A Systematic Review of Randomized Clinical Trials. Cureus 2025, 17(3), p. e80948. [Google Scholar] [CrossRef]
- Kaye, A.D.; Boullion, J.A.; Abdelsalam, M.; Green, M.A.; Nguyen, A.; MacDonald, E.M.; Dastgah, M.; Ballaera, C.; Ahmadzadeh, S.; Mychaskiw, G., Ii; Shekoohi, S.; Robinson, C.L. Efficacy of Intra-Articular Platelet-Rich Plasma Injections in Treatment of Knee Osteoarthritis: A Systematic Review and Meta-Analysis. Curr Pain Headache Rep 2025, 29(1), p. 13. [Google Scholar] [CrossRef]
- Meheux, C.J.; McCulloch, P.C.; Lintner, D.M.; Varner, K.E.; Harris, J.D. Efficacy of Intra-articular Platelet-Rich Plasma Injections in Knee Osteoarthritis: A Systematic Review. Arthroscopy 2016, 32(3), 495–505. [Google Scholar] [CrossRef]
- Berrigan, W.; Tao, F.; Kopcow, J.; Park, A.L.; Allen, I.; Tahir, P.; Reddy, A.; Bailowitz, Z. The Effect of Platelet Dose on Outcomes after Platelet Rich Plasma Injections for Musculoskeletal Conditions: A Systematic Review and Meta-Analysis. Curr Rev Musculoskelet Med 2024, 17(12), 570–588. [Google Scholar] [CrossRef]
- Berrigan, W.A.; Bailowitz, Z.; Park, A.; Reddy, A.; Liu, R.; Lansdown, D. A Greater Platelet Dose May Yield Better Clinical Outcomes for Platelet-Rich Plasma in the Treatment of Knee Osteoarthritis: A Systematic Review. Arthroscopy 2025. 41, 3, 809–817. [Google Scholar] [CrossRef]
- Pham, T.; Van Der Heijde, D.; Lassere, M.; Altman, R.D.; Anderson, J.J.; Bellamy, N.; Hochberg, M.; Simon, L.; Strand, V.; Woodworth, T.; Dougados, M.; Omeract, O. Outcome variables for osteoarthritis clinical trials: The OMERACT-OARSI set of responder criteria. J Rheumatol 2003, 30(7), 1648–54. [Google Scholar]
- Jayaram, P.; Mitchell, P.J.T.; Shybut, T.B.; Moseley, B.J.; Lee, B. Leukocyte-Rich Platelet-Rich Plasma Is Predominantly Anti-inflammatory Compared With Leukocyte-Poor Platelet-Rich Plasma in Patients With Mild-Moderate Knee Osteoarthritis: A Prospective, Descriptive Laboratory Study. Am J Sports Med 2023, 51(8), 2133–2140. [Google Scholar] [CrossRef]
- Xiong, Y.; Gong, C.; Peng, X.; Liu, X.; Su, X.; Tao, X.; Li, Y.; Wen, Y.; Li, W. Efficacy and safety of platelet-rich plasma injections for the treatment of osteoarthritis: a systematic review and meta-analysis of randomized controlled trials. Front Med (Lausanne) 2023, 10, 1204144. [Google Scholar] [CrossRef] [PubMed]
- Liu, X.; Wang, L.; Ma, C.; Wang, G.; Zhang, Y.; Sun, S. Exosomes derived from platelet-rich plasma present a novel potential in alleviating knee osteoarthritis by promoting proliferation and inhibiting apoptosis of chondrocyte via Wnt/beta-catenin signaling pathway. J Orthop Surg Res 2019, 14(1), p. 470. [Google Scholar] [CrossRef] [PubMed]
- Rui, S.; Yuan, Y.; Du, C.; Song, P.; Chen, Y.; Wang, H.; Fan, Y.; Armstrong, D.G.; Deng, W.; Li, L. Comparison and Investigation of Exosomes Derived from Platelet-Rich Plasma Activated by Different Agonists. Cell Transplant 2021, 30, p. 9636897211017833. [Google Scholar] [CrossRef] [PubMed]
- Zhang, Y.; Wang, X.; Chen, J.; Qian, D.; Gao, P.; Qin, T.; Jiang, T.; Yi, J.; Xu, T.; Huang, Y.; Wang, Q.; Zhou, Z.; Bao, T.; Zhao, X.; Liu, H.; Zheng, Z.; Fan, J.; Zhao, S.; Li, Q.; Yin, G. Exosomes derived from platelet-rich plasma administration in site mediate cartilage protection in subtalar osteoarthritis. J Nanobiotechnology 2022, 20(1), p. 56. [Google Scholar] [CrossRef]
- Song, I.; Glass, N.A.S.; E.A.; Martin, J.A.; Hlas, A.; Hall, M.M.; Kruse, R.C.; Seol, D.; Duchman, K.R.; Buckwalter, J.A. Exosome Size in Platelet-Rich Plasma is Associated with Effectiveness in Patients Treated for Knee Osteoarthritis. Orthopedic Journal of Sports Medicine 2025, 13(9). [Google Scholar] [CrossRef]
- van de Wakker, S.I.; Bauza-Martinez, J.; Rios Arceo, C.; Manjikian, H.; Snijders Blok, C.J.B.; Roefs, M.T.; Willms, E.; Maas, R.G.C.; Pronker, M.F.; de Jong, O.G.; Wu, W.; Gorgens, A.; El Andaloussi, S.; Sluijter, J.P.G.; Vader, P. Size matters: Functional differences of small extracellular vesicle subpopulations in cardiac repair responses. J Extracell Vesicles 2024, 13(1), p. e12396. [Google Scholar] [CrossRef]
- Willms, E.; Johansson, H.J.; Mager, I.; Lee, Y.; Blomberg, K.E.; Sadik, M.; Alaarg, A.; Smith, C.I.; Lehtio, J.; El Andaloussi, S.; Wood, M.J.; Vader, P. Cells release subpopulations of exosomes with distinct molecular and biological properties. Sci Rep 2016, 6, p. 22519. [Google Scholar] [CrossRef]
- Zhang, H.; Freitas, D.; Kim, H.S.; Fabijanic, K.; Li, Z.; Chen, H.; Mark, M.T.; Molina, H.; Martin, A.B.; Bojmar, L.; Fang, J.; Rampersaud, S.; Hoshino, A.; Matei, I.; Kenific, C.M.; Nakajima, M.; Mutvei, A.P.; Sansone, P.; Buehring, W.; Wang, H.; Jimenez, J.P.; Cohen-Gould, L.; Paknejad, N.; Brendel, M.; Manova-Todorova, K.; Magalhaes, A.; Ferreira, J.A.; Osorio, H.; Silva, A.M.; Massey, A.; Cubillos-Ruiz, J.R.; Galletti, G.; Giannakakou, P.; Cuervo, A.M.; Blenis, J.; Schwartz, R.; Brady, M.S.; Peinado, H.; Bromberg, J.; Matsui, H.; Reis, C.A.; Lyden, D. Identification of distinct nanoparticles and subsets of extracellular vesicles by asymmetric flow field-flow fractionation. Nat Cell Biol 2018, 20(3), 332–343. [Google Scholar] [CrossRef]
- de Menezes-Neto, A.; Saez, M.J.; Lozano-Ramos, I.; Segui-Barber, J.; Martin-Jaular, L.; Ullate, J.M.; Fernandez-Becerra, C.; Borras, F.E.; Del Portillo, H.A. Size-exclusion chromatography as a stand-alone methodology identifies novel markers in mass spectrometry analyses of plasma-derived vesicles from healthy individuals. J Extracell Vesicles 2015, 4, p. 27378. [Google Scholar] [CrossRef]
- Gamez-Valero, A.; Monguio-Tortajada, M.; Carreras-Planella, L.; Franquesa, M.; Beyer, K.; Borras, F.E. Size-Exclusion Chromatography-based isolation minimally alters Extracellular Vesicles’ characteristics compared to precipitating agents. Sci Rep 2016, 6, p. 33641. [Google Scholar] [CrossRef] [PubMed]
- Robinson, S.D.; Samuels, M.; Jones, W.; Stewart, N.; Eravci, M.; Mazarakis, N.K.; Gilbert, D.; Critchley, G.; Giamas, G. Confirming size-exclusion chromatography as a clinically relevant extracellular vesicles separation method from 1mL plasma through a comprehensive comparison of methods. BMC Methods 2024, 1(1), 7. [Google Scholar] [CrossRef]
- Hickman, E.; Carberry, V.; Carberry, C.; Cooper, B.; Mordant, A.L.; Mills, A.; Sokolsky, M.; Herring, L.E.; Alexis, N.E.; Rebuli, M.E.; Jaspers, I.; Sheats, K.; Rager, J.E. Respiratory extracellular vesicle isolation optimization through proteomic profiling of equine samples and identification of candidates for cell-of-origin studies. PLoS One 2025, 20(1), e0315743. [Google Scholar] [CrossRef] [PubMed]
- Dilsiz, N. A comprehensive review on recent advances in exosome isolation and characterization: Toward clinical applications. Transl Oncol 2024, 50, p. 102121. [Google Scholar] [CrossRef] [PubMed]
- Vanderboom, P.M.; Dasari, S.; Ruegsegger, G.N.; Pataky, M.W.; Lucien, F.; Heppelmann, C.J.; Lanza, I.R.; Nair, K.S. A size-exclusion-based approach for purifying extracellular vesicles from human plasma. Cell Rep Methods 2021, 1(3). [Google Scholar] [CrossRef]
- Meston, D.; Stoll, D.R. Pitfalls in Proteomics: Avoiding Problems That Can Occur Before Data Acquisition Begins. LCGC North America 2022, 40(11), 524–528. [Google Scholar] [CrossRef]
- Li, Z.; Jiang, J.; Cai, K.; Qiao, Y.; Zhang, X.; Wang, L.; Kang, Y.; Wu, X.; Zhao, B.; Wang, X.; Zhang, T.; Lin, Z.; Wu, J.; Lu, S.; Gao, H.; Jin, H.; Xu, C.; Huangfu, X.; James, Z.; Chen, Q.; Zheng, X.; Liu, N.N.; Zhao, J. CCN2 mediates fibroblast-macrophage interaction in knee arthrofibrosis based on single-cell RNA-seq analysis. Bone Res 2025, 13(1), p. 26.10. [Google Scholar] [CrossRef]
- Barter, M.J.; Turner, D.A.; Rice, S.J.; Hines, M.; Lin, H.; Falconer, A.M.D.; McDonnell, E.; Soul, J.; Arques, M.D.C.; Europe-Finner, G.N.; Rowan, A.D.; Young, D.A.; Wilkinson, D.J. SERPINA3 is a marker of cartilage differentiation and is essential for the expression of extracellular matrix genes during early chondrogenesis. Matrix Biol 2024, 133, 33–42. [Google Scholar] [CrossRef]
- Sun, X.; Gu, X.; Peng, J.; Yang, L.; Zhang, X.; Ran, Z.; Xiong, J. PRDX2 Knockdown Inhibits Extracellular Matrix Synthesis of Chondrocytes by Inhibiting Wnt5a/YAP1/CTGF and Activating IL-6/JAK2/STAT3 Pathways in Deer Antler. Int J Mol Sci 2022, 23(9). [Google Scholar] [CrossRef]
- Wilkinson, D.J., Serpins in cartilage and osteoarthritis: what do we know? Biochem Soc Trans 2021, 49(2), 1013–1026. [CrossRef]
- Jiang, Z.; Huang, C.; Guo, E.; Zhu, X.; Li, N.; Huang, Y.; Wang, P.; Shan, H.; Yin, Y.; Wang, H.; Huang, L.; Han, Z.; Ouyang, K.; Sun, L. Platelet-Rich Plasma in Young and Elderly Humans Exhibits a Different Proteomic Profile. J Proteome Res 2024, 23(5), 1788–1800. [Google Scholar] [CrossRef]
- Miroshnychenko, O.; Chalkley, R.J.; Leib, R.D.; Everts, P.A.; Dragoo, J.L. Proteomic analysis of platelet-rich and platelet-poor plasma. Regen Ther 2020, 15, 226–235. [Google Scholar] [CrossRef]
- Miao, C.; Zhou, W.; Wang, X.; Fang, J. The Research Progress of Exosomes in Osteoarthritis, With Particular Emphasis on the Mediating Roles of miRNAs and lncRNAs. Front Pharmacol 2021, 12, 685623. [Google Scholar] [CrossRef]
- Kamper, S.J.; Maher, C.G.; Mackay, G. Global rating of change scales: a review of strengths and weaknesses and considerations for design. J Man Manip Ther 2009, 17(3), 163–70. [Google Scholar] [CrossRef]
Figure 1.
Isolation and characterization of PRP sEVs. A) Non-EV protein levels (total protein) in fractions 1-12 from SEC (n = 4/fraction). Fractions 7, 8, 9 containing low levels non-exosomal protein were used for sEV proteomic analysis B) Size distribution determined by MRPS. C) TEM showing typical sEV morphology. D) Immunoblot confirming the presence of sEV-specific protein markers and absence of GM130, a golgi marker. E) Effects of thrombin activation on sEV concentration.
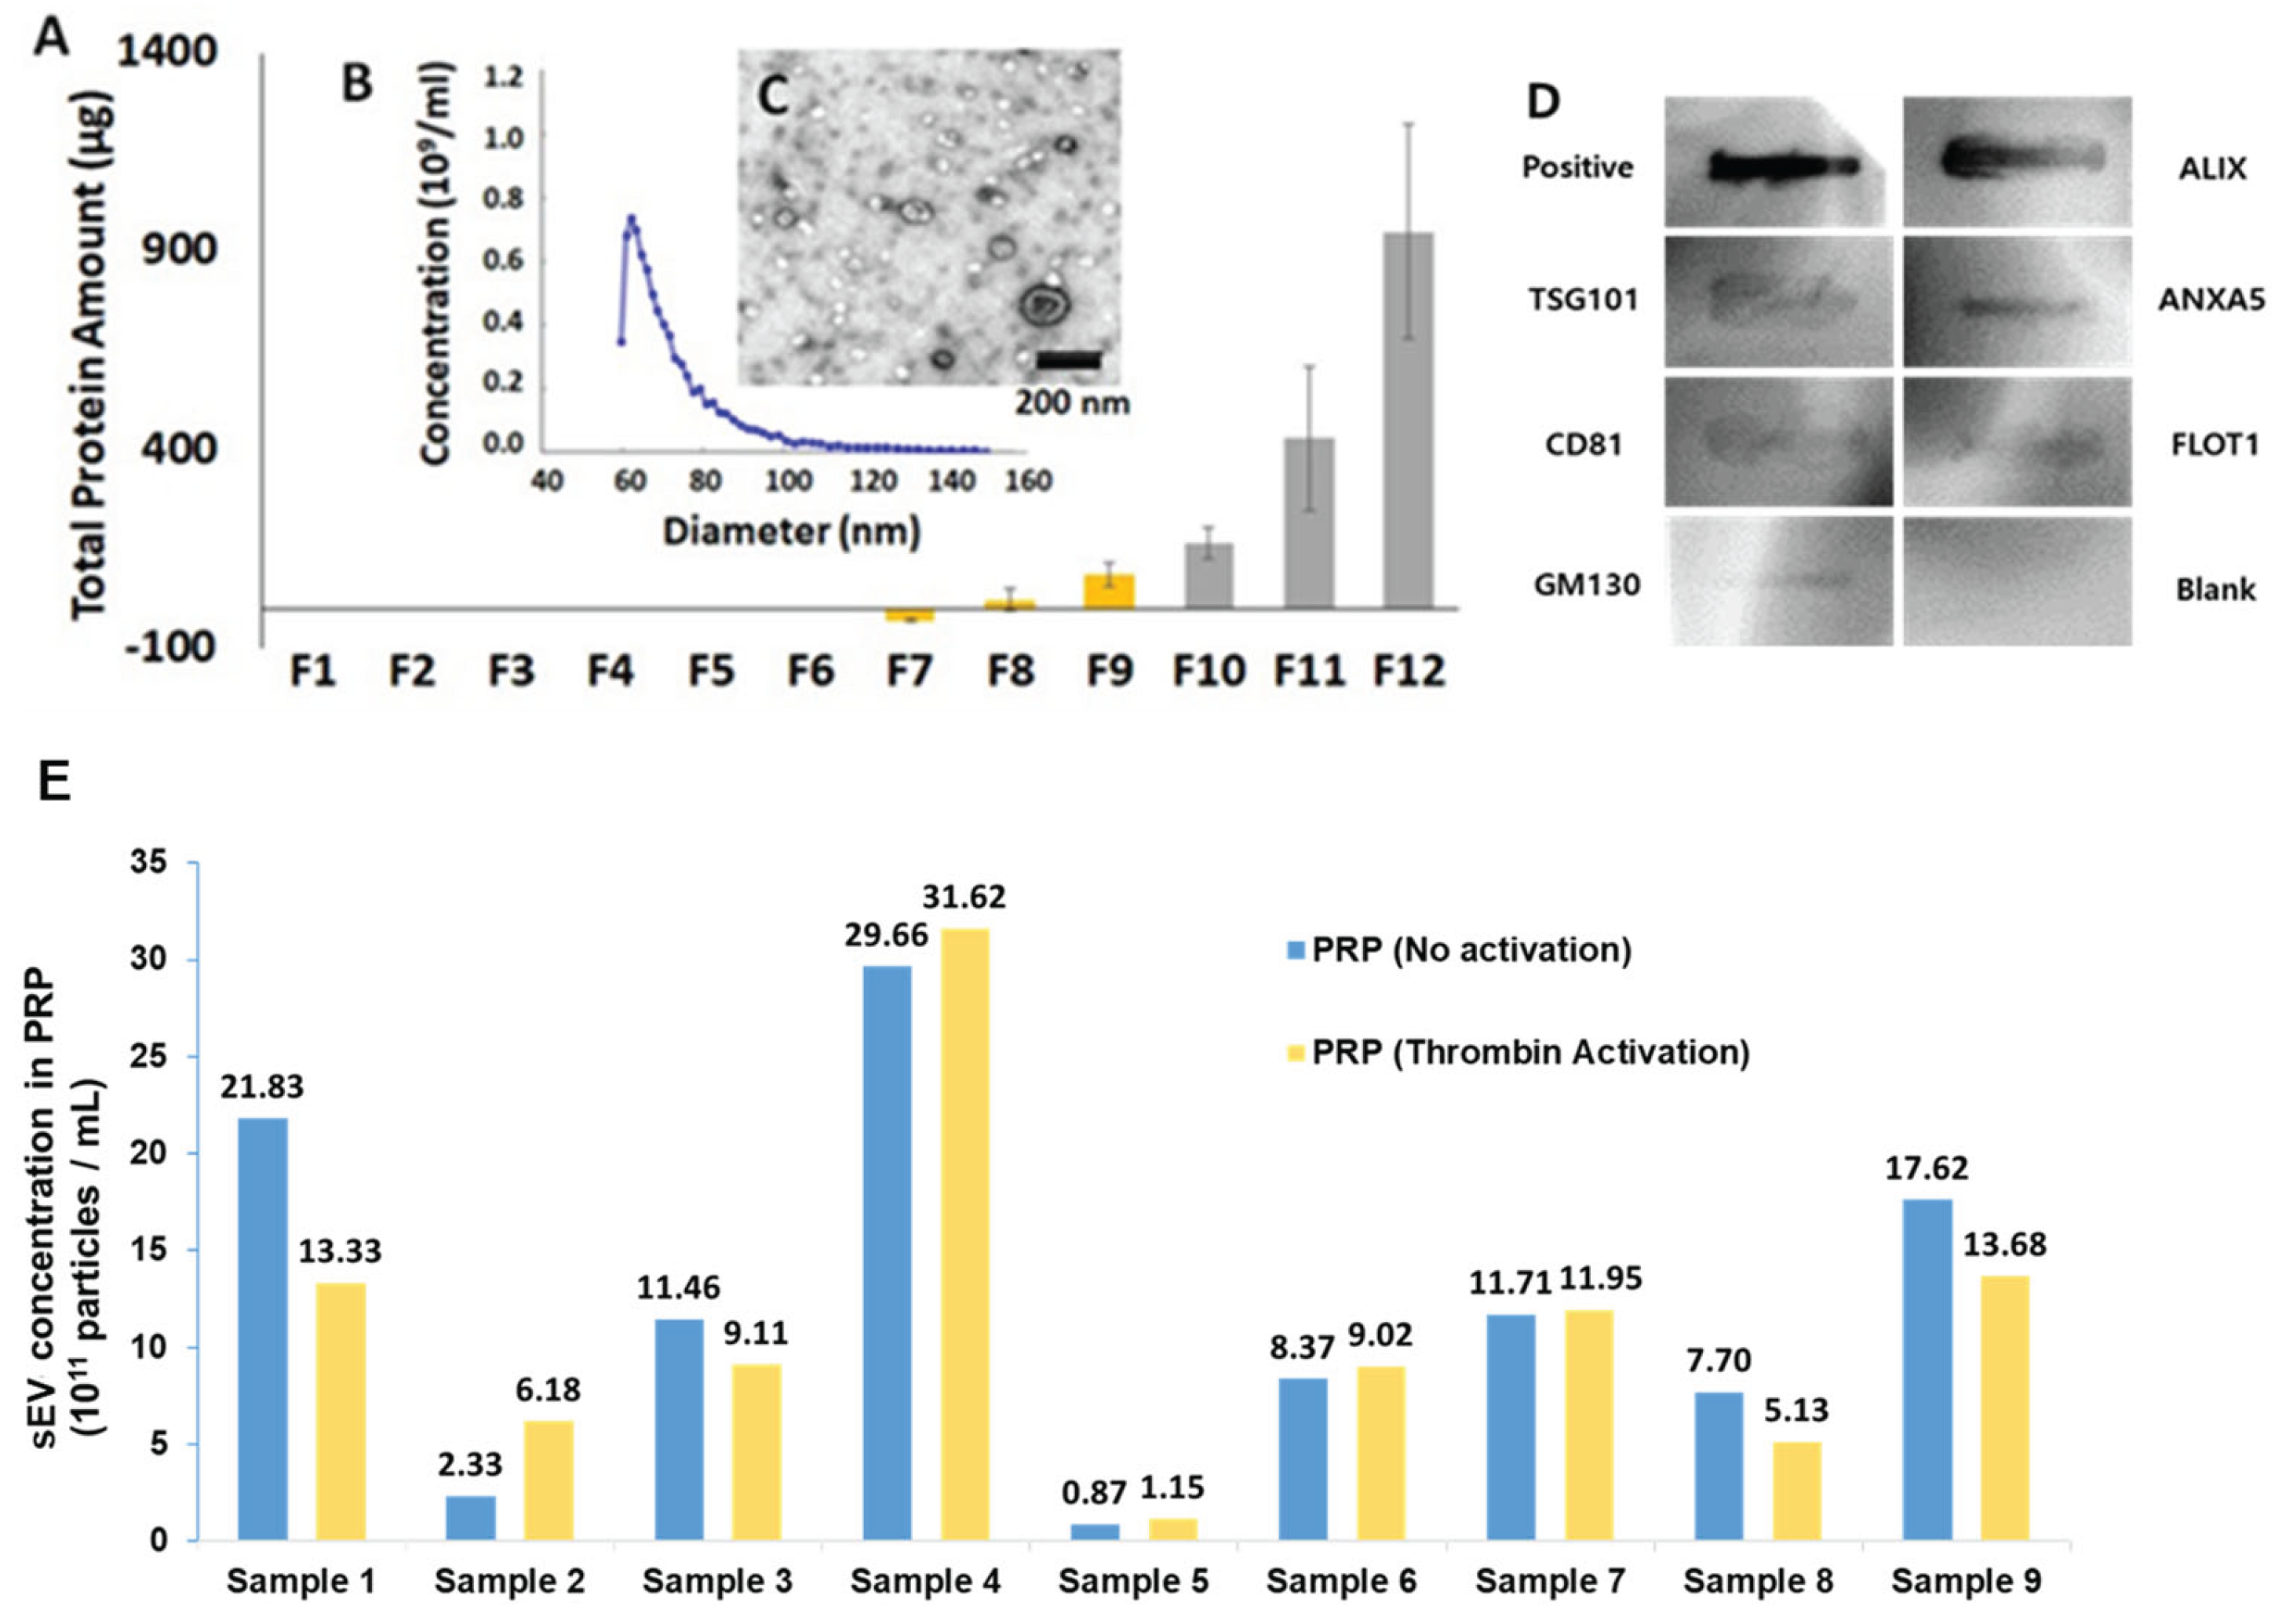
Figure 2.
Volcano plot of -log10(p-values) versus log2fold-change (Responder/Non-responder). Red dots indicate 48 protein groups that were significantly different at 1% FDR. 33 protein groups were found only in Responders and 15 were only found in Non-Responders. The dotted lines indicate fold-changes of > 2 or < -2, and p values < 0.01.
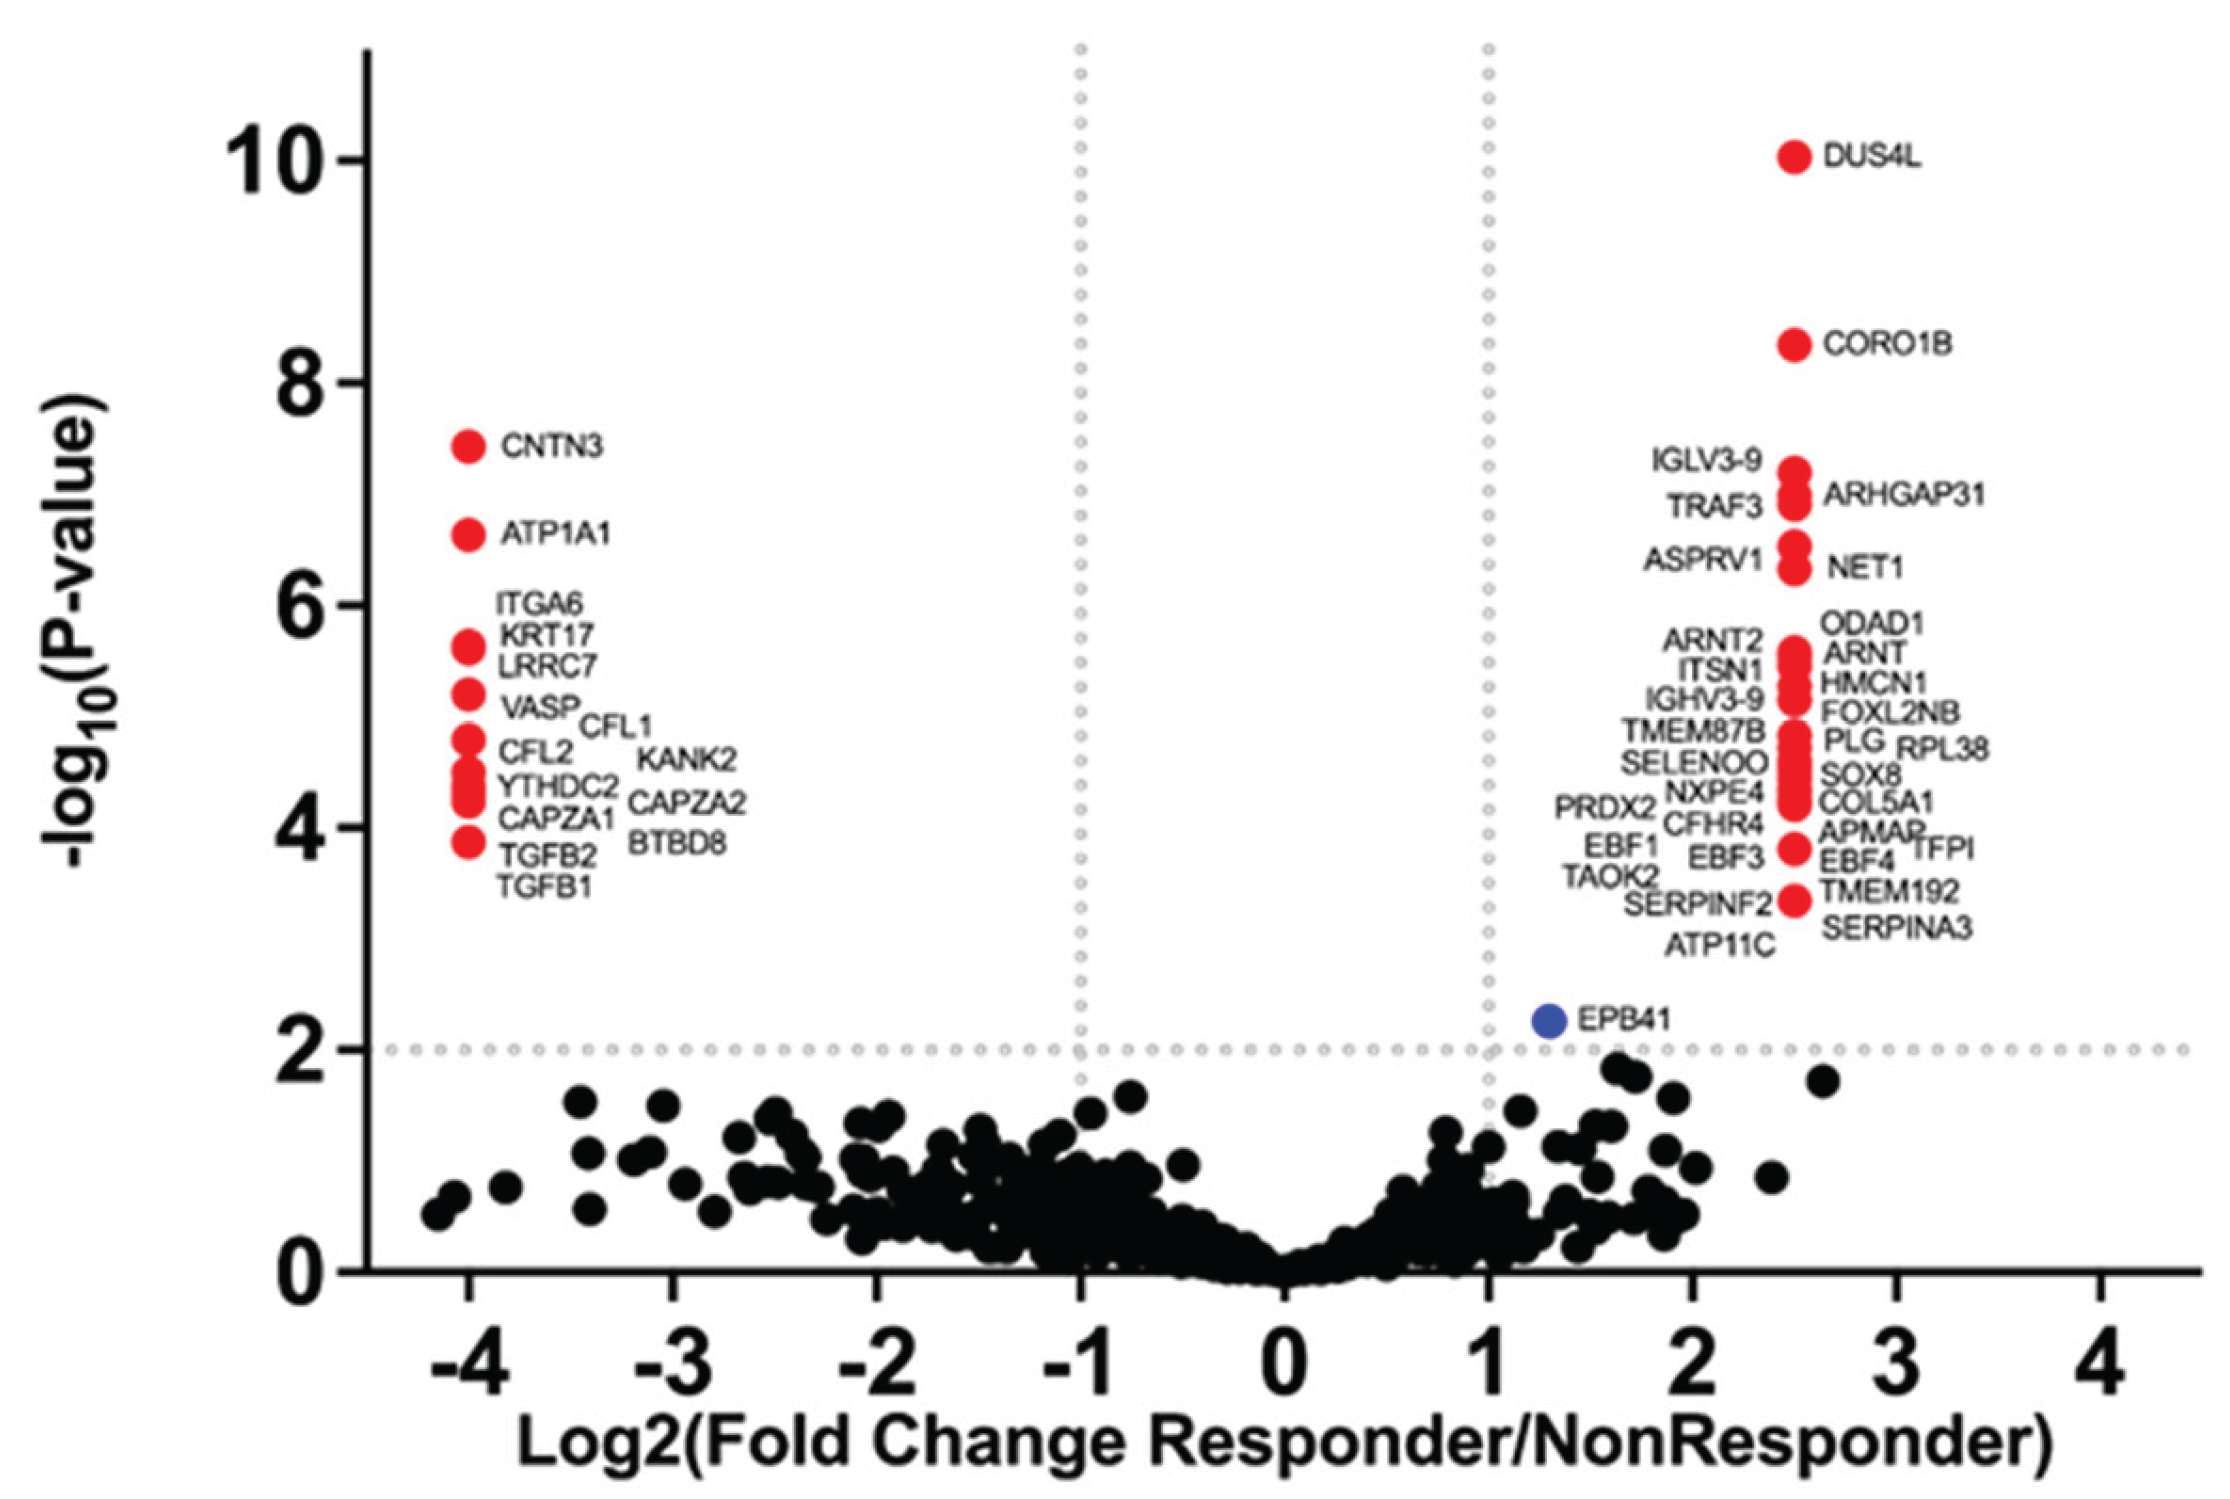

Table 1.
Definition of PRP responses based on a 0–5-point scale.
| Response | Description | Score |
|---|---|---|
| NR | No Improvement | 0 |
| NR | Minimal Improvement | 1 |
| NR | Mild Improvement | 2 |
| R | Significant Improvement | 3 |
| R | Near Complete Resolution | 4 |
| R | Complete Resolution | 5 |
*NR = non-responder, R = responder.
Table 2.
Assessments of symptom Improvement.
| Sample # | Patient Description | Score | Response |
|---|---|---|---|
| 1* | athlete, significant improvement in symptoms | 3 | R |
| 2 | highly active, healthy 60-year-old, no improvement in symptoms | 0 | NR |
| 3 | active healthy, near complete resolution in symptoms | 4 | R |
| 4* | athlete, significant improvement in symptoms | 3 | R |
| 5 | athlete, minimal change in symptoms | 1 | NR |
| 6 | middle aged healthy person, significant improvement in symptoms | 3 | R |
| 7 | middle aged, mildly active, overweight person, complete symptom resolution | 5 | R |
| 8 | middle aged, mildly active, overweight person, only mild improvement in symptoms | 2 | NR |
| 9 | 65-year-old, medically ill person, significant improvement in symptoms | 3 | R |
Table 3.
sEV size (mean) and concentration, and platelet concentrations.
| Sample # | Mean sEV Size (nm) | sEV Concentration (x 1011/mL) |
Platelet Concentration (x 108/mL) |
|---|---|---|---|
| 1* | 69.4 | 22 | 4.0 |
| 2 | 72.0 | 2 | 2.0 |
| 3 | 72.8 | 11 | 3.0 |
| 4* | 74.0 | 30 | 4.5 |
| 5 | 76.9 | 1 | 2.0 |
| 6 | 70.2 | 8 | 5.0 |
| 7 | 71.0 | 12 | 3.4 |
| 8 | 69.6 | 8 | 3.7 |
| 9 | 69.9 | 18 | 2.6 |
| Mean | 71.8 | 12.4 | 3.4 |
| ± SD | 2.48 | 9.44 | 1.06 |
*Same individual treated on two separate occasions.
Table 4.
Significant Proteins Found Only in Responders.
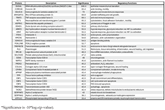 |
Table 5.
Significant Proteins Found Only in Non-Responders.
 |
Disclaimer/Publisher’s Note: The statements, opinions and data contained in all publications are solely those of the individual author(s) and contributor(s) and not of MDPI and/or the editor(s). MDPI and/or the editor(s) disclaim responsibility for any injury to people or property resulting from any ideas, methods, instructions or products referred to in the content. |
© 2026 by the authors. Licensee MDPI, Basel, Switzerland. This article is an open access article distributed under the terms and conditions of the Creative Commons Attribution (CC BY) license (http://creativecommons.org/licenses/by/4.0/).
Copyright: This open access article is published under a Creative Commons CC BY 4.0 license, which permit the free download, distribution, and reuse, provided that the author and preprint are cited in any reuse.


