
Submitted:
10 February 2026
Posted:
12 February 2026
You are already at the latest version
Abstract
Cage-based tilapia farming is highly affected by rapid variations in water quality, particularly variations in dissolved oxygen (DO), which can lead to mass fish mortality and significant economic losses. To address this challenge, in this study, an internet of things (IoT)- and LoRa-based water quality monitoring and control system is proposed, designed for real-time aquaculture management. The developed prototype enables peer-to-peer communication among distributed control nodes for continuous monitoring of dissolved oxygen, pH, and water temperature. Measured data are transmitted remotely and integrated with automated oxygen pump control through a mobile application, allowing timely intervention without continuous on-site supervision. To mitigate sensor degradation caused by prolonged submersion, an automatic probe lifting mechanism was incorporated into the system, significantly reducing biofouling and sensor drift. The experimental results show that this mechanism improves measurement accuracy, achieving a dissolved oxygen RMSE of 0.186, which is substantially lower than that of a continuously submerged sensor. Evaluation of communication performance confirms reliable LoRa transmission with a 100% packet delivery rate over distances up to 1,600 m, maintaining positive signal-to-noise ratios and RSSI values above receiver sensitivity. Detection latency analysis demonstrates sub-second response times for both single- and multi-hop configurations, sufficient for timely aeration control. Evaluation by five specialists yielded a high average performance score of 4.11, while post-implementation satisfaction assessments involving 20 tilapia farmers indicated an average score of 4.48, confirming the system’s effectiveness, reliability, and suitability for practical deployment in cage-based tilapia farming.
Keywords:
tilapia
; smart farming
; water quality
; internet of things
; LoRa
1. Introduction
Nile tilapia is a commercially significant aquaculture species, contributing substantially to income generation and the security of long-term livelihoods in farming communities. The demand for Nile tilapia continues to increase in both domestic and international markets, particularly in the United States and the European Union [1,2]. However, recently, there have been severe challenges for cage-based Nile tilapia farming in the Sirindhorn Dam area of Ubon Ratchathani Province, including elevated fish mortality rates. These losses are primarily attributed to deteriorating water quality and abrupt weather fluctuations as a consequence of climate change, which lead to rapid reductions in dissolved oxygen levels. Such conditions have resulted in substantial reductions in production yields and farmer incomes.
Environmental parameters—most notably water temperature and dissolved oxygen concentration—play a critical role in growth performance, survival rates, and susceptibility to disease in fish. Effective aquaculture management therefore requires continuous monitoring and timely control of key water quality indicators. Increasing climate unpredictability and seasonal variability are further exacerbating fluctuations in aquatic environments, underscoring the necessity for real-time water quality management systems to minimize fish health risks and economic losses [3].
In response to these challenges, agricultural technologies have advanced rapidly, particularly under the smart farming paradigm, which is being actively promoted by government policies to enhance production efficiency and sustainability. Innovations involving smart sensors, electronic devices, and automated control systems have been increasingly adopted to improve the precision of farm monitoring and management. Within this context, the internet of things (IoT) has emerged as a critical enabling technology in aquaculture, especially for continuous water quality monitoring in tilapia cage systems, where environmental changes can have immediate and severe impacts [4,5].
Field surveys conducted in the Sirindhorn Dam region have revealed that farmers predominantly rely on supercharger oxygen pumps to increase dissolved oxygen levels in fish cages. However, these systems present several limitations, including high fuel consumption, substantial operational costs, and labor-intensive deployment, particularly in farming areas where cages are widely dispersed. The spatial separation of cages also creates significant challenges for data communication. To address these constraints, long-range (LoRa) communication technology, a low-power, long-distance wireless communication protocol, has been adopted as a suitable solution for data transmission in large-scale aquaculture environments [6], offering strong potential to support sustainable farming practices.
In a previous study by Nawara Chansiri et al., a LoRa-based water quality monitoring system for tilapia cage farming was proposed, in which sensor data were transmitted from distributed monitoring nodes to a central node and subsequently forwarded to a remote server via the internet [7]. Nevertheless, such systems face critical limitations in practical deployment. In particular, water quality sensors must remain submerged for prolonged periods, leading to dirt and biofilm accumulation on probe surfaces. This fouling effect degrades measurement accuracy and significantly shortens sensor lifespan, thereby increasing maintenance costs and reducing system reliability.
To overcome these challenges, this study focuses on the design and development of an integrated water quality monitoring and control system for Nile tilapia cage farming using IoT and LoRa communication technologies. The proposed system comprises multiple control nodes deployed within fish cages for continuous monitoring of key water quality parameters and for switching oxygen pumps on/off at distributed locations. These nodes communicate via a peer-to-peer LoRa network, transmitting data to a main gateway node, which aggregates the information and forwards it to a cloud-based server through the internet. Real-time water-quality data and system status are communicated through a smartphone application, enabling farmers to remotely monitor environmental conditions and manually control oxygen pumps as needed.
In addition, the system features an automated alert mechanism that is activated when water quality parameters exceed critical thresholds, triggering immediate operation of oxygen pumps to reduce the risk of fish mortality. To further enhance sustainability and reduce operational costs, the oxygen pump system is powered by solar energy. Importantly, an automatic sensor probe submersion mechanism is introduced into the proposed system, whereby the sensor is immersed only during measurement intervals and retracted after data acquisition is complete. This approach effectively minimizes biofilm formation, improves measurement accuracy, and extends sensor service life. Collectively, these features make the developed system well suited for practical deployment in sustainable Nile tilapia cage farming under dynamic environmental conditions.
The structure of this paper is as follows: Section 1 presents the introduction, and Section 2 reviews the related work concerning the application of IoT and LoRa technologies in aquaculture water quality monitoring systems. Section 3 details the proposed methodology, while Section 4 discusses the experimental results and provides an analysis of the system’s performance. Finally, Section 5 concludes this study and outlines potential directions for future research.
2. Related Work
The role of internet of things (IoT) technologies has been increasingly emphasized in recent advances in smart aquaculture, enabling continuous, real-time monitoring of water quality to mitigate production risks and labor dependency. Early studies consistently reported that dissolved oxygen (DO), pH, and water temperature are the most critical parameters influencing fish growth, survival, and disease susceptibility, particularly under climate-driven environmental variability [1,2,3]. Also within this context, IoT-based monitoring systems have been widely adopted as a means to replace manual sampling and narrative observations, which are often incapable of detecting rapid environmental changes in open-water aquaculture environments [4,5].
A substantial body of work has focused on the use of low-power wide-area networks (LPWANs), particularly LoRa and LoRaWAN, to support long-distance data transmission in aquaculture systems. Several studies demonstrate that LoRa-based architectures exhibit significantly reduce deployment costs, node densities, and energy consumption compared with short-range or cellular alternatives, making them well suited for large water bodies and rural farming areas [6,7,8,9,10,11]. These systems typically feature a node–gateway–cloud architecture, enabling centralized visualization and alerts while maintaining low-power operation. Empirical evaluations have consistently confirmed their reliable communication performance over distances ranging from several hundred meters to multiple kilometers, with acceptable RSSI, SNR, and packet delivery rates under real-world conditions [8,11,16].
Beyond communication reliability, prior research has explored various sensing configurations and system functionalities. Many studies emphasize monitoring multiple parameters, extending beyond DO and pH to include turbidity, salinity, ammonia, and total dissolved solids, particularly in shrimp farming and biofloc systems [12,13,14,15,20,21,22]. Some systems further integrate automated control mechanisms, such as aerators, pumps, and valves, triggered by threshold-based rules or fuzzy logic controllers, leading to improvements in environmental stability and reduced manual intervention [13,15,20]. More recent studies have incorporated machine learning models to enable predictive analytics and decision support, shifting smart aquaculture systems from reactive monitoring toward proactive management [17,23].
Despite these advances, several persistent limitations remain evident across the literature. First, many IoT-based aquaculture systems rely on continuous sensor submersion, which accelerates biofouling, sensor drift, and probe degradation, particularly for dissolved oxygen and pH sensors, leading to reduced measurement accuracy and increased maintenance costs over the long term [7,15,18,19,23]. While some studies have proposed solutions such as protective casings, calibration models, or robotic maintenance mechanisms, these often increase system complexity, cost, or energy consumption, limiting their suitability for small-scale or resource-constrained farmers [18,19,22]. Second, a large proportion of existing systems prioritize monitoring and alerting, with limited empirical evaluation of end-to-end system responsiveness (for example, detection latency under real communication conditions), which is critical for timely aeration control in cage-based farming environments [9,10,11,16]. Third, many systems were validated in laboratory tanks, aquariums, or pond-scale settings, leaving a relative scarcity of long-term field evaluations in open-water cage aquaculture settings, where environmental dynamics and communication constraints are more pronounced [10,12,17].
Taken these findings together, it is clear that existing studies have clearly established the feasibility and benefits of IoT- and LoRa-enabled water quality monitoring in aquaculture. However, a research gap at the intersection of long-term sensor reliability, field-validated communication performance, and timely automated control in open-water cage-based tilapia farming is also revealed. In particular, there remains limited work that systematically addresses sensor degradation due to continuous submersion while simultaneously evaluating communication reliability, detection latency, and user acceptance under real farming conditions.
To address this gap, the present study proposes an IoT-LoRa-based water quality monitoring and control system specifically tailored for cage-based Nile tilapia farming. Unlike prior approaches, the system features an automatic probe lifting mechanism to mitigate biofouling and sensor drift, distributed LoRa control nodes for long-range peer-to-peer communication, and real-time automated oxygen pump control, validated through comprehensive field experiments. By combining evaluations of measurement accuracy, communication performance, detection latency, and farmer satisfaction, this work extends existing research toward a more reliable, responsive, and practically deployable smart aquaculture solution.
3. Materials and Methods
The figure below illustrates the architecture we used to develop a water quality control system for tilapia farming using IoT-LoRa.
Figure 1 presents the operational framework of an internet of things (IoT)-enabled water oxygen control system integrated with LoRa communication technology for tilapia aquaculture. The system architecture is composed of two primary components: control nodes and main nodes. The control nodes are responsible for continuously monitoring water quality parameters and switching the oxygen pumps distributed across multiple locations within the tilapia cage system on/off. The main nodes aggregate sensor data from the deployed control nodes and transmit the collected information to a centralized server via the internet. Sensor data from each node are visualized in real time through a smartphone application, enabling farmers to remotely monitor water quality conditions and manually control oxygen pump operations when necessary. In addition to manual control, the system features an automated alert mechanism that notifies users when water quality parameters reach critical thresholds through an application. Upon detecting such conditions, the system automatically activates the oxygen pumps to mitigate the risk of hypoxia and reduce fish mortality. To enhance sustainability and lower operational costs, the oxygen pump units are designed to operate using solar energy as the primary power source.
3.1. System Circuit Design
This section details the hardware circuit design of the control nodes and the main node implemented in the system.
Figure 2 illustrates the control node circuit diagram, showing the integration of system components with the ESP32 LoRa microcontroller board (Espressif Systems, Shanghai, China). The system features a DHT22 sensor (Aosong Electronics, Guangzhou, China) to measure ambient air temperature and relative humidity, together with a set of water quality sensors, including dissolved oxygen (DO), water temperature, and pH sensors. To improve energy efficiency, relay channel 1 controls the power supply to the DO, water temperature, and pH sensors, enabling on-demand operation. These sensors are mechanically integrated with a stepper motor that regulates the vertical movement of the sensor probe assembly. A limit switch is incorporated to define the operational range of motion and prevent mechanical over-travel. During measurement, the probe assembly is lowered into the water to acquire water-quality data and subsequently raised above the water surface upon completion. This strategy minimizes biofilm formation on the sensor probes, thereby improving sensor longevity and maintaining measurement accuracy over the long term.
The system is powered primarily by solar energy, with photovoltaic panels converting solar radiation into electrical power. The generated energy is stored in a battery, and a solar charge controller regulates the charging process to ensure safe and efficient energy management. This power subsystem supplies energy to the ESP32 LoRa microcontroller during system operation under predefined conditions. Sensor data are transmitted to the main node for processing and forwarded to the server for storage and analysis. In addition, the solar power system features a brushed DC motor that drives an oxygen pump, which is controlled via a second relay. This configuration enables automated and energy-efficient water-quality management within the aquaculture environment.
Figure 3 illustrates the circuit diagram of the main node, which serves as the central hub for receiving and aggregating data from all distributed control nodes. The collected data are transmitted to a central server through a 4G internet network via a Wi-Fi router. A dedicated smartphone application provides real-time visualization of water-quality parameters measured by the control nodes installed in the fish-farming cages, enabling continuous environmental monitoring and informed evaluation of farming conditions. In addition to data management, the main node is equipped with relay-controlled status indicator lights on the front panel, which provide visual signals for system readiness and internet connectivity. The system also enables remote control of oxygenation equipment. Control commands generated via the smartphone application are received by the main node and transmitted to the target control nodes through a peer-to-peer LoRa communication network. These nodes are connected to oxygen pumps, allowing automated and remote activation or deactivation of aeration systems. This communication architecture enhances operational flexibility, reduces the need for manual control of on-site equipment, and supports efficient water-quality management in real-world aquaculture environments.
3.2. Flowchart of System Design
Programs developed in C for the Arduino platform follow a loop-based execution architecture consisting of two primary functions. The setup() function is executed once at system startup and is responsible for initializing system configurations, including communication interfaces, input/output pin modes, and connected hardware peripherals. In contrast, the loop() function is executed repeatedly during runtime and continuously handles data processing, control logic, and system operations for as long as the device remains powered.
Figure 4 illustrates the operational sequence of the control-node devices. The process begins with the setup() phase, during which the system is initialized. This phase includes configuration of the ESP32 LoRa microcontroller’s GPIO pins, establishment of LoRa network communication, and initialization of peripheral components, including the DHT, dissolved oxygen (DO), and pH sensors and the stepper motor drive system. During the loop() phase, the control node continuously monitors incoming LoRa packets transmitted by neighboring control nodes. Upon receiving a packet, the system verifies the associated node identifier (ID) to determine whether the message is addressed to the current node. If the node ID matches, the system further checks whether the message originated from the main node and identifies the command type for oxygen pump control. When an “ON” command is received, relay channel 2 is activated to operate the oxygen pump, whereas an “OFF” command deactivates the relay to stop pump operation. If the received packet is not intended for the current node, the control node forwards the data to the next neighboring node using a multi-hop communication mechanism, thereby supporting distributed network routing. The control node performs sensor data acquisition and processing at predefined operating intervals of 60 minutes. The collected measurements are transmitted to neighboring nodes via the LoRa network, enabling efficient data aggregation and reliable forwarding to the main node for centralized monitoring and management.
Figure 5 illustrates the system’s operational procedure, executed at predefined intervals of 60 minutes. At the beginning of each measurement cycle, relay channel 1 is activated to supply power to the sensor probe assembly and associated measurement devices. The system then drives the stepper motor to lower the sensor probe into the water, enabling in situ water quality measurements. During the measurement phase, the system acquires data on water temperature, dissolved oxygen (DO) levels, and pH, while ambient air temperature and relative humidity are simultaneously recorded using the DHT sensor. Each parameter is sampled 60 times at 1 s intervals. Subsequently, the system processes the collected data by computing the average values for all parameters, thereby mitigating signal noise, reducing measurement interference, and enhancing the accuracy of the water-quality assessment.
Figure 6 illustrates the operational workflow of the main node. The process begins with the setup() phase, during which the system is initialized by configuring the GPIO pins of the ESP32 LoRa microcontroller, establishing LoRa network communication, and connecting to a Wi-Fi network to enable internet-based communication with the central server. During the loop() phase, the main node periodically sends data request messages to the server to retrieve the current system control status. If no response is received, the system waits for 5 s before retrying the request. Upon receiving a response, the main node parses the returned JSON data into structured objects corresponding to individual control nodes, including the node identifier (ID) and the on/off status of the associated oxygen pump. These control parameters are stored in the main node’s memory as an array and subsequently transmitted to neighboring nodes via the LoRa network, thereby distributing control commands to the end devices. Concurrently, the main node continuously listens for incoming LoRa packets transmitted by nearby control nodes. When measurement data are received, the main node stores the data locally and forwards them to the server via the internet for centralized storage and real-time visualization within the system. At predefined intervals of one minute, the main node issues an updated data request to the server for the latest control commands for the oxygen pumps. The retrieved information is used to update the internal control state and is redistributed to the control nodes through the LoRa network. This operational cycle enables the system to respond continuously and efficiently to user-initiated control commands issued via the smartphone application or the central management platform.
Figure 7 illustrates the workflow of the backend web system, which was developed using PHP to receive data transmitted from field-deployed control devices. Upon reception, the incoming data are processed and stored in a MySQL database. The workflow begins with verification of data transmission via the HTTP POST method. If no data are detected, the system returns an error response, indicating a communication failure. When valid data are received, the backend system decodes the JSON-formatted payload to extract the relevant parameters, including the node identifier (node ID), dissolved oxygen (DO), pH, water temperature, air temperature, and relative humidity. DO, pH, and water temperature are subsequently evaluated to determine the current water-quality status based on predefined criteria. The system then classifies the water quality risk status into three alert categories according to the following criteria [24,25,26,27,28]:
- Critical: DO < 3.5 mg/L, pH < 6.0 or pH > 9.0, or water temperature < 22 °C or > 34 °C.
- Surveillance: 3.5 mg/L ≤ DO ≤ 4.9 mg/L, 6 ≤ pH ≤ 6.4 or 8.6 ≤ pH ≤ 9, or 22 °C ≤ water temperature ≤ 24 °C or 31 °C ≤ water temperature ≤ 34 °C.
- Normal: DO ≥ 5 mg/L, 6.5 ≤ pH ≤ 8.5, and 25 °C ≤ water temperature ≤ 30 °C.
When the oxygen pump is configured to operate in automatic mode, the backend system uses the water-quality classification to determine pump operation. In Critical conditions, the system activates the oxygen pump to mitigate low oxygen levels. Conversely, when the water quality is classified as Surveillance or Normal, the oxygen pump is deactivated to conserve energy and prevent unnecessary operation. Finally, all sensor measurements and system actions are recorded in the database, and a system log is generated for subsequent review and analysis. Upon successful completion of the processing cycle, the backend system transmits a confirmation message (“Success”) to the control device, thereby concluding the operational sequence for that cycle.
3.3. System Performance Analysis
The performance of the water quality control system for tilapia farming using IoT-LoRa was evaluated based on assessments provided by five experts and a satisfaction analysis involving 20 cage-based tilapia farmers. Both descriptive and inferential statistical methods were employed to analyze the collected data. For descriptive analysis, the mean and standard deviation (S.D.) were calculated using a Likert-scale questionnaire, following the approach proposed by Likert [29], to describe the opinions and satisfaction levels among the participants. The interpretation of mean scores was classified into five levels: 4.50-5.00 (very high), 3.50-4.49 (high), 2.50-3.49 (moderate), 1.50-2.49 (low), and 1.00-1.49 (very low).
In addition, inferential statistical analysis was applied to determine whether implementation of the IoT-LoRa-based water quality control system resulted in a statistically significant improvement in farmer satisfaction. A paired t-test was used to compare satisfaction scores obtained from the 20 farmers before and after system implementation, based on Likert-scale questionnaires. Pre-implementation scores reflected baseline satisfaction associated with traditional cage-based tilapia farming practices, whereas post-implementation scores represented perceived satisfaction and system responsiveness after adopting the proposed system. A paired t-test was conducted to examine differences in mean satisfaction scores between the two conditions under the assumption that the score differences followed a normal distribution [30]. This statistical approach enabled a rigorous evaluation of the system’s impact on user satisfaction and provided empirical evidence of its effectiveness in practical aquaculture applications.
3.4. Measurements Accuracy Evaluation
3.4.1. Experimental Setup
To evaluate the measurement accuracy of the proposed water quality monitoring system, a comparative field experiment was conducted using two different control node configurations: (1) a control node equipped with an automatic probe submersion and lifting mechanism (hereafter referred to as Node-A), and (2) a conventional control node without a probe movement mechanism, in which the probe remained continuously submerged in the water (Node-B). Both control nodes were deployed at the same cage culture site to ensure identical environmental conditions. The probes of both nodes were configured to measure dissolved oxygen (DO), pH, and water temperature at a fixed depth of 1.2 m, which corresponds to the typical operating depth for tilapia cage farming. The distance between the two nodes was kept minimal (within 1 m) to reduce spatial variability while avoiding mutual interference. To obtain reference (ground truth) measurements, a standard handheld water quality measurement instrument operated by an experienced operator was used. The handheld instrument was treated as the reference device for accuracy evaluation and was calibrated according to the manufacturer’s specifications prior to the experiment.
3.4.2. Data Collection Protocol
The experiment was conducted continuously for two weeks (14 days). Data were collected daily between 06:00 and 18:00, with a sampling interval of 3 hours, resulting in measurements at 06:00, 09:00, 12:00, 15:00, and 18:00, yielding a total of 70 measurement points per parameter for each node. At each scheduled time, the following procedure was applied:
- Node-A—the probe was automatically lowered into the water, the measurement process was performed, and the probe was subsequently lifted above the water surface.
- Node-B—sensor readings were recorded at the same depth (1.2 m) without any probe movement.
- The reference instrument was manually submerged by the operator at the same depth and location. To reduce random measurement noise, three consecutive readings were taken, and their average value was used as the reference measurement.
3.4.3. Accuracy Evaluation Metrics
The accuracy of the sensor measurements was evaluated by comparing the readings from each control node with the corresponding reference measurements obtained from the handheld instrument. The primary performance metric used in this study was the root mean square error (RMSE), which quantifies the deviation between sensor readings and reference values. For each water quality parameter (DO, pH, and temperature), the RMSE was calculated as follows:
where represents the measurement obtained from the control node, denotes the corresponding reference measurement, and n is the total number of measurement samples collected during the experimental period. RMSE values were computed separately for Node-A and Node-B to enable a direct comparison of measurement accuracy between systems with and without the automatic probe movement mechanism.
3.3. Remote Communication Performance Analysis
Long-range communication performance was evaluated using two key radio-frequency indicators: the received signal strength indicator (RSSI) and the signal-to-noise ratio (SNR). The RSSI quantifies the power level of a received signal in decibels relative to one milliwatt (dBm), where higher (i.e., less negative) values correspond to stronger signal reception. RSSI values approaching -30 dBm indicate very strong signals, whereas values near -120 dBm represent weak reception conditions [31]. The RSSI can be computed using the following equation (2):
where RSSI denotes the received signal strength indicator, expressed in decibels relative to one milliwatt (dBm), and Pr represents the received power at the receiver, also measured in dBm.
The signal-to-noise ratio (SNR), expressed in decibels (dB), quantifies the relationship between the power of the received signal and the background noise level. Higher SNR values indicate superior signal quality, as the received signal is more clearly distinguishable from the noise floor [32]. The SNR can be computed as the sum of the received signal power and the noise floor, as defined in Equation (3).
In a standard LoRa transceiver, dedicated commands or built-in functions are available to directly retrieve RSSI and SNR measurements. These parameters are stored in specific hardware registers, which retain the real-time signal quality metrics measured during packet reception.
In this experimental setup, five LoRa-enabled nodes were deployed within the Sirindhorn Dam area. One node was designated as the central receiving node (main node), while the remaining four nodes functioned as control nodes. The control nodes were installed at predetermined distances of 438 m, 814 m, 1640 m, and 2290 m from the main node, respectively. All control nodes were mounted on the steel frame structures of tilapia cages at an approximate height of 50 cm above the water surface. During the experimental period, each control node periodically transmitted sensor data packets containing water-quality parameters to the main node at fixed intervals of five minutes. For each node, a total of 20 data packets were sent, providing an adequate sample size for statistical evaluation of communication performance.
Communication performance was assessed based on three key metrics: the received signal strength indicator (RSSI), the signal-to-noise ratio (SNR), and packet reception integrity. The RSSI was used to quantify the received signal power at the main node, whereas the SNR was employed to evaluate signal quality relative to the ambient noise level. Packet reception integrity was assessed by analyzing the successful reception of transmitted packets at each distance, serving as an indicator of link reliability and communication robustness.
3.5. Detection Latency Analysis
Detection latency is a critical performance metric for IoT-LoRa-based water quality control systems, as it directly reflects the system’s responsiveness to sudden environmental changes, particularly rapid drops in dissolved oxygen levels that may threaten fish survival. In this study, a detection latency experiment was conducted to quantify the time delay between the occurrence of a trigger event at a control node and the successful reception of the corresponding data packet at the main node. To comprehensively evaluate system responsiveness under different network conditions, two communication configurations were examined: single-hop transmission and two-hop transmission.
The single-hop transmission experiment evaluated the end-to-end latency of direct communication between a control node and the main node without any intermediate relay. In this configuration, the control node transmitted data packets directly to the main node using LoRa communication. The experimental procedure was defined as follows:
- A control node generated a trigger event, representing a water quality alert or sensor data transmission.
- Immediately after the event was generated, the control node transmitted a LoRa packet to the main node.
- The transmission timestamp at the control node () and the reception timestamp at the main node () were recorded.
- The detection latency for each transmission was calculated as:
To evaluate the effect of transmission distance, experiments were conducted at distances of 814 m and 1640 m. For each distance, 20 transmission trials were performed. The mean latency and standard deviation were subsequently calculated to characterize the average response time and variability of single-hop communication.
The two-hop configuration was designed to assess the additional latency introduced by packet forwarding in a multi-hop LoRa network. In this scenario, data packets generated by a control node were relayed through an intermediate node before reaching the main node, reflecting practical deployment conditions in large-scale cage-based aquaculture environments. The experimental steps were defined as follows:
- The control node generated a trigger event identical to that used in the single-hop experiment.
- The control node transmitted the packet to an intermediate relay node.
- The relay node recorded the packet reception time (), immediately retransmitted the packet, and logged the retransmission time ().
- The main node recorded the final packet reception time ().
- The total detection latency was calculated as:
Two total transmission distances were evaluated: 1640 m and 2290 m. Similar to the single-hop experiment, each distance configuration was tested 20 times, and the mean latency and standard deviation were computed.
4. Results and Discussion
4.1. Results of the Development of a Water Quality Control System for Tilapia Farming Using IoT-LoRa
Figure 8 presents the implementation of a prototype of the proposed water quality control system, comprising one main node and two distributed control (sensor) nodes. Each control node was powered primarily by a 50 W photovoltaic panel, which simultaneously charges a 12 V, 9 Ah battery to ensure uninterrupted system operation under variable environmental conditions. The system features an ESP32 LoRa SX1262 microcontroller module (Heltec Wireless Stick V3) (Heltec Automation, China), enabling long-range wireless communication within the LoRa frequency band of 863-928 MHz for reliable data transmission and reception. In addition, a high-capacity 450 W photovoltaic panel is used to directly supply power to the aeration system. The oxygen pump, driven by a brushed DC motor, is operated through on/off control signals issued by the control node.
Figure 9 illustrates the deployment of the proposed water quality monitoring system in tilapia cage farms located in Sirindhorn Dam, Ubon Ratchathani Province. The system was installed, tested, and operated under real-world farming conditions to evaluate its practical performance and effectiveness. In this experiment, the control node was mounted on the steel frame of the tilapia cage. Water quality sensors for measuring water temperature, dissolved oxygen (DO), and pH were submerged at a depth of 1.2 m below the water surface to capture representative environmental conditions within the cage. Additionally, an oxygen pump and a high-capacity 450 W photovoltaic panel were installed on the steel cage to support automated aeration.
Figure 10 presents the user interface of the OxyLo mobile application, which was developed to support real-time water quality monitoring and management in cage-based fish farming systems. The application can be downloaded and installed via the following link: http://www.tlp.ponglert.cs.ubru.ac.th/loadapp.php (accessed on 19 January 2026). The main interface displays a list of all control nodes deployed within the system and provides automatic notifications and audible alerts when water quality conditions reach the predefined “Surveillance” and “Critical” levels, enabling timely detection of abnormal conditions. Users can select individual control nodes to access detailed, real-time environmental and water quality information, including air temperature, relative humidity, dissolved oxygen (DO), pH, and water temperature. In addition, the application enables direct remote control of oxygen pumps via a mobile device and supports configurable automatic notification settings, such as alert duration and frequency, as well as condition-based rules for automatic oxygen pump activation and deactivation. These functionalities enhance the efficiency of water quality management while reducing the operational and maintenance workload for fish farmers.
Figure 11 illustrates the web-based platform developed for monitoring and managing water quality in tilapia cage-farming groups, which can be accessed at http://www.tlp.ponglert.cs.ubru.ac.th (accessed on 19 January 2026). The platform visualizes the geographical locations of individual control nodes using map-based markers. By selecting a specific marker, users can view the current water quality indicators measured at that location, along with the operational status of the associated sensors. To enhance interpretability, color-coded status indicators are employed, where green represents Normal conditions, yellow denotes the Surveillance level, and red indicates Critical water-quality conditions. In addition, the platform provides access to historical water-quality data for each control node, enabling temporal analysis and trend monitoring. For data security and integrity, system access is restricted to registered farmers through an authenticated login mechanism.
4.2. Measurement Accuracy Evaluation Results
This experiment was conducted to evaluate the measurement accuracy of the proposed water quality monitoring system, with a particular focus on dissolved oxygen (DO), pH, and water temperature. The collected sensor data were systematically processed and recorded for subsequent accuracy analysis and performance comparison. There was a total of 70 data-collection sessions over a two-week period from May 5 to May 19, 2025. Measurements were obtained at three-hour intervals between 06:00 and 18:00 at a depth of 1.2 m at tilapia cage-farming sites located in Sirindhorn Dam, Sirindhorn District, Ubon Ratchathani Province. During each data-acquisition cycle, measurements from both the automatic probe-lifting node (Node-A) and the non-lifting node (Node-B) were validated against simultaneous in situ measurements obtained using standard reference instruments. The dissolved oxygen level and water temperature were measured using an AR8406 dissolved oxygen meter (Dongguan Wenchang Electronic, Dongguan, China), while pH values were measured using a SmartSensor AS218 pH meter (Dongguan Wenchang Electronic, Dongguan, China). These reference measurements were used to benchmark the control node outputs and to verify the accuracy and reliability of the developed water quality monitoring system.
Figure 12, Figure 13 and Figure 14 illustrate clear diurnal patterns in dissolved oxygen (DO), pH, and water temperature during the two-week monitoring period, which are characteristic of open-water cage aquaculture systems. DO levels were generally lower in the early morning and late afternoon and higher at midday due to respiration and photosynthetic activity. The node with the automatic probe lifting mechanism (Node-A) showed closer agreement to the reference instrument, whereas the non-lifting node (Node-B) exhibited lower DO readings, particularly in the later stages of deployment, likely caused by biofouling and sensor drift. pH values remained within the range of 6.0-8.5, indicating stable conditions for Nile tilapia culture. Node-A closely followed the reference data, while Node-B showed a gradual downward trend. Water temperature displayed consistent diurnal cycles with minimal deviation among devices, although Node-B exhibited slightly higher variability. Overall, the results demonstrate that intermittent probe immersion improves measurement reliability during long-term monitoring.
Table 1 summarizes the root mean square error (RMSE) values obtained by comparing control node measurements with the those of reference instrument. Overall, the node equipped with an automatic probe lifting mechanism (Node-A) consistently achieved lower RMSE values than the non-lifting node (Node-B) across all parameters, indicating superior measurement accuracy and stability. The most significant difference is observed in dissolved oxygen (DO), highlighting the high sensitivity of DO sensors to continuous submersion, biofouling, and membrane degradation. Periodic probe lifting effectively mitigates these effects and preserves sensor performance over long-term deployment. For pH, both nodes show relatively low RMSE values; however, Node-A maintains closer agreement with the reference, while Node-B exhibits higher error due to gradual electrode drift. Water temperature presents the lowest RMSE overall, reflecting the robustness of thermal sensors, although Node-A still demonstrates slightly improved accuracy. Overall, the RMSE results confirm that mechanical probe management enhances long-term measurement reliability in aquaculture monitoring systems.
4.3. Testing the System’s Remote Communication Efficiency
This experiment was designed to evaluate the performance of a single-hop long-range wireless communication system. Equipment cabinets were systematically deployed at predetermined distances to ensure controlled and repeatable measurement conditions. The separation distance between the control nodes and the main node was varied across four levels (438, 814, 1640, and 2290 m) at multiple locations within the Sirindhorn Dam area. For each distance, each control node transmitted 20 data packets, as illustrated in Figure 15. The collected transmission data were analyzed to compute the average signal-to-noise ratio (SNR) and the average received signal strength indicator (RSSI). These metrics were used to evaluate signal quality, link reliability, and data-transmission integrity as functions of transmission distance.
Table 2 presents the general parameter settings for the LoRa modules that were used in the point-to-point communication, as well as the selected frequency bands for the data transmission experiments.
Table 3 presents the data transmission signal performance of the proposed IoT-LoRa system evaluated under real deployment conditions for cage-based tilapia farming. The results reveal a clear distance-dependent degradation in communication quality, as reflected by reductions in RSSI and SNR with increasing transmission range. At 438 m, the system achieved strong link quality, with a high average SNR (9.8 ± 1.2 dB) and RSSI (-78.6 ± 2.4 dBm), ensuring fully reliable packet reception. As the distance increased to 814 m and 1640 m, both indicators declined progressively; however, all transmitted packets were still successfully received, demonstrating robust communication performance under medium-range conditions. At the maximum tested distance of 2290 m, the average SNR dropped slightly below zero (-0.9 ± 1.8 dB), and RSSI decreased to -109.5 ± 4.6 dBm. Under these near-sensitivity-limit conditions, a small packet loss was observed, with 18 out of 20 packets received. Despite this degradation, the overall reception rate remained high, confirming the resilience of the LoRa link.
Overall, the results validate that the selected LoRa transmission parameters enable reliable long-range communication over distances exceeding 2 km, making the system well suited for wide-area cage-based aquaculture monitoring applications.
4.4. Detection Latency Performance Results
Single-hop transmission experiments were conducted using a control node and a main node deployed within the Sirindhorn Dam area, with separation distances of 814 m and 1640 m, as illustrated in Figure 16. For the two-hop transmission experiments, a three-node topology was implemented, consisting of control node A (source), control node B (relay), and the main node. Two end-to-end transmission distances (1640 m and 2290 m) were evaluated.
For the 1640 m configuration, control node 1A was positioned 826 m from control node 1B, while control node 1B was located 814 m from the main node. For the 2290 m configuration, control node 2A was placed 890 m from control node 2B, and control node 2B was positioned 1400 m from the main node, as shown in Figure 17.
For each experimental configuration, 20 transmission trials were performed. All LoRa modules were configured using the communication parameters specified in Table 2. The collected data were subsequently analyzed to compute the average transmission latency and the corresponding standard deviation.
reports the detection latency performance of the proposed IoT-LoRa system under single-hop and two-hop communication configurations, deployed in a real cage-based tilapia farming environment. The results indicate that the detection latency increases with both transmission distance and network hop count. For single-hop communication, the average latency was 208.6 ± 33.4 ms at 814 m and increased to 289.7 ± 41.8 ms at 1640 m. This trend reflects the impact of longer propagation distances and reduced signal quality on packet transmission and reception time. In the two-hop configuration, additional latency was introduced due to packet relaying at the intermediate node. At an equivalent end-to-end distance of 1640 m, the average latency increased to 438.9 ± 52.6 ms, representing a substantial rise compared with single-hop transmission. At the maximum evaluated distance of 2290 m, the latency further increased to 529.4 ± 66.9 ms. Despite this increase, the latency values remained within the sub-second level, which is acceptable for water quality monitoring and aeration control applications.

Table 4.
Data detection latency performance results.
| Communication Type | Distance (m) | Average Latency (ms) | Standard Deviation of Latency (ms) |
| Single-hop | 814 | 208.6 | 33.4 |
| Single-hop | 1640 | 289.7 | 41.8 |
| Two-hop | 1640 | 438.9 | 52.6 |
| Two-hop | 2290 | 529.4 | 66.9 |
Overall, the results demonstrate that while multi-hop LoRa communication incurs higher latency, the system maintains predictable and stable response times. This confirms the suitability of the proposed architecture for timely detection of critical water quality events in large-scale cage-based aquaculture systems.
4.5. Efficiency of the IoT-LoRa-Based Water Quality Control System
The system performance, the results of which are presented in Table 5, was evaluated by five experts with professional experience in software development. A structured questionnaire based on a five-point Likert scale was employed to assess the system’s suitability, efficiency, and operational availability under real-world deployment conditions in a cage aquaculture tilapia farm. The evaluation criteria encompassed measurement accuracy, communication performance, automated control functionality, and overall system sustainability.
The assessment presented in Table 6 involved 20 tilapia cage farmers and compared satisfaction levels before and after the implementation of the proposed system. Descriptive statistics, including the mean and standard deviation, were used to summarize user responses, while a paired t-test was applied to determine the statistical significance of changes observed following system deployment, thereby evaluating the system’s impact on farm operations.
The performance evaluation results summarized in Table 5 demonstrate that the proposed IoT-LoRa-based water quality control system exhibits a high level of technical readiness and operational suitability for real-world deployment in cage-based tilapia farming. Overall, the system achieved a high mean score of 4.11 (S.D. = 0.57), indicating strong expert agreement regarding its effectiveness across multiple performance dimensions. Experts rated the automatic probe lifting and lowering mechanism most favorably, achieving a very high score (4.50 ± 0.50). This result underscores the practical importance of mitigating biofouling and sensor drift in long-term aquatic deployments, and it corroborates the quantitative accuracy improvements observed in the RMSE analysis. Similarly, high ratings for measurement accuracy (4.30 ± 0.55) confirm that the system can reliably monitor dissolved oxygen, pH, and water temperature under dynamic field conditions.
The IoT-LoRa architecture and communication performance also received consistently high evaluations (means between 3.95 and 4.10), reflecting the adequacy of the RSSI, SNR, and packet delivery reliability for long-distance operation in open-water environments. Importantly, the system’s detection latency (4.00 ± 0.57) was considered appropriate for timely oxygen pump control, indicating that sub-second response times are sufficient to support proactive mitigation of hypoxic events. Furthermore, experts acknowledged the benefits of automated oxygen pump control (4.20 ± 0.54) and solar energy integration (4.35 ± 0.52), highlighting reduced operational risk, improved sustainability, and lower energy costs. Although slightly lower scores were observed for scalability (3.80 ± 0.66) and long-term stability (3.90 ± 0.63), these ratings still fall within the high-performance category, suggesting that the system is robust while leaving scope for future expansion and optimization.
The satisfaction evaluation results presented in Table 6 demonstrate a substantial and statistically significant improvement in farmer satisfaction following the implementation of the proposed IoT-LoRa-based water quality control system. Overall satisfaction increased markedly from a low pre-implementation mean of 2.23 (S.D. = 0.53) to a very high post-implementation mean of 4.48 (S.D. = 0.50), with a large mean difference of 2.25 and a high t-value (t = 16.2), indicating strong user acceptance and perceived benefits of the system. Across all dimensions, notable improvements were observed. In terms of usability and practical use, farmers reported that the system was significantly easier to operate, and that the smartphone application provided clear, comprehensible information, with post-implementation mean scores exceeding 4.45. The real-time alert notifications were particularly valued, achieving one of the highest gains, reflecting their role in supporting faster and more effective decision-making during critical water quality events.
Monitoring and control efficiencies also improved significantly. High post-implementation scores for real-time awareness, remote oxygen pump control, and rapid emergency response (means between 4.35 and 4.55) indicate that the system effectively reduced labor requirements and enhanced operational responsiveness. Furthermore, the economic and operational impact dimension shows that farmers perceived tangible benefits, including reduced fuel and energy costs and lower fish losses due to timely aeration control. Finally, the very high scores for overall satisfaction, intention to continue using the system, and willingness to recommend it to other farmers confirm the system’s practical value and readiness for wider adoption in cage-based tilapia farming.
5. Conclusions
This study details the design, development, field deployment, and performance evaluation of an internet of things- and LoRa-based (IoT-LoRa) water quality monitoring and control system tailored for cage-based Nile tilapia farming. The proposed system features distributed control nodes, long-range LoRa communication, cloud-based data management, and a mobile application to enable real-time monitoring of key water quality parameters, including dissolved oxygen (DO), pH, and water temperature, as well as automated oxygen pump control, under real farming conditions. Field experiment results demonstrate that the incorporation of an automatic probe lifting mechanism significantly enhances long-term measurement reliability by reducing biofilm accumulation and sensor drift associated with continuous submersion. This improvement is particularly evident in dissolved oxygen measurements, where the probe-lifting node achieved a substantially lower RMSE of 0.186 compared with a continuously submerged sensor. Communication performance evaluations confirm that the LoRa network achieves reliable long-range data transmission, achieving a 100% packet delivery rate at distances up to 1,600 m while maintaining positive RSSI and SNR values above the receiver sensitivity under the selected transmission parameters. Furthermore, detection latency analysis indicates sub-second end-to-end response times for both single-hop and two-hop configurations, which are sufficient for timely aeration control and rapid mitigation of hypoxic events. Expert evaluation results indicate a high level of technical readiness and operational suitability, with an average score of 4.11, while post-deployment satisfaction assessments distributed to farmers of cage-based tilapia indicate a markedly improved average score of 4.48. These findings confirm the system’s practical value, usability, and acceptance in real-world aquaculture operations. Future work will focus on extending the system to support additional water quality parameters, enhancing scalability through adaptive network management, and integrating predictive analytics or machine learning models to enable proactive decision support, risk reduction, and improved sustainability in smart aquaculture systems.
Author Contributions
Conceptualization, P.S. and S.M.; methodology, P.S. and S.M.; software, P.S., C.K., N.C., B.C., P.W., and P.C.; validation, P.S., S.M., and C.K.; formal analysis, P.S. and S.M.; investigation, P.S., N.C., B.C., P.W., and P.C.; resources, P.S. and S.M.; data curation, P.S., N.C., and B.C.; writing—original draft, P.S.; writing—review and editing, S.M. and P.S.; visualization, P.S.; supervision, S.M.; project administration, S.M.; funding acquisition, S.M. All authors have read and agreed to the published version of the manuscript.
Funding
This research received no external funding.
Data Availability Statement
Not applicable. No new data were created in this study.
Acknowledgments
The authors would like to acknowledge the Faculty of Computer Science, Ubon Ratchathani Rajabhat University, for providing financial support for this research. The authors also thank the tilapia farmers at Sirindhorn Dam, Sirindhorn District, Ubon Ratchathani Province, Thailand, for granting permission to conduct field experiments and for their valuable cooperation throughout the study.
Conflicts of Interest
The authors declare no conflict of interest.
References
- Salikara, P.; Bejranonda, S. Commercial investment of Nile tilapia (Oreochromis niloticus Linn.) culture in Nakhon Pathom Province. Journal of Economic and Management Strategy 2016, 3, 40–54. [Google Scholar]
- Truong, T.M.; Phan, C.H.; Tran, H.V.; Duong, L.N.; Nguyen, L.V.; Ha, T.T. To develop a water quality monitoring system for aquaculture areas based on agent model. In Proceedings of the Fourth International Congress on Information and Communication Technology (ICICT 2019), London, UK, 2019; Volume 2, pp. 47–58. [Google Scholar]
- Sriyasak, P.; Whangchai, N.; Chitmanat, C.; Promya, J.; Lebel, L. Impacts of climate and season on water quality in aquaculture ponds. Asia-Pacific Journal of Science and Technology 2017, 19, 743–751. [Google Scholar]
- Duang-Ek-Anong, S.; Pibulcharoensit, S.; Phongsatha, T. Technology readiness for Internet of Things (IoT) adoption in smart farming in Thailand. International Journal of Simulation Systems, Science and Technology 2019, 20, 1–6. [Google Scholar] [CrossRef]
- Tawfeeq, A.; Al Wahaibi, H.A.S.; Vijayalakshmi, K. IoT based aquaculture system with cloud analytics. International Journal of Applied Engineering Research 2019, 14, 4136–4142. [Google Scholar]
- Charan, K.; Mingkwan, S.; Pairoj, D.; Athikom, S.; Kamon, B. LoRa-based mesh network for transmitting status data from forest fire heat detection sensors (in Thai). Journal of Industrial Technology, Thepsatri Rajabhat University 2023, 18, 29–39. [Google Scholar]
- Chansiri, N.; Sangkaphet, P.; Chaleamwong, B.; Kaewklom, C.; Makdee, S. Water quality monitoring system for Nile tilapia farming using LoRa technology. In Proceedings of the 8th International Conference on Information Technology (InCIT 2024), 2024; pp. 578–583. [Google Scholar]
- Li, M.; Lin, C.; Ren, J.; Jiang, F. A wireless ecological aquaculture water quality monitoring system based on LoRa technology. In Proceedings of the International Conference on Wireless Communication, Network and Multimedia Engineering (WCNME 2019), 2019; pp. 5–7. [Google Scholar]
- Boppana, L.; Madhu, K.; Vaibhav, C.P.R. Aquaculture water monitoring system using LoRaWAN. In Proceedings of the IEEE 11th Region 10 Humanitarian Technology Conference (R10-HTC 2023), 2023; pp. 1095–1099. [Google Scholar]
- Reduan, A.; Sani, M.M.; Kutty, S.B.; Isa, N.M.; Yusof, Y. Design of an IoT water quality monitoring system for tropical fish aquaculture. International Journal of Academic Research in Business and Social Sciences 2021, 11, 173–183. [Google Scholar] [CrossRef] [PubMed]
- Syed Taha, S.N.; Abu Talip, M.S.; Mohamad, M.; Azizul Hasan, Z.H.; Tengku Mohmed Noor Izam, T.F. Evaluation of LoRa network performance for water quality monitoring systems. Applied Sciences 2024, 14, 7136. [Google Scholar] [CrossRef]
- Fitriansyah, A.; Nugroho, R.A.; Meitarice, S. Water quality monitoring and control system for fish farmers based on Internet of Things. Ingénierie des Systèmes d’Information 2024, 29, 1107–1113. [Google Scholar] [CrossRef]
- Nagothu, S.K.; Bindu Sri, P.; Anitha, G.; Vincent, S.; Kumar, O.P. Advancing aquaculture: Fuzzy logic-based water quality monitoring and maintenance system for precision aquaculture. Aquaculture International 2025, 33, 32. [Google Scholar] [CrossRef]
- Adi, D.P.; Yassir, M.; Purnama, I.; Ardi, I.; Wahyu, Y.; Mariana, L.; Novita, H.; Mahabror, D.; Zulkarnain, R.; Wirawan, A.; Prastiyono, Y.; Waryanto, N.; Santiko, A.; Patria, L.; Fatah, G.; Hidayat, A.; Nadhiroh, A.; Munthe, I.; Purnomo, M. Innovative monitoring of water environment in vaname shrimp farming based on LoRaWAN. Journal of Southwest Jiaotong University 2024, 59, 18. [Google Scholar] [CrossRef]
- Espeña, G.D.; Libao, F.J.D.; Von Jansen, G.; De Luna, N.A.P.U.; Mojica, A.J.N.; Rivera, M.D. Enhancing water quality control and monitoring in shrimp farms with LoRaWAN technology. In Proceedings of the IEEE 15th International Conference on Humanoid, Nanotechnology, Information Technology, Communication and Control, Environment, and Management (HNICEM 2023), 2023; pp. 1–6. [Google Scholar]
- Adi, P.D.P.; Ardi, I.; Plamonia, N.; Wahyu, Y.; Novita, H.; Mahabror, D.; Zulkarnain, R.; Wirawan, A.; Prastiyono, Y.; Waryanto, W.; et al. Analysis of IoT-LoRa to improve LoRa performance for vaname shrimp farming monitoring system. Jurnal Ilmiah Teknik Elektro Komputer dan Informatika 2024, 10, 99–122. [Google Scholar] [CrossRef]
- Ahmed, F.; Bijoy, M.H.I.; Hemal, H.R.; Noori, S.R.H. Smart aquaculture analytics: Enhancing shrimp farming in Bangladesh through real-time IoT monitoring and predictive machine learning analysis. Heliyon 2024, 10. [Google Scholar] [CrossRef]
- Chen, C.-H.; Wu, Y.-C.; Zhang, J.-X.; Chen, Y.-H. IoT-Based Fish Farm Water Quality Monitoring System. Sensors 2022, 22, 6700. [Google Scholar] [CrossRef] [PubMed]
- Jais, N.A.M.; Abdullah, A.F.; Kassim, M.S.M.; Abd Karim, M.M.; Muhadi, N.-A.; et al. Improved Accuracy in IoT-Based Water Quality Monitoring for Aquaculture Tanks Using Low-Cost Sensors: Asian Seabass Fish Farming. Heliyon 2024, 10. [Google Scholar]
- Al Mamun, M.R.; Ashik-E-Rabbani, M.; Haque, M.M.; Upoma, S.M. IoT-Based Real-Time Biofloc Monitoring and Controlling System. Smart Agricultural Technology 2024, 9, 100598. [Google Scholar] [CrossRef]
- Zuhaer, A.; Khandoker, A.; Enayet, N.; Partha, P.K.P.; Awal, M.A. Sustainable Aquaculture: An IoT-Integrated System for Real-Time Water Quality Monitoring Featuring Advanced DO and Ammonia Sensors. Aquacultural Engineering 2025, 102620. [Google Scholar] [CrossRef]
- Georgantas, I.; Mitropoulos, S.; Katsoulis, S.; Chronis, I.; Christakis, I. Integrated Low-Cost Water Quality Monitoring System Based on LoRa Network. Electronics 2025, 14, 857. [Google Scholar] [CrossRef]
- Flores-Iwasaki, M.; Guadalupe, G.A.; Pachas-Caycho, M.; Chapa-Gonza, S.; Mori-Zabarburú, R.C.; Guerrero-Abad, J.C. Internet of Things (IoT) Sensors for Water Quality Monitoring in Aquaculture Systems: A Systematic Review and Bibliometric Analysis. AgriEngineering 2025, 7, 78. [Google Scholar] [CrossRef]
- Food and Agriculture Organization of the United Nations. Oreochromis niloticus (Nile Tilapia): Cultured Aquatic Species Information Programme; FAO Fisheries & Aquaculture Division: Rome, Italy, 2023; Available online: https://www.fao.org/fishery/culturedspecies/oreochromis_niloticus (accessed on 20 January 2026).
- Abdel-Tawwab, M.; Hagras, A.E.; Elbaghdady, H.A.M.; Monier, M.N. Dissolved Oxygen Level and Stocking Density Effects on Growth, Feed Utilization, Physiology, and Innate Immunity of Nile Tilapia, Oreochromis niloticus. Journal of Applied Aquaculture 2014, 26, 340–355. [Google Scholar] [CrossRef]
- El-Sayed, A.-F.M. Tilapia Culture; Academic Press: London, UK, 2019. [Google Scholar]
- Boyd, C.E. Water Quality: An Introduction; Springer Science & Business Media: New York, NY, USA, 2000. [Google Scholar]
- Azaza, M.S.; Dhraïef, M.N.; Kraïem, M.M. Effects of Water Temperature on Growth and Sex Ratio of Juvenile Nile Tilapia, Oreochromis niloticus (Linnaeus), Reared in Geothermal Waters in Southern Tunisia. Journal of Thermal Biology 2008, 33, 98–105. [Google Scholar] [CrossRef]
- Likert, R. A Technique for the Measurement of Attitudes. Arch. Psychol. 1932, 22, 55. [Google Scholar]
- Field, A. Discovering Statistics Using IBM SPSS Statistics, 4th ed.; SAGE: Thousand Oaks, CA, USA, 2013. [Google Scholar]
- Azhar Muzafar, M.I.Z.; Mohd Ali, A.; Zulkifli, S. A Study on LoRa SX1276 Performance in IoT Health Monitoring. Wireless Communications and Mobile Computing 2022, 2022, 6066354. [Google Scholar] [CrossRef]
- The Things Network. RSSI and SNR. The Things Network Documentation, 2023. Available online: https://www.thethingsnetwork.org/docs/lorawan/rssi-and-snr/ (accessed on 23 January 2026).
Figure 1.
The system architecture.
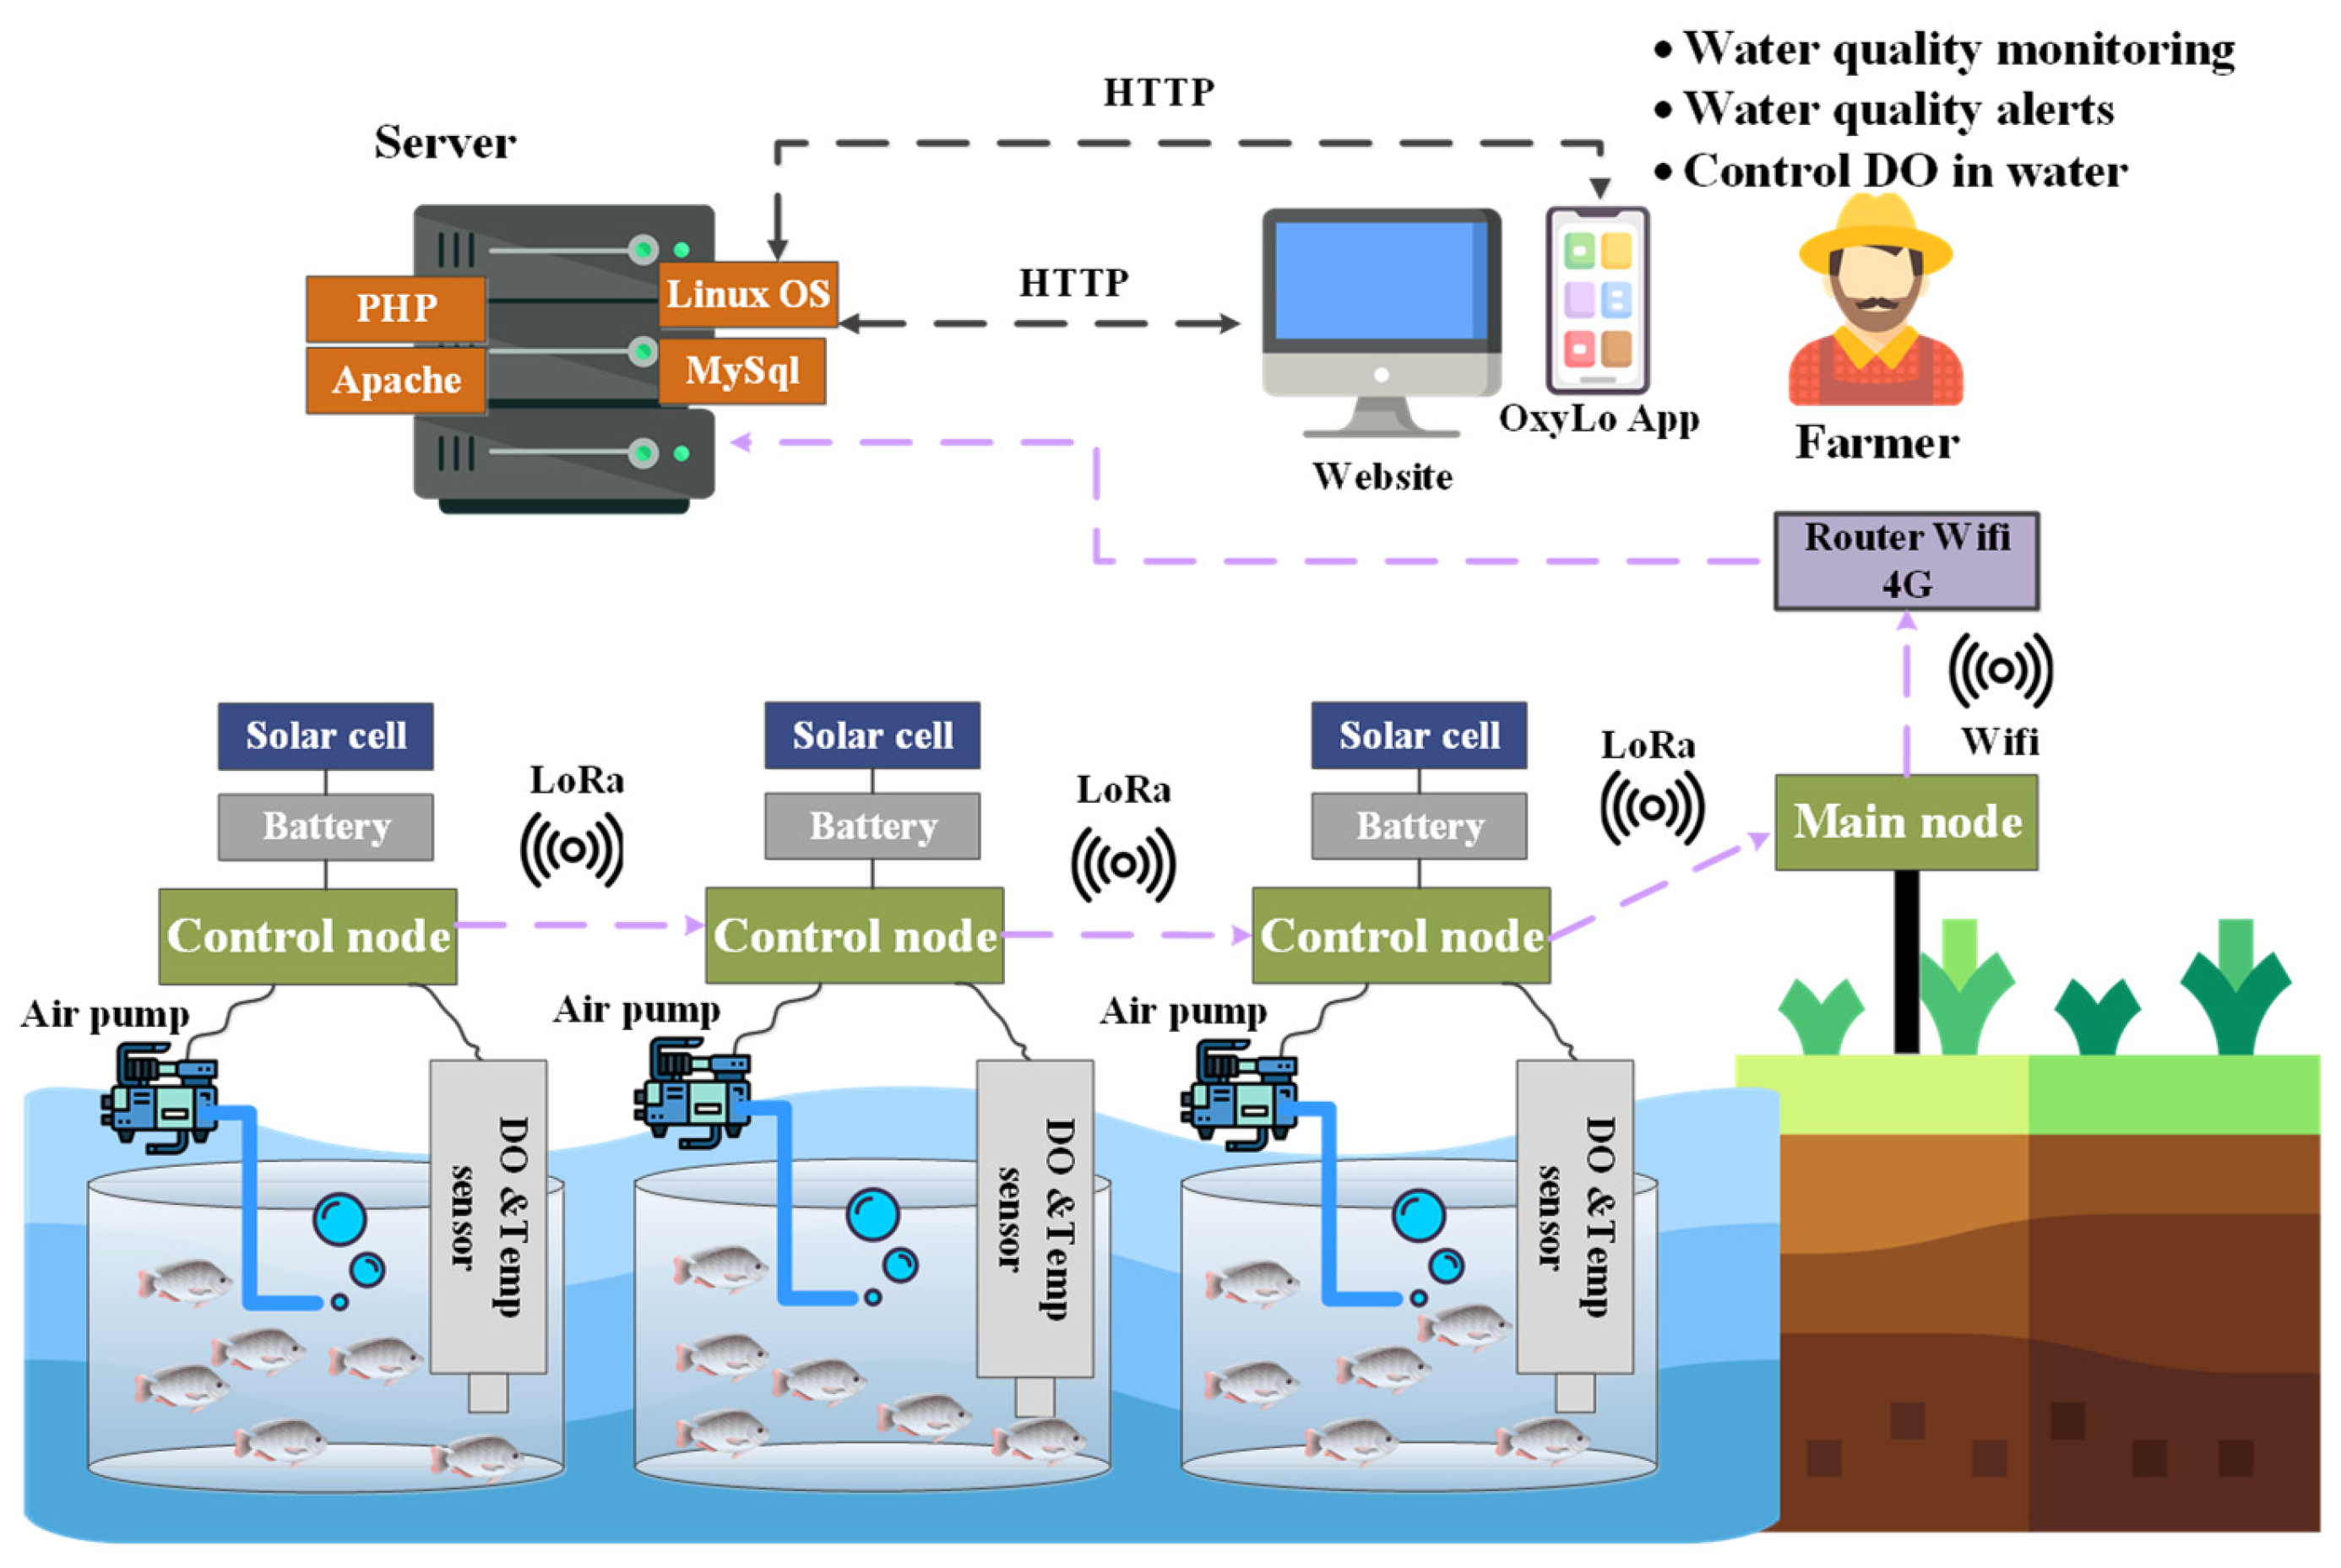
Figure 2.
The control node circuit.
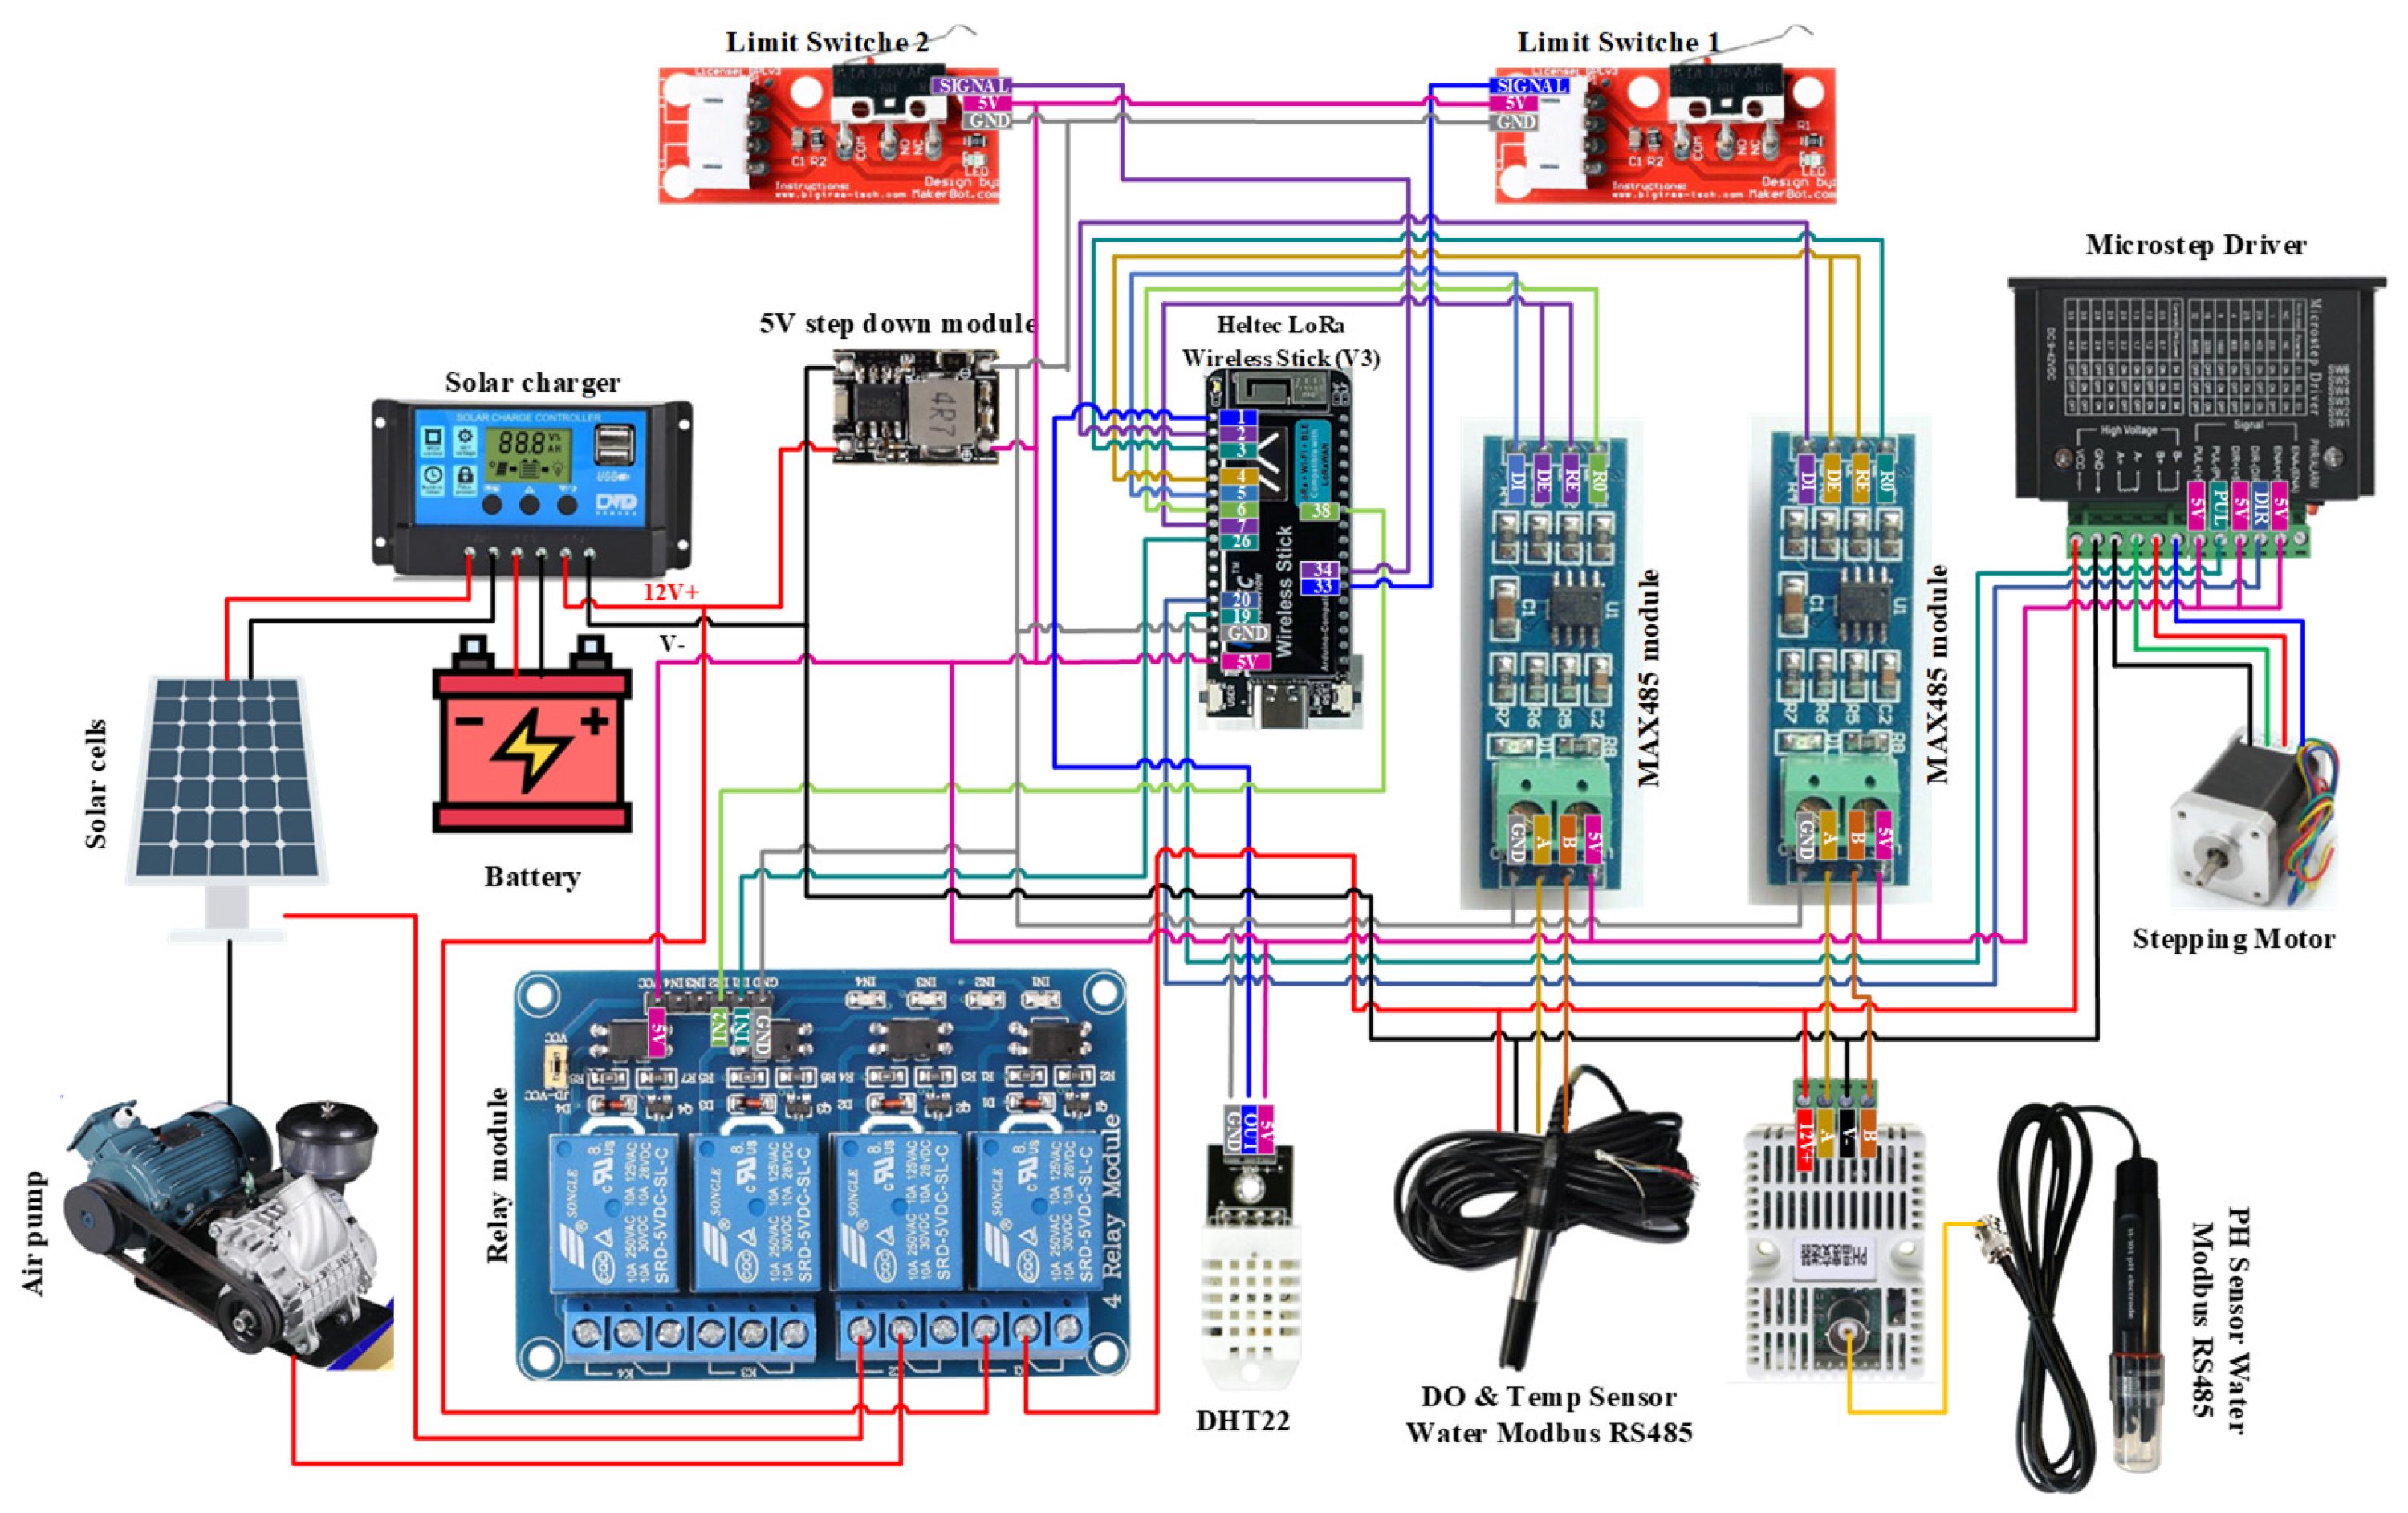
Figure 3.
The main node circuit.
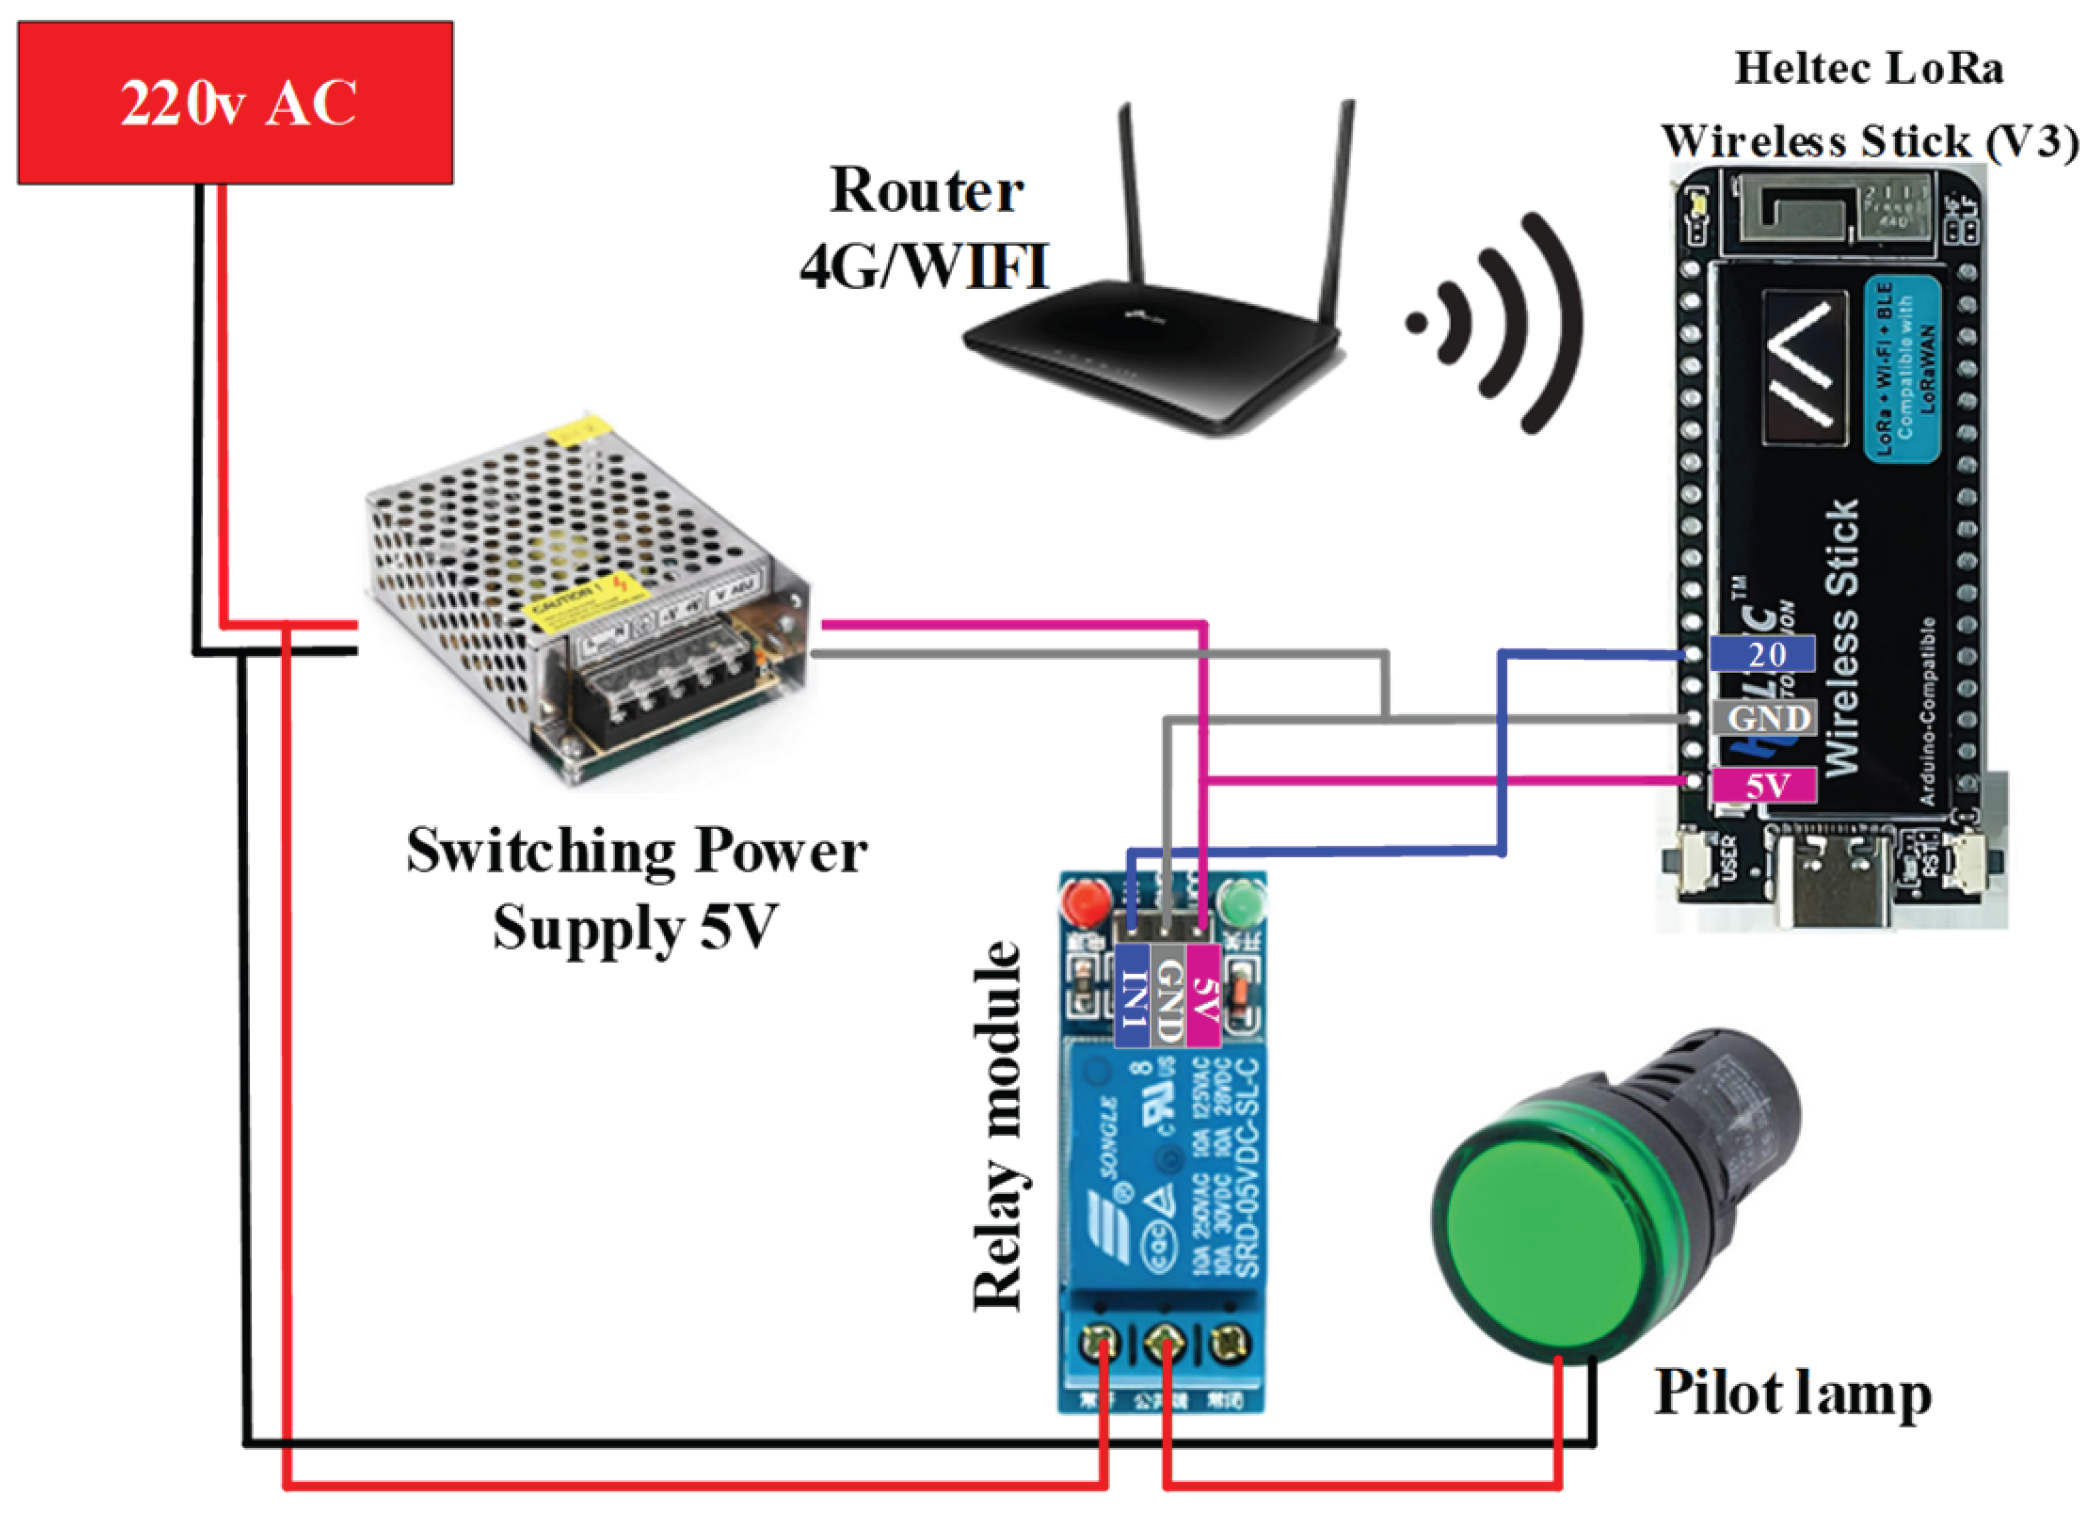
Figure 4.
Flowchart of the control node program.
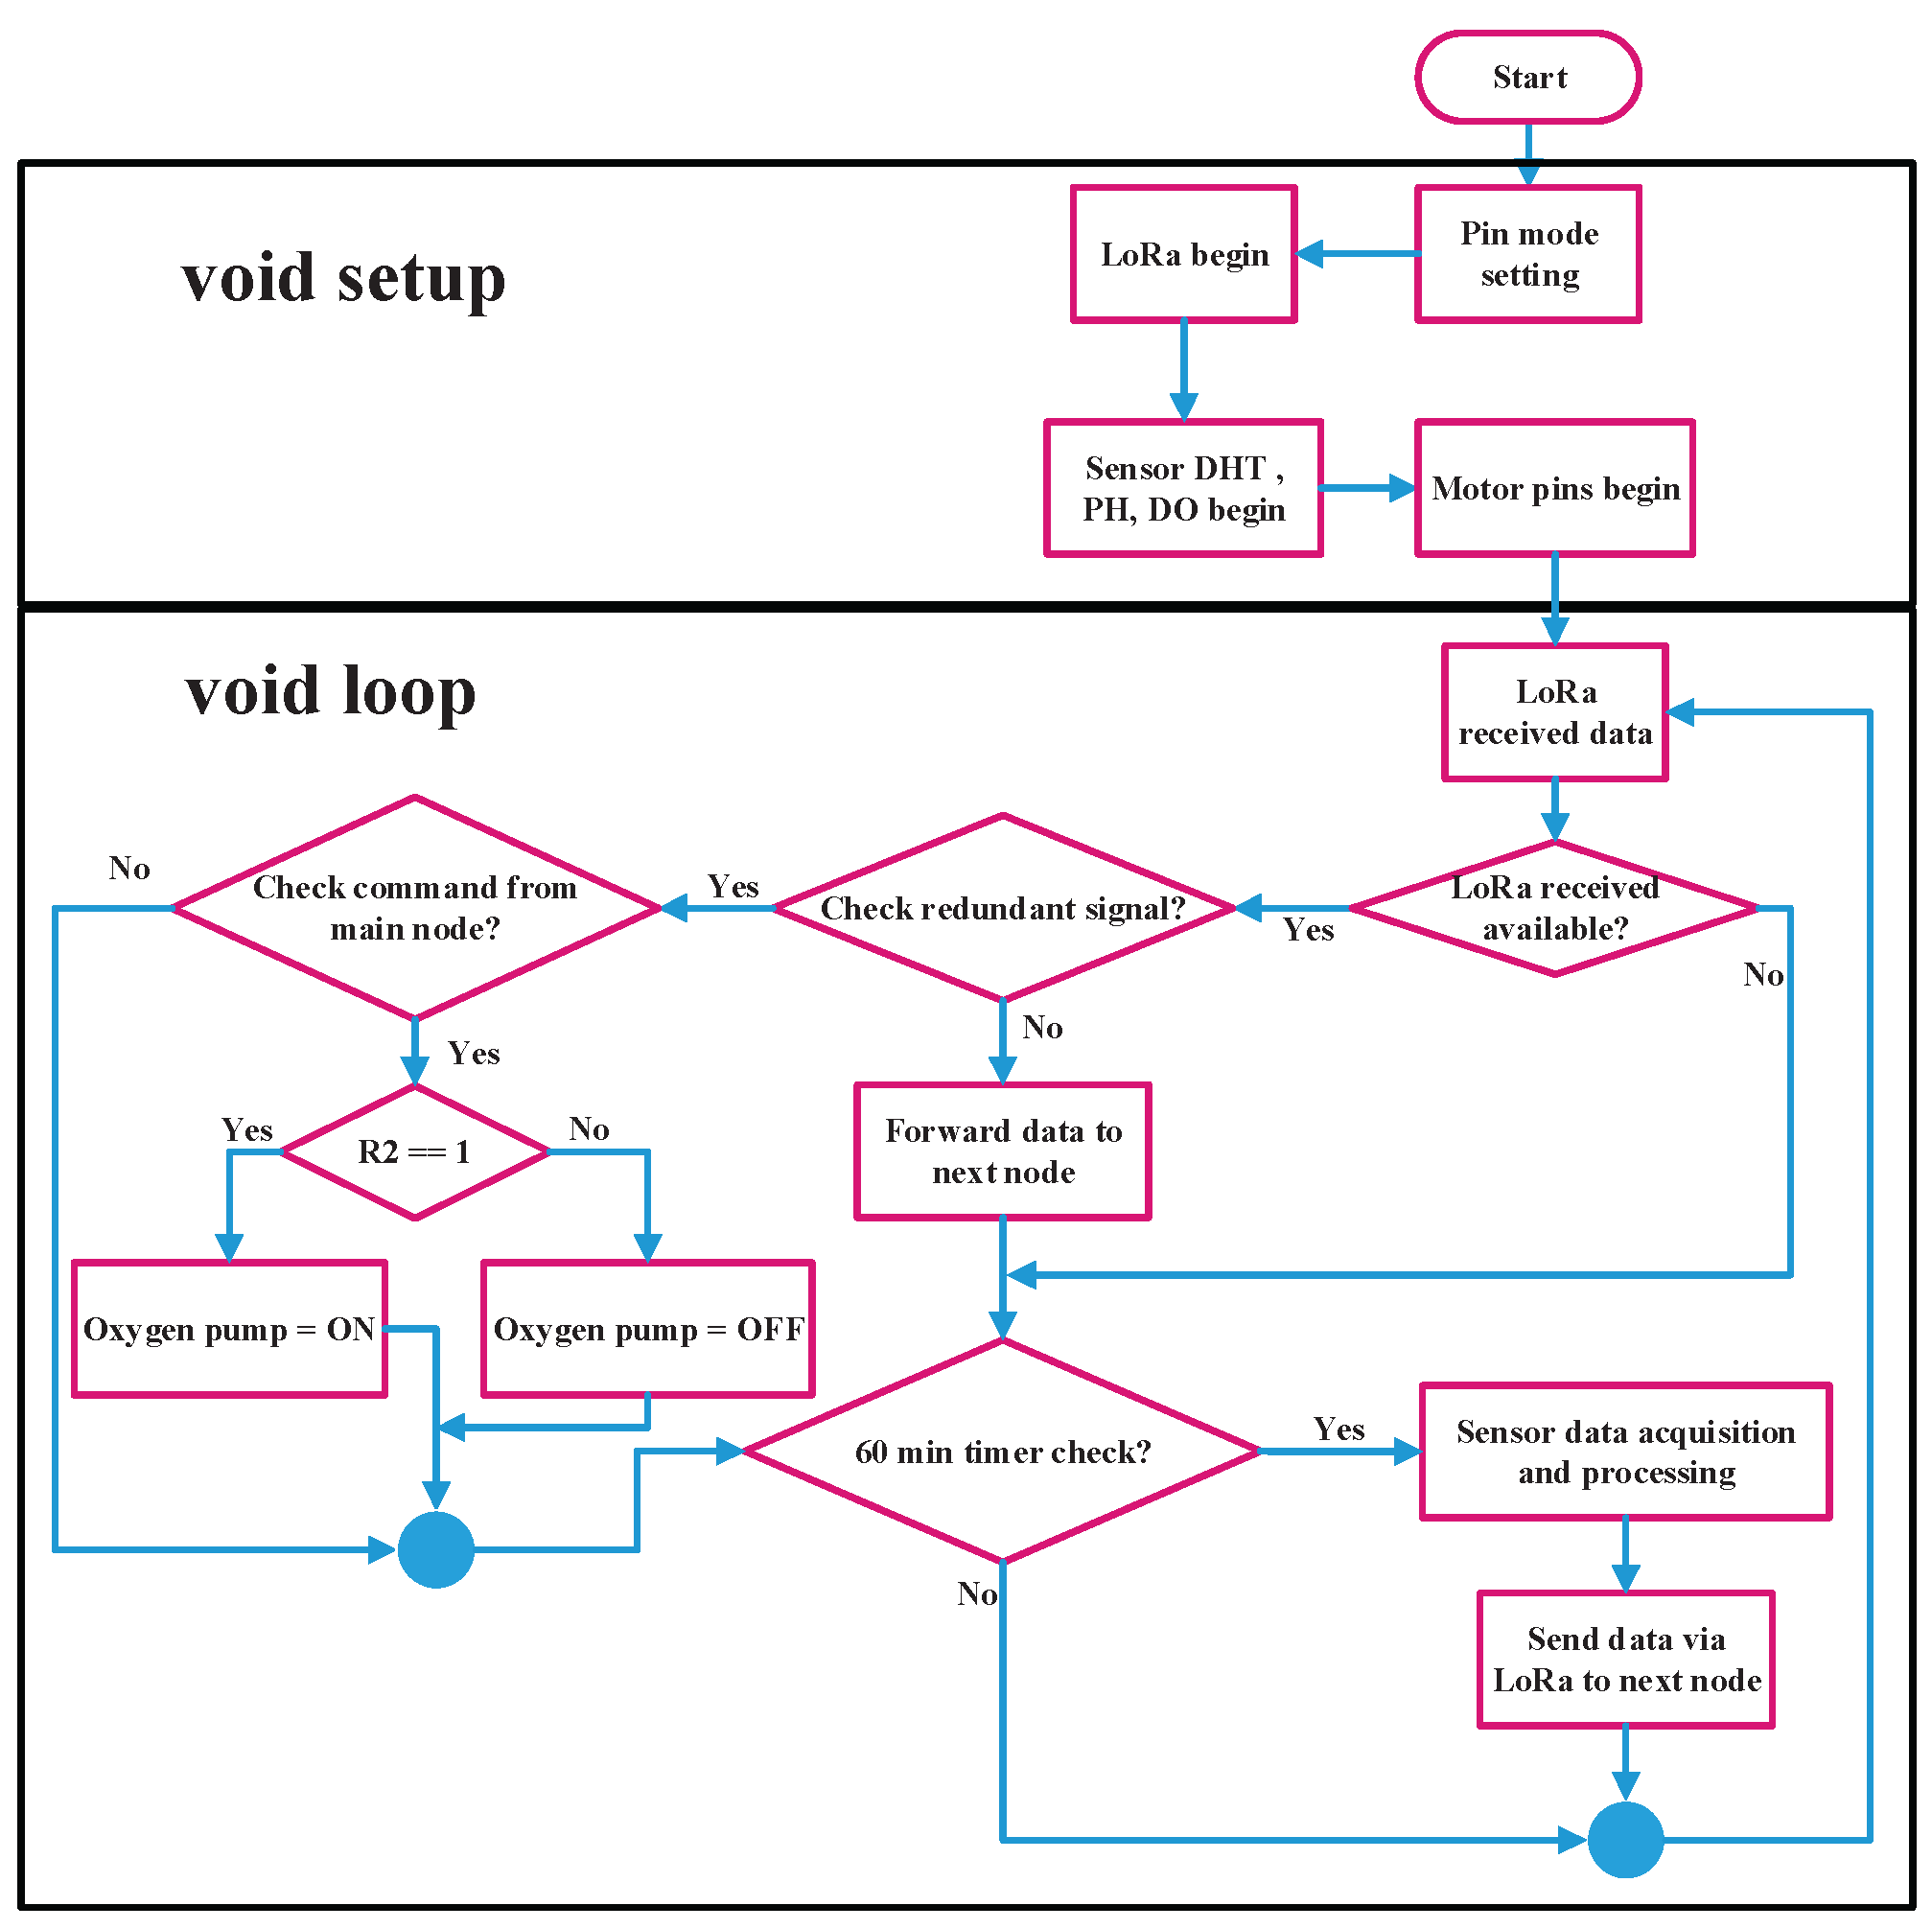
Figure 5.
Flowchart of the sensor data acquisition and processing.
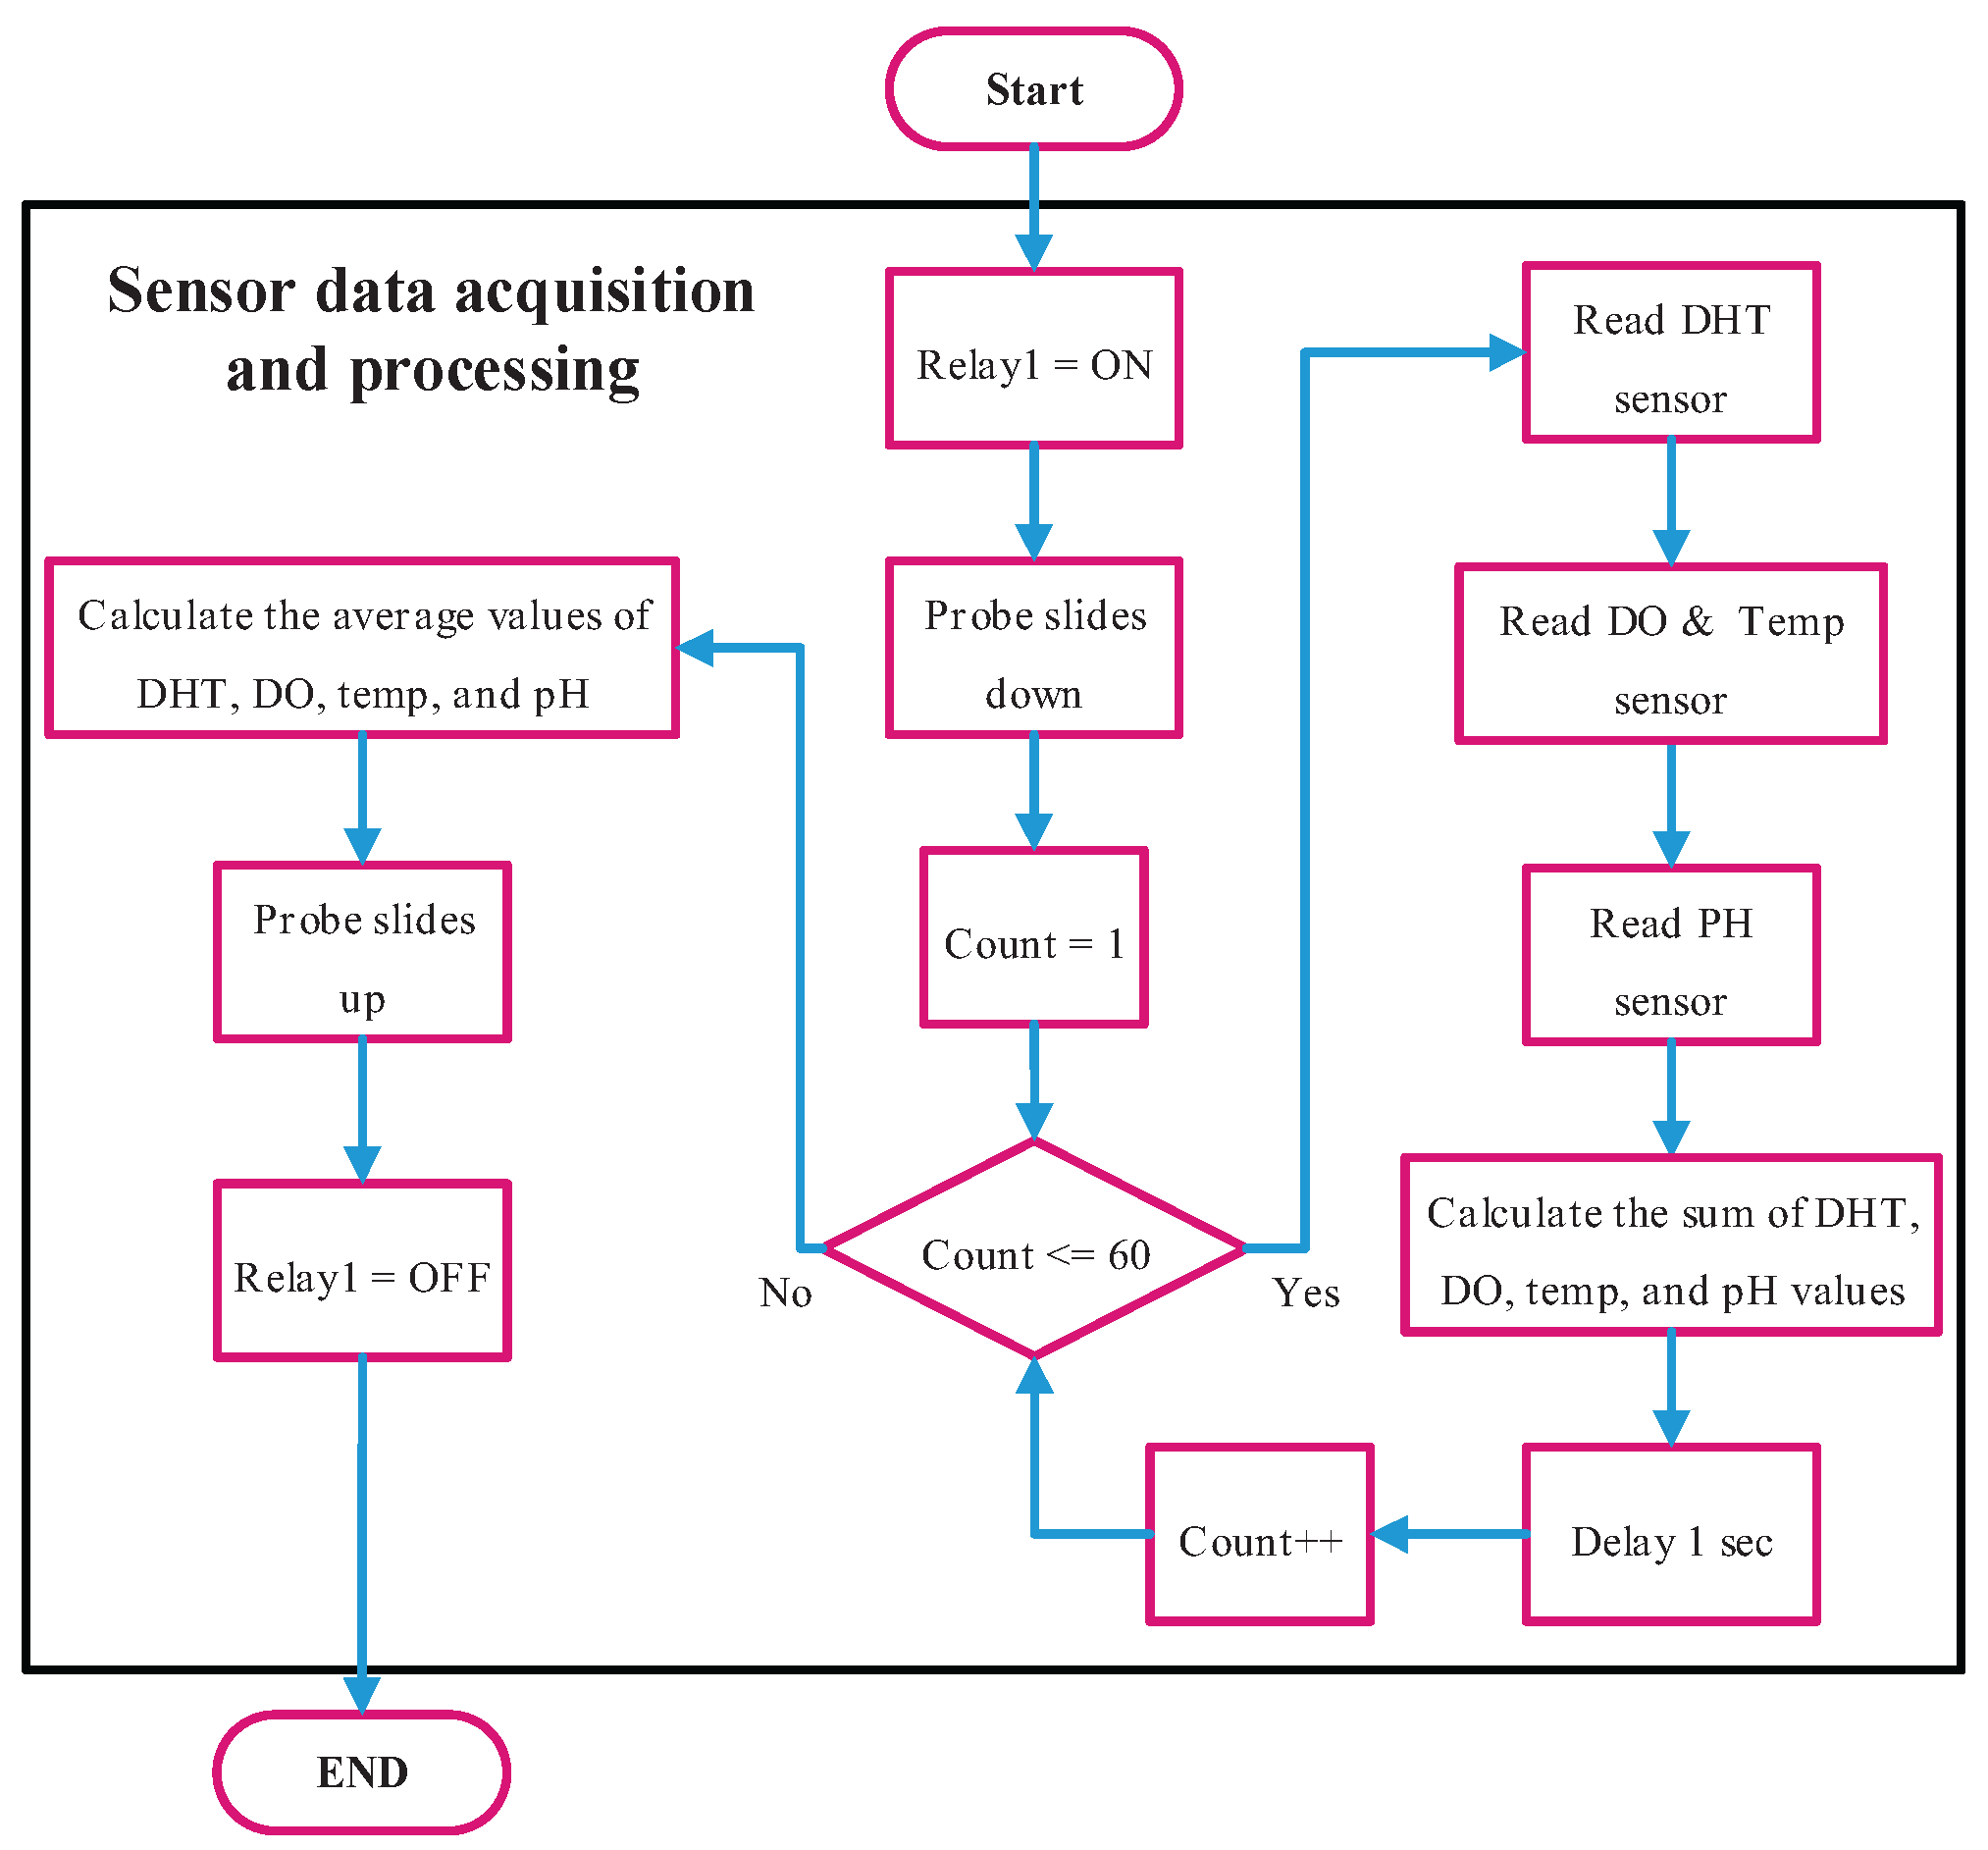
Figure 6.
Flowchart of the main node program.
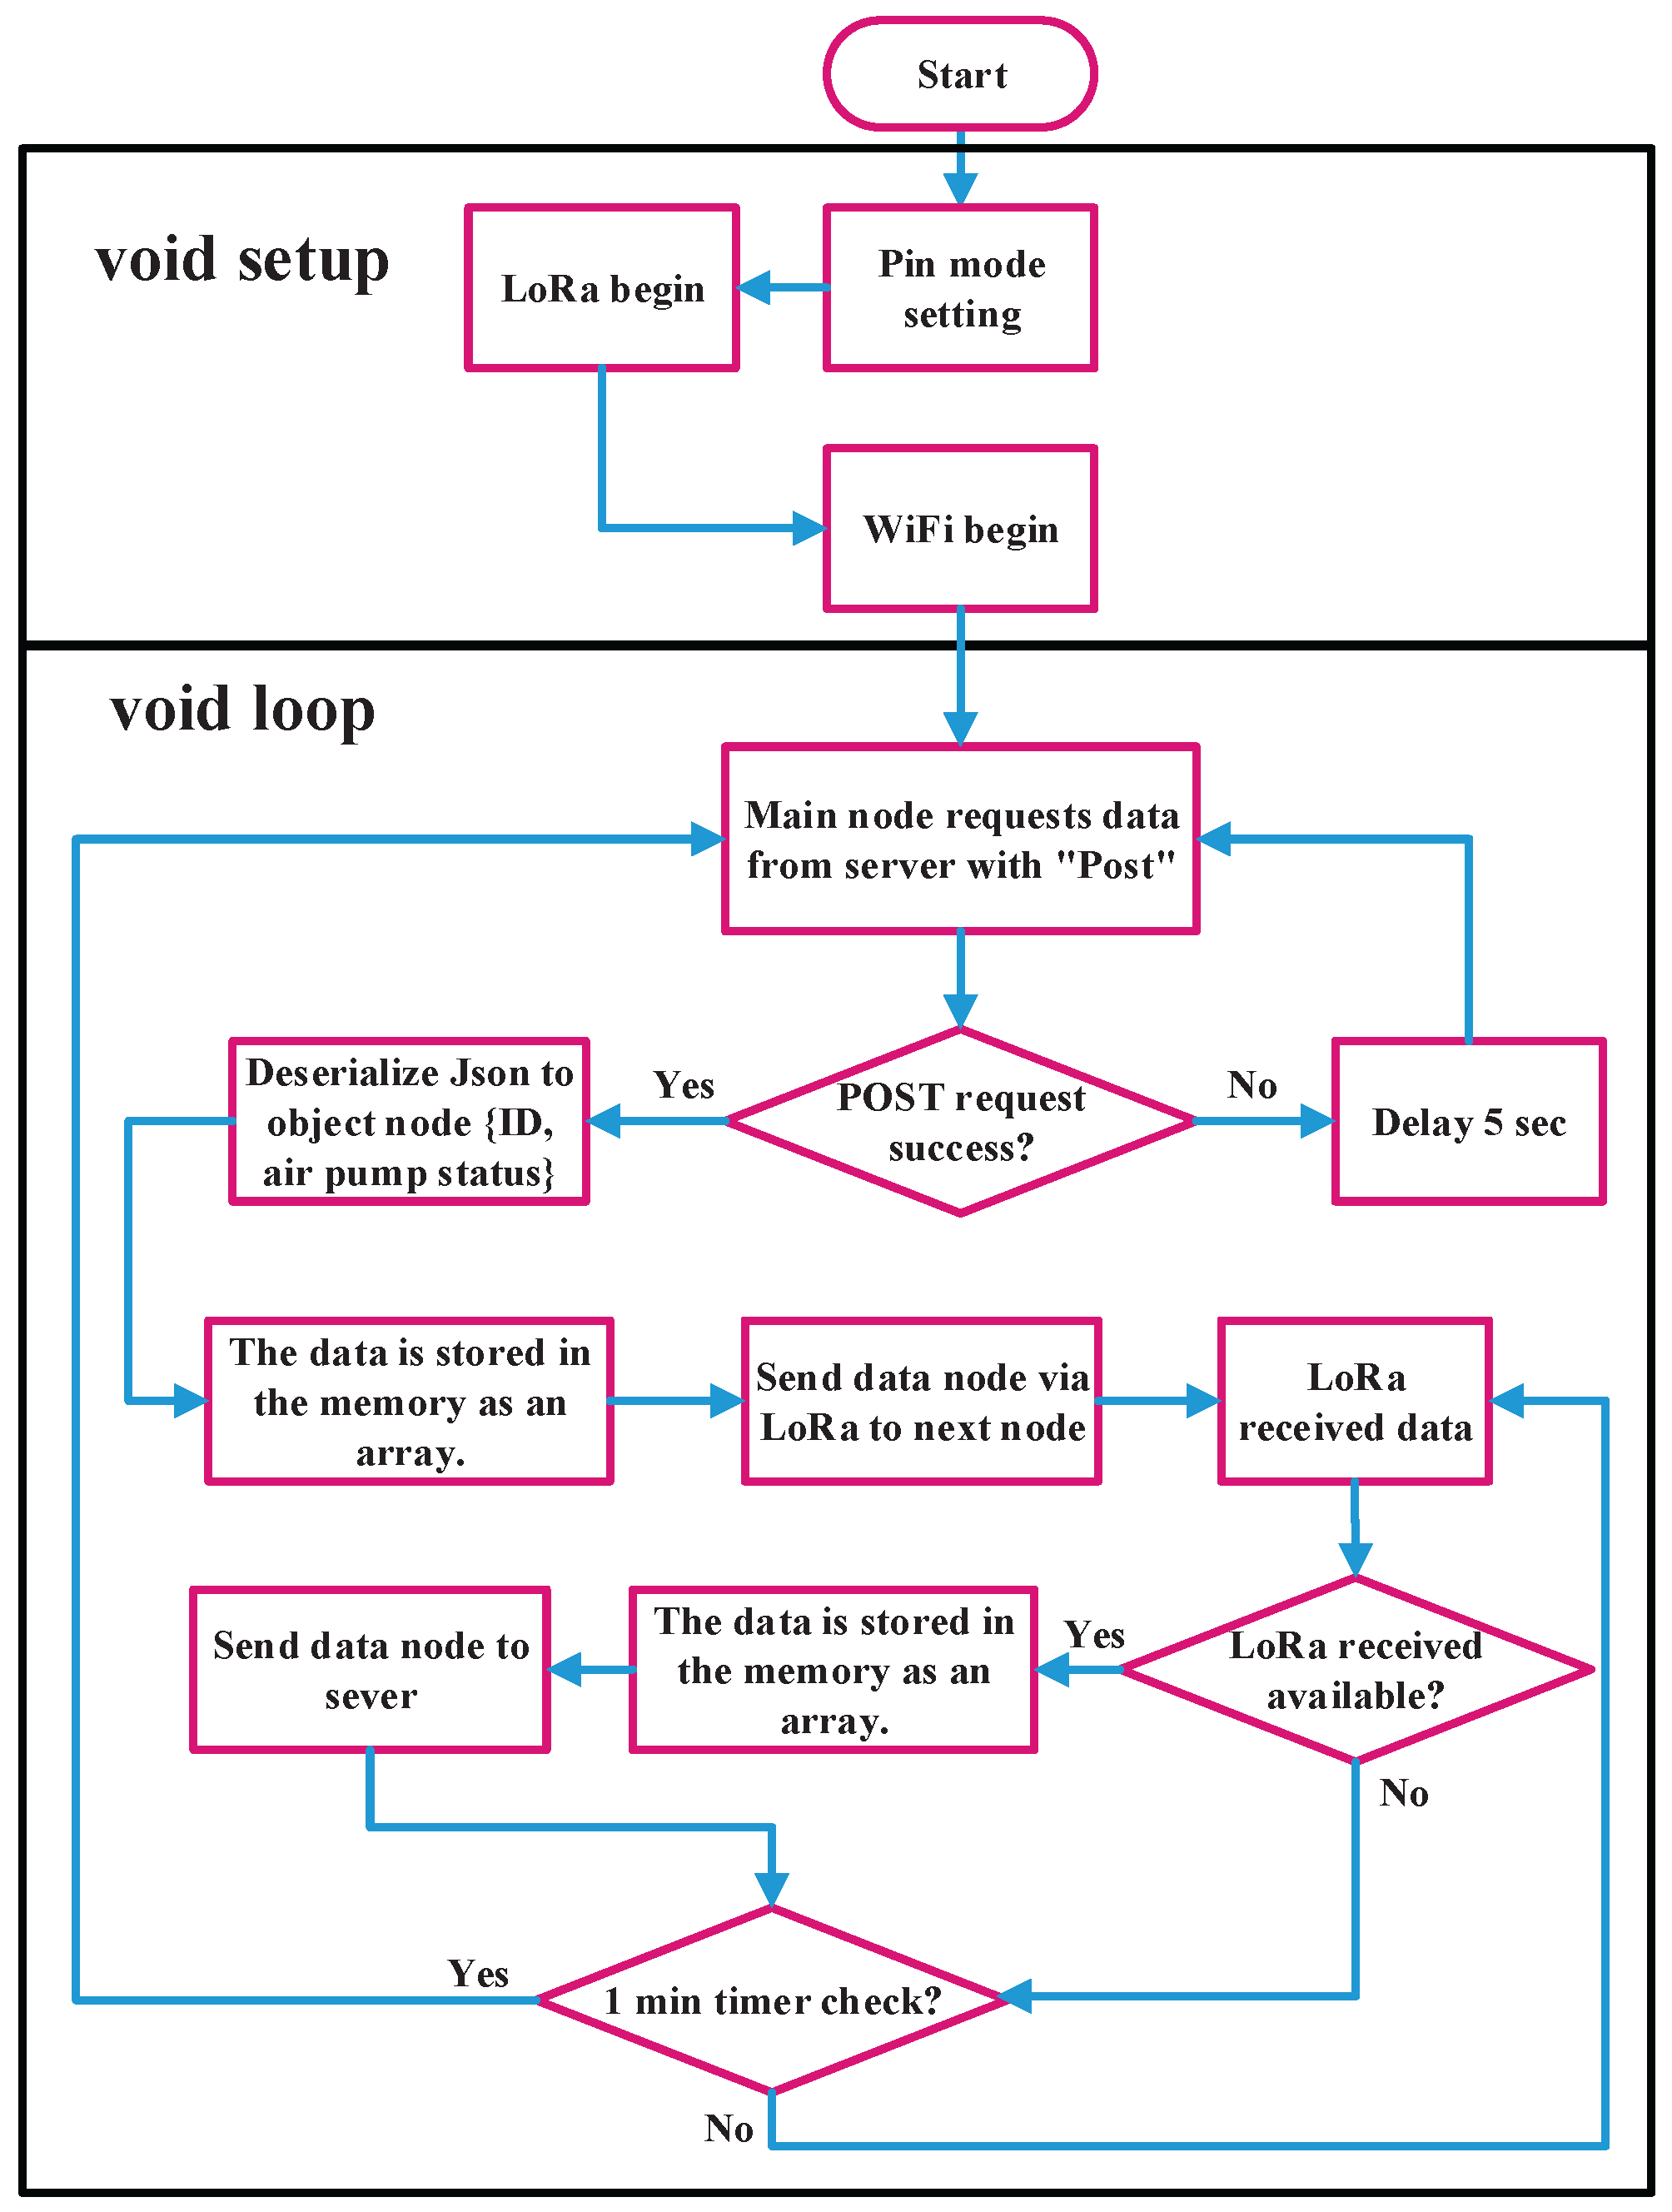
Figure 7.
Flowchart of the web backend.
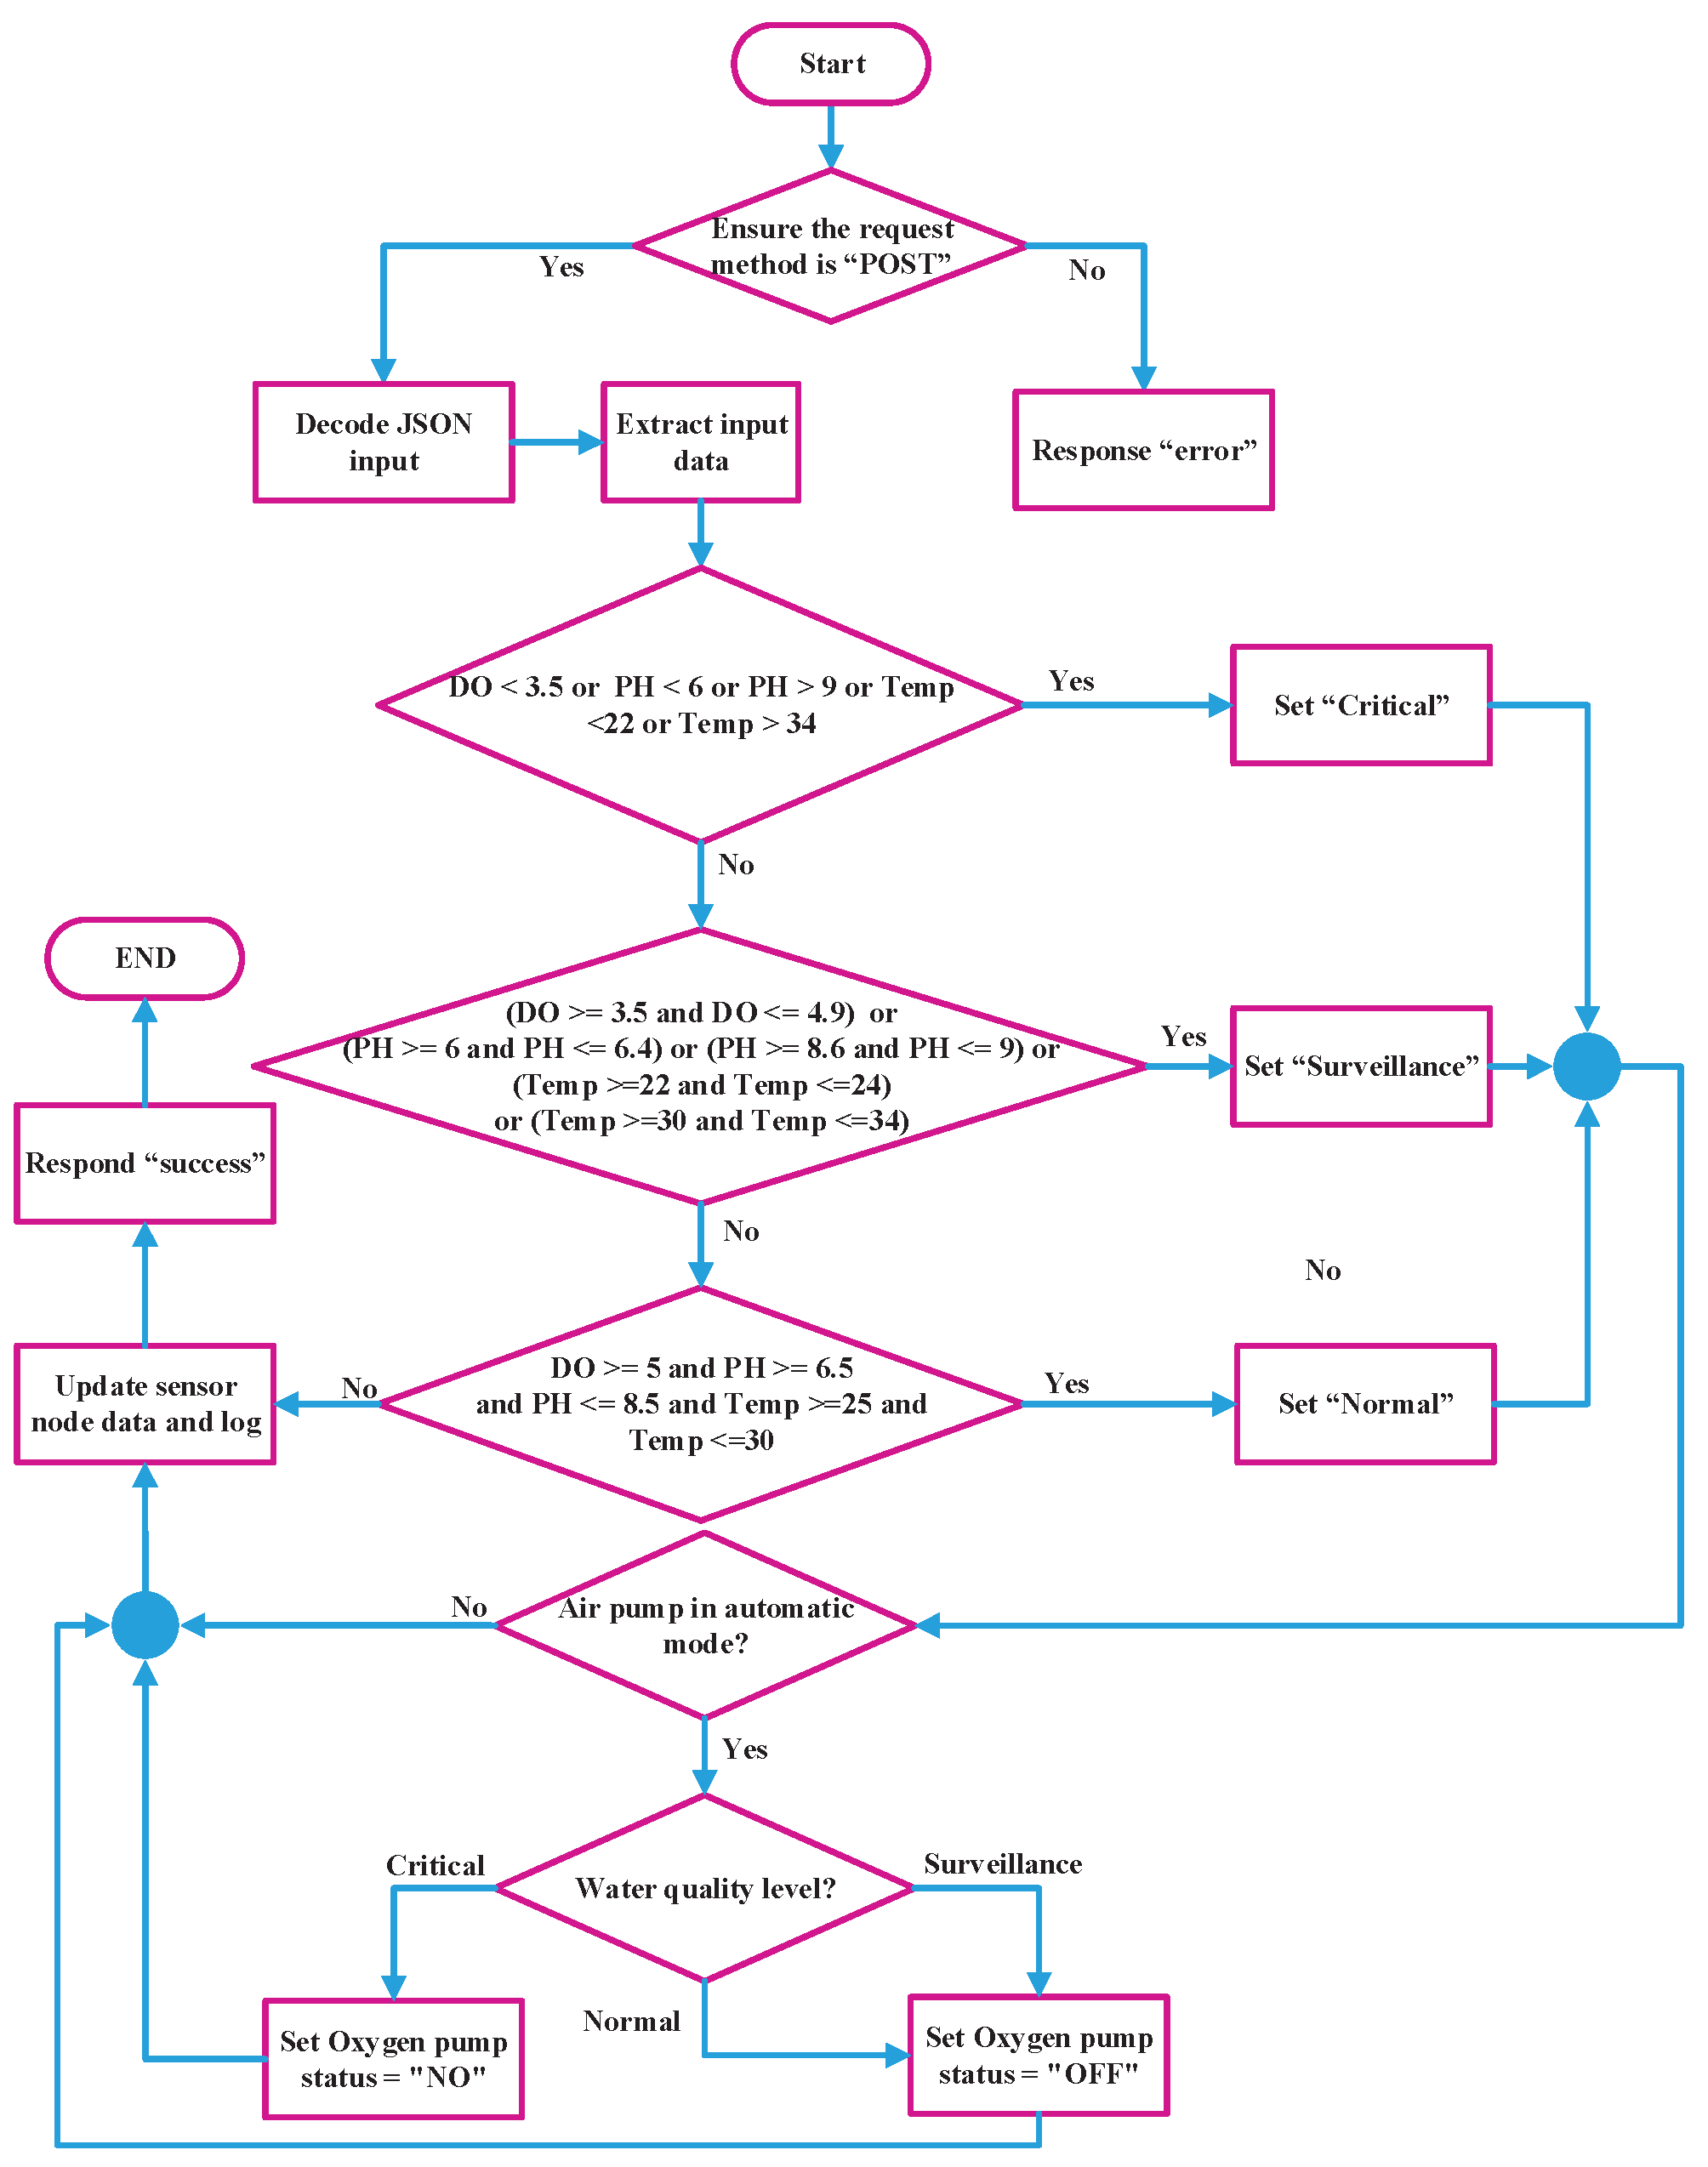
Figure 8.
Prototype and electronic circuit connections of the main node and control node cabinet.
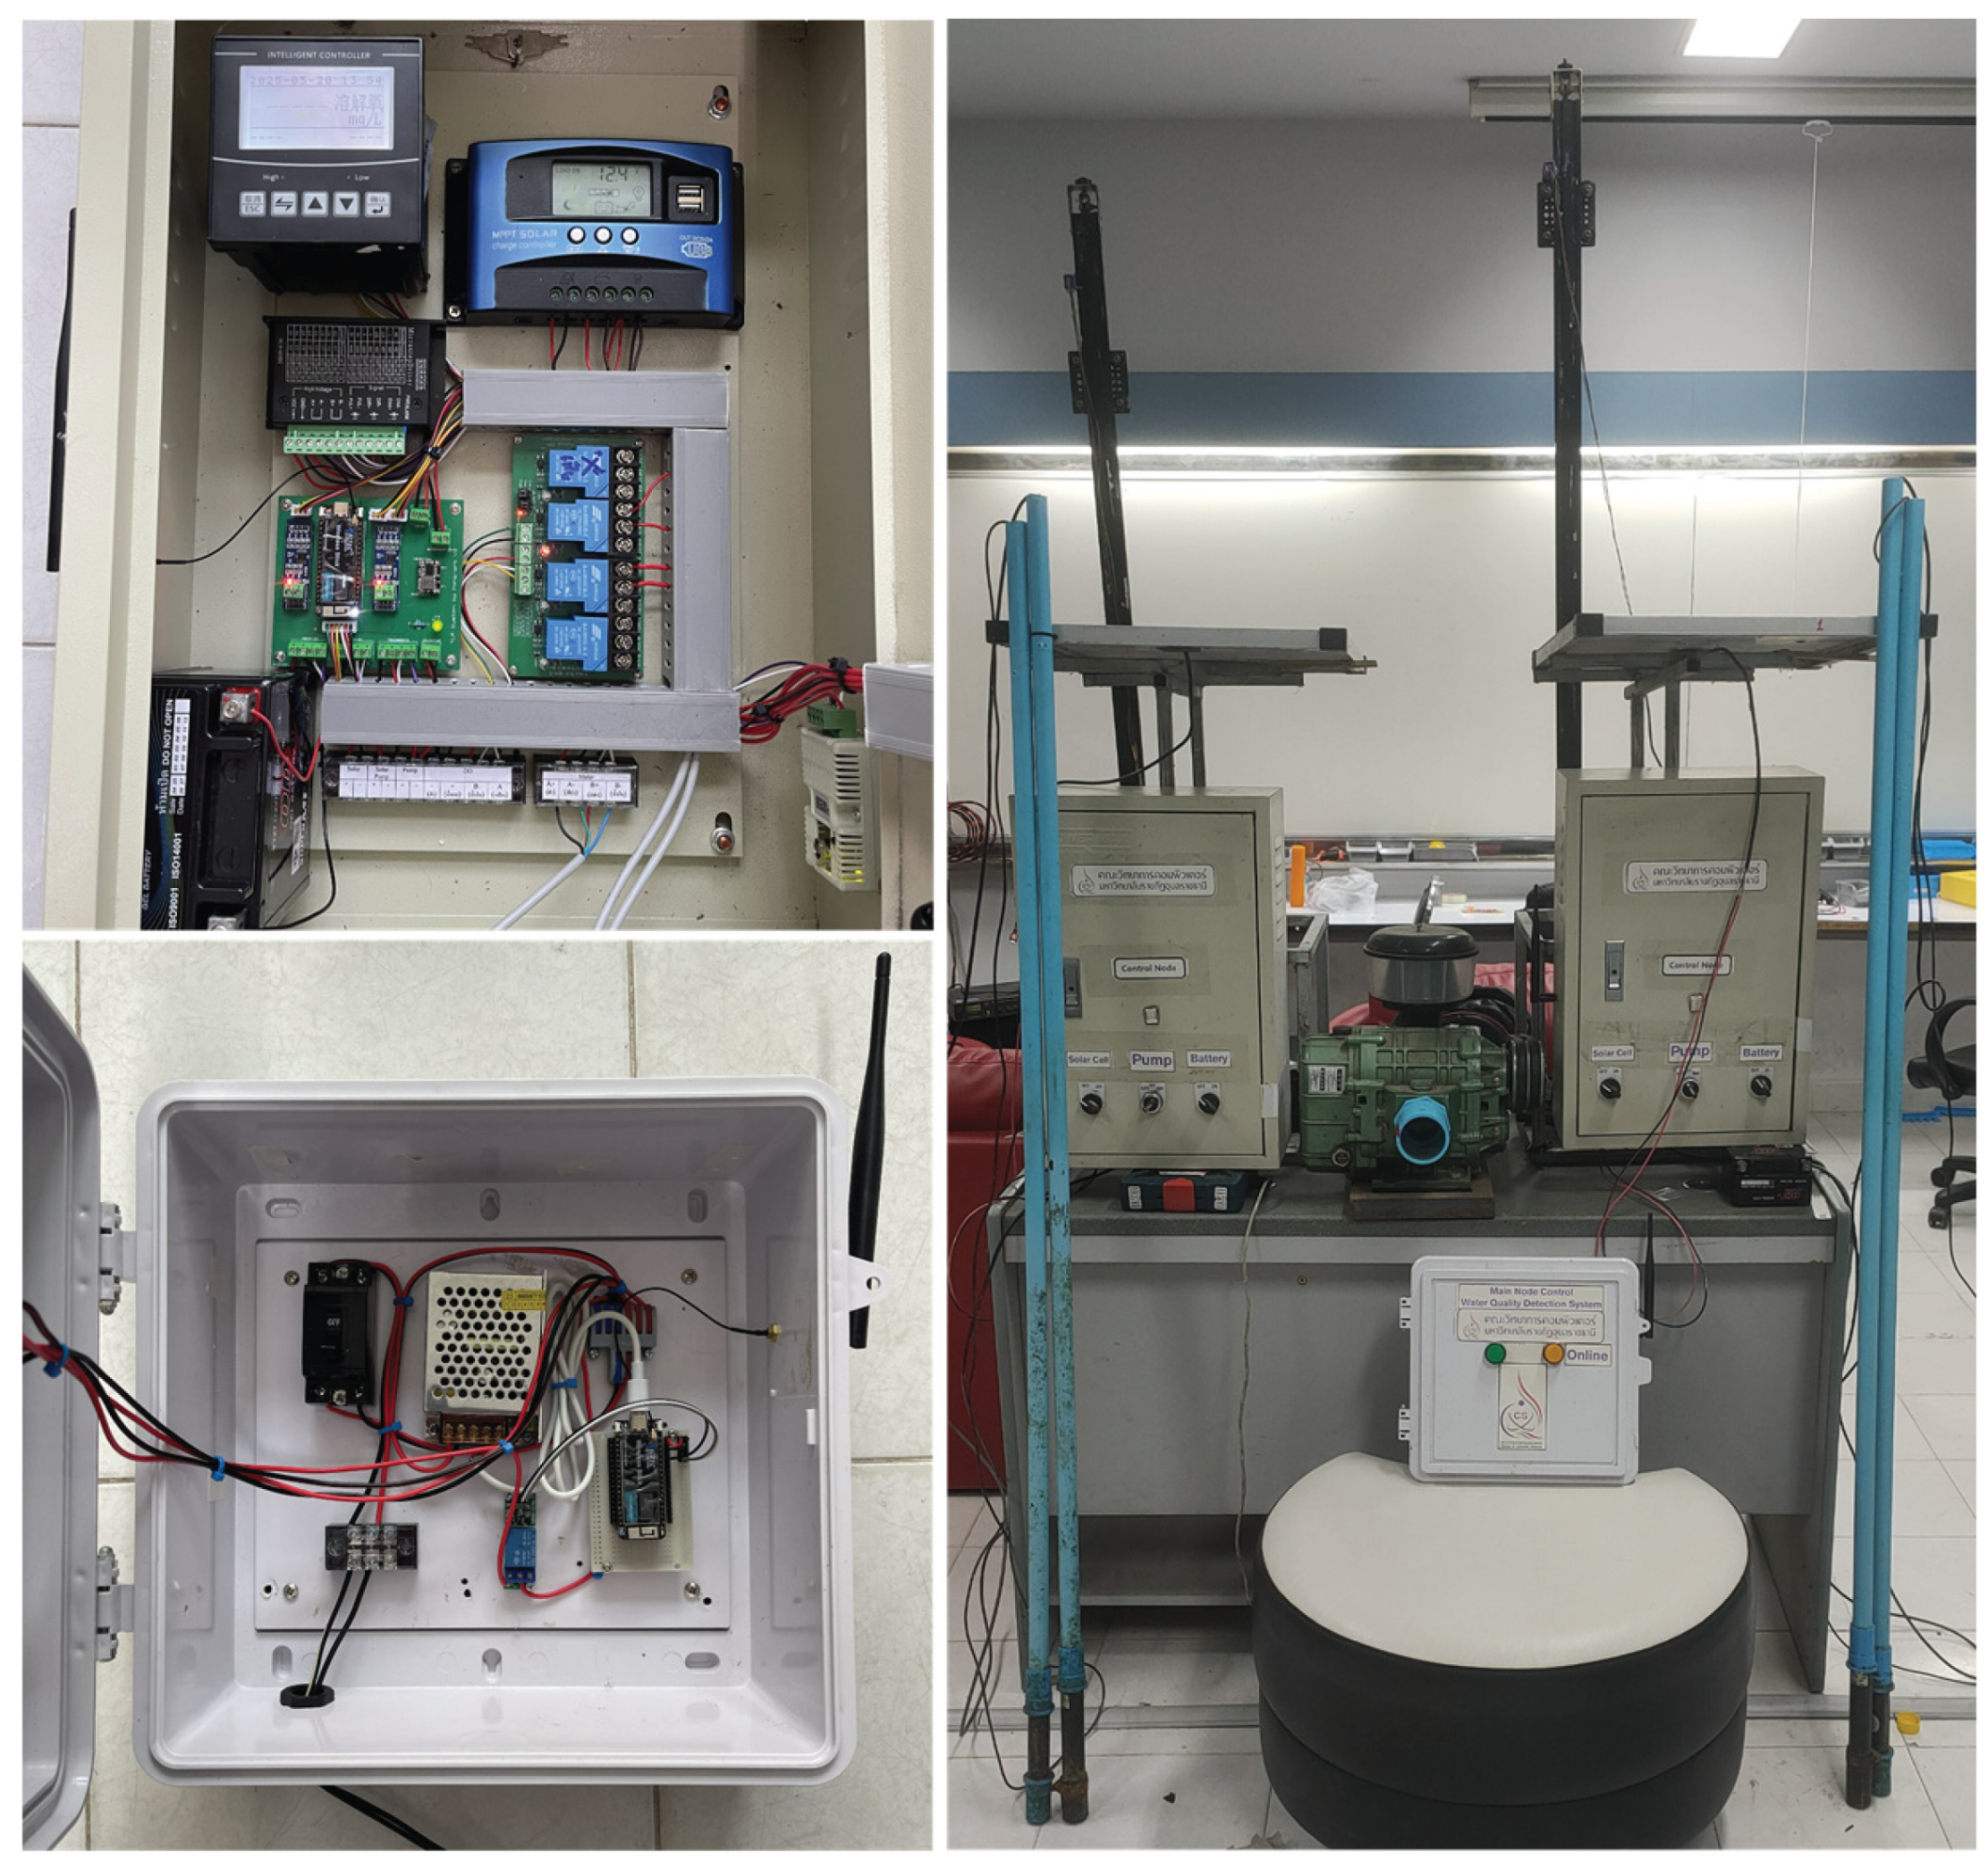
Figure 9.
Installing water quality control nodes.
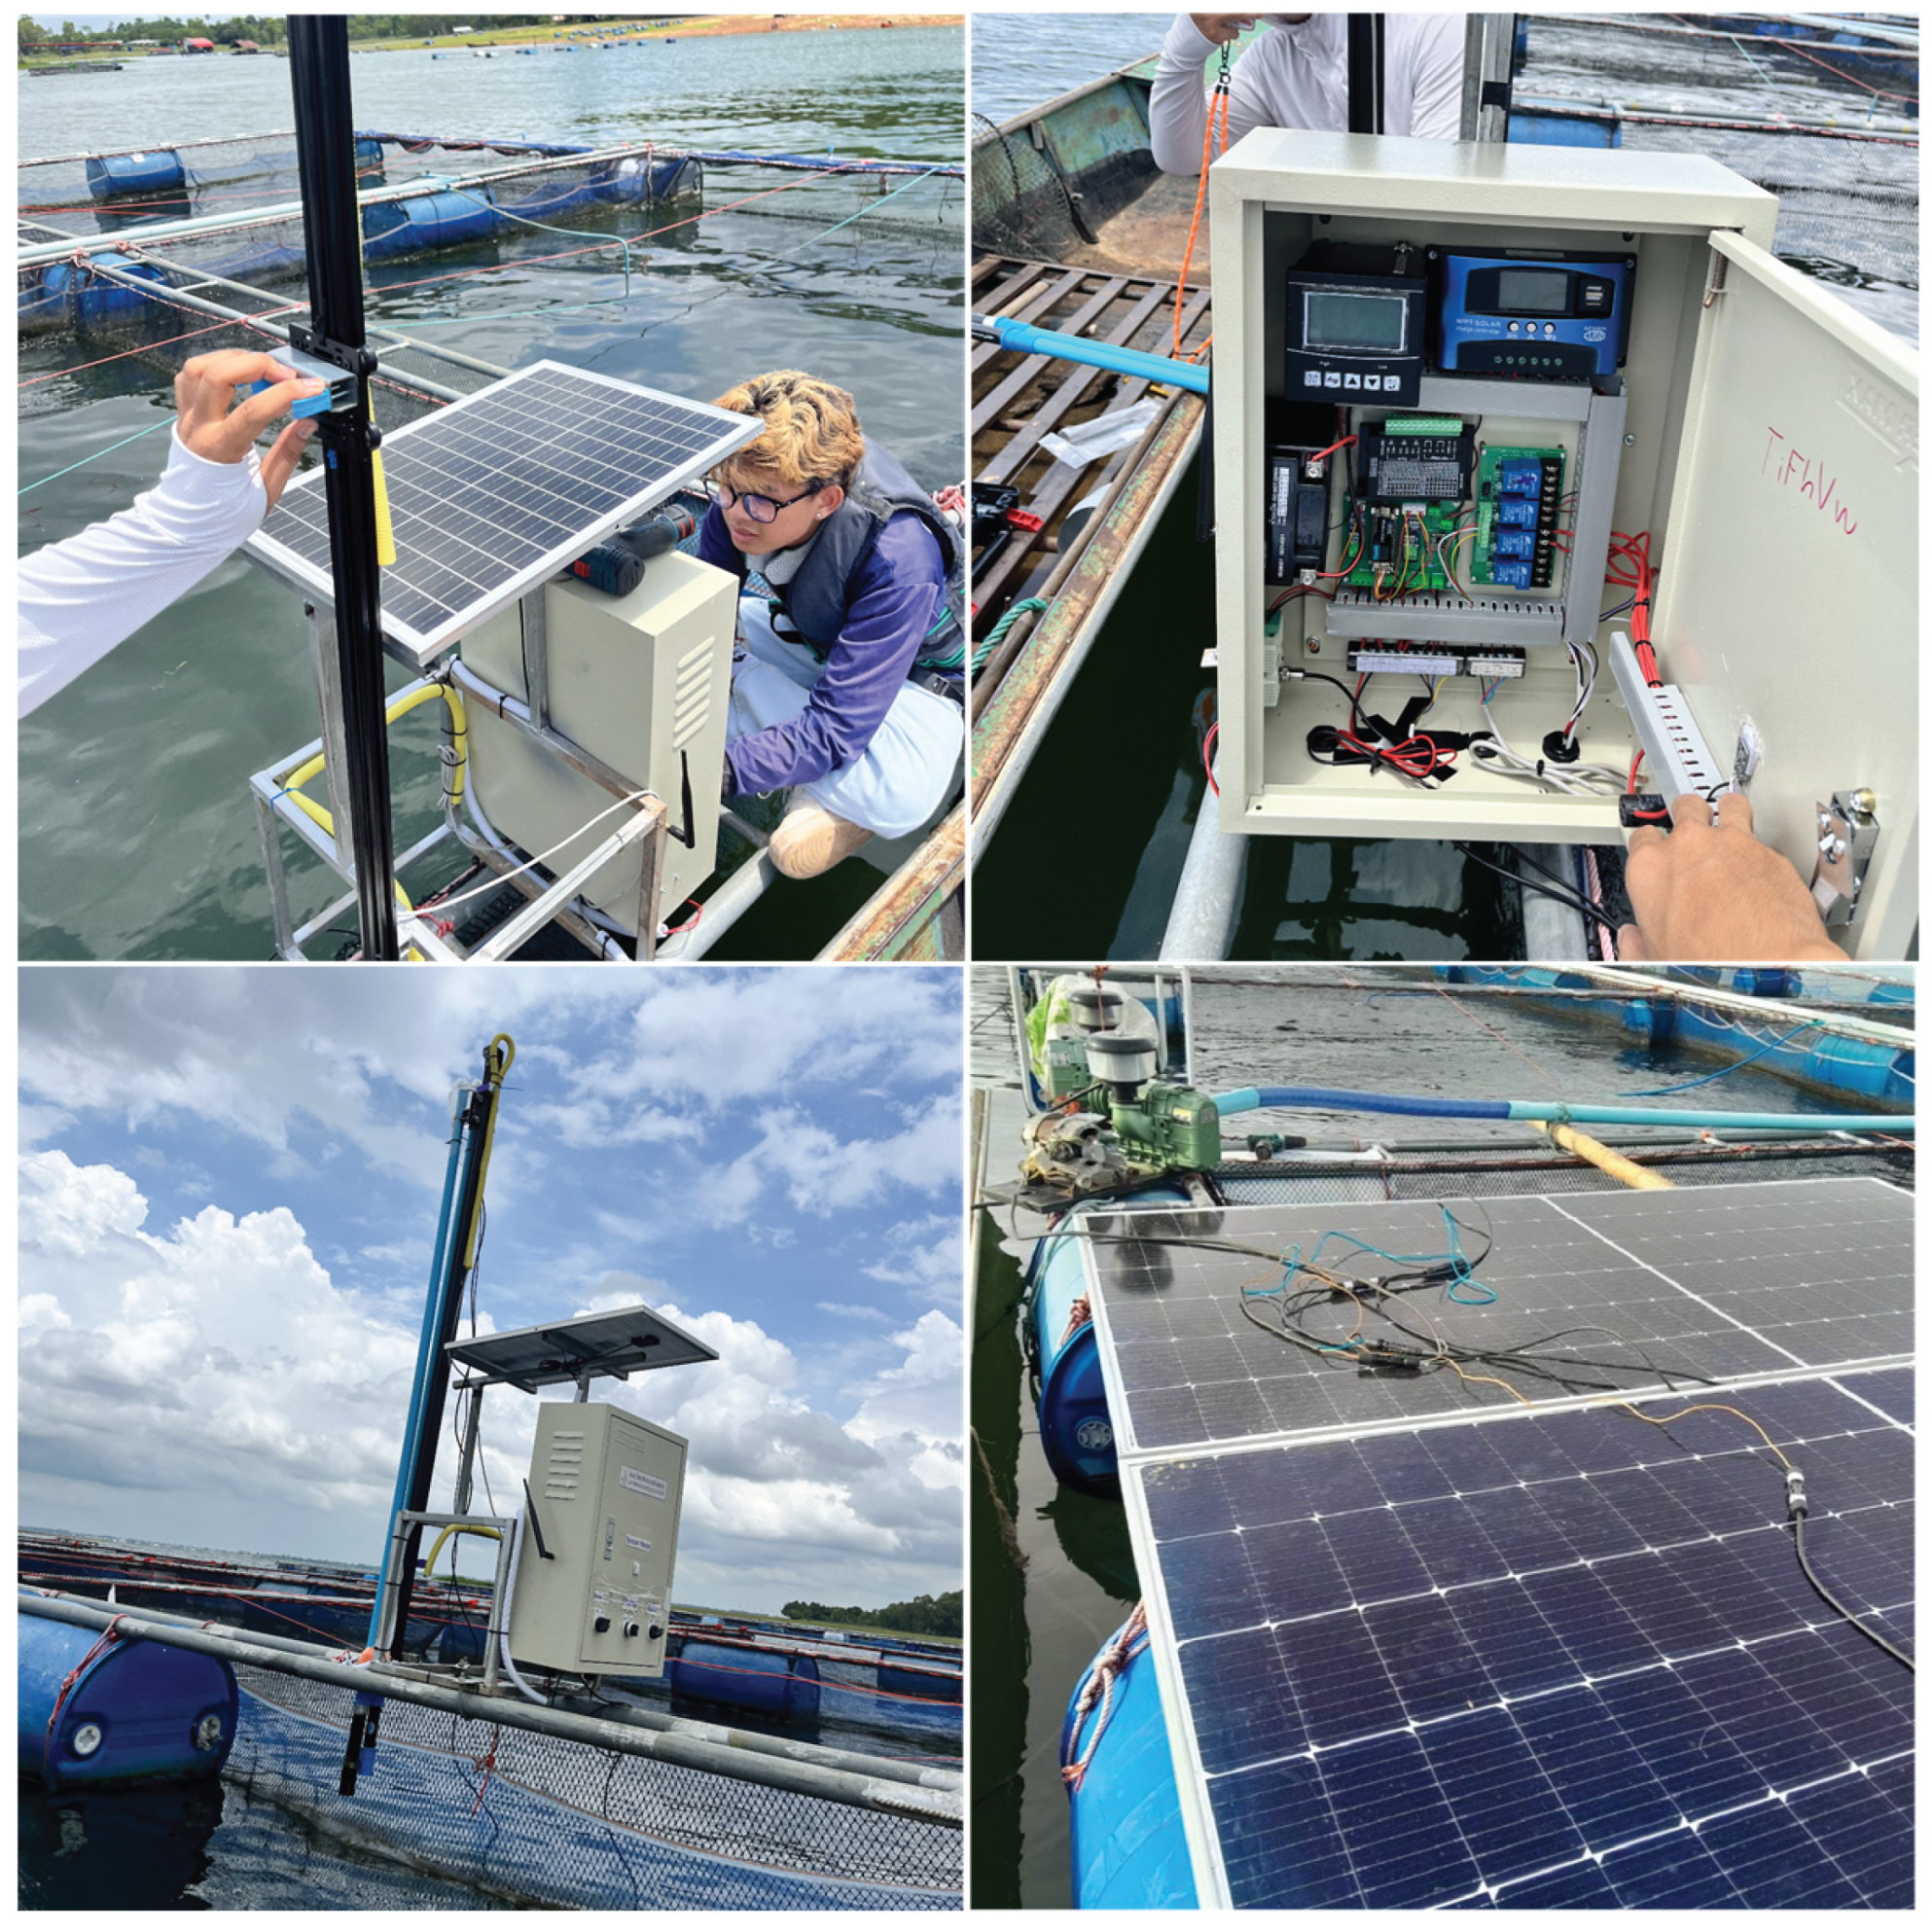
Figure 10.
The screen displays information and settings from control nodes via the OxyLo application.
Figure 10.
The screen displays information and settings from control nodes via the OxyLo application.
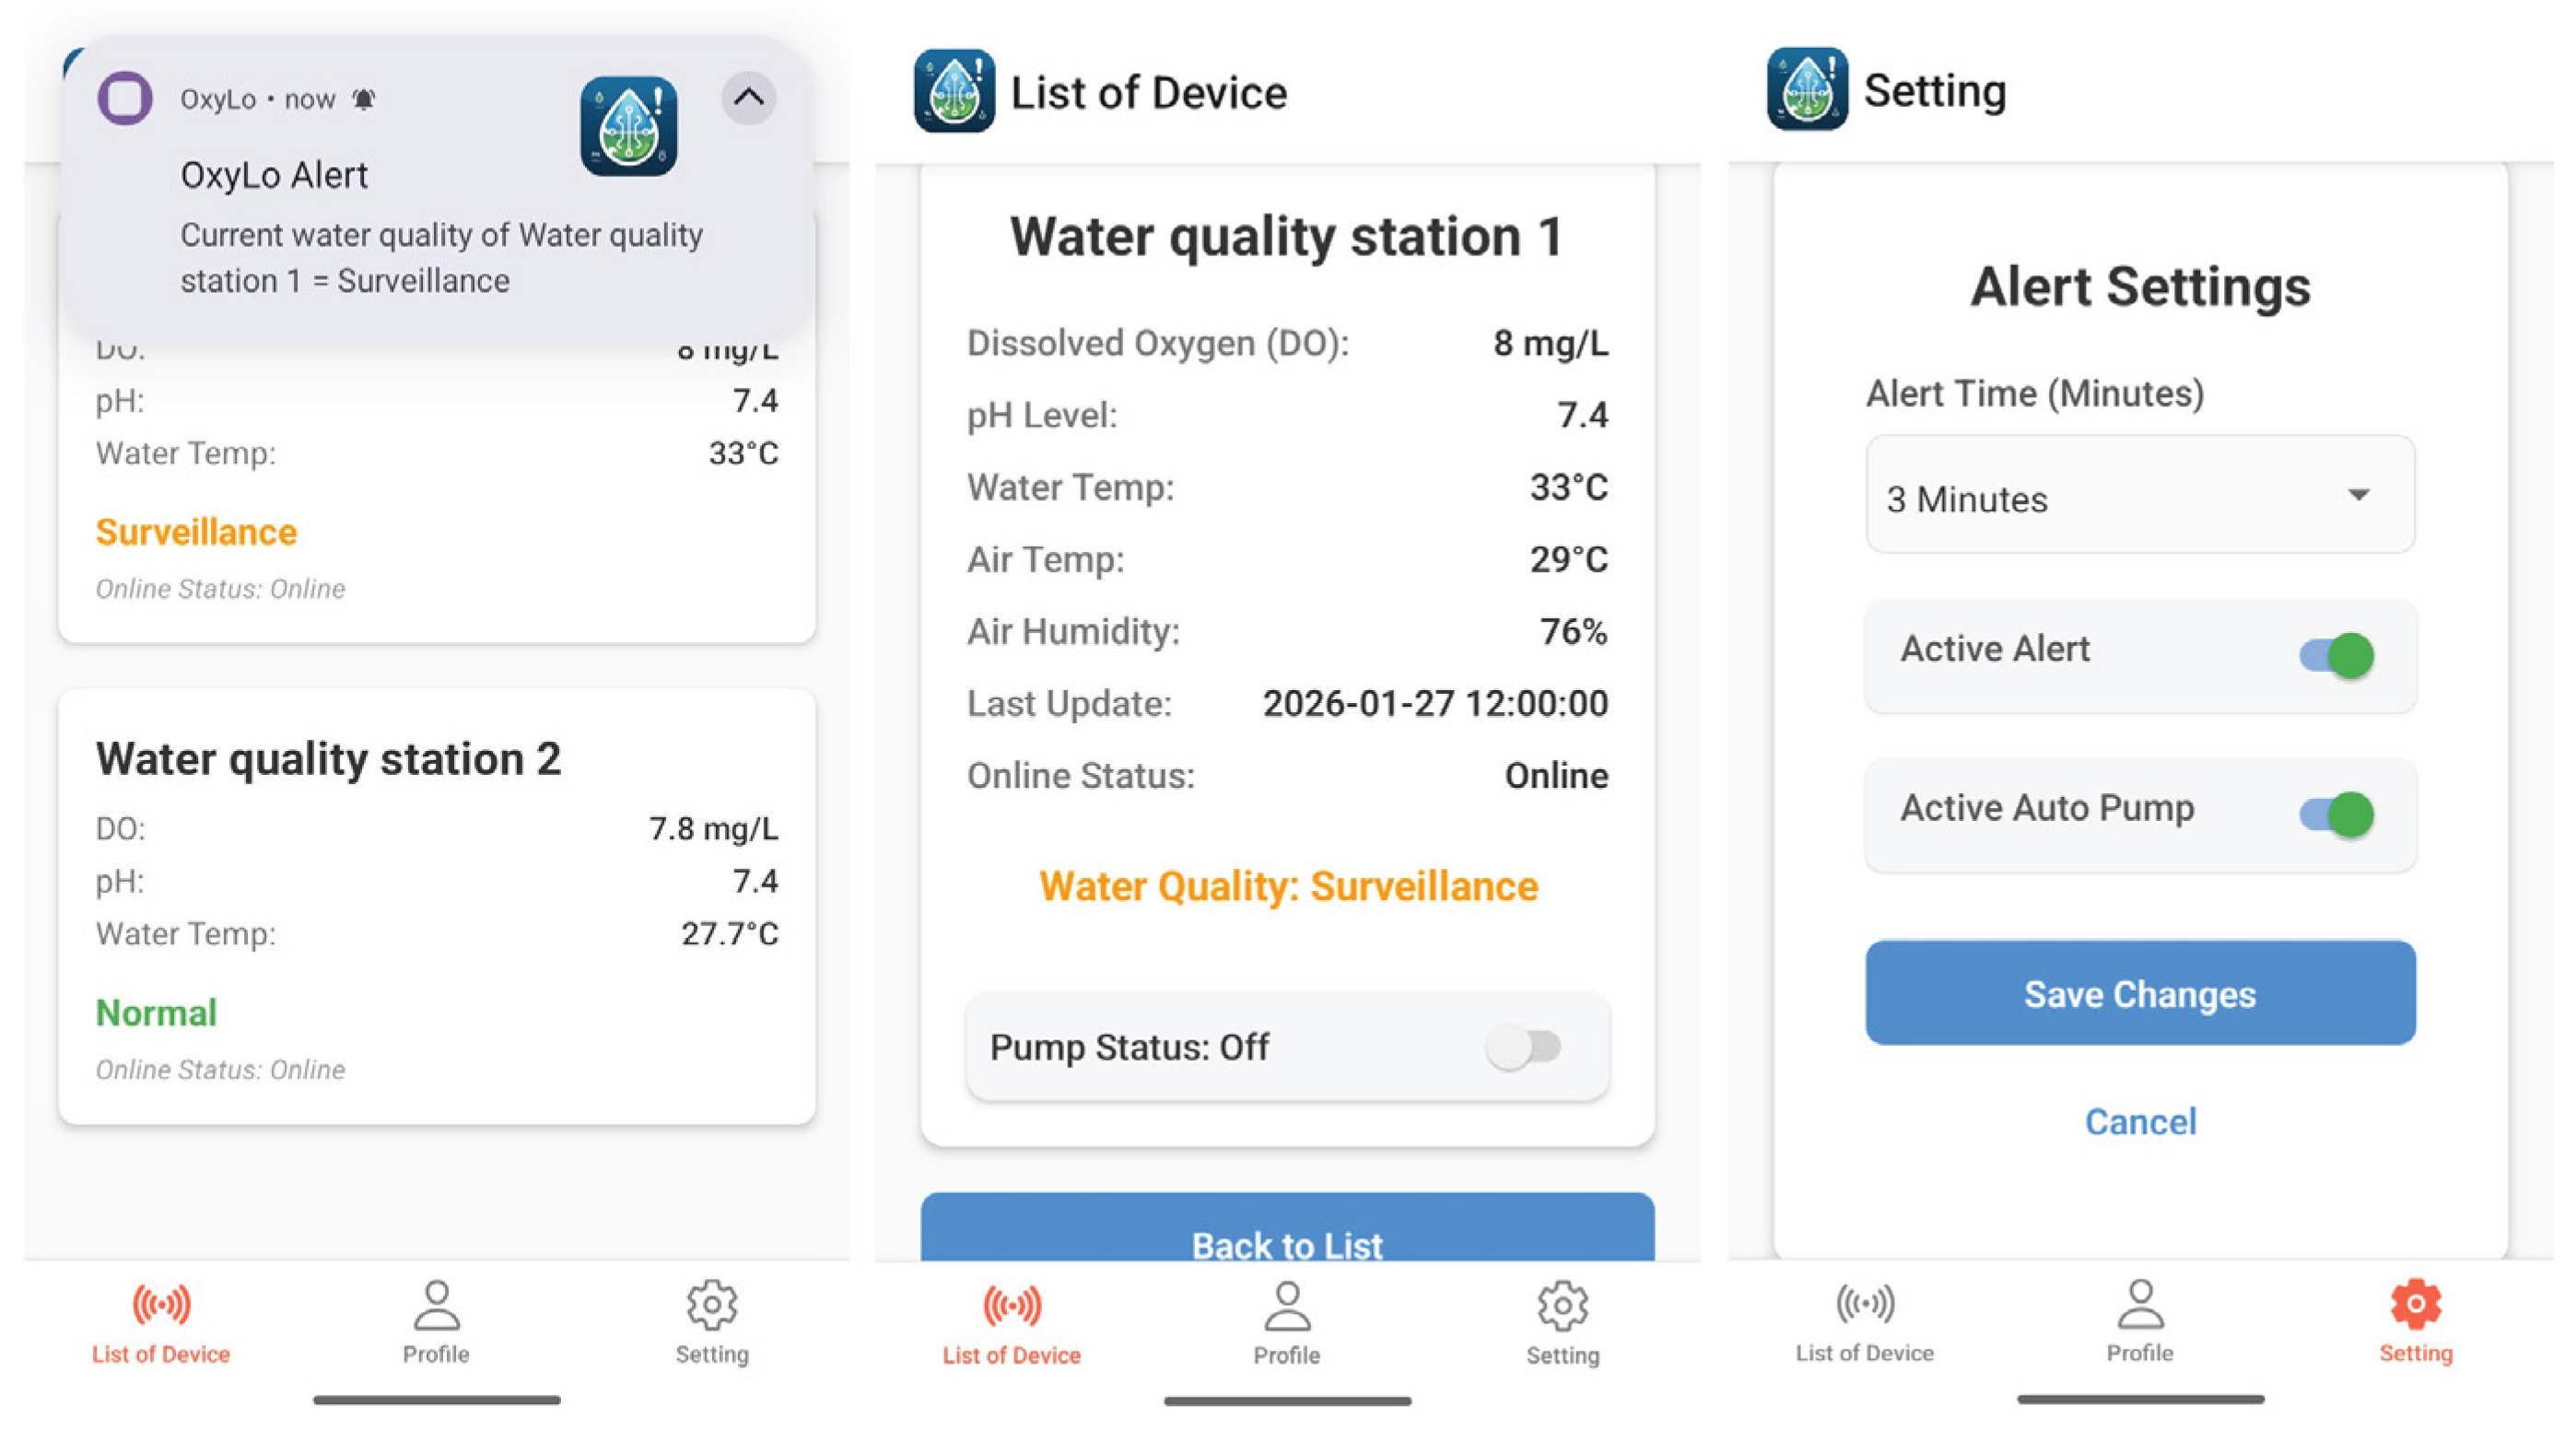
Figure 11.
The website displays data for each control nodes on the map as well as historical water quality information.
Figure 11.
The website displays data for each control nodes on the map as well as historical water quality information.
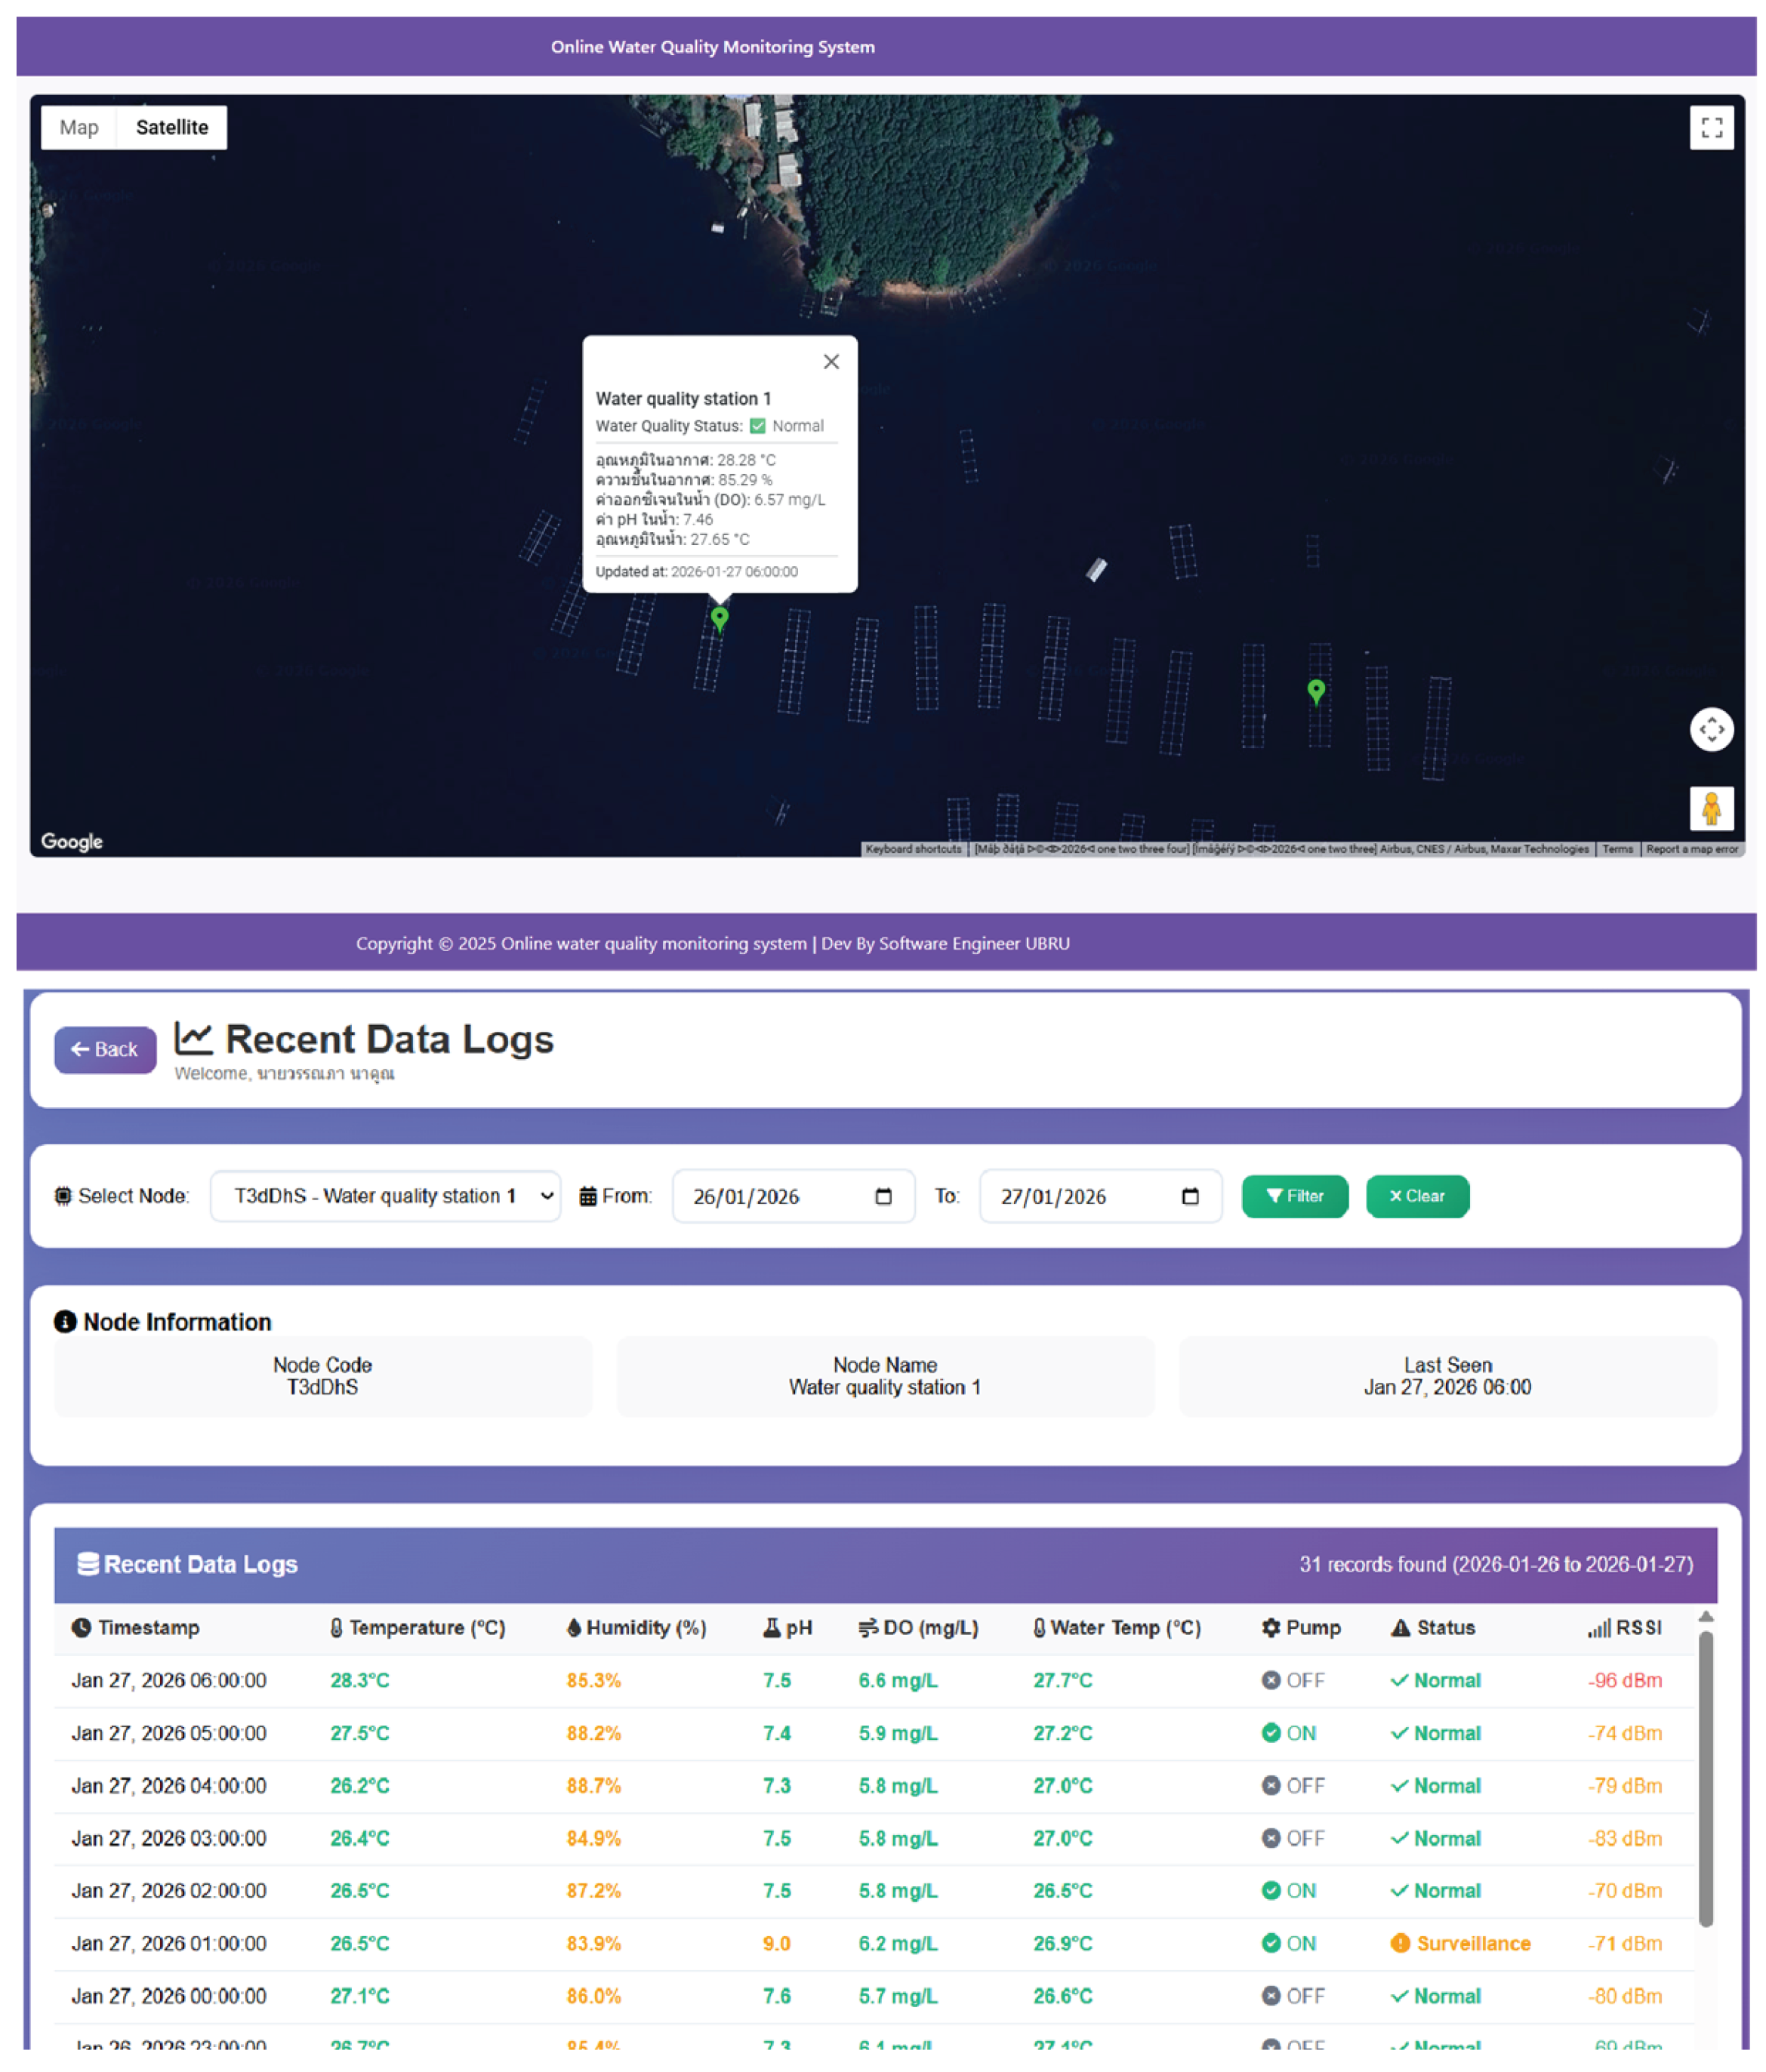
Figure 12.
Time-series comparison between reference, Node-A and Node-B for dissolved oxygen (DO).
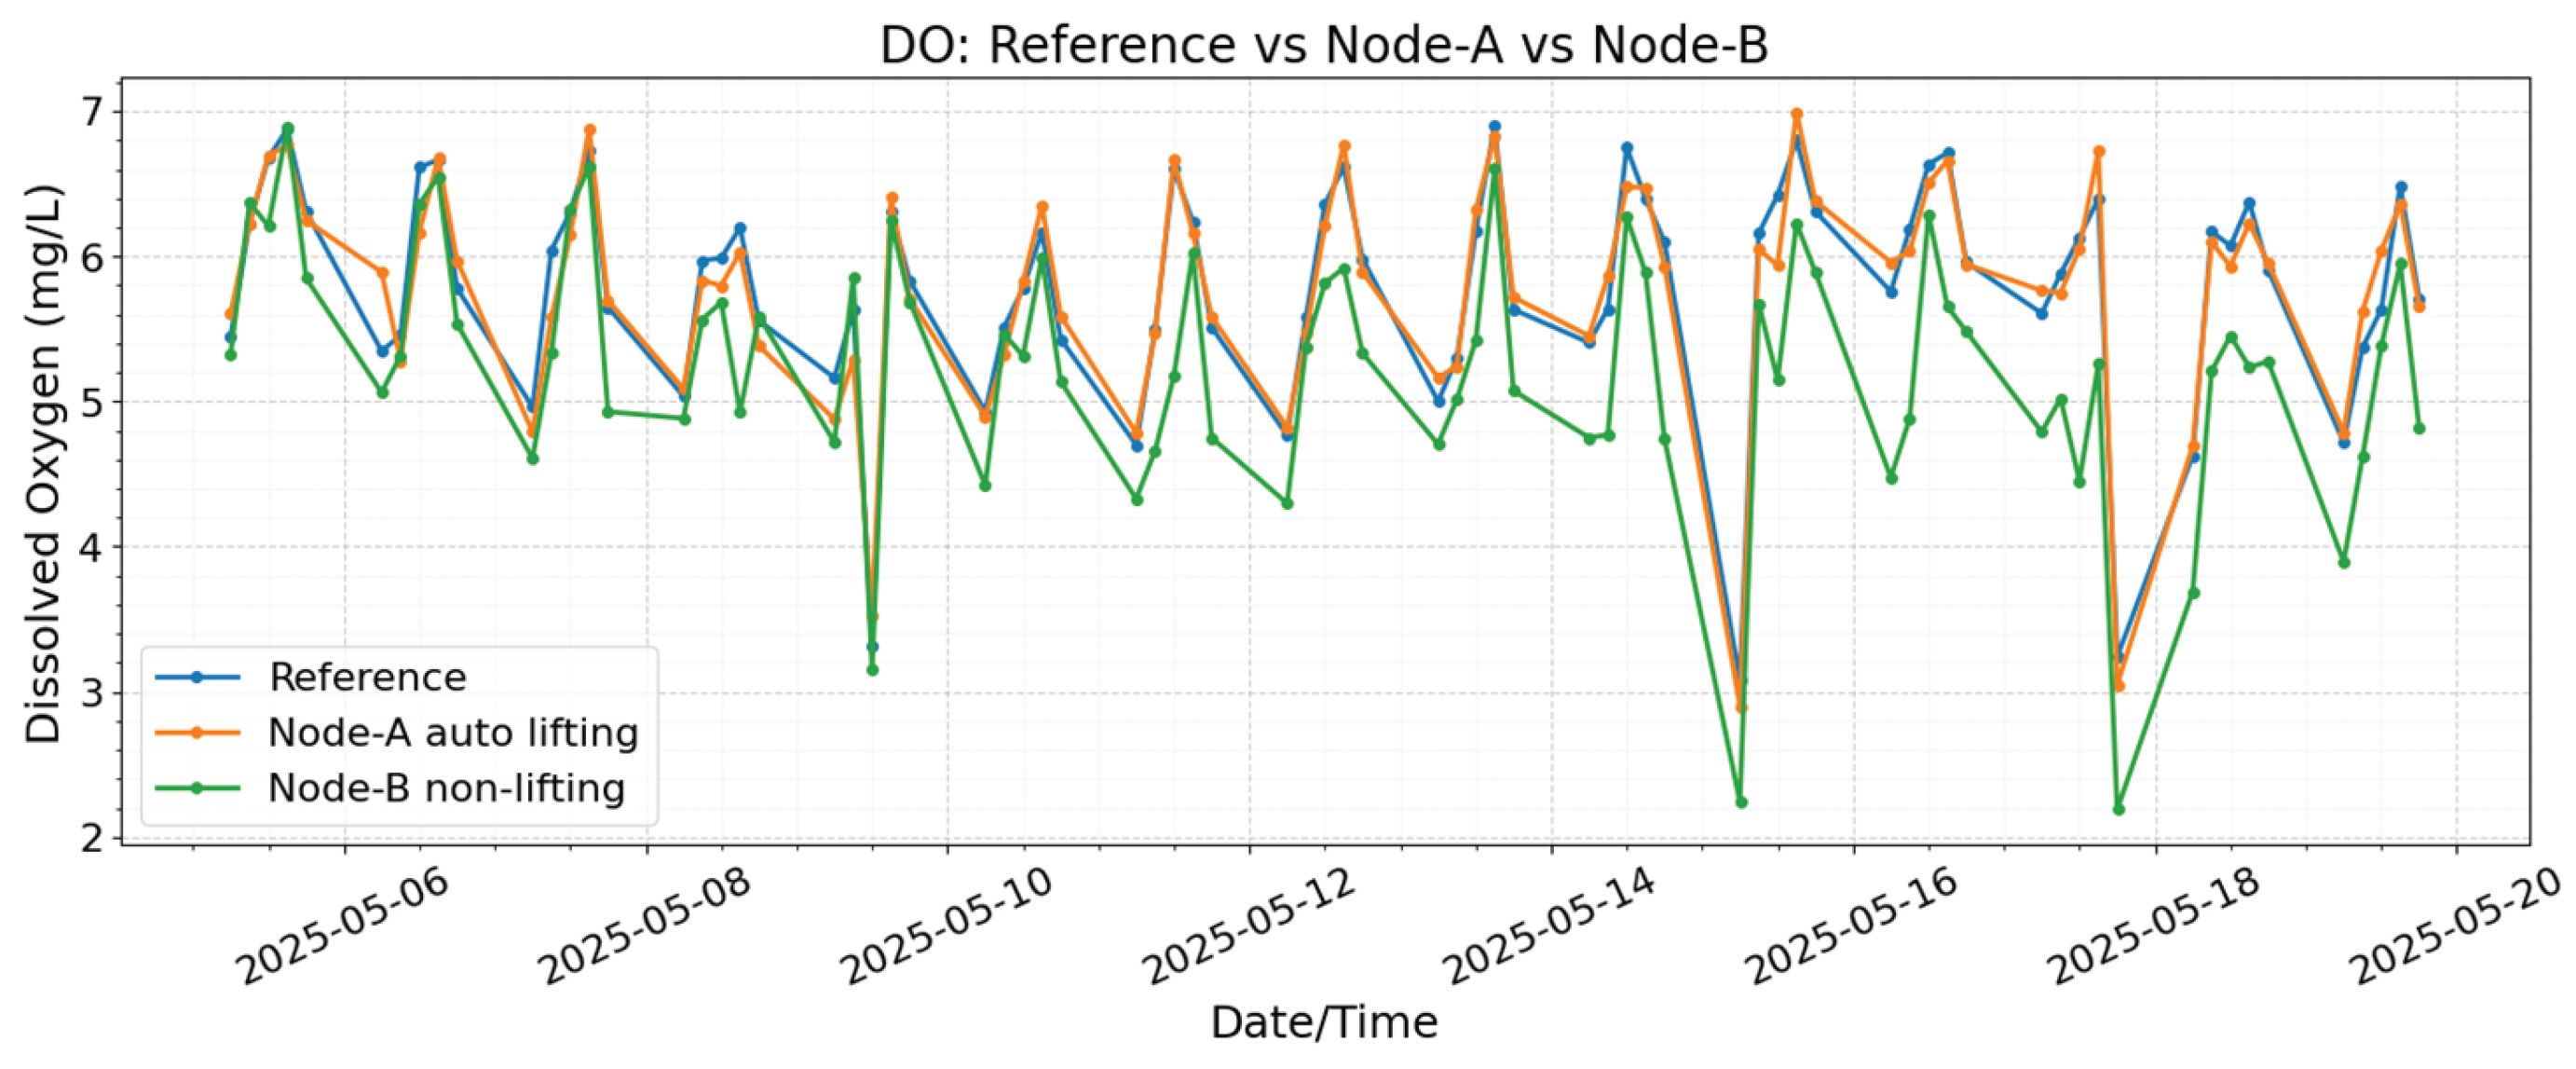
Figure 13.
Time-series comparison between reference, Node-A and Node-B for pH.
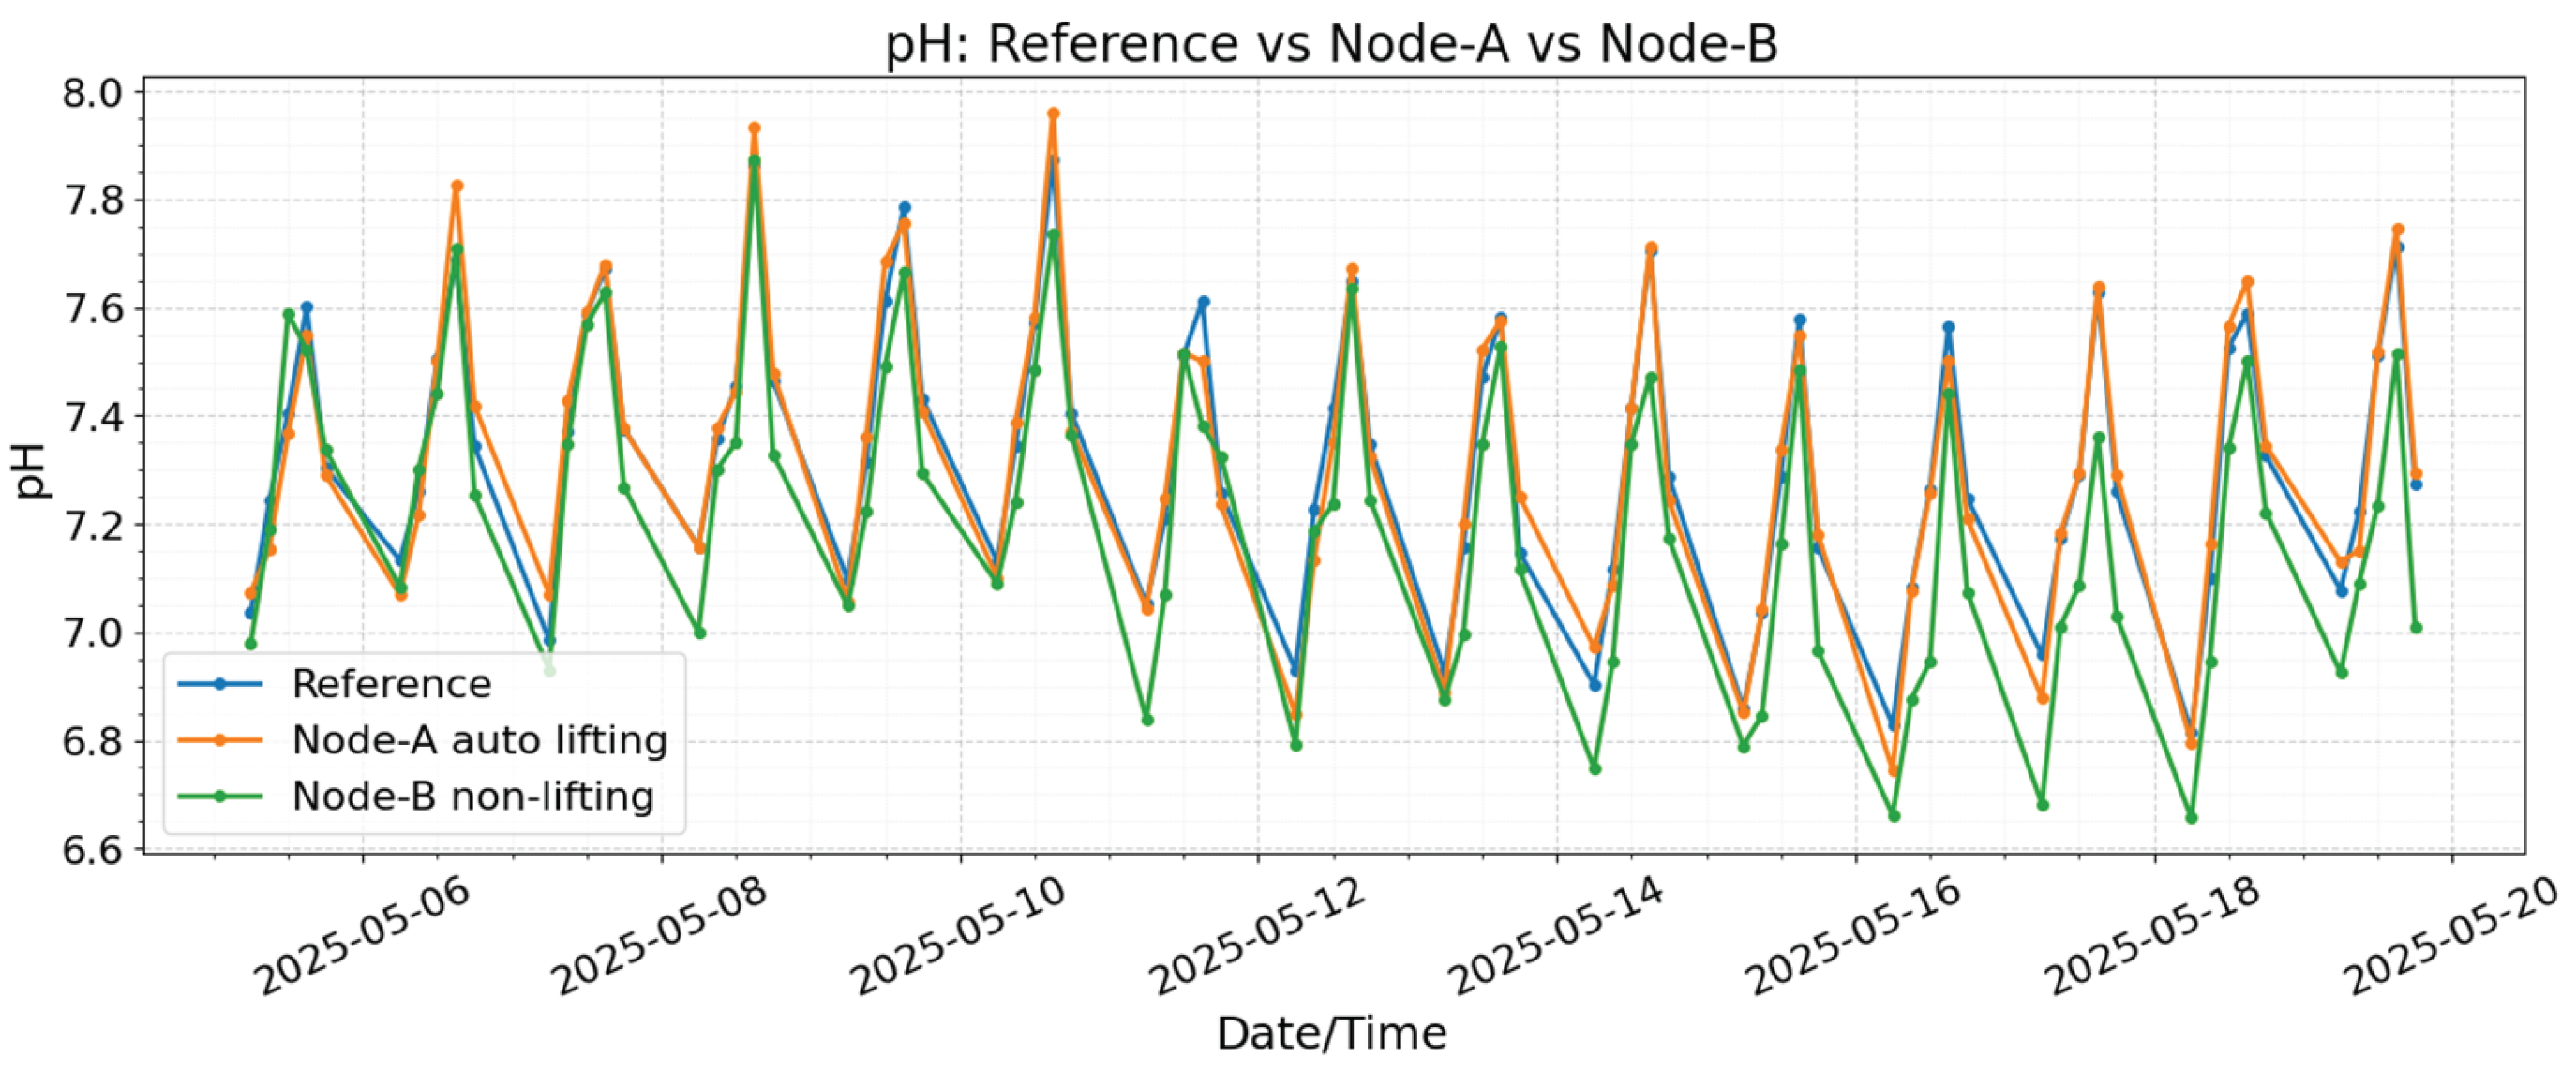
Figure 14.
Time-series comparison between reference, Node-A and Node-B for water temperature.
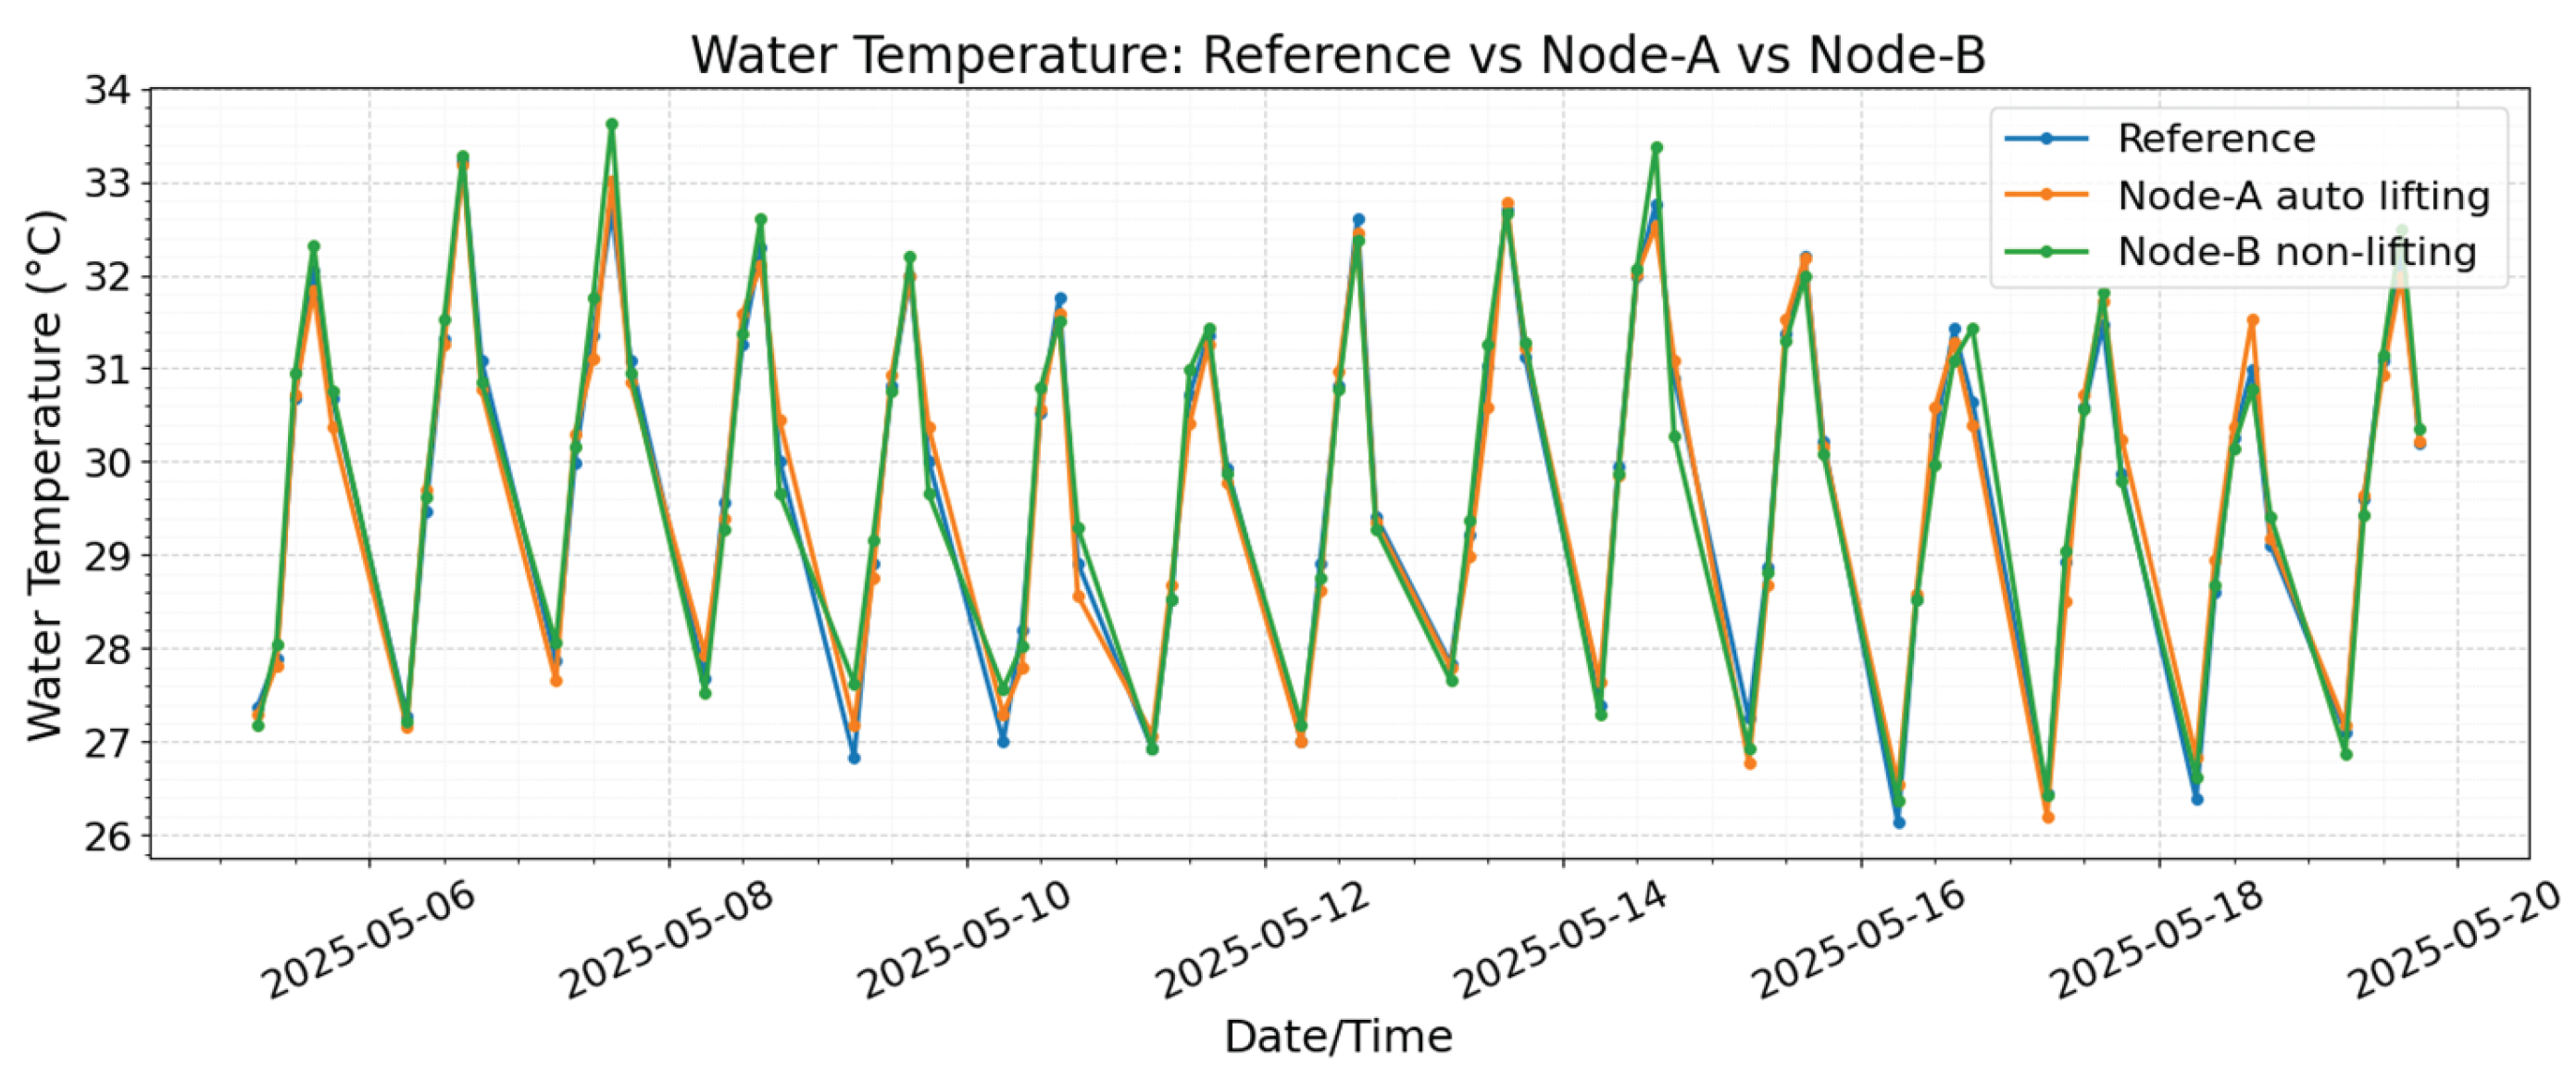
Figure 15.
The coordinate location of the transmitting device, with the relative distances to the control node also provided.
Figure 15.
The coordinate location of the transmitting device, with the relative distances to the control node also provided.
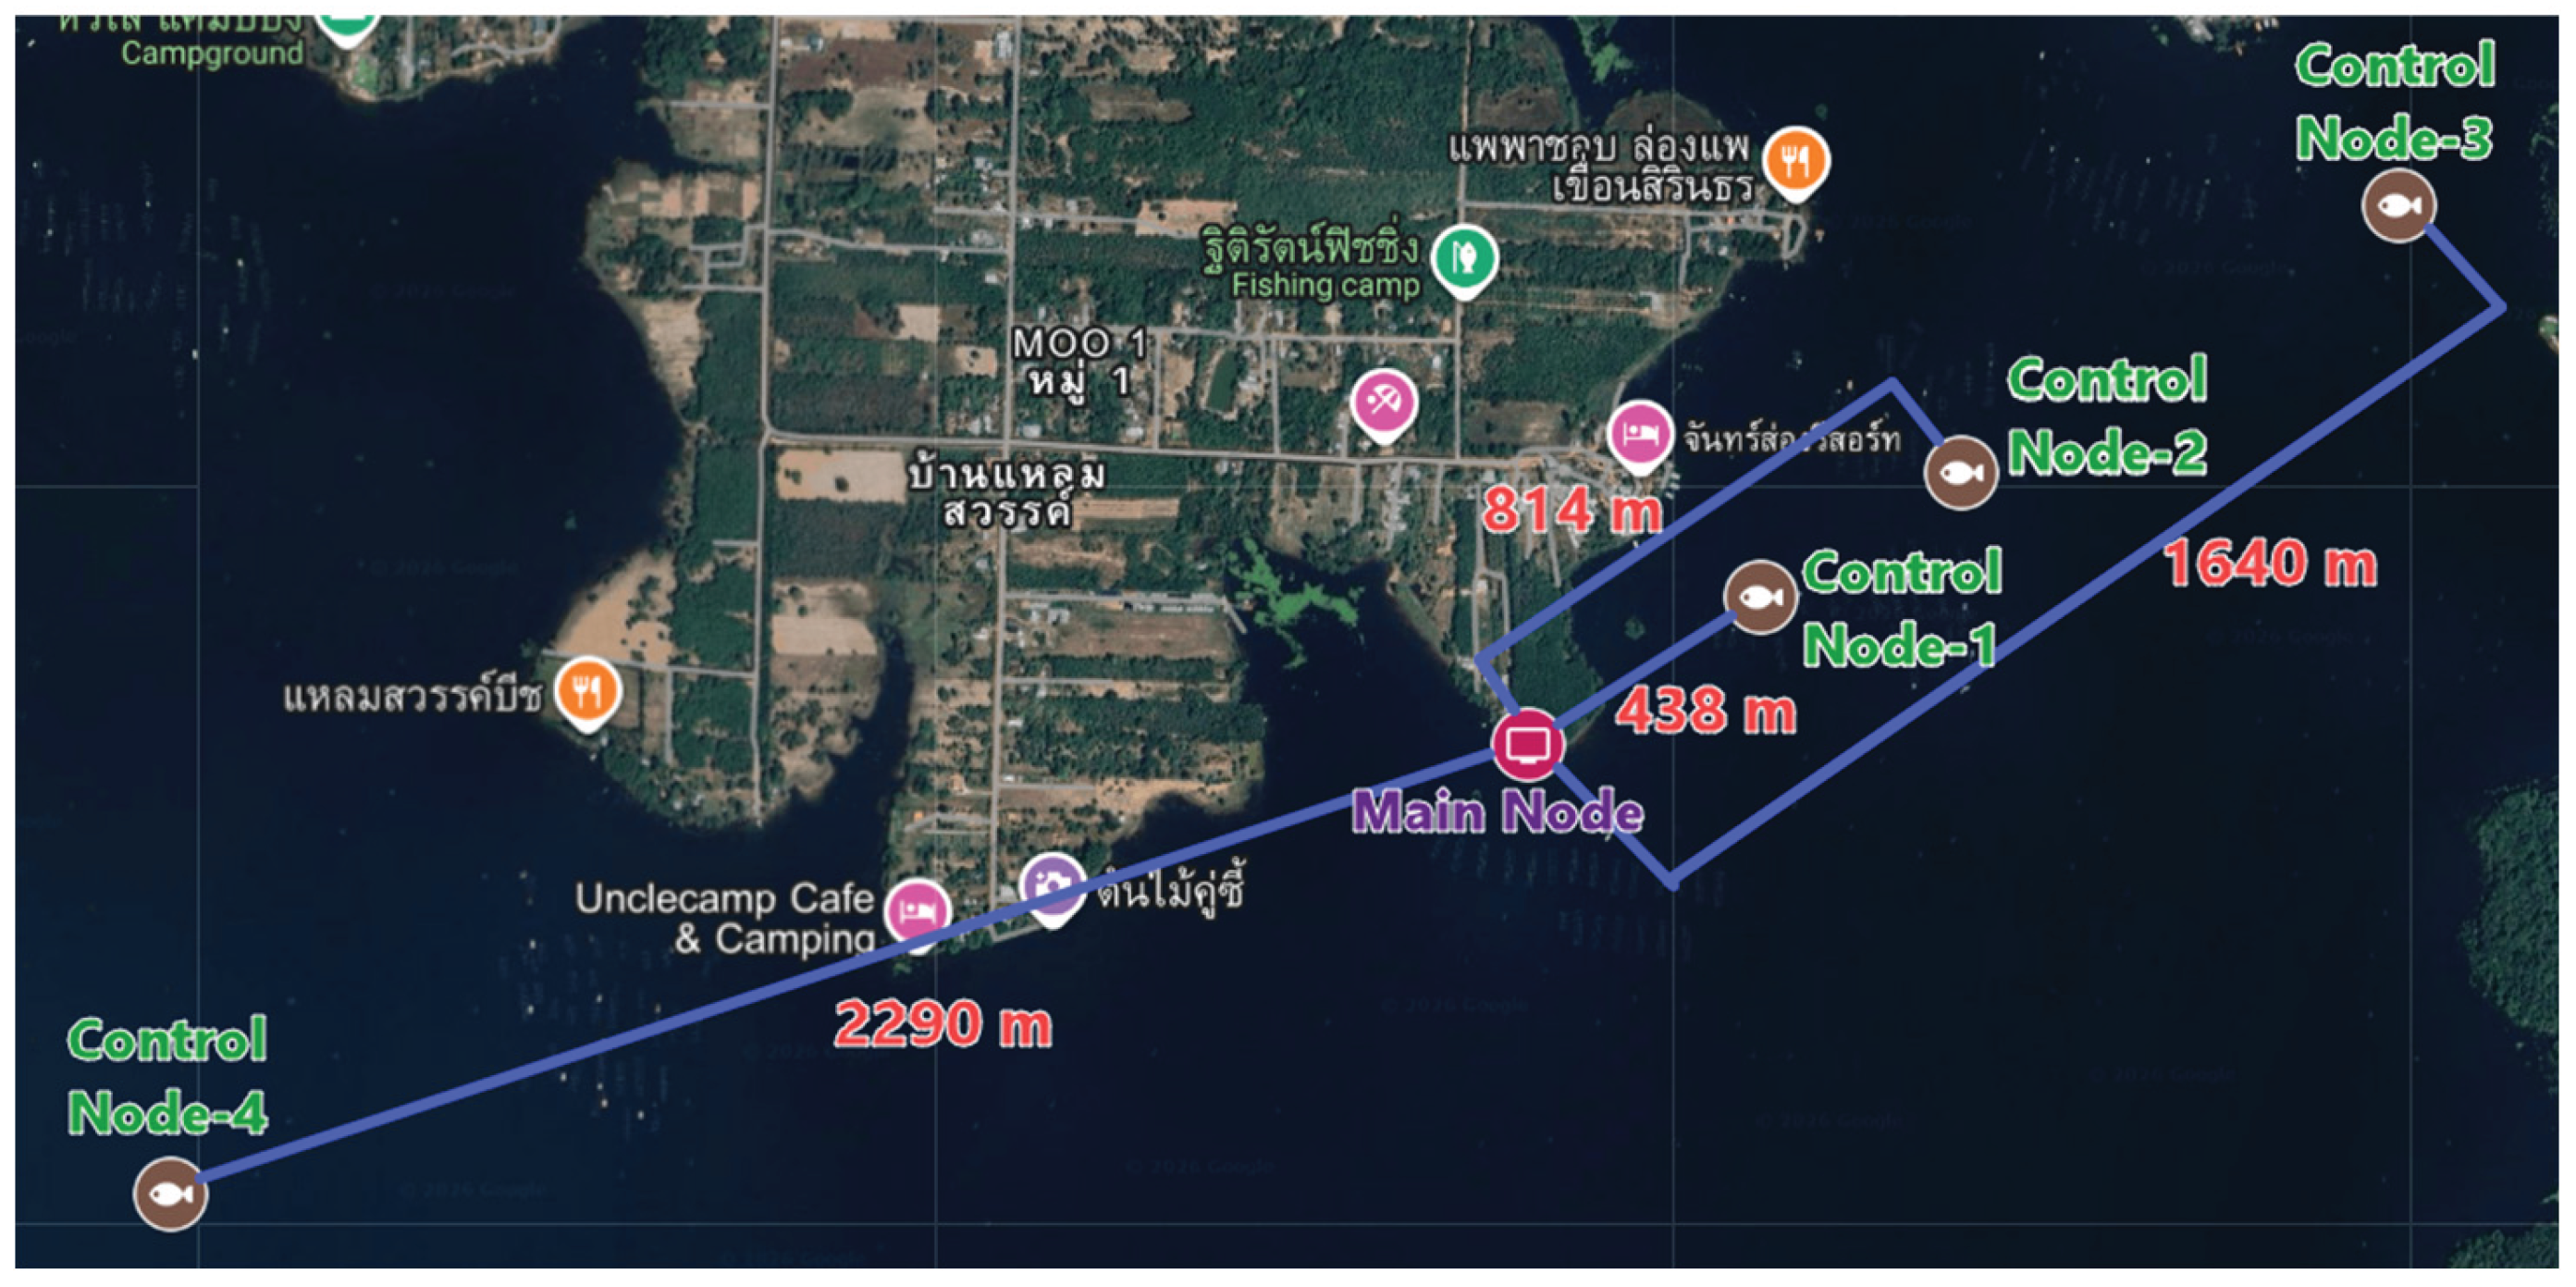
Figure 16.
The locations of the transmitting devices used for single-hop detection delay testing.
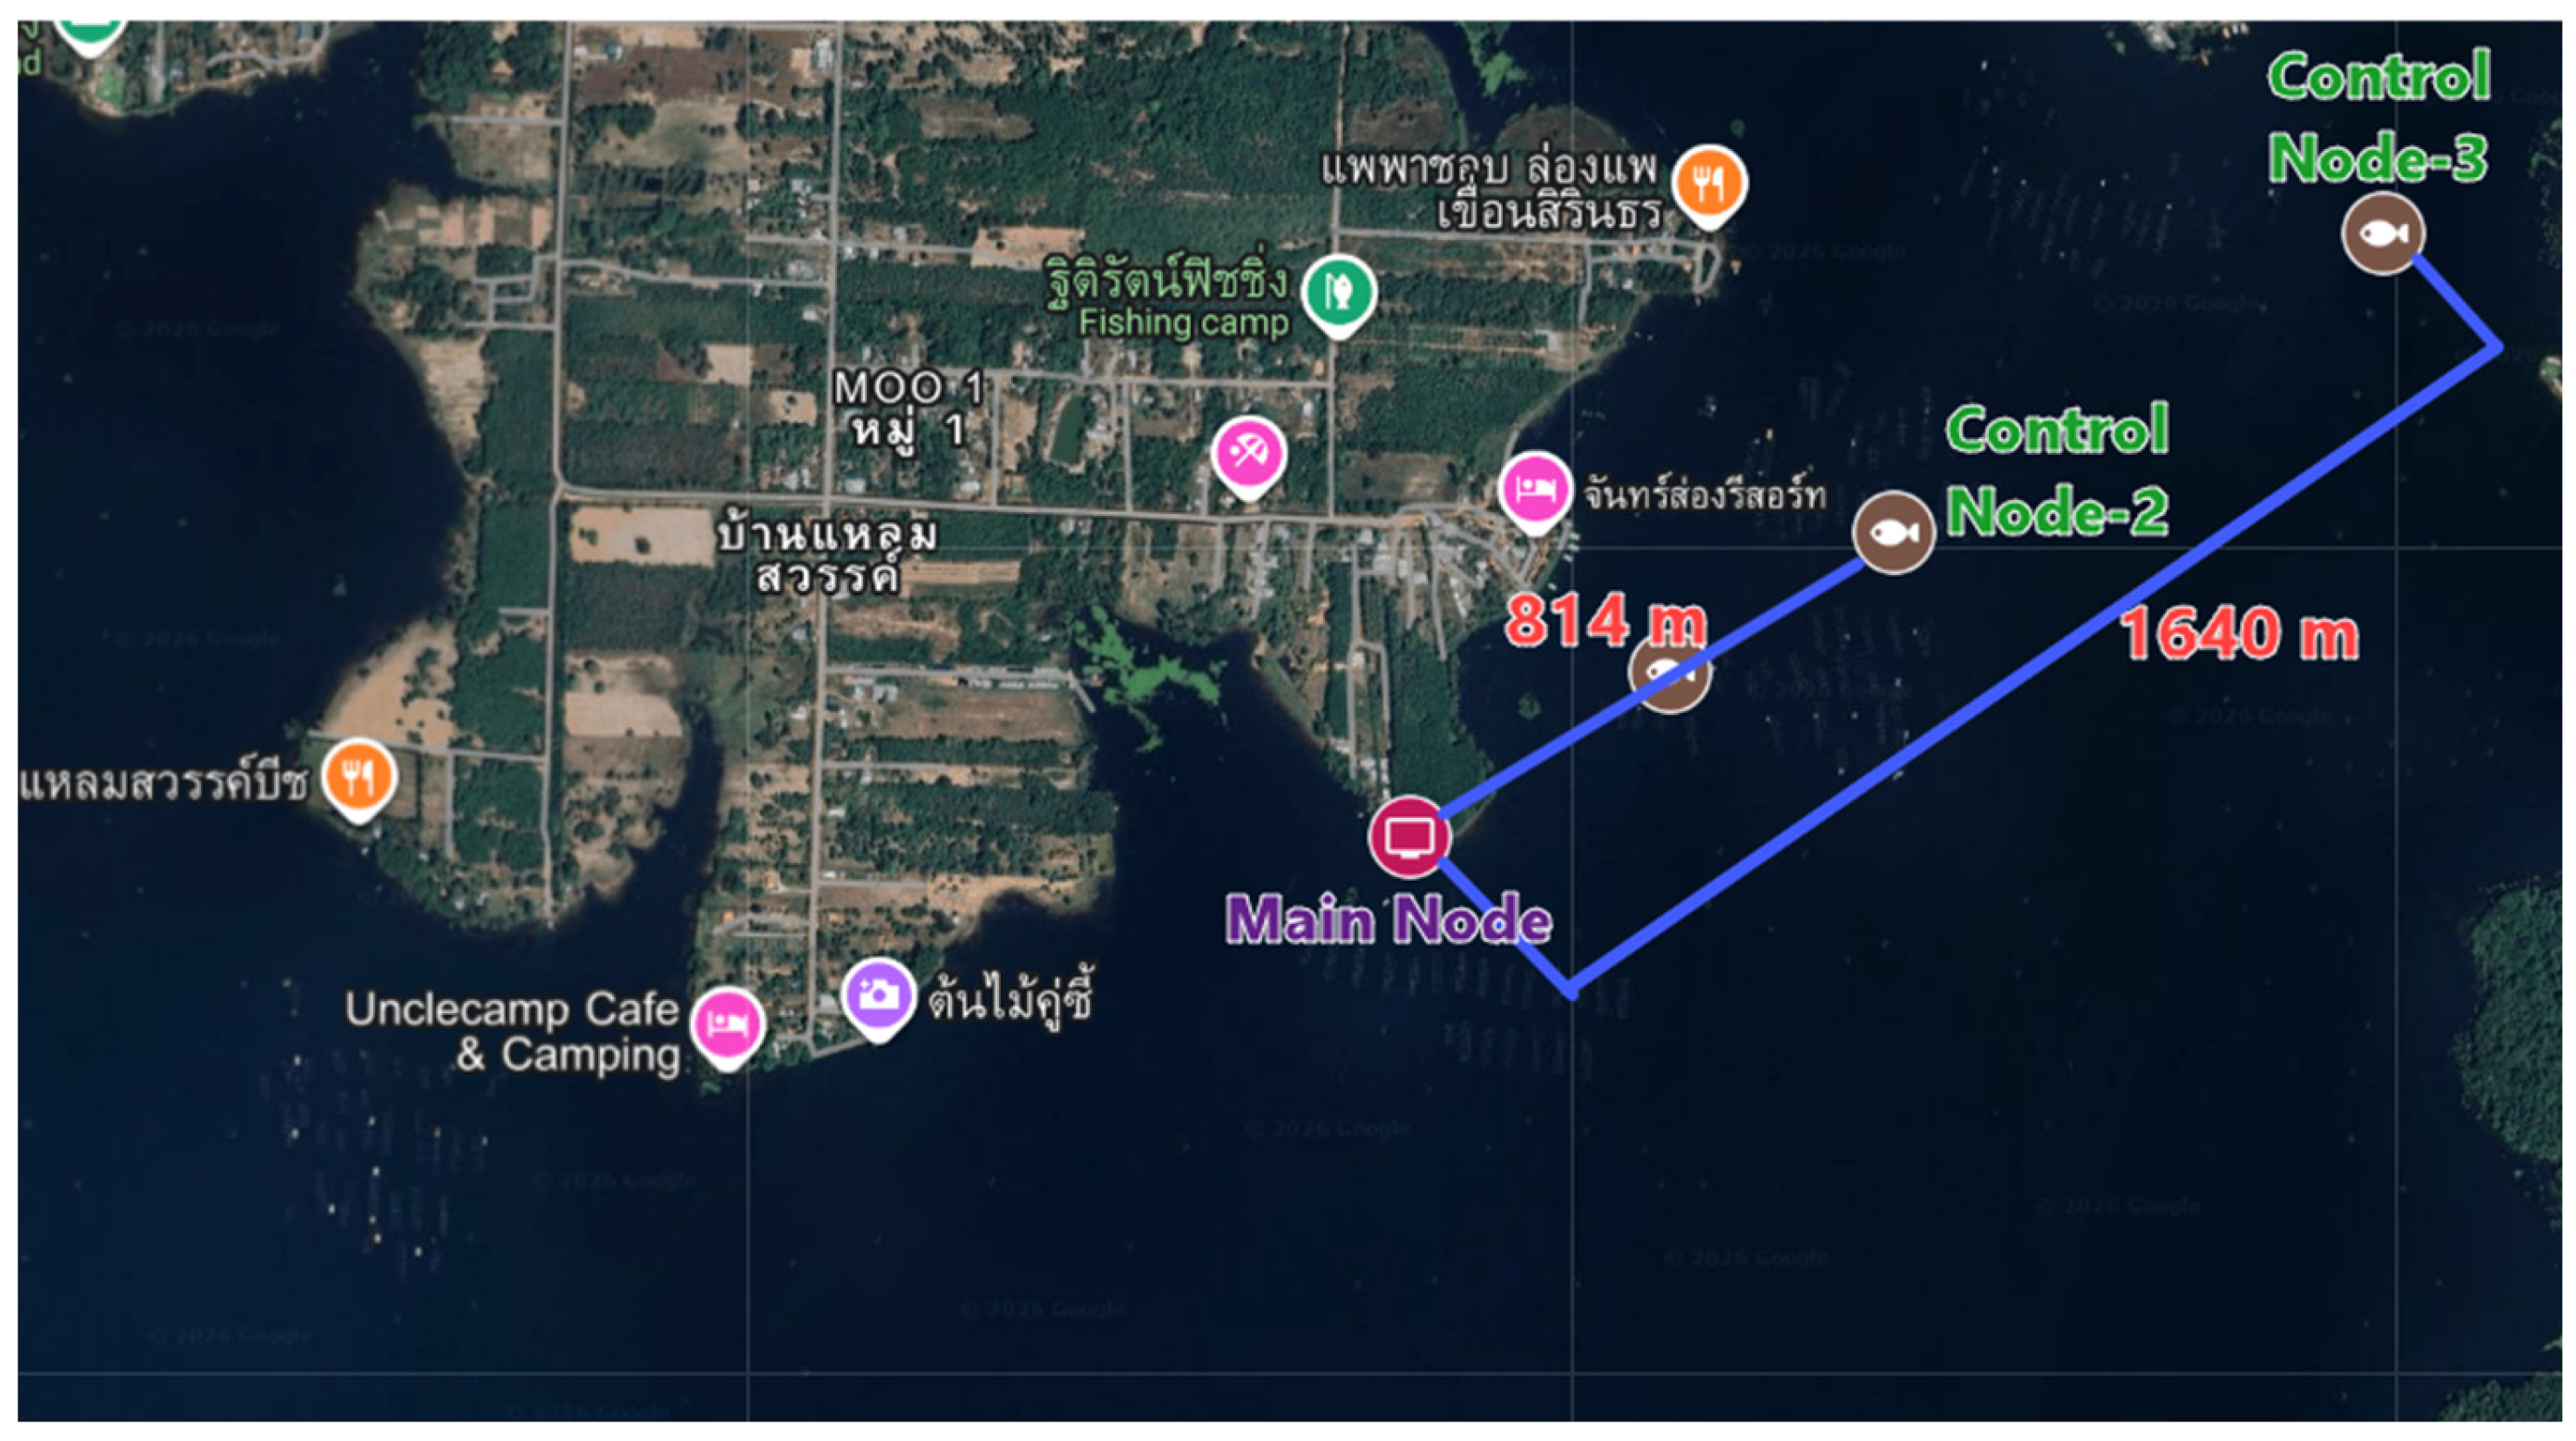
Figure 17.
The coordinate locations of the transmitting devices used in two-hop detection delay testing.
Figure 17.
The coordinate locations of the transmitting devices used in two-hop detection delay testing.
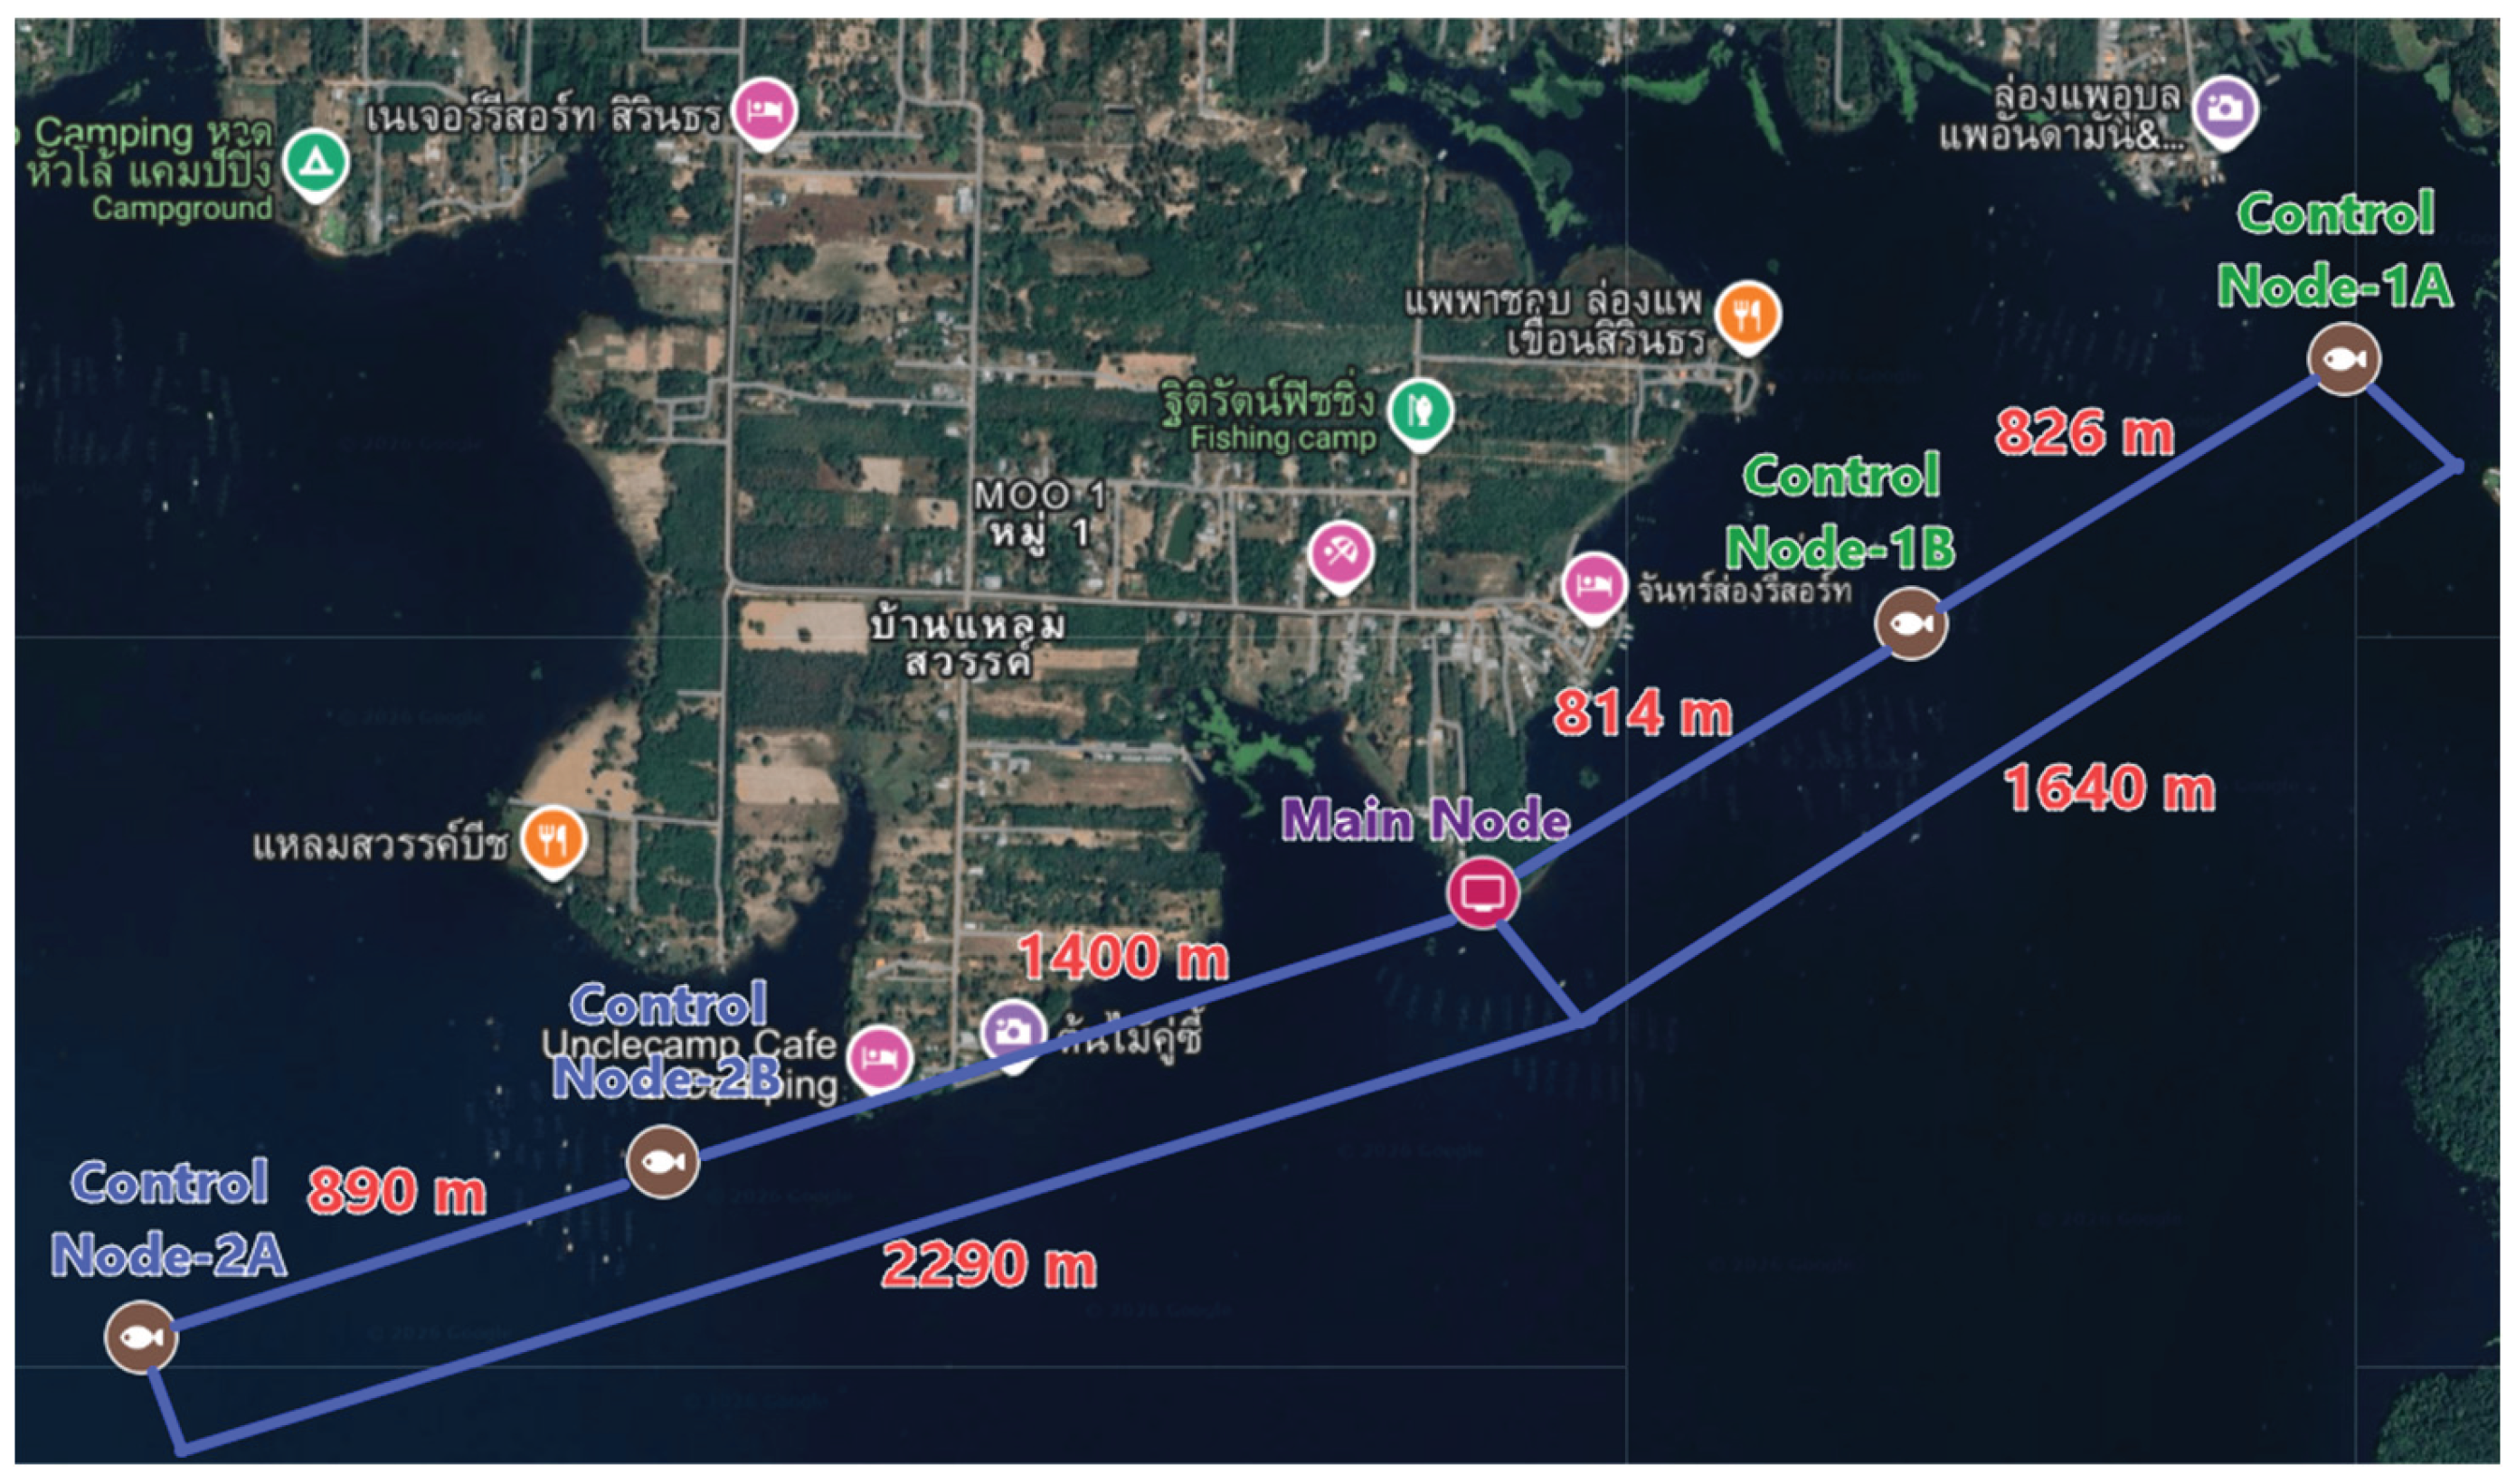
Table 1.
RMSE-based comparison of water quality measurement accuracy.
| Parameter | RMSE (Node-A vs Reference) | RMSE (Node-B vs Reference) |
| DO (mg/L) | 0.186 | 0.683 |
| pH | 0.050 | 0.142 |
| Water temperature (°C) | 0.241 | 0.283 |
Table 2.
Transmission parameter settings of the LoRa module.
| Parameter | Value |
| Transmitted power (dBm) | 15 |
| Spreading factor | 10 |
| Bandwidth (kHz) | 125 |
| CR | 4/6 |
| Antenna gain (dBi) | 6 |
| Frequency (MHz) | 923 |
Table 3.
Data transmission signal performance test results.
| Parameter | Control node | |||
| 1 | 2 | 3 | 4 | |
| Distance (m) | 438 | 814 | 1640 | 2290 |
| Average Signal-to-Noise Ratio (SNR) (dB) | 9.8 ± 1.2 | 7.1 ± 1.4 | 3.2 ± 1.6 | -0.9 ± 1.8 |
| Average Received Signal Strength Indicator (RSSI) (dB) | -78.6 ± 2.4 | -89.3 ± 3.1 | -101.7 ± 3.8 | -109.5 ± 4.6 |
| Number of Received Packages | 20 | 20 | 20 | 18 |
Table 5.
Performance evaluation table.
| Assessment | (S.D.) | Interpretation |
| 1. The system is capable of accurately and reliably measuring dissolved oxygen (DO), pH, and water temperature under real farming conditions. | 4.30 (0.55) | High |
| 2. The automatic probe lifting and lowering mechanism effectively mitigates biofouling and sensor drift, thereby enhancing long-term measurement reliability. | 4.50 (0.50) | Very High |
| 3. The proposed IoT-LoRa system architecture (control node–main node–cloud) is appropriate for deployment in open-area cage-based aquaculture environments. | 4.10 (0.60) | High |
| 4. The LoRa communication performance, as indicated by the RSSI, SNR, and packet delivery reliability, is sufficient for long-distance operation in practical field conditions. | 3.95 (0.58) | High |
| 5. The system’s detection latency is appropriate for timely oxygen pump control and rapid response to critical water quality events. | 4.00 (0.57) | High |
| 6. The automated oxygen pump control mechanism effectively reduces the risk of hypoxic conditions in cage-based tilapia farming. | 4.20 (0.54) | High |
| 7. The integration of solar energy contributes to improved system sustainability and reduced operational costs. | 4.35 (0.52) | High |
| 8. The overall system stability is suitable for long-term operation in real-world aquaculture environments. | 3.90 (0.63) | High |
| 9. The system demonstrates sufficient scalability to support an increased number of sensor and control nodes in large-scale cage farming operations. | 3.80 (0.66) | High |
| 10. Overall, the system exhibits adequate technical readiness and operational efficiency for real-world deployment. | 4.05 (0.56) | High |
| Total | 4.11 (0.57) | High |
Table 6.
Satisfaction evaluation table.
| Assessment |
Pre-Implementation (S.D.) |
Post-Implementation (S.D.) |
Mean Diff | t |
| 1. Usability and Practical Use | ||||
| 1.1 The system is easy to use and does not require complex operational procedures. | 2.30 (0.57) | 4.45 (0.51) | 2.15 | 14.8 |
| 1.2 The smartphone application presents system information in a clear and easily understandable manner. | 2.45 (0.60) | 4.50 (0.49) | 2.05 | 15.2 |
| 1.3 The water quality alert notifications support faster and more effective decision-making. | 2.20 (0.55) | 4.60 (0.50) | 2.40 | 16.1 |
| 2. Monitoring and Control Efficiency | ||||
| 2.1 The system enables real-time monitoring of water quality conditions in tilapia cages. | 2.35 (0.52) | 4.55 (0.48) | 2.20 | 15.7 |
| 2.2 Remote control of the oxygen pump helps reduce labor requirements during daily farm operations. | 2.10 (0.50) | 4.40 (0.50) | 2.30 | 16.9 |
| 2.3 The system responds promptly to emergency water quality situations. | 2.00 (0.47) | 4.35 (0.49) | 2.35 | 17.3 |
| 3. Economic and Operational Impact | ||||
| 3.1 The system helps reduce fuel and energy costs compared with conventional farming practices. | 2.25 (0.54) | 4.30 (0.52) | 2.05 | 14.2 |
| 3.2 The system contributes to a reduction in fish losses caused by water quality deterioration. | 2.15 (0.51) | 4.45 (0.51) | 2.30 | 16.0 |
| 3.3 The system increases confidence in overall farm management and decision-making. | 2.30 (0.58) | 4.50 (0.50) | 2.20 | 15.5 |
| 4. Overall Satisfaction | ||||
| 4.1 Overall satisfaction with the performance of the system. | 2.20 (0.49) | 4.55 (0.51) | 2.35 | 16.8 |
| 4.2 Intention to continue using the system in future farming operations. | 2.35 (0.52) | 4.60 (0.50) | 2.25 | 15.9 |
| 4.3 Intention to recommend the system to other cage-based tilapia farmers. | 2.10 (0.50) | 4.50 (0.52) | 2.40 | 17.1 |
| Total | 2.23 (0.53) | 4.48 (0.50) | 2.25 | 16.2 |
Disclaimer/Publisher’s Note: The statements, opinions and data contained in all publications are solely those of the individual author(s) and contributor(s) and not of MDPI and/or the editor(s). MDPI and/or the editor(s) disclaim responsibility for any injury to people or property resulting from any ideas, methods, instructions or products referred to in the content. |
© 2026 by the authors. Licensee MDPI, Basel, Switzerland. This article is an open access article distributed under the terms and conditions of the Creative Commons Attribution (CC BY) license (http://creativecommons.org/licenses/by/4.0/).
Copyright: This open access article is published under a Creative Commons CC BY 4.0 license, which permit the free download, distribution, and reuse, provided that the author and preprint are cited in any reuse.


