
Submitted:
10 February 2026
Posted:
12 February 2026
You are already at the latest version
Abstract
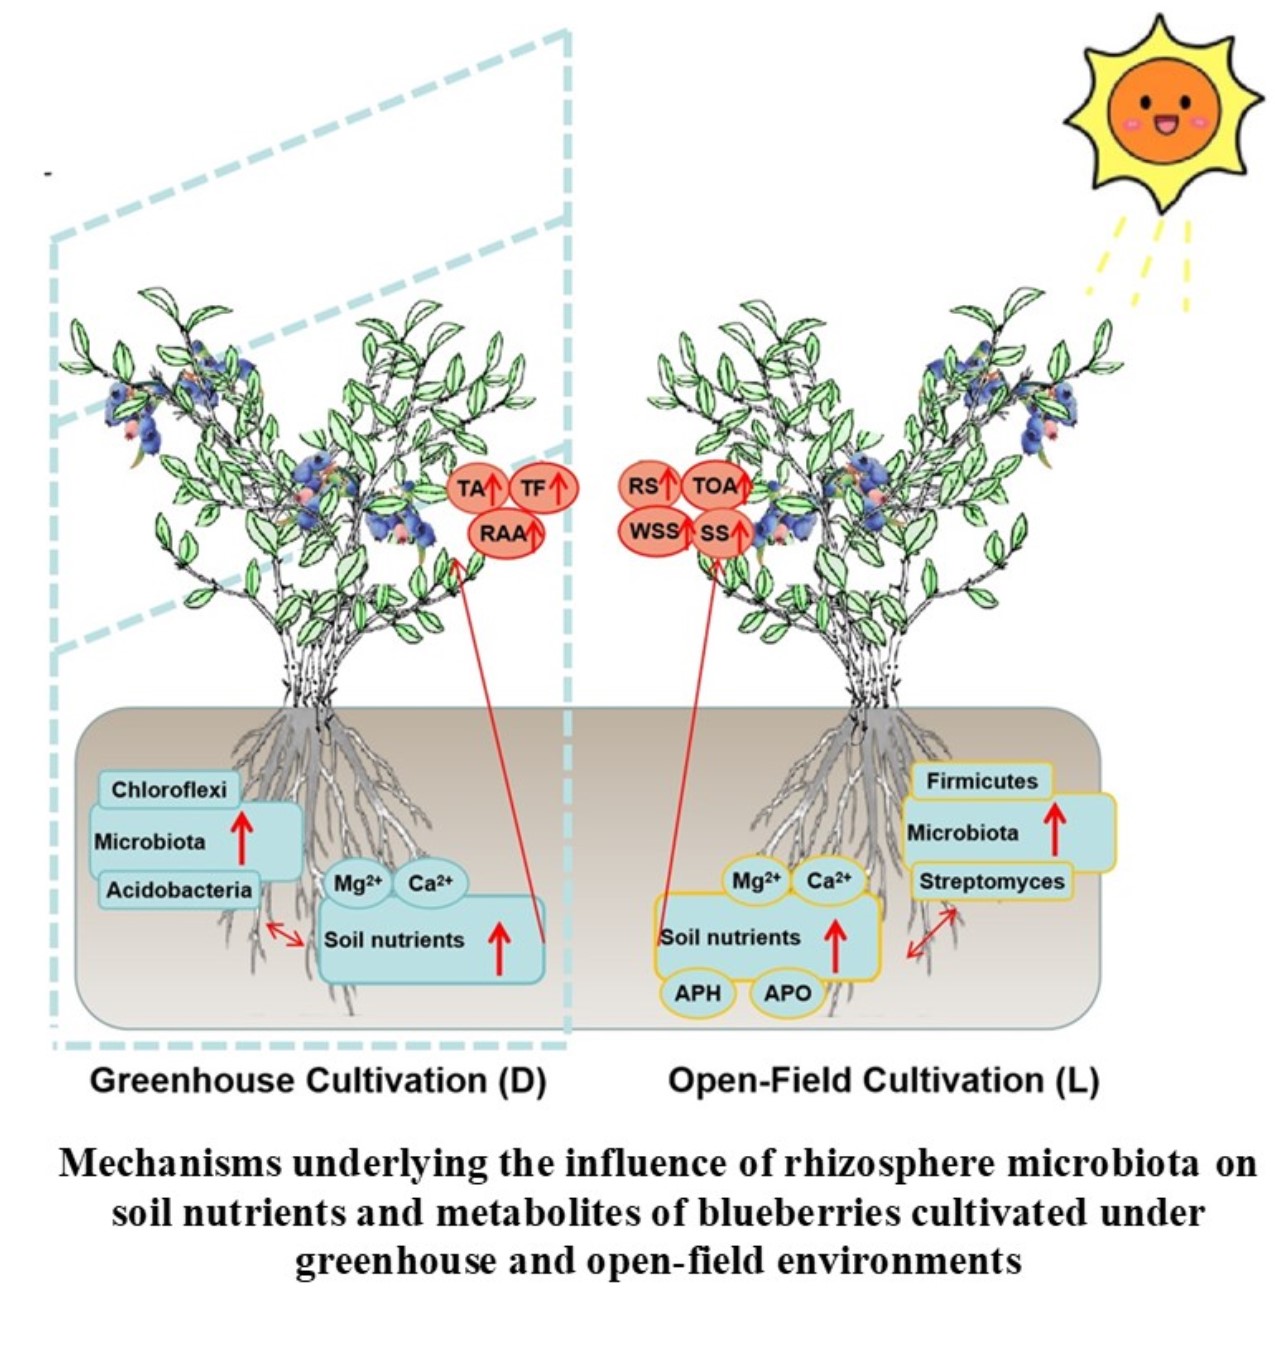
This study revealed that highbush blueberry (Vaccinium corymbosum L.) plants cultivated in distinct cultivation systems (greenhouse vs. open field) exhibited significant differences in rhizosphere microbiota, soil nutrient profiles, and fruit metabolites. Metabolite profiling revealed a significant trade-off: fruits from the open field accumulated significantly higher levels of secondary metabolites, including anthocyanins (9.5% higher; 1.85 ± 0.03 vs. 1.69 ± 0.03 μmol/g; p = 0.002), flavonoids (56.0% higher; 0.39 ± 0.01 vs. 0.25 ± 0.03 mg/g; p = 0.007), and ascorbic acid (15.6% higher; 144.71 ± 3.80 vs. 125.19 ± 3.99 μg/g; p = 0.003). In contrast, greenhouse fruits were enriched in primary metabolites such as water-soluble sugars (28.3% higher; 109.96 ± 4.73 vs. 85.70 ± 2.91 mg/g; p = 0.006) and total organic acids (30.2% higher; 19.39 ± 0.31 vs. 14.89 ± 0.55 mg/g; p < 0.001). These divergent profiles were associated with distinct rhizosphere microenvironments: the open field treatment sustained higher OC and microbial α-diversity (Shannon index), while the greenhouse system formed a high-availability cation niche characterized by lower pH, higher EC, and elevated levels of exchangeable Ca²⁺, Mg²⁺, and available potassium (APO). The cultivation systems re-engineered the rhizosphere microbiota assembly, resulting in distinct communities (assessed by principal coordinates analysis (PCO) based on UniFrac distances). Notably, the greenhouse soil was associated with a higher relative abundance of copiotrophic bacterial taxa such as Streptomyces and Bacillus. Their relative abundances showed strong positive correlations with cation availability (e.g., Streptomyces vs. Ca²⁺, *r* = 0.827), suggesting a potential ecological linkage, though causation cannot be inferred from these correlative data alone. Multivariate correlation and principal component analysis (PCA) integrated these patterns and revealed that soil cations (Ca²⁺, Mg²⁺, APO) were negatively correlated with fruit antioxidants but positively linked to sugars/acids, and the key microbial taxa (e.g., Bacillus, Chloroflexi) were major contributors to the difference of fruit quality traits. The findings highlight that the cultivation systems is strongly associated with fruit quality by selectively shaping a functionally specific rhizosphere microbiota, which co-varies with a shift in the plant's resource allocation between growth (primary metabolism) and defense (secondary metabolism). This work provides an integrative correlation and proposes framework for understanding how agricultural practices manipulate the soil-plant-microbe continuum to direct crop quality in perennial systems. Our findings, primarily correlative, reveal a consistent cultivation systems-level association between the cultivation environment, rhizosphere properties, and fruit metabolism. This work provides an integrative correlative framework for understanding how agricultural practices manipulate the soil-plant-microbe continuum to direct crop quality in perennial systems and proposes testable hypotheses for future mechanistic investigations.
Keywords:
cultivation system
; agroecosystem
; habitat filtering
; plant-microbe interactions
; primary and secondary metabolism
; perennial fruit crops
; agrocultivation systems management
1. Introduction
Highbush blueberry (Vaccinium corymbosum L.), renowned for its flavorful and nutrient-rich fruits, thrives in specific acidic soil conditions facilitated by its fine, fibrous root system [1]. In perennial fruit crops like blueberry, the rhizosphere microbiota is not merely a transient community but a stable interface critical for long-term nutrient acquisition and stress resilience [2]. The assembly of this microbiota is a product of both the soil physicochemical matrix, which acts as a primary “habitat filter”, and host plant selection [3]. Consequently, agricultural practices that alter the soil environment are potent drivers of rhizosphere community restructuring, with potential cascading effects on crop performance and quality [4].
In perennial cropping systems, the contrast between protected (e.g., greenhouse) and open-field cultivation represents a profound cultivation systems-level intervention. Evidence from perennial fruits demonstrates that such management shifts consistently re-engineer the rhizosphere microenvironment. Protected cultivation often leads to soil acidification, salinization, and the accumulation of soluble cations (e.g., K⁺, Ca²⁺, Mg²⁺), creating a high-availability, low-stress nutrient niche [5]. This niche selectively enriches for copiotrophic bacterial taxa such as Bacillus and Streptomyces, which thrive in resource-rich conditions and possess plant growth-promoting traits [6,7]. Causative studies have linked these community shifts directly to altered soil properties under protected environments [8]. Conversely, open-field systems typically maintain higher soil organic matter, greater physicochemical heterogeneity, and exposure to environmental fluctuations, fostering more diverse microbial communities with a higher abundance of oligotrophic taxa like Acidobacteriota, which are adapted to slower nutrient mineralization cycles [9,10].
The metabolic profile of a plant represents a functional readout of its physiological state and adaptive strategy. Primary metabolites, such as sugars, organic acids, and amino acids, are directly involved in fundamental processes like growth, development, and energy metabolism. In contrast, secondary metabolites, including phenolic compounds (e.g., anthocyanins, flavonoids) and ascorbic acid, are primarily synthesized for plant defense against abiotic (e.g., UV radiation, temperature extremes) and biotic (e.g., pathogens, herbivores) stresses. These compounds are crucial for plant adaptation and resilience in fluctuating environments. Importantly, in fruit crops like blueberry, these secondary metabolites are also key determinants of fruit nutritional quality and health benefits for consumers, making their accumulation a critical target for quality-oriented cultivation. The biosynthesis of secondary metabolites is energetically costly and is theorized to trade off with resources allocated for growth and primary metabolism—a central tenet of the plant growth-defense trade-off theory.
Building upon this metabolic framework, these cultivation-driven microbial shifts are not merely compositional but are hypothesised to be functional. The enrichment of copiotrophic, plant growth-promoting rhizobacteria (PGPR) in stabilized environments is associated with enhanced nutrient solubilization and auxin production, potentially biasing plant resource allocation toward growth and primary metabolism [11,12]. In contrast, the diverse and stress-associated microbiota of open fields, along with abiotic factors like UV exposure, may act as mild biotic/abiotic elicitors, priming jasmonic acid and salicylic acid pathways and upregulating plant defense and secondary metabolism [13,14]. This aligns with the central ecological theory of a plant growth-defense trade-off [15]. While correlations between soil microbes and blueberry fruit quality exist [16], and the separate links between cultivation→microbiota and microbiota→plant physiology are established in model systems, an integrated understanding of how the cultivation systems filters a functionally specific microbiota that subsequently mediates a systematic fruit metabolite trade-off in a perennial crop remains elusive.
Therefore, we hypothesize that, Greenhouse and open-field cultivation systemss create distinct rhizosphere physicochemical niches (e.g., high-availability cations vs. higher organic carbon) that serve as habitat filters, selecting for divergent microbial communities (copiotrophic-dominated vs. diverse/oligotrophic-enriched). And, these distinct microbiotas, coupled with the prevailing soil nutrient availability, are associated with a reprogramming of the host plant’s metabolic strategy, leading to a measurable trade-off in blueberry fruit profiles—favoring primary metabolites (sugars, organic acids) in greenhouses and secondary metabolites (anthocyanins, flavonoids, ascorbic acid) in open fields.
This study tests this hypothesis by integrating time-series rhizosphere microbiota analysis, soil nutrient profiling, and fruit metabolomics in blueberry. While our approach is observational and treats each cultivation system as an integrated ‘cultivation systems package’, it is designed to document whether a coherent, system-level association exists along the cultivation–soil–microbiota–fruit metabolome continuum. The resulting framework aims to move beyond correlation and propose a testable mechanistic model for how agricultural practices manipulate crop quality through the rhizosphere microbiota.
2. Materials and Methods
2.1. Collection of Soil Samples
Rhizosphere soil samples were collected from the roots of southern highbush blueberry (Vaccinium corymbosum L.) plants cultivated under open field and greenhouse conditions at distinct growth stages according to Wang et al. [9]. Specifically, soil was collected from a depth of 5–20 cm around the base of blueberry plant trunks, following the same protocol. The sampling site was located at 33°12‘01”N–33°12‘10”N, 107°34’29”E–107°34‘49”E, with an elevation of 623.5–624.2 masl. All sampled plants were mature, 3-year-old southern highbush blueberry bushes that had been established under their respective cultivation systems (greenhouse or open field) since planting. Sampling times and corresponding sample designations as well as the monthly average temperature at the time of sample collection are provided in Table 1. Relative humidity in greenhouse system was maintained at a level of 60-70%, whereas, in open field system, irrigation regimes were modulated according to actual weather conditions to maintain appropriate soil moisture levels around the rhizosphere. For each cultivation method and at each sampling time, three biological replicate soil samples were collected. Sampling points were distributed throughout the cultivation area to ensure that replicates were spatially independent. three replicate soil samples were collected from three individual blueberry plants spaced at least 5 meters. The soil from each sampling point was thoroughly homogenized to form a composite sample and stored at 4 °C prior to analysis.
Soil Characteristics. The experimental site featured a typical sandy loam soil. Key physicochemical properties of the bulk soil (0-20 cm depth), determined prior to the establishment of the cultivation systems, were as follows: pH (H₂O, 1:2.5), 5.2 ± 0.1; organic matter content, 1.85 ± 0.15%; total nitrogen (TN), 0.92 ± 0.08 g kg⁻¹; available phosphorus (AP, Olsen-P), 15.2 ± 1.5 mg kg⁻¹; and available potassium (AK), 85 ± 7 mg kg⁻¹ (values are mean ± standard deviation, n=3). These baseline properties indicate an acidic, moderately fertile soil representative of the local conditions and are within the suitable range for southern highbush blueberry cultivation.
Light Regime. The open-field system relied solely on natural sunlight under ambient photoperiod conditions. In the greenhouse system, plants received natural sunlight transmitted through the polyethylene covering. No supplemental artificial lighting was used in the greenhouse throughout the experiment.
During the experiment, divergent fertilization and irrigation regimes were applied according to standard practices for each system. The greenhouse system received integrated drip irrigation and fertilization, with a compound fertilizer (N-P₂O₅-K₂O: 20-20-20) applied at a rate of approximately 25 kg ha⁻¹ every 4-6 weeks during the growing season. The open-field system relied on a combination of overhead irrigation and controlled-release fertilizer applied biannually in spring and early summer, with an annual total equivalent to the greenhouse input. These management differences are intrinsic to the cultivation systems and are the primary drivers of the divergent rhizosphere microenvironments investigated in this study.
2.2. Collection and Nutritional Components Analysis of Blueberry Sample
Harvest times were different between the two cultivation methods. The greenhouse-grown blueberries were harvested in March 2025, while the open field blueberries were harvested in May 2025. Fruits were harvested at commercial maturity, determined by full blue skin coloration and uniform firmness. Three independent biological replicates were established for each cultivation system, with each replicate comprising a composite sample of approximately 100 fresh fruits randomly collected from 10 individual plants across the cultivation area.
Total anthocyanin (TA) content was determined using the pH differential method [10]. Briefly, homogenized fruit tissue was extracted with acidified methanol (1% HCl, v/v) at 4 °C in the dark for 24 h. The absorbance of the supernatant was measured at 520 nm and 700 nm in buffers at pH 1.0 (potassium chloride) and pH 4.5 (sodium acetate). The concentration was calculated using a molar extinction coefficient of cyanidin-3-glucoside (ε = 26,900 L·mol⁻¹·cm⁻¹) and expressed as cyanidin-3-glucoside equivalents. Total flavonoid (TF) content was measured by the aluminum chloride colorimetric assay [11]. An aliquot of the extract was mixed with an equal volume of 2% AlCl₃ (in methanol). After incubation for 30 min at room temperature, the absorbance was measured at 415 nm. A standard curve was prepared using rutin, and results were expressed as mg rutin equivalent per gram fresh weight. Reducing sugar (RS) content was quantified spectrophotometrically [12]. The reaction mixture was heated in a boiling water bath for 5 min, cooled, and the absorbance was read at 540 nm. D-Glucose was used as the standard. Total amino acid (TAA) content was determined spectrophotometrically [13]. The extract was reacted with ninhydrin reagent in a boiling water bath for 15 min. After cooling, the absorbance was measured at 570 nm. Glycine was used to generate the standard curve. Water-soluble sugar (WSS) and total organic acid (TOA) contents were analyzed using high-performance liquid chromatography [14]. For sugars, separation was performed on a carbohydrate analysis column (Waters XBridge Amide, 3.5 μm, 4.6 × 150 mm) with a refractive index detector. The mobile phase was acetonitrile:water (75:25, v/v) at a flow rate of 1.0 mL/min. Sucrose, D-glucose, and D-fructose were used as standards. For organic acids, separation was achieved on a C18 reverse-phase column (Agilent ZORBAX SB-Aq, 5 μm, 4.6 × 250 mm) with a UV detector set at 210 nm. The mobile phase was 0.01 M potassium phosphate buffer (pH 2.8) at a flow rate of 0.8 mL/min. Citric, malic, and quinic acids were used as primary standards. Soluble solids (SS) content was determined using near-infrared spectroscopy [15]. The instrument was calibrated using standard sucrose solutions prior to use. Homogenized fruit puree was scanned directly, and the soluble solids content was derived from the built-in prediction model. Reduced ascorbic acid (RAA) content was quantified by a spectrophotometric colorimetric method [12]. The fruit extract in 2% metaphosphoric acid was reacted with the dye, and the decrease in absorbance at 518 nm was measured. L-Ascorbic acid was used as the standard.
2.3. Analysis of Microbial Community
Soil microbial communities were characterized using high-throughput amplicon sequencing. A total of 36 rhizosphere soil samples were analyzed (2 cultivation systems × 6 time points × 3 biological replicates).
Total genomic DNA was extracted from 0.5 g of soil using the FastDNA Spin Kit for Soil (MP Biomedicals, USA) following the manufacturer’s instructions. The V4 region of the bacterial 16S rRNA gene was amplified using the primer pair 515F (5′-GTGYCAGCMGCCGCGGTAA-3′) and 806R (5′-GGACTACNVGGGTWTCTAAT-3′). For fungal community analysis, the ITS2 region was targeted using the primer pair ITS3 (5′-GCATCGATGAAGAACGCAGC-3′) and ITS4 (5′-TCCTCCGCTTATTGATATGC-3′).
PCR amplifications were performed in a Bio-Rad S1000 Thermal Cycler (Bio-Rad Laboratories, USA). The bacterial 16S rRNA gene amplification protocol consisted of initial denaturation at 95 °C for 3 min, followed by 30 cycles of denaturation at 95 °C for 30 s, annealing at 55 °C for 30 s, and extension at 72 °C for 45 s, with a final extension at 72 °C for 10 min. The fungal ITS amplification utilized the same thermal cycling conditions.
Amplicons from all samples were purified, quantified using a Qubit fluorometer (Thermo Fisher Scientific, USA), and pooled in equimolar ratios. Sequencing libraries were constructed using the NEBNext Ultra DNA Library Prep Kit (New England Biolabs, USA). Paired-end sequencing (2 × 250 bp) was performed on an Illumina HiSeq 2500 platform (Illumina, USA).
Raw demultiplexed sequences were quality-filtered, denoised, and merged into amplicon sequence variants (ASVs) using the DADA2 pipeline [17] within QIIME2 (version 2021.11) [18]. Taxonomic classification was performed against the SILVA 138 database [19] for bacteria and the UNITE 8.0 database [20] for fungi. Alpha diversity indices (Chao1, Shannon, and Simpson) were calculated using QIIME2 [18]. Beta diversity was assessed through principal coordinates analysis (PCoA) based on Bray-Curtis distances. Differential abundance analysis was performed using linear discriminant analysis effect size (LEfSe) with an LDA score threshold of 2.0 [21].
2.4. Determination of Nutritional Elements in Plant and Rhizosphere Soil
Organic carbon (OC) content, total nitrogen (TN) content, total phosphorus (TPH) content, total potassium (TPO) content, hydrolysable nitrogen (HN) content, available phosphorus (APH) content, and available potassium (APO) content in the samples collected on day 10 after root irrigation were determined as the methods described by Wang et al. [9]. Exchangeable cations (Na+, Ca2+, and Mg2+) were extracted using 0.1 M BaCl2 and measured by flame photometry [16](Houba et al., 1995). After soil sample was mixed with water at a soil:water ratio of 1:2.5, then pH and electrical conductivity (EC) measurements were performed using a Hanna HI9813-6 portable pH/EC meter [22].
2.5. Statistical Analysis
All experiments were conducted with three biological replicates. Data are presented as mean ± standard deviation (SD). To assess the significant differences in soil physicochemical properties, fruit metabolites, and microbial alpha diversity indices between the two cultivation systems (greenhouse vs. open field), independent two-sample Student’s t-tests were performed using SPSS Statistics 23.0 (IBM Corp., USA). A p-value of less than 0.05 was considered statistically significant. The statistical methodology for microbial beta diversity and differential abundance analysis (e.g., PCoA, LEfSe) is described in section 2.3. Multivariate correlations (e.g., Spearman’s) and PCA were conducted using R (version 4.1.0).
3. Results
3.1. Divergent Fruit Metabolic Profiles in Blueberries Cultivated in the Two Systems
Metabolic profiling revealed a clear trade-off between primary and secondary metabolism that was statistically significant and aligned with the cultivation system (Figure 1). Greenhouse blueberries accumulated significantly more primary metabolites: reducing sugars (RS: 108.87 ± 5.28 vs. 98.64 ± 0.59 mg/g; p =0.003; Figure 1c), water soluble sugars (WSS: 109.96 ± 4.73 vs. 85.70 ± 2.91 mg/g; p =0.006; Figure 1e), total organic acids (TOA: 19.39 ± 0.31 vs. 14.89 ± 0.55 mg/g; Figure 1f), and soluble solids (SS: 0.14 ± 0.00 vs. 0.11 ± 0.00 g/g; Figure 1g). Conversely, open field cultivation significantly enhanced concentrations of secondary metabolites: total anthocyanin (TA: 1.69 ± 0.03 vs. 1.85 ± 0.03 μmol/g; p =0.002; Figure 1a), total flavonoids (TF : 0.39 ± 0.01 vs. 0.25 ± 0.03 mg/g; p =0.007; Figure 1b) and reduced ascorbic acid (RAA: 144.71 ± 3.80 vs. 125.19 ± 3.99 μg/g; p =0.003; Fig. h). However, no difference was observed in total amino acid (TAA) content between the two cultivation methods. The TAA content for both greenhouse (D) and open field (L) blueberries was 0.58 μmol/g FW (±0.03 and ±0.02, respectively; p =0.07; Figure 1d). This metabolic divergence indicated a system-level reprogramming to blueberry plant metabolism.
3.2. Cultivation Systems Drives Rhizosphere microbiota Assembly and Diversity
Microbial community analysis revealed distinct differences in the composition and diversity of rhizosphere microorganisms between greenhouse-cultivated (D) and open field-grown (L) blueberry plants. At the phylum level, the bacterial communities in both cultivation systems were dominated by Proteobacteria, Actinobacteriota, Acidobacteriota, Chloroflexi, and Firmicutes (Figure 2a). Fungal communities were primarily composed of Ascomycota, Basidiomycota, Rozellomycota, and Mortierellomycota (Figure 2c). Heatmaps at the genus level further illustrated structural differences between the two groups, with clearly distinctive separation in both bacterial and fungal compositions (Figure 2b, d).
Alpha diversity analysis indicated that open field-grown blueberries harbored significantly higher bacterial diversity, as reflected by the Shannon index (community diversity; Figure 2e), and greater species richness, as indicated by the Chao1 index (Figure 2f). Similarly, fungal communities in the open field system also showed higher diversity (Shannon index; Figure 2g) and richness (Chao1 index; Figure 2h) compared to the greenhouse system.
Beta diversity analysis based on unweighted UniFrac distances revealed significant phylogenetic separation between the bacterial communities of the two cultivation methods (Figure 2i). Non-metric Multidimensional Scaling (NMDS) plots further confirmed structural differences in both bacterial (Figure 2k) and fungal (Figure 2l) communities, indicating that cultivation environment strongly influenced microbial assembly in the blueberry rhizosphere.
Supplementary analysis (Figure 1S) through Venn diagrams highlighted a greater number of unique bacterial and fungal species in the open field system, suggesting a more diverse and specialized microbial niche under traditional cultivation. LEfSe analysis (LDA ≥ 4.0) identified several differentially abundant taxa at phylum, class, order, family, genus, and species levels in both bacterial and fungal communities, underscoring the microenvironment-specific microbial recruitment under greenhouse and open field conditions.
These findings demonstrated that the bacterial and fungal community structures were profoundly different between greenhouse and open field conditions (Figure 2a-d). Beta diversity analysis (PCoA, NMDS) confirmed significant phylogenetic separation. It indicated that the cultivation systems was a primary determinant of microbial community assembly (Figure 2i, k, l). open field cultivation supported significantly higher bacterial and fungal alpha diversity (Shannon and Chao1 indices; Figure 2e-h) and hosted a greater number of unique OTUs (Figure 1S). It suggested a more complex and niche-differentiated microbial community. LEfSe analysis identified multiple taxa differentially abundant between systems to show microenvironment-specific microbial selection.
3.3. System-Specific Rhizosphere Soil Physicochemical Niches
The physicochemical properties of blueberry rhizosphere soil differed between cultivation methods (Figure 3). The mean concentrations of exchangeable calcium (Ca²⁺) and magnesium (Mg²⁺) were higher in the greenhouse cultivation rhizosphere than in the open field cultivation (Figure 3i and 3j). Similarly, the mean content of available potassium (APO) was elevated under greenhouse conditions (Figure 3g). In contrast, the mean organic carbon (OC) content was lower in the greenhouse cultivation rhizosphere (Figure 3a). The mean values for total nitrogen (TN), total phosphorus (TPH), total potassium (TPO), hydrolysable nitrogen (HN), available phosphorus (APH), and sodium ion (Na⁺) concentrations showed less pronounced differences between the two methods (Figure 3b, c, d, e, f, h).
Regarding soil properties, the mean pH of the rhizosphere soil under greenhouse cultivation was lower than that under open field cultivation, while the mean soil electrical conductivity (EC) was higher in the greenhouse environment (Figure 3k, l).
These patterns suggest that the greenhouse system tended to form a niche with higher levels of soluble cations and salts, alongside lower pH and OC, whereas the open field system maintained a higher OC environment.
3.4. Integrated Analysis for the Links of Rhizosphere Microenvironment to Fruit Quality Through Microbial Associations
Integrated correlation and principal component analyses were carried out to assess the associations among rhizosphere soil nutrients, microbial communities, and fruit quality parameters under the two cultivation systems. The correlation heatmap (Figure 4) and statistical analysis (Tables S1, S2) revealed a network of significant associations. Notably, soil exchangeable cations (Ca²⁺ and Mg²⁺) and available potassium (APO) showed consistent and significantly negative correlations with key antioxidant compounds, including total anthocyanins (TA) and total flavonoids (TF). Conversely, these soil nutrients were positively correlated with sugar and acid components, such as water-soluble sugars (WSS) and total organic acids (TOA). This pattern underscored a fundamental trade-off between primary and secondary metabolism in fruit which linked to soil nutrient availability.
The analysis further identified specific microbial linkages within this network. The bacterial phyla Firmicutes and Bacteroidota, which were enriched in the greenhouse cultivation (D), demonstrated significant positive correlations with Ca²⁺, Mg²⁺, and APO. Specific genera within these phyla, such as Streptomyces and Bacillus, also showed strong positive correlations with these nutrients (e.g., Streptomyces vs. Ca²⁺, r = 0.827, p < 0.01). In contrast, the phylum Acidobacteriota, which was more abundant in the open field cultivation (L), was generally negatively correlated with the same set of nutrients.
Principal component analysis (PCA) provided an integrated visualization of these associations (Table S3). The first two principal components effectively captured the covariance structure among the variables. Loadings analysis indicated that soil factors (especially Mg²⁺, pH, and OC) and specific microbial taxa (e.g., Bacillus, Chloroflexi) were the major contributors to the separation along the principal components.
4. Discussion
4.1. Observed Metabolic Trade-Offs Between Cultivation Systems
Our data reveal a clear divergence in the metabolite profiles of blueberries from the two cultivation systems. Fruits from greenhouse cultivation contained consistently higher levels of primary metabolites such as reducing sugars, water-soluble sugars, total organic acids, and soluble solids. Conversely, fruits from open field cultivation exhibited significantly greater concentrations of secondary metabolites, including total anthocyanins, total flavonoids, and reduced ascorbic acid.
The pronounced enrichment of antioxidant secondary metabolites (anthocyanins, flavonoids, ascorbic acid) in open-field blueberries is of particular note, as it directly aligns with and reinforces the well-documented high biological value of Vaccinium corymbosum L. fruits. Extensive literature characterizes highbush blueberries as a rich source of these bioactive compounds, which are responsible for their strong antioxidant capacity and associated health benefits. Our finding that open-field conditions further amplify this inherent trait underscores the significant role of cultivation environment in modulating the nutraceutical potential of this crop. This pattern also aligns with observations in other perennial fruits [23], supporting the broader ecological principle of a resource allocation trade-off between growth (primary metabolism) and defense/adaptation (secondary metabolism).
However, it is critical to distinguish between observation and mechanism. While we document this systematic association, our study design cannot identify the specific drivers behind it. The metabolic shift could be a direct response to contrasting aerial environments (e.g., light, temperature), a consequence of differences in rhizosphere conditions (soil nutrients and microbiota), or, most plausibly, a result of the integrated effect of the entire cultivation systems package. The lack of significant difference in total amino acid content suggests that the observed shift may primarily involve carbon metabolism, but this interpretation is constrained by the limited scope of our metabolic profiling.
4.2. Distinct Rhizosphere Microbial Communities Associate with Cultivation Systems
Our analyses revealed distinct differences in the composition and diversity of rhizosphere microbial communities between the two cultivation systems. We observed significantly higher bacterial and fungal alpha diversity (Shannon and Chao1 indices) in the open field system compared to the greenhouse (Figure 2e-h). Beta-diversity analyses (PCoA, NMDS) further confirmed that the bacterial and fungal communities were phylogenetically and structurally distinct between the systems (Figure 2i-l).
This pattern—higher microbial diversity and distinct community composition in the more heterogeneous open field environment—is consistent with well-established ecological principles. Heterogeneous environments typically support greater biodiversity and niche differentiation, whereas controlled settings like greenhouses can lead to biotic homogenization [24,25]. Thus, our observations align with the concept that the cultivation environment may act as a habitat filter, shaping microbial assembly.
Specific taxonomic shifts were notable. The greenhouse rhizosphere showed a relative enrichment of copiotrophic bacterial genera such as Streptomyces and Bacillus (Figure 2b), which are often associated with resource-rich conditions and possess plant growth-promoting potential [26,27]. In contrast, the open field system harbored a greater abundance of taxa like Acidobacteriota (Figure 2a), a phylum frequently linked to oligotrophic conditions and complex organic matter decomposition [28].
However, it is crucial to interpret these microbial associations within the context of the entire cultivation systems. The distinct communities we describe are correlated with the cultivation system, but they are likely not shaped by it in isolation. These microbial patterns could be a direct response to the contrasting soil physicochemical properties (discussed below), an indirect consequence of differences in plant physiology induced by the aerial environment, or, most realistically, a result of feedbacks among all these factors. Therefore, while the microbial community is a prominent and correlative component of each system’s distinct rhizosphere profile, our study cannot attribute its assembly solely to the cultivation practice as a deterministic force.
4.3. Contrasting Soil Physicochemical Niches Between Cultivation Systems
The rhizosphere soil physicochemical properties systematically differed between the greenhouse and open field systems (Figure 3). The greenhouse soil was characterized by a lower mean pH, higher electrical conductivity (EC), and elevated levels of exchangeable calcium (Ca²⁺), magnesium (Mg²⁺), and available potassium (APO). In contrast, the open field soil maintained a significantly higher mean organic carbon (OC) content.
This divergence suggests the formation of two distinct soil niches. The greenhouse conditions appear to foster a high-availability cation niche, which could be conducive to primary plant metabolism given the known roles of potassium in enzyme activation and sugar transport, and magnesium in photosynthesis [29,30]. The open field system, with its higher OC, likely supports a more complex soil food web and slower, more diverse nutrient mineralization pathways [31].
These contrasting soil niches are logically positioned to influence both the microbial community and the plant. The high cation availability and lower pH in the greenhouse could select for the observed copiotrophic, potentially salt-tolerant bacteria (e.g., Bacillus). Conversely, the high OC, more neutral pH environment of the open field could favor a broader range of oligotrophic and saprotrophic organisms, contributing to the higher overall diversity. Collectively, these results demonstrate that the cultivation system acts as a powerful habitat filter, shaping distinct rhizosphere physicochemical niches which, in turn, drive the assembly of divergent microbial communities.
A critical and unavoidable limitation of our study is that these soil properties were measured as part of the holistic cultivation systems package. We report a clear co-variation between cultivation system and soil niche, but we cannot definitively state that management practice caused the soil differences, nor that the soil differences caused the microbial shifts. For instance, differences in irrigation, fertilization, organic matter inputs, and even the moderating effect of the greenhouse structure on soil microclimate (temperature, moisture) are all confounded with the “cultivation system” variable. Therefore, we present these distinct soil niches as central and correlated features of the two cultivation systemss, which likely interact with the aerial environment to create the distinct contexts for plant growth and microbiota assembly.
4.4. Considering the Role of Environmental and Physiological Mediators
Interpreting differences between greenhouse and open field cultivation requires caution, as these systems differ in a suite of interrelated factors. In addition to the rhizosphere properties measured here, uncontrolled variables such as diurnal temperature variation, humidity, light intensity/quality, and atmospheric CO₂ levels inherently vary between the two environments. These aerial factors are known to directly affect photosynthetic efficiency and stress responses, thereby influencing fruit metabolite profiles [32,33].
Therefore, the correlations established in this study between the rhizosphere and the fruit metabolome (Figure 4) should be interpreted as describing system-level associations within two distinct agrocultivation systems packages [34]. Our data robustly show that each system packages a unique set of aerial conditions with a correspondingly distinct rhizosphere niche and microbiota (Figure 2 and Figure 3; Table 1). The logical consistency of the observed patterns—where a high-availability cation niche and copiotrophic bacteria coincide with fruit high in primary metabolites, and a carbon-rich, diverse microbiota coincides with fruit high in antioxidants—provides a foundational correlation that justifies future mechanistic investigation. To isolate the specific role of the rhizosphere microbiota, controlled experiments (e.g., soil transplant or microbial inoculation studies under shared environmental conditions) are necessary [35]. Furthermore, incorporating direct plant physiological measurements (e.g., leaf nutrient status, photosynthetic rates) would be crucial to bridge the gap between soil microbial community structure and final fruit quality [36].
4.5. The Rhizosphere microbiota: A Putative Link Between Soil Niche and Fruit Metabolome
Based on the observed correlations, we propose a model in which the rhizosphere microbiota may act as a functional bridge. The tight coupling revealed by our integrated analysis is consistent with the hypothesis that the cultivation-system-shaped microbiota could be involved in shaping the plant‘s metabolic strategy. The greenhouse microenvironment, characterized by its high-availability cation niche and an enriched community of potential plant growth-promoting rhizobacteria (PGPR) such as Bacillus and Streptomyces, likely signals a “low-stress” state to the plant, directing resources toward growth and accumulation of primary metabolites in fruits. These bacteria may enhance this effect through nutrient solubilization or modulation of phytohormone networks (e.g., auxins) that favor primary metabolism.
Conversely, the open field environment presents an integrated set of biotic and abiotic cues. The higher microbial diversity, complex OC pool, and greater exposure to environmental fluctuations (e.g., UV-B, temperature variance) collectively create a milieu that may be perceived by the plant as mild stress, thereby priming defense responses [37,38]. The open field-adapted microbiota, including taxa like Acidobacteriota, may contribute by decomposing complex organic matter and releasing a diverse array of metabolites that act as biotic elicitors. This, in concert with abiotic factors, likely activates defense-related phytohormone pathways (e.g., jasmonic acid, salicylic acid) and upregulates the biosynthesis of protective secondary metabolites [39]. This aligns perfectly with the plant growth-defense trade-off theory [7], where investment in defense is prioritized under conditions perceived as more challenging.
4.6. Limitations and Future Perspectives
This study provides a comprehensive correlation between cultivation systems, rhizosphere properties, and fruit metabolomes. However, several limitations should be acknowledged to guide future research. The lack of direct measurements of plant physiological parameters, such as leaf nutrient content (e.g., N, Mg) and photosynthetic capacity (e.g., chlorophyll content, net photosynthetic rate), restricts our ability to directly validate the “soil-plant-fruit” pathway. These data are critical to confirm whether the differential soil nutrients were actually absorbed and utilized by the plants to shape the observed metabolic shifts.
And, greenhouse and open field systems constitute fundamentally different environments, varying not only in rhizosphere conditions but also in aerial factors such as temperature fluctuations, light intensity/quality, humidity, and atmospheric CO₂ concentration. In this study, the cultivation system was treated as an integrated “cultivation systems package”. Therefore, the observed associations are the result of the combined effects of multiple co-varying factors. To isolate the specific role of the rhizosphere microbiota identified here, future controlled experiments are essential. These could include soil transplant studies or microbial inoculation trials (e.g., using synthetic communities containing key taxa like Bacillus and Streptomyces) conducted under shared environmental conditions. Additionally, integrating metatranscriptomics and plant hormone profiling could elucidate the functional mechanisms and molecular dialogues underlying the proposed microbiota-mediated metabolic reprogramming.
This study did not monitor dynamic soil environmental variables such as soil temperature and moisture content, which are known to be critical regulators of microbial activity, community composition, and nutrient cycling rates. The absence of these data means we cannot partition the observed microbial and nutrient differences between those driven by the cultivation system’s management (e.g., irrigation, cover) and those potentially attributable to differing soil microclimates. Future studies should incorporate continuous soil environmental monitoring to disentangle these interactive effects.
5. Conclusions
This comparative study revealed that blueberry plants grown in greenhouse and open field cultivation systemss develop distinct rhizosphere microenvironments and fruit metabolite profiles. We observed a systematic pattern: the greenhouse system was associated with a rhizosphere niche higher in available cations and enriched in copiotrophic bacterial taxa, coinciding with fruits higher in primary metabolites (sugars, organic acids). Conversely, the open field system was associated with higher soil organic carbon, greater microbial diversity, and fruits enriched in antioxidant secondary metabolites.
The integrated correlations suggest that the rhizosphere microbiota may be a key component linking the cultivation environment to fruit quality, although this remains a hypothesis to be tested. The major limitation of this work is the lack of plant physiological data and the confounding effects of aerial environmental factors, which preclude causal inference.
Therefore, our primary contribution is the description of this robust cultivation systems-level association and the generation of a clear, mechanistic hypothesis. Future studies employing soil transplants, microbial inoculations, and comprehensive plant physiological monitoring under controlled conditions are essential to isolate the role of the rhizosphere microbiota and validate the proposed links in the soil-plant-fruit continuum.
Supplementary Materials
The following supporting information can be downloaded at the website of this paper posted on Preprints.org, Figure S1: Microbial community analysis in the rhizosphere of blueberry plants; Table S1: Kendall’s correlation analysis of blueberry fruit quality parameters, rhizosphere microbial community structure and key rhizosphere nutrient element contents; Table S2: Spearman’s correlation analysis of blueberry fruit quality parameters, rhizosphere microbial community structure and key rhizosphere nutrient element contents; Table S3: Eigenvector of nine principal components of blueberry fruit quality parameters, rhizosphere microbial community structure and key rhizosphere nutrient element contents.
Author Contributions
Conceptualization, M.W. and Z.X.; methodology, M.W. and Z.X; software, M.W.; validation, M.W.; formal analysis, M.W.; investigation, M.W., D.B. and Y.L.; resources, M.W.; data curation, M.W.; writing—original draft preparation, M.W. and Z.X.; writing—review and editing, M.W. and Z.X.; visualization, M.W.; supervision, M.W.; project administration, M.W.; funding acquisition, M.W. All authors have read and agreed to the published version of the manuscript.
Funding
This research was funded by Key Research and Development Project of Shaanxi Provincial Department of Science and Technology (Agriculture and Rural Areas Field), grant number 2025NC-YBXM-241; 2024 Shaanxi Provincial Education Department Service Local Special Scientific Research Project (Industrialization Cultivation project), grant number 24JC028; Research and Demonstration on the Safe Utilization Technology of Agricultural Organic Waste, grant number 2025-CXY-071.
Data Availability Statement
Data is contained within the article or supplementary material.
Acknowledgments
The authors acknowledge the use of AI tools for English language editing and text refinement during the drafting stage of this manuscript. The tool was used solely for language polishing tasks such as grammar checking and sentence restructuring. All scientific content, hypotheses, data interpretation, and conclusions were solely generated and critically reviewed by the authors.
Conflicts of Interest
The authors have no conflicts of interest to declare.
List of Abbreviations for Analyzed Items
| APH | available phosphorus |
| APO | available potassium |
| EC | electric conductivity |
| HN | hydrolysable nitrogen |
| OC | Organic carbon |
| RAA | reduced ascorbic acid |
| RS | reducing sugar |
| SS | soluble solids |
| TA | total anthocyanin |
| TAA | total amino acid |
| TF | total flavonoid |
| TN | total nitrogen |
| TOA | total organic acid |
| TPH | total phosphorus |
| TPO | total potassium |
| WSS | water-soluble sugar |
| OTU | operational taxonomic unit |
| PCoA | principal coordinates analysis |
| PCA | principal component analysis |
| NMDS | non-metric multidimensional scaling |
| LEfSe | linear discriminant analysis effect size |
| ASV | amplicon sequence variant |
| PGPR | plant growth-promoting rhizobacteria |
References
- Fotirić-Akšić, M.; Dabić; Zagorac, D.; Sredojević, M.; Milivojević, J.; Gašić, U.; Meland, M.; Natić, M. Chemometric Characterization of strawberries and blueberries according to their phenolic profile: combined effect of cultivar and cultivation system. Molecules 2019, 24(23), 4310. [Google Scholar] [CrossRef]
- Wang, M.; Yang, X. Effects of plant growth-promoting rhizobacteria on blueberry growth and rhizosphere soil microenvironment. PeerJ. 2024, 12, e16992. [Google Scholar] [CrossRef] [PubMed]
- Singh, B.K.; Jiang, G.; Wei, Z.; Sáez-Sandino, T.; Gao, M.; Liu, H.; Xiong, C. Plant pathogens, microbiotas, and soil health. Trends Microbiol. 2025, 33(8), 887–902. [Google Scholar] [CrossRef]
- Riseh, R.S.; Fathi, F.; Vazvani, M.G.; Tarkka, M.T. Plant Colonization by Biocontrol Bacteria and Improved Plant Health: A Review. Front Biosci (Landmark Ed) 2025, 30(1), 23223. [Google Scholar] [CrossRef] [PubMed]
- Meisner, A.; Wepner, B.; Kostic, T.; van; Overbeek, L.S.; Bunthof, C.J.; de; Souza, R.S.C.; Olivares, M.; Sanz, Y.; Lange, L.; Fischer, D.; Sessitsch, A.; Smidt, H.; microbiotaSupport; Consortium. Calling for a systems approach in microbiota research and innovation. Curr Opin Biotechnol. 2022, 73, 171–178. [Google Scholar] [CrossRef]
- Vaupel, A.; Küsters, M.; Toups, J.; Herwig, N.; Bösel, B.; Beule, L. Trees shape the soil microbiota of a temperate agrosilvopastoral and syntropic agroforestry system. Sci Rep. 2025, 15(1), 1550. [Google Scholar] [CrossRef]
- Ansari, M.; Devi, B.M.; Sarkar, A.; Chattopadhyay, A.; Satnami, L.; Balu, P.; Choudhary, M.; Shahid, M.A.; Jailani, A.A.K. Microbial Exudates as Biostimulants: Role in Plant Growth Promotion and Stress Mitigation. J Xenobiot. 2023, 13(4), 572–603. [Google Scholar] [CrossRef]
- Kawash, J.; Oudemans, P.V.; Erndwein, L.; Polashock, J.J. Assessment and comparison of rhizosphere communities in cultivated Vaccinium spp. provide a baseline for study of causative agents in decline. Front Plant Sci. 2023, 14, 1173023. [Google Scholar] [CrossRef]
- Wang, M.; Sun, H.; Xu, L.; Xu, Z. Bacterial diversity in tea plant (Camellia sinensis) rhizosphere soil from Qinling Mountains and its relationship with environmental elements. Plant Soil. 2021, 460, 403–415. [Google Scholar] [CrossRef]
- Bennett, C.; Sookwong, P.; Jakmunee, J.; Mahatheeranont, S. Smartphone digital image colorimetric determination of the total monomeric anthocyanin content in black rice via the pH differential method. Anal Methods 2021, 13(30), 3348–3358. [Google Scholar] [CrossRef]
- Amran, N.; Rani, A.N.; Mahmud, R.; Yin, K.B. Antioxidant and cytotoxic effect of barringtonia racemosa and hibiscus sabdariffa fruit extracts in MCF-7 human breast cancer cell line. Pharmacognosy Res. 2016, 8(1), 66–70. [Google Scholar] [CrossRef]
- Al-Duais, M.; Hohbein, J.; Werner, S.; Böhm, V.; Jetschke, G. Contents of vitamin C, carotenoids, tocopherols, and tocotrienols in the subtropical plant species Cyphostemma digitatum as affected by processing. J Agric Food Chem. 2021, 57(12), 5420–7. [Google Scholar] [CrossRef]
- Luyckx, A.; Beghin, C.; Quinet, M.; Achadé, B.; Prodjinoto, H.; Gandonou, C.B.; Lutts, S. Salinity differently affects antioxidant content and amino acid profile in two cultivars of Amaranthus cruentus differing in salinity tolerance. J Sci Food Agric. 2021, 101(15), 6211–6219. [Google Scholar] [CrossRef]
- Raamussen, S.; Parsons, A.J.; Fraser, K.; Newman, J.A. Metabolic profiles of Lolium perenne are differentially affected by nitrogen supply, carbohydrate content, and fungal endophyte infection. Plant Physiol. 2008, 146(3), 1440–53. [Google Scholar] [CrossRef]
- Yuan, L.M.; You, L.; Yang, X.; Chen, X.; Huang, G.; Chen, X.; Shi, W.; Sun, Y. Consensual regression of soluble solids content in peach by near infrared spectrocopy. Foods 2022, 11(8), 1095. [Google Scholar] [CrossRef]
- Houba, V; Vanderlee, J.; Novozamsky, I. Soil analysis procedures (soil and plant analysis, part 5B), a series of syllabi. Sixth Edition. In The Netherlands: Department of Soil Science and Plant Nutrition; Wageningen Agricultural University, 1995. [Google Scholar]
- Callahan, B.J.; McMurdie, P.J.; Rosen, M.J.; Han, A.W.; Johnson, A.J.; Holmes, S.P. DADA2: High-resolution sample inference from Illumina amplicon data. Nat. Methods 2016, 13, 581–583. [Google Scholar] [CrossRef] [PubMed]
- Bolyen, E.; Rideout, J.R.; Dillon, M.R.; Bokulich, N.A.; Abnet, C.C.; Al-Ghalith, G.A.; Alexander, H.; Alm, E.J.; Arumugam, M.; Asnicar, F.; et al. Reproducible, interactive, scalable and extensible microbiome data science using QIIME 2. Nat Biotechnol. 2019, 37, 852–857. [Google Scholar] [CrossRef]
- Quast, C.; Pruesse, E.; Yilmaz, P.; Gerken, J.; Schweer, T.; Yarza, P.; Peplies, J.; Glöckner, F.O. The SILVA ribosomal RNA gene database project: improved data processing and web-based tools. Nucleic Acids Res. 2013, 41, D590–D596. [Google Scholar] [CrossRef] [PubMed]
- Kõljalg, U.; Nilsson, R.H.; Abarenkov, K.; Tedersoo, L.; Taylor, A.F.S.; Bahram, M.; Bates, S.T.; Bruns, T.D.; Bengtsson-Palme, J.; Callaghan, T.M.; Douglas, B.; Drenkhan, T.; Eberhardt, U.; Dueñas, M.; Grebenc, T.; Griffith, G.W.; Hartmann, M.; Kirk, P.M.; Kohout, P.; Larsson, E.; Lindahl, B.D.; Lücking, R.; Martín, M.P.; Matheny, P.B.; Nguyen, N.H.; Niskanen, T.; Oja, J.; Peay, K.G.; Peintner, U.; Peterson, M.; Põldmaa, K.; Saag, L.; Saar, I.; Schüßler, A.; Scott, J.A.; Senés, C.; Smith, M.E.; Suija, A; Taylor, D.L.; Telleria, M.T.; Weiss, M.; Larsson, KH. Towards a unified paradigm for sequence-based identification of fungi. Mol. Ecol. 2013, 22, 5271–5277. [Google Scholar] [CrossRef] [PubMed]
- Segata, N.; Izard, J.; Waldron, L.; Gevers, D.; Miropolsky, L.; Garrett, W.S.; Huttenhower, C. Metagenomic biomarker discovery and explanation. Genome Biol. 2011, 12, R60. [Google Scholar] [CrossRef]
- Dang, L.V.; Hung, N.N. Effects of the age of raised beds on the physicochemical characteristics of fruit orchard soil in the Vietnamese Mekong Delta. PeerJ. 2023, 11, e16178. [Google Scholar] [CrossRef] [PubMed]
- Xu, S.; Shi, D.; Chen, H.; Ma, F.; Tao, G.; Wu, W.; Lin, D.; Wu, S.; Fei, Q.; Hu, Y.; Meng, L. Substrate cultivation system improved the quality of ‘Hongyan’ strawberry fruits compared with the soil cultivation system. Food Chem. 2025, 485, 144430. [Google Scholar] [CrossRef] [PubMed]
- Dong, J.; Zhao, W.; Shi, P.; Zhou, M.; Liu, Z.; Wang, Y. Soil differentiation and soil comprehensive evaluation of in wild and cultivated Fritillaria pallidiflora Schrenk. Sci Total Environ. 2023, 872, 162049. [Google Scholar] [CrossRef] [PubMed]
- West, J.R.; Whitman, T. Disturbance by soil mixing decreases microbial richness and supports homogenizing community assembly processes. FEMS Microbiol Ecol. 2022, 98(9), fiac089. [Google Scholar] [CrossRef]
- Kapadia, C.; Patel, N.; Rana, A.; Vaidya, H.; Alfarraj, S.; Ansari, M.J.; Gafur, A.; Poczai, P.; Sayyed, R.Z. Evaluation of plant growth-promoting and salinity ameliorating potential of halophilic bacteria isolated from saline soil. Front Plant Sci. 2022, 13, 946217. [Google Scholar] [CrossRef]
- Qiao, R.; Xu, M.; Jiang, J.; Song, Z.; Wang, M.; Yang, L.; Guo, H.; Mao, Z. Plant growth promotion and biocontrol properties of a synthetic community in the control of apple disease. BMC Plant Biol. 2024, 24(1), 546. [Google Scholar] [CrossRef]
- Hausmann, B.; Pelikan, C.; Herbold, C.W.; Köstlbacher, S.; Albertsen, M.; Eichorst, S.A.; Glavina, Del; Rio, T.; Huemer, M.; Nielsen, P.H.; Rattei, T.; Stingl, U.; Tringe, S.G.; Trojan, D.; Wentrup, C.; Woebken, D.; Pester, M.; Loy, A. Peatland Acidobacteria with a dissimilatory sulfur metabolism. ISME J. 2018, 12(7), 1729–1742. [Google Scholar] [CrossRef] [PubMed]
- Armengaud, P.; Sulpice, R.; Miller, A.J.; Stitt, M.; Amtmann, A.; Gibon, Y. Multilevel analysis of primary metabolism provides new insights into the role of potassium nutrition for glycolysis and nitrogen assimilation in Arabidopsis roots. Plant Physiol. 2009, 150(2), 772–85. [Google Scholar] [CrossRef]
- Liu, Y.; Zhu, Q.; Li, R.; Wei, R.; Geng, X.; Zhang, X.; Wei, H.; Gao, P.; Xu, K.; Dai, Q.; Chen, Y. Foliar magnesium enhances rice salt tolerance by improving photosynthesis and regulating ion homeostasis. Front Plant Sci. 2025, 16, 1578023. [Google Scholar] [CrossRef]
- Johnson, D.C.; Teague, R.; Apfelbaum, S.; Thompson, R.; Byck, P. Adaptive multi-paddock grazing management’s influence on soil food web community structure for: increasing pasture forage production, soil organic carbon, and reducing soil respiration rates in southeastern USA ranches. PeerJ. 2022, 10, e13750. [Google Scholar] [CrossRef]
- Warner, R.; Wu, B.S.; MacPherson, S.; Lefsrud, M. A Review of Strawberry Photobiology and Fruit Flavonoids in Controlled Environments. Front Plant Sci. 2021, 12, 611893. [Google Scholar] [CrossRef]
- Kumar, S.; Tripathi, A.; Chakraborty, I.; Ghangrekar, M.M. Engineered nanomaterials for carbon capture and bioenergy production in microbial electrochemical technologies: A review. Bioresour Technol. 2023, 389, 129809. [Google Scholar] [CrossRef] [PubMed]
- Ganugi, P.; Fiorini, A.; Ardenti, F.; Caffi, T.; Bonini, P.; Taskin, E.; Puglisi, E.; Tabaglio, V.; Trevisan, M.; Lucini, L. Nitrogen use efficiency, rhizosphere bacterial community, and root metabolome reprogramming due to maize seed treatment with microbial biostimulants. Physiol Plant. 2022, 174(2), e13679. [Google Scholar] [CrossRef] [PubMed]
- Pantigoso, H.A.; Newberger, D.; Vivanco, J.M. The rhizosphere microbiota: Plant-microbial interactions for resource acquisition. J Appl Microbiol. 2022, 133(5), 2864–2876. [Google Scholar] [CrossRef] [PubMed]
- Henningsen, J.N.; Venturas, M.D.; Quintero, J.M.; Garrido, R.R.; Mühling, K.H.; Fernández, V. Leaf surface features of maize cultivars and response to foliar phosphorus application: effect of leaf stage and plant phosphorus status. Physiol Plant. 2023, 175(6), e14093. [Google Scholar] [CrossRef]
- Ramakrishna, A.; Ravishankar, G.A. Influence of abiotic stress signals on secondary metabolites in plants. Plant Signal Behav. 2011, 6(11), 1720–31. [Google Scholar]
- Lee, J.H.; Tanaka, S.; Goto, E. Growth and biosynthesis of phenolic compounds of Canola (Brassica napus L.) to different ultraviolet (UV)-B wavelengths in a plant factory with artificial light. Plants (Basel) 2022, 11(13), 1732. [Google Scholar] [CrossRef]
- Desmedt, W.; Jonckheere, W.; Nguyen, V.H.; Ameye, M.; De; Zutter, N.; De; Kock, K.; Debode, J.; Van; Leeuwen, T.; Audenaert, K.; Vanholme, B.; Kyndt, T. The phenylpropanoid pathway inhibitor piperonylic acid induces broad-spectrum pest and disease resistance in plants. Plant Cell Environ. 2021, 44(9), 3122–3139. [Google Scholar] [CrossRef]
Figure 1.
Nutritional composition comparison of highbush blueberry (V. corymbosum) fruits grown in greenhouse (D) and open field (L) cultivations. (a) Total anthocyanin (TA) content; (b) Total flavonoids (TF); (c) Reducing sugars (RS); (d) Total amino acids (TAA); (e) Water-soluble sugars (WSS); (f) Total organic acids (TOA); (g) Soluble solids (SS); (h) Reduced ascorbic acid (RAA). Notes: Values are presented as mean ± standard deviation. Different letters on bars in each group indicate that the data are significantly different between cultivation methods (*p < 0.05, independent two-sample t-test).
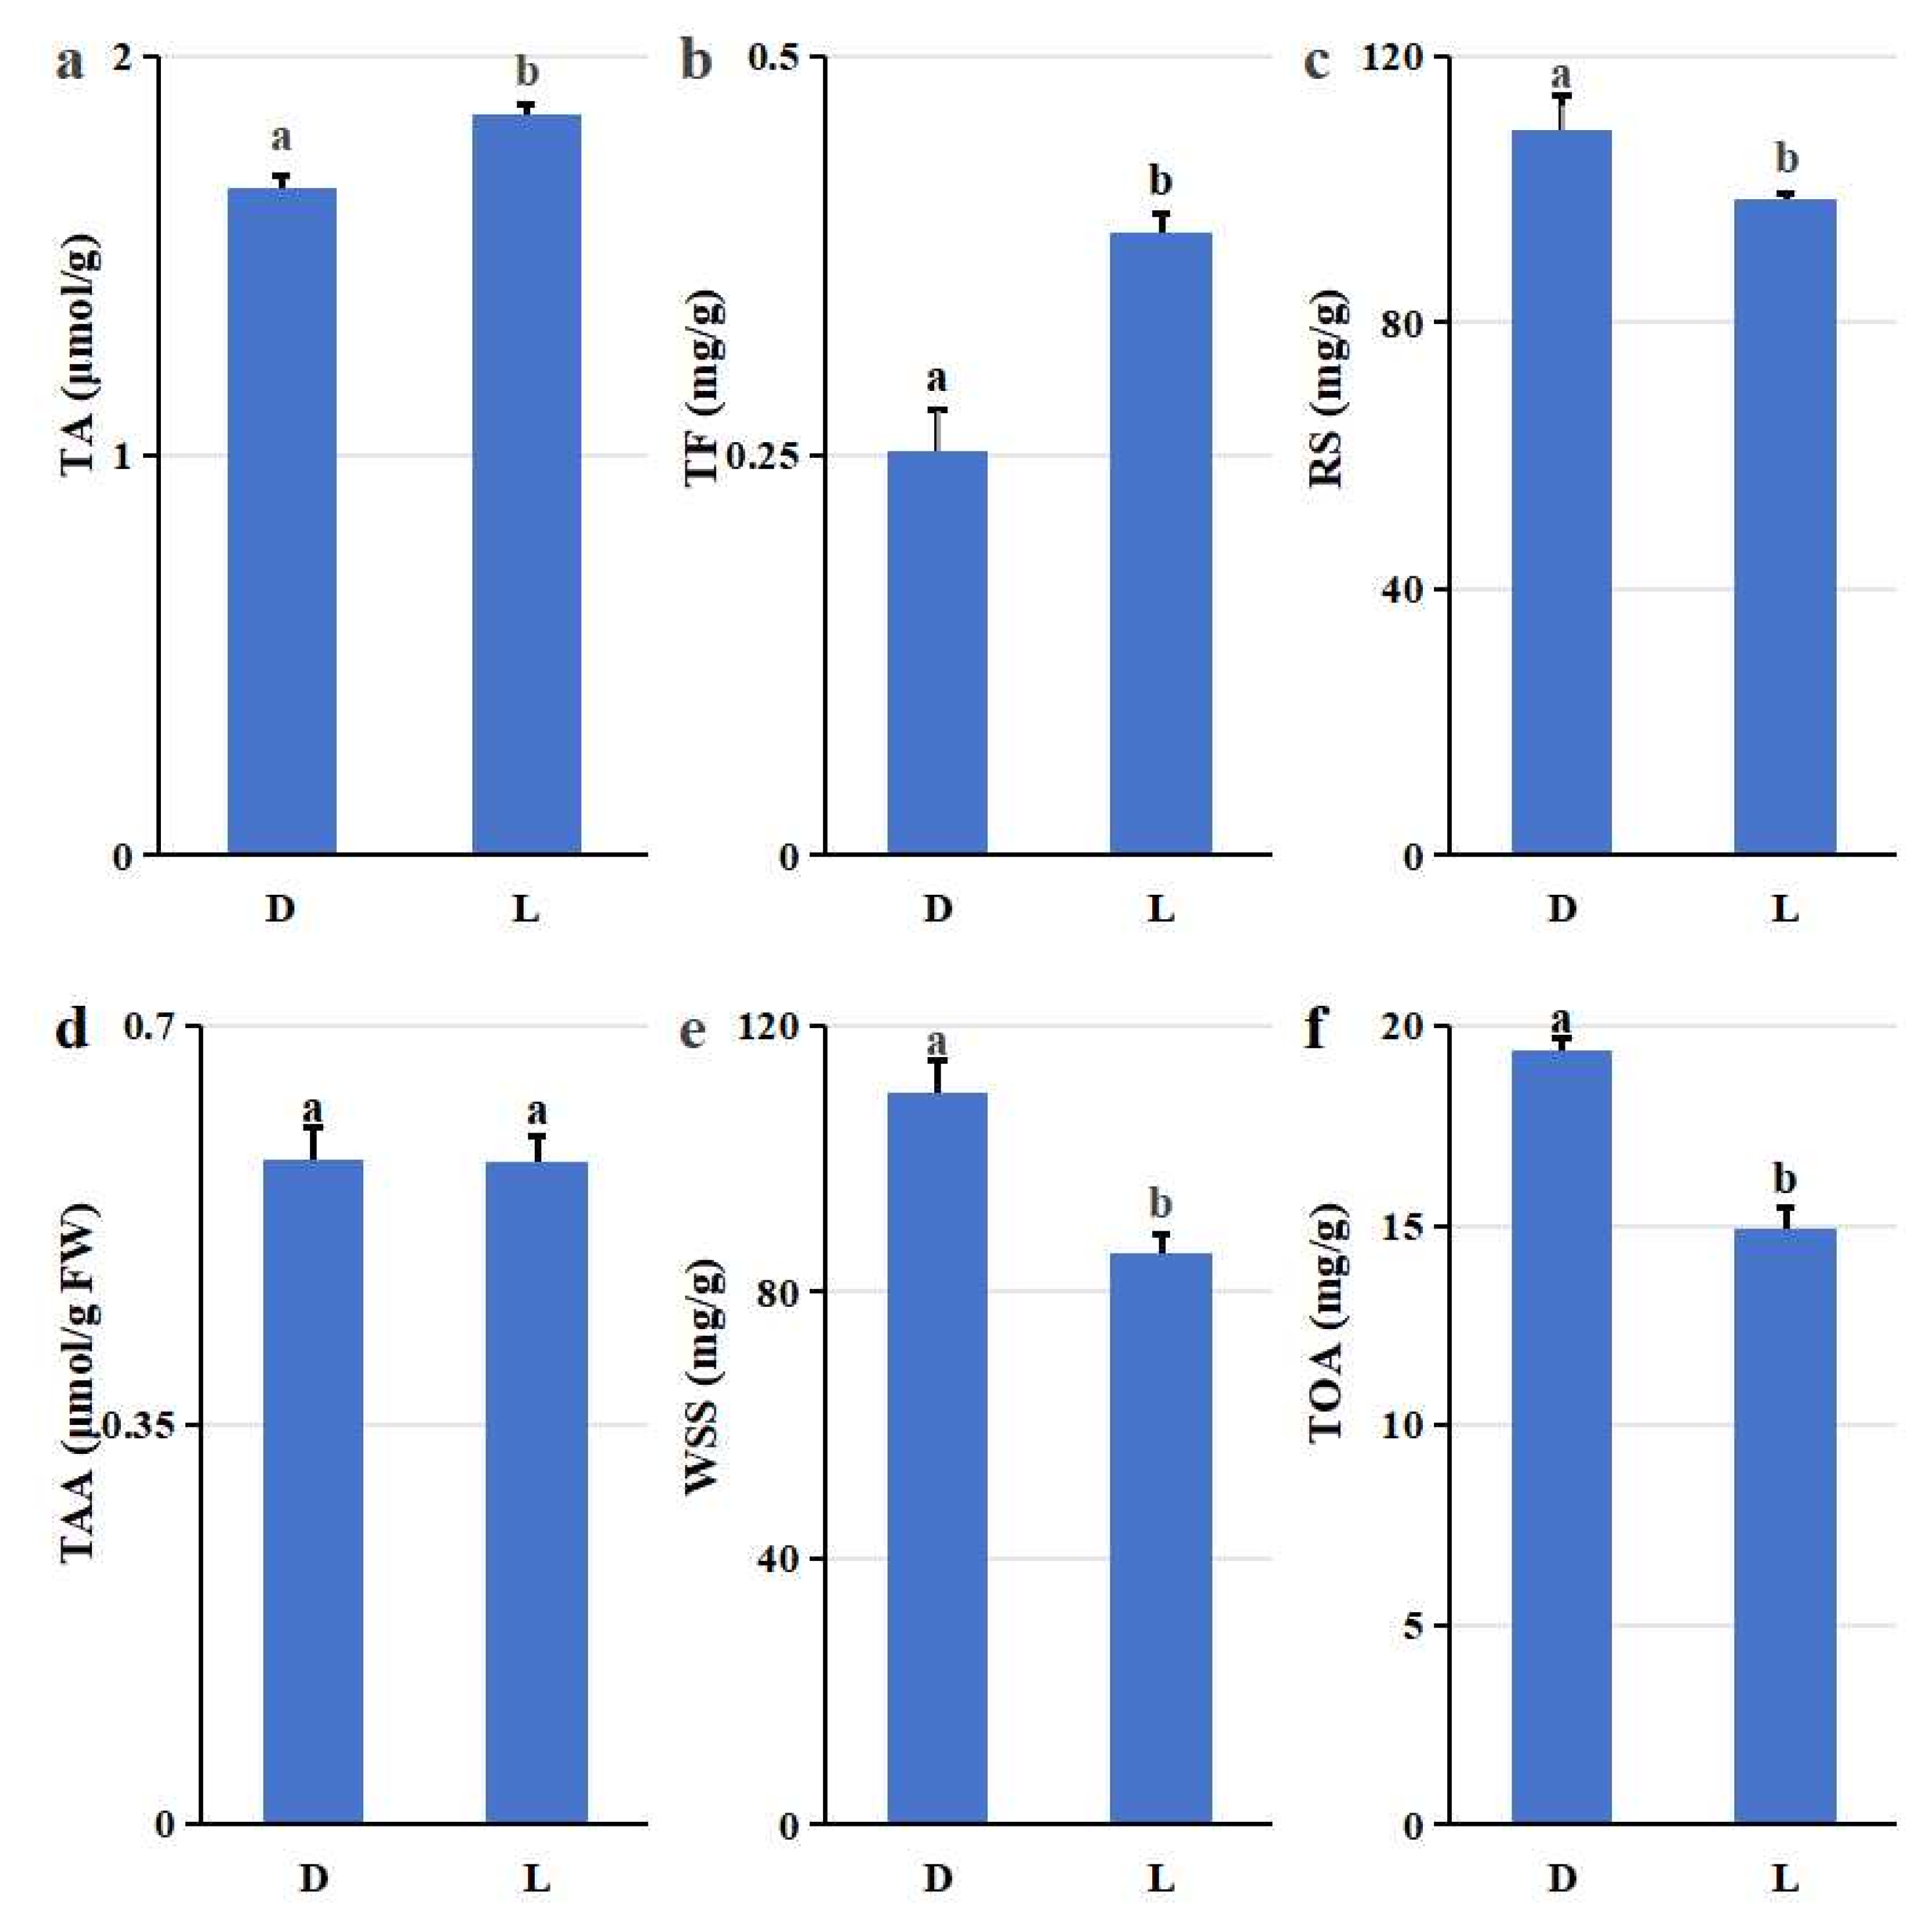
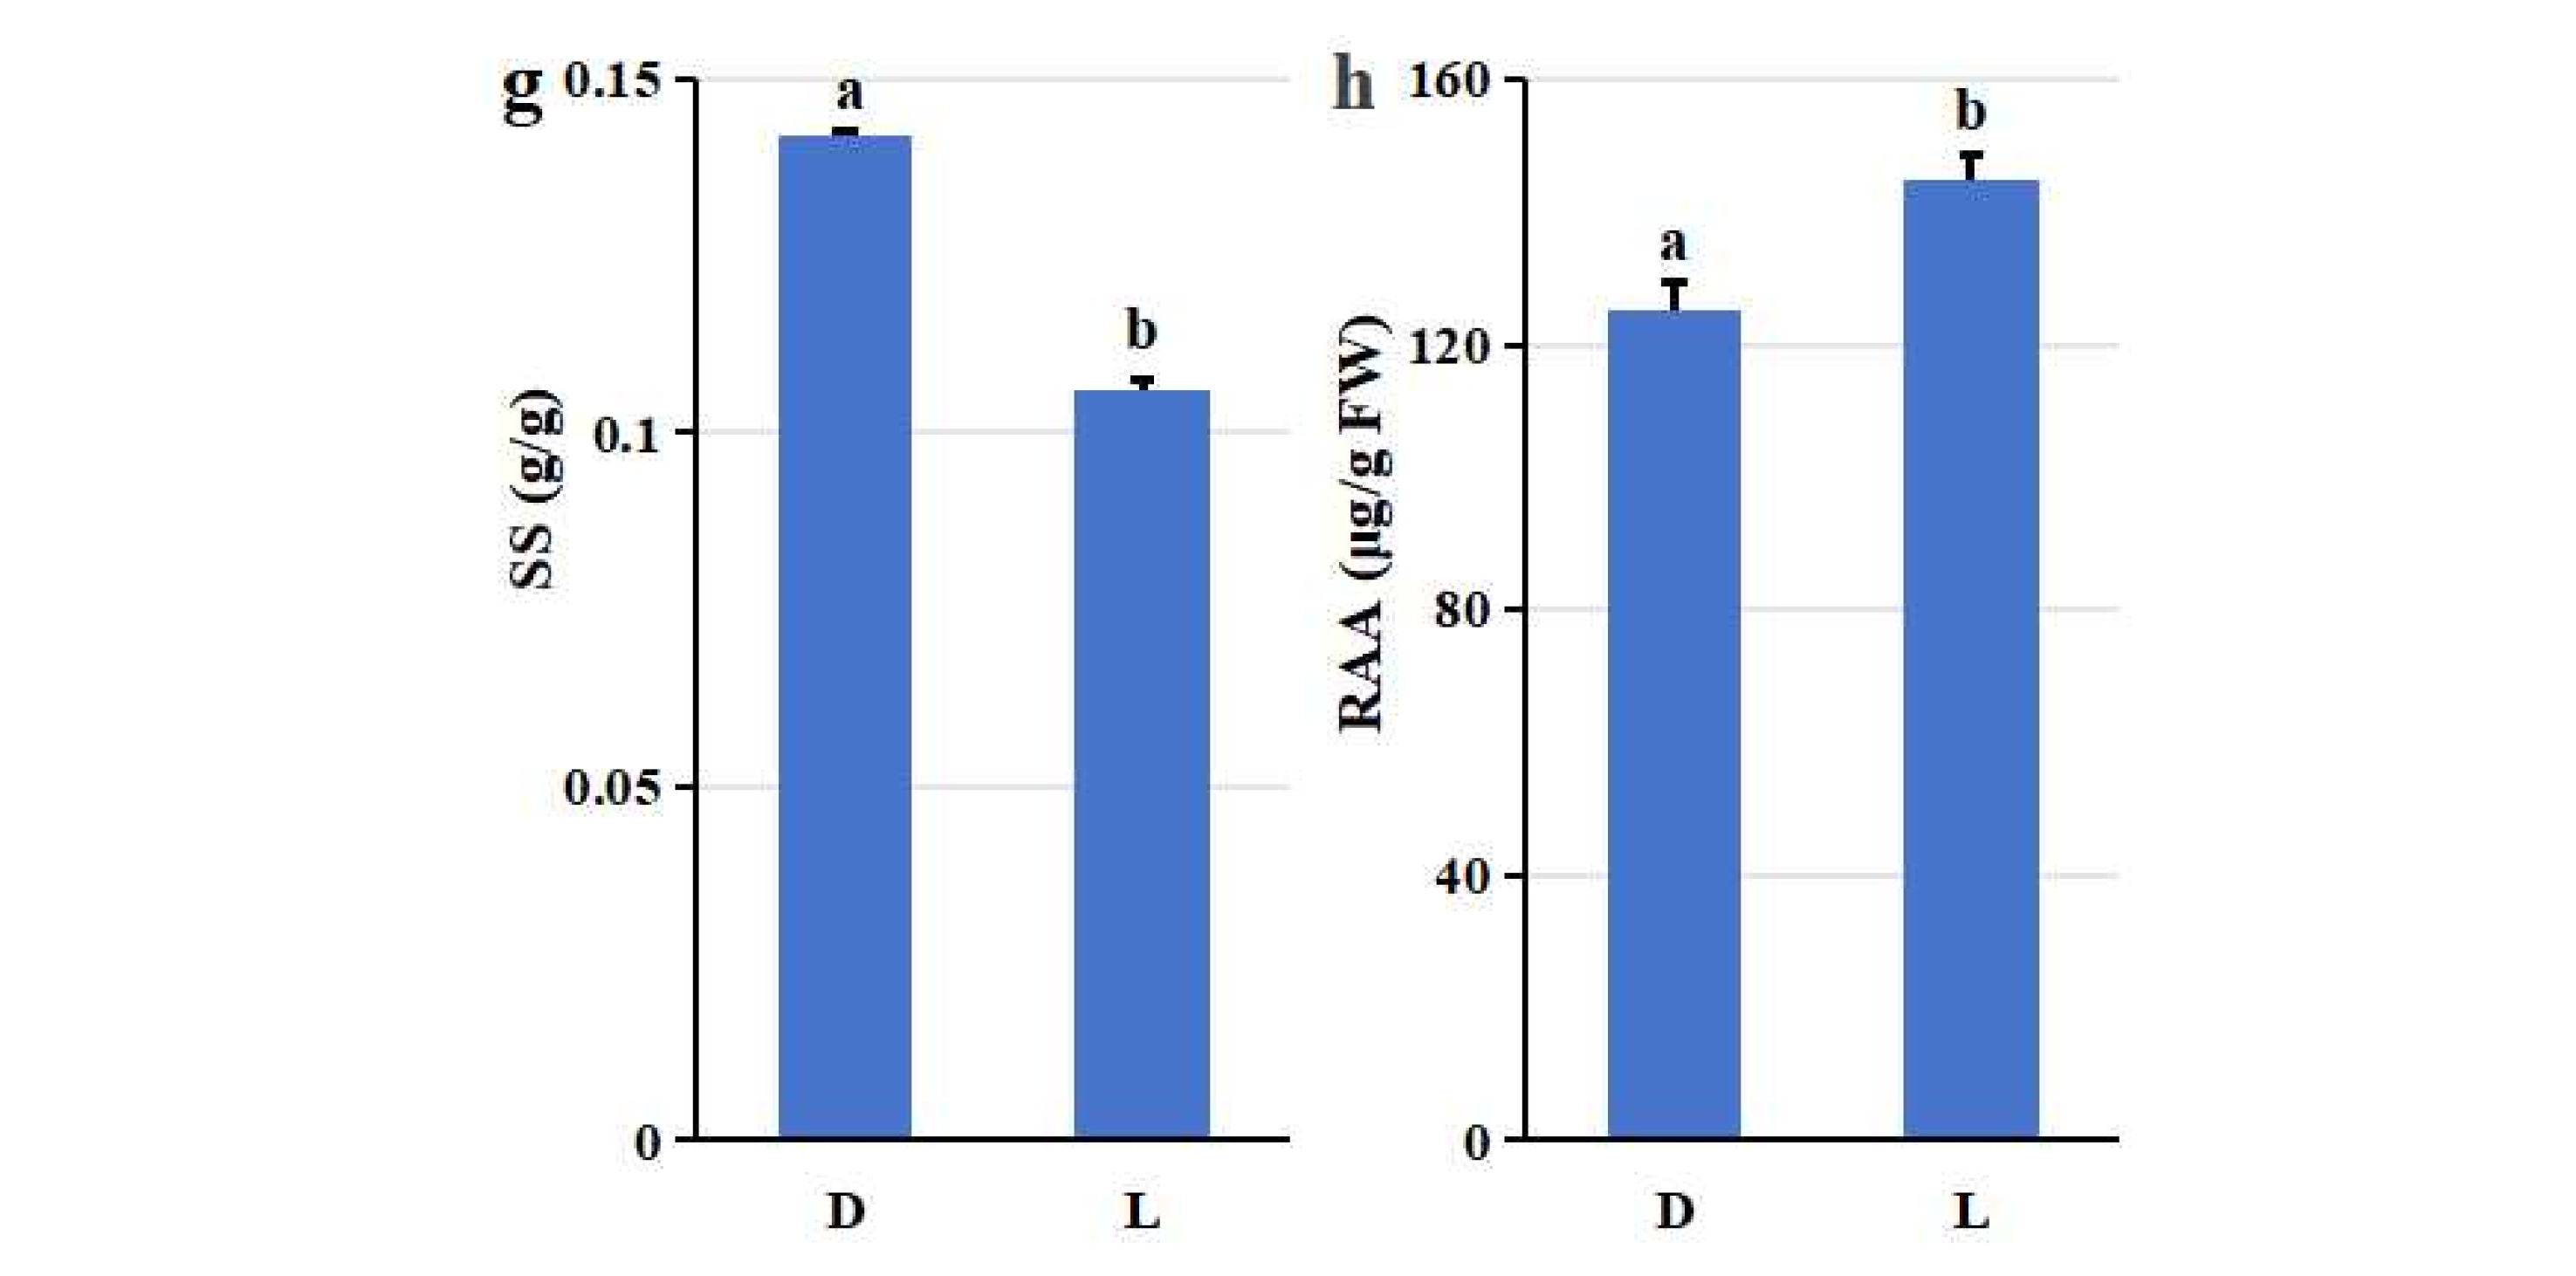
Figure 2.
Microbial community in greenhouse-cultivated (D) and open field-grown (L) blueberry plant rhizospheres. (a) Composition of bacterial phyla with a relative abundance ≥ 1%. (b) Heatmap of bacterial genus-level composition. (c) Composition of fungal phyla with a relative abundance ≥ 1%. (d) Heatmap of fungal genus-level composition. (e, f) Bacterial α-diversity indices: (e) Shannon index (community diversity) and (f) Chao1 index (species richness). (g, h) Fungal α-diversity indices: (g) Shannon index (community diversity) and (h) Chao1 index (species richness). (i, j) Phylogenetic β-diversity based on unweighted UniFrac distances for (i) bacterial and (j) fungal communities. (k, l) Non-metric Multidimensional Scaling (NMDS) plots illustrating community structure differences for (k) bacterial and (l) fungal communities.
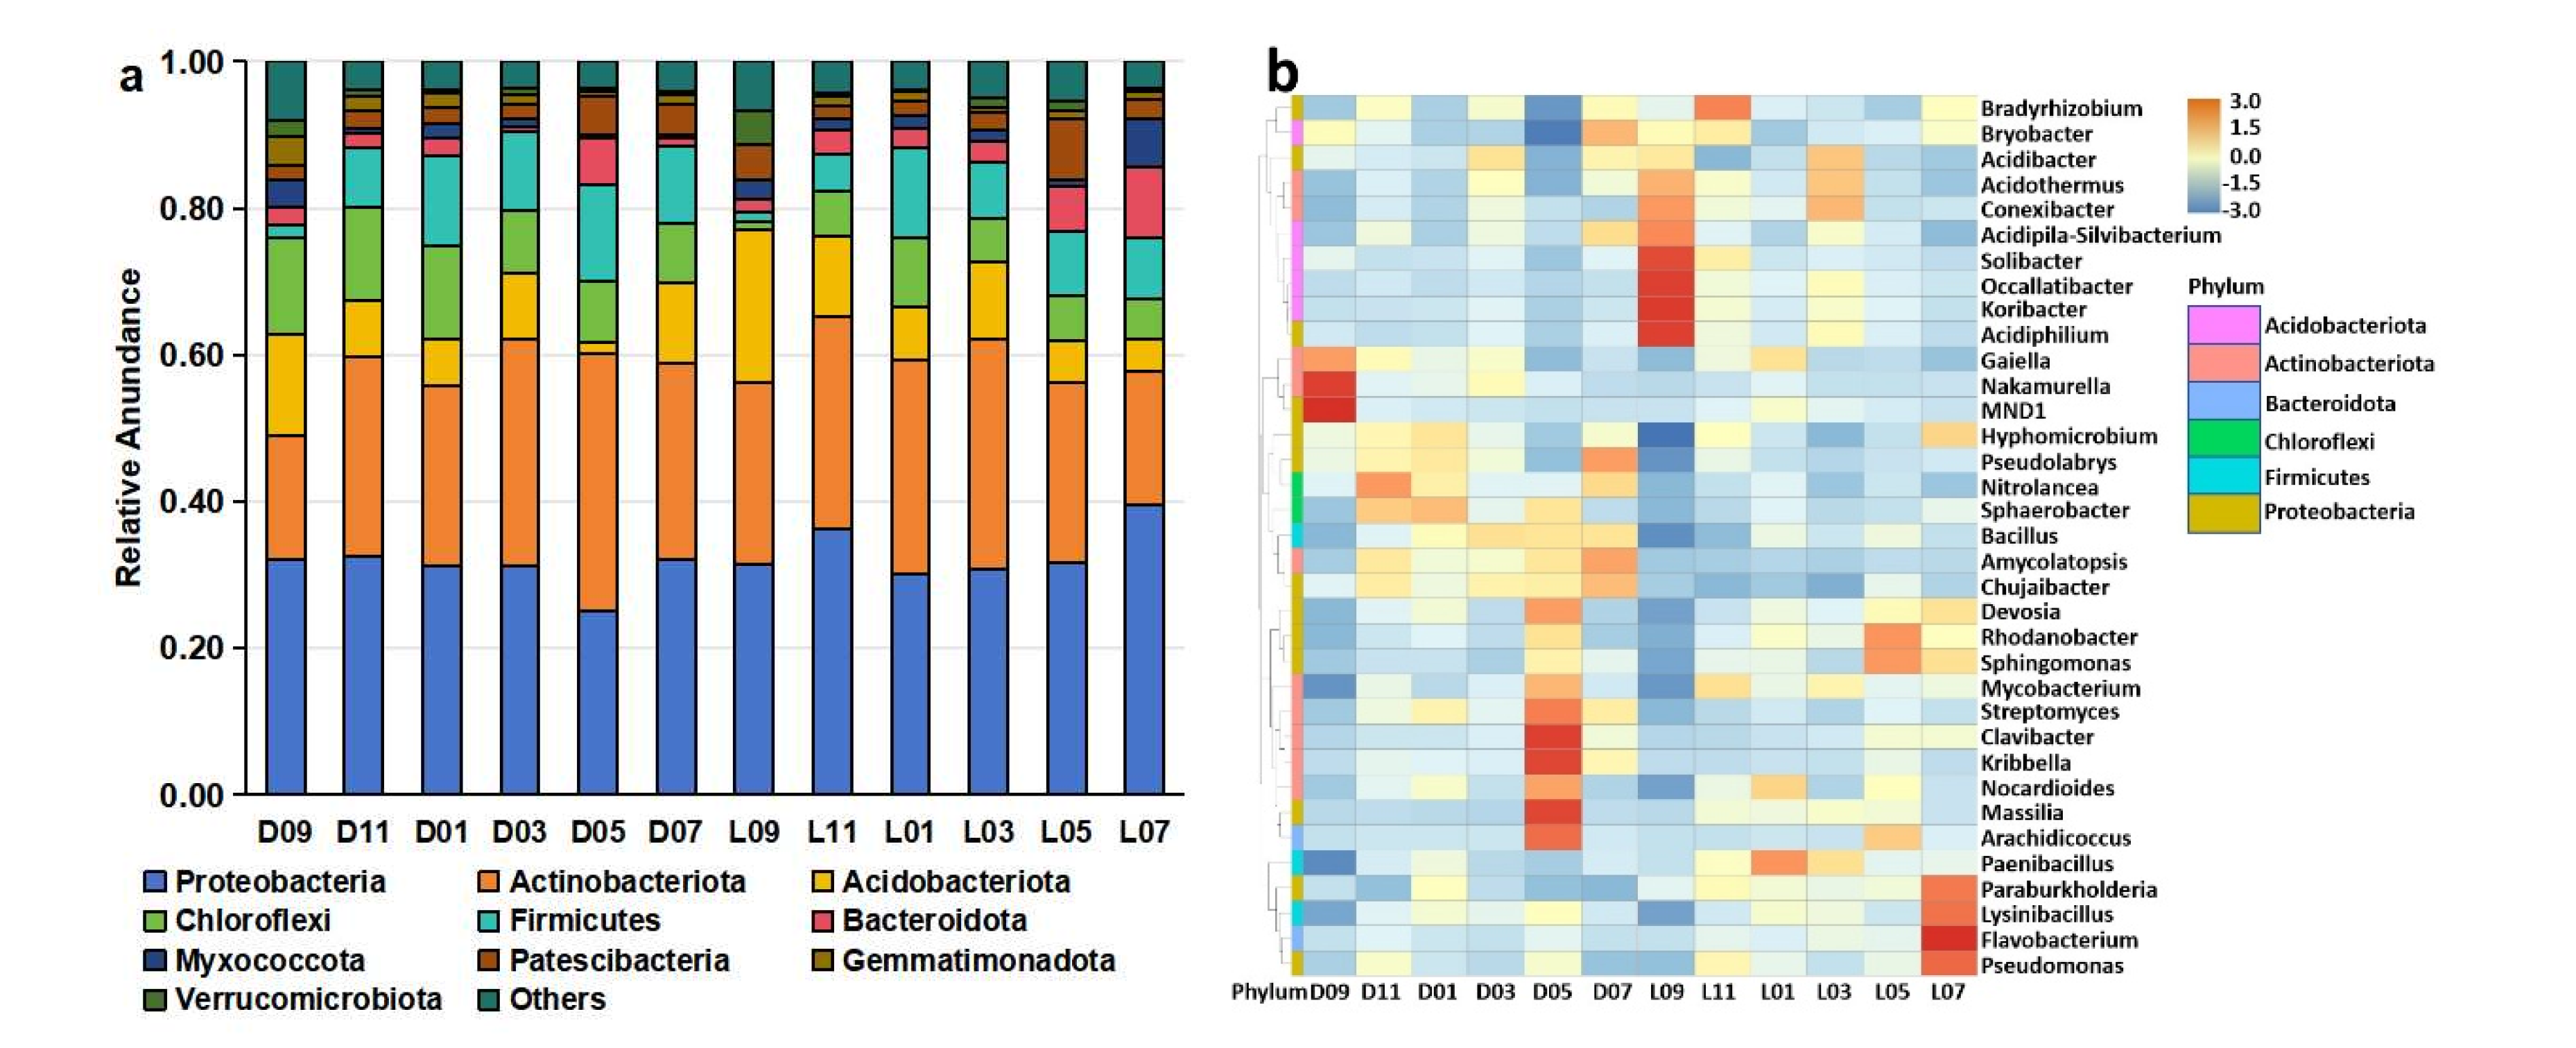
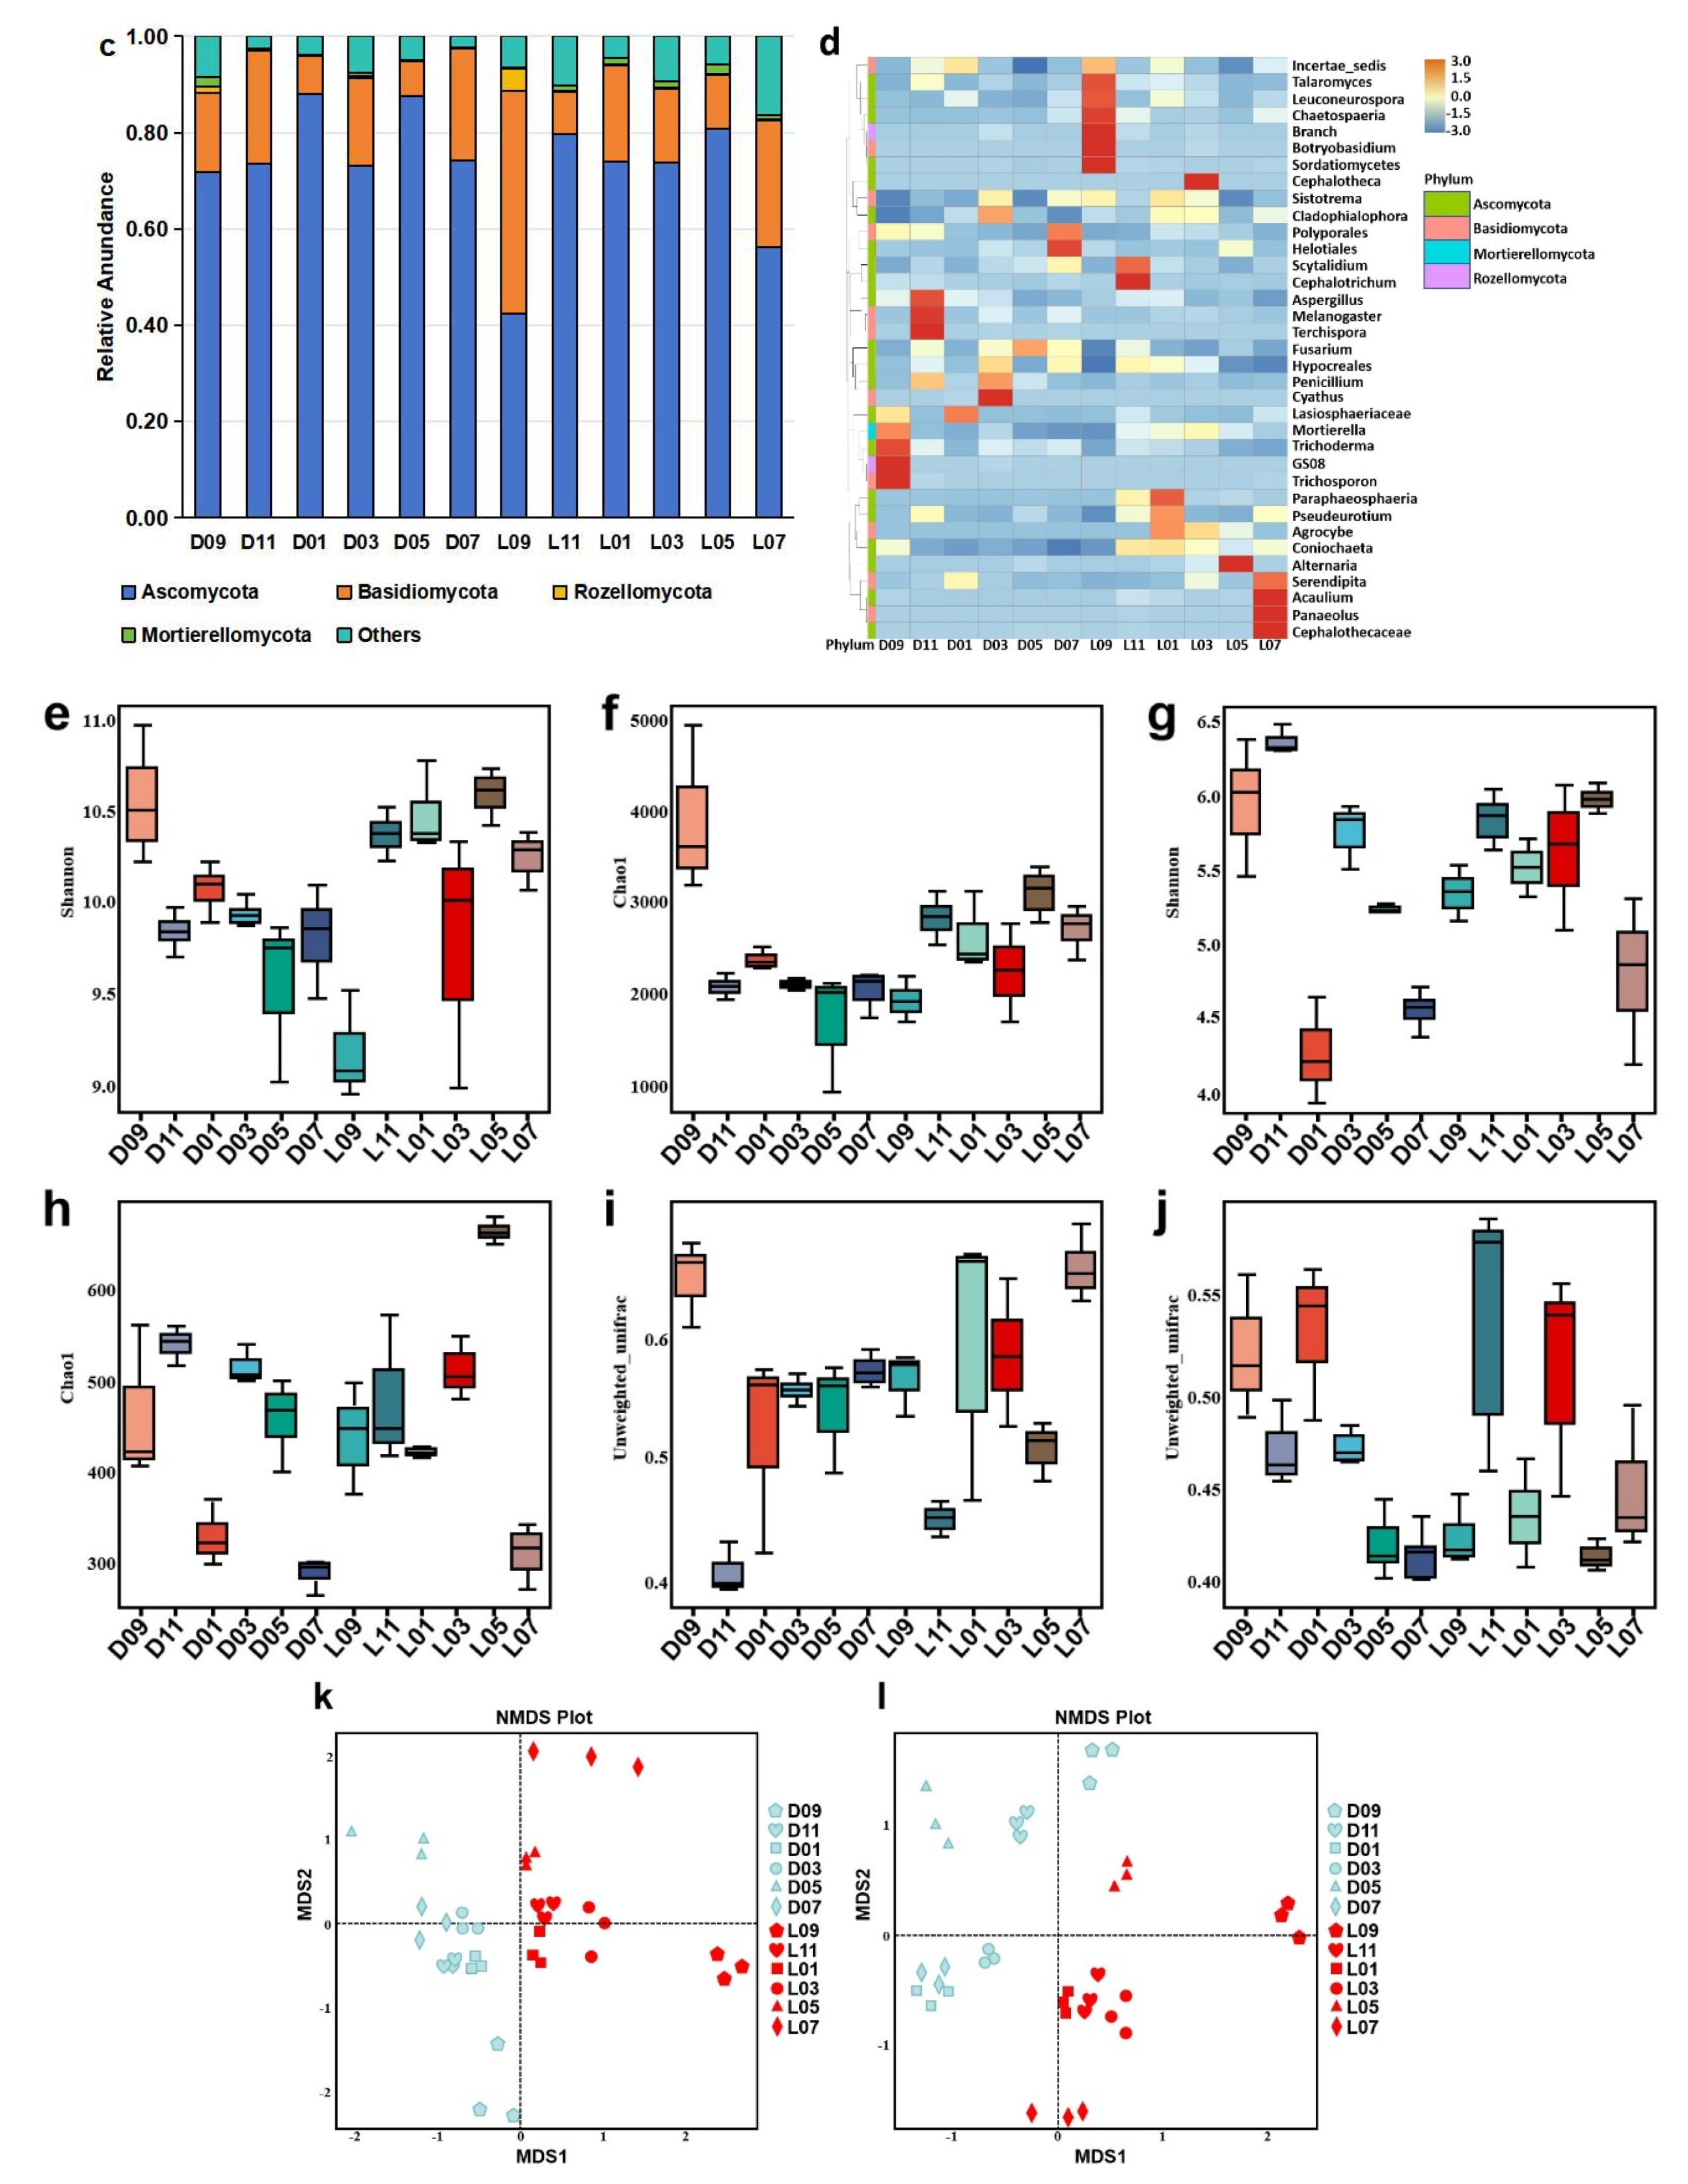
Figure 3.
Temporal dynamics of rhizosphere soil properties in greenhouse-cultivated (D) and open-field-grown (L) blueberry plants. All subplots (a-l) share the same x-axis representing the sampling time (months from September 2024 to July 2025). Soil parameters measured include: (a) organic carbon (OC), (b) total nitrogen (TN), (c) total phosphorus (TPH), (d) total potassium (TPO), (e) hydrolysable nitrogen (HN), (f) available phosphorus (APH), (g) available potassium (APO), (h) sodium ion concentration (Na⁺), (i) calcium ion concentration (Ca²⁺), (j) magnesium ion concentration (Mg²⁺), (k) pH, and (l) electrical conductivity (EC). In each subplot, data points marked with “D” (greenhouse) and “L” (open field) correspond to their respective cultivation systems.
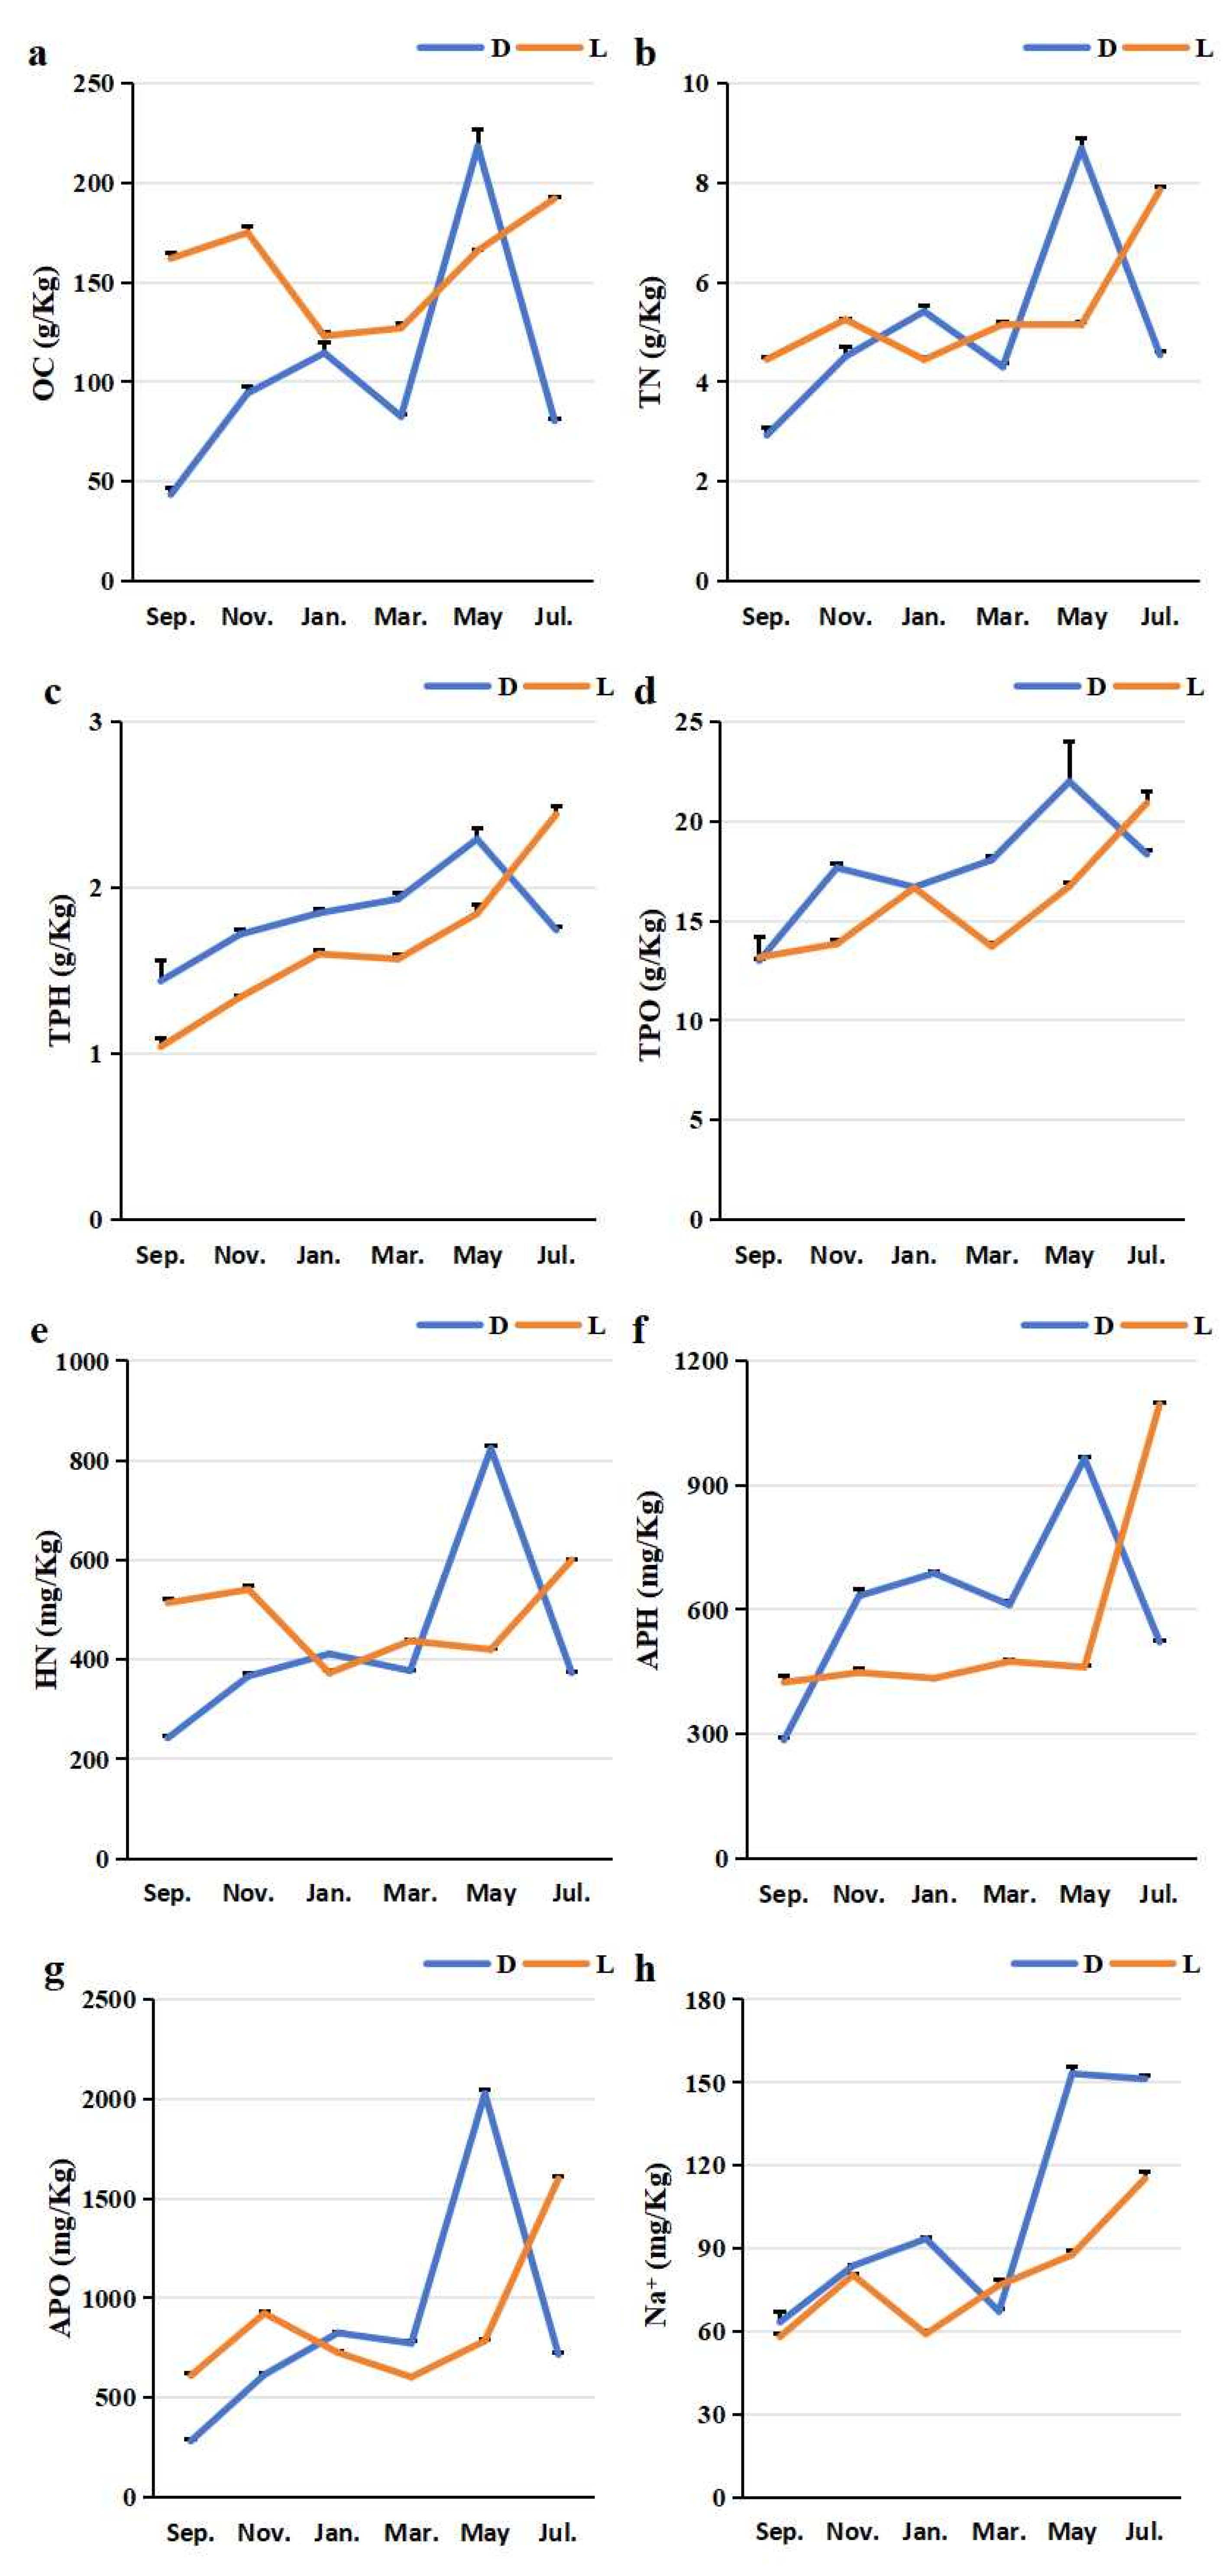
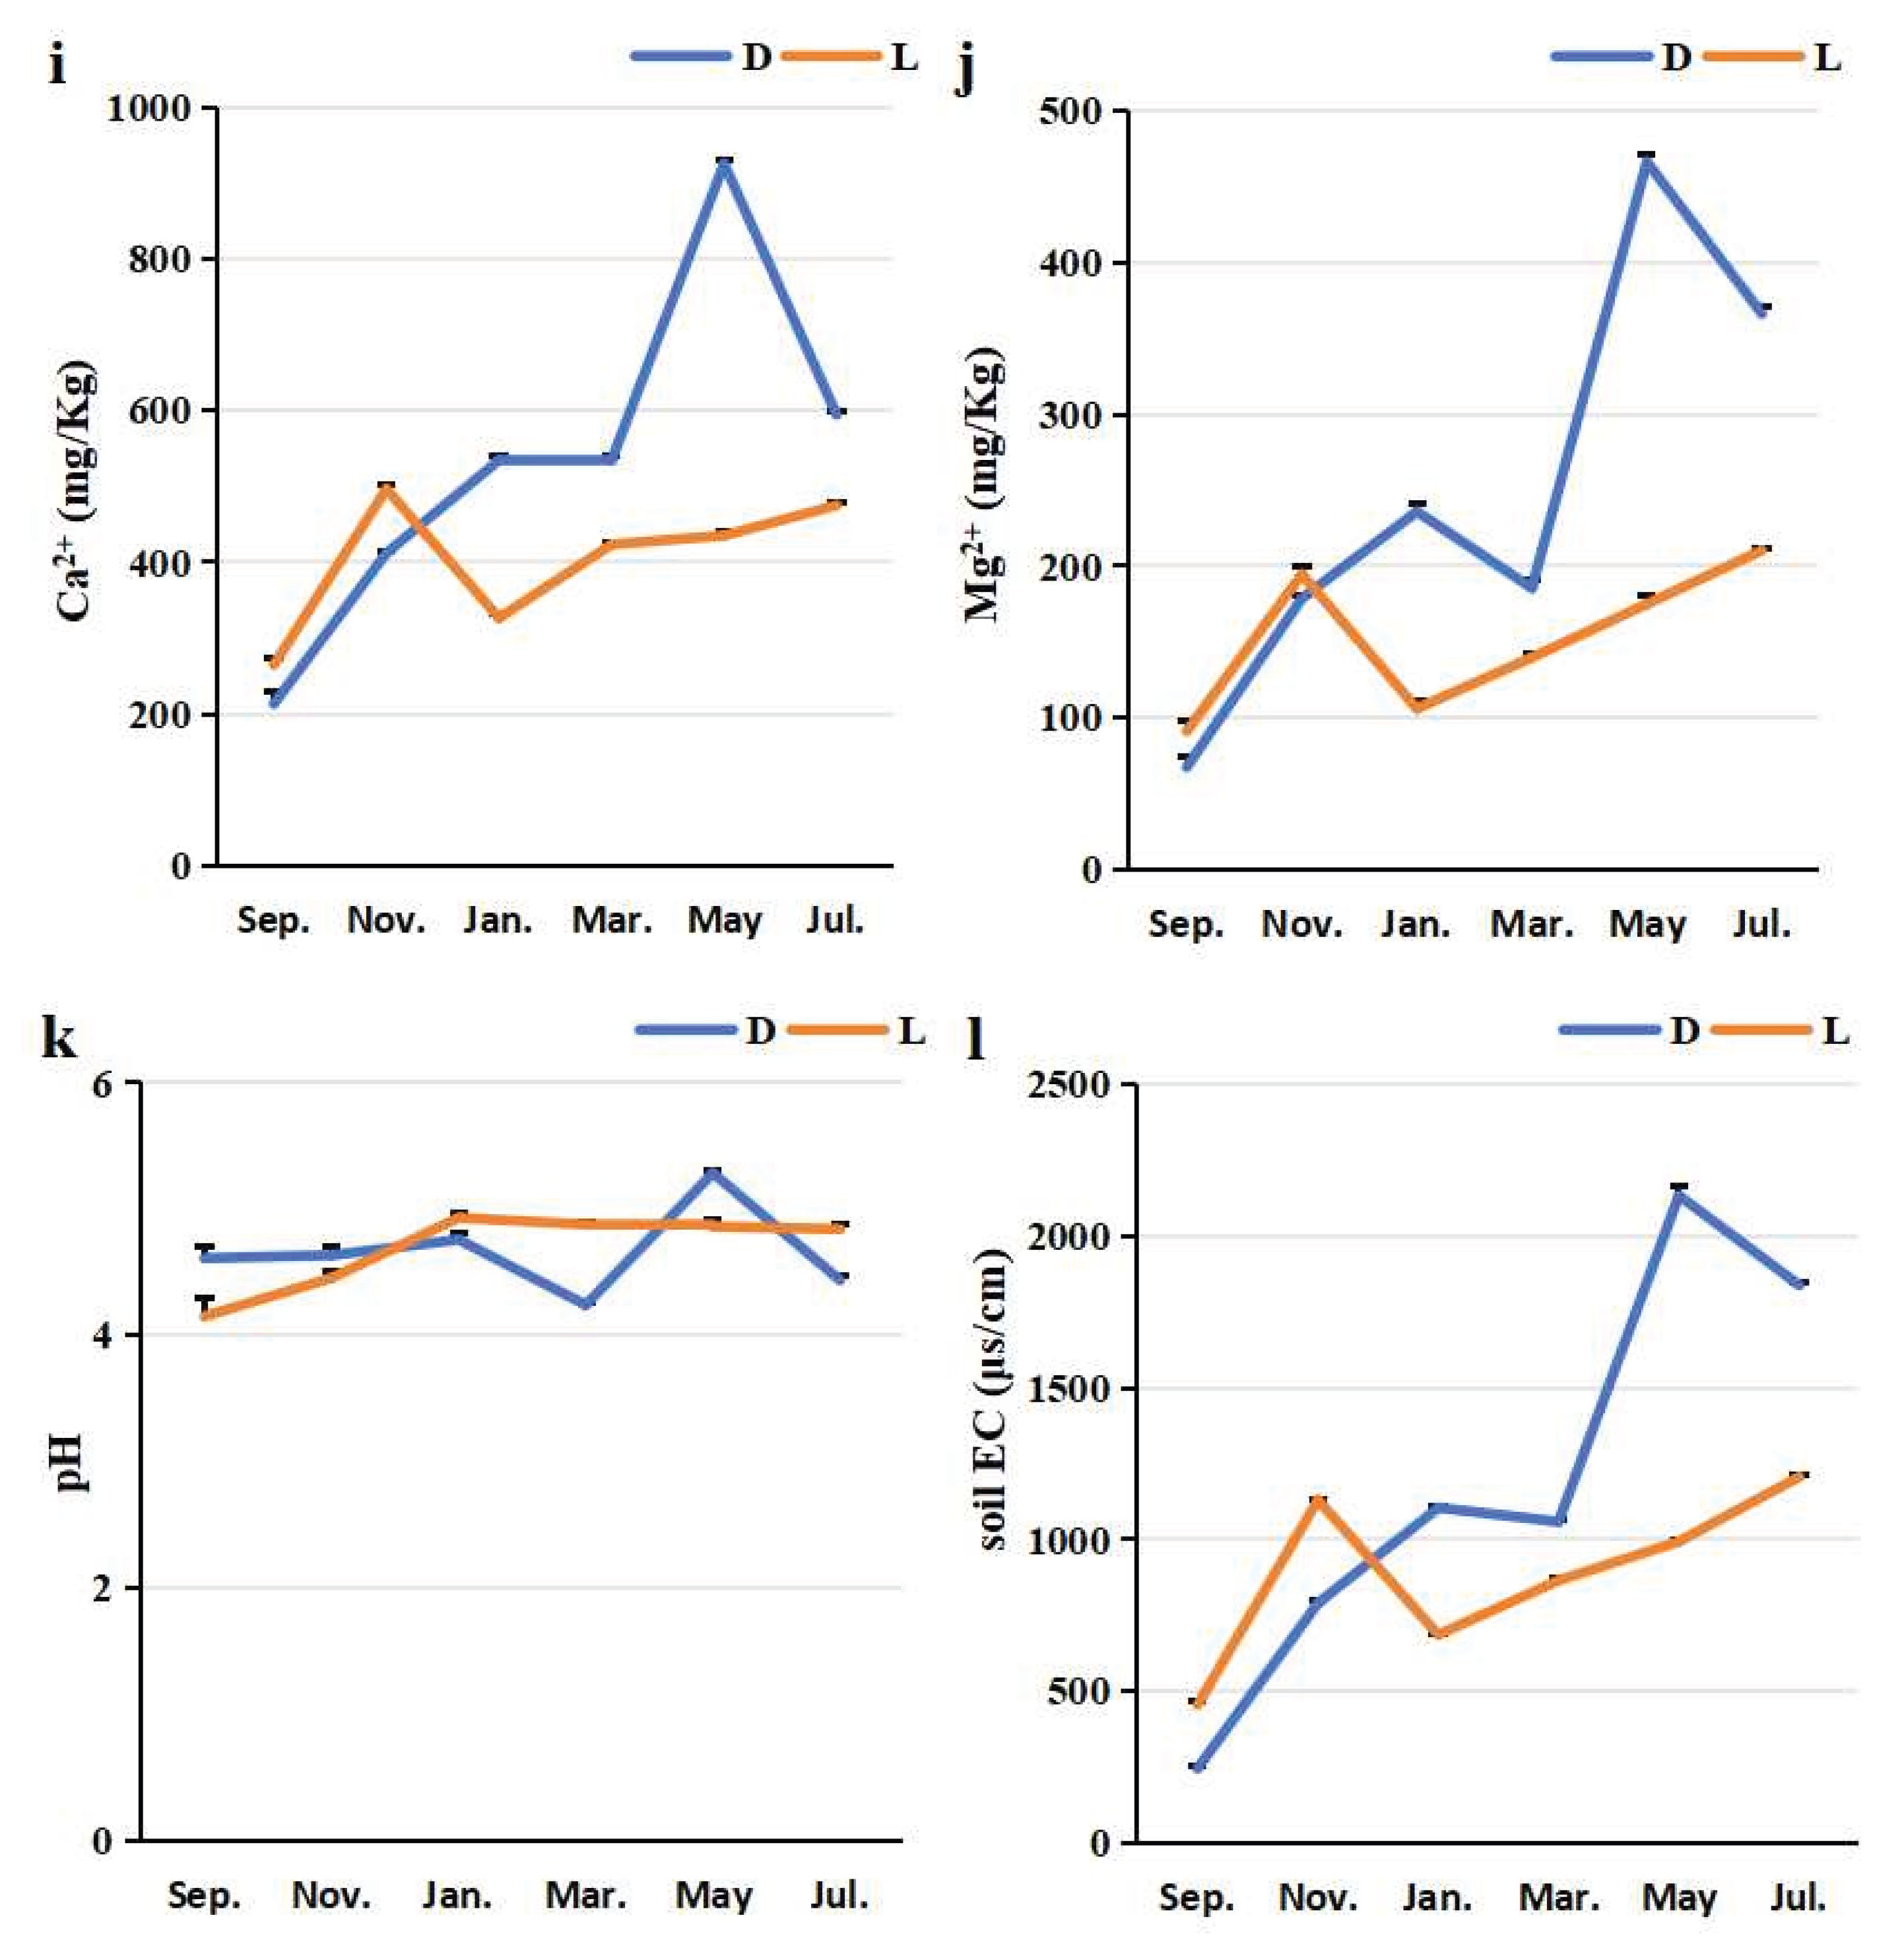
Figure 4.
Correlation heatmap integrating blueberry fruit quality parameters, rhizosphere microbial community structure and key rhizosphere nutrient element contents. Note: TA: Total anthocyanin content, TF: Total flavonoids, RS: Reducing sugars, TAA: Total amino acids, WSS: Water-soluble sugars, TOA: Total organic acids, SS: Soluble solids, RAA: Reduced ascorbic acid; OC: The organic carbon contents, TN: total nitrogen contents, HN: hydrolysable nitrogen contents, TP: total phosphorous contents, AP: available phosphorous contents, TK: total potassium contents, and AK: available potassium contents.
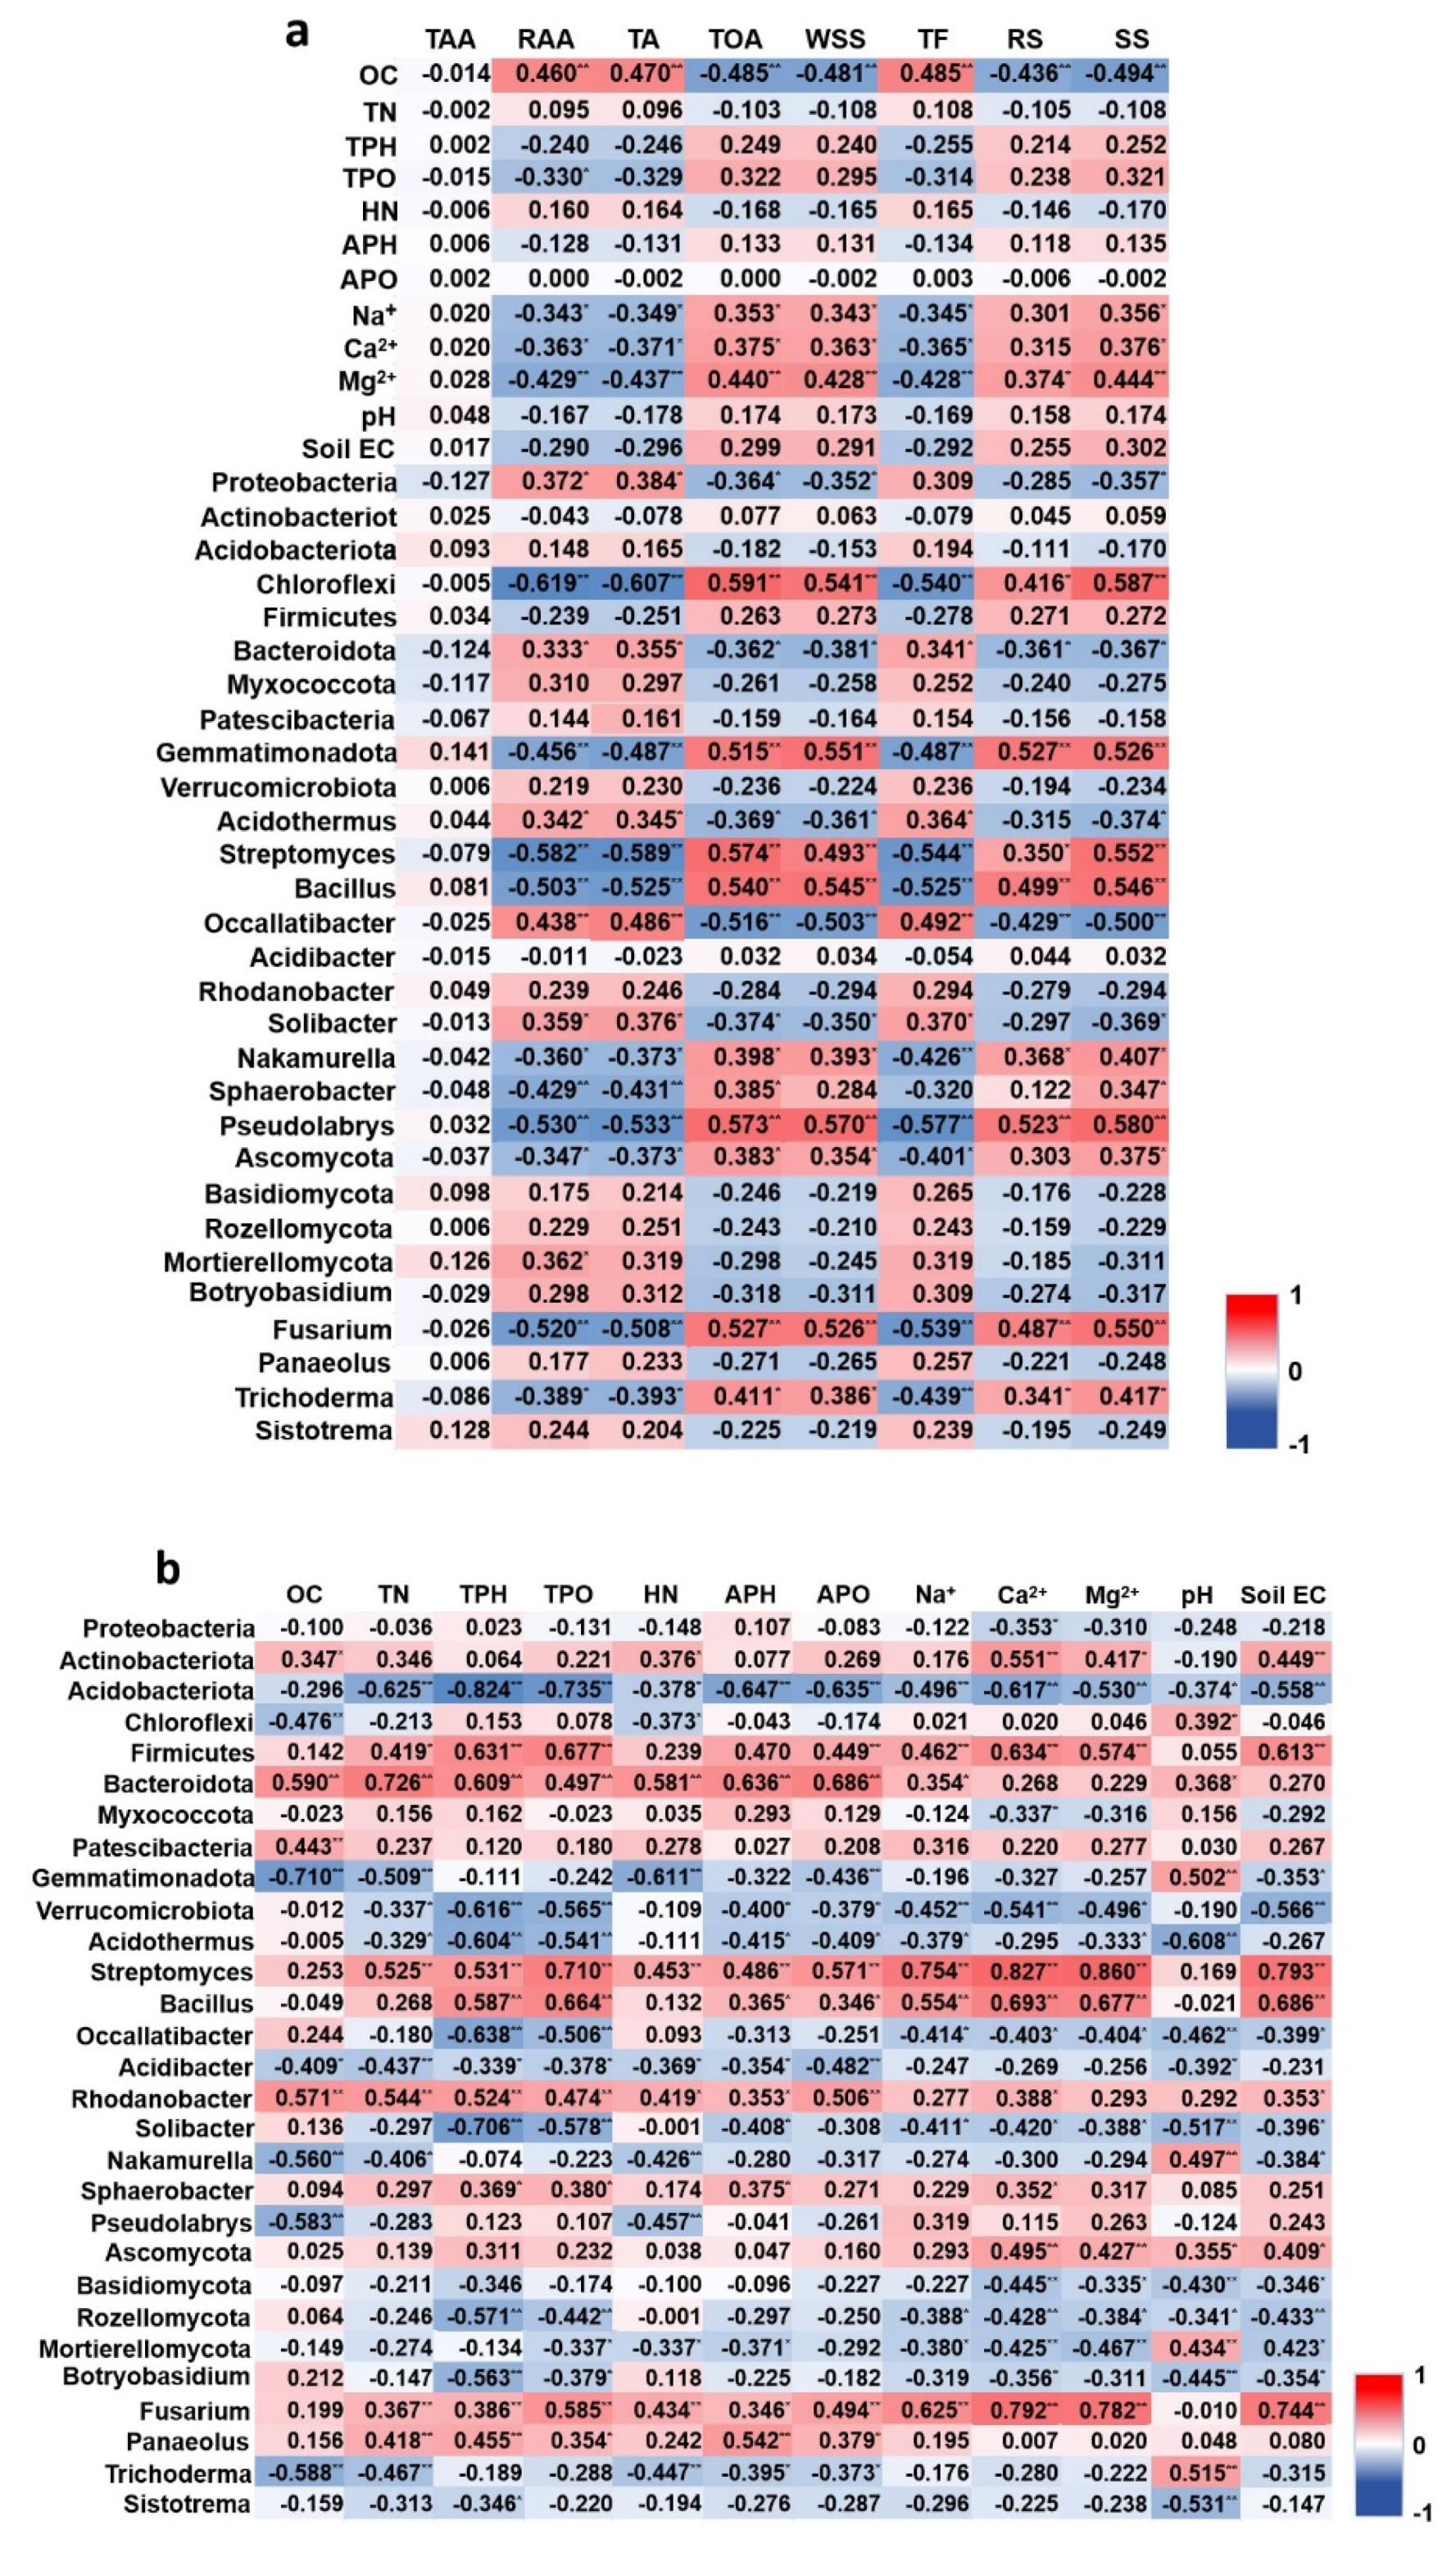

Table 1.
The sampling time and sample names.
| Sampling time | Sample names | The monthly average temperature | ||
| Blueberry plants grown in open- fields | Blueberry plants grown in greenhouses | Blueberry plants grown in open- fields (℃) | Blueberry plants grown in greenhouses (℃) | |
| September, 2024 | L09 | D09 | 26.50 ± 6.35 | 25.07 ± 0.96 |
| November, 2024 | L11 | D11 | 11.06 ± 5.96 | 20.71 ± 2.14 |
| January, 2025 | L01 | D01 | 3.76 ± 6.51 | 18.28 ± 3.15 |
| March, 2025 | L03 | D03 | 10.76 ± 7.40 | 19.90 ± 2.81 |
| May, 2024 | L05 | D05 | 22.84 ± 7.76 | 22.55 ± 2.56 |
| July, 2024 | L07 | D07 | 29.05 ± 5.59 | 25.77 ± 1.34 |
Disclaimer/Publisher’s Note: The statements, opinions and data contained in all publications are solely those of the individual author(s) and contributor(s) and not of MDPI and/or the editor(s). MDPI and/or the editor(s) disclaim responsibility for any injury to people or property resulting from any ideas, methods, instructions or products referred to in the content. |
© 2026 by the authors. Licensee MDPI, Basel, Switzerland. This article is an open access article distributed under the terms and conditions of the Creative Commons Attribution (CC BY) license (http://creativecommons.org/licenses/by/4.0/).
Copyright: This open access article is published under a Creative Commons CC BY 4.0 license, which permit the free download, distribution, and reuse, provided that the author and preprint are cited in any reuse.


