Submitted:
10 February 2026
Posted:
12 February 2026
You are already at the latest version
Abstract
Fractured reservoir characterization is a complex and challenging task due to its depositional nature and high uncertainty in the spatial distribution of fractures, typically when well data is limited and interpolation algorithms are employed. This paper introduces an alternative workflow designed to enhance fracture modeling between well locations by incorporating seismic attributes, using publicly released data from the Teapot Dome field. The paper's objective is to create a fracture model for the Tensleep reservoir in the Teapot Dome Anticline by employing seismic attributes sensitive to fault and fracture features, while also demonstrating the limitations of interpolation-based models such as Gaussian simulation. The approach uses artificial neural networks to predict fracture intensity by analyzing seismic data and well logs, training supervised probabilistic artificial networks to identify the seismic attributes that most closely correlate with the fracture intensity property derived from well log data. The validated network successfully transformed the 3D seismic data into 3D fracture intensity data, achieving a high correlation coefficient between the selected seismic attributes and the training wells. The research findings are extremely valuable because they help address the lack of information on fractures, improve reservoir management, and optimize well placement.
Keywords:
fractured reservoir characterization
; artificial neural networks
; Probabilistic Neural Networks
; fracture intensity
; Teapot dome
1. Introduction
Fractures is among the more prevalent geological features find in the upper layer of the Earth crust. They can be identified in the outcrops as well as in subsurface data like seismic and well log records, and it is highly probable that most reservoirs contain some degrees of natural fracturing[1]. The development of naturally fractured reservoirs typically necessitates a different strategy than that employed for conventional reservoirs. A major challenge in managing fractured reservoirs is the variability in rock properties, such as porosity and permeability, between the matrix and the fractures. Consequently, these fractured reservoirs are often classified as dual porosity reservoirs, where the matrix (first medium) and fractures (second medium) exhibit distinctly different capacitive and conductive characteristics[2].
Naturally fractured reservoirs (NFRs) are important for the evaluation and exploration of oil and gas reservoirs with abundant unconventional oil and rich experience in shale gas production. The difficulty in developing and investigating these NFRs is related to their complex fracture structure and variable fracture intensity features. The casing and cementing program, hydraulic test, and production program of wells will be designed based on fracture features, so it is very important to know the distribution of the fracture features precisely. There are many methods to define fracture features, and the seismic method or the logging method is widely used. However, the application of the logging method has a high cost, and the resolution is limited. The spatial resolution of the seismic method is commonly less than 10 m, so the fracture feature is also not clear. Additionally, the logging method and the seismic method need to be well spaced, and the interval will result in missing data. The advanced logging method can provide a high-resolution, well-spaced fracture feature, but the cost is extremely high [3].
Natural fractures in a reservoir may have positive and adverse impacts on the fluid movement. Fractures enhance permeability through extra routes for the flow of fluids, hence increasing hydrocarbon production. On the other hand, the fracture may act either as a conduit or barrier for water breakthrough, impeding oil production and changing the efficiency of the reservoir. Such a dual role calls for an advanced approach in fracture modeling to capture the variability and randomness in fracture distribution within the reservoir [4]. For instance, in most instances, fractures provide secondary porosity and permeability in rock matrices that tend to exhibit low porosity, as in the case of carbonate and clastic reservoirs. The other features devolved fluid movements of matrix-dominated productions zones, these also act as conduits to early water breakthrough [5].
Fracture properties can be affected by several geological factors, and it often referred “fracture drivers.” These factors include lithology, structural features, proximity faults, stress regimes, and tectonic history. The Fracture drivers are generally inferred from seismic and well log data, allowing geologists to estimate the location, orientation, and intensity in fractures across reservoir. However, Formation MicroImager (FMI) logs techniques, can be effective at capturing detailed fracture data, were prohibitively expensive and thus limited to small number of wells. Reservoir-wide fracture formation remains not complete, and there is a strong need for predictive models that can extrapolate fracture properties beyond the limited scopes of FMI datas [6,7,8].
In high heterogeneous reservoirs, traditional characterization methods are frequently losses the precise location and orientation of fractures. However, the recently integration of Artificial Intelligence into reservoir characterization have turned this challenge into a feasible task. Artificial intelligence can integrate various tools from multiple source, thus overcome uncertainty. The most wide recognized artificial intelligence techniques include Artificial Neural Networks (ANN) and Fuzzy Logic [9].
The study area is the Teapot Dome region in central Wyoming, USA, which was chosen because it contains a naturally fractured reservoir and its data set is available, especially the 3D seismic cube. The Teapot Dome is an important geological structure characterized by a complex fracture network, particularly within the sandstone reservoir known as Tensleep. Numerous studies have focused on characterizing and modeling these fractures in this area. Cooper and others [10,11,12,13] identified three sets of fractures, striking perpendicularly, parallel, and obliquely to the fold axis. Valerie [14] and Thomas [15] employed volumetric seismic features as a guide for characterizing and modeling the fractures. Some researchers, such as Quenes et al.[16], used unconventional methods by combining seismic features with additional fracture drivers in continuous fracture modeling techniques. Thachaparambil [17] used volumetric seismic features associated with fracture presence to determine fracture length, direction, and shape.
Cooper et al.[18] identified a dominant NW-WNW fracture set that plays a significant role in fluid movement within the reservoir. Thomas et al. [15] confirmed this through their study in which they developed a model of the discrete fracture network based on integrated field data, image probes, and three-dimensional seismic data. Characterizing the discrete fracture network in this reservoir is not only important for hydrocarbon recovery but also for understanding the nature of the dual-porosity reservoir, which Teapot Dome was classified by Spooner et al.[19] as a Type II fractured reservoir. In this type of reservoir, fractures play a primary role in permeability, while the matrix plays a secondary role. This classification gives great importance to the accuracy of discrete fracture network modeling in improving the recovery factor, which is often low in naturally fractured reservoirs due to the high uncertainty in fracture characterization and modeling [20].
The paper try to develop an integrated approaches for characterizing fractures in the naturally fractured Tensleep Formation, Wyoming, USA. A scheme using the Artificial Neural Network technique is presented, incorporating seismic attributes along with the well loge data so that fracture intensity variations could be quantified for the whole reservoir. By using the strengths of DFN modeling, we will build a 3D fracture intensity cube that optimally approximates fracture distribution, orientatione, and density within the Tensleep Formation.
The results of our paper offer a cost-effective and the scalable approach to fracture characterization that have the potential to development reservoir management and recovery strategies around the world in fractured reservoirs. This research has done the integration for artificial intelligence techniques into conventional reservoir characterization procedures to address the complexities related to modeling fractured reservoirs in continuing of an improving understanding of fracture dynamics and their impact on reservoir performance using data-driven methodologies.
2. Materials and Methods
The major steps involved in this study include data preparation, fracture characterization, seismic attribute analysis, ANN and PNN model development, and the construction of a 3D fracture intensity cube together with DFN modeling. These steps have been developed to introduce an appropriate workflow regarding the characterization and prediction of fracture intensity within the Teapot Dome Tensleep Formation.
2.1. Data Preparation and Fracture Characterization
2.1.1. Dataset Collection
The dataset employed in this research has been provided by the RMOTC and includes four 2D seismic lines, one 3D seismic cube, and well log data over four wells located within the Tensleep Formation: 25-1-X-14, 48-X-28, 67-1-TPX-10, 71-1-X-14. The 2D seismic lines are from 4 to 13 km long. One 3D seismic cube at the surface is about 70 km². The maximum two-way time is 3000 ms. Each well has Formation MicroImager logs, fracture measurement logs, and well tops that are very important in model calibration and validation because of the essential fracture data they possess.
2.1.2. Fracture Classification and Intensity Logs
Fractures from the four wells were initially classified into dip angle and azimuth classes based on the FMI log data; such a classification enabled the development of a fracture intensity log for each fracture set corresponding to different fracture orientations. These fracture intensity logs were necessary to train and validate the ANN model. Subsequently, they were combined with seismic attributes in order to build the 3D fracture intensity cube.
2.2. Seismic Attribute Interpretation
2.2.1. Seismic Horizon Interpretation and Structural Modeling (Time and Depth Domains)
Major seismic horizons within the Teapot dome were interpreted on a 3D post-stack migrated seismic volume. Identified reflectors by previous studies were picked with the aid of the Petrel software. Then an auto-tracking function in the software was used to produce continuous horizons across each seismic line that formed the basic constituent of a 3D structural model developed in the time domain.
This data were afterwards converted to depth by creating a velocity model. It was built using velocity points provided by the processing center and distributed on interpreted horizons. The cell dimensions in this model were set to 50x50 meters while the model itself was divided into eight different layers vertically. The velocity model is a key tool used for converting data between time and depth, and vice versa. It is designed to handle various types of data, including volumetric (VOLUME) and surface-based (SURFACE) data.
2.2.2. Structural Model of Tensleep Reservoir in the Depth Domain
Structural Model of Tensleep Reservoir in the Depth Domain: The structural model of Tensleep Reservoir in the depth domain was constructed by the top and bottom horizons of the Tensleep Formation. The model was split into 720 vertical layers, and each grid cell was 400 x 400 meters. This number of layers, determined through iterative adjustments, was found to be optimal for accurately representing fracture data, including dip angles and azimuths. The model was subsequently utilized to generate seismic attributes aimed at detecting fractures within the formation.
2.3. Construction of Seismic Attributes
Seismic attributes computed from the 3D post-stack seismic volume enhanced fracture detection within the Tensleep Formation. Of the myriad of different attributes tried, only two were used, being Volume Curvature and Ant Tracking, since they showed the greatest correlation with fracture intensity from the preliminary analysis. These were imported into Hampson Russell’s software as external attributes and were used to train the ANN and PNN models in an effort to estimate secondary porosity and fracture intensity.
2.4. Secondary Porosity and Fracture Intensity Estimation Using ANN
2.4.1. ANN Model Architecture for Secondary Porosity
As secondary porosity is a key proxy for fracture intensity, an ANN model which estimates secondary porosity was presented. The general structure of ANN contains one input layer, six hidden layers, and one output layer. In this work, the input data involves density logs, deep resistivity logs, and compressional slowness logs of three wells: 25-1-X-14, 48-X-28, and 71-1-X-14. Well 67-1-TPX-10 is used herein to validate the model.
In this respect, the ANN model was used to iteratively adjust the weights of connection between neurons, applying a backpropagation and a gradient descent algorithm. This will, in effect, minimize the error between the predicted and the actual porosity values. The model accurately predicted porosity for the input of secondary porosity into the fracture intensity model.
2.4.2. ANN Model for Fracture Intensity Estimation
An ANN model with a hidden layer of ten neurons has also been developed to estimate fracture intensity for wells with no direct availability of FMI data. This ANN model takes this estimated secondary porosity along with the density logs, compressional slowness logs and deep resistivity logs as inputs and provides fracture intensity estimates from its output. The ANN was trained on data from three wells-67-1-TPX-10, 48-X-28, and 71-1-X-4-and tested on well 25-1-X-14.
The results obtained from the ANN model showed a high correlation between predicted and actual fracture intensity, thereby proving its capability for generalization across the data and predicting fracture characteristics in wells lacking FMI logs.
2.5. 3D Fracture Intensity Cube Construction Using PNN
2.5.1. Multiple Attribute Regression for Seismic Attribute Selection
Multiple regressions were done on a total of forty seismic attributes in order to establish which seismic attributes best describe fracture intensity. Based on these regressions, the capability of the HRS software was utilised to analyse for each attribute the correlation with fracture intensity and hence chose the best fifteen with the highest predictability accuracy. A validation curve showed that more than fifteen attributes produced overfitting, so the model was limited to only those better attributes.
2.5.2. Probabilistic Neural Network (PNN) Model for Fracture Intensity Prediction
In this respect, the PNN was trained using the chosen seismic attributes through the 3D seismic cube for fracture intensity modeling. By large, the PNN consists of four layers comprising input, hidden, pattern, and output. The network approximates the probability density functions of fracture intensity from the training data integrated with seismic attribute inputs for a likely estimation of fracture intensity.
Cross-validation analysis favored an operator length of nine in the PNN model, which balanced the granularity and computational efficiency of predictions. The PNN model showed a training correlation coefficient of 0.93 while the validation error rate was less than 4% in most wells, further confirming the reliability of this model to predict the fracture intensity over the seismic data set.
2.6. Discrete Fracture Network (DFN) Model Construction
The fracture intensity cube generated by the PNN model was transformed into a 3D geocellular model representing fracture distribution across the Tensleep Formation. Sequential Gaussian simulation was used to create a fracture intensity property for each fracture set (class0, class1, class2, and class3), which served as inputs for constructing the Discrete Fracture Network (DFN).
Then, the DFN model was created using the fracture sets defined above. Herein, the Fisher distribution for the fracture orientation is employed in order to decrease the variability around the mean orientation. Power law has been considered for fracture length and aperture. Aperture and permeability parameters have been derived accordingly using the cubic law.
Upscaling has been done to convert the data obtained from the DFN model into properties that are usable for either dual-porosity or -permeability flow simulation. Fracture porosity, permeability, sigma factor, and spacing have been calculated and assigned to each grid cell comprising the reservoir simulation model. Upscaled properties enable correct simulation of fluid movement within a fractured reservoir and help dynamic reservoir management strategies.
2.7. Validation and Application of the 3D Fracture Intensity Model
The final 3D fracture intensity cube was verified by comparing the predicted fracture intensities against independent well data with known fracture properties. The model was validated by cross-correlation analysis, with the acceptable correlation coefficient being greater than 0.8 for all wells used in the validation. Strong validation of the model confirms its applicability to predict fracture intensity at locations where data is sparse; hence, a scalable method was developed for future fractured reservoir characterization.
3. Results
This work used Artificial Neural Networks (ANN) and Probabilistic Neural Networks (PNN) for fracture intensity prediction in the Tensleep Formation at the Teapot Dome. Integrating seismic attribute analyses, ANN and PNN modeling, and Discrete Fracture Network (DFN) construction, this workflow presented a rigorous anddetailed reservoirfracture representation. All of the steps of the workflow are substantiated with 18 Figures, which visually validate the accuracy of the model and give insight into the reservoir fracture characteristics.
3.1. Geological Setting and Dataset Overview
The Teapot Dome is in the Laramide structural belt of Wyoming ( Figure 1), which describes the geographical location. Figure 2(a) shows the structural relationship of the Teapot Dome with respect to other Laramide uplifts, and Figure 2(b) illustrates the segmentation of the Teapot Dome by faults within the Salt Creek structural complex. Those tectonics features like the spatial distribution and intensity of fractures across the reservoir and provide geologic framework in which fracture characterization is constructed.
The Tensleep Formation are the hydrocarbon-bearing unit, composed primarily for aeolian sandstone interbedded with marine dolomites. Figure 3 show the stratigraphic column with the lithological units and, hydrocarbon-rich layers requires for reservoir productivity. Seismic interpretation visualized in Figure 4 delineates keys reservoir horizons within a framework for integrating seismic attributes into fracture prediction models.
Available data from four wells, 48-X-28, 71-1-X-4, 67-1-TPX-10, and 25-1-X-14, whose locations are shown in Figure 5, were selected for models calibrations and their validation. These wells also had FMI logs, which provided the necessary fracture intensity data and were the referencse points used to trains the ANN and PNN models.
3.2. Structural Modeling and Seismic Attribute Interpretation
3D seismic dataset give nine primary reflectors, which were auto-tracked to generate structural model. The velocity model construction process is explained in Figure 6, which illustrates:
The structural model, visualized in Figure 7, captures the reservoir’s stratigraphic and structural complexity. The model consists of 720 vertical layers with grid resolution of 400x400 meteres, providing a foundation for analyssing fractures and integrating seismic attributes.
Seismic attributes, particularly Volume Curvature , and Ant Tracking, is computed to detect fractures by highlighting structural discontinuities and subtl subsurface features. The interpretation of seismic datas and integratoin of attributes into fracture analysis workflows were illustrated in Figure 8, showing seismic cross-line X-line 94 with interpreted horizons.
3.3. Fracture Set Distribution and Orientation Analysis
Fracture orientations and intensity analyses for individuale wells provided insights into the spatial variability of fractures within the reservoir. Figure 9 presents polare plots of fracture orientation and intensity for the following wells: 48-X-28, 67-1-X-10, 25-1-X-14, and 71-1-X-4. Fractures was groupede into four set (Codes 0 to 3), with color-coded representations bringing out variability. The combined view across all wells shown high heterogeneity, important for understanding fracture dynamicse, fluid , and reservoir managemente.
3.4. ANN Model Development and Validation for Secondary Porosity and Fracture Intensity
3.4.1. Secondary Porosity Estimation
The ANN model of secondary porositye predictions use bulk density, compressional slowness, and resistivity logs as input parameters. The model architecture, illustrated in Figure 10, featur six hidden layes. Validation againsts well 67-1-TPX-10 showed a high correlation between observed and predicteds porosity values, as shown in Figure 11, confirming the model predictives accuracy.
3.4.2. Fracture Intensity Estimation
A s ANN model develops four fractures intensity prediction, incorporating additional input parameters such as secondary porosity. The structure of this model, detailed in Figure 12, include ten hidden layers. To validate the results at wells 25-1-X-14 , we found excellent agreement between predicted and observed fracture intensities, as shown in Figure 13.
3.5. Selection of Seismic Attributes and PNN Model Training
We have optimized the Seismic attribute selection by using multiple regression analysis. The errored curve in Figure 14 points out that the model achieves optimal performance with 15 attributes. By Adding more attributes increased the risks of overfitting, highlighting the importance of precise attribute selections.
PNN model, trained wit the selected attributes, achieving attaining correlation of 0.93 and validation errors below 4%. Figure 15 presents scattern plot comparing actuals and predicted fracture intensities, confirming the model reliability. The operator length for the PNN model, proved in Figure 16, were determined to be nine, ensuring a balance between predictions accuracy and computational efficiency.
3.6. Construction of the 3D Fracture Intensity Cube and DFN Model
PNN outputs used to construct a 3D fracture intensity cube, which provided a spatially detailed representation of fracture intensity across the reservoir. As shown in Figure 17 the spatial distribution of fracture intensity, with color-coded zonese representing varying intensity levels. This cube served as the foundation for constructing the DFN model.
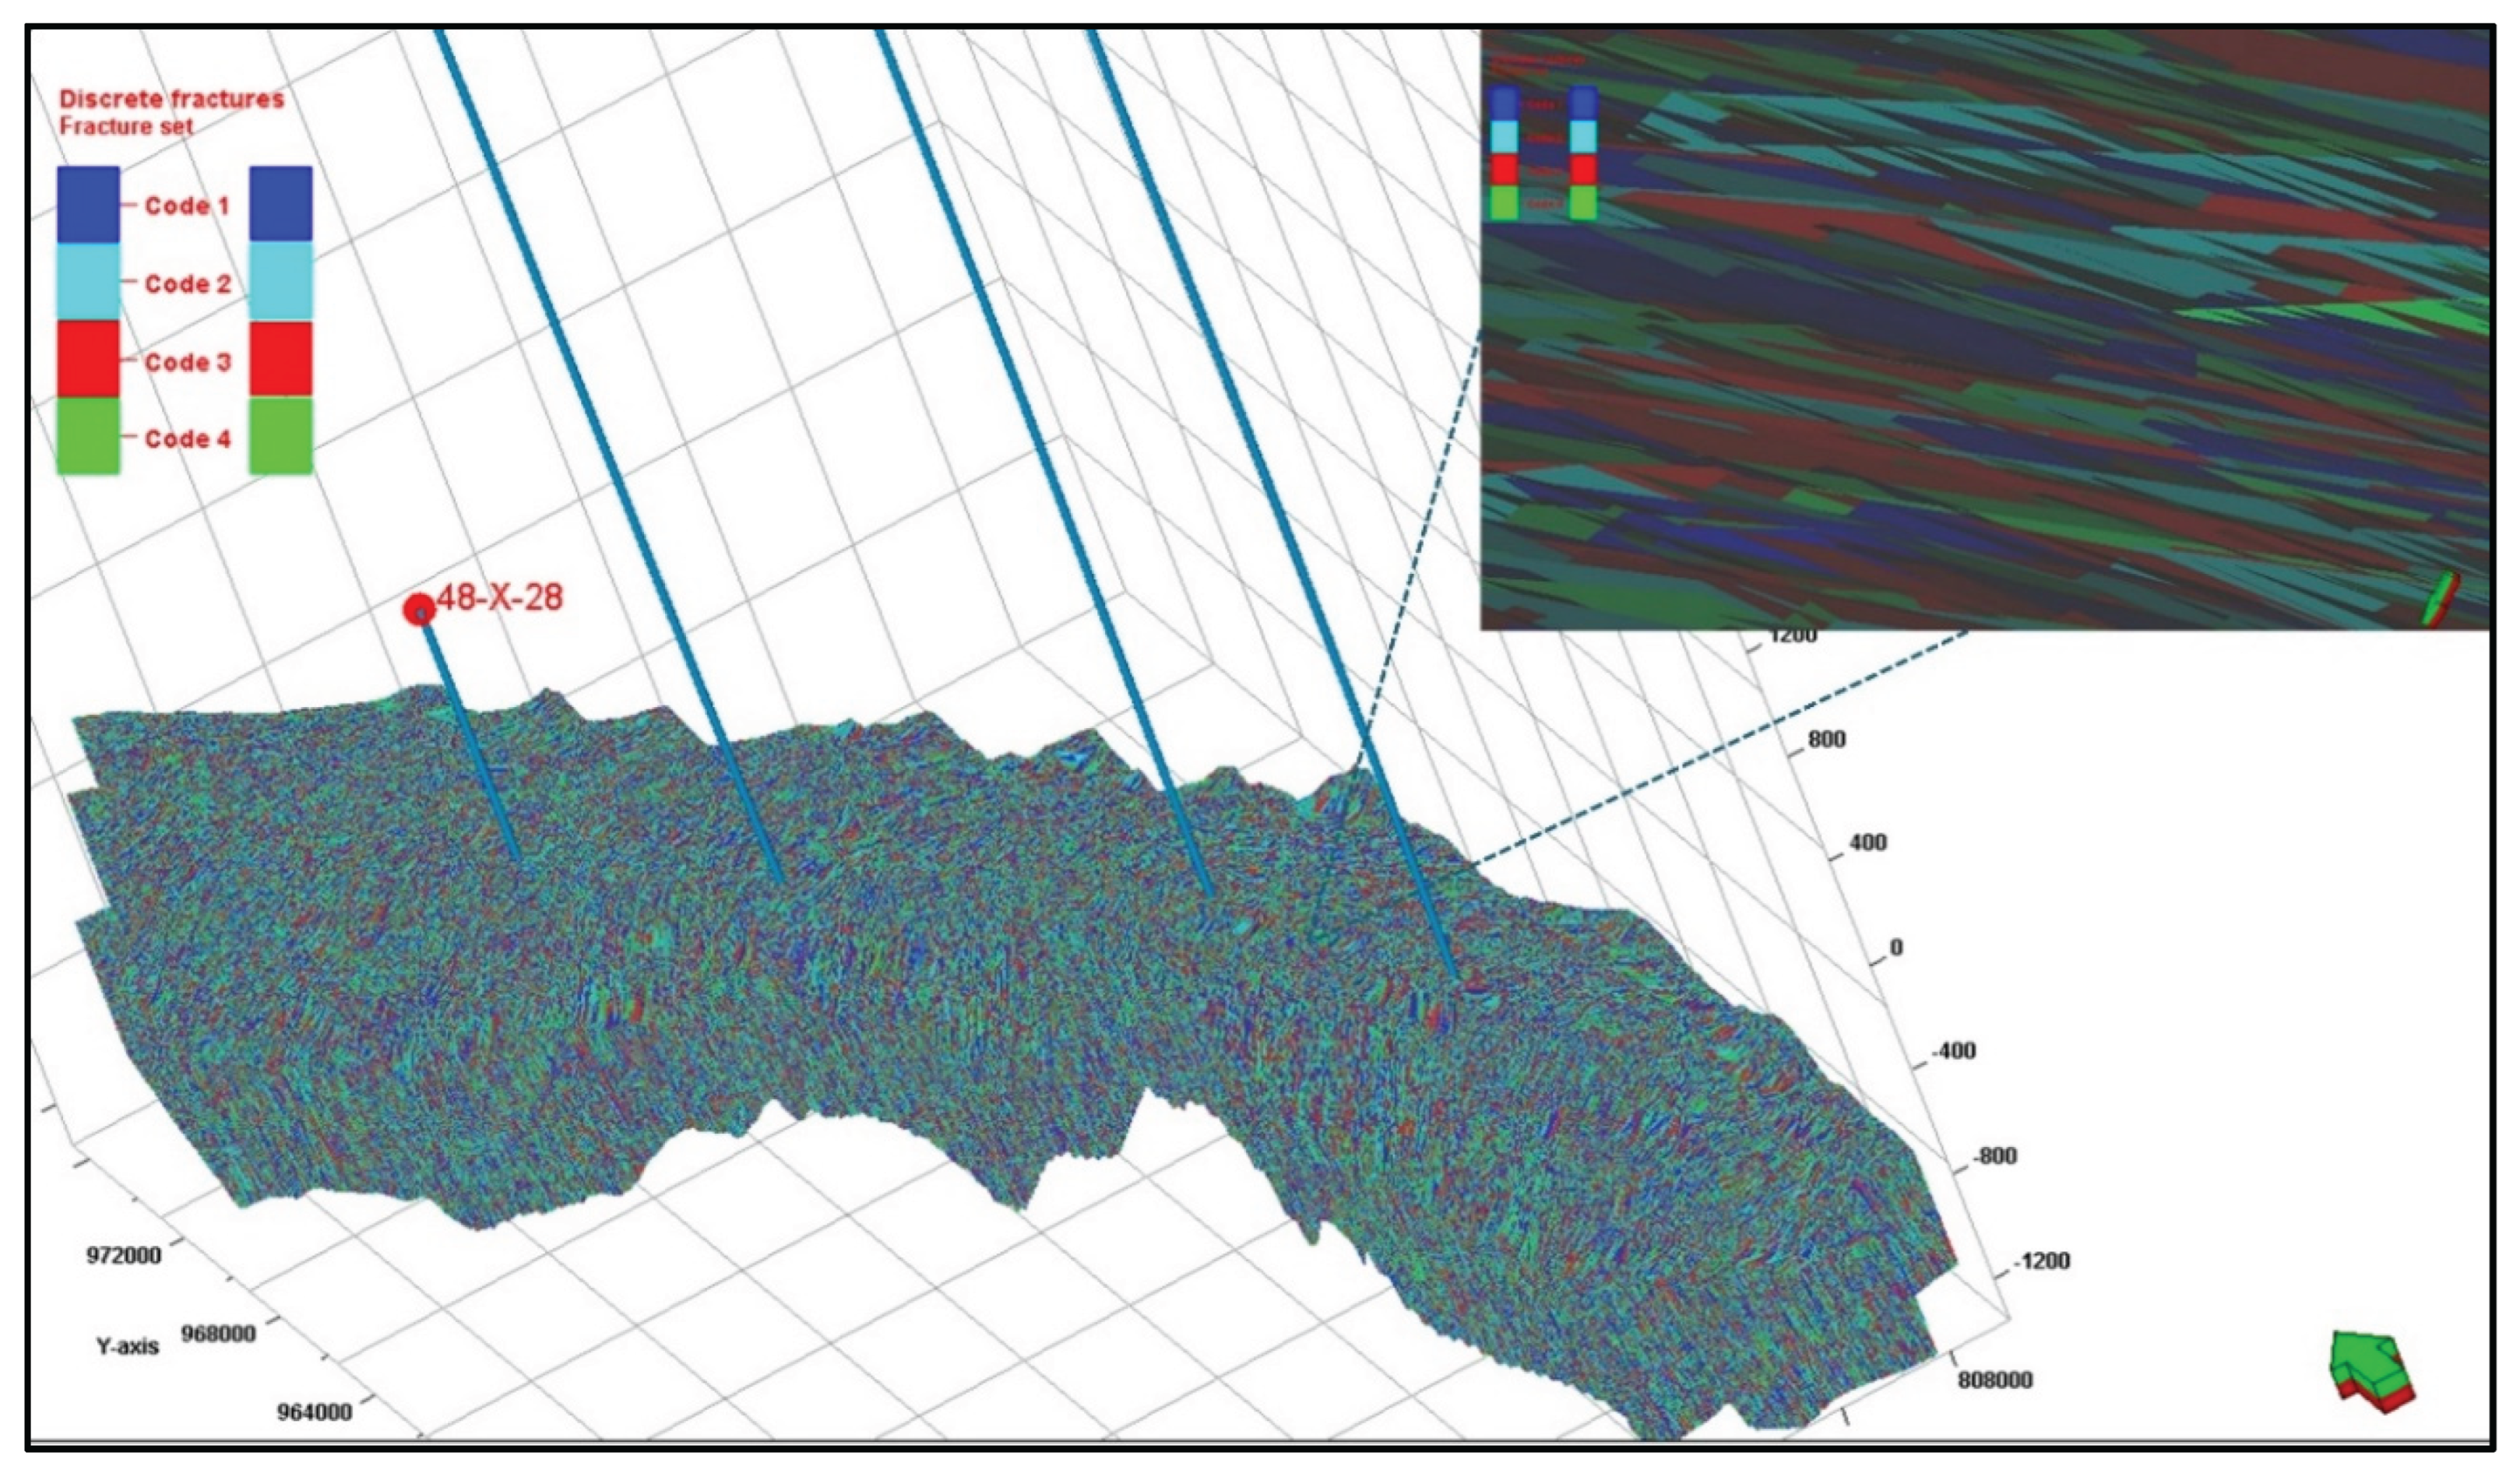
DFN model, depicted in Figure 18, incorporates fracture geometrys, and density for four fracture sets (Codes 1 to 4). Sequential Gaussian simulation were employed of assignn intensity properties to the DFN model, enabling realistics and detailed fracture characterization across the Tensleep Formation.
3.7. DFN Upscaling for Dynamic Simulation
Permeability, and sigma factorse, was upscaled for dual permeability flows simulations. The Discrete Fracture Network (DFN) model see ( Figure 18) provided a detailed representation of fracture distribution, orientation, and density acrosses the Tensleep Formation, which served the foundation for these upscaling process.
ehe cubic law used to calculates permeability . This law correlates fracture aperture with fluid flow, enabling accurate estimation of fracture permeability within the network. Using the cubic law, fracture permeability was derived and assigned to individual grids cells in the simulation model. These permeability values were than statistically analysed ensures consistency with theoretical predictions.
In the another hand, fracture porosity, sigma factor, and spacing were calculated and integrateds into the reservoir simulation grid. The upscaled properties allowed for dynamic simulations of fluid flow, providings insights into fluid migration pathways and supporting strategies for enhanced oil recovery (EOR) and secondary recovery. This approachs underscores the importance of integrating detailing DFN modeling with robuste mathematical frameworks like the cubic law optimize reservoir performances.
4. Discussion
This study provide a good applications of Artificial Neural Networks (ANN) and Probabilistic Neural Network (PNN) for predicting fracture intensity in the Tensleep Formation, a naturally fractured reservor at Teapot Dome. By integrating seismics attributes and well log data, we developing 3D fractures intensity cube and Discrete Fracture Network (DFN) model, allowes for an accurate and spatially comprehensive characterization of fracture network. The result affirm the efficacy for machine learning in capturing complex geological features and underscore the transformative potential of AI-driven methods for fractured reservoir managemen.
4.1. Enhanced Fracture Characterization Through AI: Addressing Traditional Limitations
Naturally fractured reservoirs were very problematic of reservoir characterization owinge to their highly heterogeneous and , anisotropic nature-for instance, like reservoirs of the Middle East and at Teapot Dome, Wyoming. Traditional methods of fracture characterization, such as sampling and FMI logging, result in very high-resolution with respect the fractures, yet are highly limite of their spatial coverage due to their high cost. A host of studies such as Akshat and Sanjay[23] have established the fact that traditional approaches normally cannote capture the fracturing variability in a reservoir and thus provide poor recovery strategies. This paper, with the application of the ANN and PNN approaches, will not only address such shortfalls but also be computationally efficient and easily scalable for precise fracture intensity predictions over the entire reservoir.
The proposed model achieves this goal by using some of the seismic attributes, such as Volume Curvature and Ant Tracking, identified as key determinants of fracture intensity. The structural discontinuities and subtle changes that remain not clear within the raw seismic data , this agrees with the works by Di and Gao[24] and Gao and Di [25], where the feasibility of seismic curvature attributes in mapping natural fractures and fault structures was demonstrated. We gained a decrease in predicti on errors by optimizing the model to employ 15 highly predictiven attributes in a manner that the model would not run the risk of overfitting and could generalize very well for the whole reservoir.
4.2. Implications of Seismic Attribute Selection and ANN-PNN Modeling Accuracy
The selection of seismic attributes are important to enhance the model performance, each attribute contributes differently for predicting the framework. In our study, Volume Curvature and Ant Tracking used as key indicators for fracture intensity, aligning with the works of Di and Gao[26] who established that curvature-relatede attributes can enhancen fracture detection, especially in folded and faulted geological settings. Volume Curvature highlights flexural stresses patterns that correlate with fracture formation, while Ant Tracking enhances detection of fault trends by reducing subtle structural features. The integration of these attributes allowed our ANN model to predicts fractures intensity with high spatial fidelity.
Our model achieved a training correlation of 0.93 by using multiple attributes regression for the selection of the optimal number of attributes, with very low validation errors for all wells. This is an important result since it shows that the AI model is able to capture the spatial variability of fractures with limited FMI data, avoiding the cost of acquiring extensive direct measurements. This work develops approaches suggested in Zaiery et al.[27], where machine learning models applied for fracture density estimation showed comparable performance in extrapolating fracture properties over spatially limited datasets.
4.3. Constructing a 3D Fracture Intensity Cube: A Step Toward Dynamic Modeling
The resulting model come up with a 3D fracture intensity cube, which give details to a spatially improve mesh of fracture intensities of the Tensleep Formatione. This provided a framework frome which to base the DFN model for simulations of the fracture geometry, orientation, and density at a reservoir-wide scale. The development of such a detailed 3D model is important for understanding the fluid flow pathways, which are believed to be greatly influenced by fracture distribution and intensity. This model, as observed by Di and Gao[26] and Akshat and Sanjay[23], will enhance the prediction of fluid movement within the reservoir, ensuring better EOR and even better planning of secondary recovery with the definition of high-intensity fracture zones that might act either as conduits or barriers to flow.
The 3D fracture intensity cube further feed the DFN model with directly upscaled intensity data for dynamic simulations. Again, the approach here rests on the findings of Lefranc et al.[28] that while the DFN models are critical to effective fracture characterization, in their absence of spatially continuous data these models usually fail in heterogeneous reservoirs. By incorporating our intensity cube into the DFN model, we enable dual-porosity/permeability flow simulation that capture complex fractures and matrix interactions in flow properties.
4.4. Probabilistic Neural Network (PNN) and Cross-Validation: Ensuring Model Robustness
Validation optimum operator lengths of nine, during the implementation of the PNN model, yields constantly low values for validation error, thus further confirming the reliability of this model. Such an accurate model is very important; this is because the reservoir models should work reliably under various conditions and with a lot of types of datasets. Our model could maintain the validation error below 4% while achieving high cross-correlation across well. This prove that the model is robuste. This level of reliability is essential in fractured reservoirs, where unexpected variations in fracture intensity may significantly impacted production forecasting and secondary recovery methods.
The optimum attribute weighting process-entailing cross-validation-definitely improve the model reliability. An evidence was provided by Rockhold et al.[29] and Zaiery et al. [27] that refining attribute weights is very essential to decrease the prediction errors. Accordingly, to reduce overfitting, a systematic adjustment of the weights of each attribute was conducted, thereby assuring strong generalization throughout the modeling process for independent wells an essential feature of its applicability to other naturally fractured reservoirs.
4.5. Practical Implications for Reservoir Management and Secondary Recovery
Our results have wide implications for reservoir managements, especially in mature fields where optimizing secondary recovery is often crucial. The resulting 3D fracture intensity cube gives the reservoir engineer high-resolution fracture intensity maps. This map is important for well placement, improving drilling paths, and preventing water breakthrough by identifying highly conductive zones in the fracture networks. By modeling fracture intensity and orientation precisely, our framework helps develop more focused secondary recovery strategies. This challenge mentioned in the previous studies about fractured reservoirs[10,18,30].
Additionally, the AI-driven approach offers an economical way to characterize reservoirs by reducing the need for FMI logs and direct fracture measurements. Many maturee fields have budget limits for acquiring different types of data. Therefore, an AI-driven method provides flexibility for use even in data-scarce areas. These findings support the work of Xuemei et al.[4], which showed that AI models optimized with machine learning algorithms like PSO can achieve high accuracy in complex reservoir conditions. This suggests potential future improvements for this study’s methodology.
4.6. Model Limitations and Future Directions
PNN approach shows excellent predication in forecasting howe severe fractures may be in our study, but future work could look into ways to make it more responsive to real-time changes and better at including geomechanical factors , For instance, the inclusion of real-time seismic monitoring information could enhance model predictions by considering variations in reservoir stresses states, especially as they relate to productions activities. According to Soumya et al.[31], geomechanical modeling can increase our ability to predict how stress data and fracture slip probabilities play out, especially in reservoirs when we’re injecting fluids. This could give us accurate forecast, particularly if we use top-notch machine learning tools like LSTM networks that have been finely tuned with PSO, because they really capture the flow of time in the reservoir. In this pervious study Xuemei et al.[4] shows, the LSTM-PSO model give great capability of handling complex nonlinear data, and probably further improvements of predictive performance of fracture models are possible by including temporal information together with spatial information.
5. Conclusions
Results confirm that the transformative potentials of AI-driven fracture characterization methods, particularly in naturally fractured reservoirs where traditional approaches often fail. We have combined seismic data with ANN and PNN models in a robust and scalable way to predict fracture intensity, which really helps in managing reservoirs. Creating a 3D fracture intensity cube and adding it to the DFN model is a brilliant method for enhancing how we plan production, especially in old oil fields where the focus was supposed to be given to secondary recovery methods. Future research may enhance this method by using live geomechanical information and state-of-the-art AI, which will lead to intelligent, flexible models that handle the ever-changing issues related to managing fractured reservoirs.
Author Contributions
Conceptualization, I.A., A. S. D., G. H.; methodology, I.A., A. S. D., G. H.; software, I.A.; validation, I.A., A. S. D., G. H.; formal analysis, I.A., A. S. D., G. H.; investigation, I.A.; resources, I.A.; data curation, I.A.; writing—original draft preparation, I.A.; writing—review and editing, I.A., A. S. D., G. H.; visualization, I.A.; supervision, A. S. D., G. H.; project administration, I.A. All authors have read and agreed to the published version of the manuscript.
Funding
This research received no external funding
Data Availability Statement
Part of the dataset used in this study was obtained from the SEG website, and the remaining part was purchased personally by the first author (Israa Ahmed). The author confirms that all data sources were legally accessed and properly utilized for the purposes of this research.
Acknowledgments
The author would like to express sincere gratitude to Prof. Abdel Sattar Dahab and Prof. Gharib Hamada for their valuable guidance, constructive comments, and continuous support throughout the preparation of this research. Their supervision and advice were instrumental in shaping the study. The author also acknowledges that this research received no external funding, and all expenses, including data acquisition, were personally covered by Israa Ahmed.
Conflicts of Interest
The authors declare no conflicts of interest. The funders had no role in the design of the study; in the collection, analyses, or interpretation of data; in the writing of the manuscript; or in the decision to publish the results.
References
- Narr, W.; Schechter, D.S.; Laird, B.T. Naturally Fractured Reservoir Characterization. SPE, 2006. [CrossRef]
- Warren, J.E.; Root, P.J. The Behavior of Naturally Fractured Reservoirs. SPE J. 1963, 3(3), 245–255. [CrossRef]
- Amr, G.; Ahmed, F.I.; Mohamed, A.G.; Mohamed, E.; Ahmed, A.; Nihal, D. Automated Borehole Image Interpretation Using Computer Vision and Deep Learning. SPE J. 2024, 29(12), 6918–6933. [CrossRef]
- Xuemei, X.; Xiaopeng, Z.; Aoxiang, K.; Yang, L.; Xueling, Z.; Zelong, X.; Yishan, L. Prediction of Leakage Pressure in Fractured Carbonate Reservoirs Based on PSO-LSTM Neural Network. Processes 2023, 11(7), 2222. [CrossRef]
- Fraidoon, R.; Devan, H.; Lorinczi, P.; Glover, P.W.J. The Effect of Fracturing on Permeability in Carbonate Reservoir Rocks. Mar. Pet. Geol. 2023, 152, 106240. [CrossRef]
- Adibifard, M.; Tabatabaei-Nezhad, S.A.R.; Khodapanah, E. Artificial Neural Network to Estimate Reservoir Parameters in Naturally Fractured Reservoirs Using Well Test Data. J. Pet. Sci. Eng. 2014, 122, 585–594. [CrossRef]
- Kim, L.N.; Meshael, J.; Naveen, V.; Riyad, Q. Identifying Fracture Sweet Spots Using Artificial Neural Network Approach. In Proc. Middle East Oil, Gas and Geosciences Show; Manama, Bahrain, 19–21 Feb 2023. [CrossRef]
- Pinous, O.; Abdel, M.Z.; Gary, R.; Ted, R.; Nikolay, S.; Dmitry, B.; Blank, A. Continuous Fracture Modeling of a Carbonate Reservoir in West Siberia. In Proc. 2nd Int. Oil Conf. Exhib. Mexico; Veracruz, Mexico, 19–23 Jun 2007. [CrossRef]
- Ouahed, A.K.; Tiab, D.; Mazouzi, A.; Sarfraz, A.J. Application of Artificial Intelligence to Characterize Naturally Fractured Reservoirs. In Proc. SPE Int. Improved Oil Recovery Conf. Asia Pacific; Kuala Lumpur, Malaysia, 2003. [CrossRef]
- Cooper, S.P. Deformation within a Basement-Cored Anticline, Teapot Dome, Wyoming. MSc Thesis, New Mexico Tech, 2000.
- Cooper, S.P.; Goodwin, L.B.; Lorenz, J.C. Fracture and Fault Patterns Associated with Basement-Cored Anticlines. AAPG Bull. 2006, 90, 1903–1920. [CrossRef]
- Gilbertson, N. 3-D Geologic Modeling and Fracture Interpretation of the Tensleep Sandstone. MSc Thesis, Colorado School of Mines, 2006.
- Schwartz, B.C. Fracture Pattern Characterization of the Tensleep Formation, Teapot Dome, Wyoming. MSc Thesis, West Virginia University, 2006.
- Valerie, L.S. Modeling Natural Fracture Networks: Establishing the Groundwork for Flow Simulation at Teapot Dome. PhD Thesis, West Virginia University, 2008. [CrossRef]
- Thomas, H.W.; Valerie, S.; Alan, B. Developing a Model Discrete Fracture Network. AAPG Bull. 2015, 99(4), 735–762. [CrossRef]
- Ouenes, A.; Anderson, T.; Klepacki, D.; Bachir, A.; Boukhelf, D.; Araktingi, U.; Holmes, M.; Black, B.; Stamp, V. Integrated Characterization and Simulation of the Fractured Tensleep Reservoir. In Proc. SPE Western Reg. Meet.; Anaheim, CA, USA, 2010. [CrossRef]
- Thachaparambil, M.V. Discrete 3D Fracture Network Extraction from 3D Seismic Data. Interpretation 2015, 3(3), 29–41. [CrossRef]
- Cooper, S.P.; Lorenz, J.C.; Goodwin, L.B. Lithologic and Structural Controls on Natural Fracture Characteristics. 2001. [CrossRef]
- Spooner, V.E.; Geiger, S.; Arnold, D. Dual-Porosity Flow Diagnostics for Spontaneous Imbibition. Water Resour. Res. 2021, 57(5). [CrossRef]
- Ahmed Elfeel, M.; Jamal, M.; Enemanna, C.; Arnold, D.; Geiger, S. Effect of DFN Upscaling on History Matching. In Proc. EAGE Annu. Conf. Exhib. Incorporating SPE Europec; London, UK, 2013. [CrossRef]
- James, E.F.; Gordon, L.D.; Jerry, L.C. Powder River Basin. Geol. Soc. Am. 1991, 2, 373–390. [CrossRef]
- Chiaramonte, L. Geomechanical Characterization and Reservoir Simulation of a CO₂ Sequestration Project. PhD Thesis, Stanford University, 2009.
- Akshat, C.; Sanjay, S. Modeling Natural Fracture Networks Using Geostatistical and Geomechanical Inferences. Energy Procedia 2019, 158, 6073–6078. [CrossRef]
- Di, H.; Gao, D. 3D Seismic Flexure Analysis for Fault Detection. Pure Appl. Geophys. 2017, 174(9), 3769–3785. [CrossRef]
- Gao, D.; Di, H. Efficient Volumetric Extraction of Curvature and Flexure. Geophys. Prospect. 2016, 64(2), 363–376. [CrossRef]
- Di, H.; Gao, D. Gray-Level Transformation and Canny Edge Detection. Comput. Geosci. 2014, 66, 1–12. [CrossRef]
- Zaiery, M.; Kadkhodaie, A.; Arian, M.; Maleki, Z. ANN and Random Forest for Fracture Intensity Estimation. J. Pet. Explor. Prod. Technol. 2023, 13(9), 1877–1887. [CrossRef]
- Lefranc, M.; Farag, S.; Bingjian, L. Reservoir Characterization for Fracture Prediction. In Proc. SPE Asia Pac. Oil Gas Conf. Exhib.; Jakarta, Indonesia, 2011. [CrossRef]
- Rockhold, M.L.; Sullivan, E.C.; Murray, C.J.; Last, G.V.; Bacon, D.H. Data Assimilation Tools for CO₂ Reservoir Model Development. Environ. Geosci. 2009, 16(1), 105–115. [CrossRef]
- Chiaramonte, L.; Zoback, M.D.; Friedmann, J.; Stamp, V.W.; Zahm, C. Fracture Characterization and Flow Simulation with Geomechanical Constraints. Energy Procedia 2011, 4, 3973–3980. [CrossRef]
- Soumya, B.; Souvik, S.; Rafik, B.; Sourav, M.; Rabah, C. Geomechanical Modeling for Injection-Induced Slip Potential. Int. J. Rock Mech. Min. Sci. 2024, 178, 105775. [CrossRef]
Figure 1.
Location of the Teapot Dome in Wyoming[13].
Figure 1.
Location of the Teapot Dome in Wyoming[13].
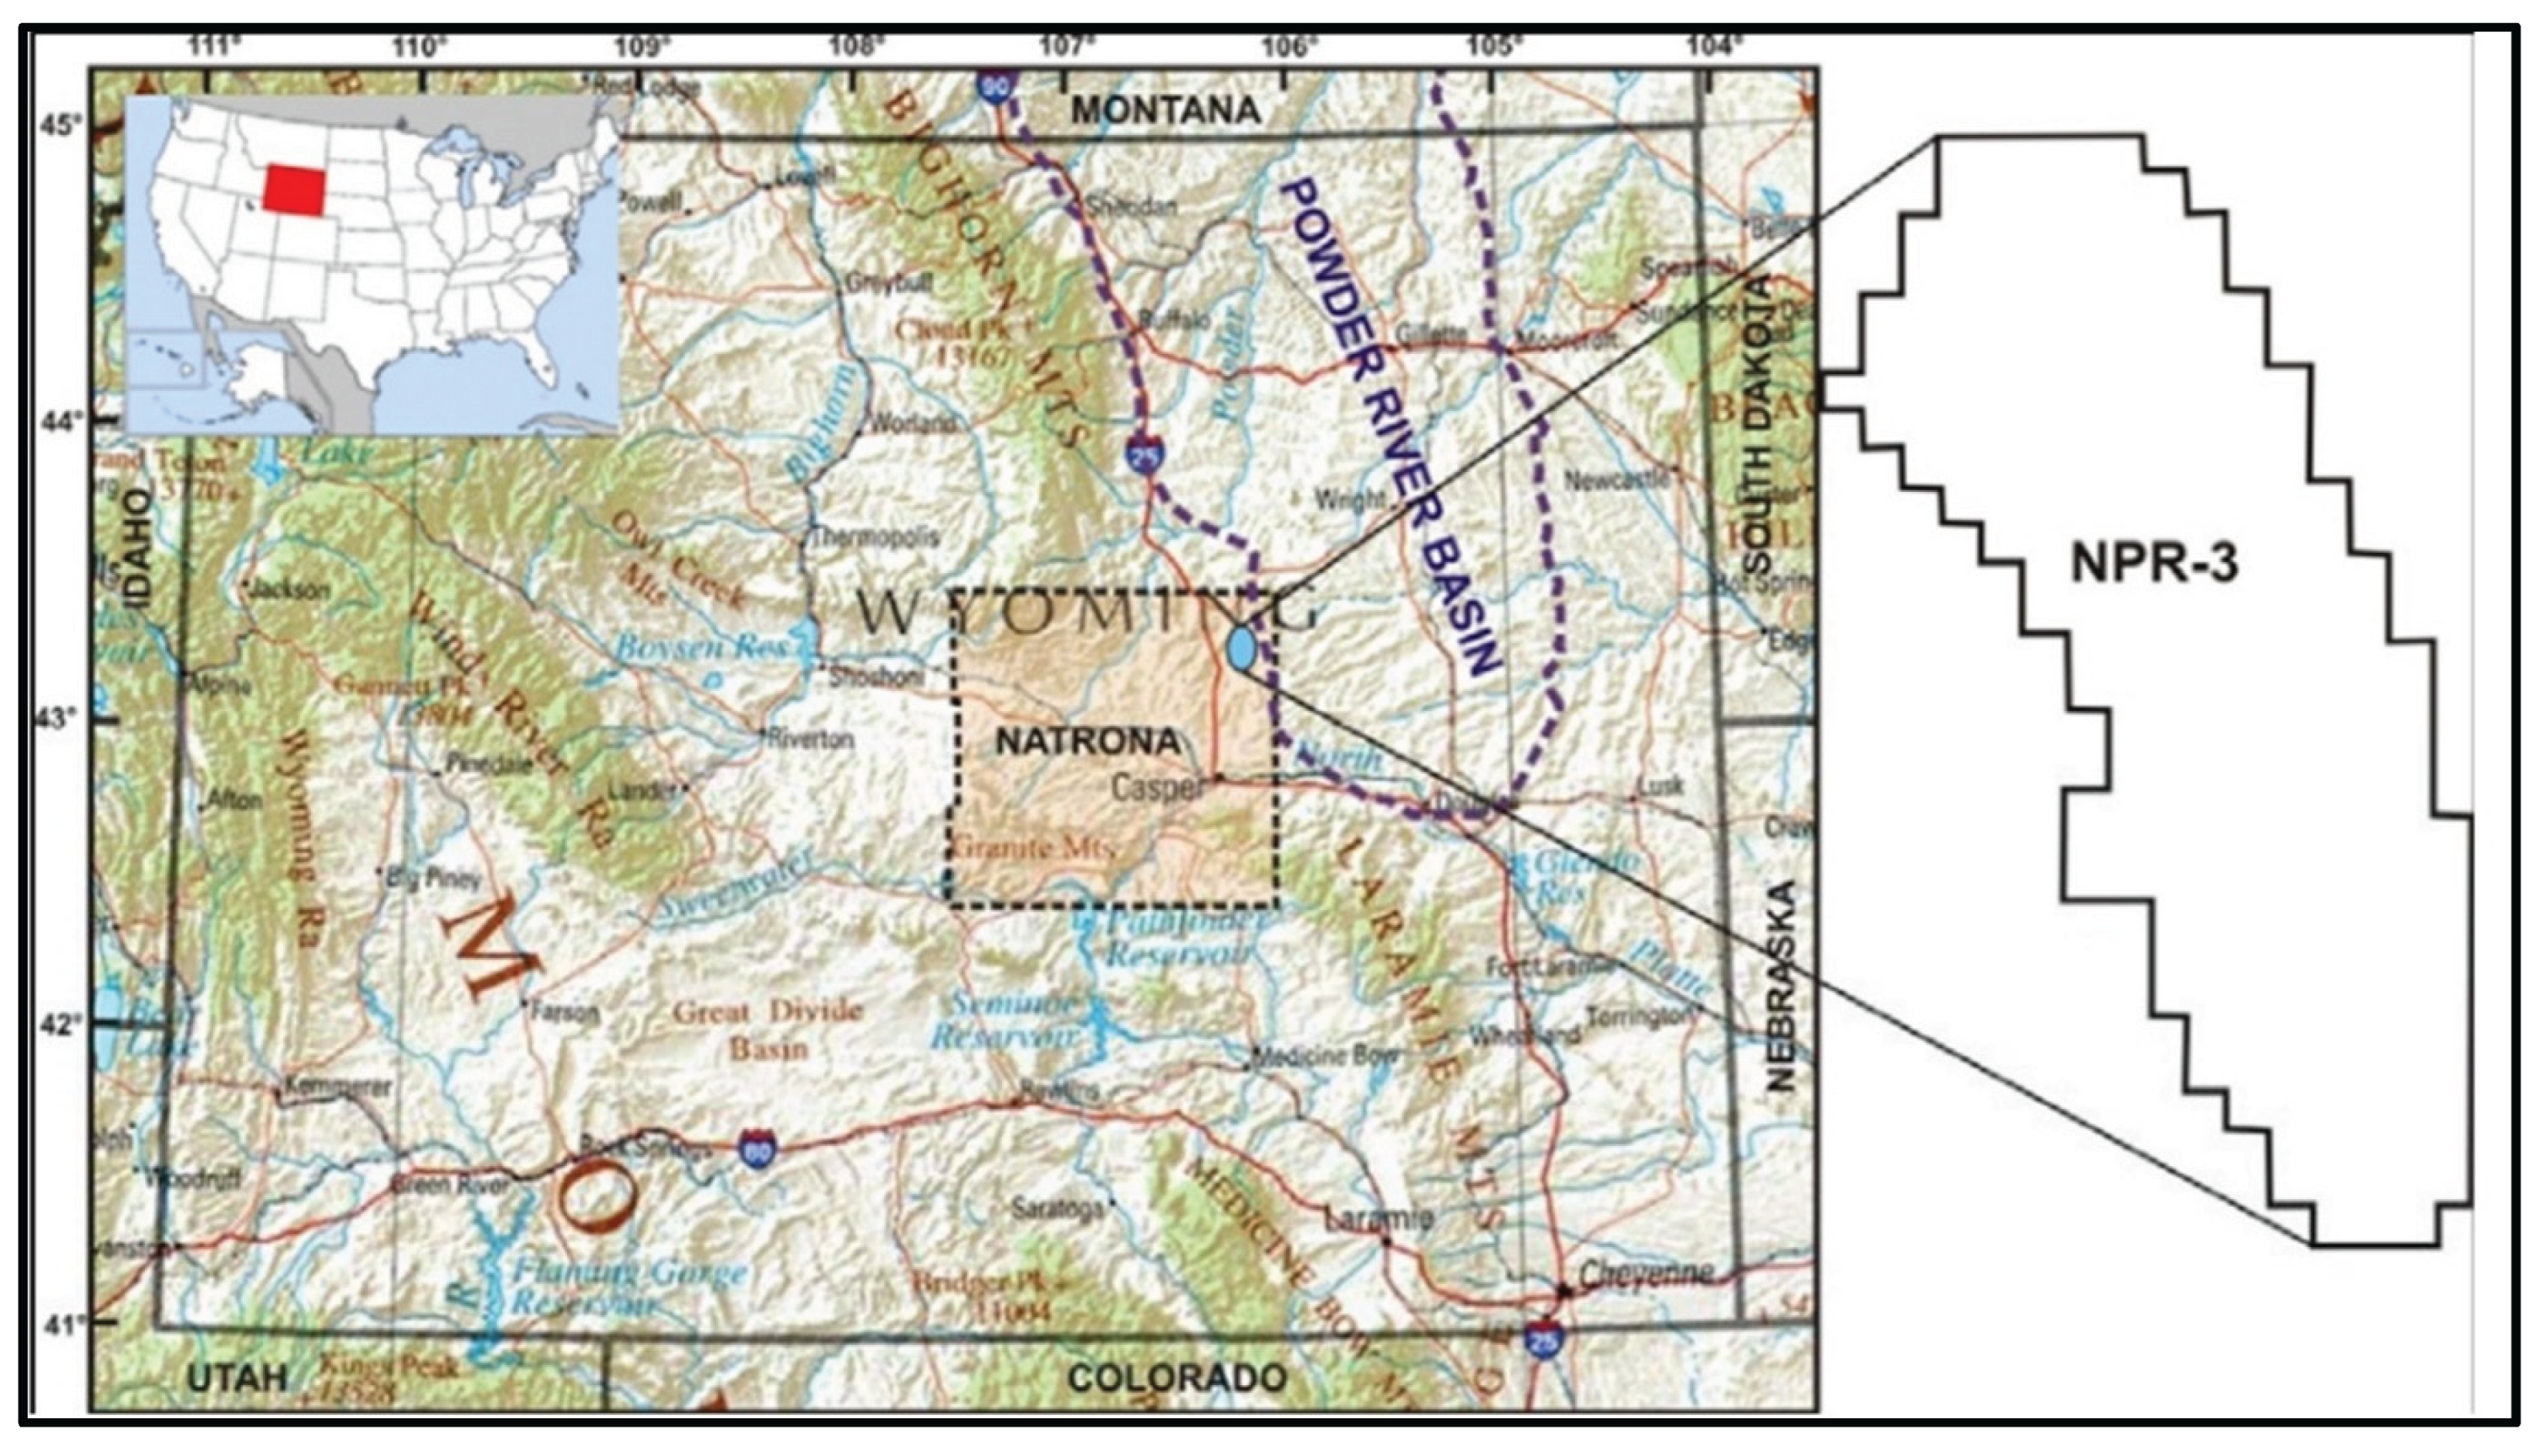
Figure 2.
(a) Map of the Teapot Dome within Laramide uplifts [21]; (b) Teapot Dome’s location within the Salt Creek structural complex[22].
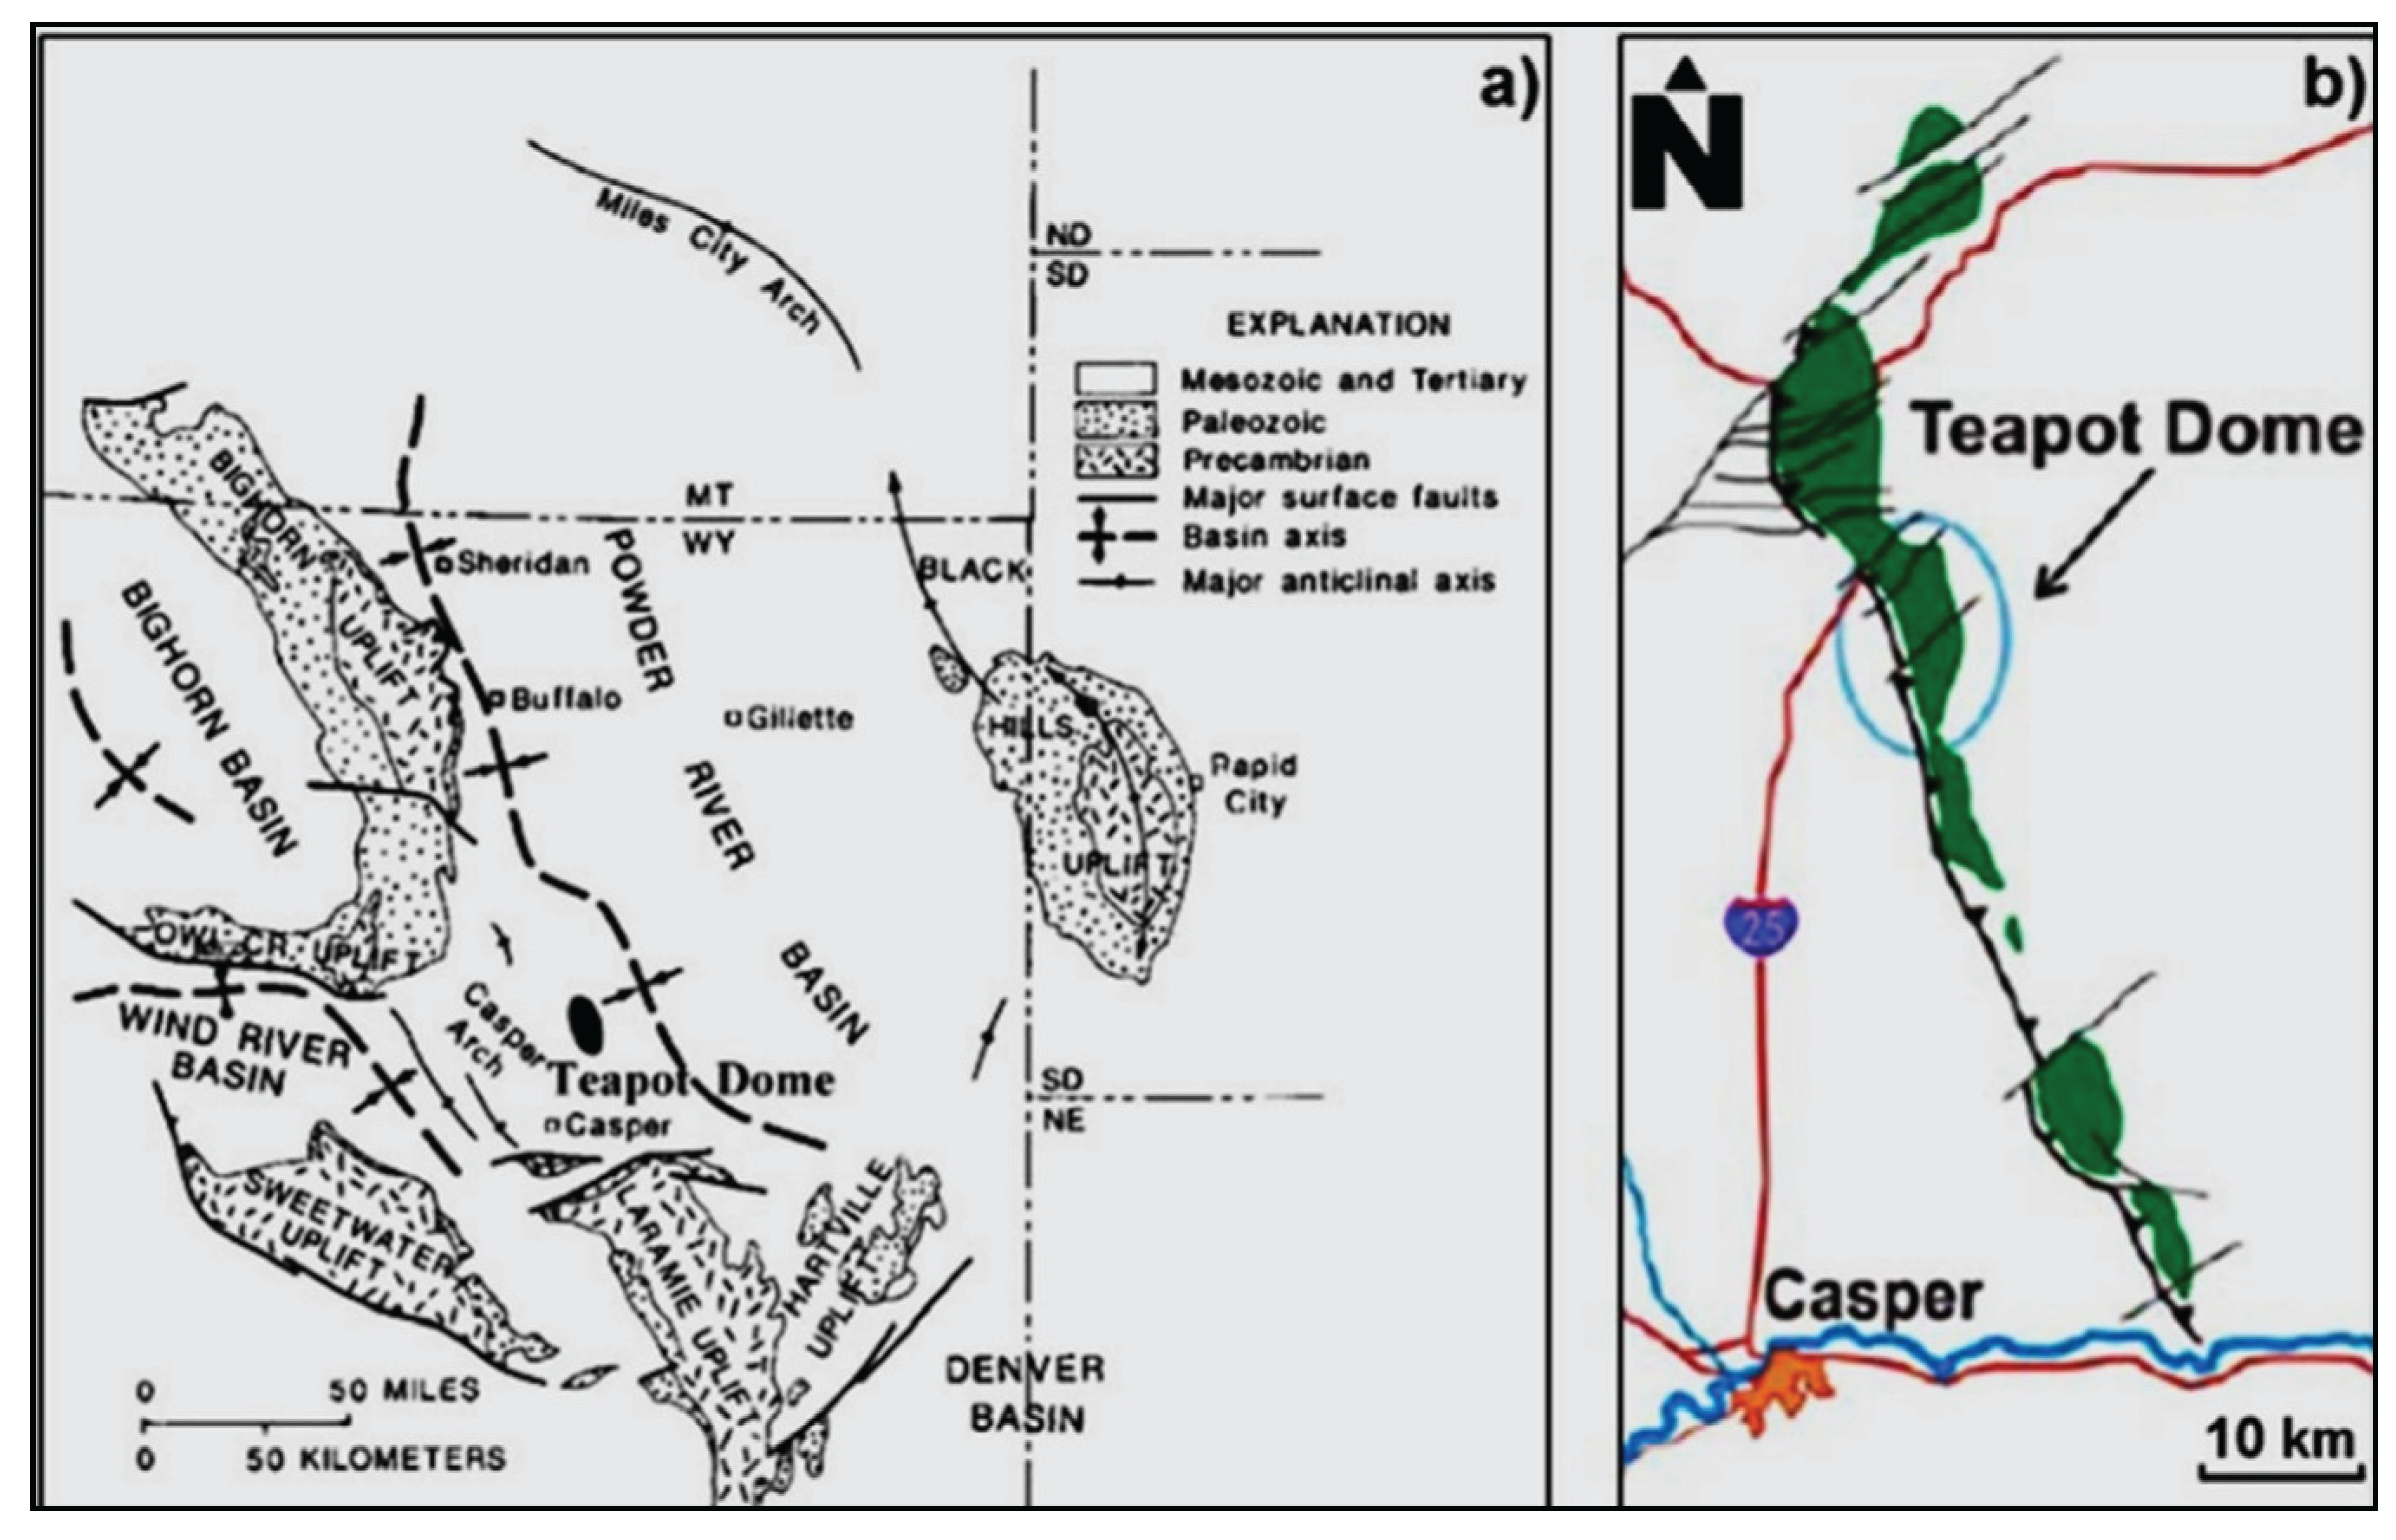
Figure 3.
Stratigraphic column of the Tensleep Formation, highlighting lithological units and key hydrocarbon-bearing layers [22].
Figure 3.
Stratigraphic column of the Tensleep Formation, highlighting lithological units and key hydrocarbon-bearing layers [22].
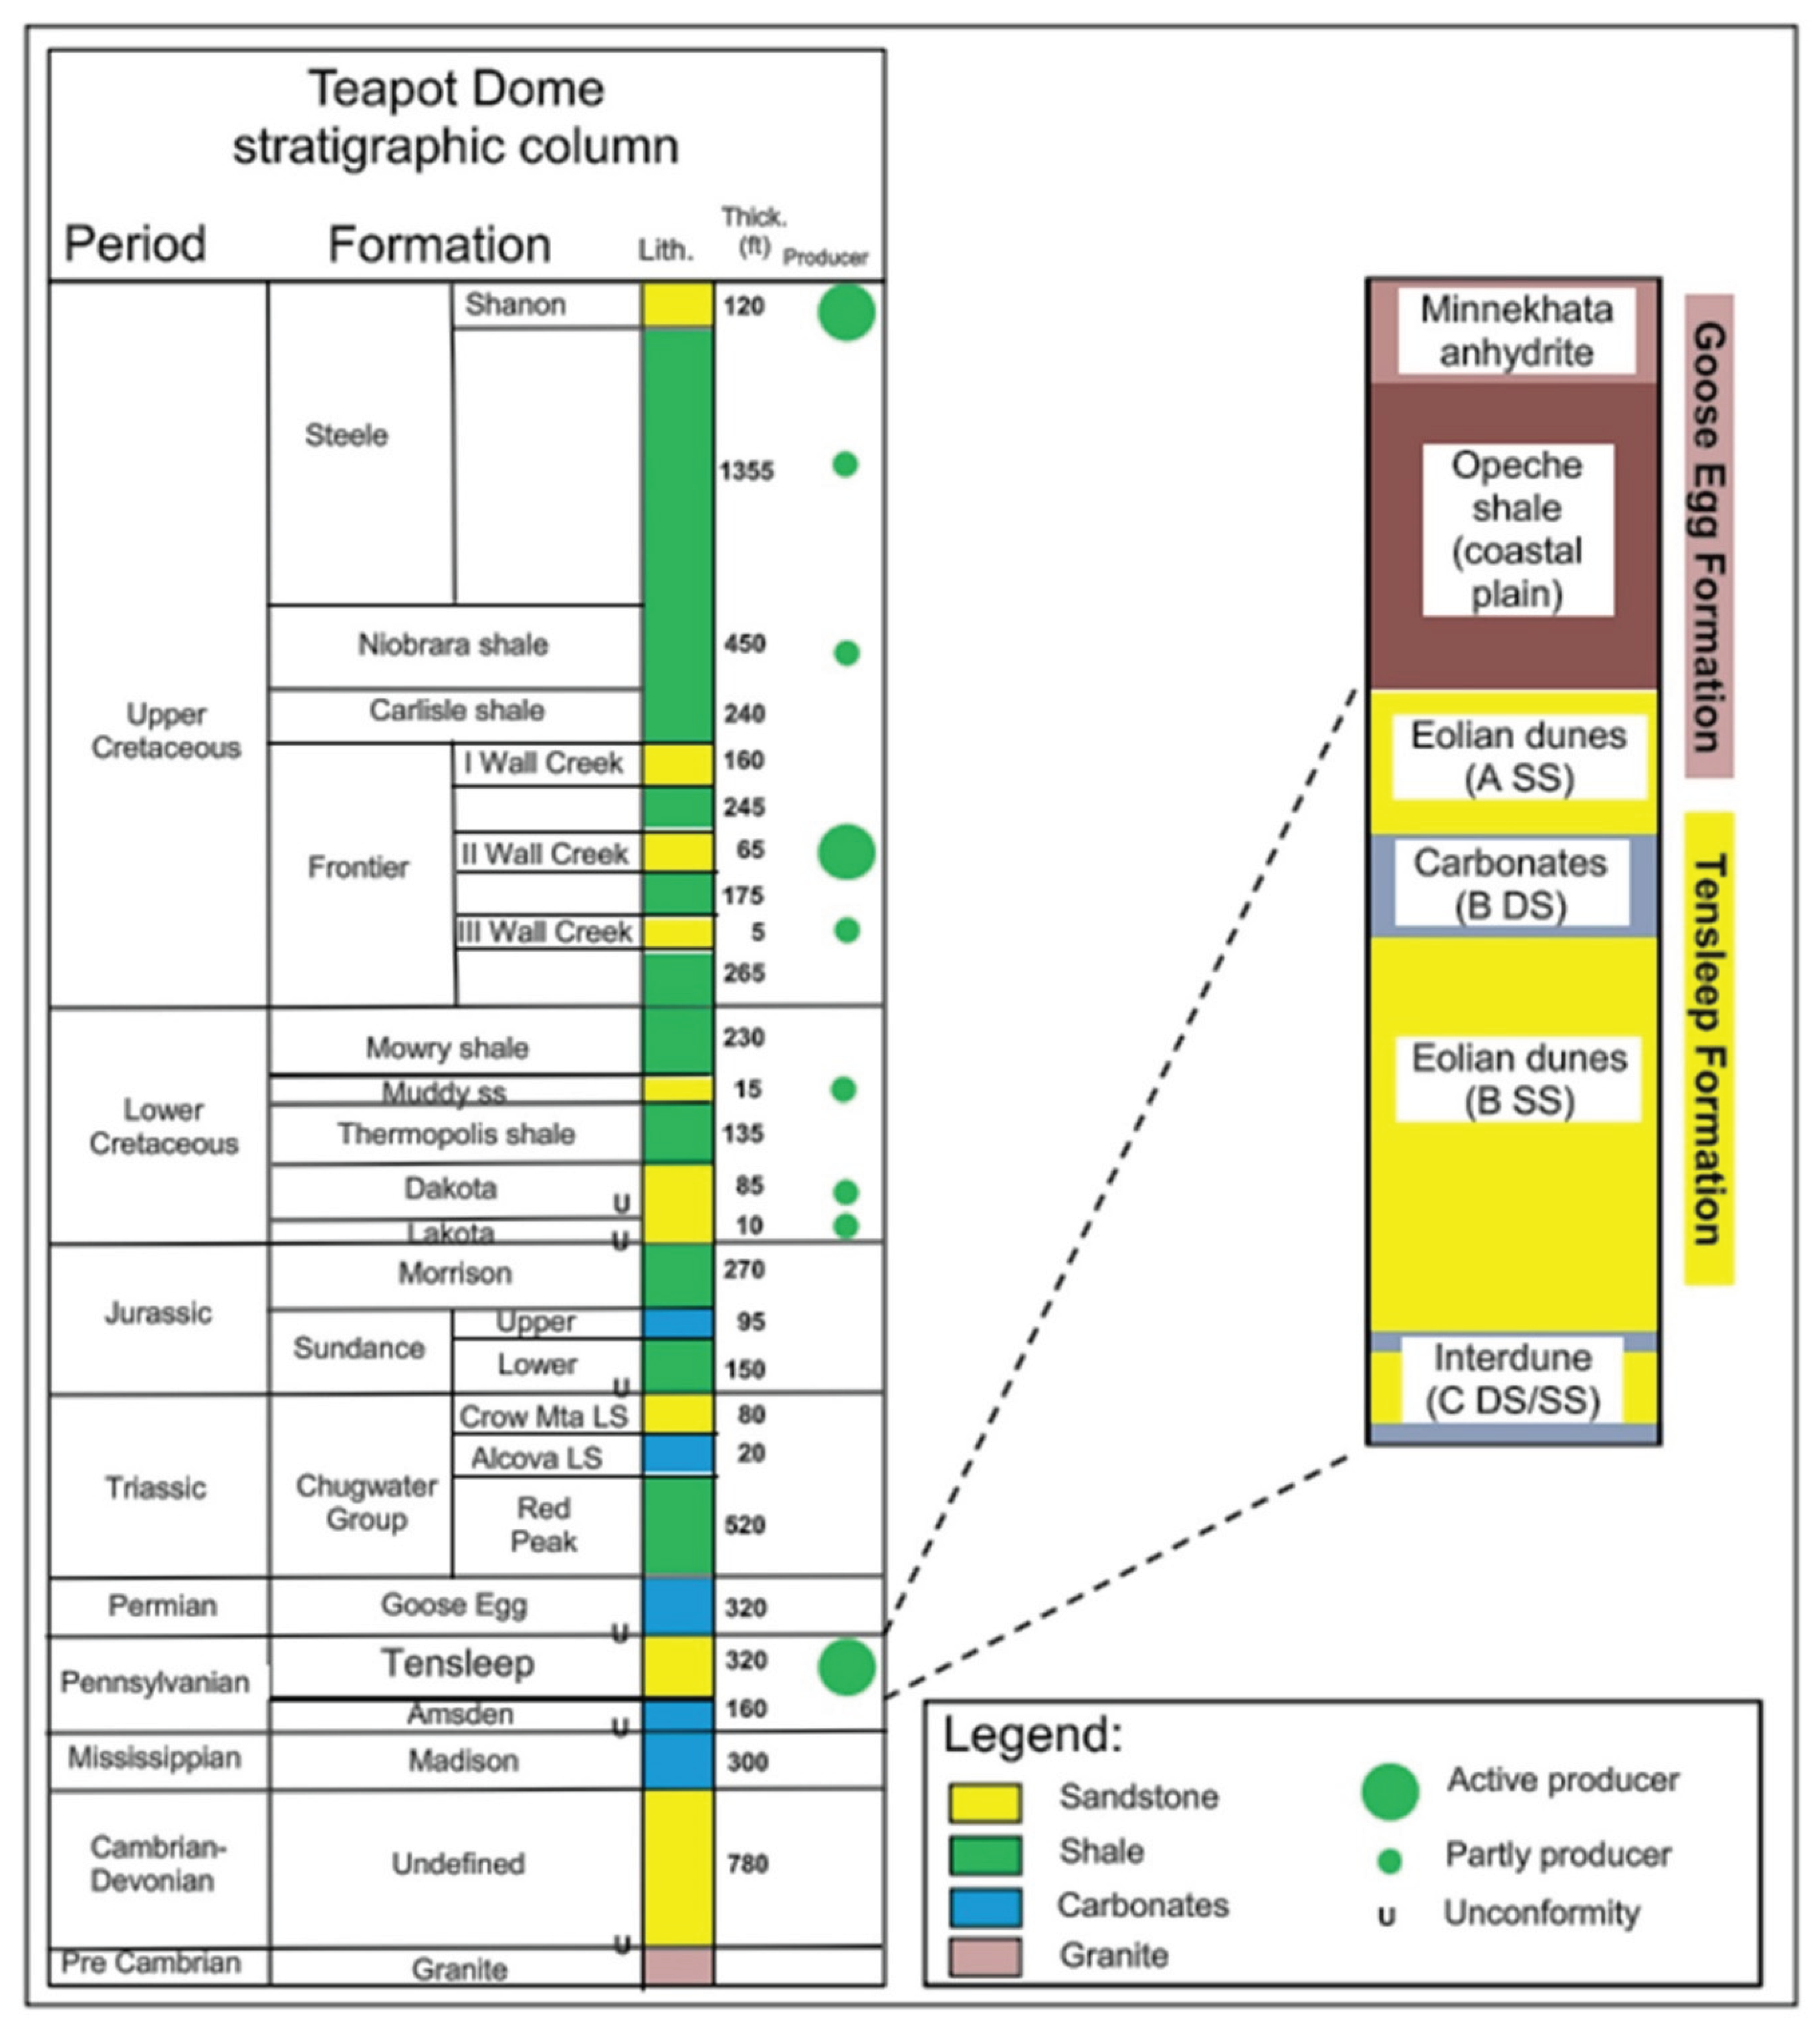
Figure 4.
Seismic in-line (128) with interpreted reservoir horizons within the Tensleep Formation.
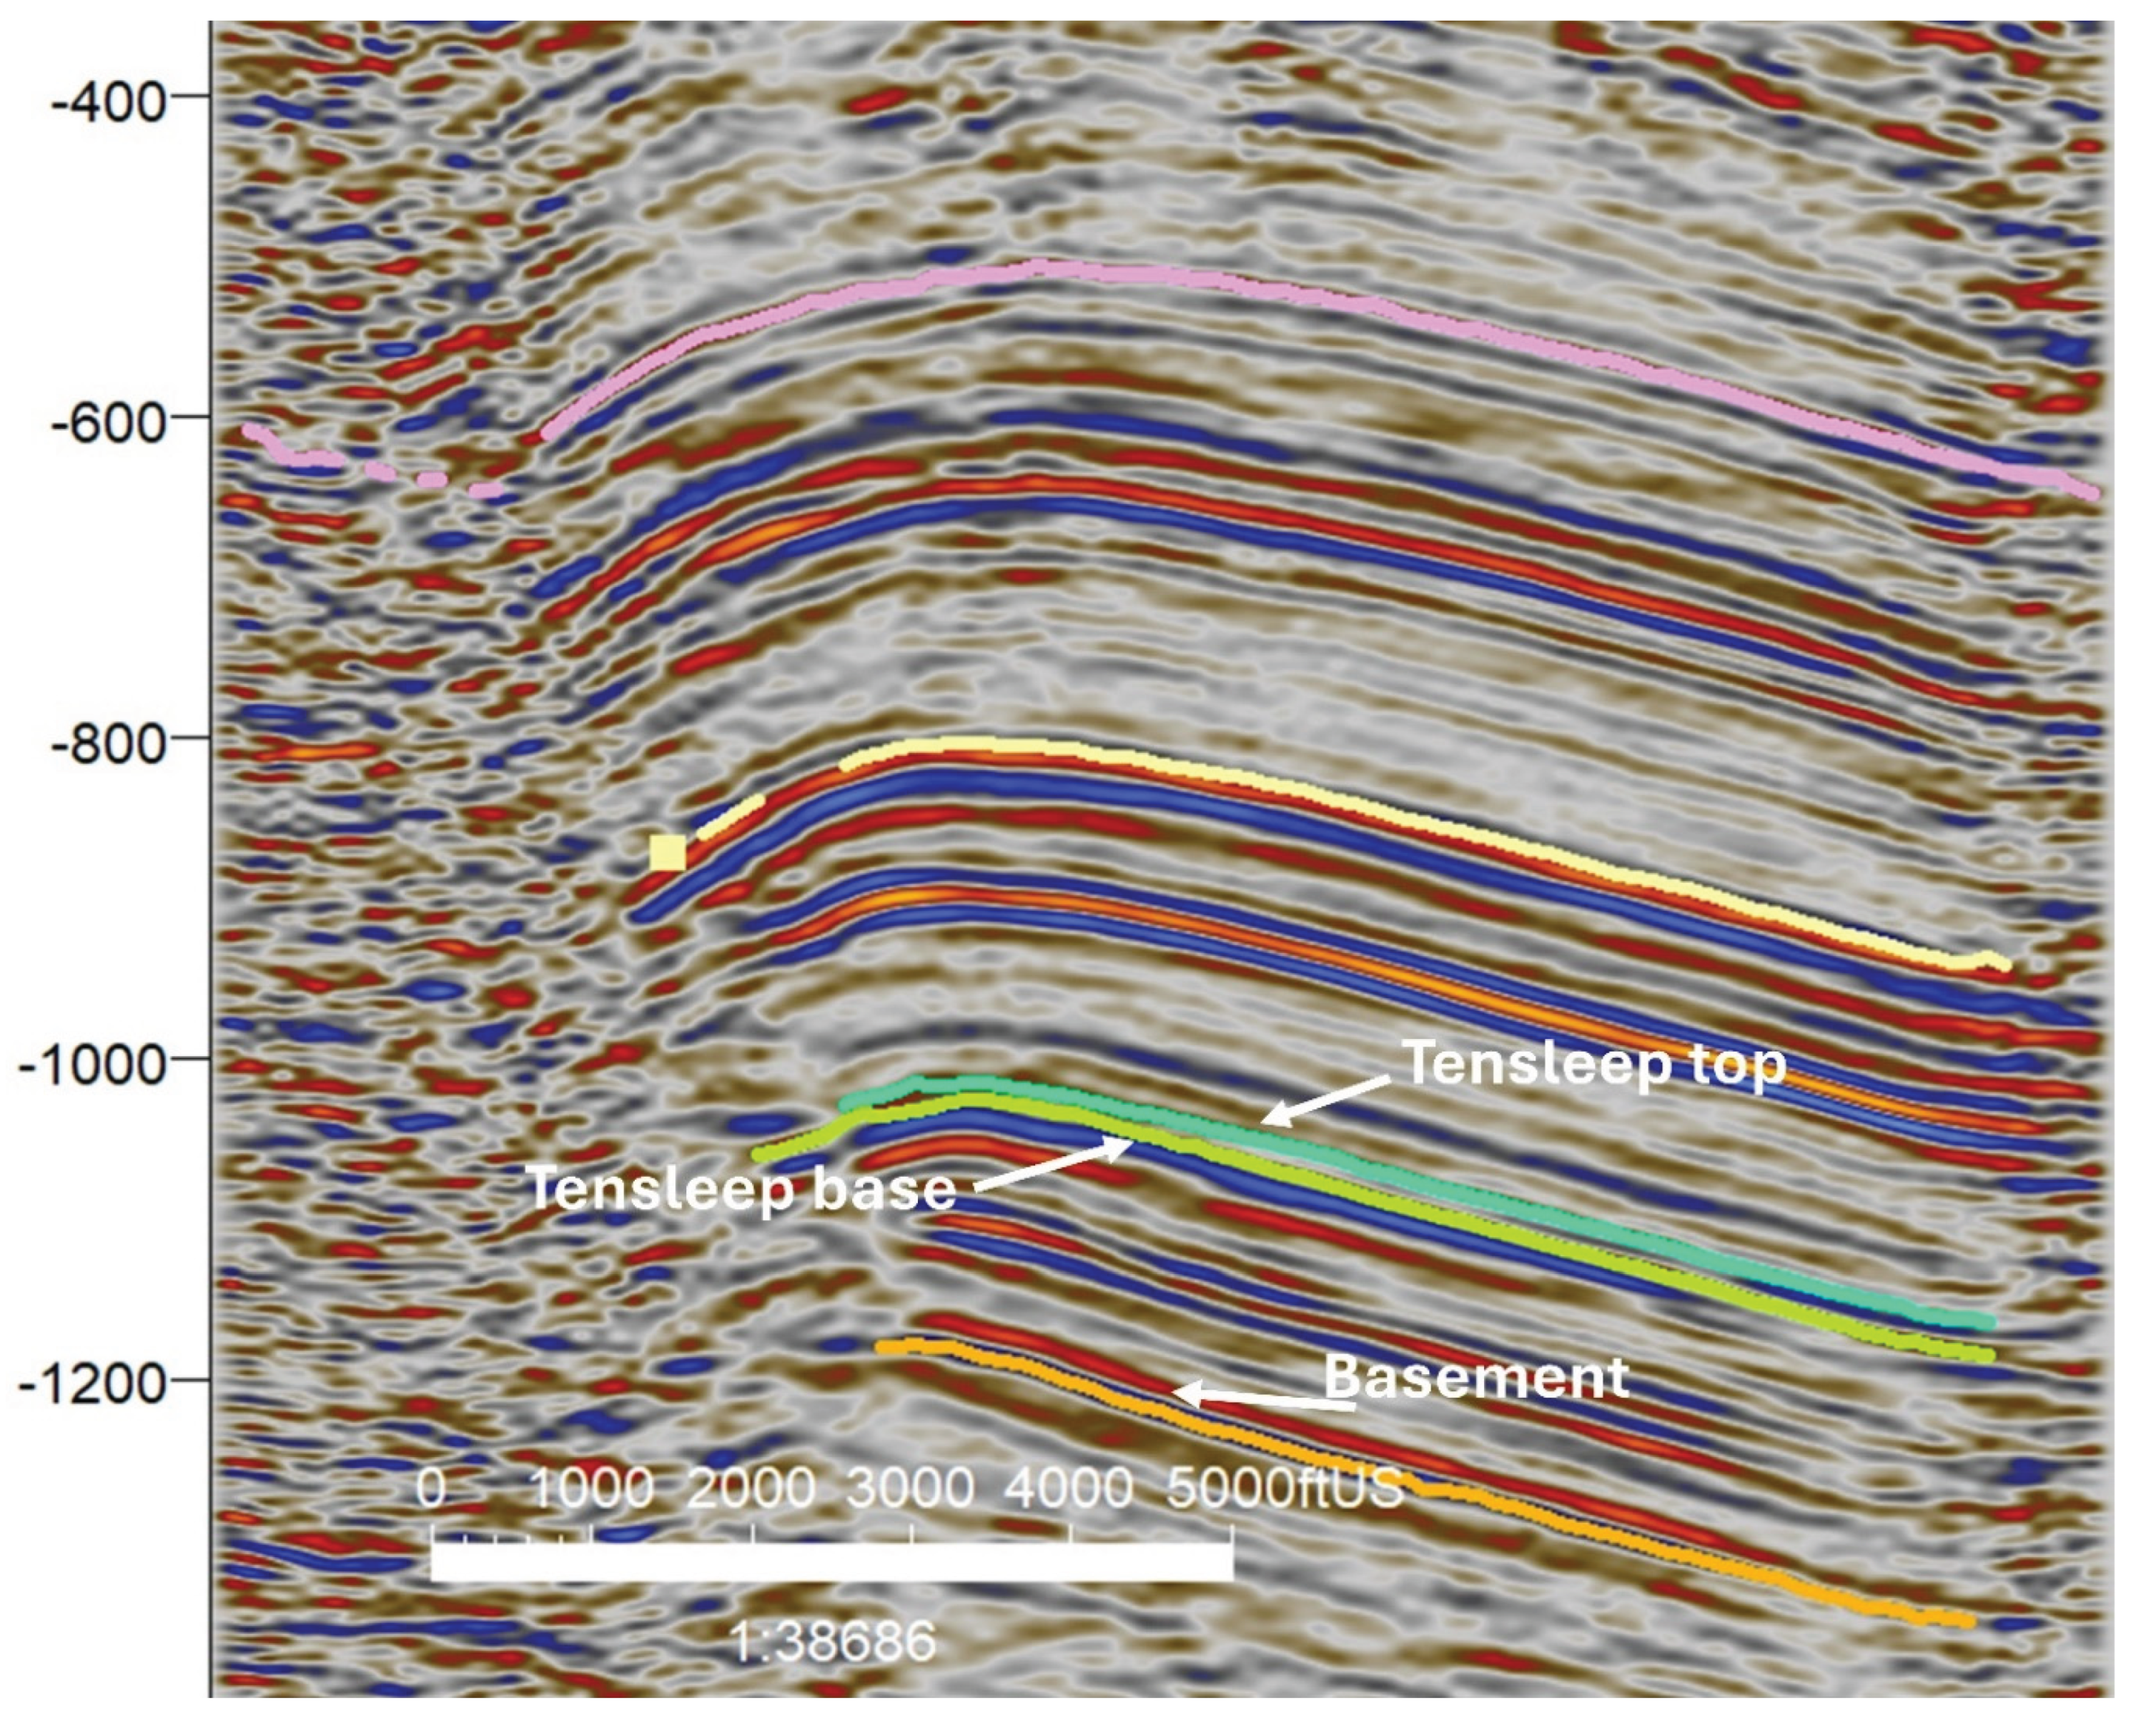
Figure 5.
Well Location Map of the Teapot Dome Field: Spatial distribution of key wells (48-X-28, 71-1-X-4, 67-1-TPX-10, and 25-1-X-14) overlaid on seismic time slice at the Teapot Dome Field.
Figure 5.
Well Location Map of the Teapot Dome Field: Spatial distribution of key wells (48-X-28, 71-1-X-4, 67-1-TPX-10, and 25-1-X-14) overlaid on seismic time slice at the Teapot Dome Field.
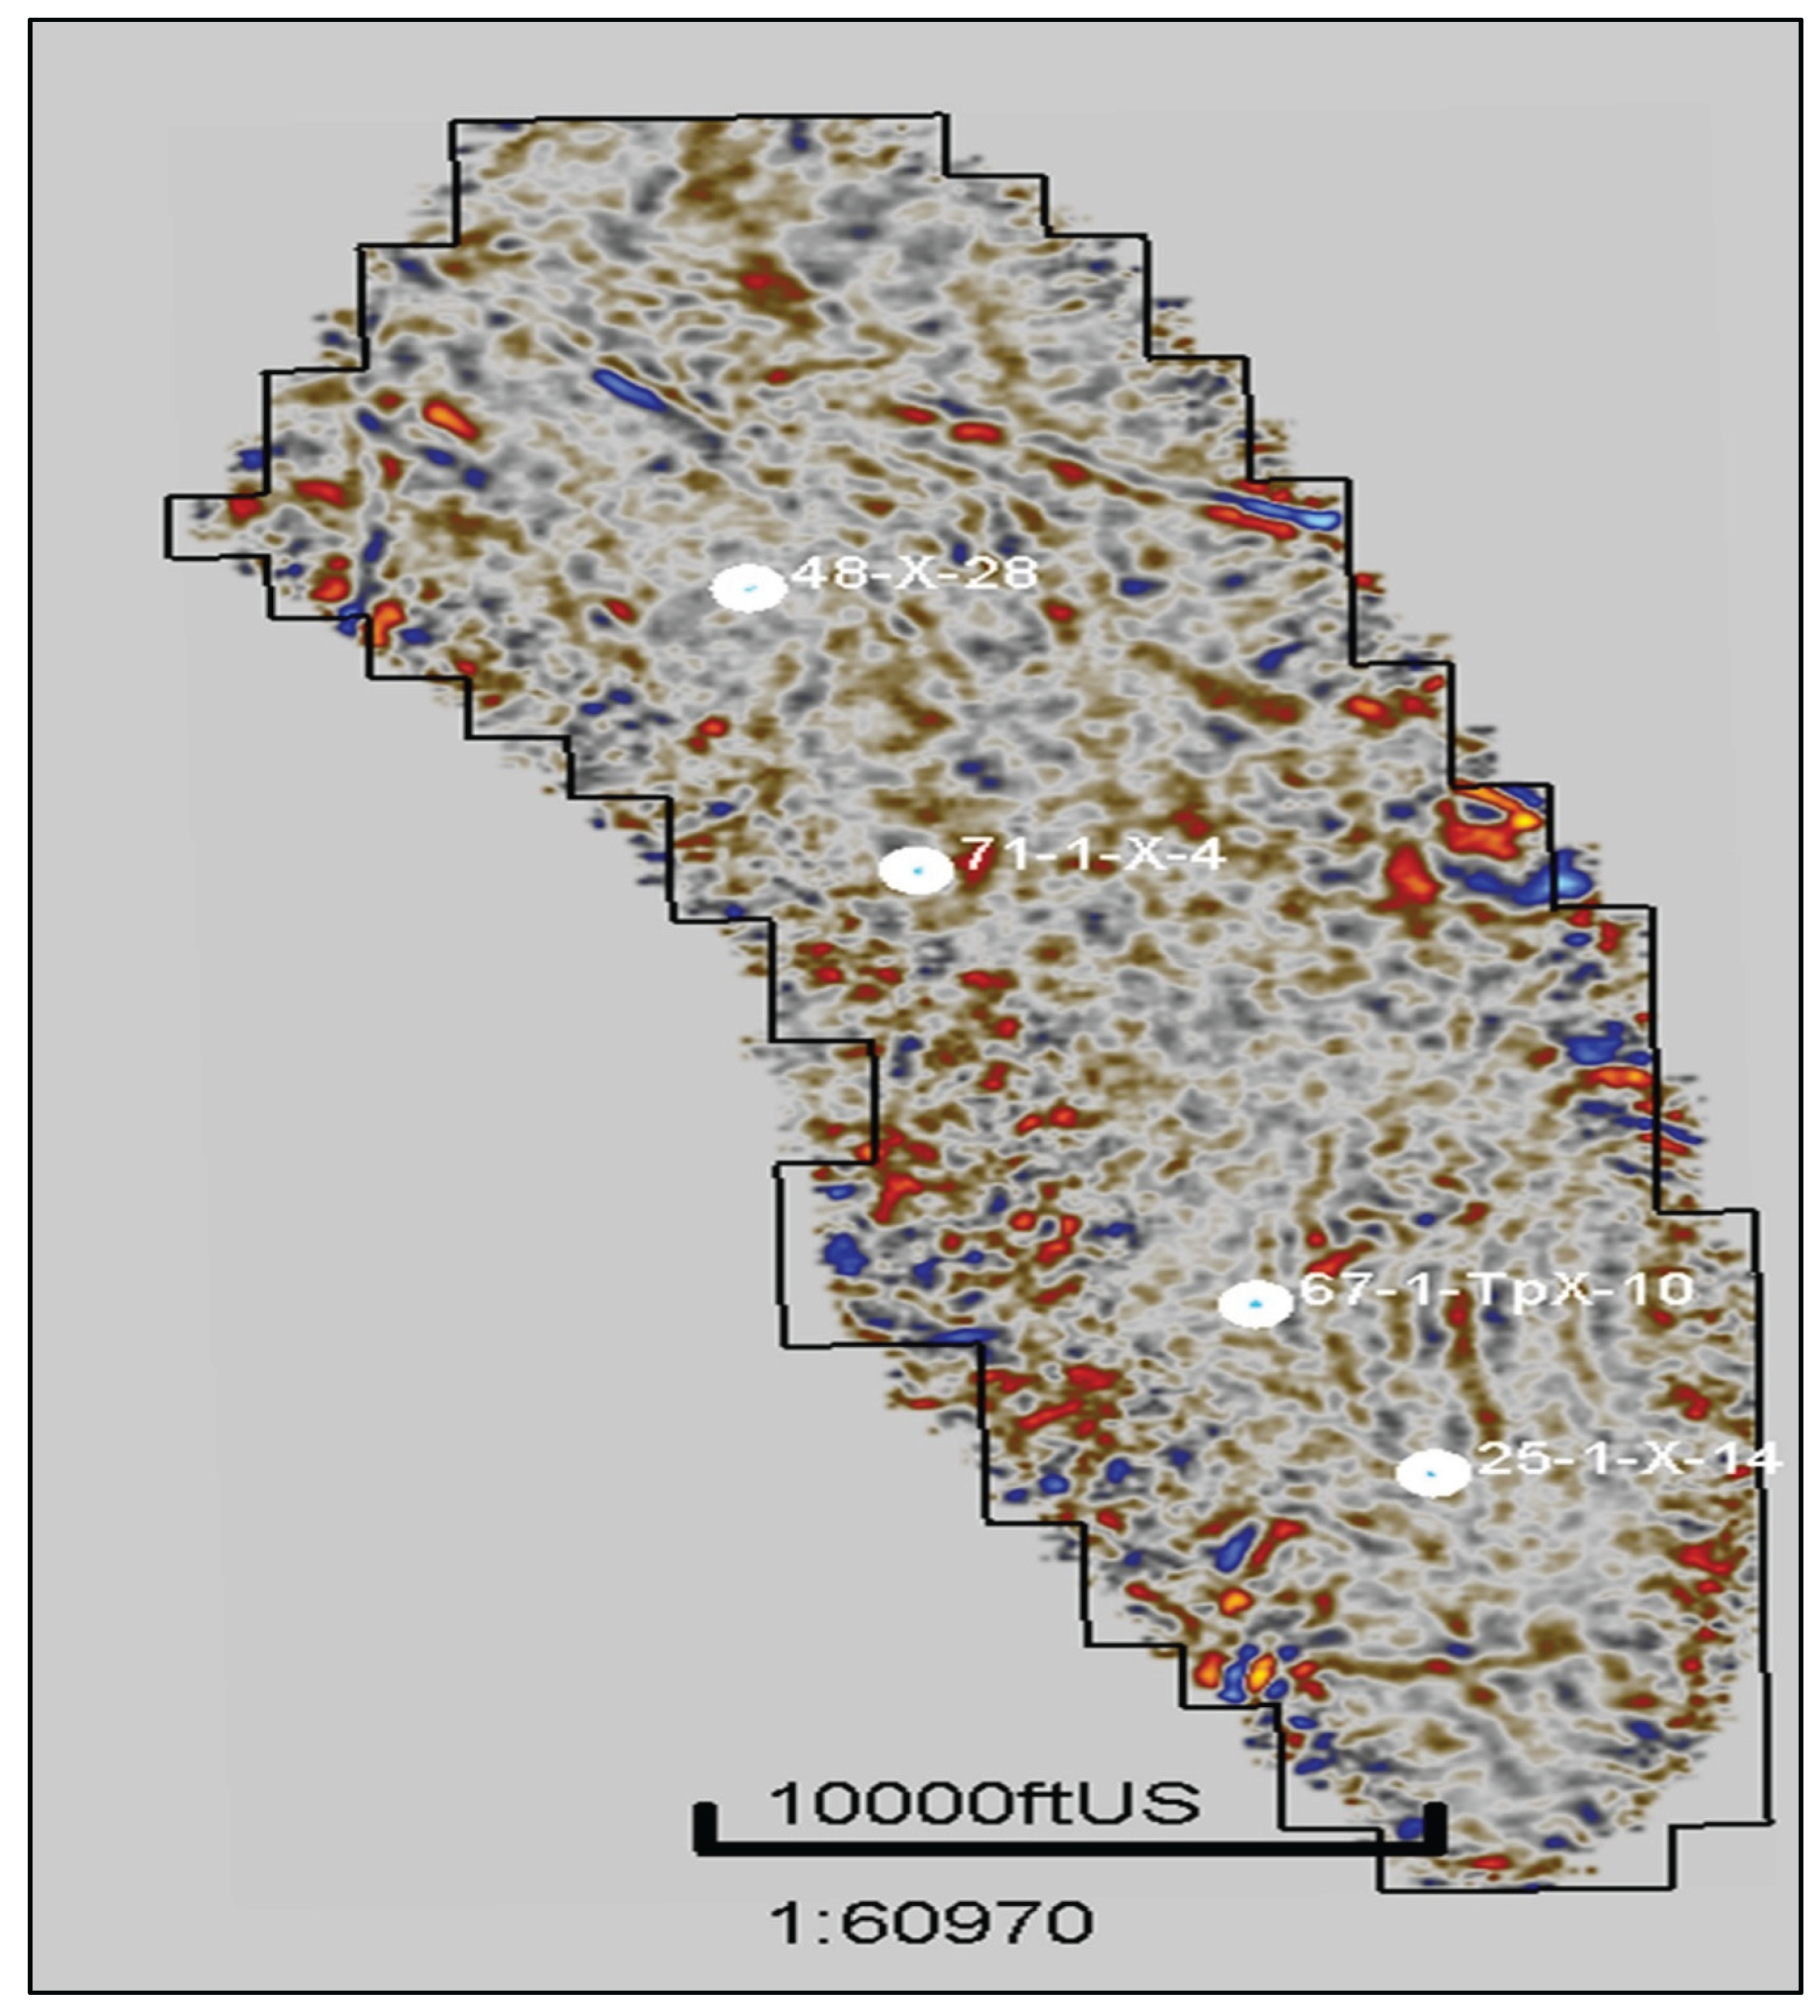
Figure 6.
(a) Velocity points; (b) model skeleton; (c) interpreted horizons; (d) final velocity model used for time-to-depth conversion.
Figure 6.
(a) Velocity points; (b) model skeleton; (c) interpreted horizons; (d) final velocity model used for time-to-depth conversion.
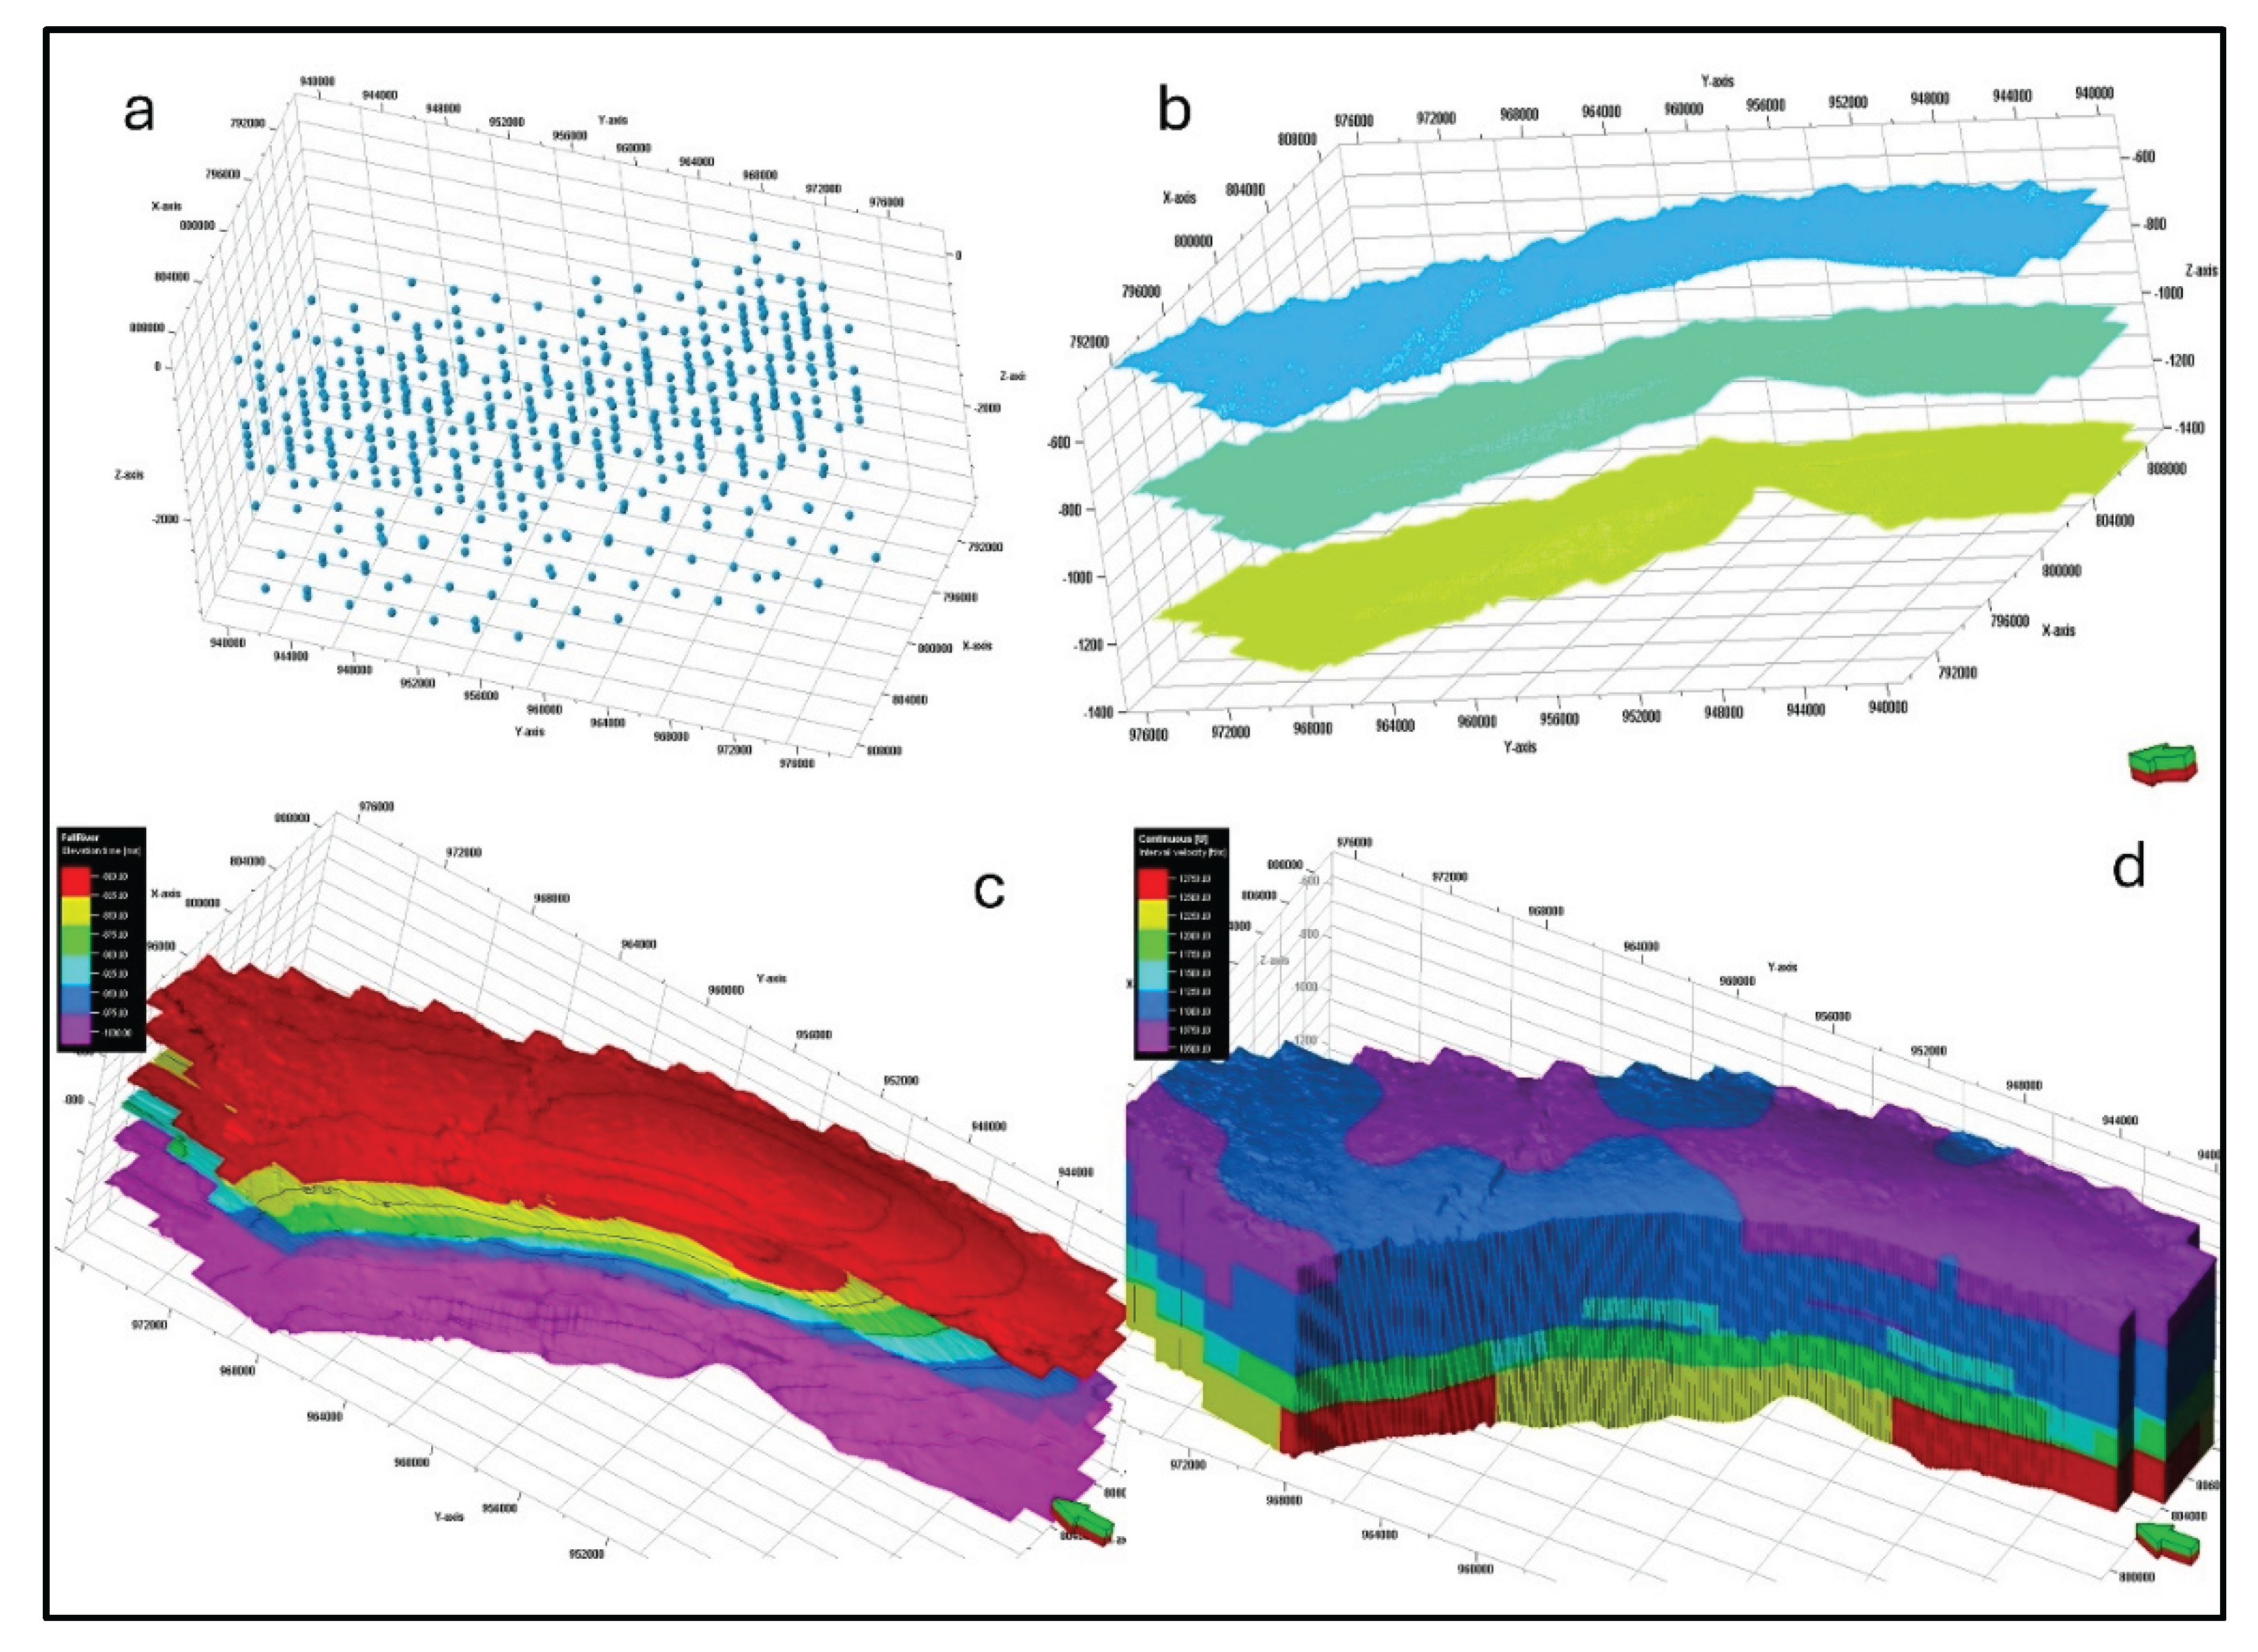
Figure 7.
3D Structural Model of the Teapot Dome Field: Visual representation of segmented geological zones and layers.
Figure 7.
3D Structural Model of the Teapot Dome Field: Visual representation of segmented geological zones and layers.
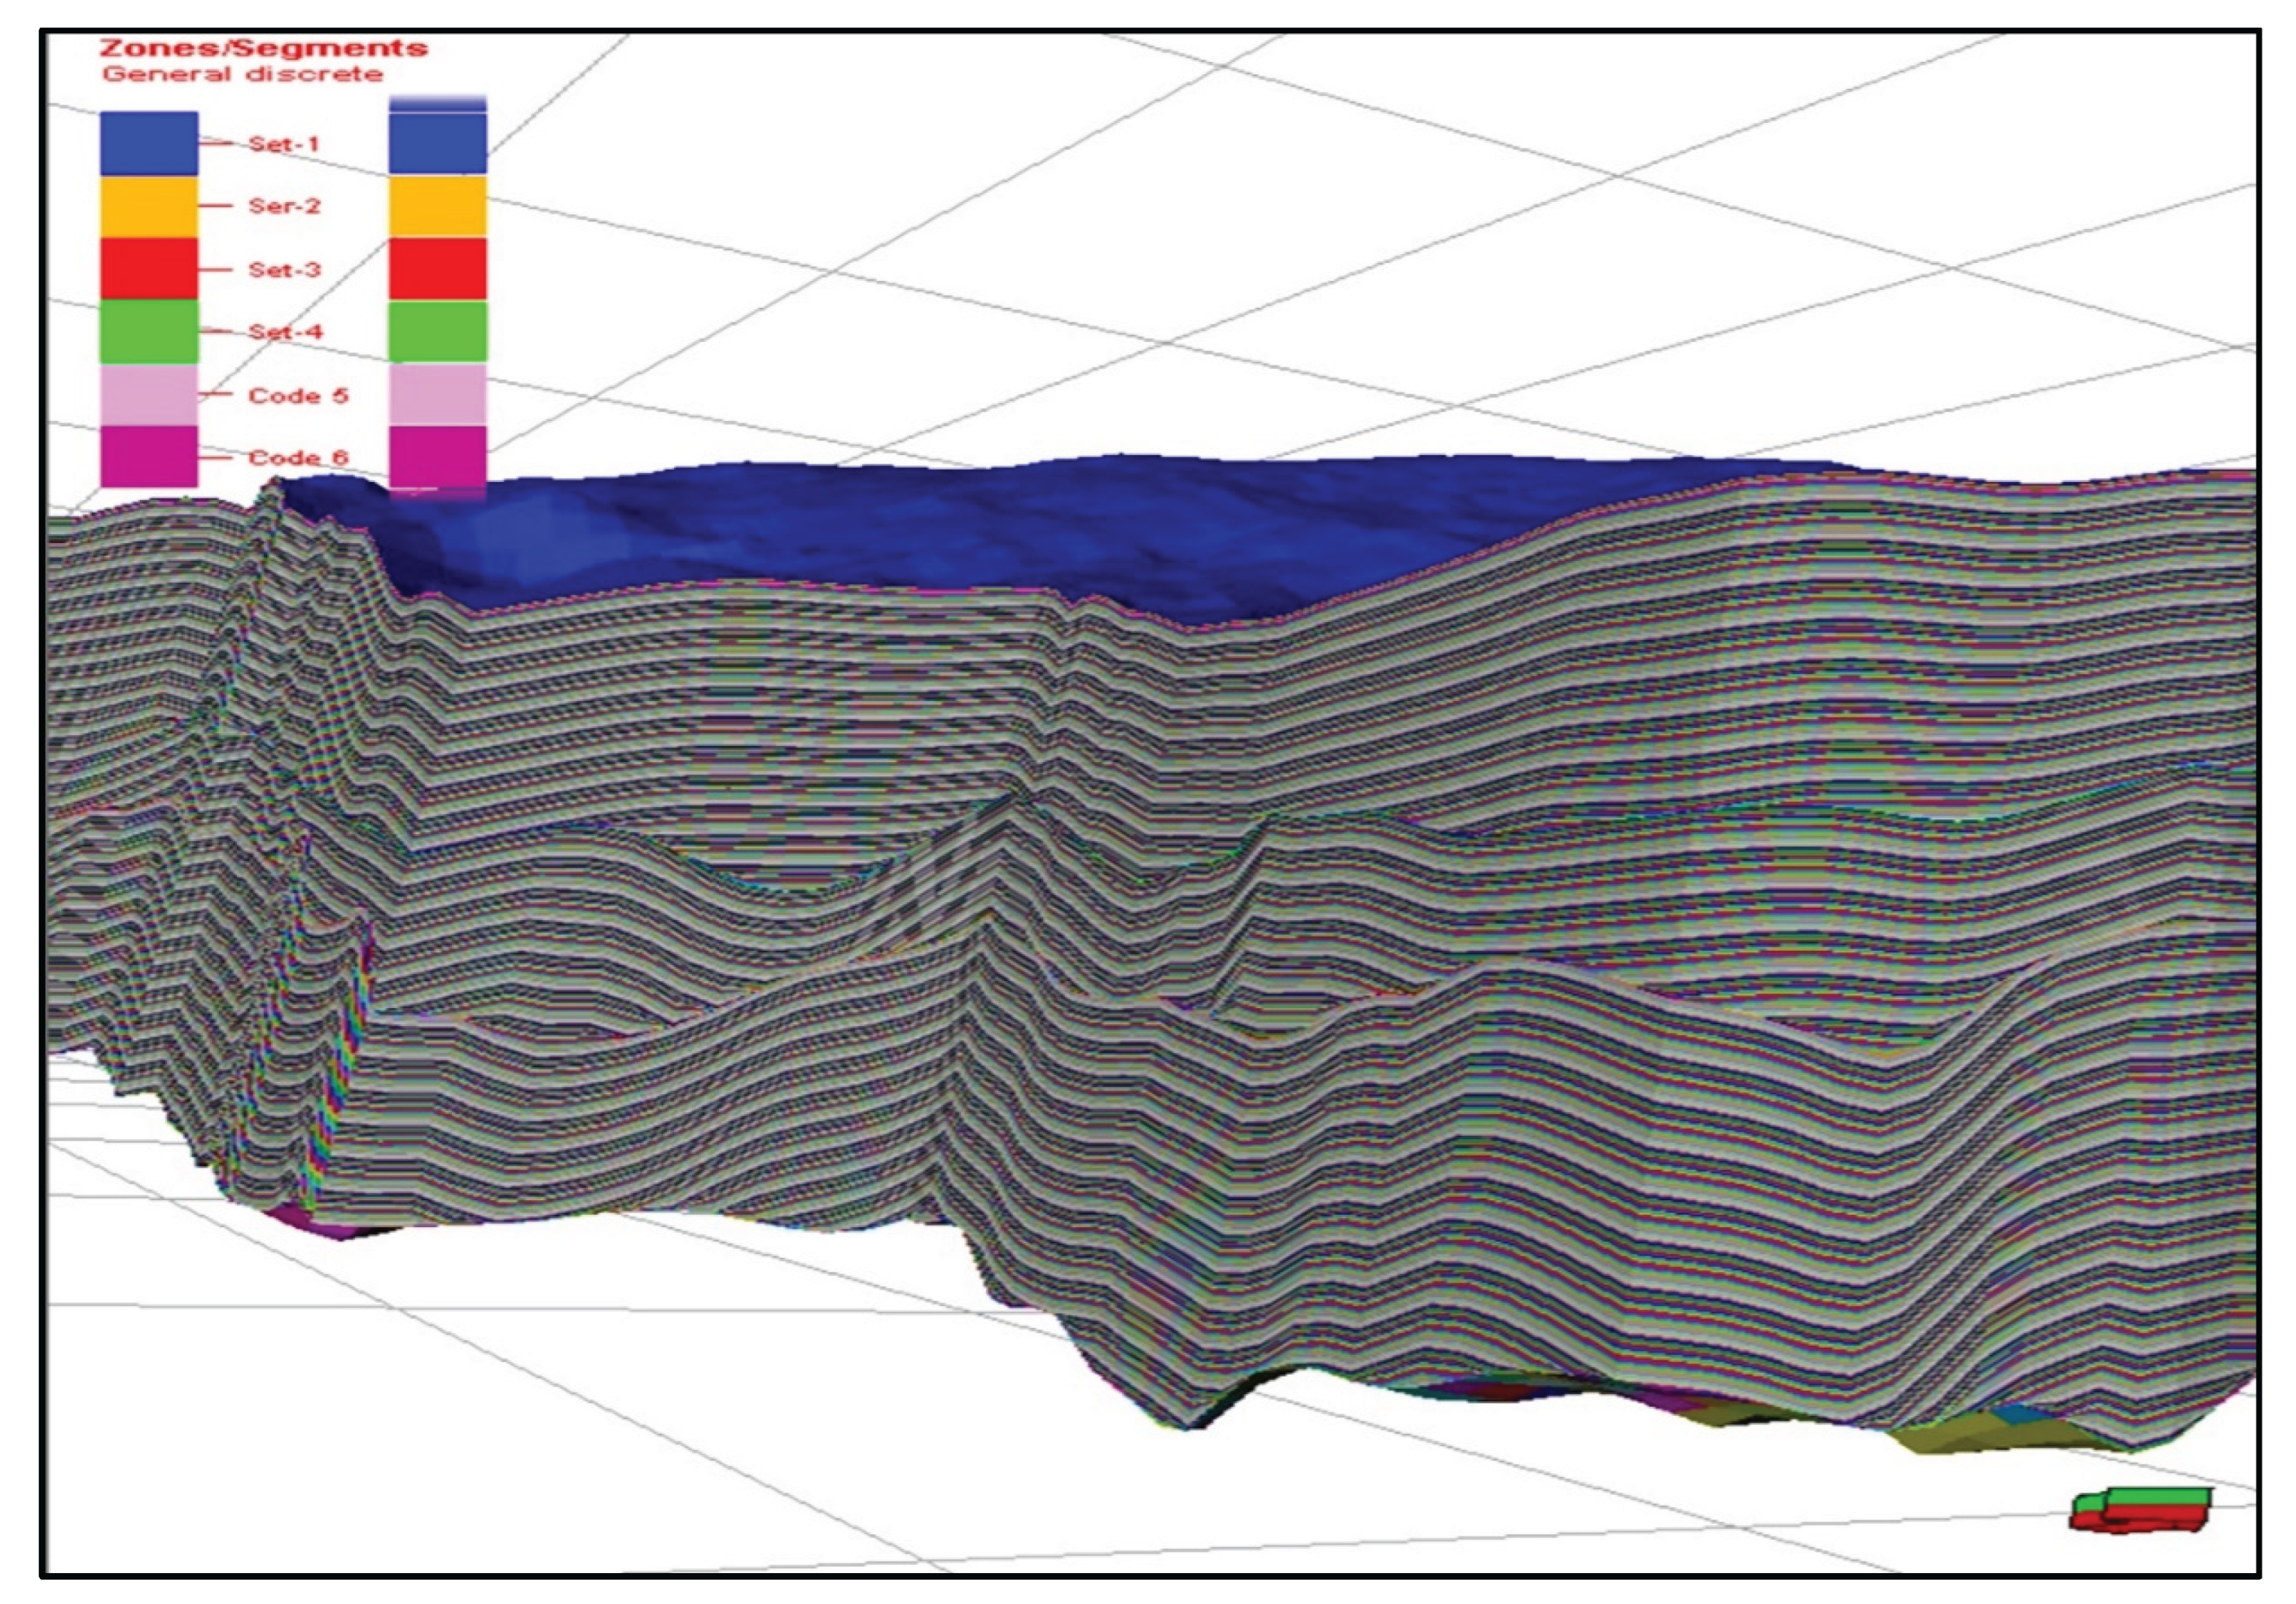
Figure 8.
Seismic 3D cross line (X-line 94) with interpretation of the horizons.
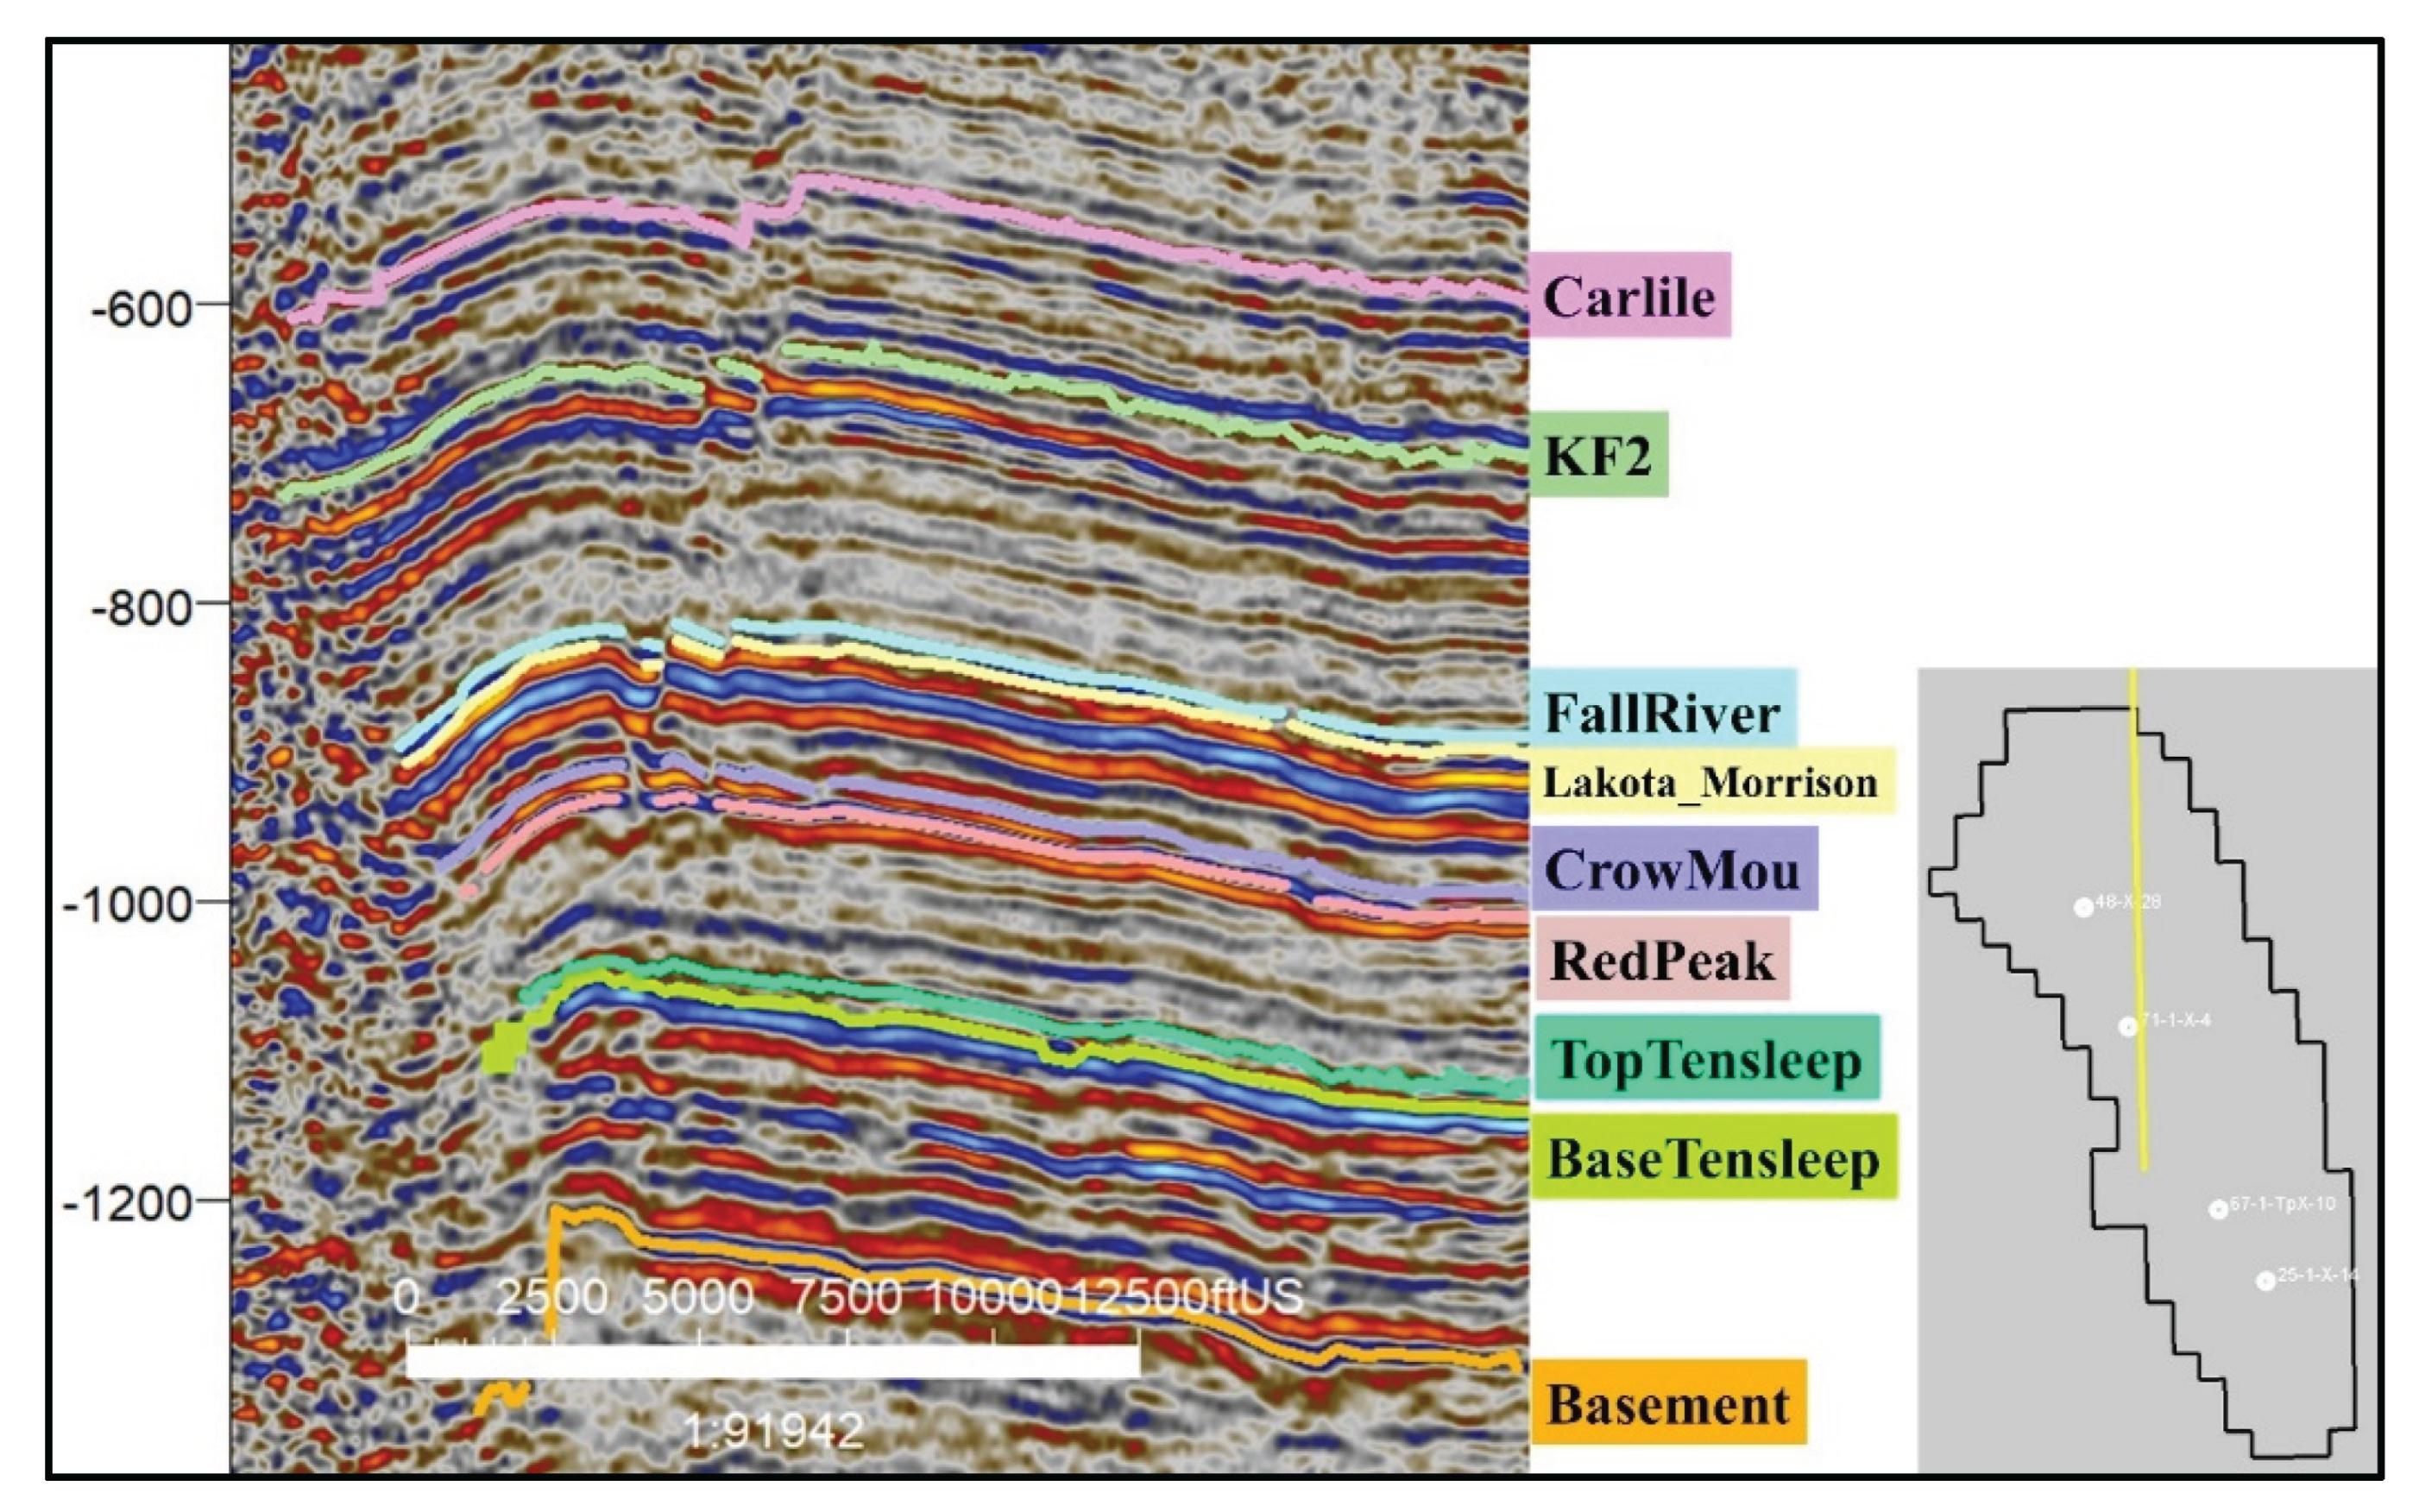
Figure 9.
Fracture Set Distribution Across Wells: Polar plots showing fracture orientation and distribution for individual wells and a combined view of all wells.
Figure 9.
Fracture Set Distribution Across Wells: Polar plots showing fracture orientation and distribution for individual wells and a combined view of all wells.
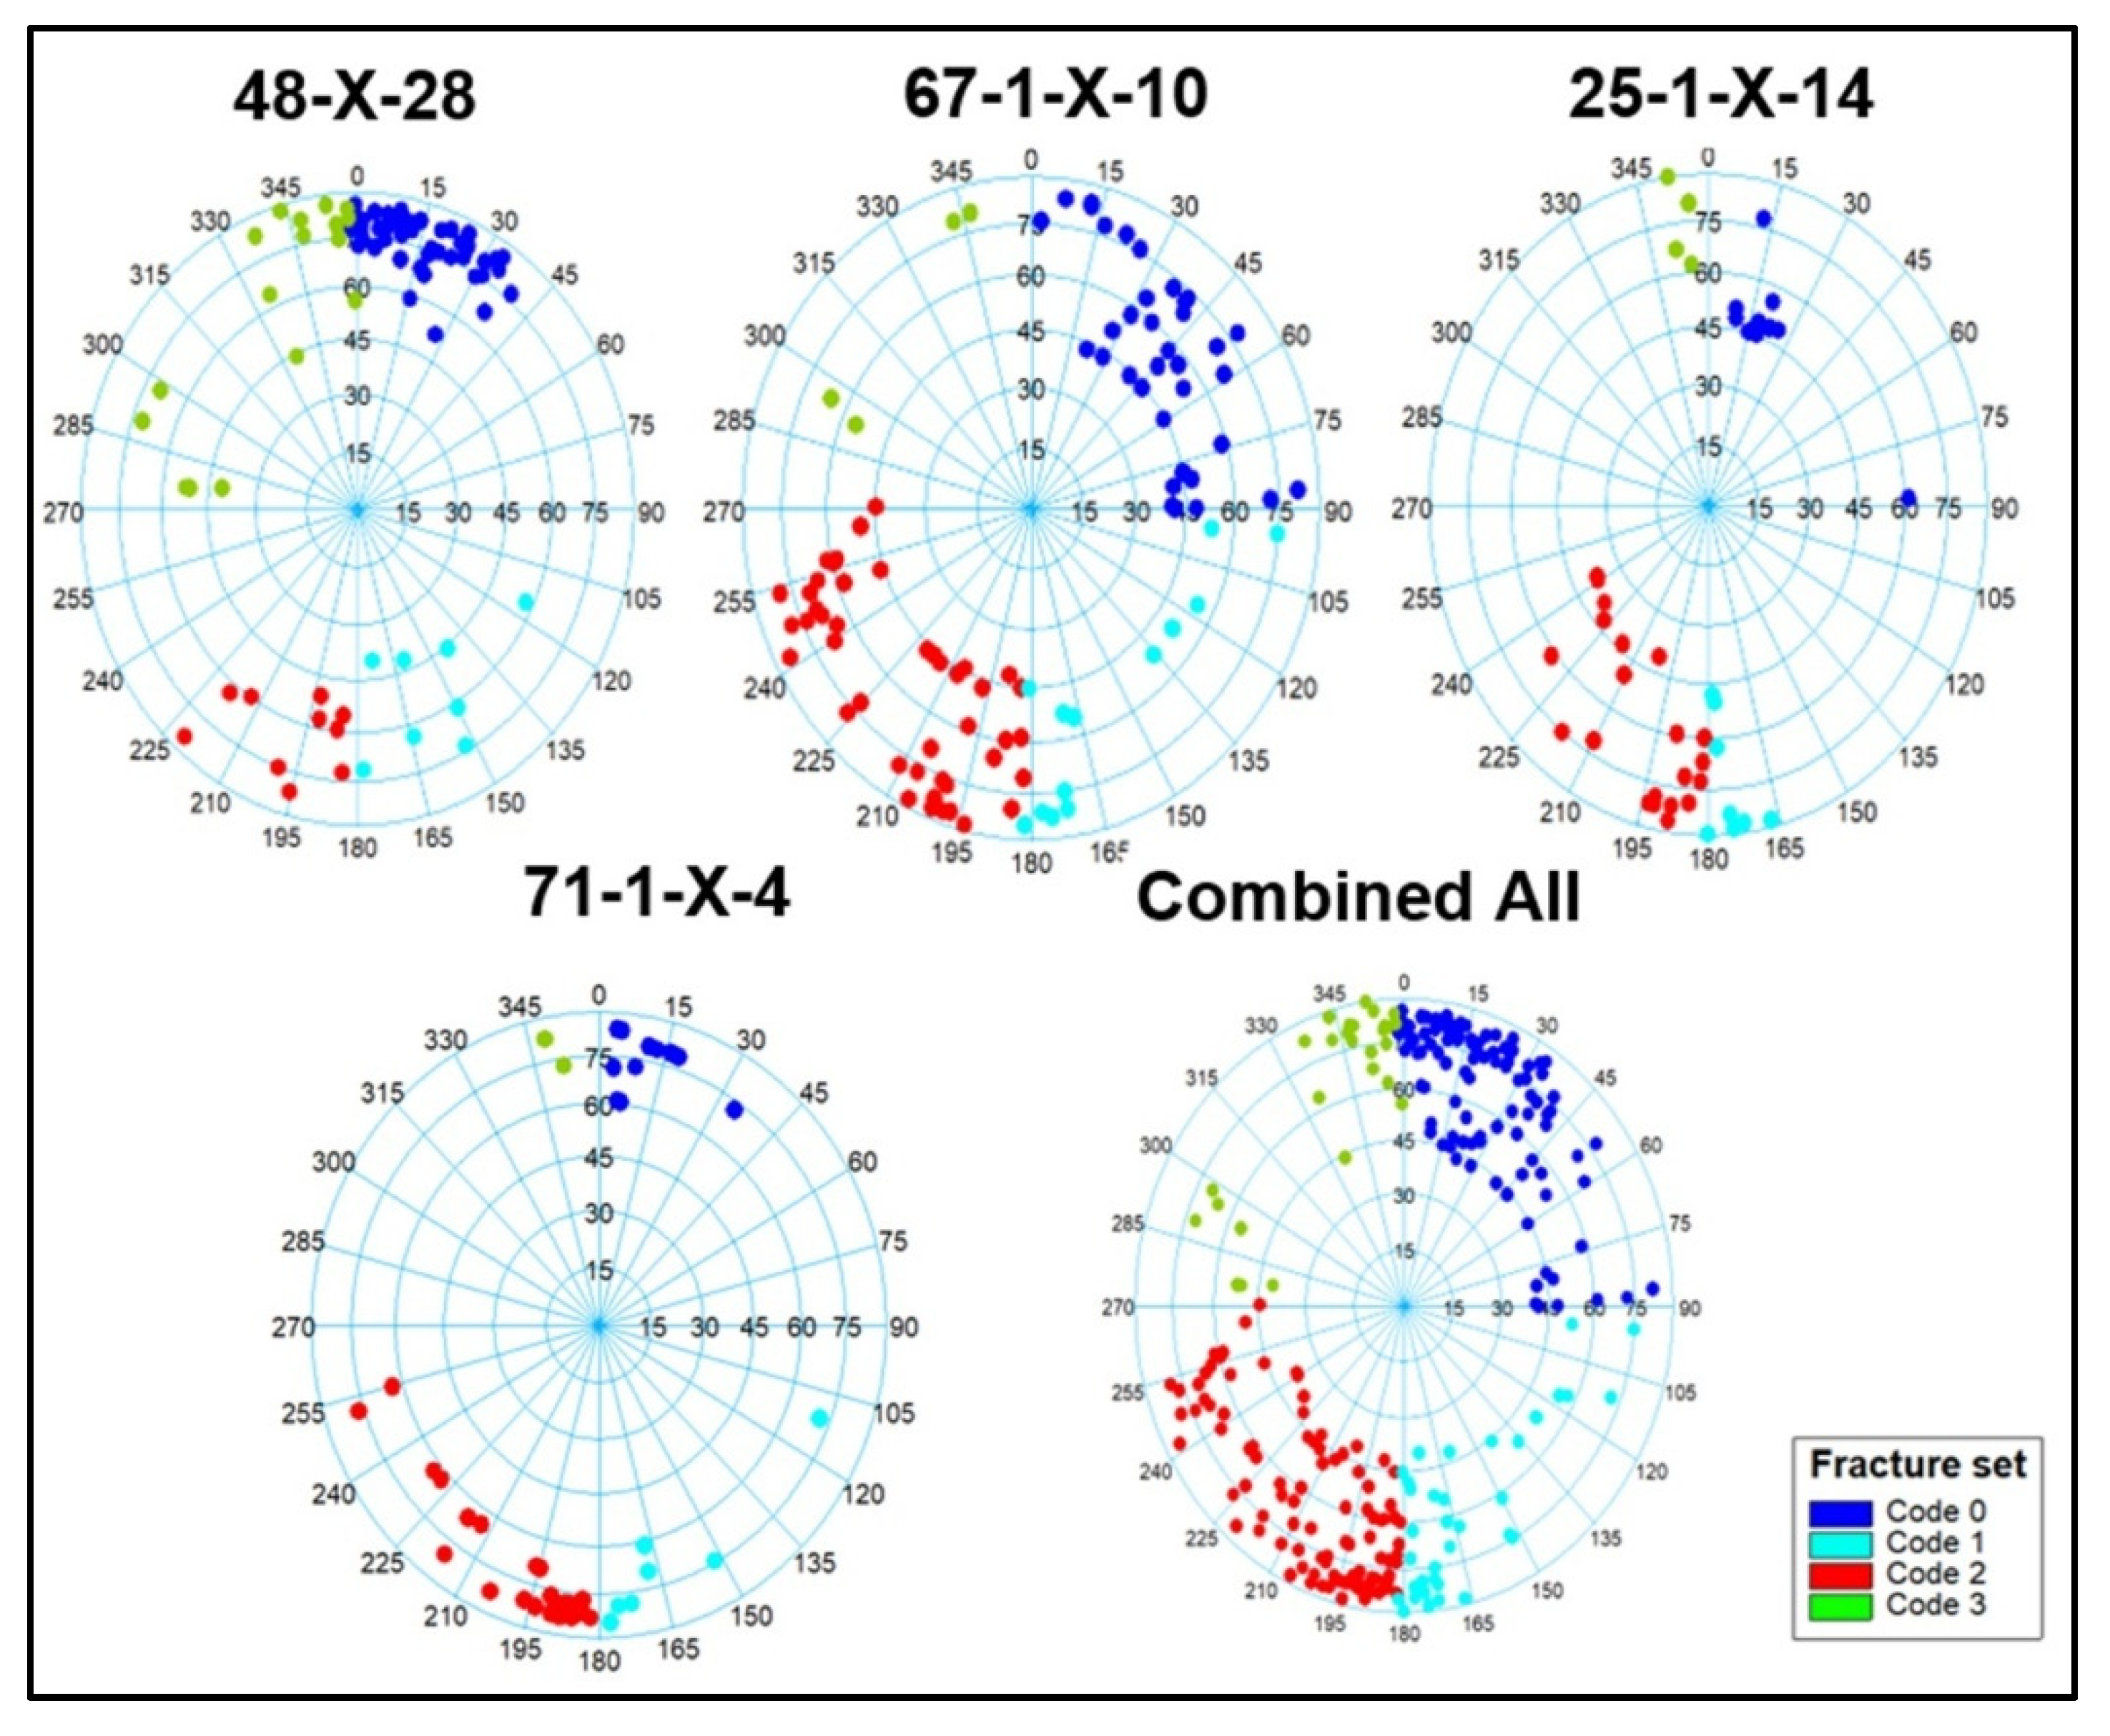
Figure 10.
Artificial Neural Network Architecture for Secondary Porosity Prediction.
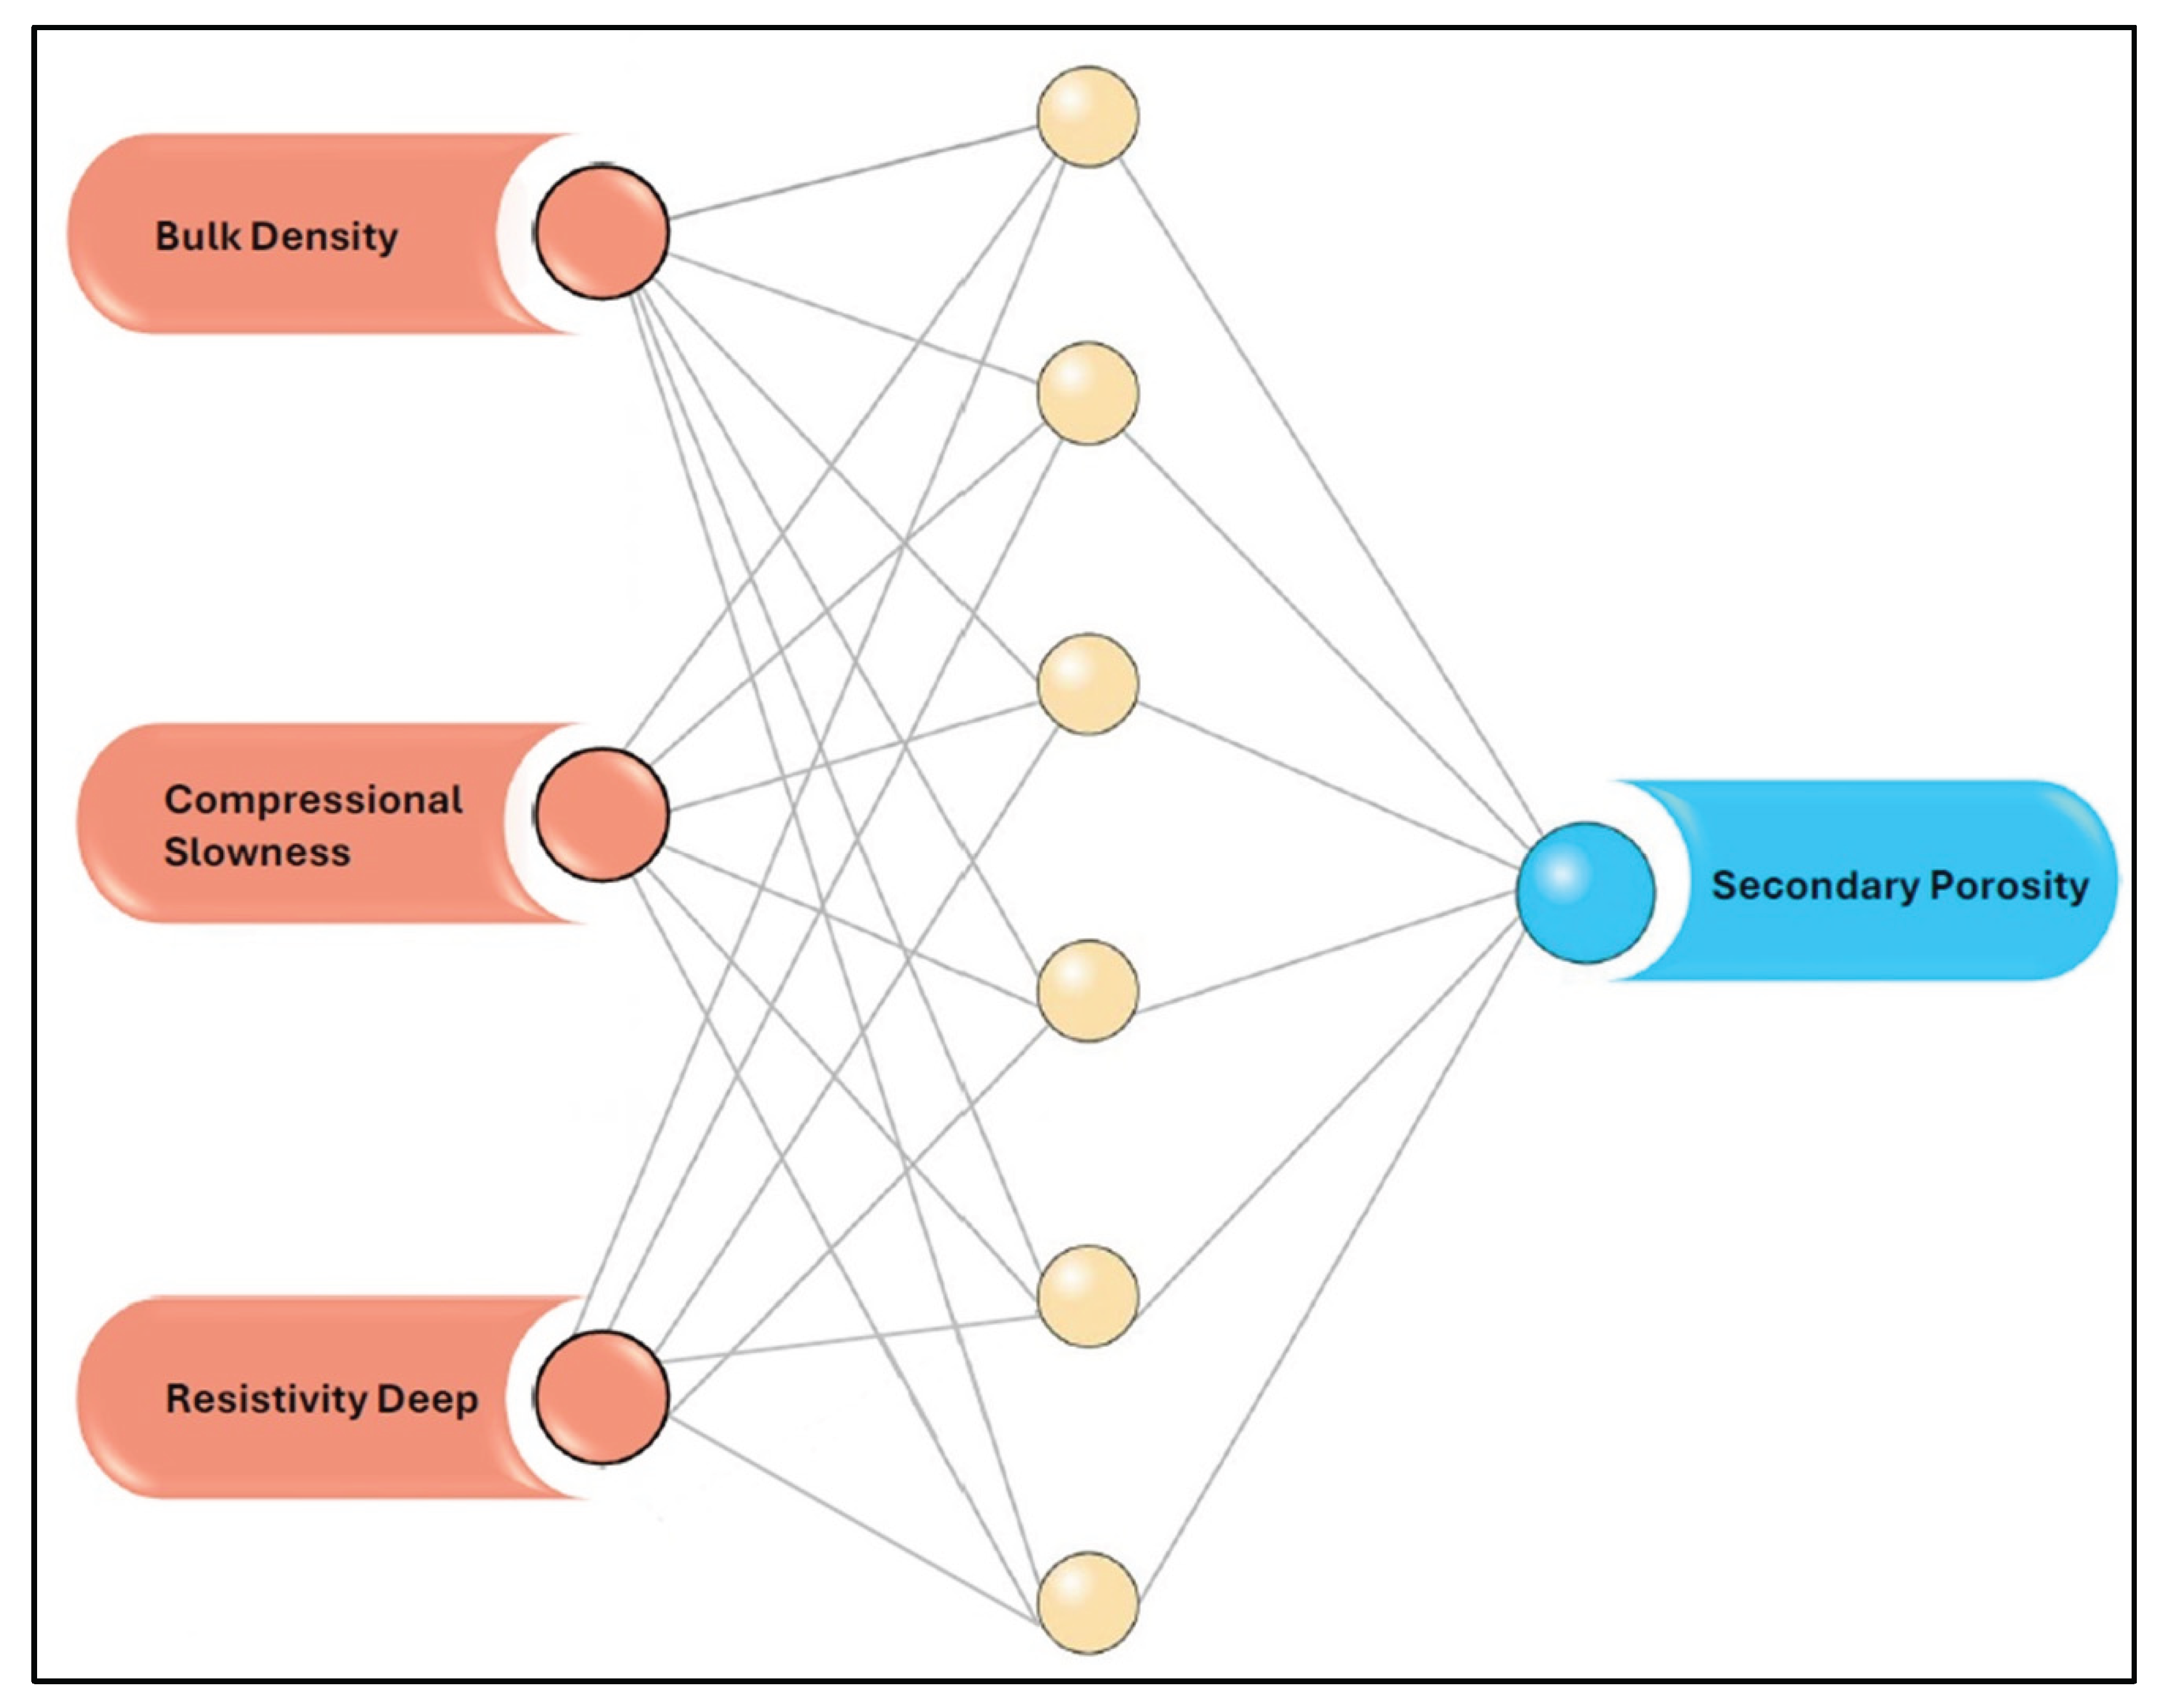
Figure 11.
The estimated secondary porosity log is well matched with the original porosity log in the validation well (67-1-TP-10). The black line in the last track Is the calculated secondary porosity, and the light blue is the predicted from the ANN model.
Figure 11.
The estimated secondary porosity log is well matched with the original porosity log in the validation well (67-1-TP-10). The black line in the last track Is the calculated secondary porosity, and the light blue is the predicted from the ANN model.
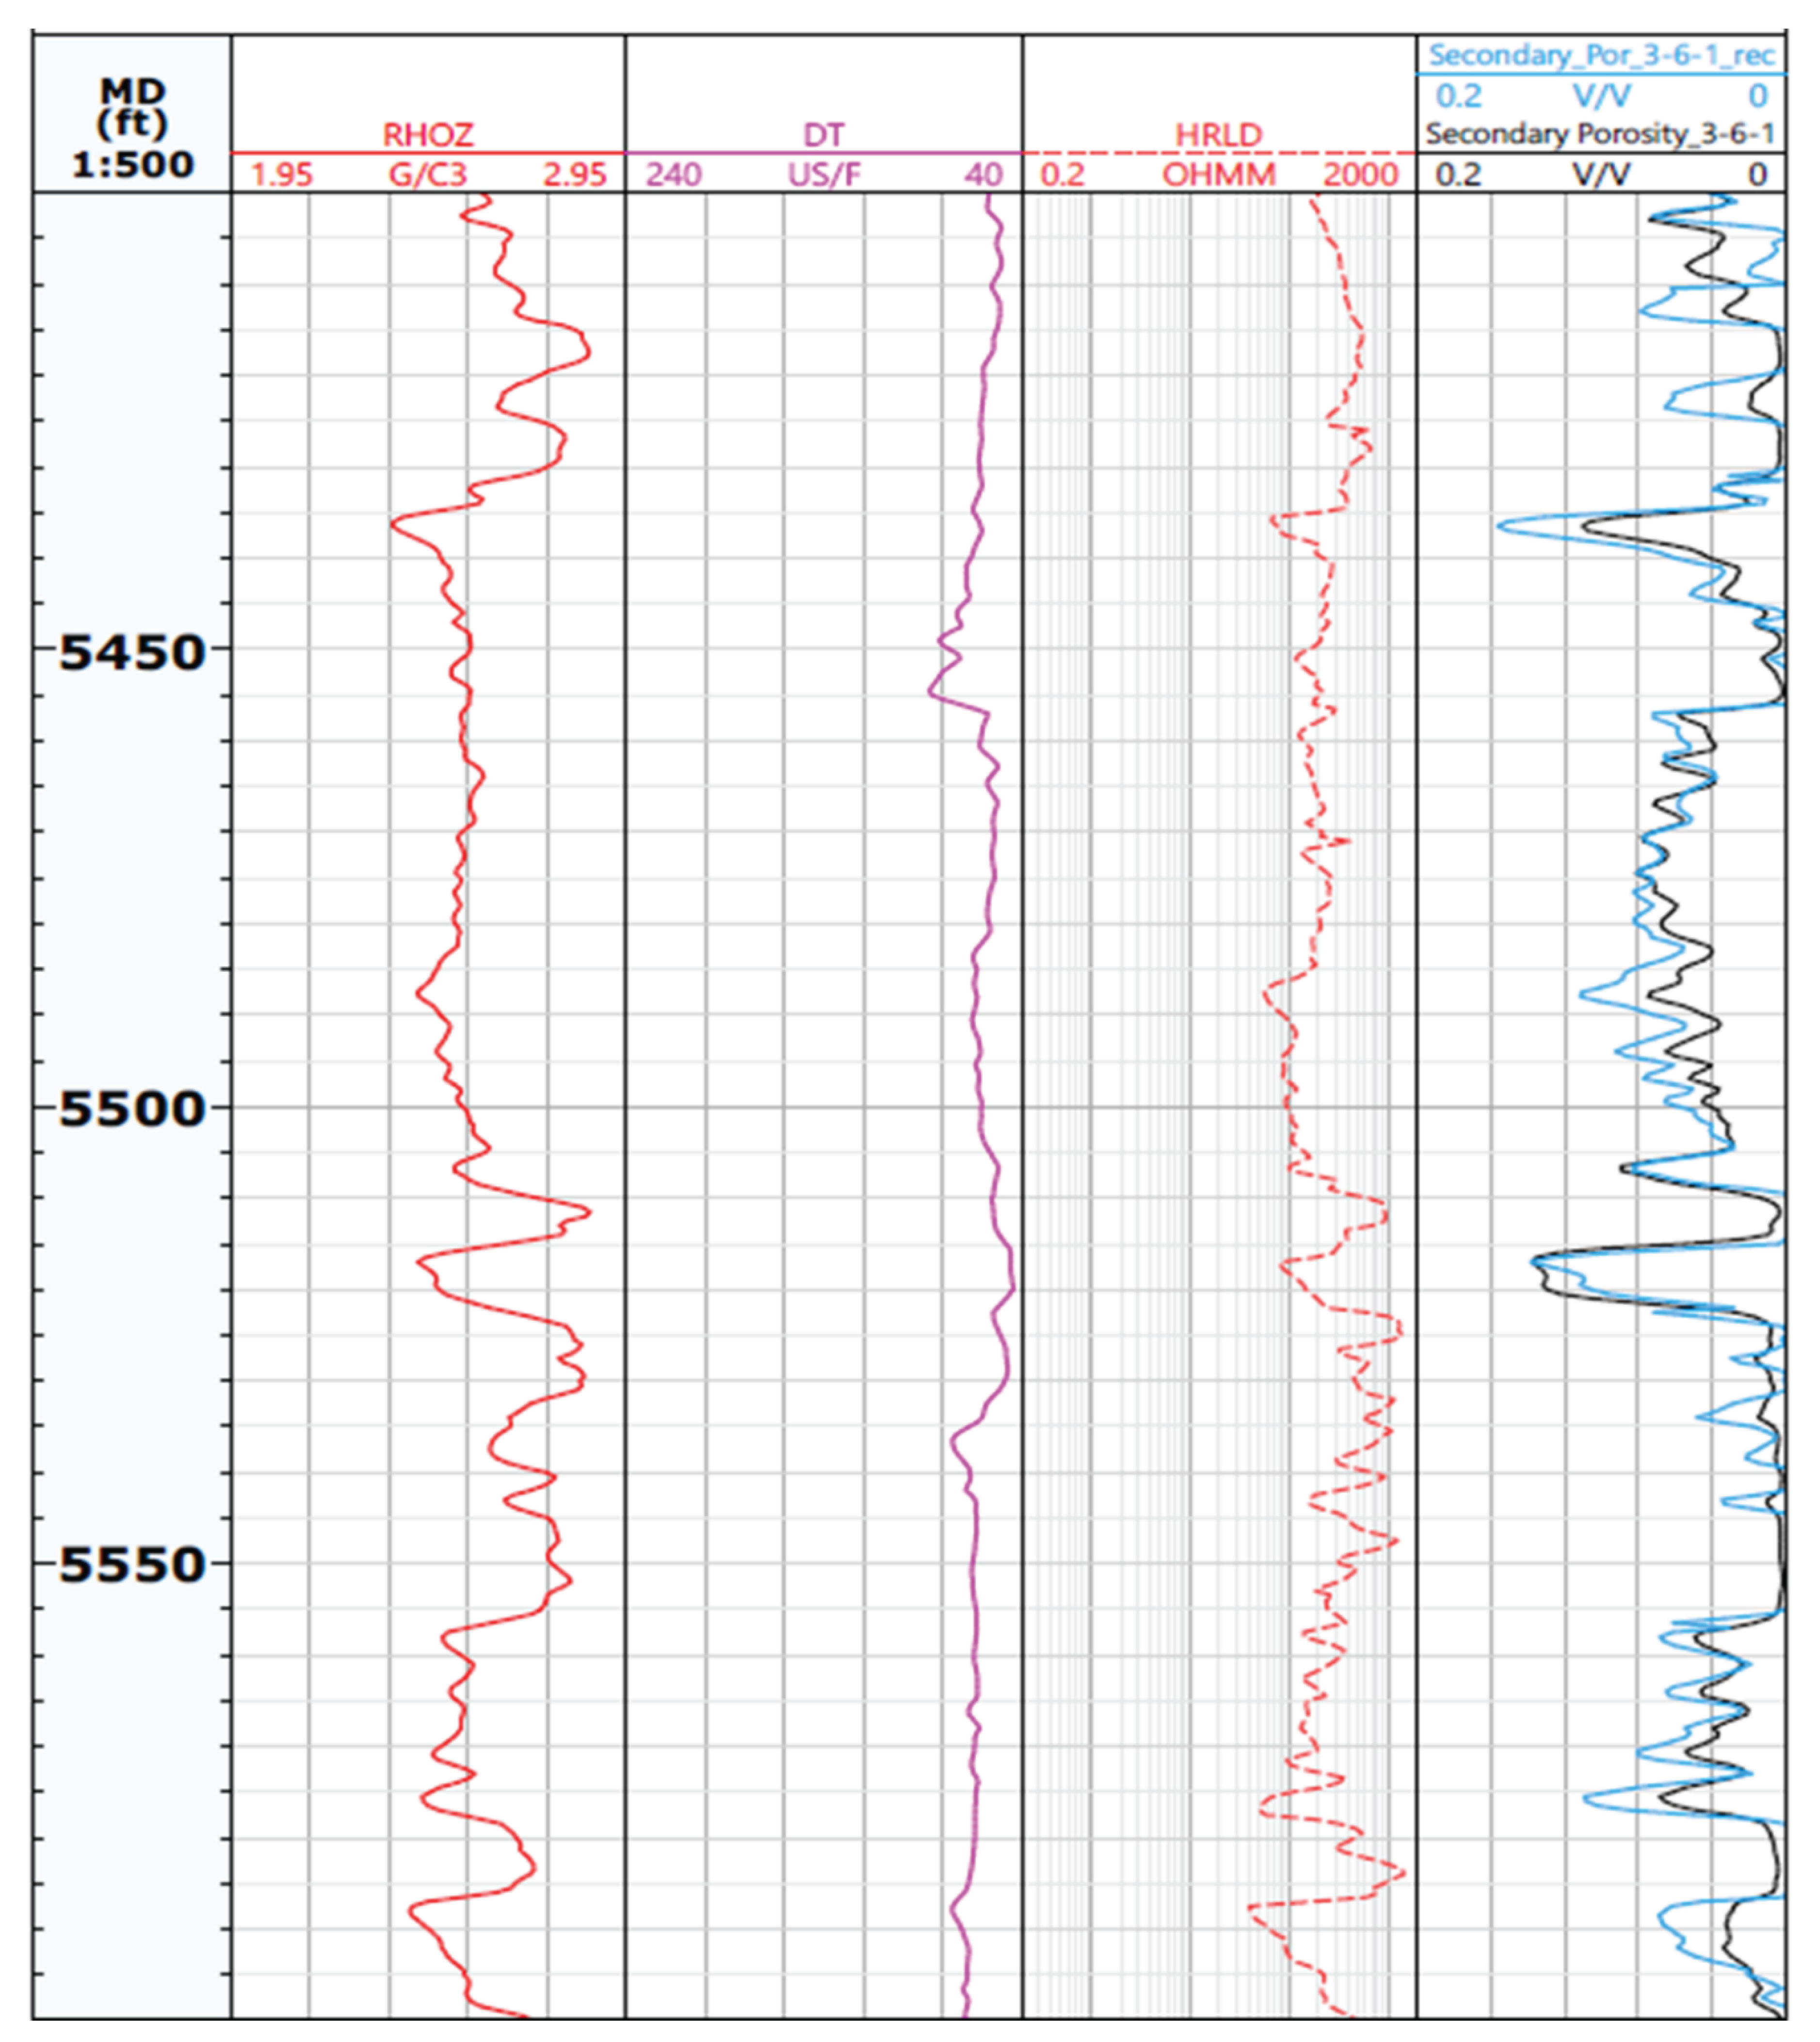
Figure 12.
Artificial Neural Network Architecture for Fracture Density Prediction.
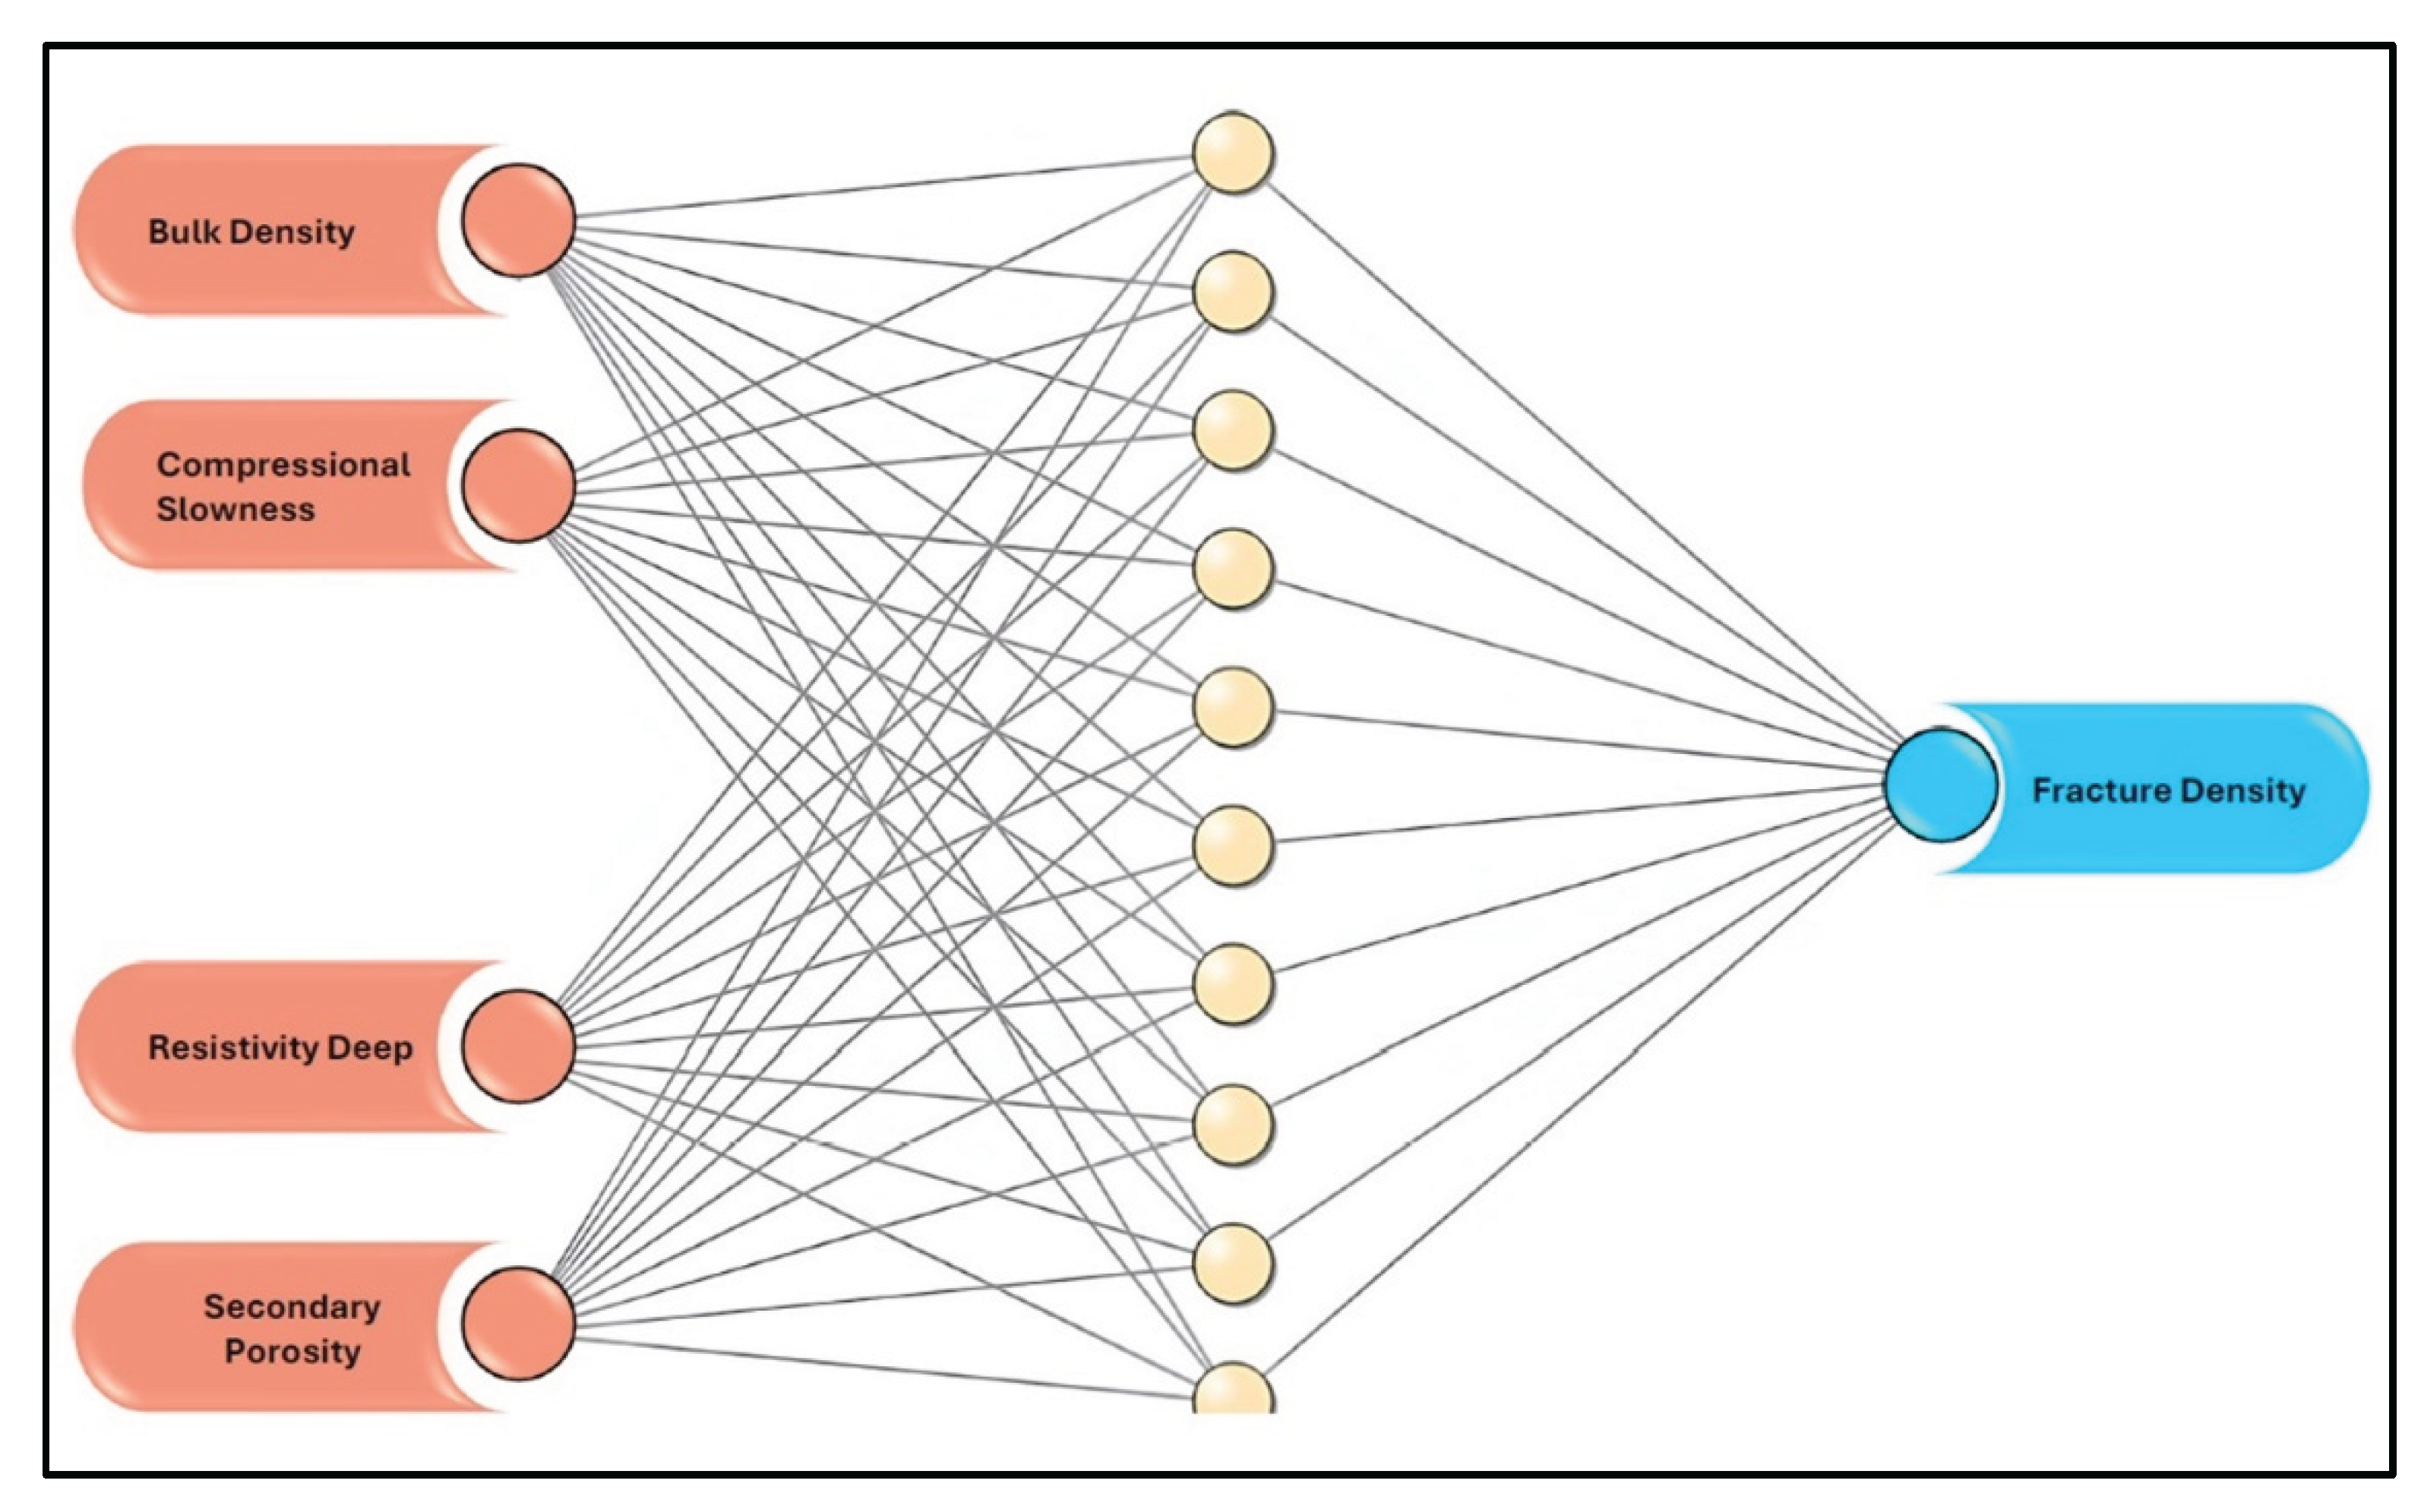
Figure 13.
The estimated fracture density log closely aligns with the original fracture density log in the validation well, denoted as 25-1-X-14. In the final track, the black line represents the computed fracture density, while the light blue line represents the fracture density predicted by the Artificial Neural Network (ANN) model.
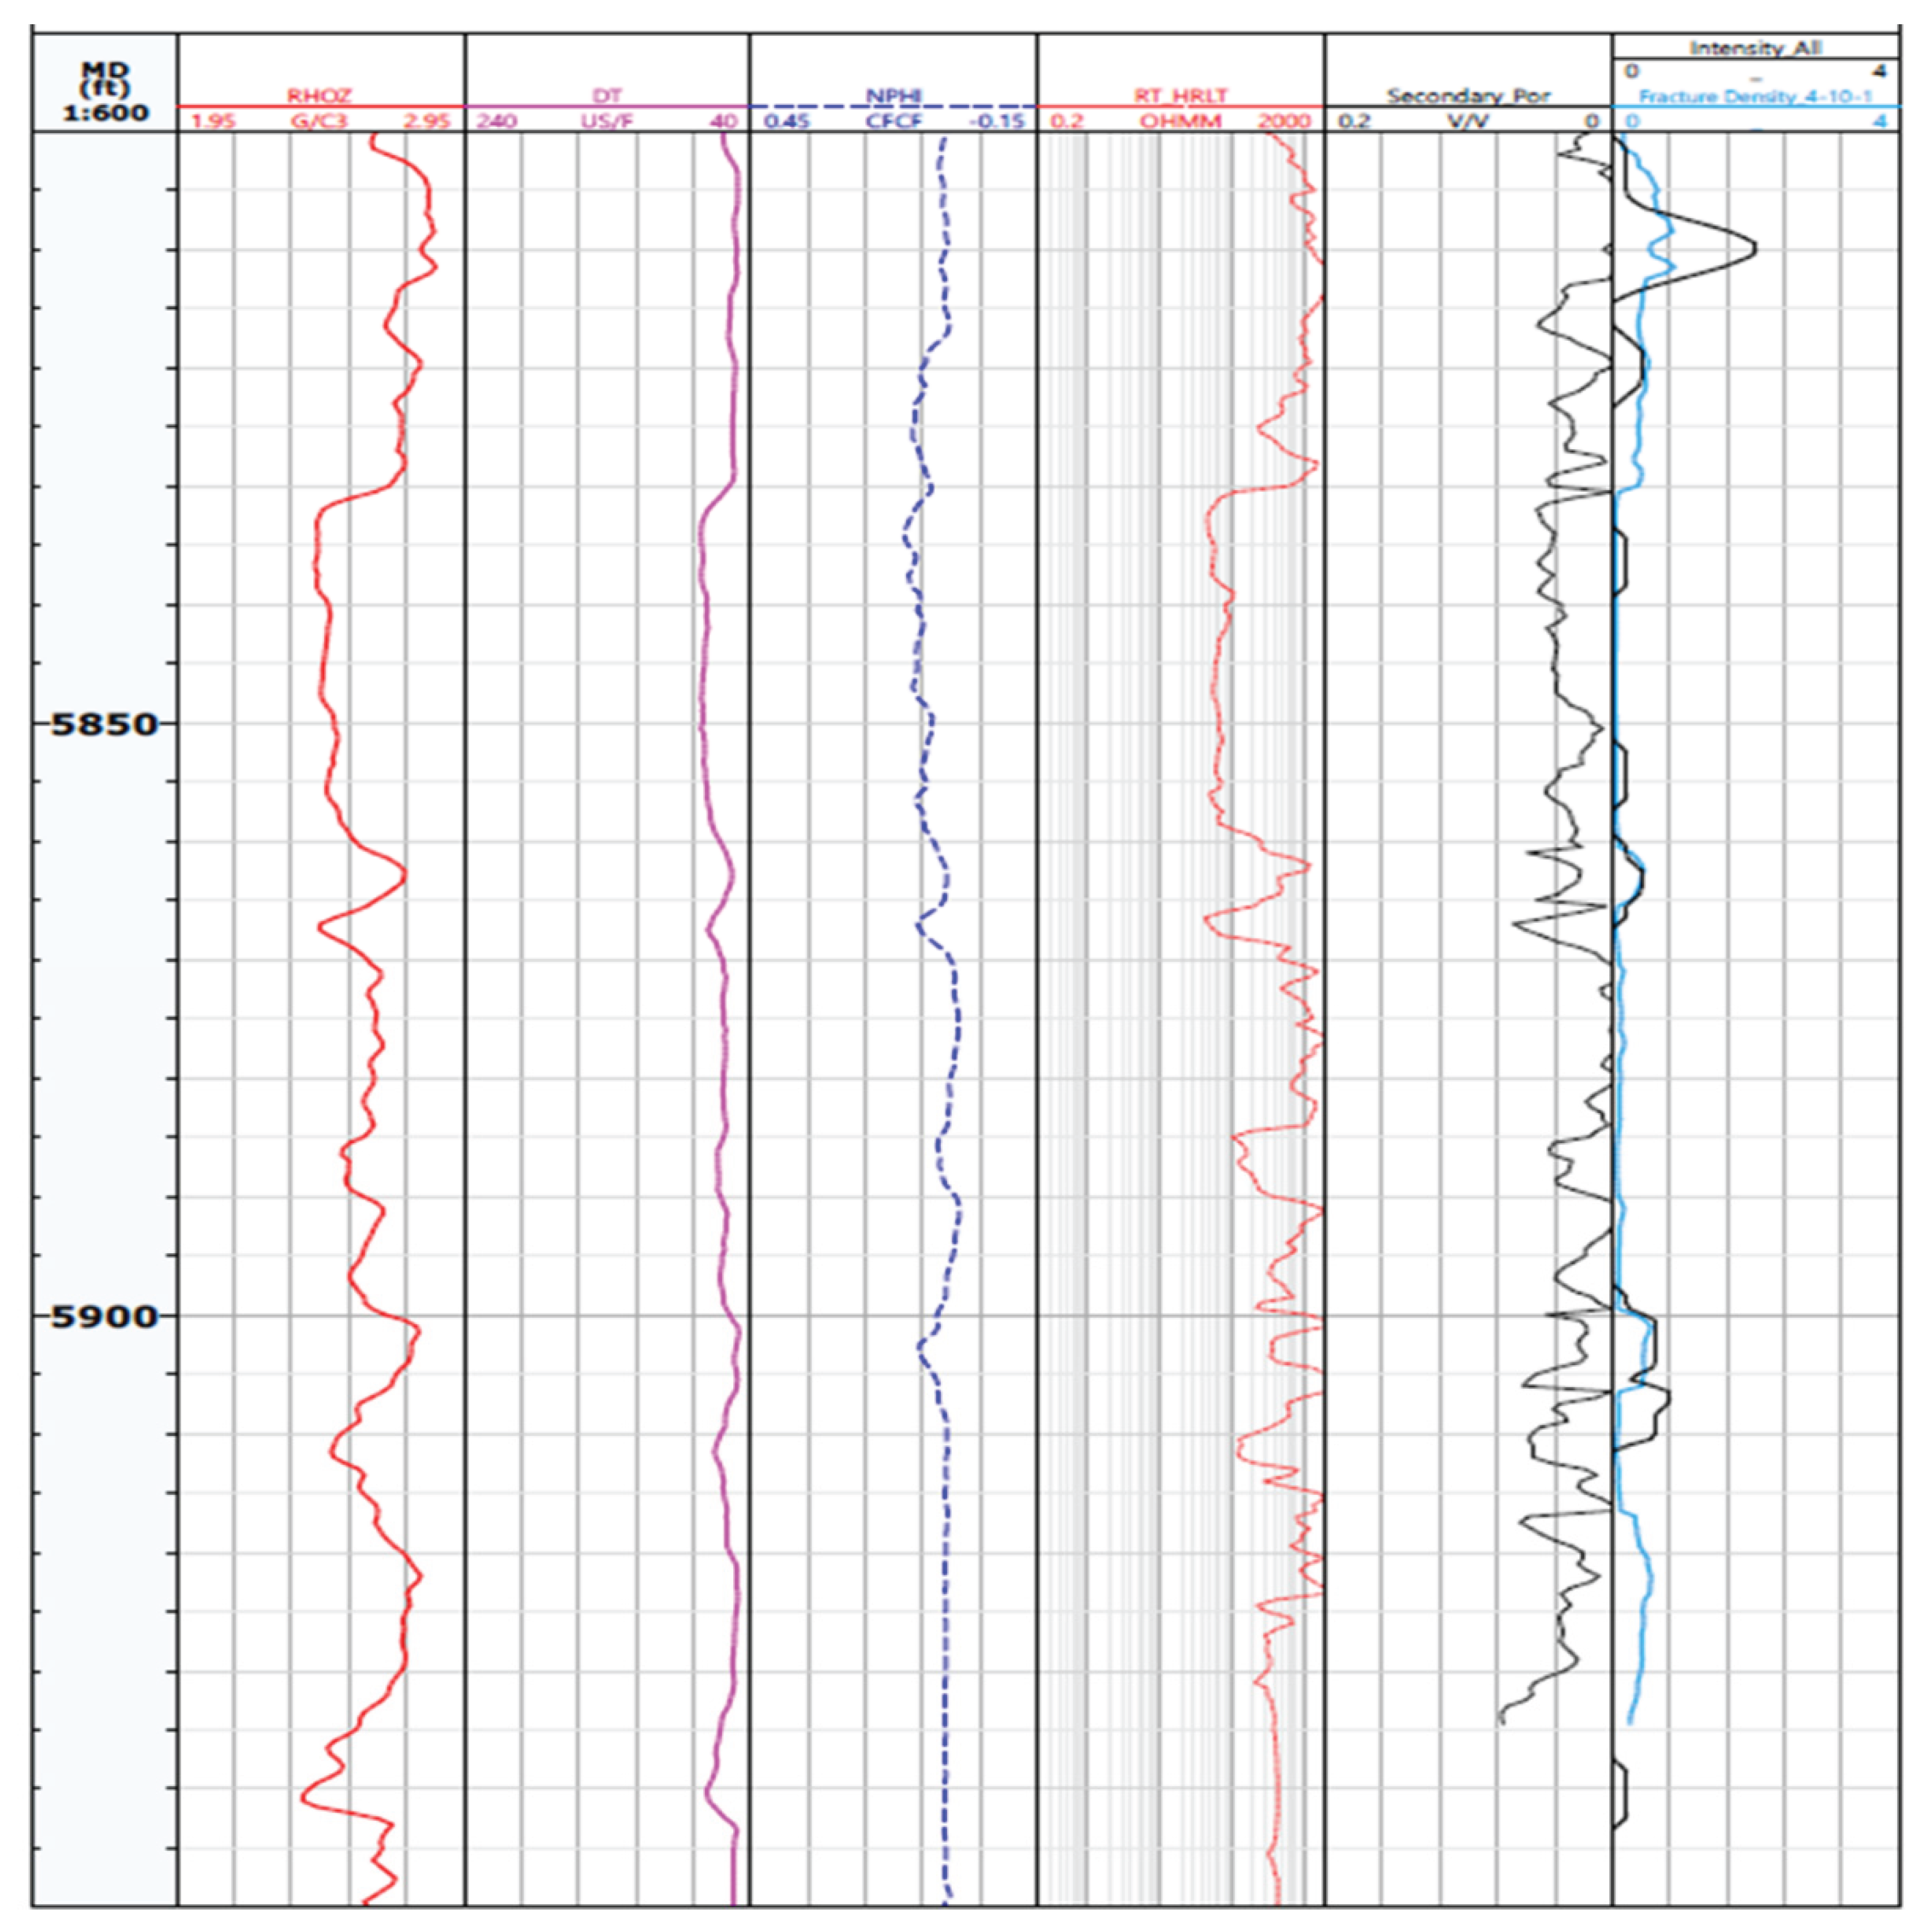
Figure 14.
Average error relative to the number of seismic attributes selected, indicating optimal performance at 15 attributes.
Figure 14.
Average error relative to the number of seismic attributes selected, indicating optimal performance at 15 attributes.
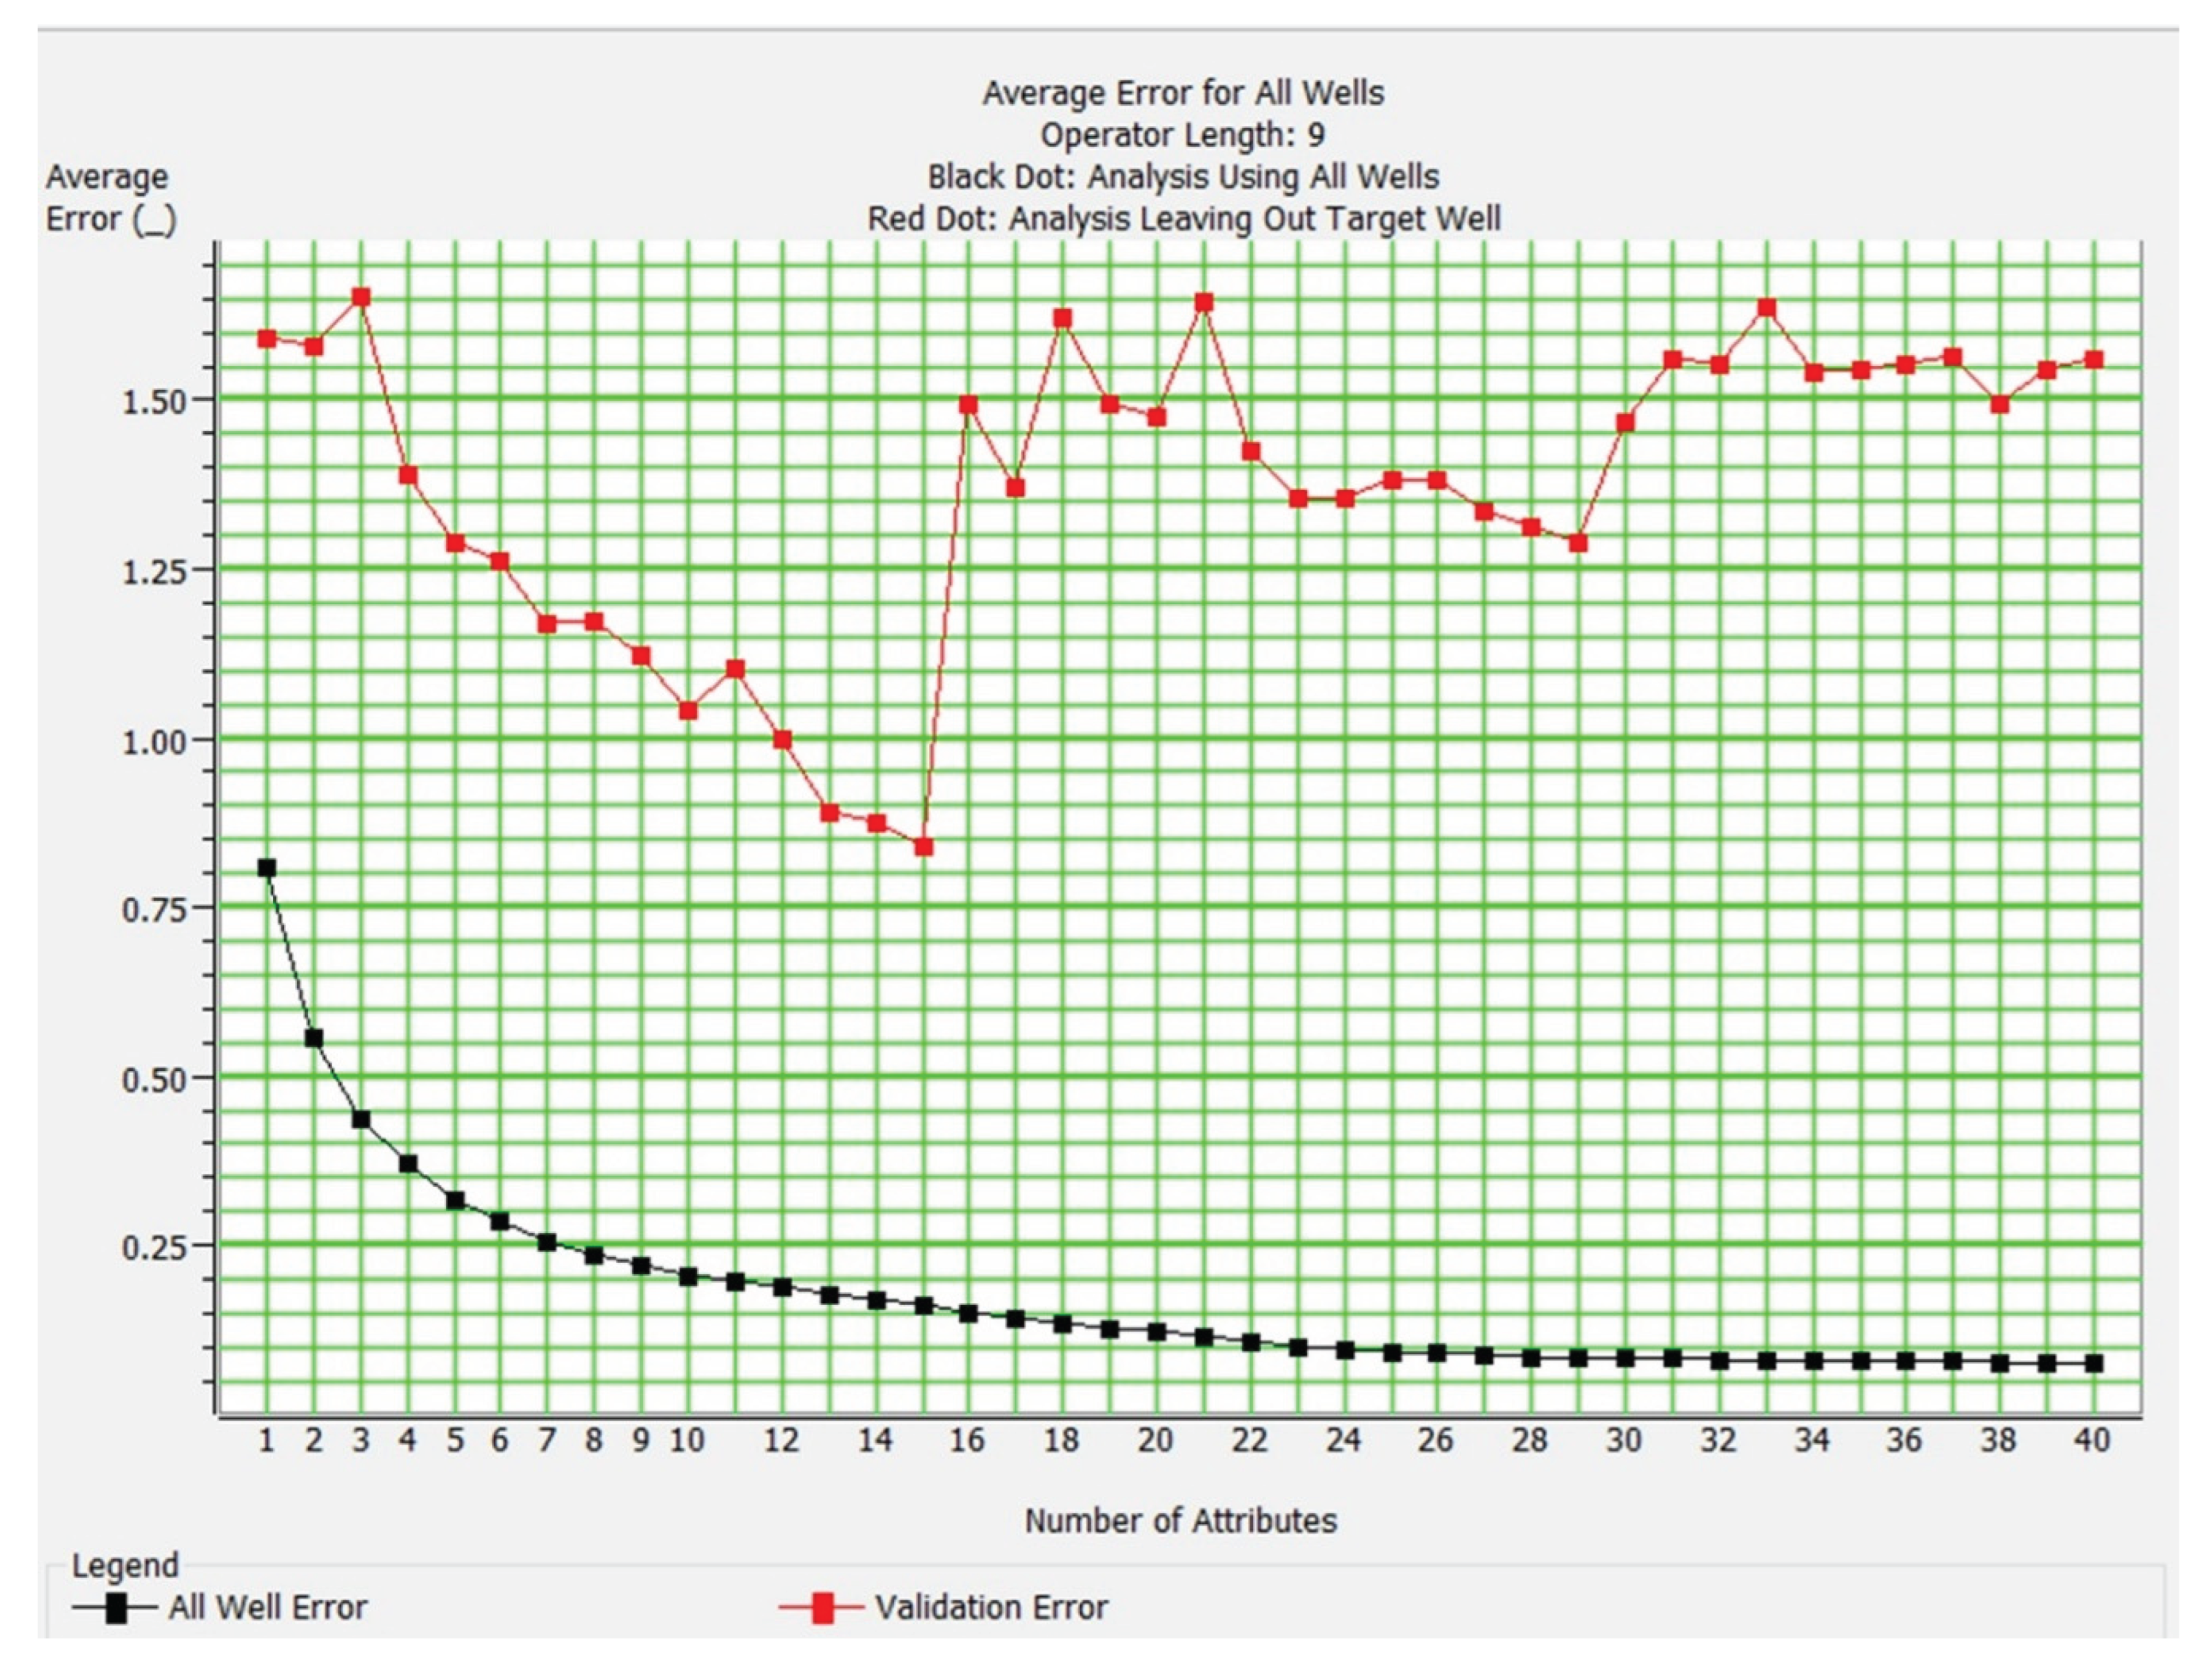
Figure 15.
Comparison of Actual vs. Predicted Fracture Intensity.
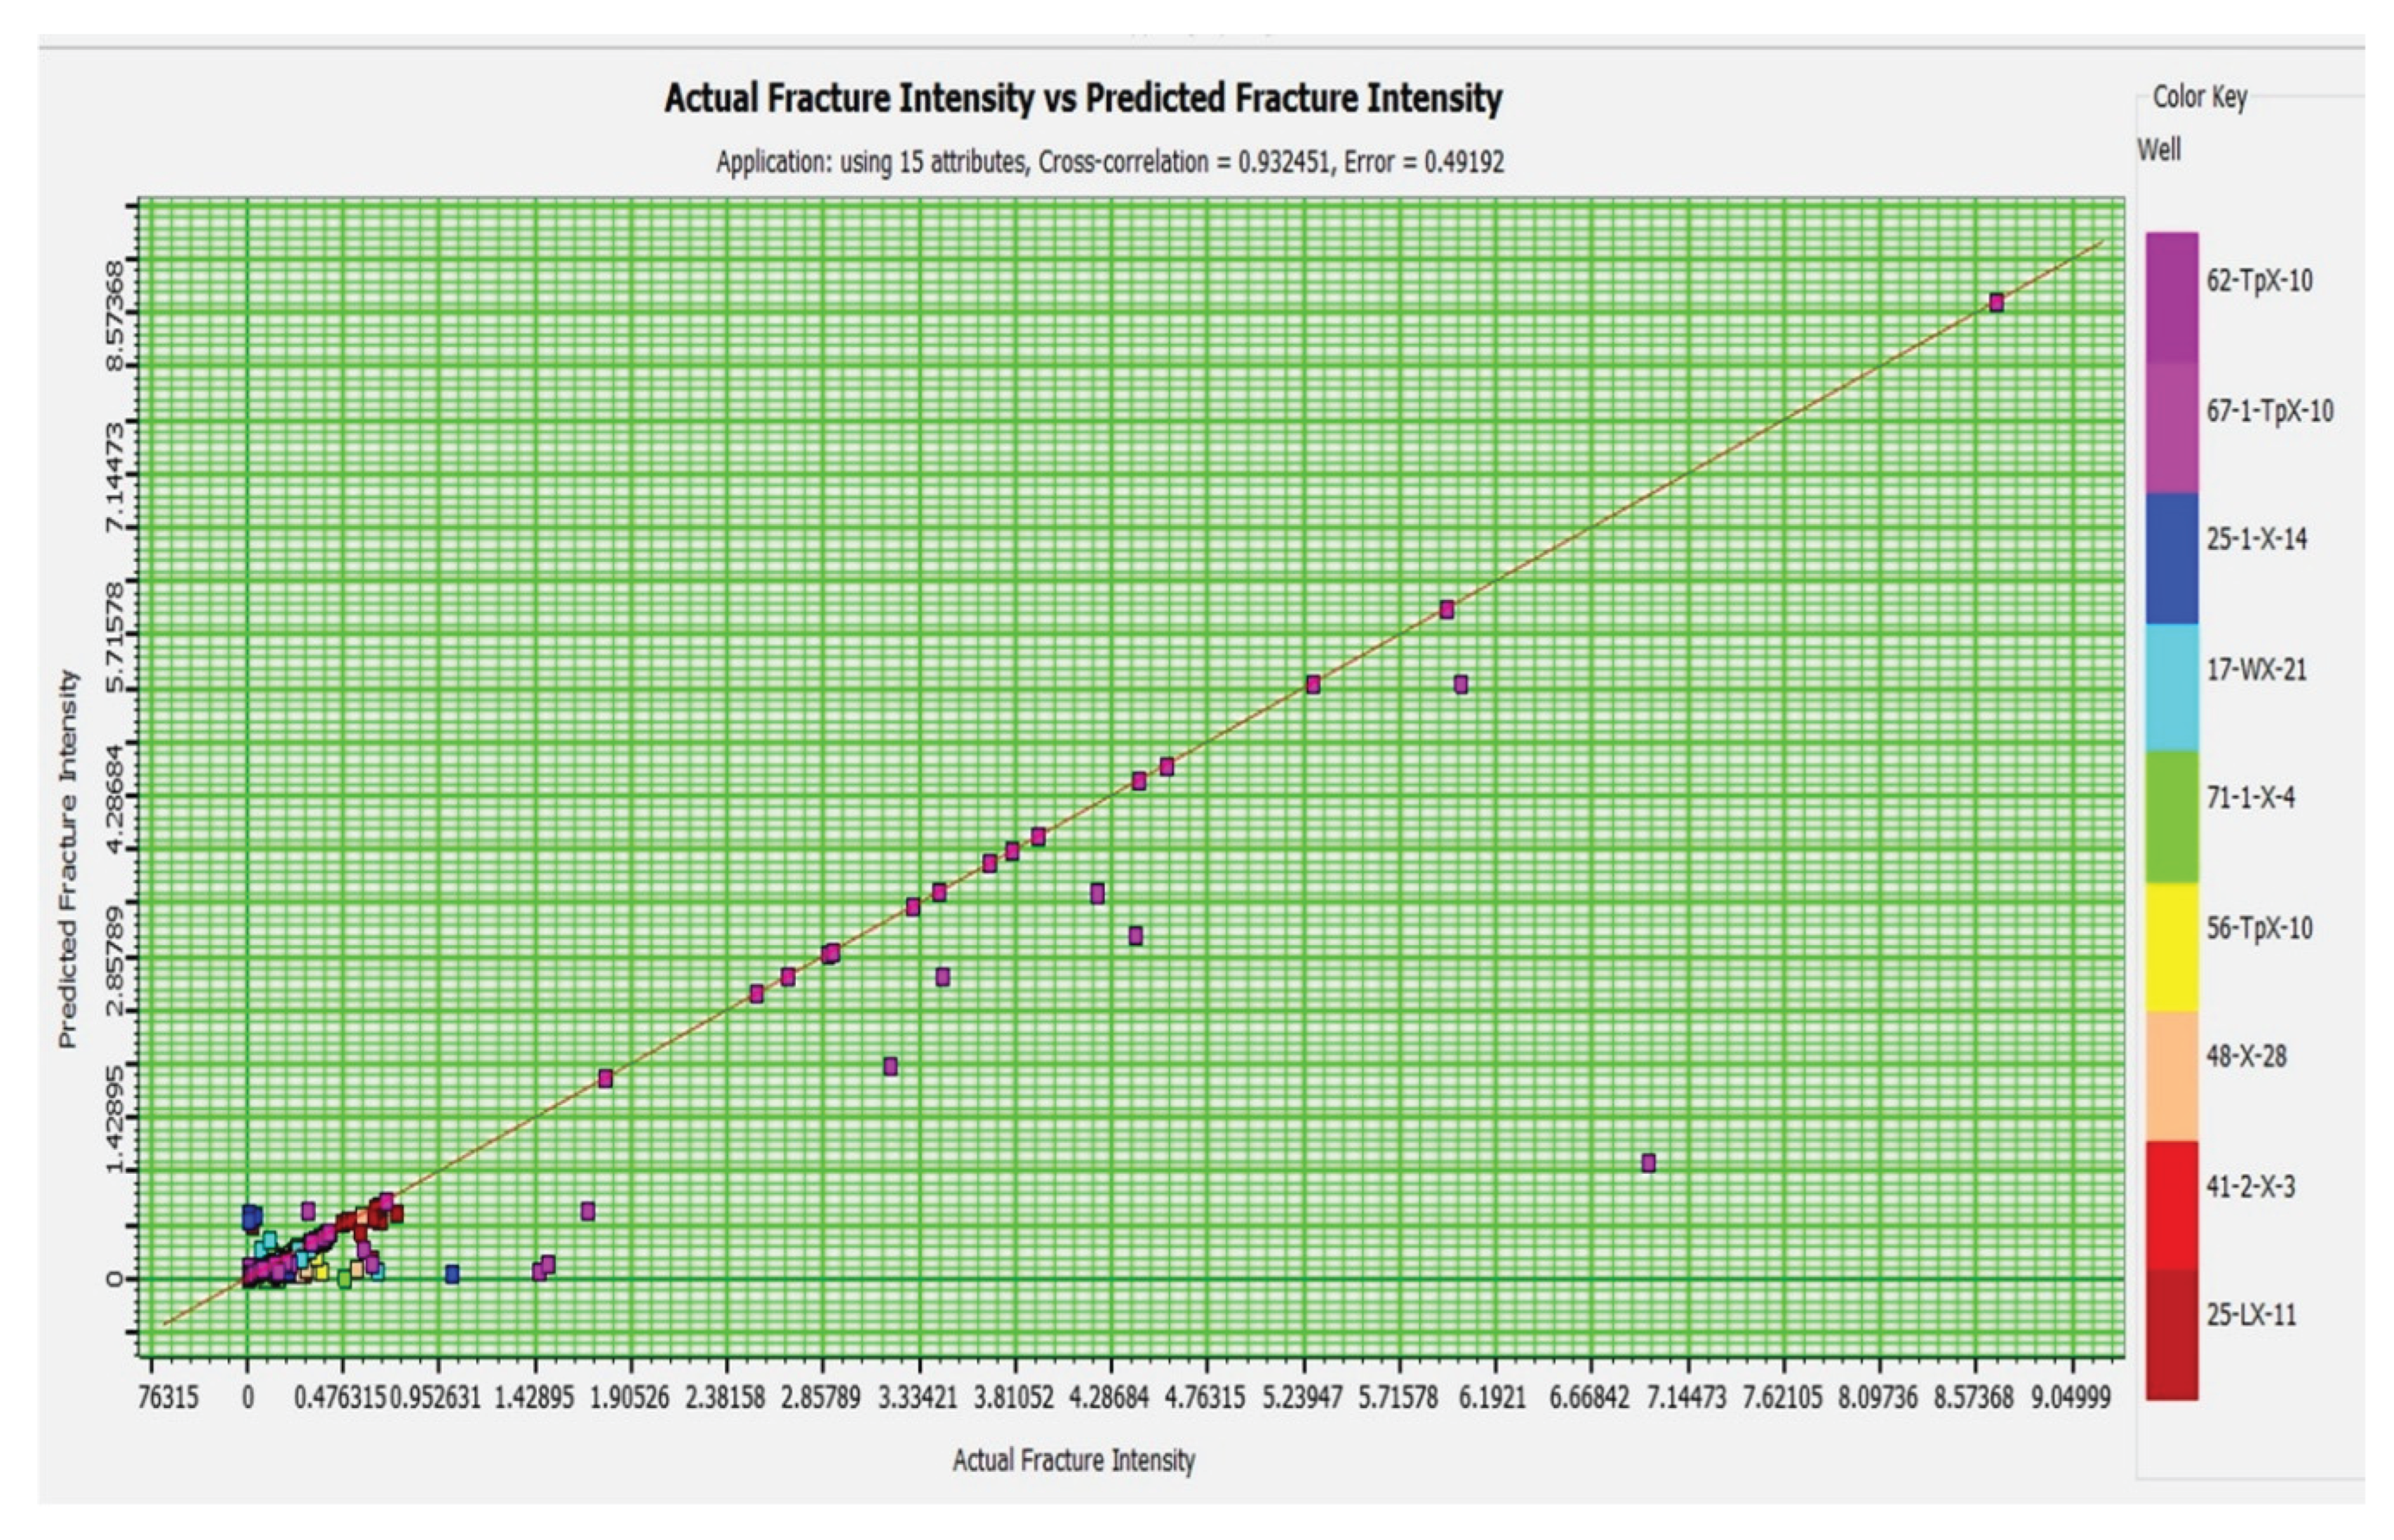
Figure 16.
Validation of operator length in PNN model.
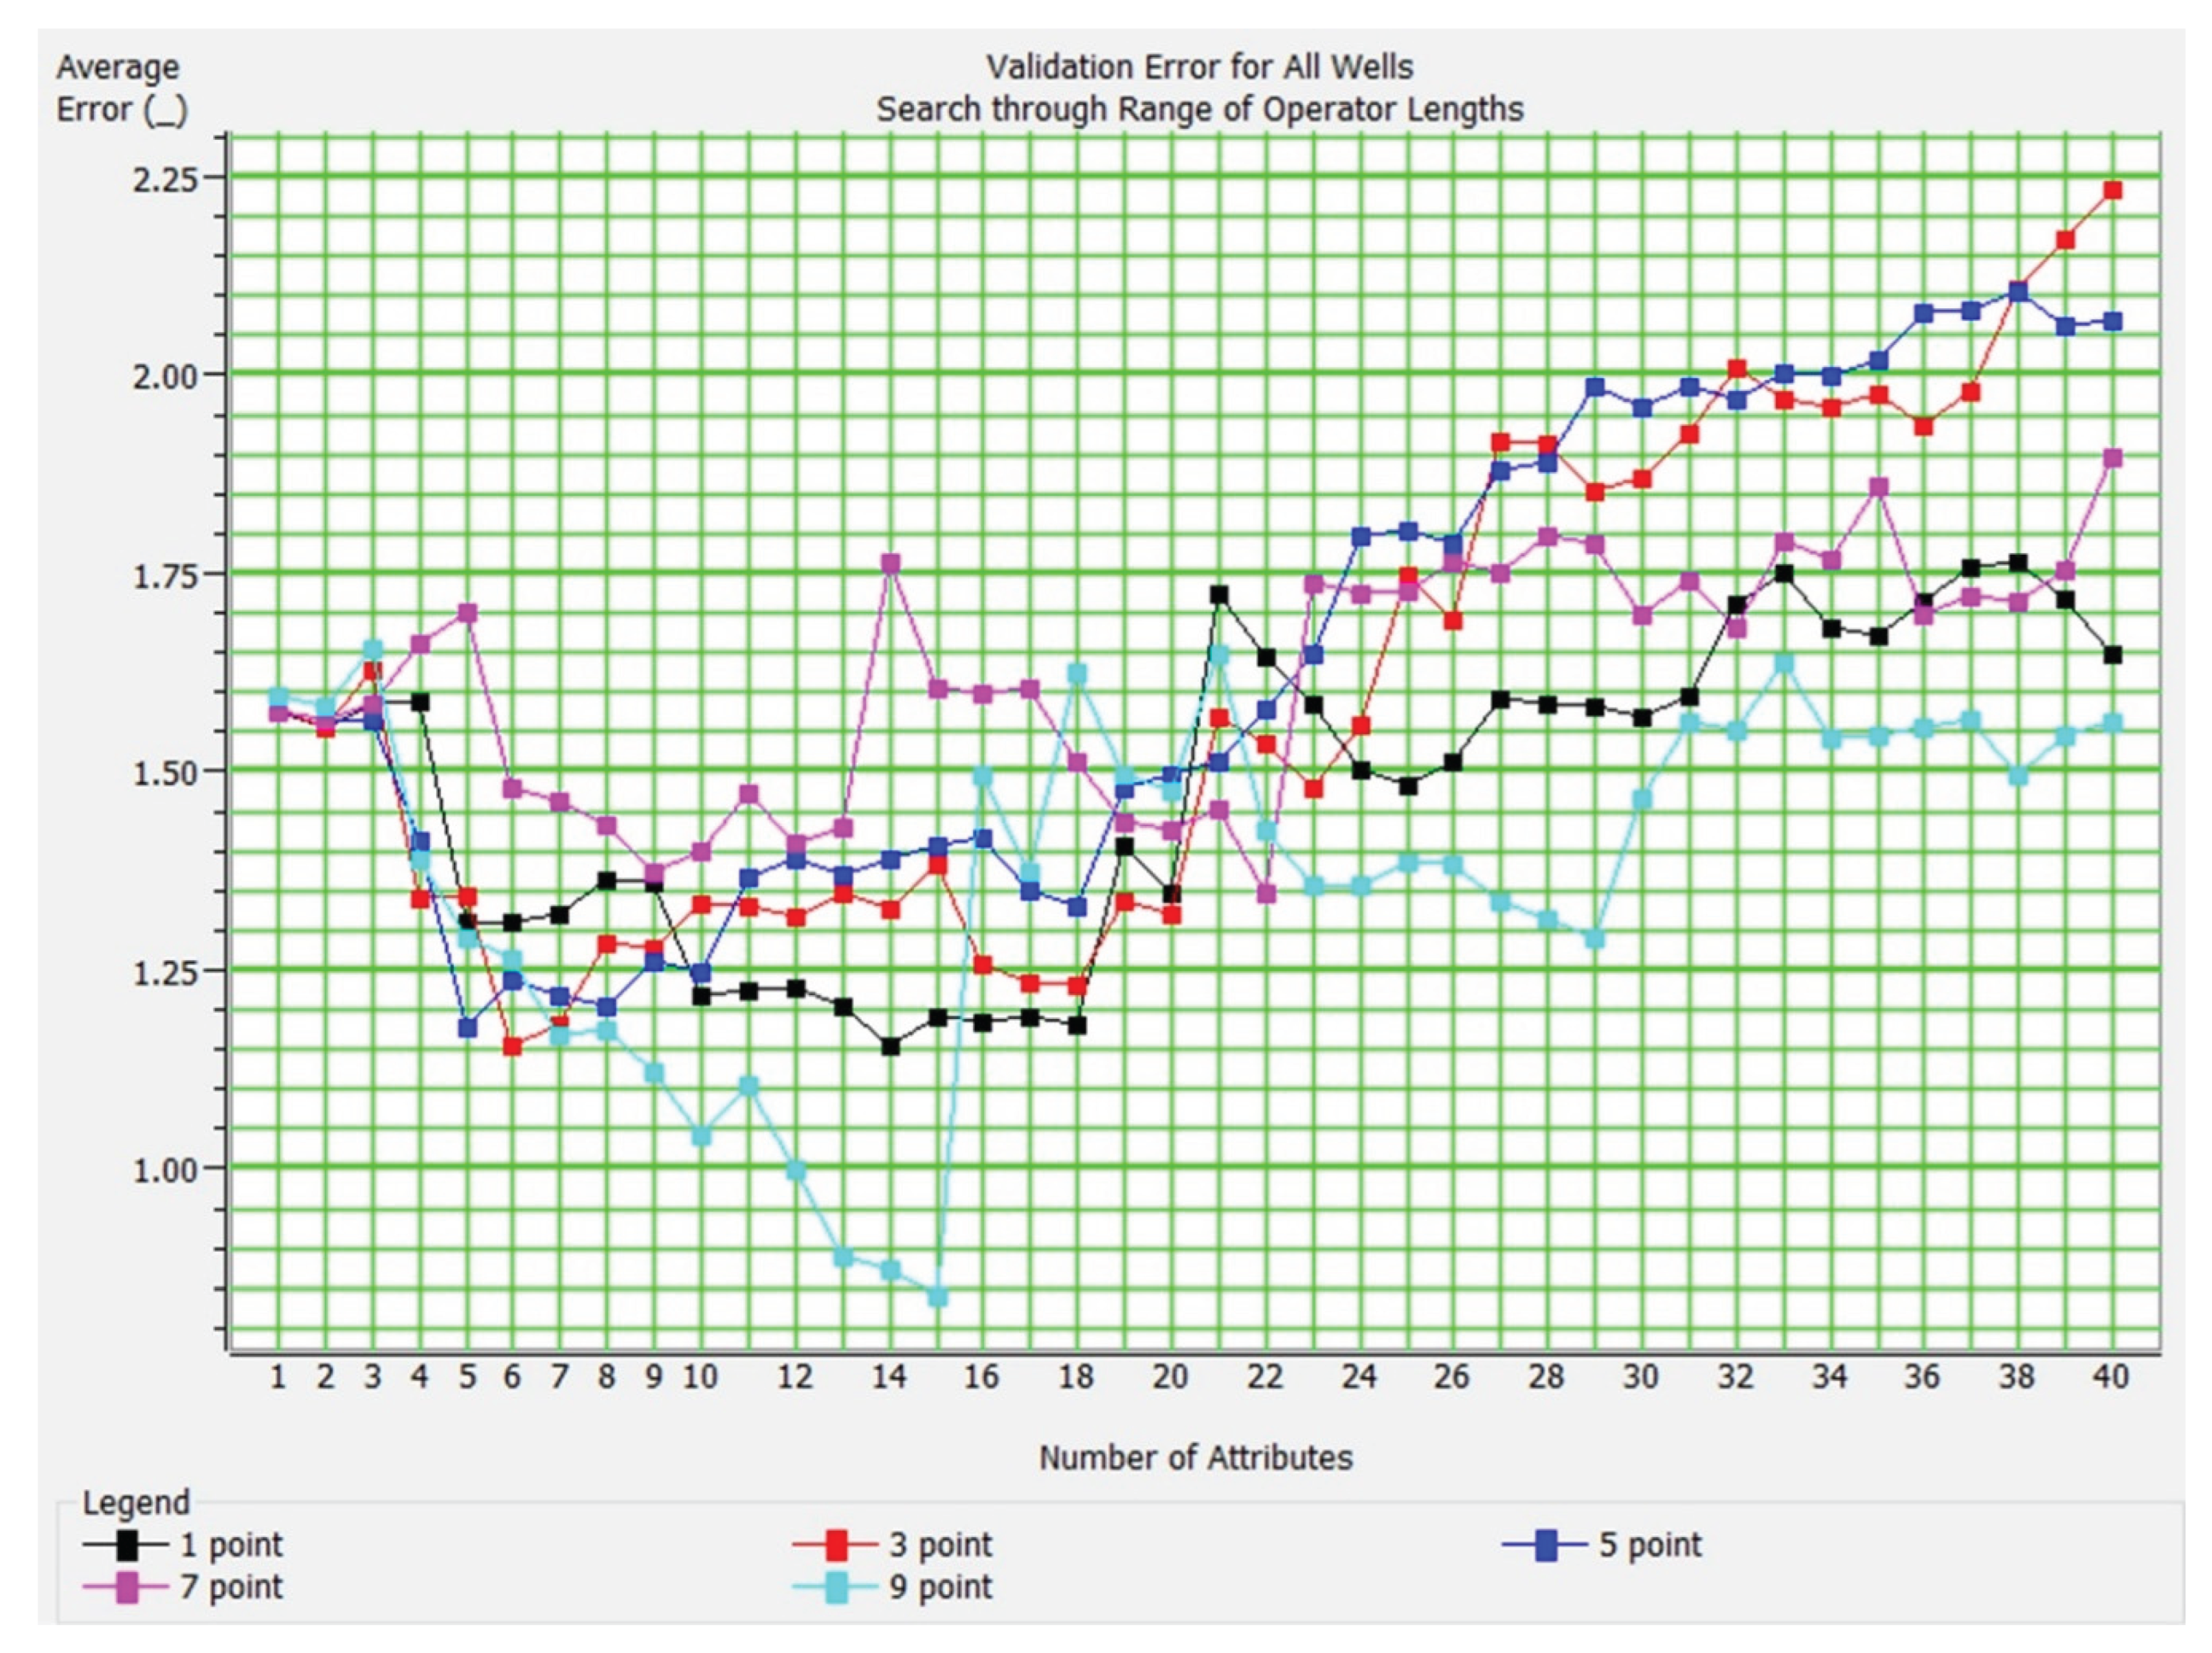
Figure 17.
Cross-sectional view of the reservoir showing the spatial distribution of fracture intensity.
Figure 17.
Cross-sectional view of the reservoir showing the spatial distribution of fracture intensity.
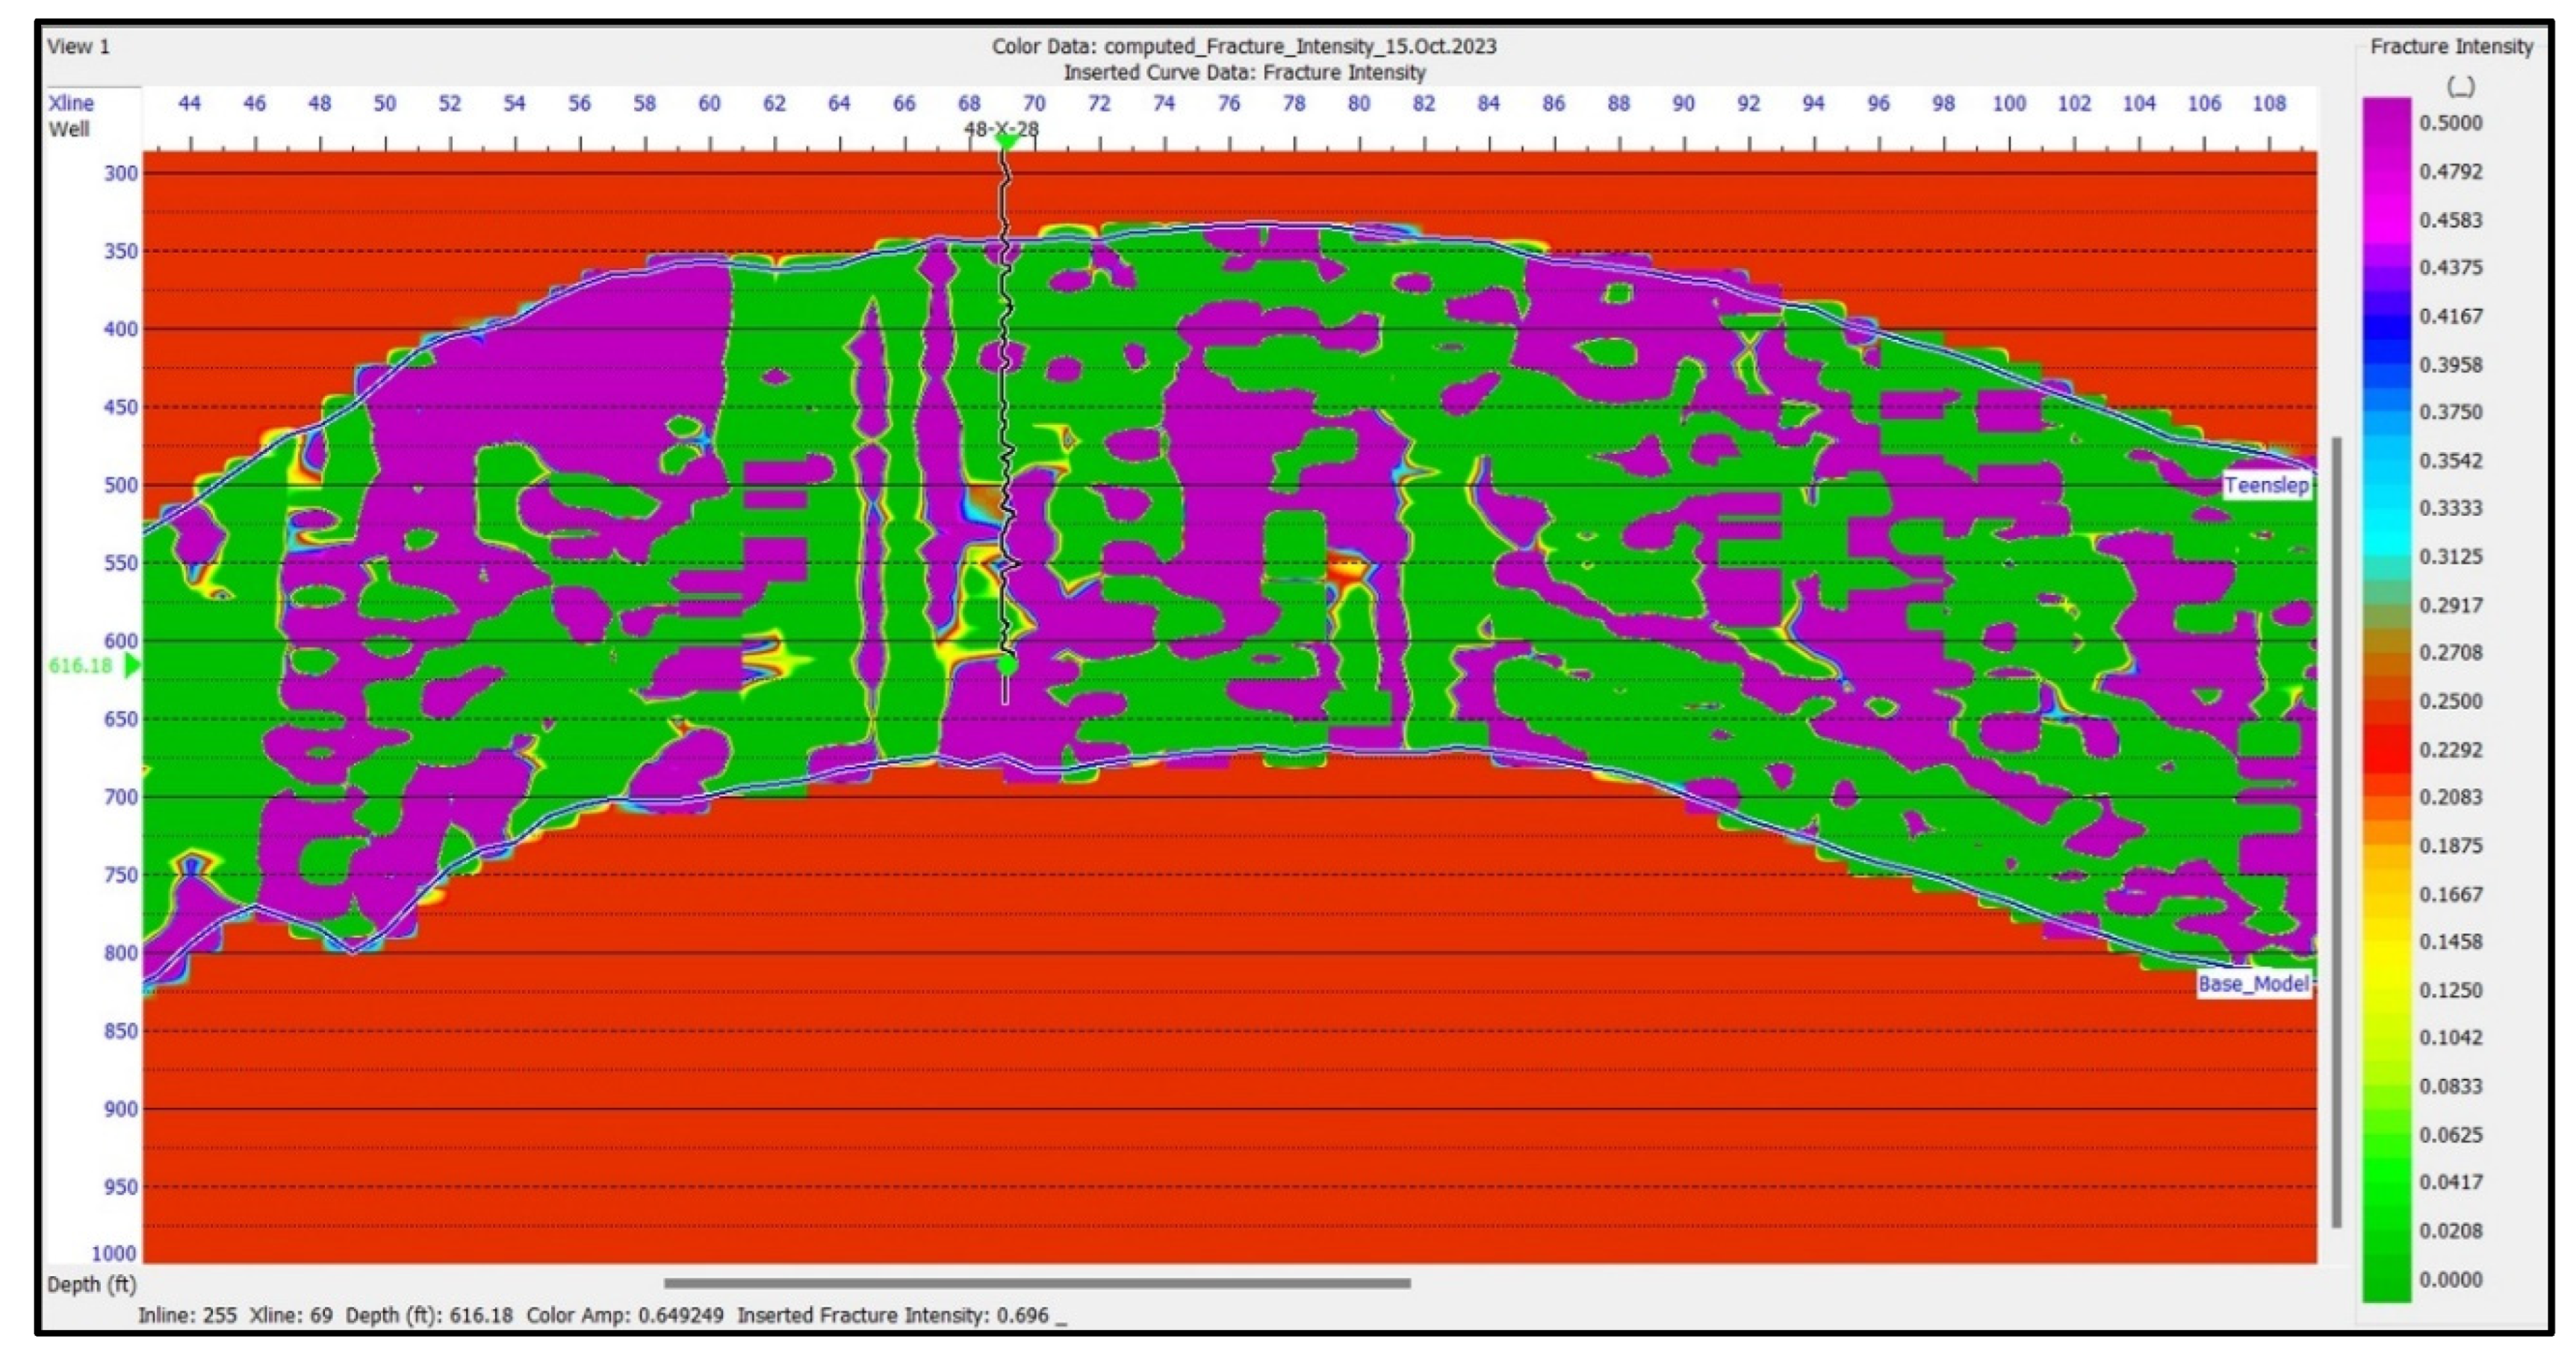
Figure 18.
Discrete Fracture Network (DFN) Model: 3D representation of fracture sets within the Tensleep Formation, with color-coded fracture classes (Code 1 to Code 4) indicating varying fracture orientations and intensities.
Figure 18.
Discrete Fracture Network (DFN) Model: 3D representation of fracture sets within the Tensleep Formation, with color-coded fracture classes (Code 1 to Code 4) indicating varying fracture orientations and intensities.
Disclaimer/Publisher’s Note: The statements, opinions and data contained in all publications are solely those of the individual author(s) and contributor(s) and not of MDPI and/or the editor(s). MDPI and/or the editor(s) disclaim responsibility for any injury to people or property resulting from any ideas, methods, instructions or products referred to in the content. |
© 2026 by the authors. Licensee MDPI, Basel, Switzerland. This article is an open access article distributed under the terms and conditions of the Creative Commons Attribution (CC BY) license (http://creativecommons.org/licenses/by/4.0/).
Copyright: This open access article is published under a Creative Commons CC BY 4.0 license, which permit the free download, distribution, and reuse, provided that the author and preprint are cited in any reuse.


