Submitted:
10 February 2026
Posted:
11 February 2026
You are already at the latest version
Abstract
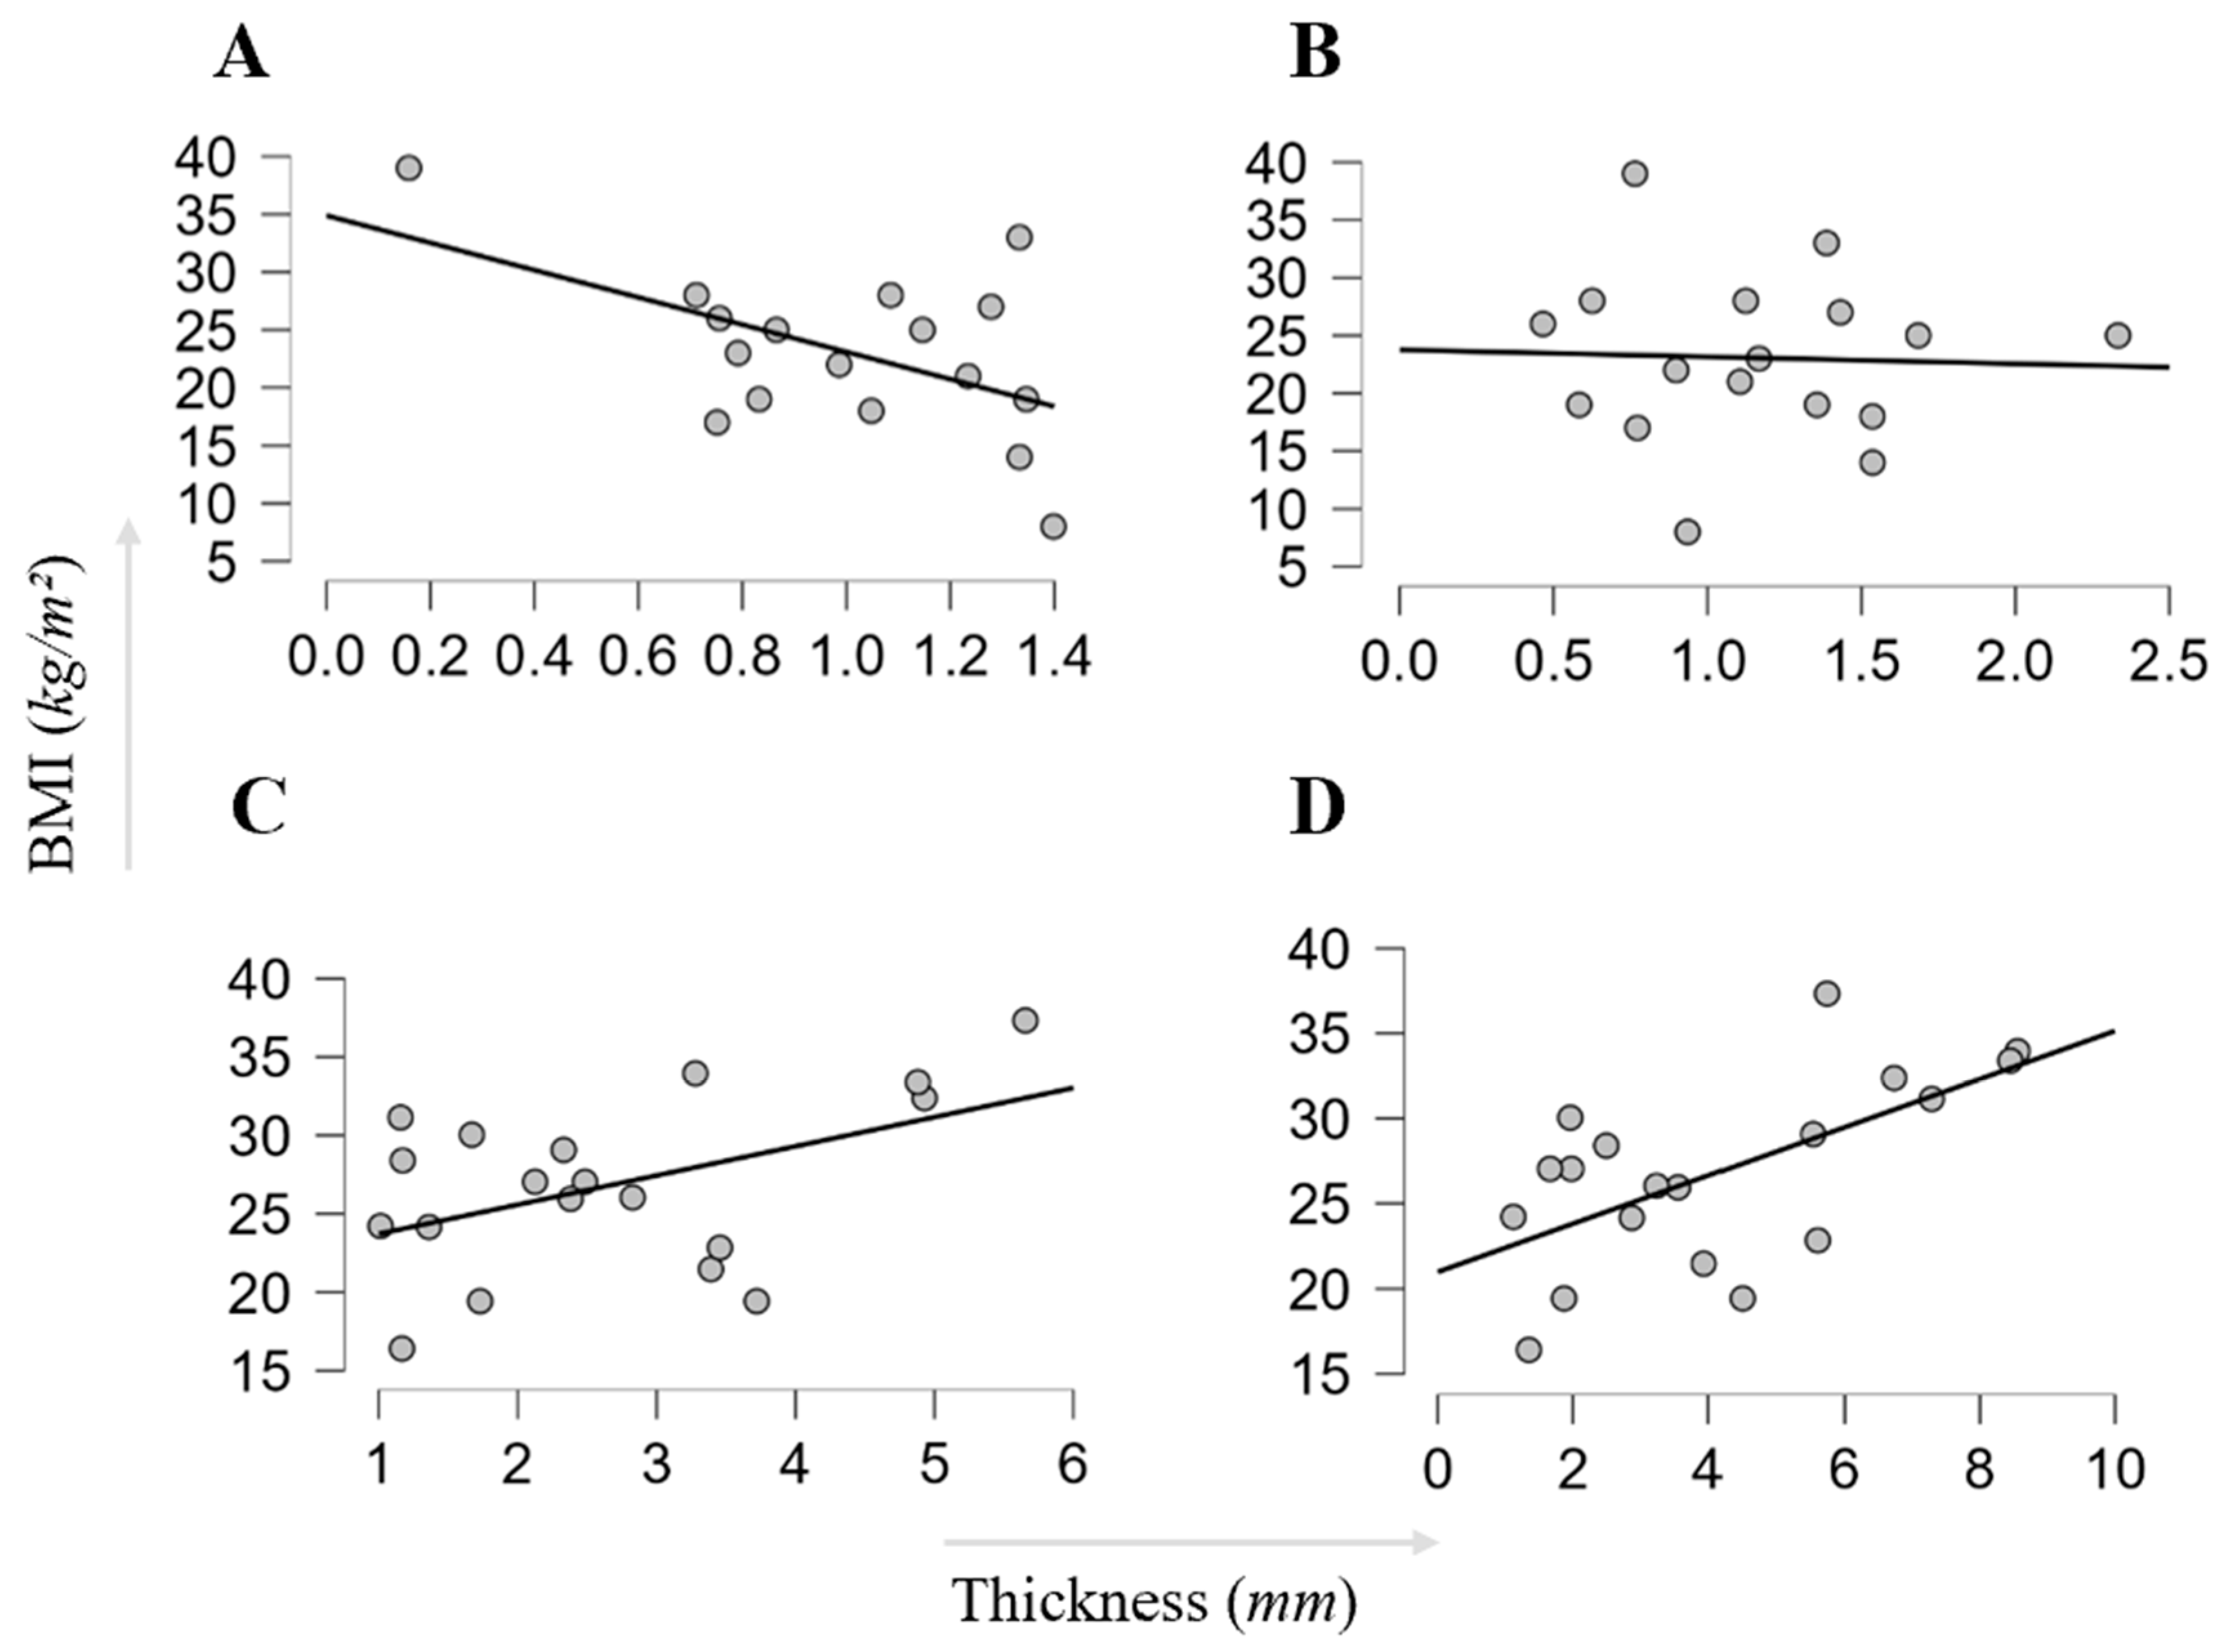
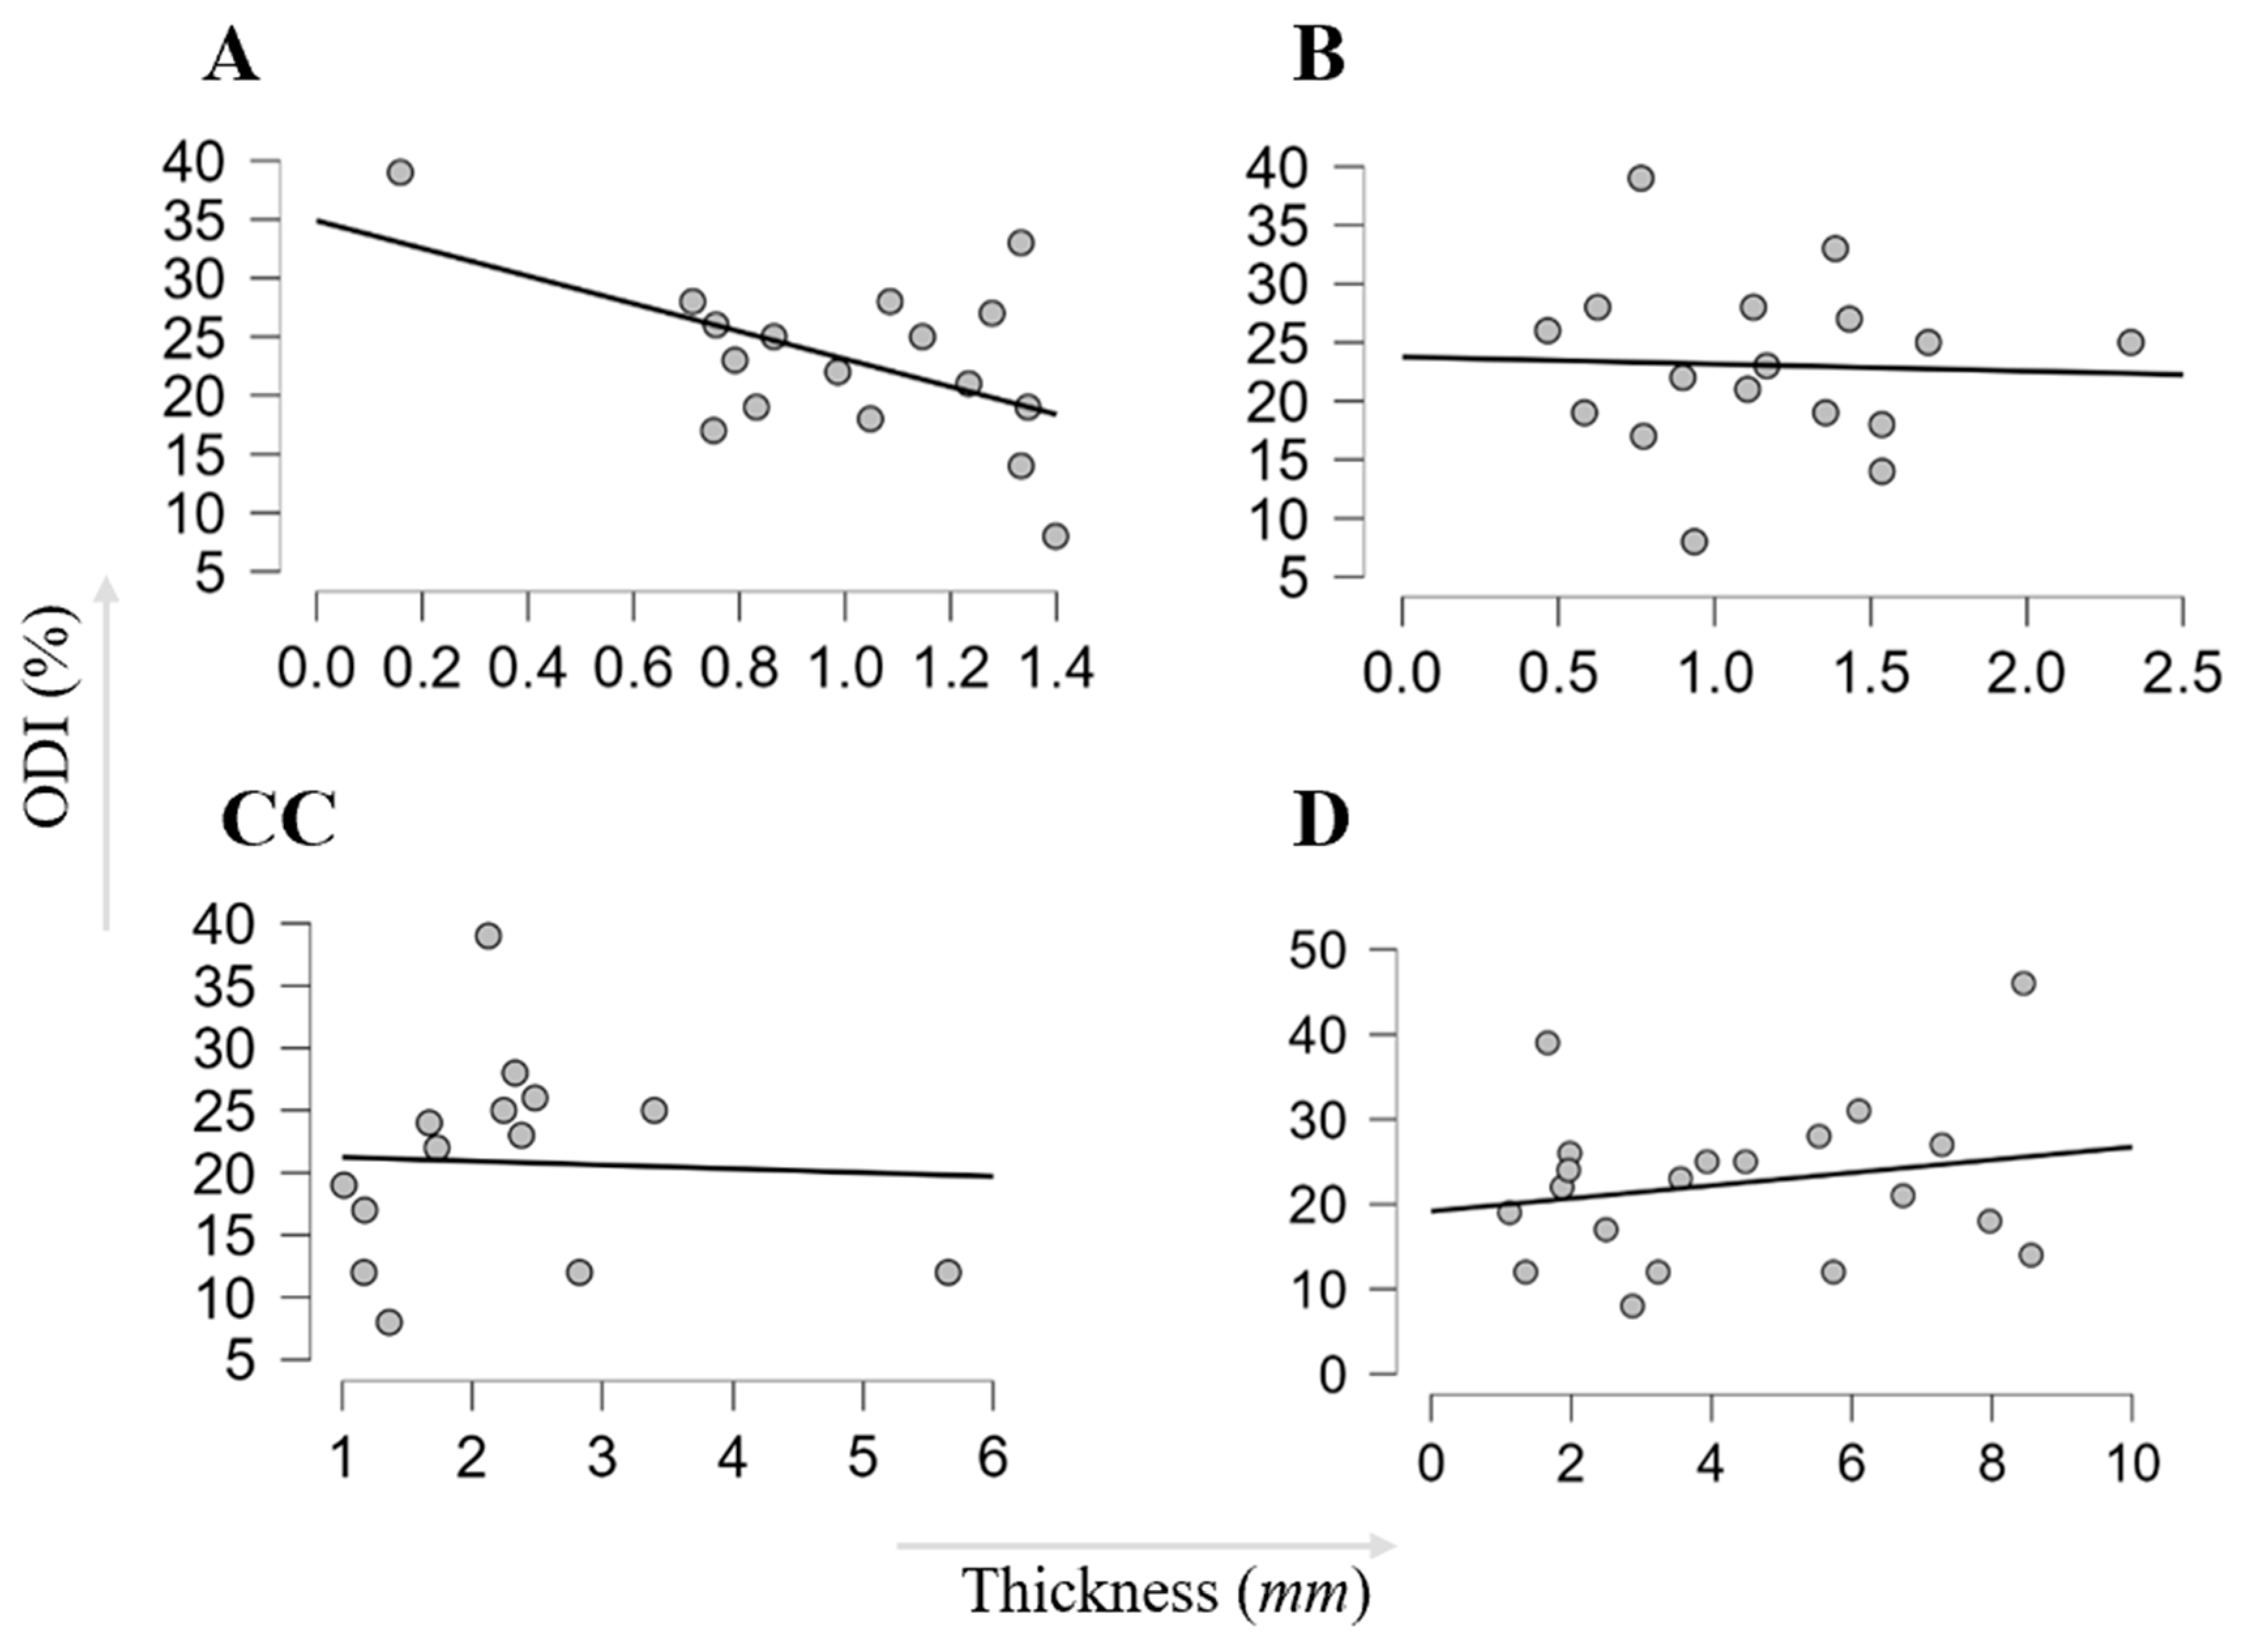
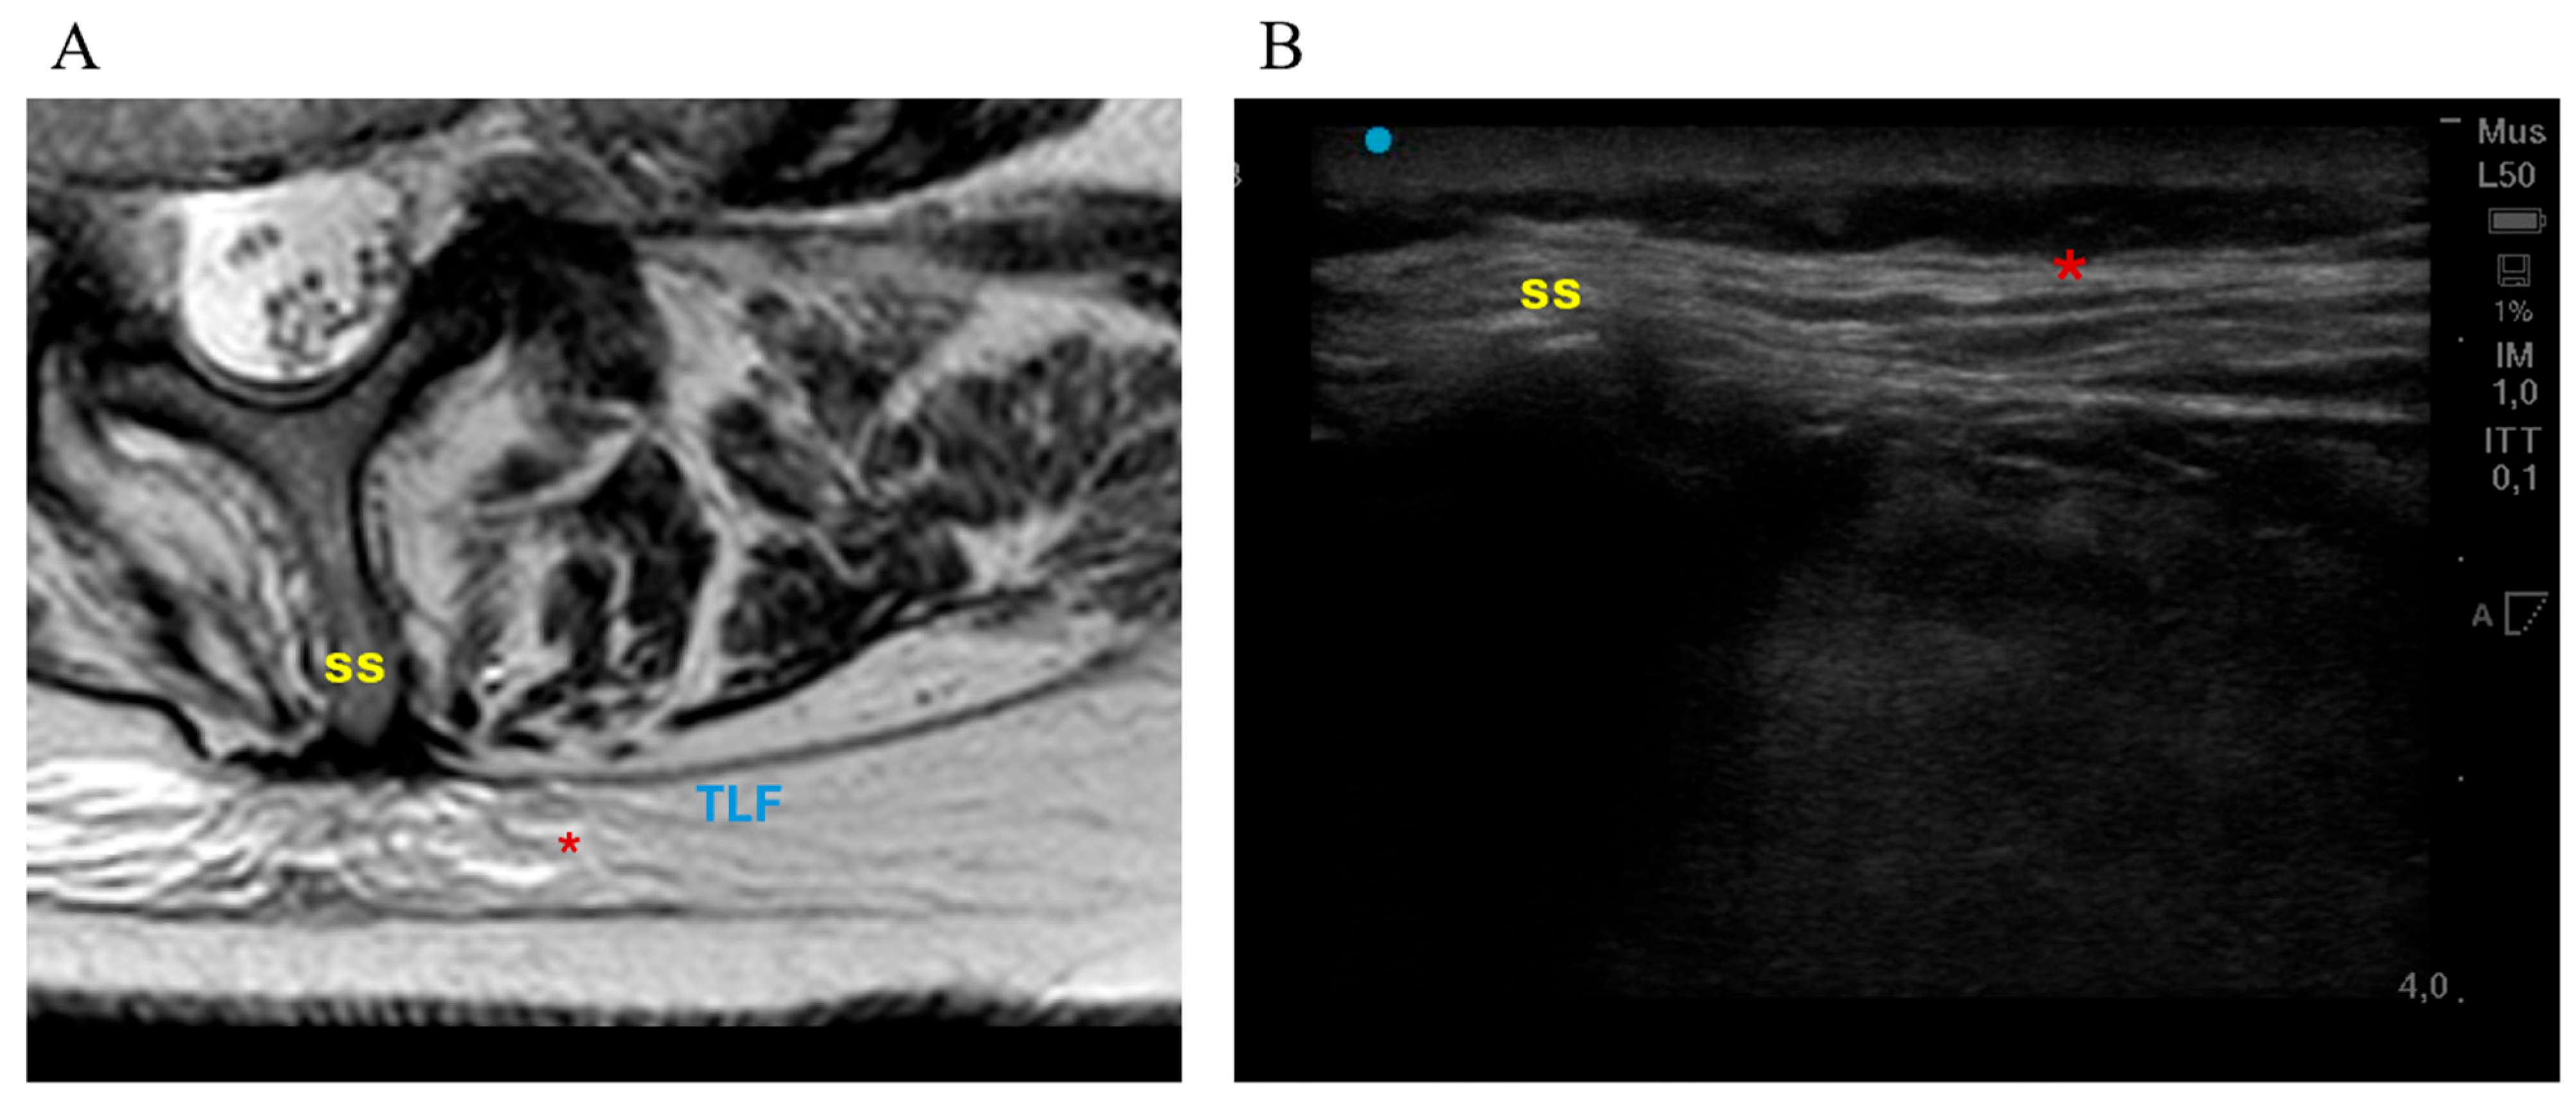
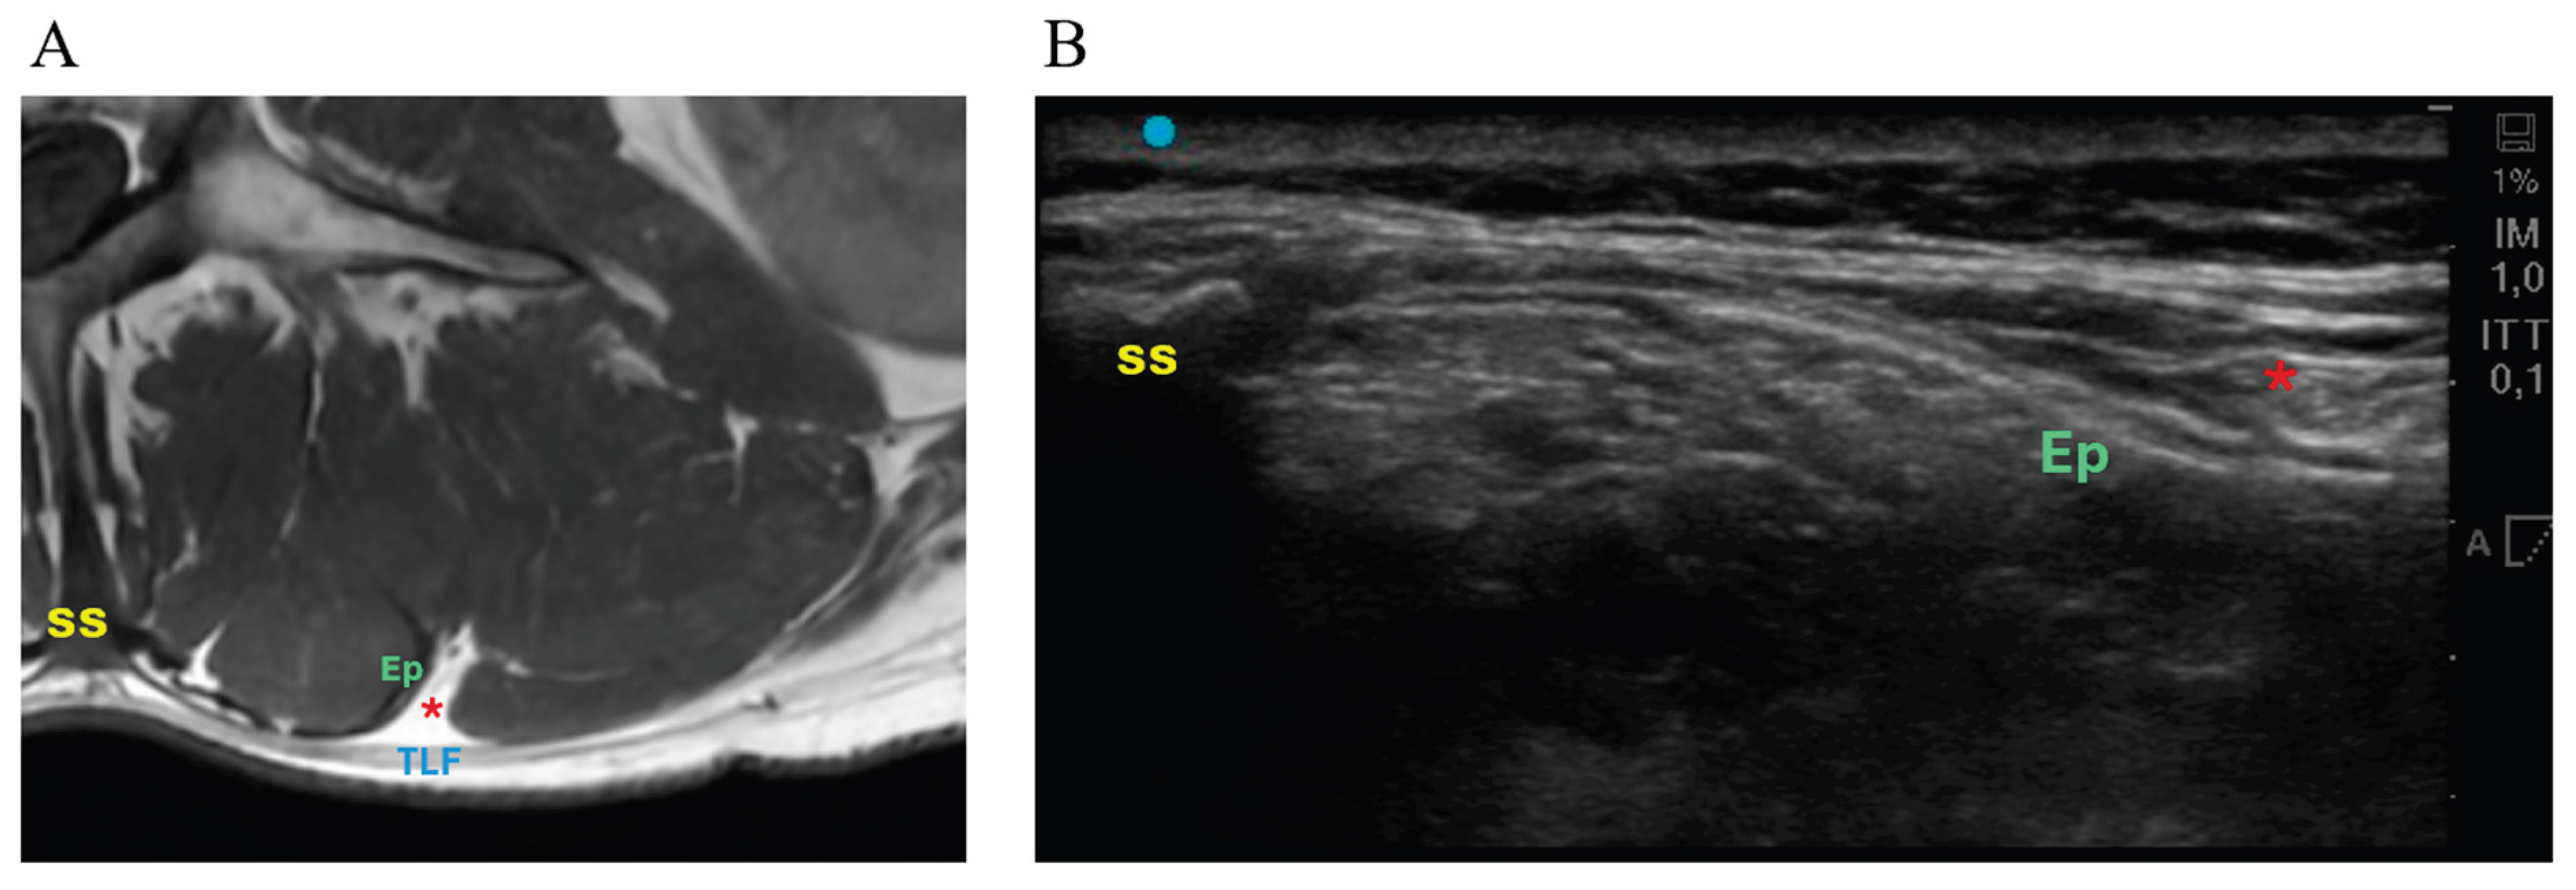
Background and Objectives: The thoracolumbar fascia (TLF) has been implicated in low back pain, but imaging-based characterization in specific degenerative lumbar pathologies—particularly in surgical cohorts—remains limited. To evaluate TLF thickness on Magnetic resonance imaging (MRI) and Ultrasound (US) across common lumbar pathologies, examine associations with age, body mass index, disability, and assess MRI–US agreement for TLF thickness. Materials and Methods: In this prospective single-centre cohort, adults scheduled for elective lumbar surgery underwent preoperative US (short- and long-axis at L3) and review of routine lumbar MRI (axial and sagittal T1-weighted measurements at L3) using standardized protocols. Disability was assessed using the Oswestry Disability Index (ODI). Group comparisons, correlation analyses, and intraclass correlation coefficients were used to evaluate between-diagnosis differences, patient-factor associations, and MRI–US agreement. Results: Thirty-seven patients were eligible (15 lumbar spinal stenosis, 5 discs herniations, 4 spondylolisthesis, 2 scoliosis, 9 revision surgeries, 2 trauma comparators). Median TLF thickness was 0.86 mm (0.16–1.40) on axial MRI, 1.12 mm (0.47–2.33) on sagittal MRI, 2.38 mm (1.01–5.91) on US short-axis, and 2.87 mm (1.12–5.74) on US long-axis. Axial MRI thickness differed across groups (p=0.010), driven by thinner measurements in trauma versus disc herniation (p=0.031); no significant group effects were observed on sagittal MRI or US. Age correlated positively with axial MRI thickness (p=0.021). No significant correlations were detected between ODI and TLF thickness on MRI or US. MRI–US agreement was poor, indicating the modalities are not interchangeable for TLF thickness measurement. Conclusions: TLF thickness measured on MRI and US did not consistently differentiate diagnostic groups and was not associated with disability. Thickness estimates differed substantially by modality, with poor MRI–US agreement. Larger studies with standardized acquisition and reliability testing are needed to clarify the clinical and mechanistic relevance of TLF imaging in degenerative lumbar disease and to determine whether it can support phenotype-based stratification within degenerative spine disease.
Keywords:
1. Introduction
2. Material and Methods
2.1. Clinical Assessment and Outcomes
2.2. Ultrasound Protocol
2.3. MRI Protocol
2.4. Statistical Analysis
3. Results
3.1. Study Cohort
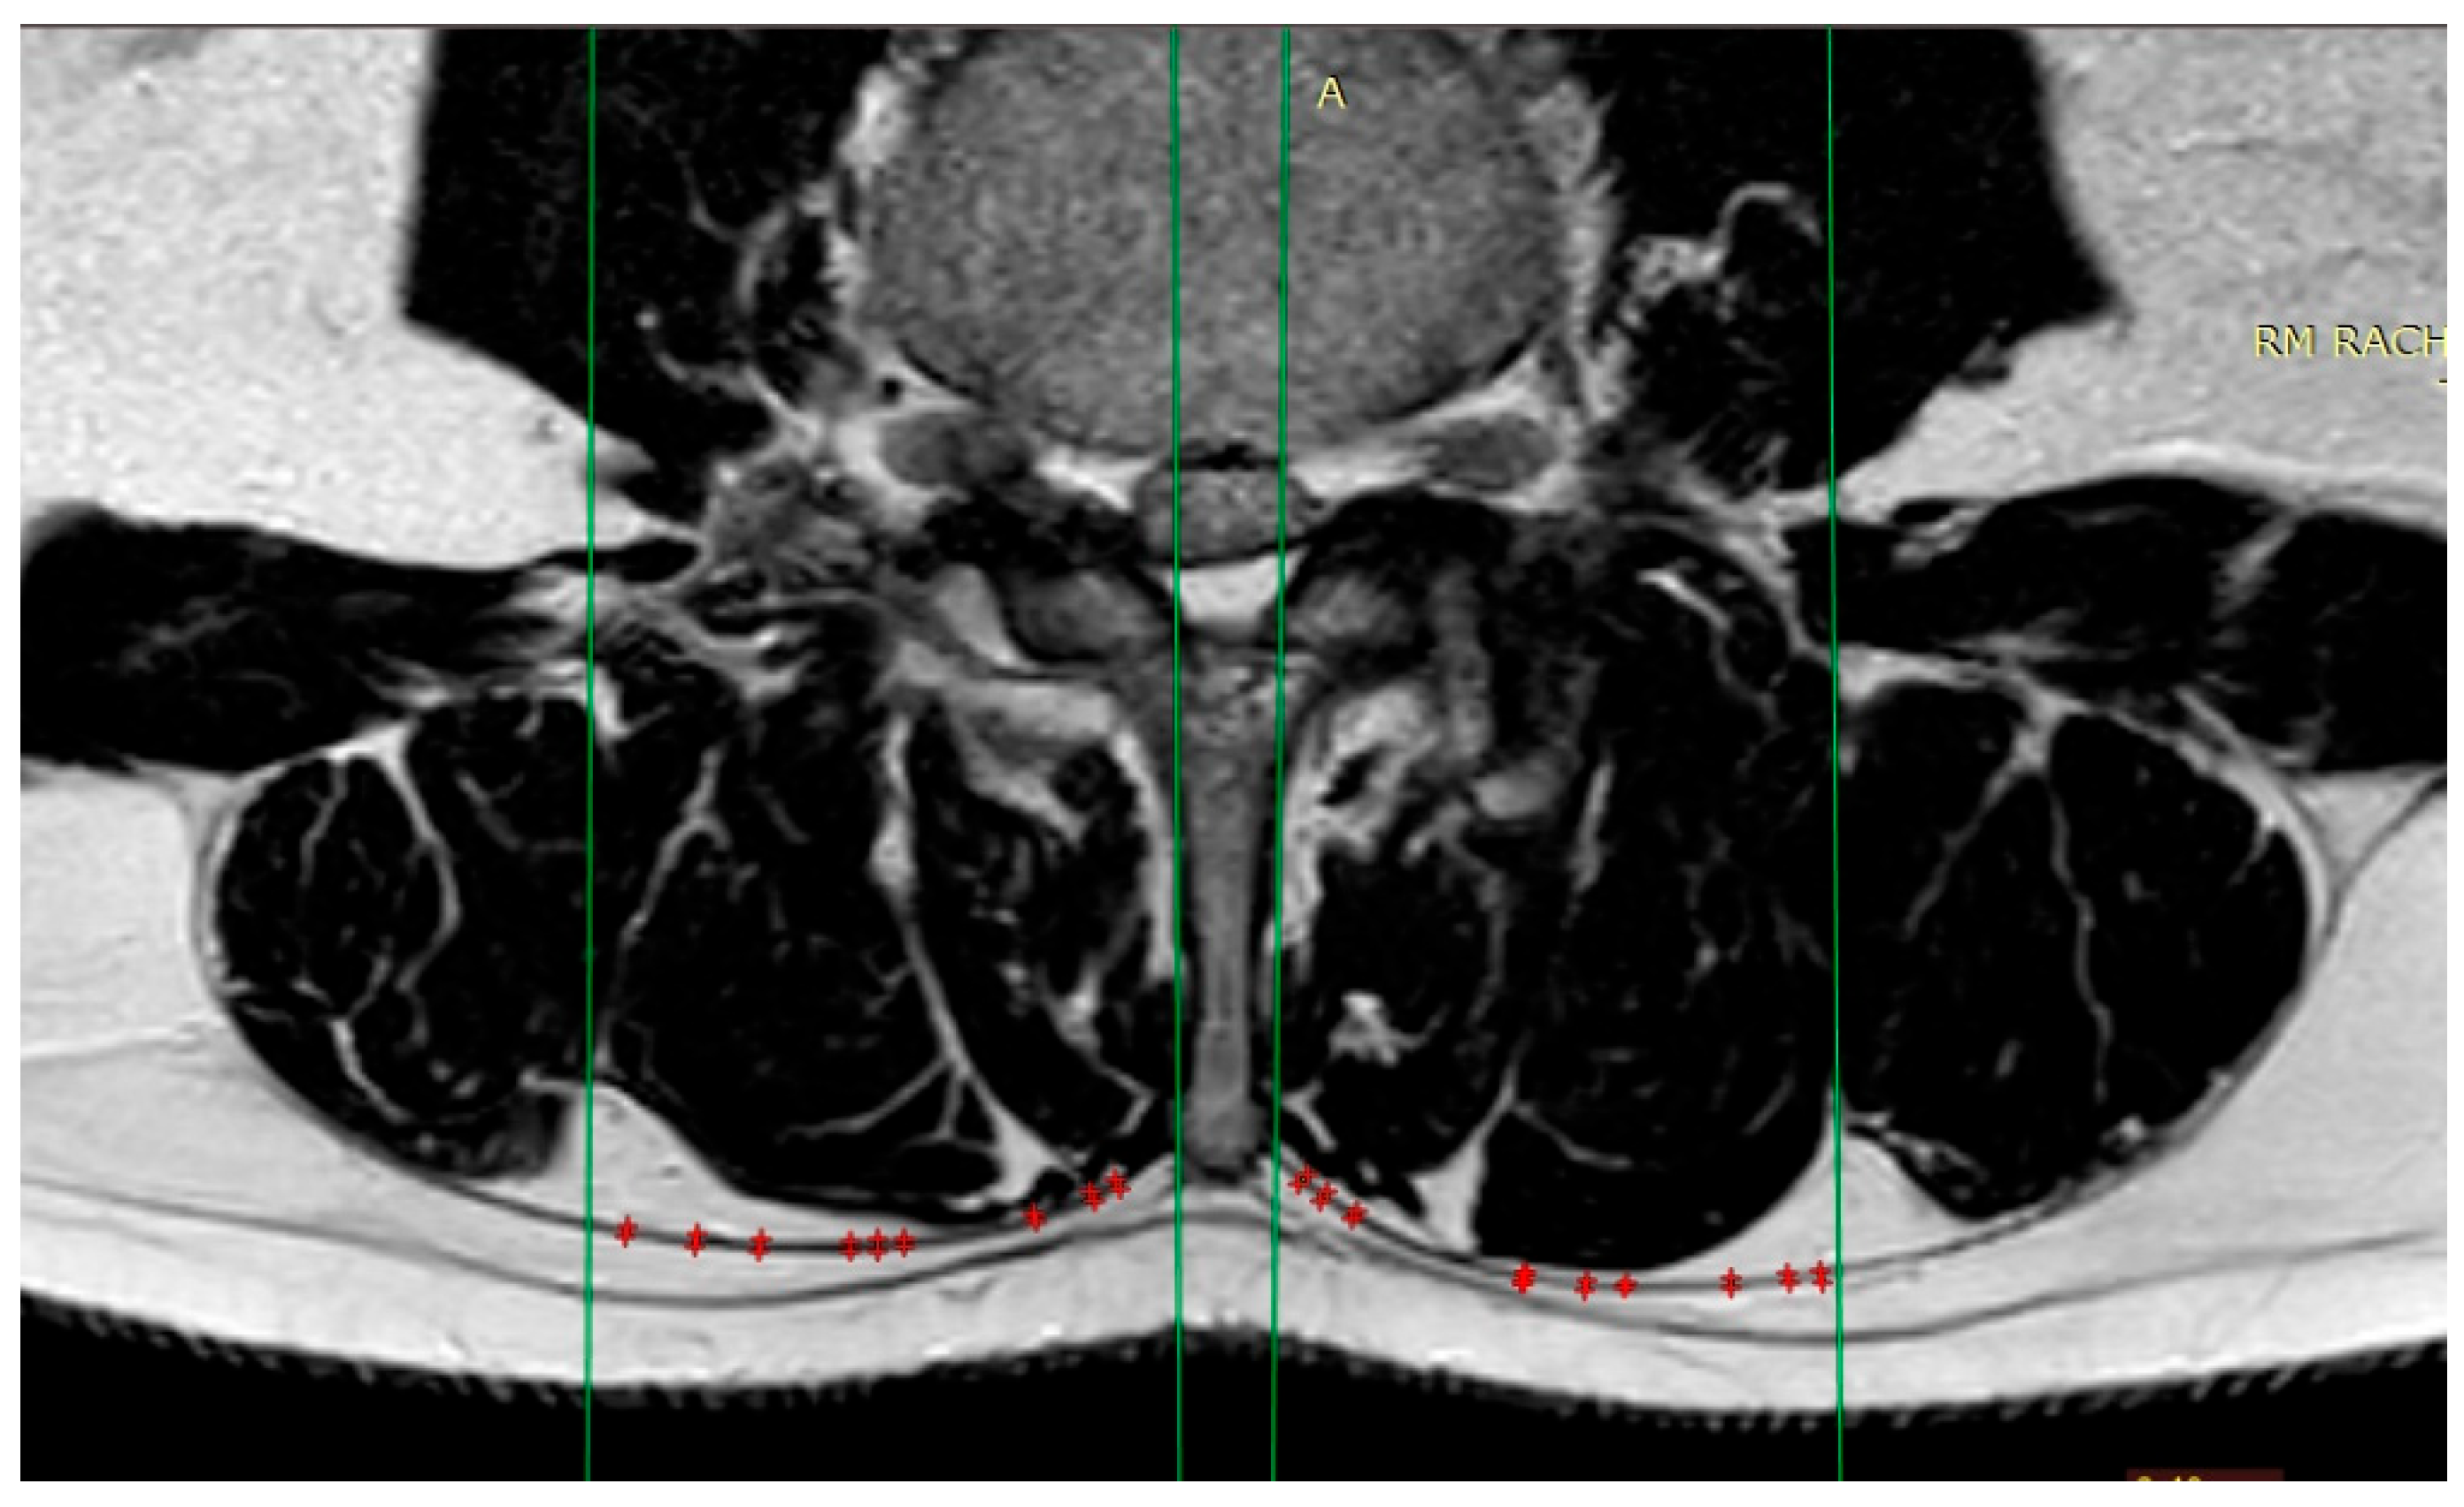
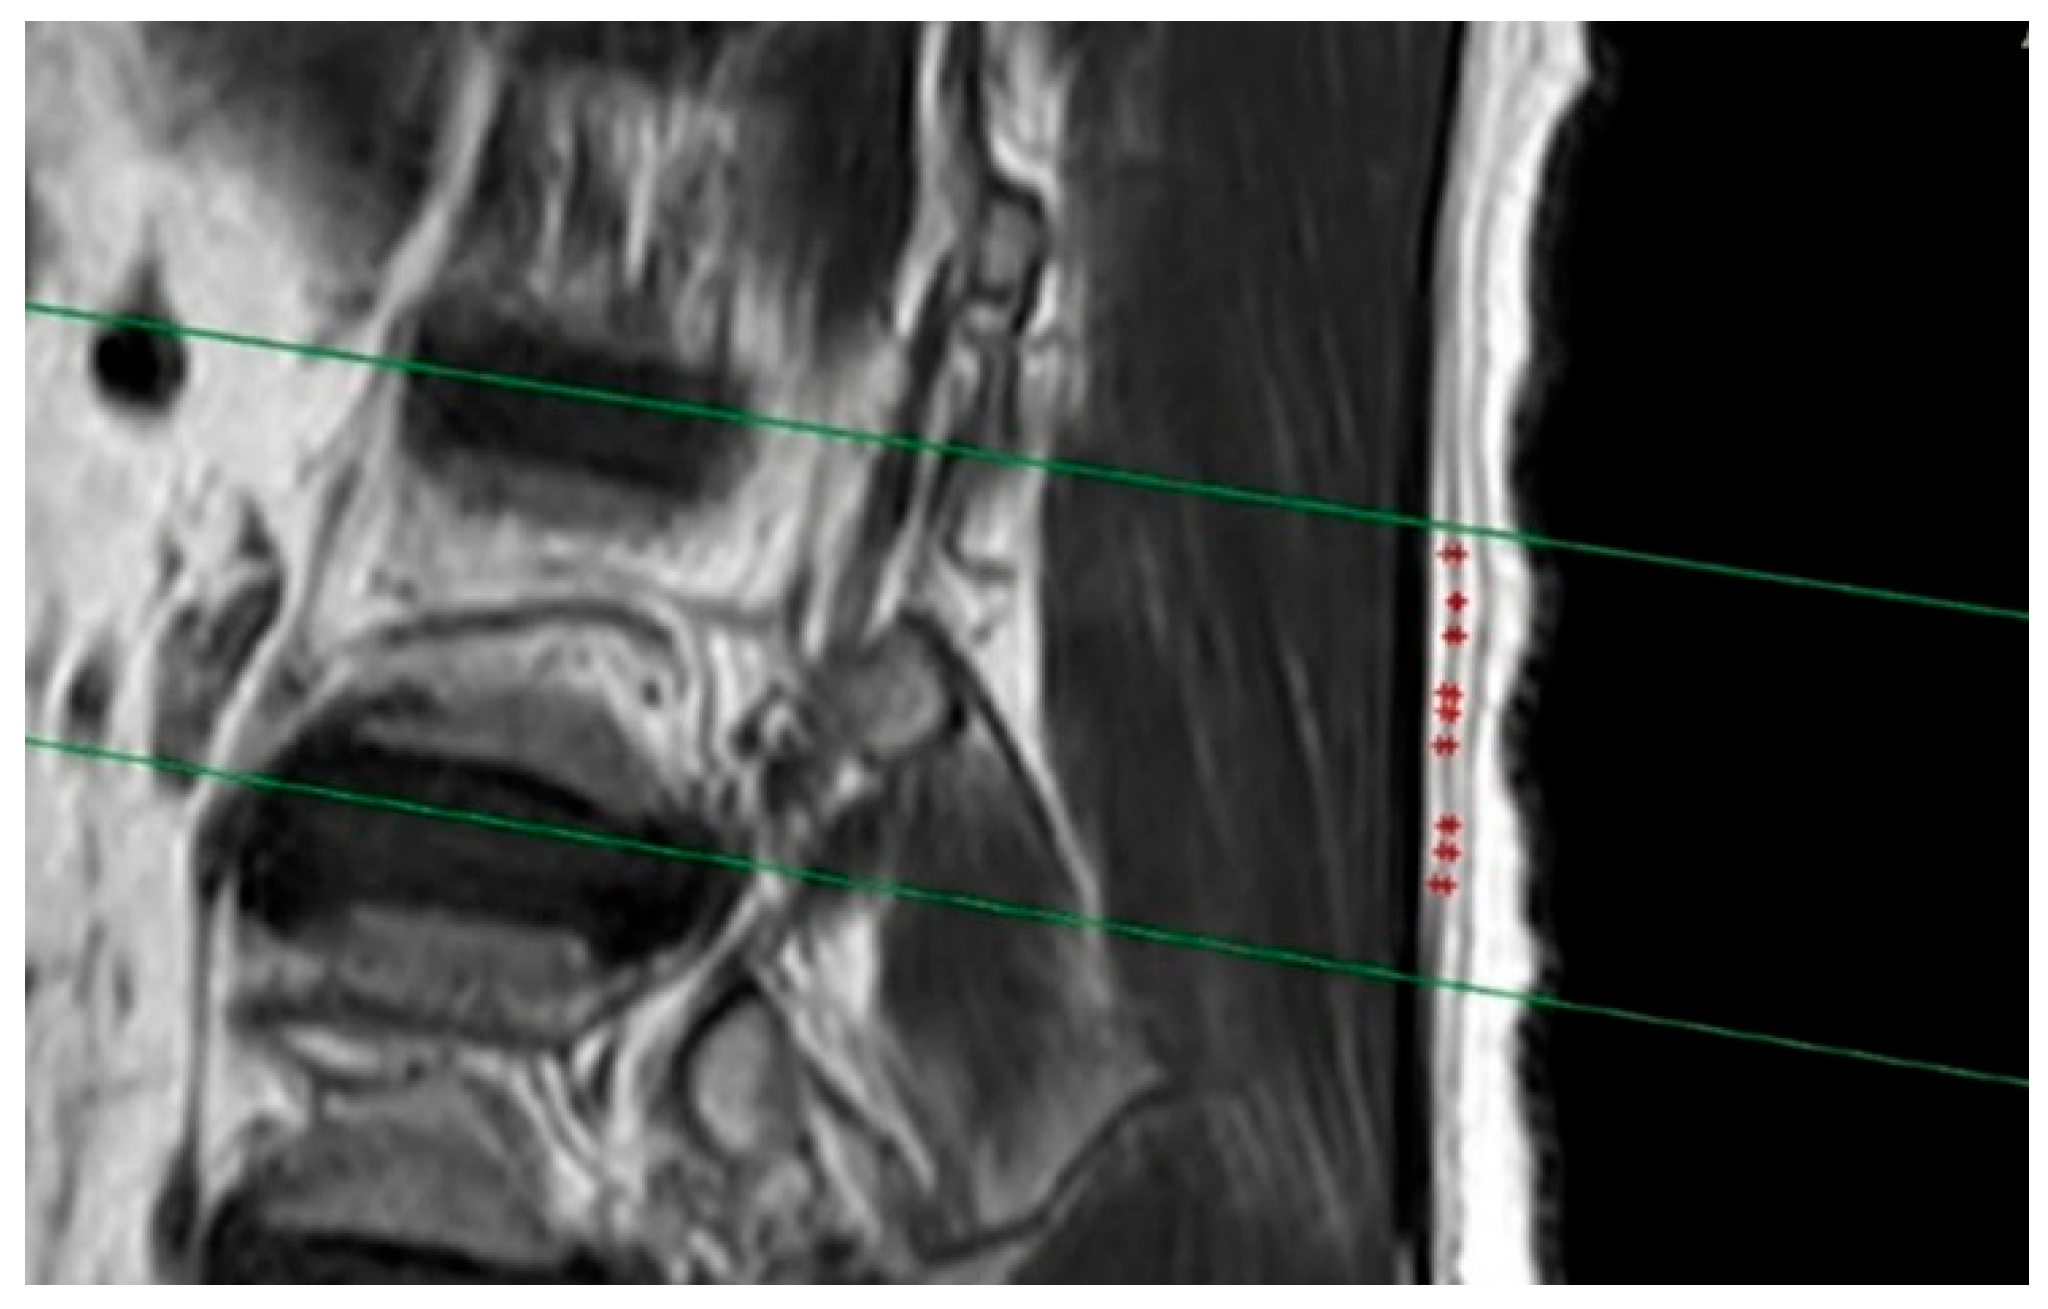
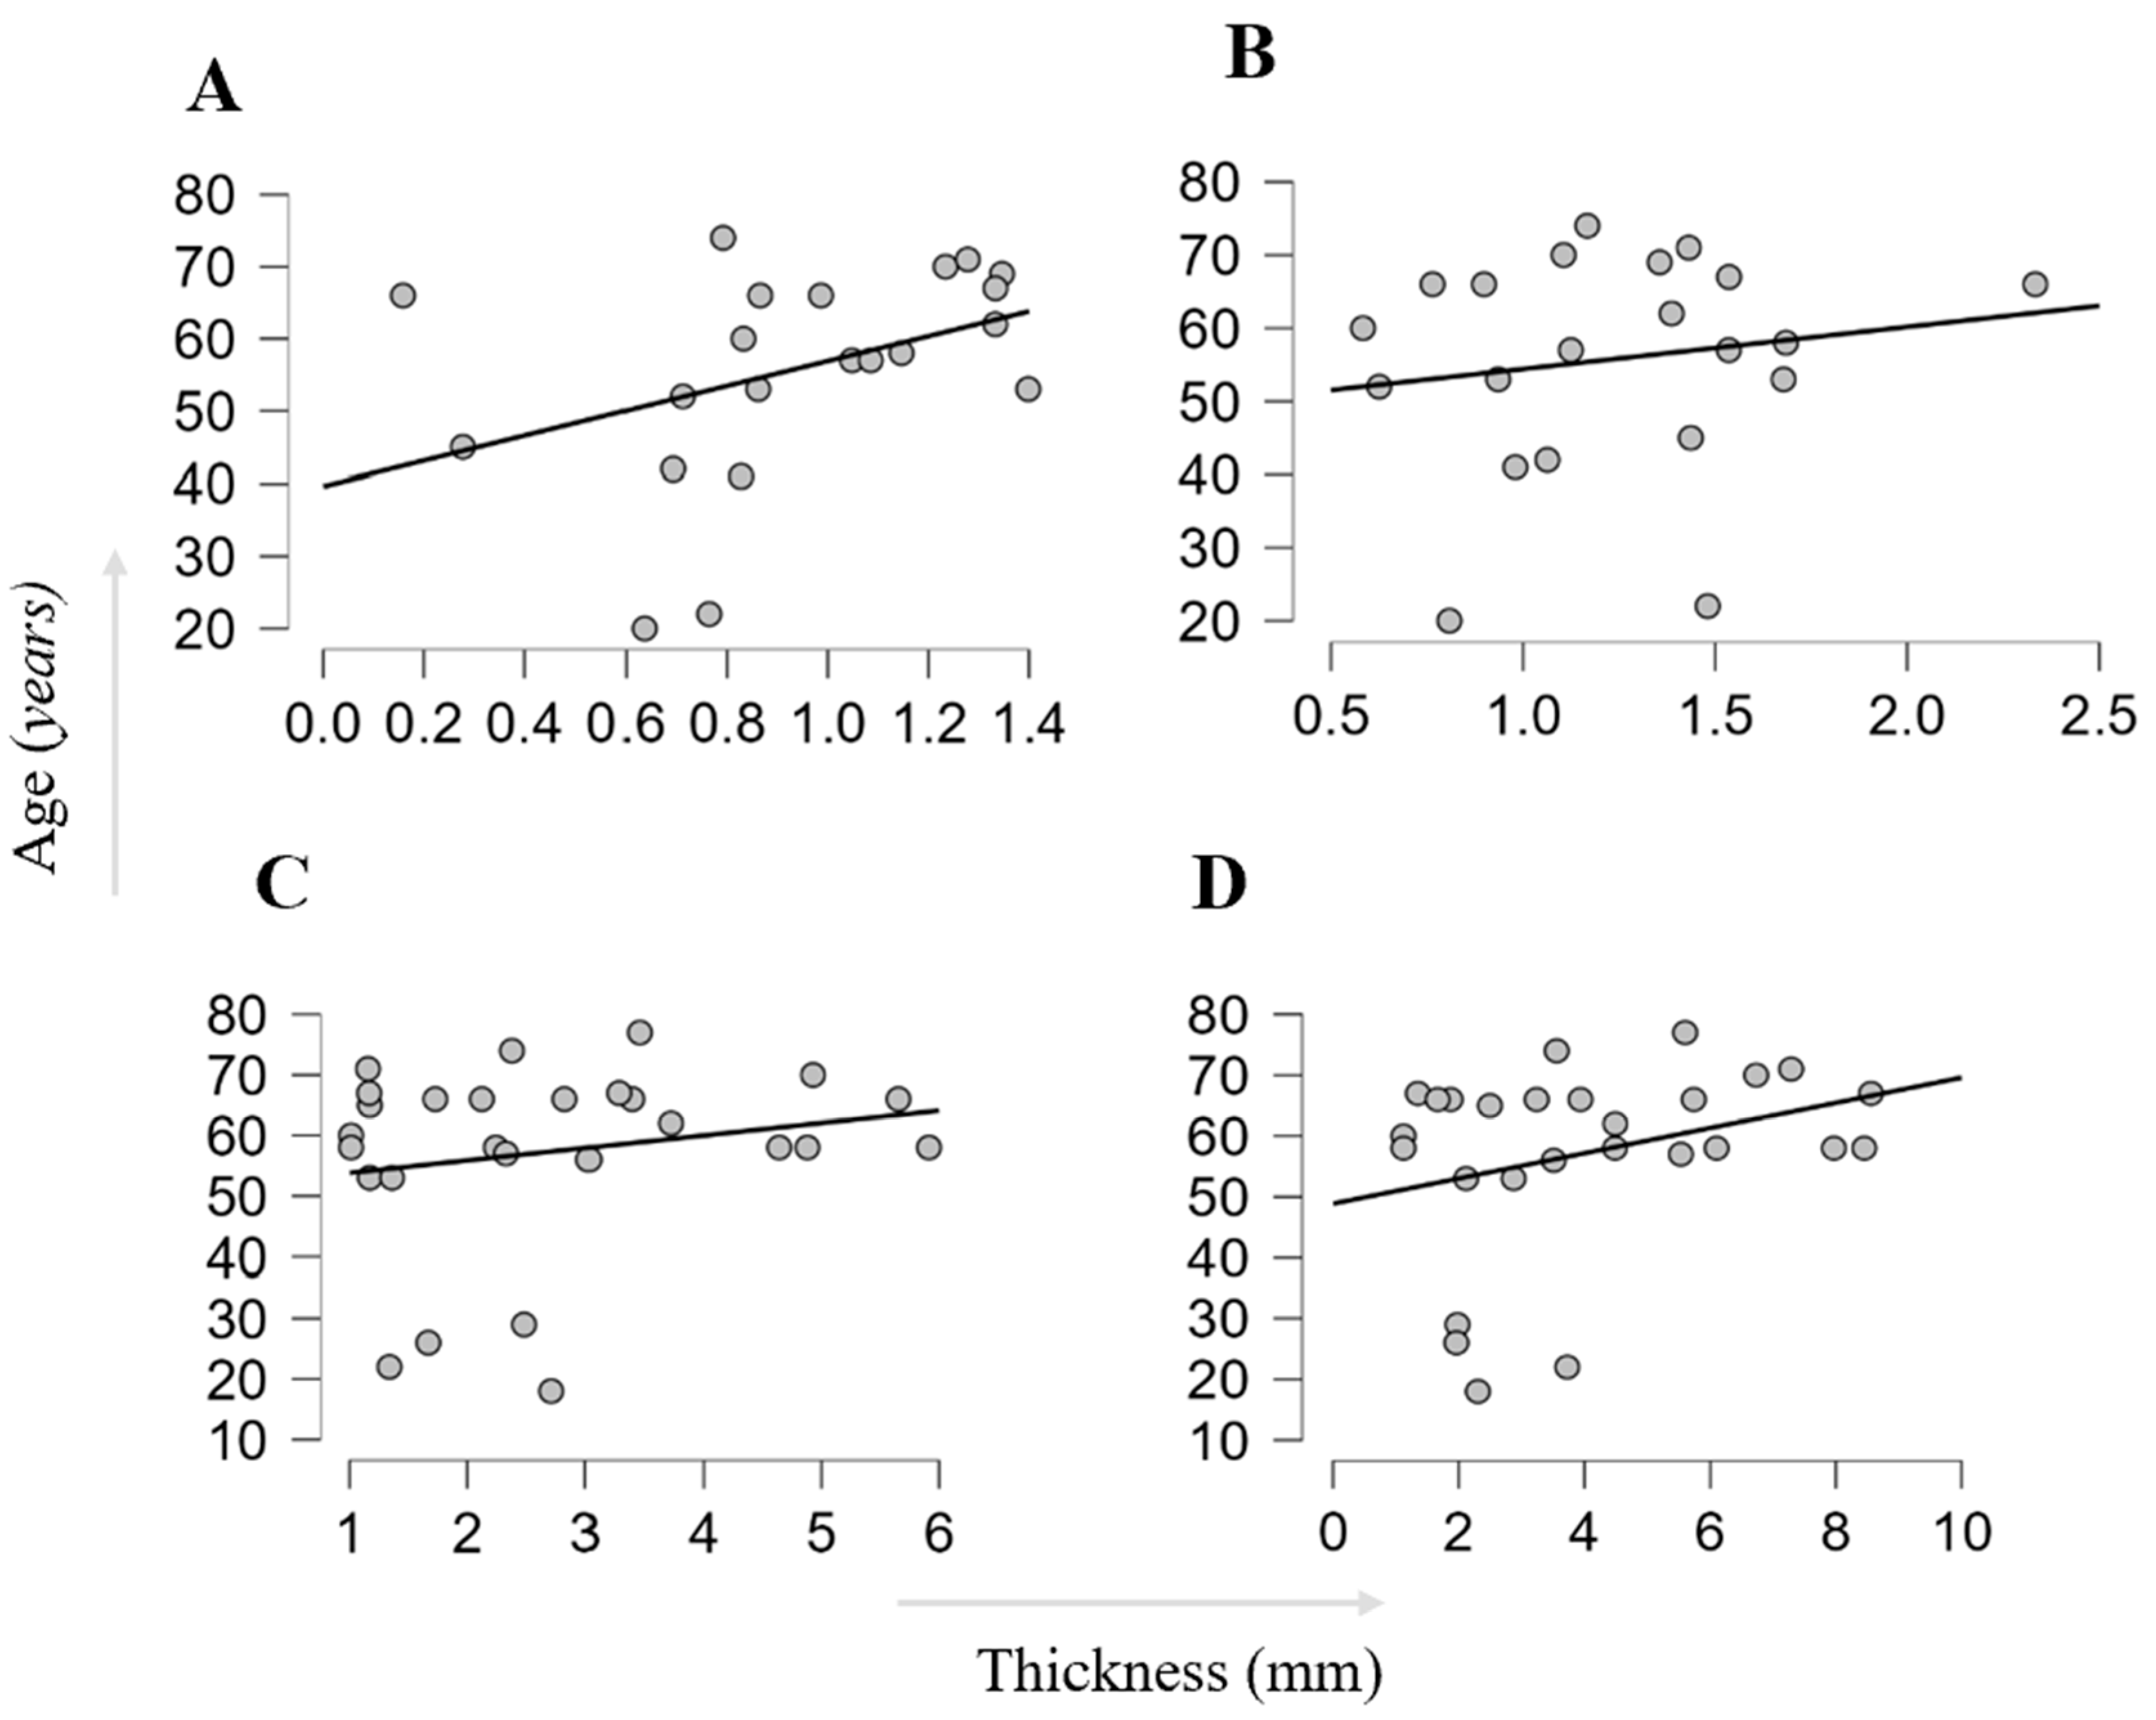
3.2. MRI-Derived TLF Thickness
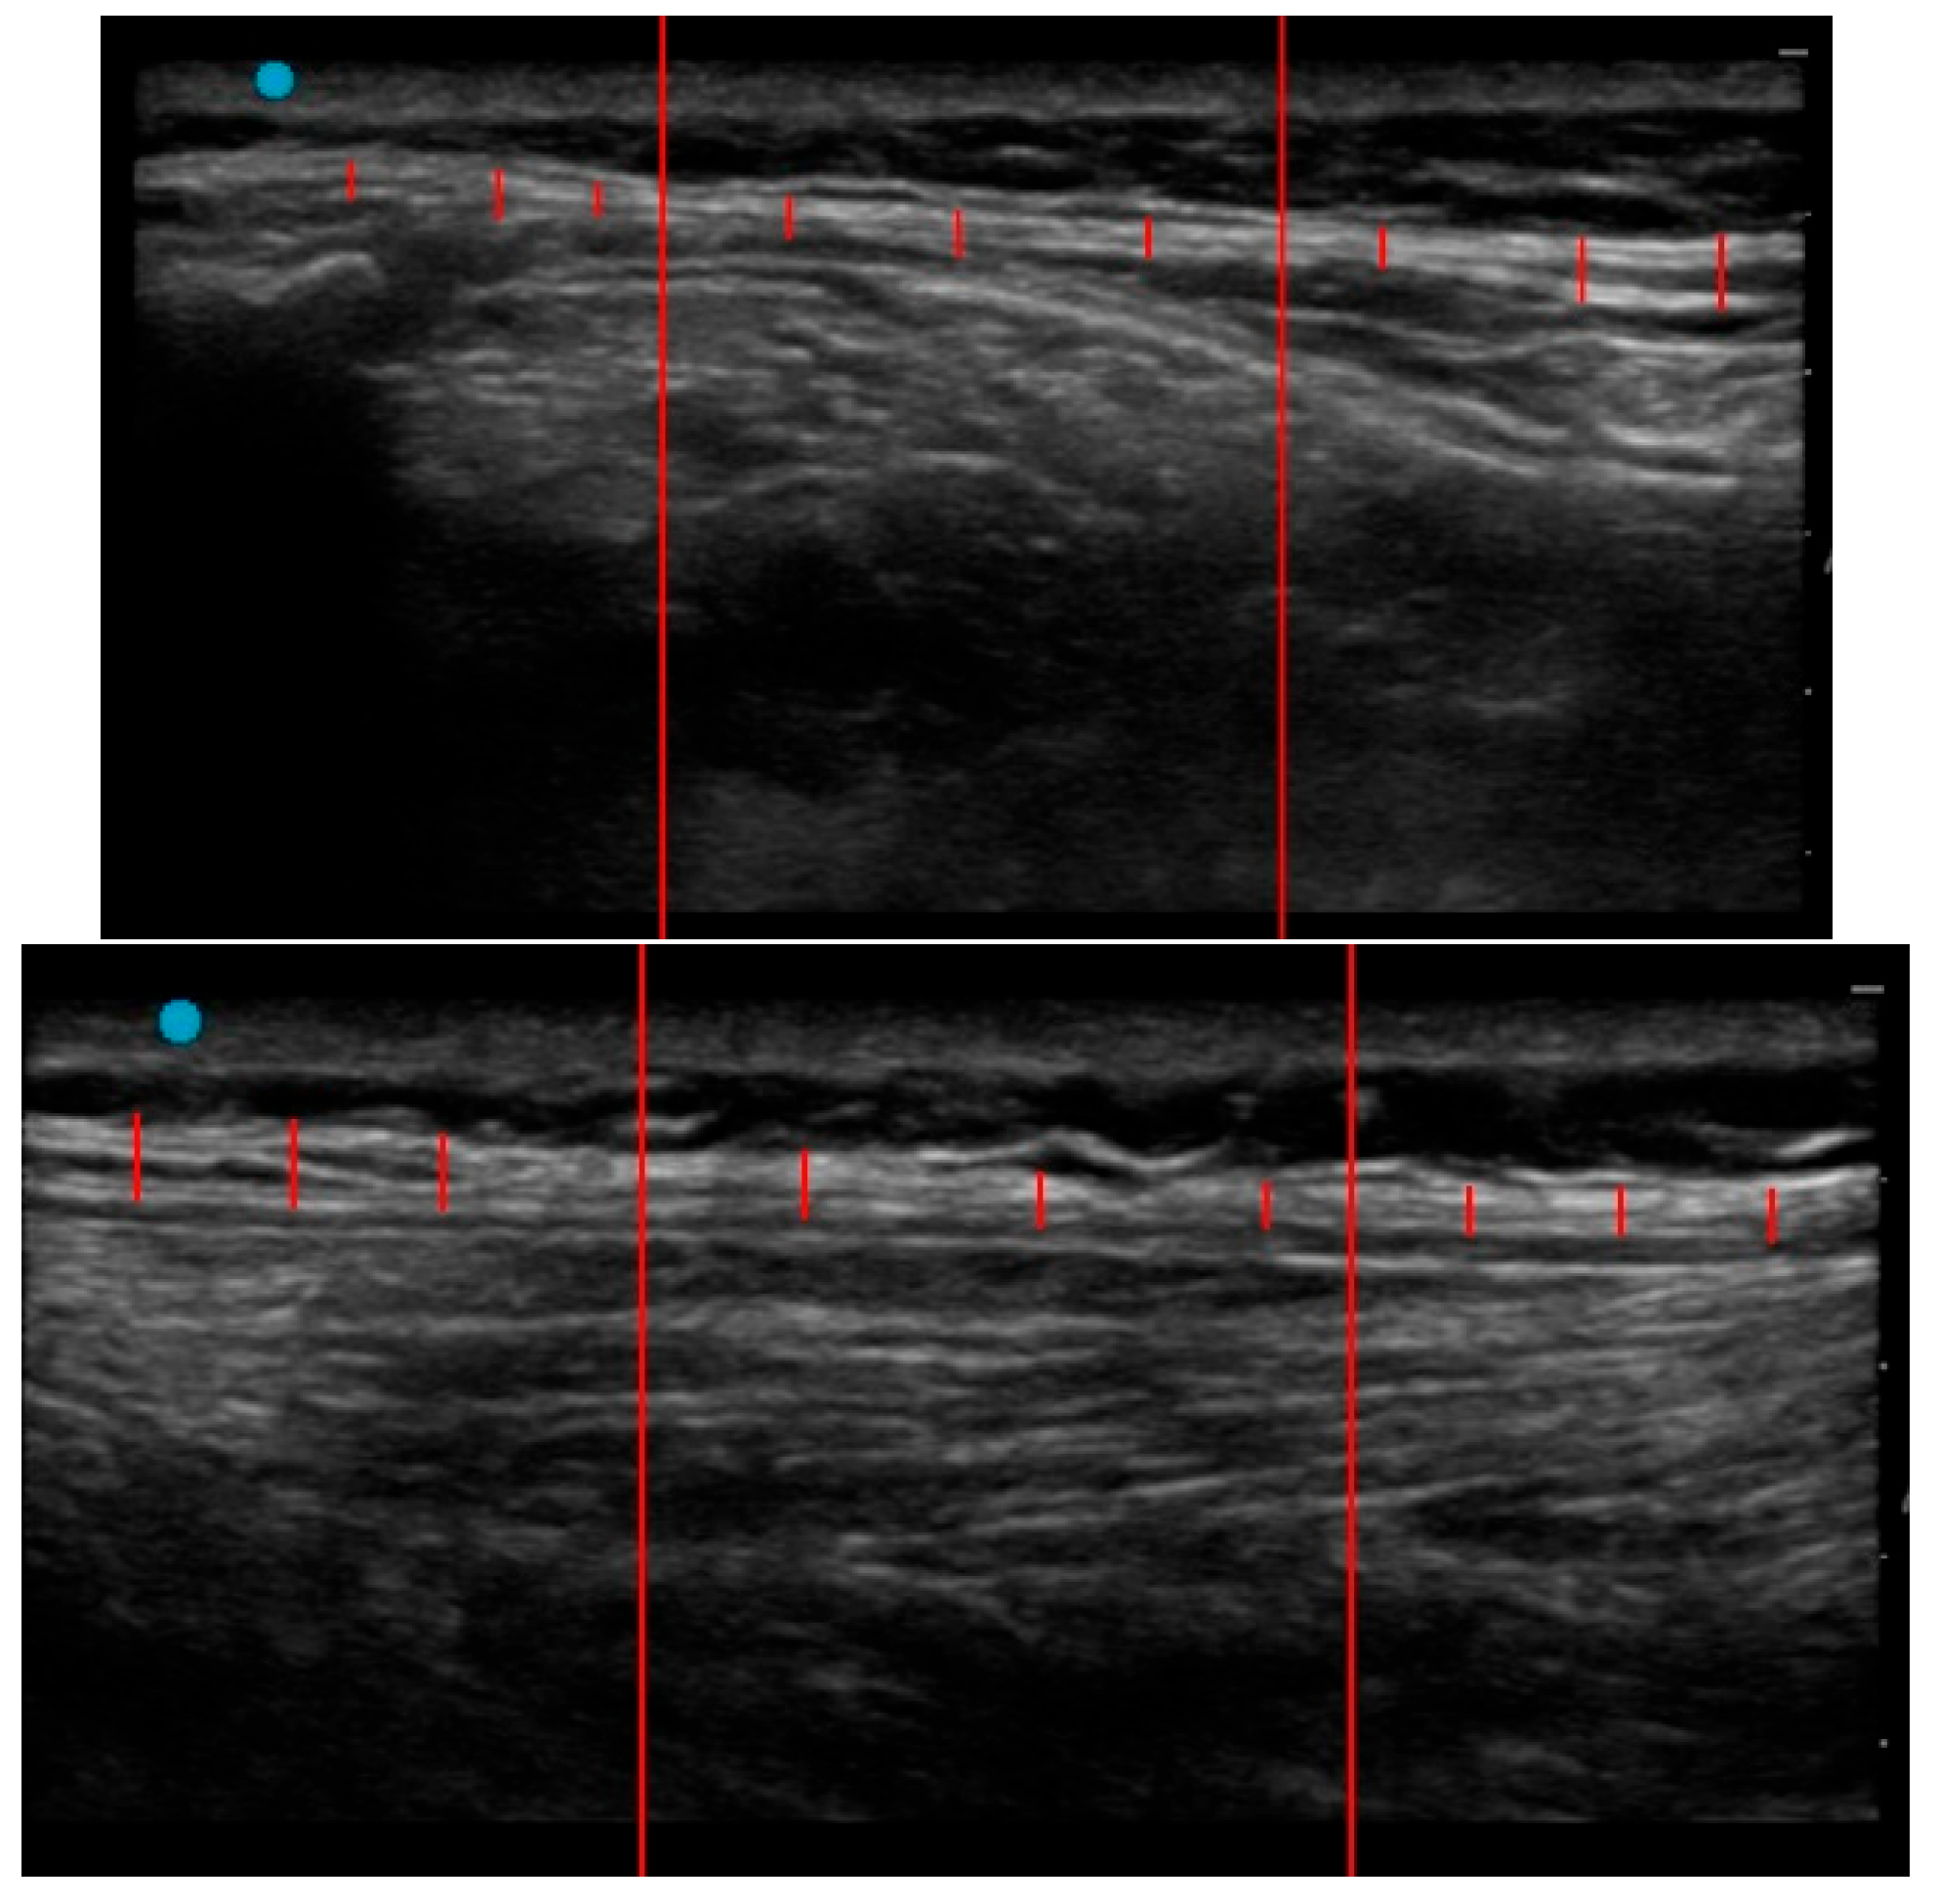
3.3. Ultrasound-Derived TLF Thickness
3.4. Inter-Method Comparison
3.5. Clinical Assessment
4. Discussion
5. Conclusions
Author Contributions
Funding
Institutional Review Board Statement
Informed Consent Statement
Data Availability Statement
Conflicts of Interest
References
- Hartvigsen, J.; Hancock, M.J.; Kongsted, A.; Louw, Q.; Ferreira, M.L.; Genevay, S.; Hoy, D.; Karppinen, J.; Pransky, G.; Sieper, J.; Smeets, R.J.; Underwood, M. Lancet Low Back Pain Series Working Group. What low back pain is and why we need to pay attention. Lancet 2018, 391, 2356–2367. [Google Scholar] [CrossRef]
- Ferreira, M.L.; De Luca, K.; Haile, L.M.; Steinmetz, J.D.; Culbreth, G.T.; Cross, M.; et al. Global, regional, and national burden of low back pain, 1990–2020, its attributable risk factors, and projections to 2050: a systematic analysis of the Global Burden of Disease Study 2021. Lancet Rheumatol 2023, 5, e316–e329. [Google Scholar] [CrossRef] [PubMed]
- Traeger, A.; Buchbinder, R.; Harris, I.; Maher, C. Diagnosis and management of low-back pain in primary care. CMAJ 2017, 189, E1386–E1395. [Google Scholar] [CrossRef] [PubMed]
- Deyo, R.A.; Weinstein, J.N. Low Back Pain. N Engl J Med 2001, 344, 363–370. [Google Scholar] [CrossRef] [PubMed]
- Andaloro, A. Lumbar spinal stenosis. JAAPA 2019, 32, 49–50. [Google Scholar] [CrossRef] [PubMed]
- Akuthota, V.; Lento, P.; Sowa, G. Pathogenesis of lumbar spinal stenosis pain: why does an asymptomatic stenotic patient flare? Phys Med Rehabil Clin N Am 2003, 14, 17–28. [Google Scholar] [CrossRef] [PubMed]
- Ansari, K.; Singh, M.; McDermott, J.R.; Gregorczyk, J.A.; Balmaceno-Criss, M.; Daher, M.; McDonald, C.L.; Diebo, B.G.; Daniels, A.H. Adolescent idiopathic scoliosis in adulthood. EFORT Open Rev 2024, 9, 676–684. [Google Scholar] [CrossRef]
- Brinjikji, W.; Luetmer, P.H.; Comstock, B.; Bresnahan, B.W.; Chen, L.E.; Deyo, R.A.; Halabi, S.; Turner, J.A.; Avins, A.L.; James, K.; Wald, J.T.; Kallmes, D.F.; Jarvik, J.G. Systematic literature review of imaging features of spinal degeneration in asymptomatic populations. AJNR Am J Neuroradiol 2015, 36, 811–6. [Google Scholar] [CrossRef] [PubMed]
- Benzakour, T.; Igoumenou, V.; Mavrogenis, A.F.; Benzakour, A. Current concepts for lumbar disc herniation. Int Orthop 2019, 43, 841–851. [Google Scholar] [CrossRef] [PubMed]
- Sekiguchi, M. The Essence of Clinical Practice Guidelines for Lumbar Spinal Stenosis, 2021: 1. Definition, Epidemiology, and Natural History. Spine Surg Relat Res 2023, 7, 298–299. [Google Scholar] [CrossRef] [PubMed]
- Benetazzo, L.; Bizzego, A.; De Caro, R.; Frigo, G.; Guidolin, D.; Stecco, C. 3D reconstruction of the crural and thoracolumbar fasciae. Surg Radiol Anat 2011, 33, 855–862. [Google Scholar] [CrossRef]
- Willard, F.H.; Vleeming, A.; Schuenke, M.D.; Danneels, L.; Schleip, R. The thoracolumbar fascia: anatomy, function and clinical considerations. J Anat 2012, 221, 507–536. [Google Scholar] [CrossRef] [PubMed]
- Schuenke, M.D.; Vleeming, A.; Van Hoof, T.; Willard, F.H. A description of the lumbar interfascial triangle and its relation with the lateral raphe: anatomical constituents of load transfer through the lateral margin of the thoracolumbar fascia. J Anat 2012, 221, 568–576. [Google Scholar] [CrossRef]
- Vleeming, A.; Pool-Goudzwaard, A.L.; Stoeckart, R.; Van Wingerden, J.P.; Snijders, C.J. The Posterior Layer of the Thoracolumbar Fascia|Its Function in Load Transfer From Spine to Legs. Spine 1995, 20, 753–758. [Google Scholar] [CrossRef]
- Tesarz, J.; Hoheisel, U.; Wiedenhöfer, B.; Mense, S. Sensory innervation of the thoracolumbar fascia in rats and humans. Neuroscience 2011, 194, 302–308. [Google Scholar] [CrossRef]
- Corey, S.M.; Vizzard, M.A.; Badger, G.J.; Langevin, H.M. Sensory innervation of the nonspecialized connective tissues in the low back of the rat. Cells Tissues Organs 2011, 194, 521–530. [Google Scholar] [CrossRef]
- Fede, C.; Petrelli, L.; Guidolin, D.; Porzionato, A.; Pirri, C.; Fan, C.; De Caro, R.; Stecco, C. Evidence of a new hidden neural network into deep fasciae. Sci Rep 2021, 11, 12623. [Google Scholar] [CrossRef] [PubMed]
- Yahia, L.; Rhalmi, S.; Newman, N.; Isler, M. Sensory innervation of human thoracolumbar fascia: An immunohistochemical study. Acta Orthop Scand 1992, 63, 195–197. [Google Scholar] [CrossRef]
- Mense, S.; Hoheisel, U. Evidence for the existence of nociceptors in rat thoracolumbar fascia. J Bodyw Mov Ther 2016, 20, 623–628. [Google Scholar] [CrossRef] [PubMed]
- Mense, S. Innervation of the thoracolumbar fascia. Eur J Transl Myol 2019, 29. [Google Scholar] [CrossRef] [PubMed]
- Hoheisel, U.; Mense, S. Inflammation of the thoracolumbar fascia excites and sensitizes rat dorsal horn neurons. Europ J Pain 2015, 19, 419–428. [Google Scholar] [CrossRef] [PubMed]
- Langevin, H.M.; Stevens-Tuttle, D.; Fox, J.R.; Badger, N.A.; Bouffard, N.A.; Krag, M.H.; Wu, J.; Henry, S.M. Ultrasound evidence of altered lumbar connective tissue structure in human subjects with chronic low back pain. BMC Musculoskelet Disord 2009, 10, 151. [Google Scholar] [CrossRef]
- Langevin, H.M.; Fox, J.R.; Koptiuch, C.; Badger, G.J.; Greenan-Naumann, A.C.; Bouffard, N.A.; Konofagou, E.E.; Lee, W.N.; Triano, J.J.; Henry, S.M. Reduced thoracolumbar fascia shear strain in human chronic low back pain. BMC Musculoskelet Disord 2011, 12, 203. [Google Scholar] [CrossRef]
- Pirri, C.; Pirri, N.; Guidolin, D.; Macchi, V.; Porzioanto, A.; De Caro, R.; Stecco, C. Ultrasound Imaging of Thoracolumbar Fascia Thickness: Chronic Non-Specific Lower Back Pain versus Healthy Subjects; A Sign of a “Frozen Back”? Diagnostics 2023, 13, 1436. [Google Scholar] [CrossRef] [PubMed]
- Pirri, C.; Pirri, N.; Macchi, V.; Porzionato, A.; De Caro, R.; Stecco, C. Ultrasound Imaging of Thoracolumbar Fascia: A Systematic Review. Medicina 2024, 60, 1090. [Google Scholar] [CrossRef]
- Fairbank, J.C.; Couper, J.; Davies, J.B.; O’Brien, J.P. The Oswestry low back pain disability questionnaire. Physiother 1980, 66, 271–273. [Google Scholar]
- Bonaldi, L.; Berardo, A.; Stecco, A.; Stecco, C.; Fontanella, C.G. Assessment of the Fascial System Thickness in Patients with and Without Low Back Pain: A Narrative Review. Diagnostics 2025, 15, 2059. [Google Scholar] [CrossRef] [PubMed]
- Saragiotto, B.T.; Maher, C.G.; Hancock, M.J.; Koes, B.W. Subgrouping Patients With Nonspecific Low Back Pain: Hope or Hype? J Orthop & Sports Physical Ther 2017, 47, 44–48. [Google Scholar]
- Wilke, J.; Schleip, R.; Klingler, W.; Stecco, C. The Lumbodorsal Fascia as a Potential Source of Low Back Pain: A Narrative Review. Biomed Res Int 2017, 2017, 5349620. [Google Scholar] [CrossRef]
- Caron, F.P.; Martin Smith, C.; Naghdi, N.; Iorio, O.C.; Bertrand, C.; Fortin, M. Morphological characteristics of the thoracolumbar fascia: relationship to chronic low back pain and back extension strength. Eur Spine J 2025, 34, 2562–2570. [Google Scholar] [CrossRef]
- Adamietz, B.; Schönberg, S.O.; Reiser, M.; Uder, M.; Frank, A.; Strecker, R.; Weiß, C.; Heiss, R. Visualization of the epimysium and fascia thoracolumbalis at the lumbar spine using MRI. Radiologe 2021, 61, 49–53. [Google Scholar] [CrossRef]
- Wilke, J.; Macchi, V.; De Caro, R.; Stecco, C. Fascia thickness, aging and flexibility: is there an association? J Anat 2019, 234, 43–49. [Google Scholar] [CrossRef] [PubMed]
- Serhal, A.; Adams, B.; Omar, I.; Deshmukh, S. Fascia lata attachment at the iliac crest: refining our diagnostic criteria of injury on magnetic resonance imaging. Br J Radiol 2020, 93, 20200187. [Google Scholar] [CrossRef]
- Pirri, C.; Pirri, N.; Guidolin, D.; De Rose, E.; Macchi, V.; Porzionato, A.; De Caro, R.; Stecco, C. The (ProteUS) Anisotropy Effect in Deep Fascia Ultrasonography: The Impact of Probe Angulation on Echogenicity and Thickness Assessments. Life (Basel) 2025, 15, 822. [Google Scholar] [CrossRef] [PubMed]
- Ponti, F.; De Cinque, A.; Fazio, N.; Napoli, A.; Guglielmi, G.; Bazzocchi, A. Ultrasound imaging, a stethoscope for body composition assessment. Quant Imaging Med Surg 2020, 10, 1699–1722. [Google Scholar] [CrossRef] [PubMed]
- Calle-Toro, J.S.; Maya, C.L.; Gorfu, Y.; Dunn, E.; Darge, K.; Back, S.J. Supine versus prone positioning for ultrasound evaluation of postnatal urinary tract dilation in children. Pediatr Radiol 2020, 50, 357–362. [Google Scholar] [CrossRef] [PubMed]
- Cronin, C.G.; Lohan, D.G.; Mhuircheartaigh, J.N.; McKenna, D.; Alhajeri, N.; Roche, C.; Murphy, J.M. MRI Small-Bowel Follow-Through: Prone Versus Supine Patient Positioning for Best Small-Bowel Distention and Lesion Detection. AJR Am J Roentgenol 2008, 191, 502–6. [Google Scholar] [CrossRef] [PubMed]
- Baad, M.; Lu, Z.F.; Reiser, I.; Paushter, D. Clinical Significance of US Artifacts. RadioGraphics 2017, 37, 1408–1423. [Google Scholar] [CrossRef]
- Zullo, A.; Fleckenstein, J.; Schleip, R.; Hoppe, K.; Wearing, S.; Klingler, W. Structural and Functional Changes in the Coupling of Fascial Tissue, Skeletal Muscle, and Nerves During Aging. Front Physiol 2020, 11, 592. [Google Scholar] [CrossRef]
- Cebula, A.; Cebula, M.; Czajkowska, M.; Gruszczyńska, K.; Kopyta, I. Influence of the physical pressure of an ultrasound probe on shear-wave elastography measurements of the gastrocnemius muscle in a paediatric population: a non-interventional cohort study. Pol J Radiol 2024, 89, e24–e29. [Google Scholar] [CrossRef] [PubMed]
- Sun, K.; Li, X.; Scherer, P.E. Extracellular Matrix (ECM) and Fibrosis in Adipose Tissue: Overview and Perspectives. Compr Physiol 2023, 13, 4387–4407. [Google Scholar] [CrossRef] [PubMed]
- Jha, D.K.; Wongkaewpotong, J.; Chuckpaiwong, B. Effect of Age and BMI on Sonographic Findings of Plantar Fascia. J Foot Ankle Surg 2023, 62, 125–128. [Google Scholar] [CrossRef]
- Neto Müller, J.; Lanferdini, F.J.; Passos Karam, J.Y.; de Brito Fontana, H. Examination of the confounding effect of subcutaneous fat on muscle echo intensity utilizing exogenous fat. Appl Physiol Nutr Metab 2021, 46, 473–478. [Google Scholar] [CrossRef] [PubMed]
- Uppot, R.N. Technical challenges of imaging & image-guided interventions in obese patients. Br J Radiol 2018, 91, 20170931. [Google Scholar] [PubMed]
- Canever, J.B.; Lanferdini, F.J.; de Moura, B.M.; Diefenthaeler, F.; Lima, K.M.M.E. Influence of subcutaneous adipose thickness and dominance on reliability of quadriceps muscle quality in healthy young individuals. J Ultrasound 2021, 25, 513–519. [Google Scholar] [CrossRef] [PubMed]

| Group by pathology | N | Age | Gender | BMI | ODI | |||
|---|---|---|---|---|---|---|---|---|
| Mean ± SD | Range | Male (%) | Mean ± SD | Range | Mean ± SD | Range | ||
| Spinal stenosis | 15 | 60.33± 10.03 |
29-70 | 53 | 26.26 ± 5.75 | 16.41-33.95 | 41.08 ± 10.44 | 24–62 |
| Disc herniation | 5 | 55.80± 16.73 | 42-74 | 80 | 26.31± 2.99 | 21.45- 29.39 |
60.00 ± 16.38 | 46–78 |
| Spondylolisthesis | 4 | 44.50 ± 16.73 | 26-58 | 50 | 30.25 ± 6.34 | 24.16-39.04 | 34.00 ± 16.38 | 16–48 |
| Scoliosis | 2 | 24.00 ± 8.49 | 18-30 | 50 | 24.10 ± 5.52 | 20.00-28.00 | n/a | n/a |
| Trauma | 2 | 21.00 ± 1.41 | 20-22 | 50 | 24.83 ±5.23 | 19.04-32.41 | n/a | n/a |
| Revision | 9 | 63.44± 7.18 | 56-77 | 44 | 30.67± 4.32 | 22.84 - 37.33 |
53.72 ± 23.90 | 24–92 |
| Total | 37 | 54.68 ±14.29 | 18-77 | 54 | 26.83 ± 7.04 | 16.41-39.04 | 45.84 ± 17.38 | 16–92 |
| TLF thickness on Axial Plane | TLF thickness on Sagittal Plane | |||||||
|---|---|---|---|---|---|---|---|---|
| Diagnosis | N | Median | Range | P-value | N | Median | Range | P-value |
| Spinal Stenosis | 11 | 0.99 | 0.75-1.35 | 0.01 | 11 | 1.36 | 0.47-2.33 | 0.744 |
| Spondylolisthesis | 2 | 1.11 | 0.83-1.40 | 2 | 0.96 | 0.94-0.98 | ||
| Lumbar Disc Herniation | 5 | 0.69 | 0.16-0.79 | 5 | 1.06 | 0.63-1.44 | ||
| Trauma | 2 | 0.70 | 0.64-0.76 | 2 | 1.14 | 0.81-1.48 | ||
| Revision | 4 | 1.18 | 1.02-1.33 | 3 | 1.39 | 1.12-1.48 | ||
| Scoliosis | 1 | 0.81 | n/a | n/a | 0 | n/a | n/a | n/a |
| Total | 25 | 0.86 | 0.16-1.40 | 23 | 1.12 | 0.47-2.33 | ||
| TLF thickness on Short Axis (mm) |
TLF thickness on Long Axis (mm) |
||||||||
|---|---|---|---|---|---|---|---|---|---|
| Diagnosis | N | Median | Range | P-value | N | Median | Range | P-value | |
| Spinal Stenosis | 13 | 2.48 | 1.01-5.91 | 0.231 | 9 | 2.12 | 1.12-4.49 | 0.130 | |
| Spondylolisthesis | 3 | 1.36 | 1.01-1.67 | 3 | 1.96 | 1.12-2.87 | |||
| Lumbar Disc Herniation | 2 | 2.25 | 2.13-2.38 | 2 | 2.61 | 1.66-3.56 | |||
| Revision | 7 | 3.03 | 1.16-5.65 | 5 | 5.53 | 3.24-5.75 | |||
| Scoliosis | 1 | 2.72 | n/a | n/a | 1 | 2.30 | n/a | n/a | |
| Trauma | 1 | 1.33 | n/a | n/a | 1 | 3.72 | n/a | n/a | |
| Total | 26 | 2.38 | 1.01-5.91 | 27 | 3.56 | 1.12-8.56 | |||
| Mean | Standart Deviation | Median (mm) | Range (mm) | |
|---|---|---|---|---|
| MRI axial | 0.89 | 0.33 | 0.89 | 0.16–1.40 |
| MRI sagittal | 1.16 | 0.48 | 1.16 | 0.47–2.33 |
| US short axis | 2.53 | 1.44 | 2.24 | 1.01–5.91 |
| US long axis | 2.49 | 1.14 | 2.12 | 1.12–4.49 |
Disclaimer/Publisher’s Note: The statements, opinions and data contained in all publications are solely those of the individual author(s) and contributor(s) and not of MDPI and/or the editor(s). MDPI and/or the editor(s) disclaim responsibility for any injury to people or property resulting from any ideas, methods, instructions or products referred to in the content. |
© 2026 by the authors. Licensee MDPI, Basel, Switzerland. This article is an open access article distributed under the terms and conditions of the Creative Commons Attribution (CC BY) license.


