
Submitted:
03 November 2025
Posted:
04 November 2025
You are already at the latest version
Abstract
Background: Transforaminal endoscopic lumbar discectomy (TELD) is a minimally invasive procedure that enables rapid recovery for symptomatic lumbar disc herniations. However, early postoperative pain trajectories and their prognostic value remain insufficiently characterized. Methods: A multicenter retrospective cohort study was conducted in 97 patients (104 levels) who underwent TELD between 2021 ‐ 2024 at 11 spine‐specialized centers. Patient‐reported outcomes (Visual Analog Scale [VAS] for low back and leg pain; Oswestry Disability Index [ODI]) were collected preoperatively and serially through postoperative day (POD) 180 using a validated mobile platform (SPINEhealthie). A ≥30% ODI improvement at final follow‐up defined a good outcome. Comparisons were performed using repeated‐measures ANOVA and receiver operating characteristic (ROC) analyses. Results: Mean age was 54.1 ± 1.5 years; 55.7% were male. Overall, 69.1% of our patients achieved good outcomes. LBP and leg pain improved significantly by POD1 (VAS‐LBP: 6.0; 3.8, respectively. p<0.001; VAS‐leg: 6.7;2.9, respectively. p<0.001), while ODI improved gradually through POD90 (p<0.001). Foraminal herniations showed worse outcomes (46.1% good) compared to central/paracentral lesions (84.2%, p<0.001). Early reduction in leg pain correlated with short‐term success (AUC=0.717; cutoff −2.75, sensitivity 70.0%, specificity 68.2%). In foraminal LDH, both leg pain and ODI improvements at POD1 predicted good outcomes (AUC=0.726 and 0.700, respectively). Conclusions: TELD provides rapid relief of pain and functional improvement. Early postoperative reduction in leg pain, particularly within the first 24 hours, is a fair predictor of midterm recovery. Mobile app‐based outcome tracking enables early identification of patients at risk for poor recovery and may inform timely postoperative interventions.
Keywords:
transforaminal endoscopic discectomy
; lumbar disc herniation
; early outcomes
; leg pain
; Oswestry Disability Index
; prognostic factors
; remote patient monitoring
1. Introduction
Lumbar disc herniation (LDH) is a common spinal disorder characterized by low back pain (LBP), radiating leg pain, or both and the condition often leads to significant limitations in activities of daily living. [1] When conservative treatment fails to provide sufficient relief, surgical intervention is considered. [2] Although traditional open surgery was once the standard approach, recent advancements in minimally invasive techniques have led to improved patient satisfaction and earlier return to work and daily life. [3,4,5,6] Among these, full-endoscopic spine surgery has garnered attention for its ability to be performed under local anesthesia, its minimal invasiveness to surrounding soft tissues, and its rapid postoperative recovery. [7,8,9,10] In particular, the transforaminal approach allows access to the herniated disc via the intervertebral foramen, preserving structures such as the lamina and ligamentum flavum, and contributing to the growing practice of 1-day surgeries in the field of orthopedic spine surgery.
Moreover, since the onset of the COVID-19 pandemic, there has been a societal shift toward improved accessibility to healthcare services, including the widespread adoption of remote consultations and mobile applications for postoperative pain assessment and follow-up. [11,12,13,14,15,16] These tools have enabled more continuous and quantitative monitoring of postoperative recovery from an earlier stage, thereby increasing the importance of evaluating outcomes and predicting prognosis during the acute postoperative period.
However, postoperative trajectories of low back pain, leg pain, and functional recovery after LDH surgery vary substantially among individuals. Prior studies have identified factors such as patient age, herniation morphology, and anesthesia type as potential determinants of outcome. Nevertheless, the relationship between acute postoperative changes in pain and disability and subsequent short-term recovery remains poorly defined, and the specific predictors of suboptimal outcomes, particularly in foraminal herniations, have not been fully elucidated.
In this study, we retrospectively analyzed cases of transforaminal endoscopic lumbar discectomies (TELD) to evaluate the progression of low back and leg pain, and lumbar function from the preoperative period through the acute and early postoperative phases. We aimed to determine the correlation between acute postoperative trends and short-term clinical outcomes, and to identify clinical characteristics associated with poor surgical outcomes.
2. Materials and Methods
2.1. Patient Enrollment and Data Acquisition
This multicenter retrospective study included patients aged 18 years or older who underwent TELD between March 2021 and June 2024 for LDH. Ethical approval was obtained from the Institutional Review Boards of all participating centers. Informed consent was secured from each patient after thorough explanation of the procedure, associated risks and benefits, and the option to withdraw at any time. All surgeries were carried out at 11 surgeons proficient in TELD in multi spine-specialized institutions by. The procedure was defined as uniportal endoscopic discectomy employing an integrated system consisting of a light source, camera, and irrigation. Patient-reported outcome measures (PROMs) were collected both preoperatively and postoperatively using the validated SPINEhealthie mobile application.
2.2. Surgical Indications and Preoperative Management
Patients presented with LBP and radicular symptoms including leg pain, paresthesia, or muscle weakness attributed to nerve root compression by herniated intervertebral discs. In the absence of acute neurologic deficits, patients were required to complete a minimum 3-month course of conservative therapy, which included non-steroidal anti-inflammatory drugs (NSAIDs), oral analgesics, and physical rehabilitation. For cases with ambiguous clinical or imaging findings, selective nerve root blocks were administered for diagnostic clarification. Exclusion criteria included interlaminar endoscopic procedures, and cases where detailed PROMs could not be collected via smartphone application.
2.3. Radiological Assessment and Classification
LDHs were subtyped into 3 groups according to the location of herniated disc by magnetic resonance imaging (MRI) in central disc herniation, paracentral disc herniation, and foraminal disc herniation.
2.4. Surgical Technique
All TELD procedures were performed following established protocols. Patients were positioned either prone under general anesthesia or in the lateral decubitus position under conscious sedation. The trajectory was planned using anteroposterior fluoroscopy at a 15° angle, with a skin entry point 8–10 cm off midline, adjusted to the spinous process projection in lateral view. After an 8-mm skin incision, a Jamshidi needle was advanced to the lateral aspect of the superior articular process (SAP) under fluoroscopic guidance. Serial dilation and trephine use allowed partial resection of the SAP to create the working channel. The ligamentum flavum was dissected from its ventromedial insertion on the SAP to expose the lateral recess. For ventral lesions, the nerve root was gently retracted, and compressive disc fragment were resected with a punch. All patients were discharged on the day of surgery and encouraged to resume daily activities as tolerated.
2.5. Statistical Analysis
Statistical analyses were conducted using IBM SPSS Statistics version 26.0. Continuous data were expressed as mean ± standard error of the mean (SEM), while categorical variables were presented as frequencies and percentages. Depending on the distribution, comparisons of continuous variables were performed using either the Student’s t-test or the Mann–Whitney U test. Categorical data were compared using the χ² test or Fisher’s exact test. Repeated measures were analyzed using one-way ANOVA. A p-value < 0.05 was considered statistically significant. Patients who completed VAS assessments within 14 days and at either 3 or 6 months postoperatively were included in this study. A good outcome was defined as a ≥30% improvement in the Oswestry Disability Index (ODI) from baseline, while cases with <30% improvement were classified as poor outcomes.
3. Results
3.1. Patient Demographics in the Entire Cohort (Table 1)
A total of 97 patients were included in this study. The mean age was 54.1 ± 1.5 years, with 54 male patients (55.7%) and 43 female patients (44.3%). The mean BMI was 31.0 ± 0.8 kg/m². A total of 104 discs were treated, including seven cases (7.2%) involving two intervertebral levels. The most frequently affected level was L4/5 (57 discs, 54.8%), followed by L5/S1 (24 discs, 23.1%) and L3/4 (14 discs, 13.5%). The most common type of herniation was paracentral (51 cases, 52.6%), followed by foraminal (39 cases, 40.2%) and central (6 cases, 6.2%); in one case (1.0%), the herniation could not be classified. No segmental instability was observed. The mean duration of symptoms before surgery was 14.2 ± 1.7 months. There were 27 revision surgeries (27.8%). General anesthesia was used in 61 cases (62.9%), and local anesthesia in 36 cases (37.2%). The average operative time was 73.7 ± 5.4 minutes, and the mean blood loss was 5.5 ± 0.7 ml. No intraoperative complications such as dural tears, postoperative CSF leakage, or nerve root injuries were observed. The average follow-up period was 5.0 ± 1.0 months.

Table 1.
Demographic and surgical characteristics of patients who underwent transforaminal endoscopic lumbar discectomy (TELD).
Table 1.
Demographic and surgical characteristics of patients who underwent transforaminal endoscopic lumbar discectomy (TELD).
| Number of cases | Total | Good outcome | Poor outcome | p-value |
| 97 | 67 (69.1 %) | 30 (30.1 %) | ||
| Age (years) | 54.1 ± 1.5 | 53.4 ± 1.9 | 55.5 ± 2.3 | 0.526 |
| Gender | 0.757 | |||
| Male | 54 (55.7 %) | 38 (56.7 %) | 16 (53.3 %) | |
| Female | 43 (44.3 %) | 29 (43.3 %) | 14 (46.7 %) | |
| BMI (kg/m2) | 31.0 ± 0.8 | 30.6 ± 1.0 | 31.8 ± 1.6 | 0.510 |
| Level | ||||
| L1/2 | 2 (1.9 %) | 2 (2.8 %) | 0 (0 %) | 1.000 |
| L2/3 | 7 (6.7 %) | 4 (5.6 %) | 3 (9.4 %) | 0.673 |
| L3/4 | 14 (13.5 %) | 10 (13.9 %) | 4 (12.5 %) | 1.000 |
| L4/5 | 57 (54.8 %) | 42 (58.3 %) | 15 (46.9 %) | 0.241 |
| L5/S1 | 24 (23.1 %) | 14 (19.4 %) | 10 (31.3 %) | 0.189 |
| Total number | 104 | 72 | 32 | |
| More than 2 levels | 7 (7.2 %) | 5 (7.5 %) | 2 (6.7 %) | 1.000 |
| Location of disc herniation | ||||
| Central | 6 (6.2 %) | 5 (7.5 %) | 1 (3.3 %) | 0.663 |
| Paracentral | 51 (52.6 %) | 43 (64.1 %) | 8 (26.7 %) | 0.001 |
| Foraminal | 39 (40.2 %) | 18 (26.9 %) | 21 (70.0 %) | <0.001 |
| Missing | 1 (1.0 %) | 1 (1.5 %) | 0 (0 %) | 1.000 |
| Intervertebral Instability | 0 | 0 | 0 | |
| Duration of symptoms (months) | 14.2 ± 1.7 | 14.3 ± 2.2 | 13.9 ± 2.3 | 0.909 |
| Revision surgery | 27 (27.8 %) | 16 (23.9 %) | 11 (36.7 %) | 0.194 |
| Anesthesia | 0.008 | |||
| General | 61 (62.9 %) | 48 (71.6 %) | 13 (43.3 %) | |
| Local | 36 (37.2 %) | 19 (28.4 %) | 17 (56.7 %) | |
| OP time (min) | 73.7 ± 5.4 | 79.5 ± 6.5 | 60.8 ± 9.6 | 0.112 |
| Blood loss (g) | 5.5 ± 0.7 | 6.2 ± 0.9 | 4.0 ± 0.9 | 0.146 |
| Perioperative complication | 0 | 0 | 0 | |
|
Duration of follow-up (months) |
5.0 ± 0.1 | 5.0 ± 0.2 | 4.9 ± 0.3 | 0.826 |
3.2. Postoperative Course in the Entire Cohort (Table 2 and Figure 1)
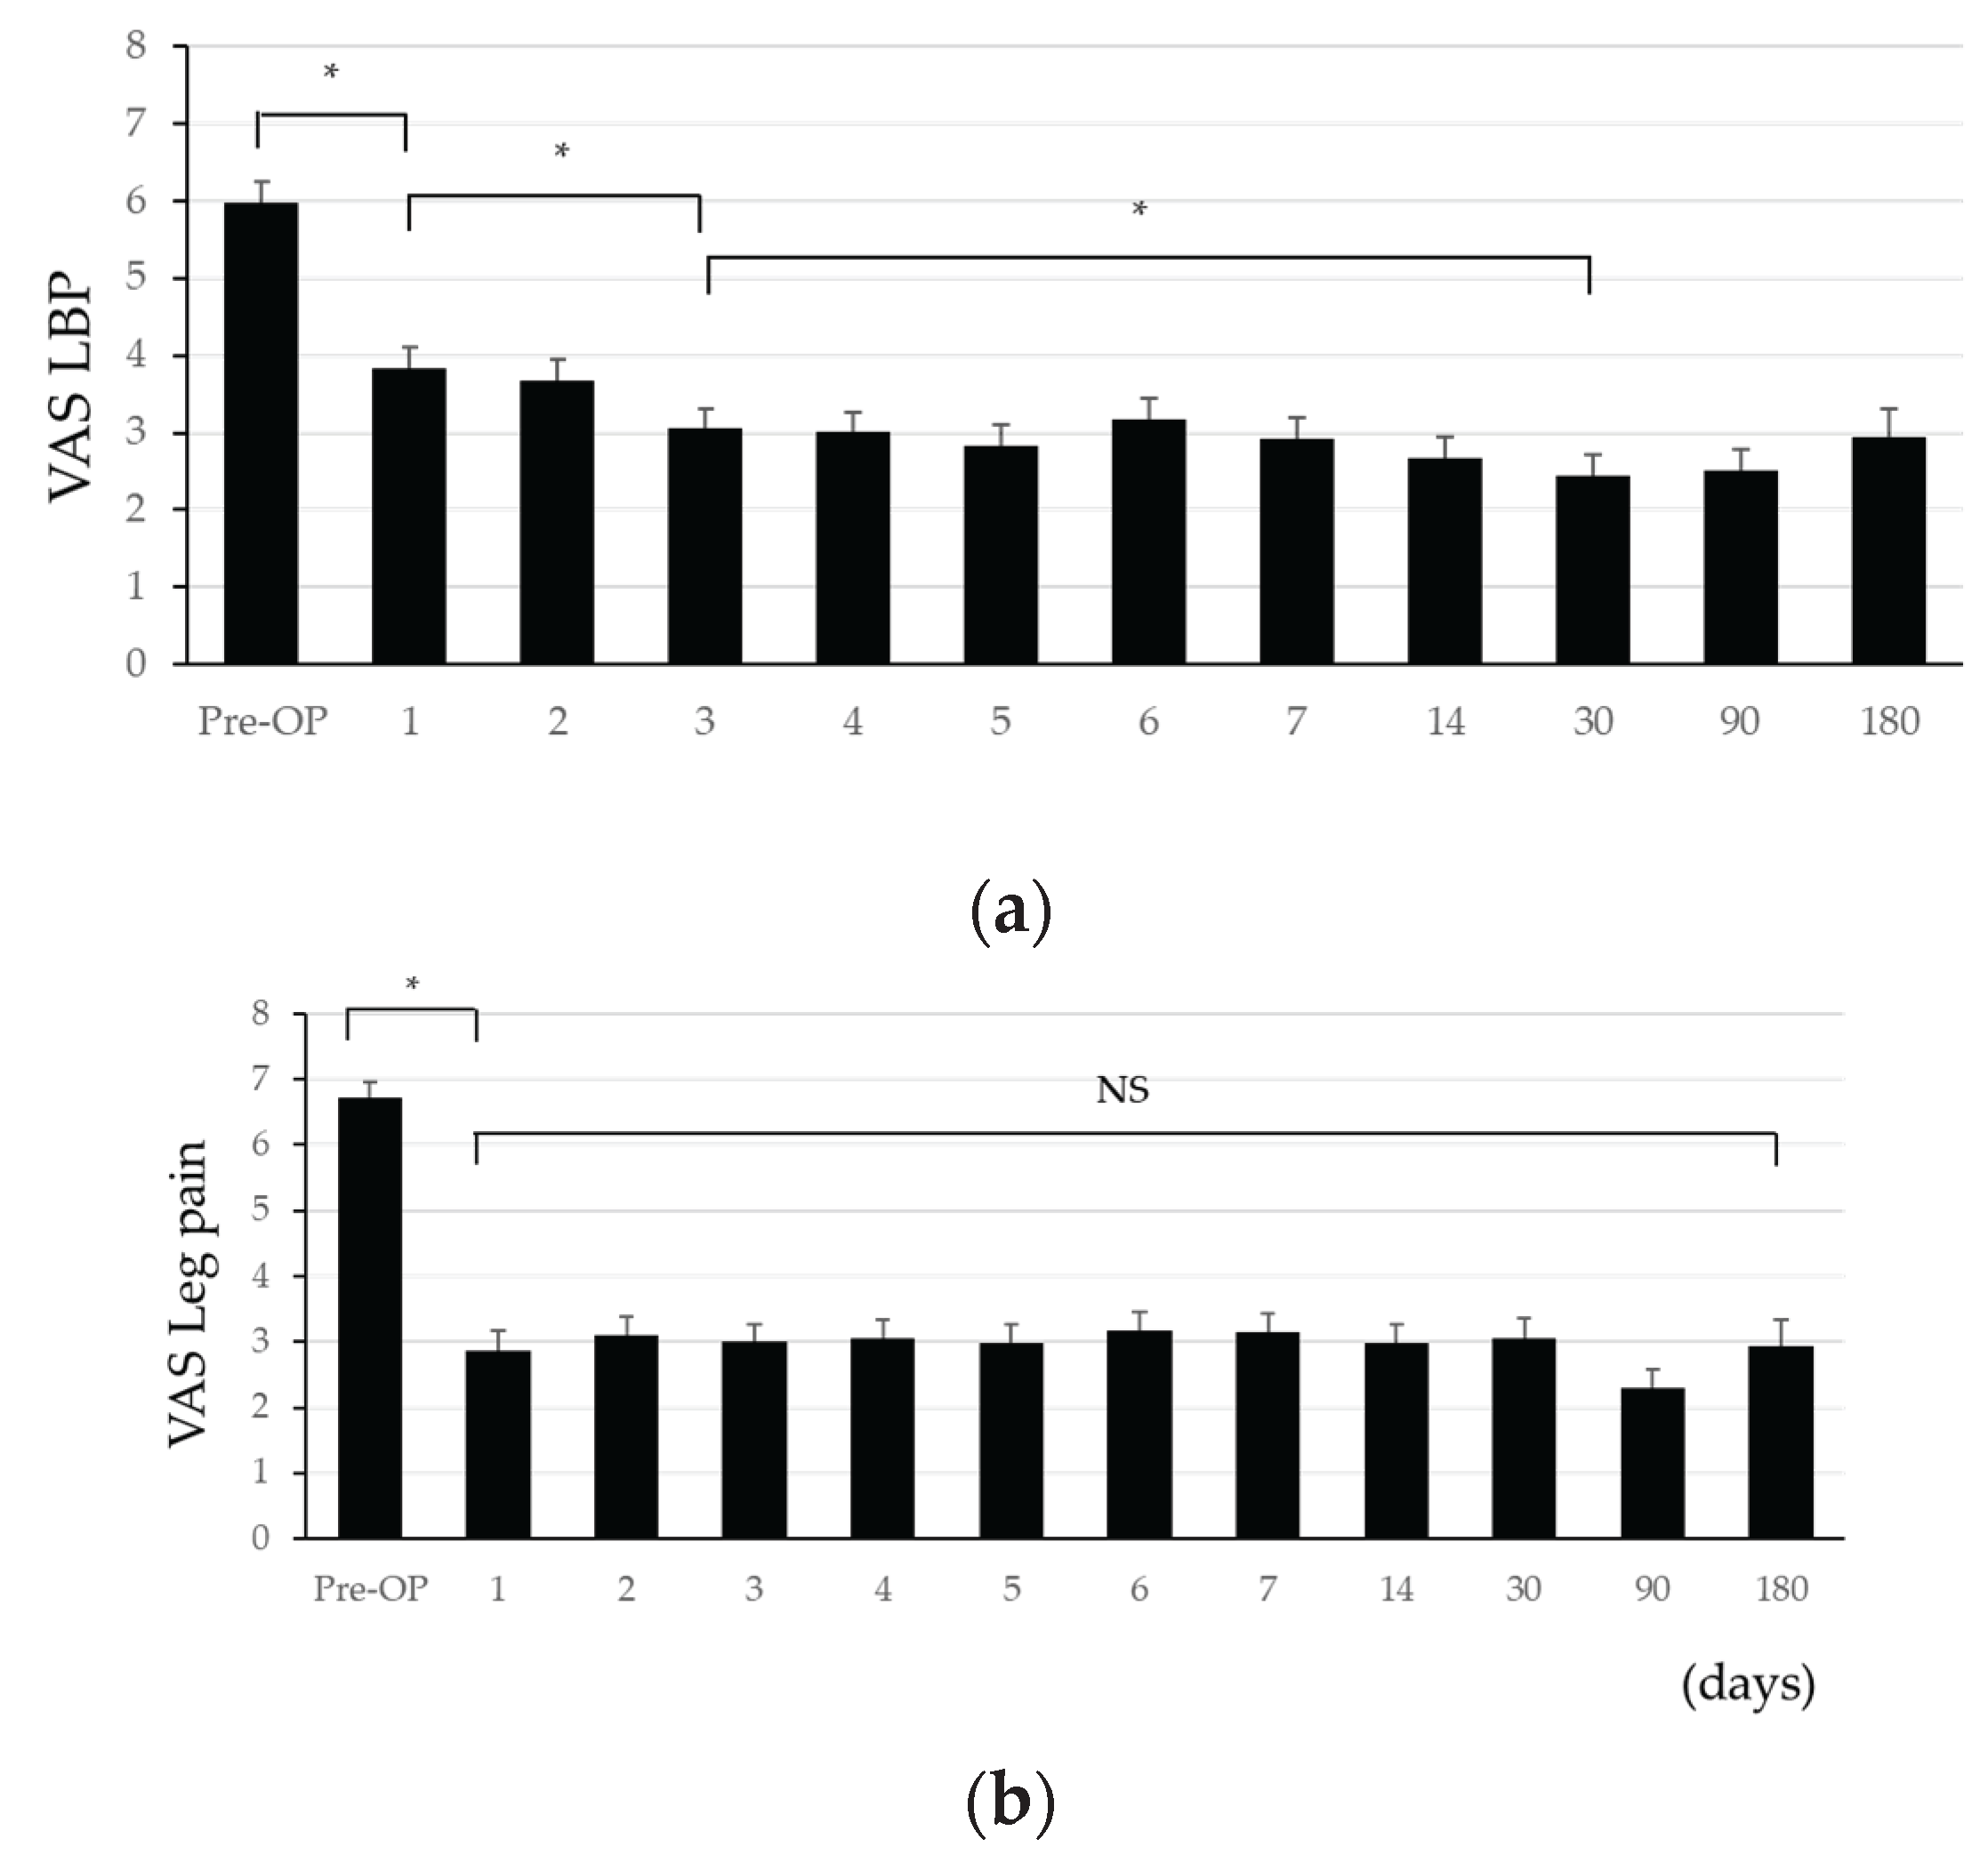
Preoperative VAS scores for LBP, leg pain, and ODI were 6.0 ± 0.3, 6.7 ± 0.2, and 23.0 ± 1.0, respectively. All significantly decreased by postoperative day 1 (3.8 ± 0.3, p<0.001; 2.9 ± 0.3, p<0.001; 18.7 ± 1.0, p=0.001), and the improvement was maintained until the final follow-up. VAS for LBP continued to improve significantly through postoperative day 3 and day 30 (p=0.004 and p<0.001, respectively) and remained stable thereafter. Leg pain VAS showed a marked improvement on day 1 and remained stable up to day 180, with no significant difference between day 1 and day 180 (p=0.697). ODI showed gradual and significant improvement on days 14, 30, and 90 (p=0.036, p=0.002, p<0.001), with no further significant difference between day 90 and day 180 (p=0.222).
Table 2.
Postoperative Course after TELD in the Entire Cohort.
| Days post-surgery | Pre-OP | 1 | 2 | 3 | 4 | 5 | 6 | 7 | 14 | 30 | 90 | 180 | |
| VAS LBP | n | 97 | 97 | 97 | 97 | 97 | 97 | 97 | 97 | 97 | 85 | 96 | 66 |
| Mean ± SEM | 6.0 ± 0.3 | 3.8 ± 0.3 | 3.7 ± 0.3 | 3.0 ± 0.3 | 3.0 ± 0.2 | 2.8 ± 0.3 | 3.2 ± 0.3 | 2.9 ± 0.3 | 2.7 ± 0.3 | 2.4 ± 0.3 | 2.5 ± 0.3 | 2.9 ± 0.4 | |
| p-Value for Pre-OP | <0.001 | <0.001 | <0.001 | <0.001 | <0.001 | <0.001 | <0.001 | <0.001 | <0.001 | <0.001 | <0.001 | ||
| p-Value for 1 day before | 0.509 | 0.006 | 0.831 | 0.256 | 0.104 | 0.137 | 0.137 | 0.168 | 0.472 | 0.103 | |||
| VAS Leg pain | n | 97 | 97 | 97 | 97 | 97 | 97 | 97 | 97 | 97 | 85 | 96 | 66 |
| Mean ± SEM | 6.7 ± 0.2 | 2.9 ± 0.3 | 3.1 ± 0.3 | 3.0 ± 0.3 | 3.0 ± 0.3 | 3.0 ± 0.3 | 3.2 ± 0.3 | 3.2 ± 0.3 | 3.0 ± 0.3 | 3.1 ± 0.3 | 2.3 ± 0.3 | 2.9 ± 0.4 | |
| p-Value for Pre-OP | <0.001 | <0.001 | <0.001 | <0.001 | <0.001 | <0.001 | <0.001 | <0.001 | <0.001 | <0.001 | <0.001 | ||
| p-Value for 1 day before | 0.284 | 0.686 | 0.727 | 0.644 | 0.333 | 0.866 | 0.291 | 0.381 | 0.046 | 0.033 | |||
| ODI | n | 97 | 96 | 96 | 95 | 95 | 96 | 94 | 96 | 96 | 84 | 95 | 63 |
| Mean ± SEM | 23.0 ± 1.0 | 18.7 ± 1.0 | 19.6 ± 1.1 | 18.6 ± 1.0 | 19.7 ± 1.0 | 18.9 ± 1.0 | 18.7 ± 1.0 | 18.0 ± 1.0 | 17.0 ± 1.0 | 14.9 ± 1.1 | 11.1 ± 1.0 | 11.3 ± 1.3 | |
| p-Value for Pre-OP | 0.001 | 0.005 | <0.001 | 0.001 | <0.001 | <0.001 | <0.001 | <0.001 | <0.001 | <0.001 | <0.001 | ||
| p-Value for 1 day before | 0.225 | 0.112 | 0.121 | 0.081 | 0.785 | 0.187 | 0.077 | 0.002 | <0.001 | 0.222 |
Figure 1.
Postoperative Evolution of VAS and ODI Scores After TELD (a) VAS Low Back Pain Over the Operative Course (b) VAS Low Leg Pain Over the Operative Course (c) ODI Scores Over the Operative Course
Figure 1.
Postoperative Evolution of VAS and ODI Scores After TELD (a) VAS Low Back Pain Over the Operative Course (b) VAS Low Leg Pain Over the Operative Course (c) ODI Scores Over the Operative Course
3.3. Comparison of Patient Demographics Between Good and Poor Outcome Groups (Table 1)
Of the 97 patients, 67 (69.1%) were classified as having a good outcome group (G group), defined as >30% improvement in ODI at final follow-up. No significant differences in age, sex, or BMI were observed between the good and poor outcome (P group) groups (53.4 ± 1.9 vs. 55.5 ± 2.3 years, p=0.526; 56.7% vs. 53.3% male, p=0.757; 30.6 ± 1.0 vs. 31.8 ± 1.6 kg/m², p=0.510). The affected disc level distribution did not differ significantly. However, paracentral LDH were significantly more common in the G group (64.1% vs. 26.7%, p=0.001), while foraminal herniations were more frequent in the P group (26.9% vs. 70.0%, p<0.001). No significant differences were observed in symptom duration or prior lumbar surgery. General anesthesia was more commonly used in the G group (71.6% vs. 43.3%, p=0.008). No differences in operative time, blood loss, or follow-up period were noted.
3.4. Comparison of Postoperative Course Between Good and Poor Groups (Table 3 and Figure 2, 3)
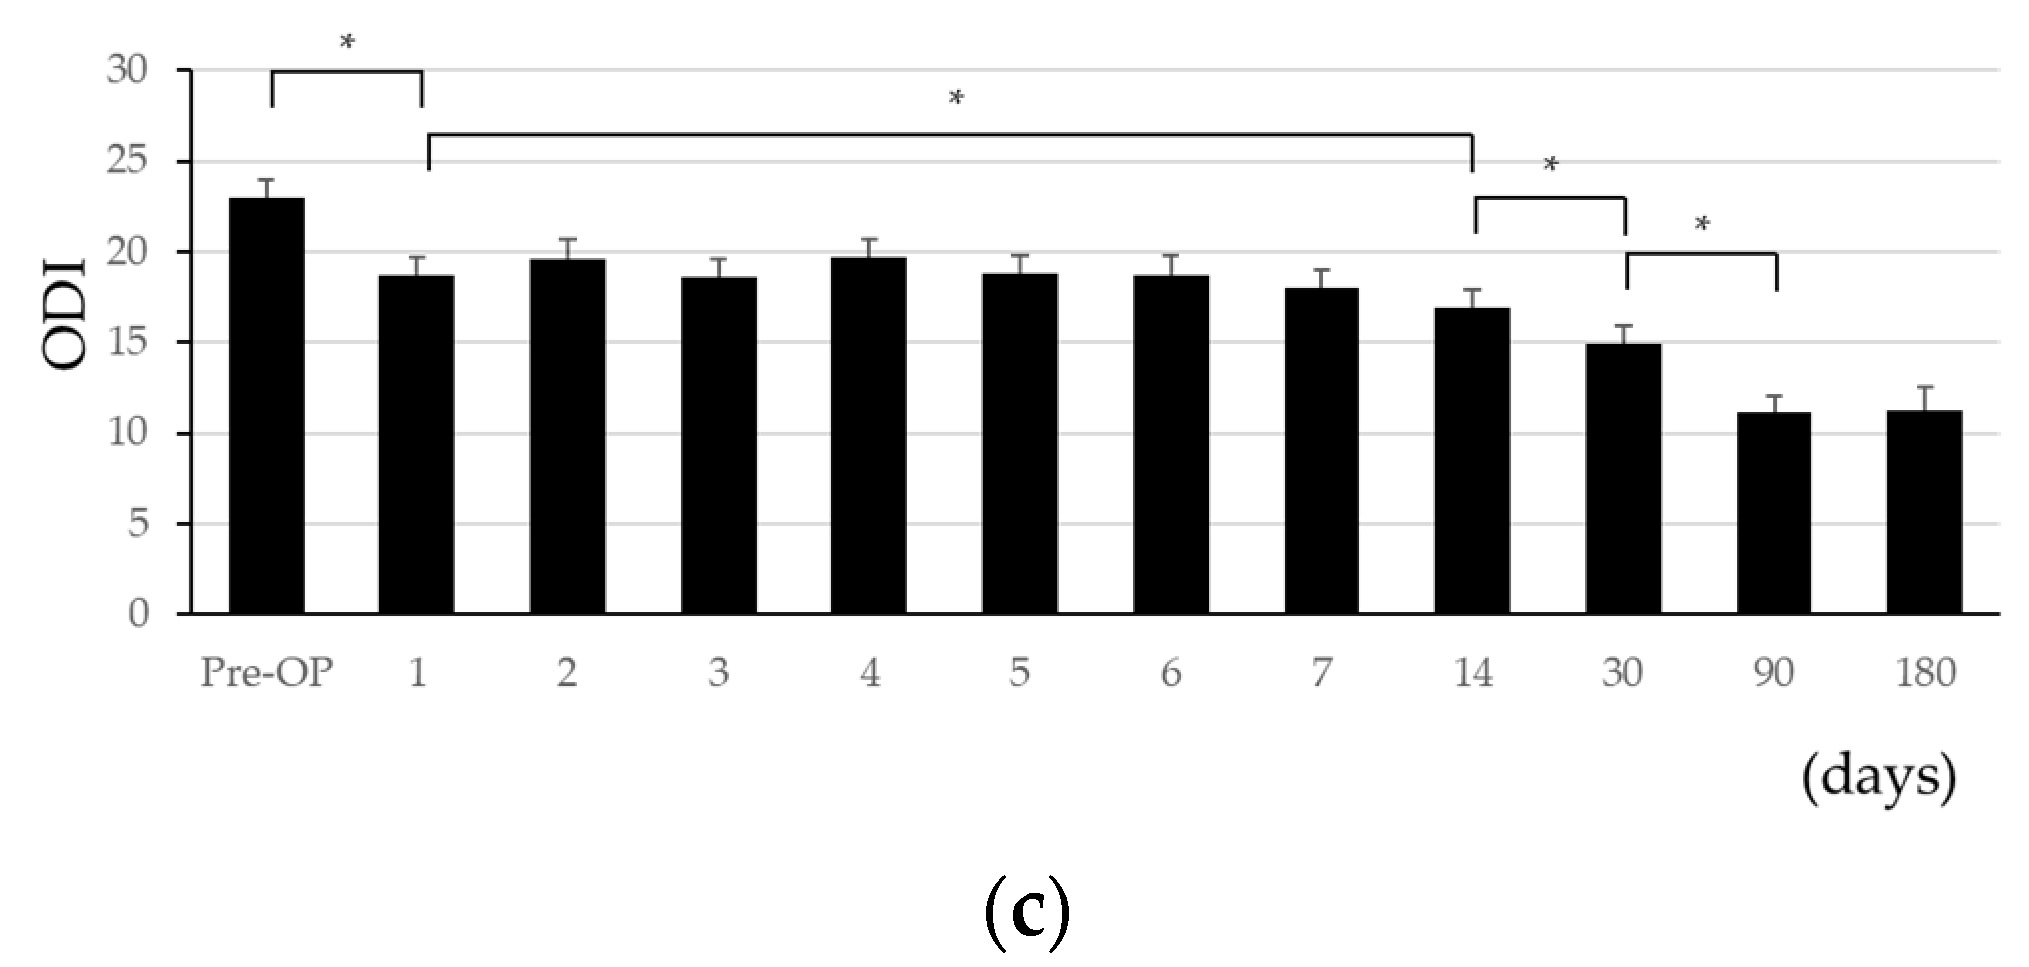
No significant differences were observed in preoperative VAS or ODI scores between groups. However, on postoperative day 1, both VAS scores were significantly lower in the G group compared in the P group (back pain: 3.4 ± 0.3 vs. 4.8 ± 0.5, p=0.027; leg pain: 2.2 ± 0.4 vs. 4.3 ± 0.5, p=0.001), with the differences persisting through day 180. ODI differences became significant at day 14 (15.2 ± 1.2 vs. 20.7 ± 1.6, p=0.008). ROC analysis showed AUC values of 0.534 (LBP), 0.717 (leg pain), and 0.605 (ODI), indicating a fair correlation only for leg pain VAS. The cutoff for leg pain VAS was -2.75 (sensitivity 70.0%, specificity 68.2%).
Table 3.
Postoperative Course after TELD in Good and Poor outcome groups.
| Days post-surgery | Pre-OP | 1 | 2 | 3 | 4 | 5 | 6 | 7 | 14 | 30 | 90 | 180 | ||
| VAS LBP | Good | n | 67 | 67 | 67 | 67 | 67 | 67 | 67 | 67 | 67 | 57 | 66 | 45 |
| Mean ± SEM | 5.7 ± 0.4 | 3.4 ± 0.3 | 3.2 ± 0.3 | 2.7 ± 0.3 | 2.5 ± 0.3 | 2.5 ±0.3 | 2.7 ± 0.3 | 2.5 ± 0.3 | 2.0 ± 0.3 | 1.9 ± 0.3 | 1.5 ±0.2 | 1.8 ± 0.3 | ||
| Poor | n | 30 | 30 | 30 | 30 | 30 | 30 | 30 | 30 | 30 | 28 | 30 | 21 | |
| Mean ± SEM | 6.5 ± 0.4 | 4.8 ± 0.5 | 4.7 ± 0.6 | 3.9 ± 0.5 | 4.2 ± 0.5 | 3.7 ± 0.5 | 4.3 ± 0.5 | 4.0 ± 0.5 | 4.3 ± 0.5 | 3.6 ± 0.5 | 4.7 ± 0.5 | 5.5 ± 0.7 | ||
| p-Value | 0.217 | 0.027 | 0.010 | 0.017 | 0.002 | 0.028 | 0.007 | 0.007 | <0.001 | 0.002 | <0.001 | <0.001 | ||
| VAS Leg pain | Good | n | 67 | 67 | 67 | 67 | 67 | 67 | 67 | 67 | 67 | 57 | 66 | 45 |
| Mean ± SEM | 6.8± 0.3 | 2.2 ± 0.4 | 2.4 ± 0.3 | 2.6 ± 0.3 | 2.5 ± 0.3 | 2.6 ± 0.3 | 2.6 ± 0.3 | 2.6 ± 0.3 | 2.2 ± 0.3 | 2.4 ± 0.3 | 1.4 ± 0.3 | 1.6 ± 0.4 | ||
| Poor | n | 30 | 30 | 30 | 30 | 30 | 30 | 30 | 30 | 30 | 28 | 30 | 21 | |
| Mean ± SEM | 6.5 ± 0.4 | 4.3 ± 0.5 | 4.7 ± 0.5 | 4.0 ± 0.5 | 4.4 ± 0.5 | 4.0 ± 0.5 | 4.4 ± 0.6 | 4.4 ± 0.5 | 4.8 ±0.5 | 4.4 ± 0.6 | 4.3 ±0.5 | 5.9 ± 0.5 | ||
| p-Value | 0.579 | 0.001 | <0.001 | 0.010 | 0.001 | 0.015 | 0.003 | 0.004 | <0.001 | 0.002 | <0.001 | <0.001 | ||
| ODI | Good | n | 67 | 66 | 66 | 66 | 65 | 66 | 66 | 66 | 66 | 56 | 65 | 44 |
| Mean ± SEM | 23.5 ± 1.3 | 17.4 ± 1.2 | 18.3 ± 1.3 | 18.2 ± 1.2 | 19.0 ± 1.2 | 18.4 ± 1.1 | 17.9 ± 1.2 | 16.9 ± 1.2 | 15.2 ± 1.2 | 12.4 ± 1.1 | 6.7 ± 0.7 | 6.2 ± 1.0 | ||
| Poor | n | 30 | 30 | 30 | 30 | 30 | 30 | 28 | 30 | 30 | 28 | 30 | 19 | |
| Mean ± SEM | 21.8 ± 1.3 | 21.6 ± 1.8 | 22.4 ± 2.1 | 19.6 ± 1.9 | 21.2 ± 1.7 | 19.9 ± 1.8 | 20.6 ± 2.0 | 20.4 ± 1.8 | 20.7 ± 1.6 | 20.0 ± 1.9 | 20.7 ± 1.7 | 23.2 ± 1.6 | ||
| p-Value | 0.397 | 0.063 | 0.082 | 0.520 | 0.286 | 0.451 | 0.249 | 0.110 | 0.008 | <0.001 | <0.001 | <0.001 |
Figure 2.
(a) Comparison of VAS Low Back Pain Over the Operative Course Between Good and Poor Outcomes (b) Comparison of VAS Low Leg Pain Over the Operative Course Between Good and Poor Outcomes (c) Comparison of ODI Scores Over the Operative Course Between Good and Poor Outcomes
Figure 2.
(a) Comparison of VAS Low Back Pain Over the Operative Course Between Good and Poor Outcomes (b) Comparison of VAS Low Leg Pain Over the Operative Course Between Good and Poor Outcomes (c) Comparison of ODI Scores Over the Operative Course Between Good and Poor Outcomes
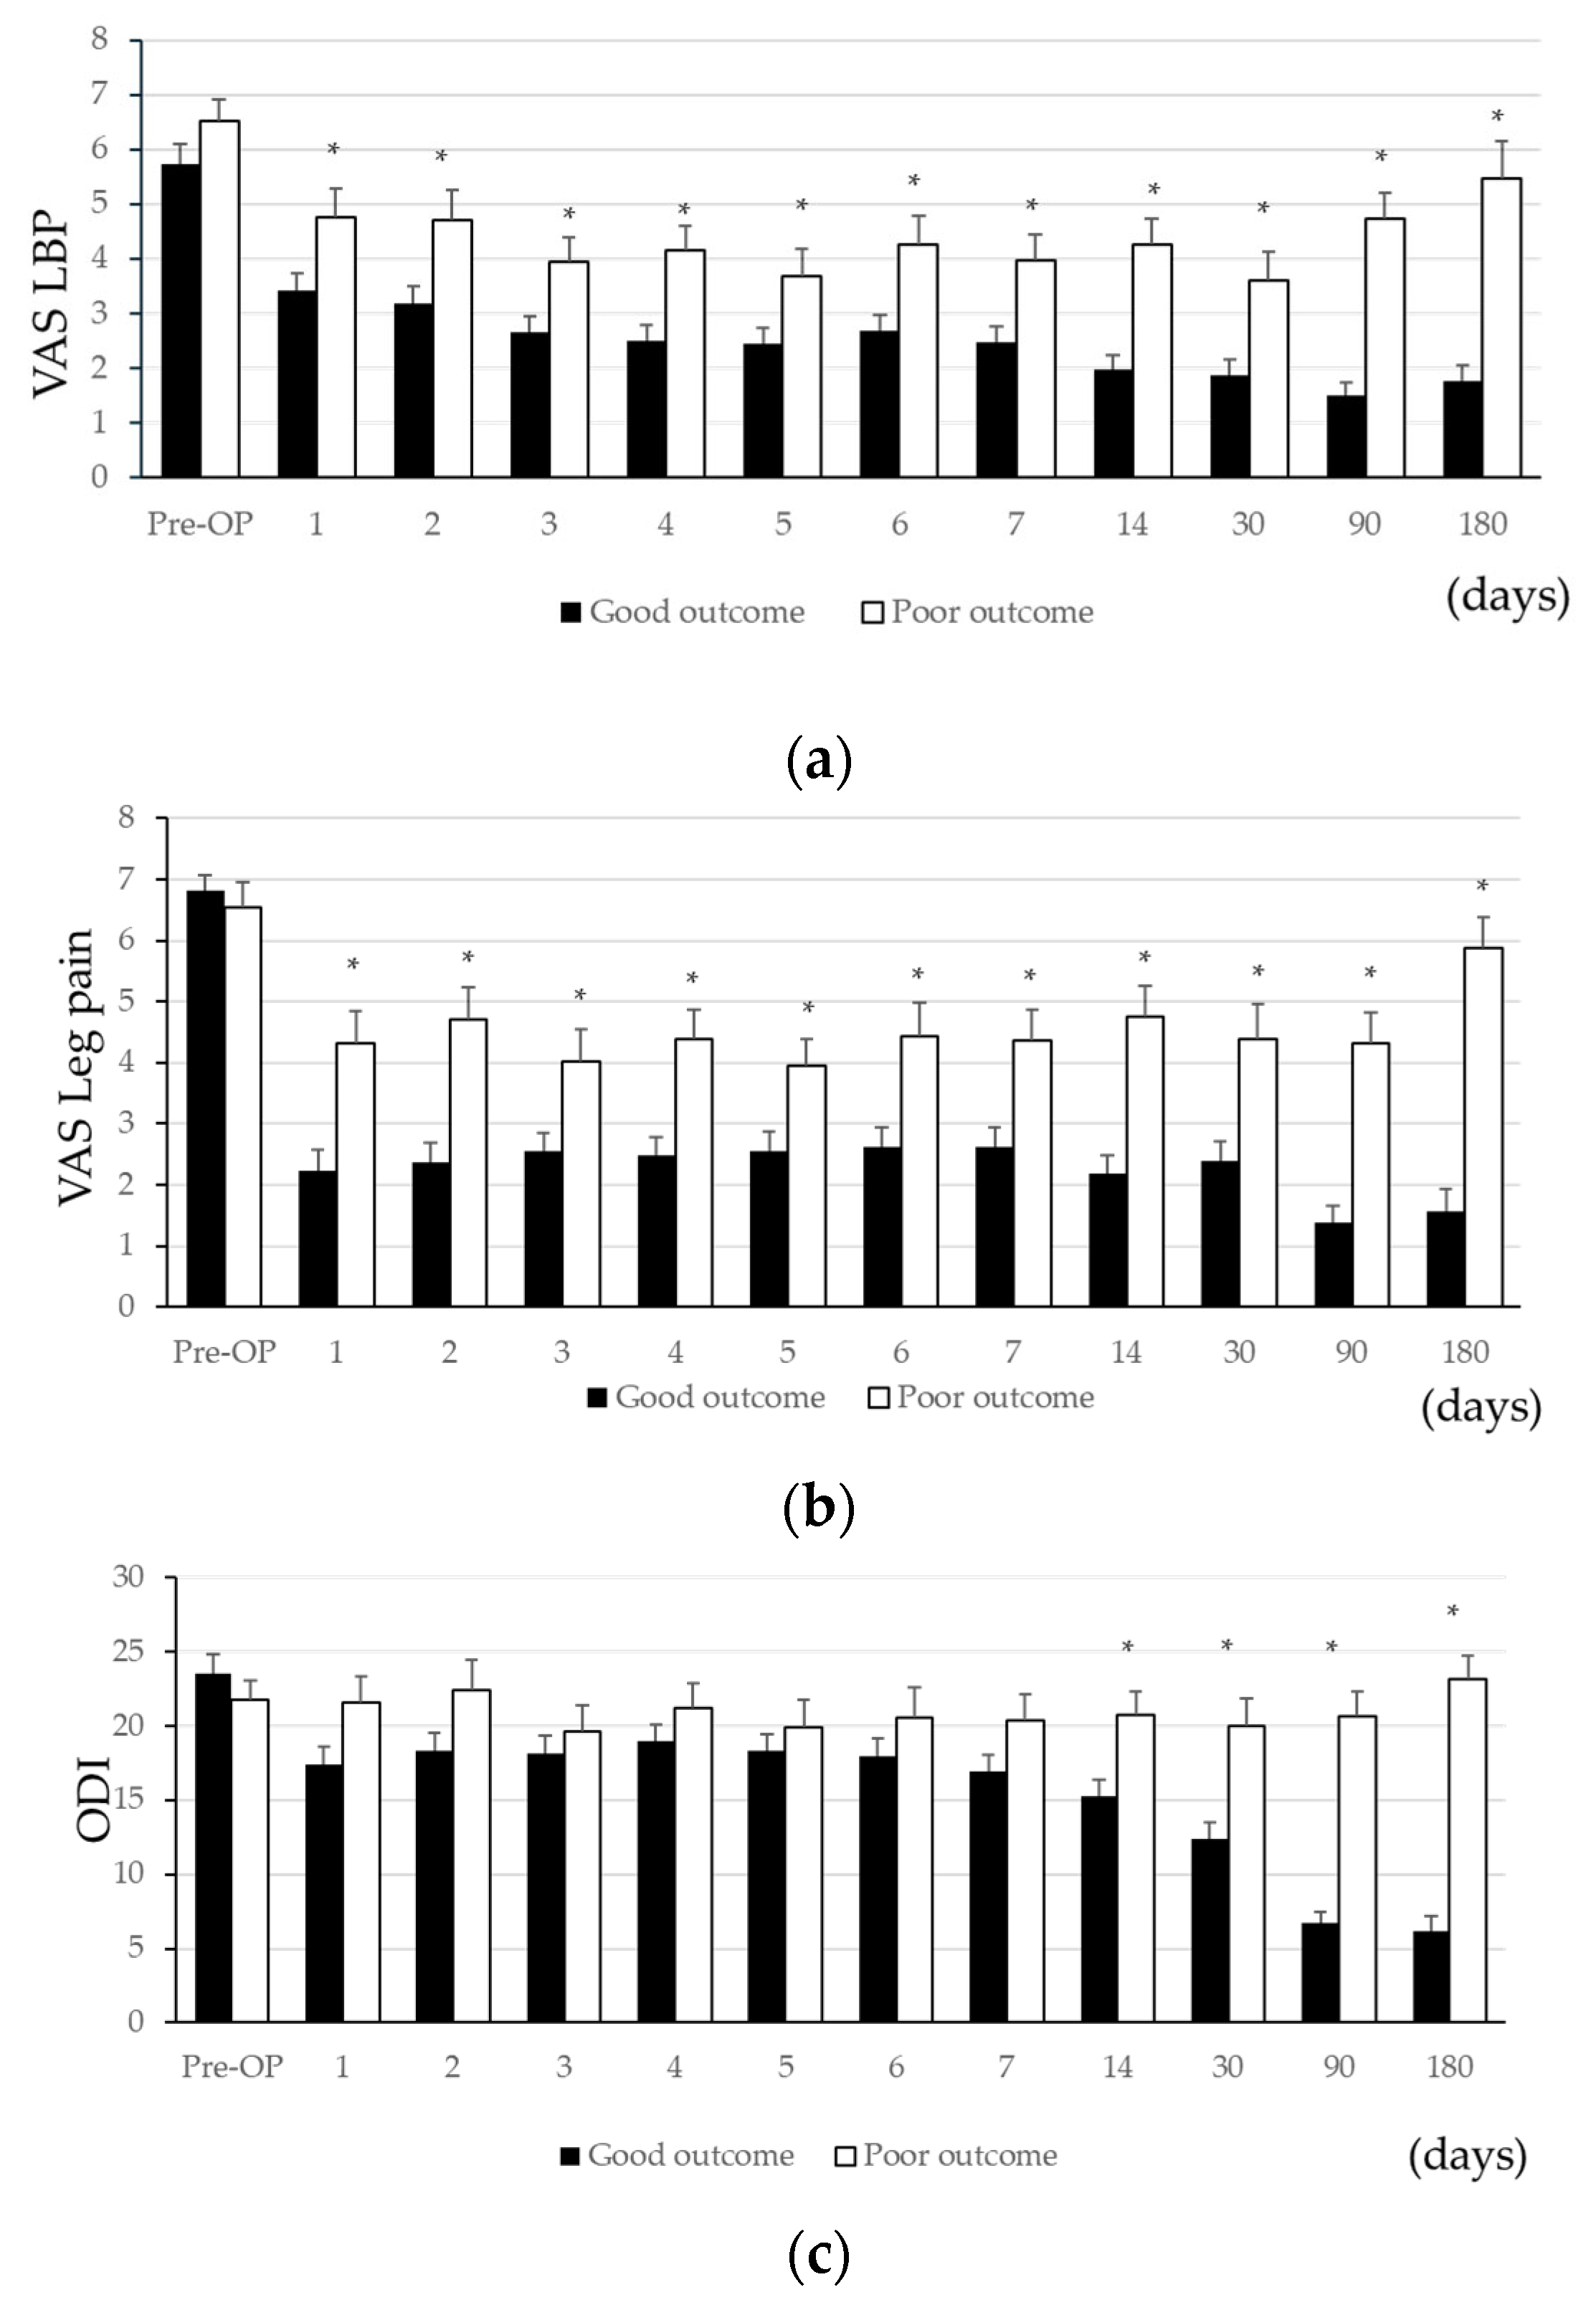
Figure 3.
ROC Curves for VAS (LBP & Leg Pain) and ODI on Day 1 After TELD.
3.5. Comparison of Patient Demographics and Postoperative Course by Herniation Location (Table 4, 5 and Figure 4)
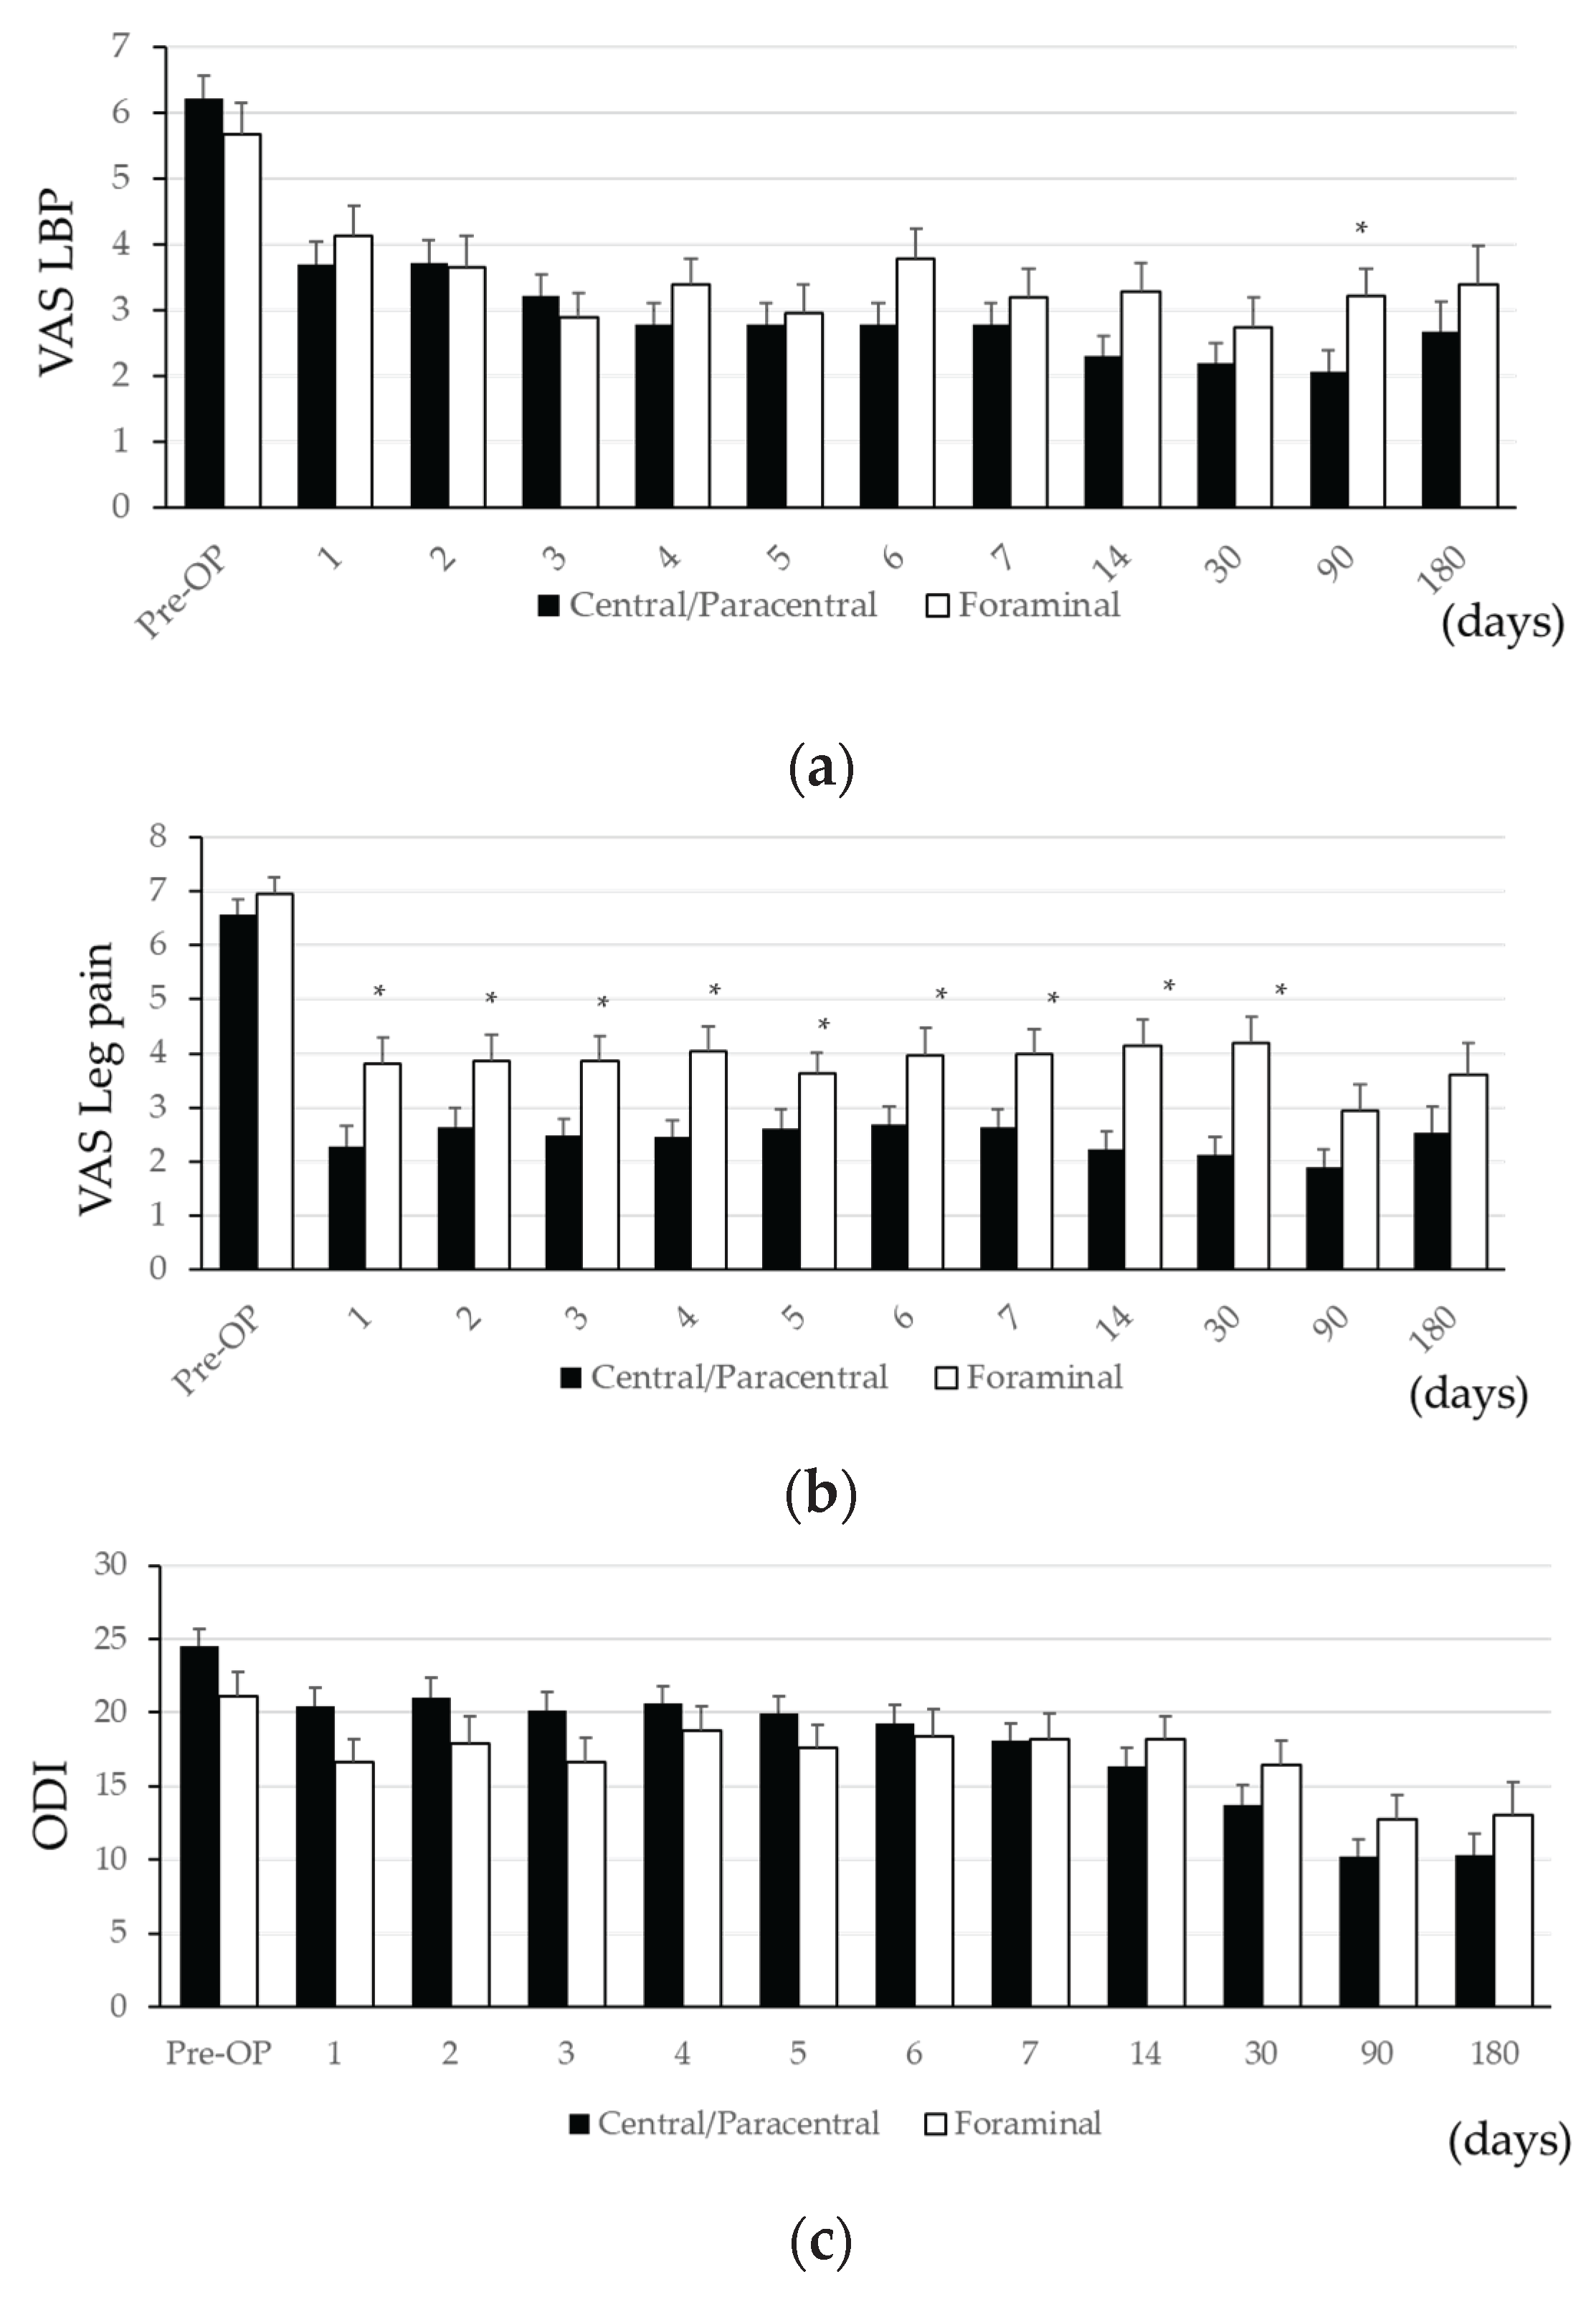
Patients were grouped into central/paracentral LDH (CP group, n=57) and foraminal LDH (F group, n=39) based on herniation type. F group patients were older (60.6 ± 1.8 vs. 49.6 ± 2.0, p<0.001) and had lower BMI (28.6 ± 1.1 vs. 32.6 ± 1.2, p=0.015). CP group had more L4/5 herniations (63.3% vs. 42.9%, p=0.045), and general anesthesia was more frequently used in CP group (71.9% vs. 51.3%). Other background factors were not significantly different.
VAS and ODI scores preoperatively were not significantly different between CP and F groups. However, LBP VAS at day 90 was significantly lower in CP group (2.1 ± 0.3 vs. 3.2 ± 0.4, p=0.037), though no difference remained at day 180. Leg pain VAS was significantly lower in CP group from day 1 through day 30 but not beyond. ODI did not differ significantly at any time point.
Table 4.
Demographic and surgical characteristics of patients between Central/Paracentral LDH and Foraminal Lumbar disc herniation (LDH).
Table 4.
Demographic and surgical characteristics of patients between Central/Paracentral LDH and Foraminal Lumbar disc herniation (LDH).
| Number of cases | Central/Paracentral (CP) LDH | p-value | Foraminal (F) LDH | p-value | p-value | |||||
| Total | Good outcome | Poor outcome | Total | Good outcome | Poor outcome | CP vs F | ||||
| 57 (59.4 %) | 48 (84.2 %) | 9 (15.8 %) | 39 (40.6 %) | 18 (46.1 %) | 21 (53.9 %) | <0.001 | ||||
| Age | 49.6 ± 2.0 | 48.6 ± 2.3 | 50.3 ± 4.1 | 0.762 | 60.6 ± 1.8 | 63.9 ± 2.0 | 57.7 ± 2.8 | 0.081 | <0.001 | |
| Gender | 0.717 | 0.232 | 0.979 | |||||||
| Male | 32 (56.1 %) | 26 (54.2 %) | 6 (66.7 %) | 22 (56.4 %) | 12 (66.7 %) | 10 (47.6 %) | ||||
| Female | 25 (43.9 %) | 22 (45.8 %) | 3 (33.3 %) | 17 (43.6 %) | 6 (33.3 %) | 11 (52.4 %) | ||||
| BMI (kg/m2) | 32.6 ± 1.2 | 32.2 ± 1.3 | 35.0 ± 3.4 | 0.394 | 28.6 ± 1.1 | 26.4 ± 1.1 | 30.4 ± 1.7 | 0.069 | 0.015 | |
| Level | ||||||||||
| L1/2 | 2 (3.3 %) | 2 (3.9 %) | 0 (0 %) | 1.000 | 0 (0 %) | 0 (0 %) | 0 (0 %) | 0.512 | ||
| L2/3 | 3 (5.0 %) | 2 (3.9 %) | 1 (11.1 %) | 0.409 | 4 (9.5%) | 2 (10.5 %) | 2 (8.7 %) | 1.000 | 0.437 | |
| L3/4 | 7 (11.7 %) | 6 (11.8 %) | 1 (11.1 %) | 1.000 | 7 (16.6 %) | 4 (21.1 %) | 3 (13.0 %) | 0.682 | 0.558 | |
| L4/5 | 38 (63.3 %) | 33 (64.7 %) | 5 (55.6 %) | 0.463 | 18 (42.9 %) | 8 (42.1 %) | 10 (43.4 %) | 0.843 | 0.045 | |
| L5/S1 | 10 (16.7 %) | 8 (15.7 %) | 2 (22.2 %) | 0.650 | 13 (31.0 %) | 5 (26.3 %) | 8 (34.8 %) | 0.496 | 0.075 | |
| Total number | 60 | 51 | 9 | 42 | 19 | 23 | ||||
| More than 2 levels | 3 (5.2 %) | 3 (6.3 %) | 0 (0 %) | 1.000 | 3 (7.7 %) | 1 (5.6 %) | 2 (9.5 %) | 1.000 | 0.684 | |
| Intervertebral Instability | 0 (0 %) | 0 (0 %) | 0 (0 %) | 0 (0 %) | 0 (0 %) | 0 (0 %) | ||||
| Duration of symptoms | 12.7 ± 2.0 | 13.2 ± 2.3 | 10.0 ± 2.0 | 0.307 | 16.3 ± 3.0 | 17.2 ± 5.4 | 15.5 ± 3.2 | 0.781 | 0.297 | |
| Revision surgery | 14 (24.6 %) | 12 (25.0 %) | 2 (22.2 %) | 1.000 | 13 (33.3 %) | 4 (21.0 %) | 9 (42.9 %) | 0.173 | 0.348 | |
| Anesthesia | 0.250 | 0.075 | 0.039 | |||||||
| General | 41 (71.9 %) | 36 (75.0 %) | 5 (55.6 %) | 20 (51.3 %) | 12 (66.7 %) | 8 (38.1 %) | ||||
| Local | 16 (28.1 %) | 12 (25.0 %) | 4 (44.4 %) | 19 (48.7 %) | 6 (33.3 %) | 13 (61.9 %) | ||||
| OP time (min) | 82.4 ± 7.5 | 83.0 ± 8.1 | 84.8 ± 22.0 | 0.931 | 61.0 ± 7.3 | 73.1 ± 10.8 | 50.6 ± 9.6 | 0.125 | 0.053 | |
| Blood loss (g) | 6.8 ± 1.1 | 6.8 ± 1.2 | 7.2 ± 0.9 | 0.890 | 3.6 ± 0.6 | 4.8 ± 1.0 | 2.6 ± 0.5 | 0.049 | 0.026 | |
| Perioperative complication | 0 (0 %) | 0 (0 %) | 0 (0 %) | 0 (0 %) | 0 (0 %) | 0 (0 %) | ||||
| Duration of follow-up (months) | 4.9 ± 0.2 | 4.8 ± 0.2 | 5.3 ± 0.4 | 0.309 | 5.0 ± 0.2 | 5.3 ± 0.3 | 4.7 ± 0.3 | 0.182 | 0.774 | |
Table 5.
Postoperative Course after TELD in Central/Paracentral LDH and Foraminal LDH.
| Type of LDH | Days post surgery | Pre-OP | 1 | 2 | 3 | 4 | 5 | 6 | 7 | 14 | 30 | 90 | 180 | |
| VAS LBP | Central/Paracentral | n | 57 | 57 | 57 | 57 | 57 | 57 | 57 | 57 | 57 | 47 | 56 | 37 |
| Mean ± SEM | 6.2 ± 0.4 | 3.7 ± 0.4 | 3.7 ± 0.3 | 3.2 ± 0.3 | 2.8 ± 0.3 | 2.8 ± 0.3 | 2.8 ± 0.3 | 2.8 ± 0.3 | 2.3 ± 0.3 | 2.2 ± 0.3 | 2.1 ± 0.3 | 2.7 ± 0.5 | ||
| Foraminal | n | 39 | 39 | 39 | 39 | 39 | 39 | 39 | 39 | 39 | 39 | 39 | 28 | |
| Mean ± SEM | 5.7 ± 0.5 | 4.1 ± 0.5 | 3.7 ± 0.5 | 2.9 ± 0.4 | 3.4 ± 0.4 | 3.0 ± 0.4 | 3.8 ± 0.5 | 3.2 ± 0.4 | 3.3 ± 0.4 | 2.8 ± 0.4 | 3.2 ± 0.4 | 3.4 ± 0.6 | ||
| p-Value | 0.378 | 0.450 | 0.907 | 0.519 | 0.232 | 0.753 | 0.075 | 0.442 | 0.064 | 0.304 | 0.037 | 0.345 | ||
| VAS Leg pain | Central/Paracentral | n | 57 | 57 | 57 | 57 | 57 | 57 | 57 | 57 | 57 | 47 | 56 | 37 |
| Mean ± SEM | 6.6 ± 0.3 | 2.3 ± 0.4 | 2.6 ± 0.4 | 2.5 ± 0.3 | 2.4 ± 0.3 | 2.6 ± 0.4 | 2.7 ± 0.3 | 2.6 ± 0.3 | 2.2 ± 0.3 | 2.1 ± 0.3 | 1.9 ± 0.3 | 2.5 ± 0.5 | ||
| Foraminal | n | 39 | 39 | 39 | 39 | 39 | 39 | 39 | 39 | 39 | 39 | 39 | 28 | |
| Mean ± SEM | 6.9 ± 0.3 | 3.8 ± 0.5 | 3.9 ± 0.5 | 3.9 ± 0.5 | 4.0 ± 0.5 | 3.6 ± 0.4 | 4.0 ± 0.5 | 4.0 ± 0.5 | 4.2 ± 0.5 | 4.2 ± 0.5 | 3.0 ± 0.5 | 3.6 ± 0.6 | ||
| p-Value | 0.393 | 0.017 | 0.034 | 0.015 | 0.004 | 0.065 | 0.037 | 0.019 | 0.001 | 0.001 | 0.070 | 0.171 | ||
| ODI | Central/Paracentral | n | 57 | 56 | 57 | 57 | 57 | 57 | 57 | 57 | 57 | 47 | 56 | 36 |
| Mean ± SEM | 24.6 ± 1.1 | 20.4 ± 1.3 | 21.0 ± 1.3 | 20.2 ± 1.2 | 20.6 ± 1.2 | 20.0 ± 1.1 | 19.3 ± 1.2 | 18.1 ± 1.2 | 16.4 ± 1.2 | 13.7 ± 1.3 | 10.2 ± 1.2 | 10.3 ± 1.5 | ||
| Foraminal | n | 39 | 38 | 38 | 38 | 38 | 38 | 37 | 38 | 38 | 37 | 38 | 26 | |
| Mean ± SEM | 21.1 ± 1.7 | 16.6 ± 1.6 | 17.9 ± 1.9 | 16.7 ± 1.7 | 18.8 ± 1.7 | 17.6 ± 1.6 | 18.4 ± 1.9 | 18.2 ± 1.7 | 18.2 ± 1.6 | 16.4 ± 1.7 | 12.8 ± 1.7 | 13.0 ± 2.3 | ||
| p-Value | 0.077 | 0.073 | 0.159 | 0.090 | 0.380 | 0.225 | 0.662 | 0.951 | 0.371 | 0.210 | 0.208 | 0.301 |
Table 6.
Postoperative Course after TELD in Good and Poor outcome groups in Central/Paracentral LDH.
Table 6.
Postoperative Course after TELD in Good and Poor outcome groups in Central/Paracentral LDH.
| Days post surgery | Pre-OP | 1 | 2 | 3 | 4 | 5 | 6 | 7 | 14 | 30 | 90 | 180 | ||
| VAS LBP | Good | n | 48 | 48 | 48 | 48 | 48 | 48 | 48 | 48 | 48 | 39 | 47 | 30 |
| Mean ± SEM | 6.1 ± 0.4 | 3.6 ± 0.4 | 3.6 ± 0.4 | 3.0 ± 0.3 | 2.6 ± 0.3 | 2.7 ± 0.3 | 2.7 ± 0.3 | 2.7 ± 0.3 | 2.2 ± 0.3 | 2.1 ± 0.4 | 1.5 ± 0.3 | 2.0 ± 0.4 | ||
| Poor | n | 9 | 9 | 9 | 9 | 9 | 9 | 9 | 9 | 9 | 8 | 9 | 7 | |
| Mean ± SEM | 6.6 ± 0.8 | 4.0 ± 0.9 | 4.2 ± 1.1 | 4.3 ± 0.9 | 3.6 ± 0.8 | 3.1 ± 0.9 | 3.2 ± 0.9 | 3.1 ± 0.9 | 2.6 ± 0.8 | 2.4 ± 0.8 | 5.1 ± 1.1 | 5.5 ± 1.2 | ||
| p-Value | 0.657 | 0.746 | 0.549 | 0.140 | 0.260 | 0.677 | 0.619 | 0.673 | 0.675 | 0.736 | 0.012 | 0.002 | ||
| VAS Leg pain | Good | n | 48 | 48 | 48 | 48 | 48 | 48 | 48 | 48 | 48 | 39 | 47 | 30 |
| Mean ± SEM | 6.7 ± 0.3 | 2.1 ± 0.4 | 2.3 ± 0.4 | 2.3 ± 0.3 | 2.2 ± 0.3 | 2.5 ± 0.4 | 2.6 ± 0.4 | 2.6 ± 0.4 | 2.1 ± 0.4 | 2.2 ± 0.4 | 1.5 ± 0.4 | 1.8 ± 0.5 | ||
| Poor | n | 9 | 9 | 9 | 9 | 9 | 9 | 9 | 9 | 9 | 8 | 9 | 7 | |
| Mean ± SEM | 5.8 ± 0.9 | 3.1 ± 1.0 | 4.4 ± 1.0 | 3.3 ± 0.8 | 3.6 ± 0.8 | 3.2 ± 0.8 | 3.4 ± 0.9 | 3.0 ± 0.8 | 2.8 ± 0.8 | 1.9 ± 0.6 | 4.0 ± 0.8 | 5.8 ± 1.0 | ||
| p-Value | 0.310 | 0.393 | 0.032 | 0.231 | 0.117 | 0.467 | 0.337 | 0.625 | 0.418 | 0.763 | 0.007 | 0.001 | ||
| ODI | Good | n | 48 | 47 | 48 | 48 | 48 | 48 | 48 | 48 | 48 | 39 | 47 | 29 |
| Mean ± SEM | 24.8 ± 1.2 | 19.9 ± 1.4 | 20.7 ± 1.4 | 20.1 ± 1.4 | 20.5 ± 1.3 | 20.1 ± 1.3 | 19.6 ± 1.3 | 18.1 ± 1.3 | 16.2 ± 1.3 | 13.2 ± 1.4 | 7.4 ± 0.8 | 6.9 ± 1.1 | ||
| Poor | n | 9 | 9 | 9 | 9 | 9 | 9 | 9 | 9 | 9 | 8 | 9 | 7 | |
| Mean ± SEM | 23.5 ± 2.1 | 22.9 ± 3.6 | 23.0 ± 3.8 | 20.6 ± 3.4 | 21.1 ± 2.7 | 19.4 ± 3.1 | 17.9 ± 3.2 | 18.3 ± 3.2 | 17.3 ± 2.9 | 16.4 ± 3.8 | 24.9 ± 2.7 | 24.1 ± 2.8 | ||
| p-Value | 0.672 | 0.426 | 0.529 | 0.891 | 0.863 | 0.823 | 0.618 | 0.954 | 0.757 | 0.371 | <0.001 | <0.001 |
Table 7.
Postoperative Course after TELD in Good and Poor outcome groups in Central/Paracentral LDH.
Table 7.
Postoperative Course after TELD in Good and Poor outcome groups in Central/Paracentral LDH.
| Days post-surgery | Pre-OP | 1 | 2 | 3 | 4 | 5 | 6 | 7 | 14 | 30 | 90 | 180 | ||
| VAS LBP | Good | n | 18 | 18 | 18 | 18 | 18 | 18 | 18 | 18 | 18 | 18 | 18 | 14 |
| Mean ± SEM | 4.8 ± 0.8 | 3.0 ± 0.6 | 2.2 ± 0.5 | 1.9 ± 0.4 | 2.3 ± 0.4 | 1.8 ± 0.6 | 2.7 ± 0.6 | 1.9 ± 0.5 | 1.3 ± 0.4 | 1.3 ± 0.4 | 1.6 ± 0.5 | 1.3 ± 0.3 | ||
| Poor | n | 21 | 21 | 21 | 21 | 21 | 21 | 21 | 21 | 21 | 21 | 21 | 14 | |
| Mean ± SEM | 6.5 ± 0.5 | 5.1 ± 0.6 | 4.9 ± 0.7 | 3.8 ± 0.6 | 4.4 ± 0.6 | 3.9 ± 0.6 | 4.7 ± 0.7 | 4.3 ± 0.6 | 5.0 ± 0.5 | 4.1 ± 0.7 | 4.6 ± 0.5 | 5.5 ± 0.9 | ||
| p-Value | 0.094 | 0.022 | 0.002 | 0.011 | 0.007 | 0.016 | 0.032 | 0.004 | <0.001 | 0.001 | <0.001 | <0.001 | ||
| VAS Leg pain | Good | n | 18 | 18 | 18 | 18 | 18 | 18 | 18 | 18 | 18 | 18 | 18 | 14 |
| Mean ± SEM | 7.1 ± 0.5 | 2.6 ± 0.7 | 2.7 ± 0.6 | 3.3 ± 0.6 | 3.3 ± 0.7 | 2.9 ± 0.5 | 2.9 ± 0.7 | 2.9 ± 0.7 | 2.5 ± 0.6 | 2.9 ± 0.6 | 1.2 ± 0.4 | 1.3 ± 0.5 | ||
| Poor | n | 21 | 21 | 21 | 21 | 21 | 21 | 21 | 21 | 21 | 21 | 21 | 14 | |
| Mean ± SEM | 6.8 ± 0.5 | 4.9 ± 0.6 | 4.9 ± 0.6 | 4.3 ± 0.6 | 4.7 ± 0.6 | 4.3 ± 0.6 | 4.9 ± 0.7 | 4.9 ± 0.6 | 5.6 ± 0.6 | 5.4 ± 0.7 | 4.5 ± 0.7 | 5.9 ± 0.6 | ||
| p-Value | 0.739 | 0.018 | 0.021 | 0.279 | 0.121 | 0.079 | 0.054 | 0.027 | 0.001 | 0.012 | <0.001 | <0.001 | ||
| ODI | Good | n | 18 | 17 | 17 | 17 | 17 | 17 | 17 | 17 | 17 | 17 | 17 | 14 |
| Mean ± SEM | 21.2 ± 3.1 | 11.5 ± 1.7 | 12.6 ± 2.1 | 13.6 ± 2.2 | 15.8 ± 2.4 | 14.4 ± 2.2 | 14.4 ± 2.4 | 14.4 ± 2.4 | 13.1 ± 2.4 | 10.5 ± 1.9 | 5.2 ± 1.5 | 4.9 ± 2.0 | ||
| Poor | n | 21 | 21 | 21 | 21 | 21 | 21 | 20 | 21 | 21 | 20 | 21 | 12 | |
| Mean ± SEM | 21.0 ± 1.6 | 21.0 ± 2.2 | 22.2 ± 2.6 | 19.2 ± 2.3 | 21.3 ± 2.2 | 20.2 ± 2.3 | 21.9 ± 2.6 | 21.3 ± 2.3 | 22.2 ± 1.8 | 21.4 ± 2.2 | 18.9 ± 2.0 | 22.6 ± 2.1 | ||
| p-Value | 0.961 | 0.002 | 0.008 | 0.094 | 0.098 | 0.080 | 0.045 | 0.047 | 0.004 | 0.001 | <0.001 | <0.001 |
Figure 4.
(a) Comparison of VAS Low Back Pain Over the Operative Course Between Central/Paracentral and Foraminal Disc Herniations (b) Comparison of VAS Low Leg Pain Over the Operative Course Between Central/Paracentral and Foraminal Disc Herniations (c) Comparison of ODI Scores Over the Operative Course Between Central/Paracentral and Foraminal Disc Herniations
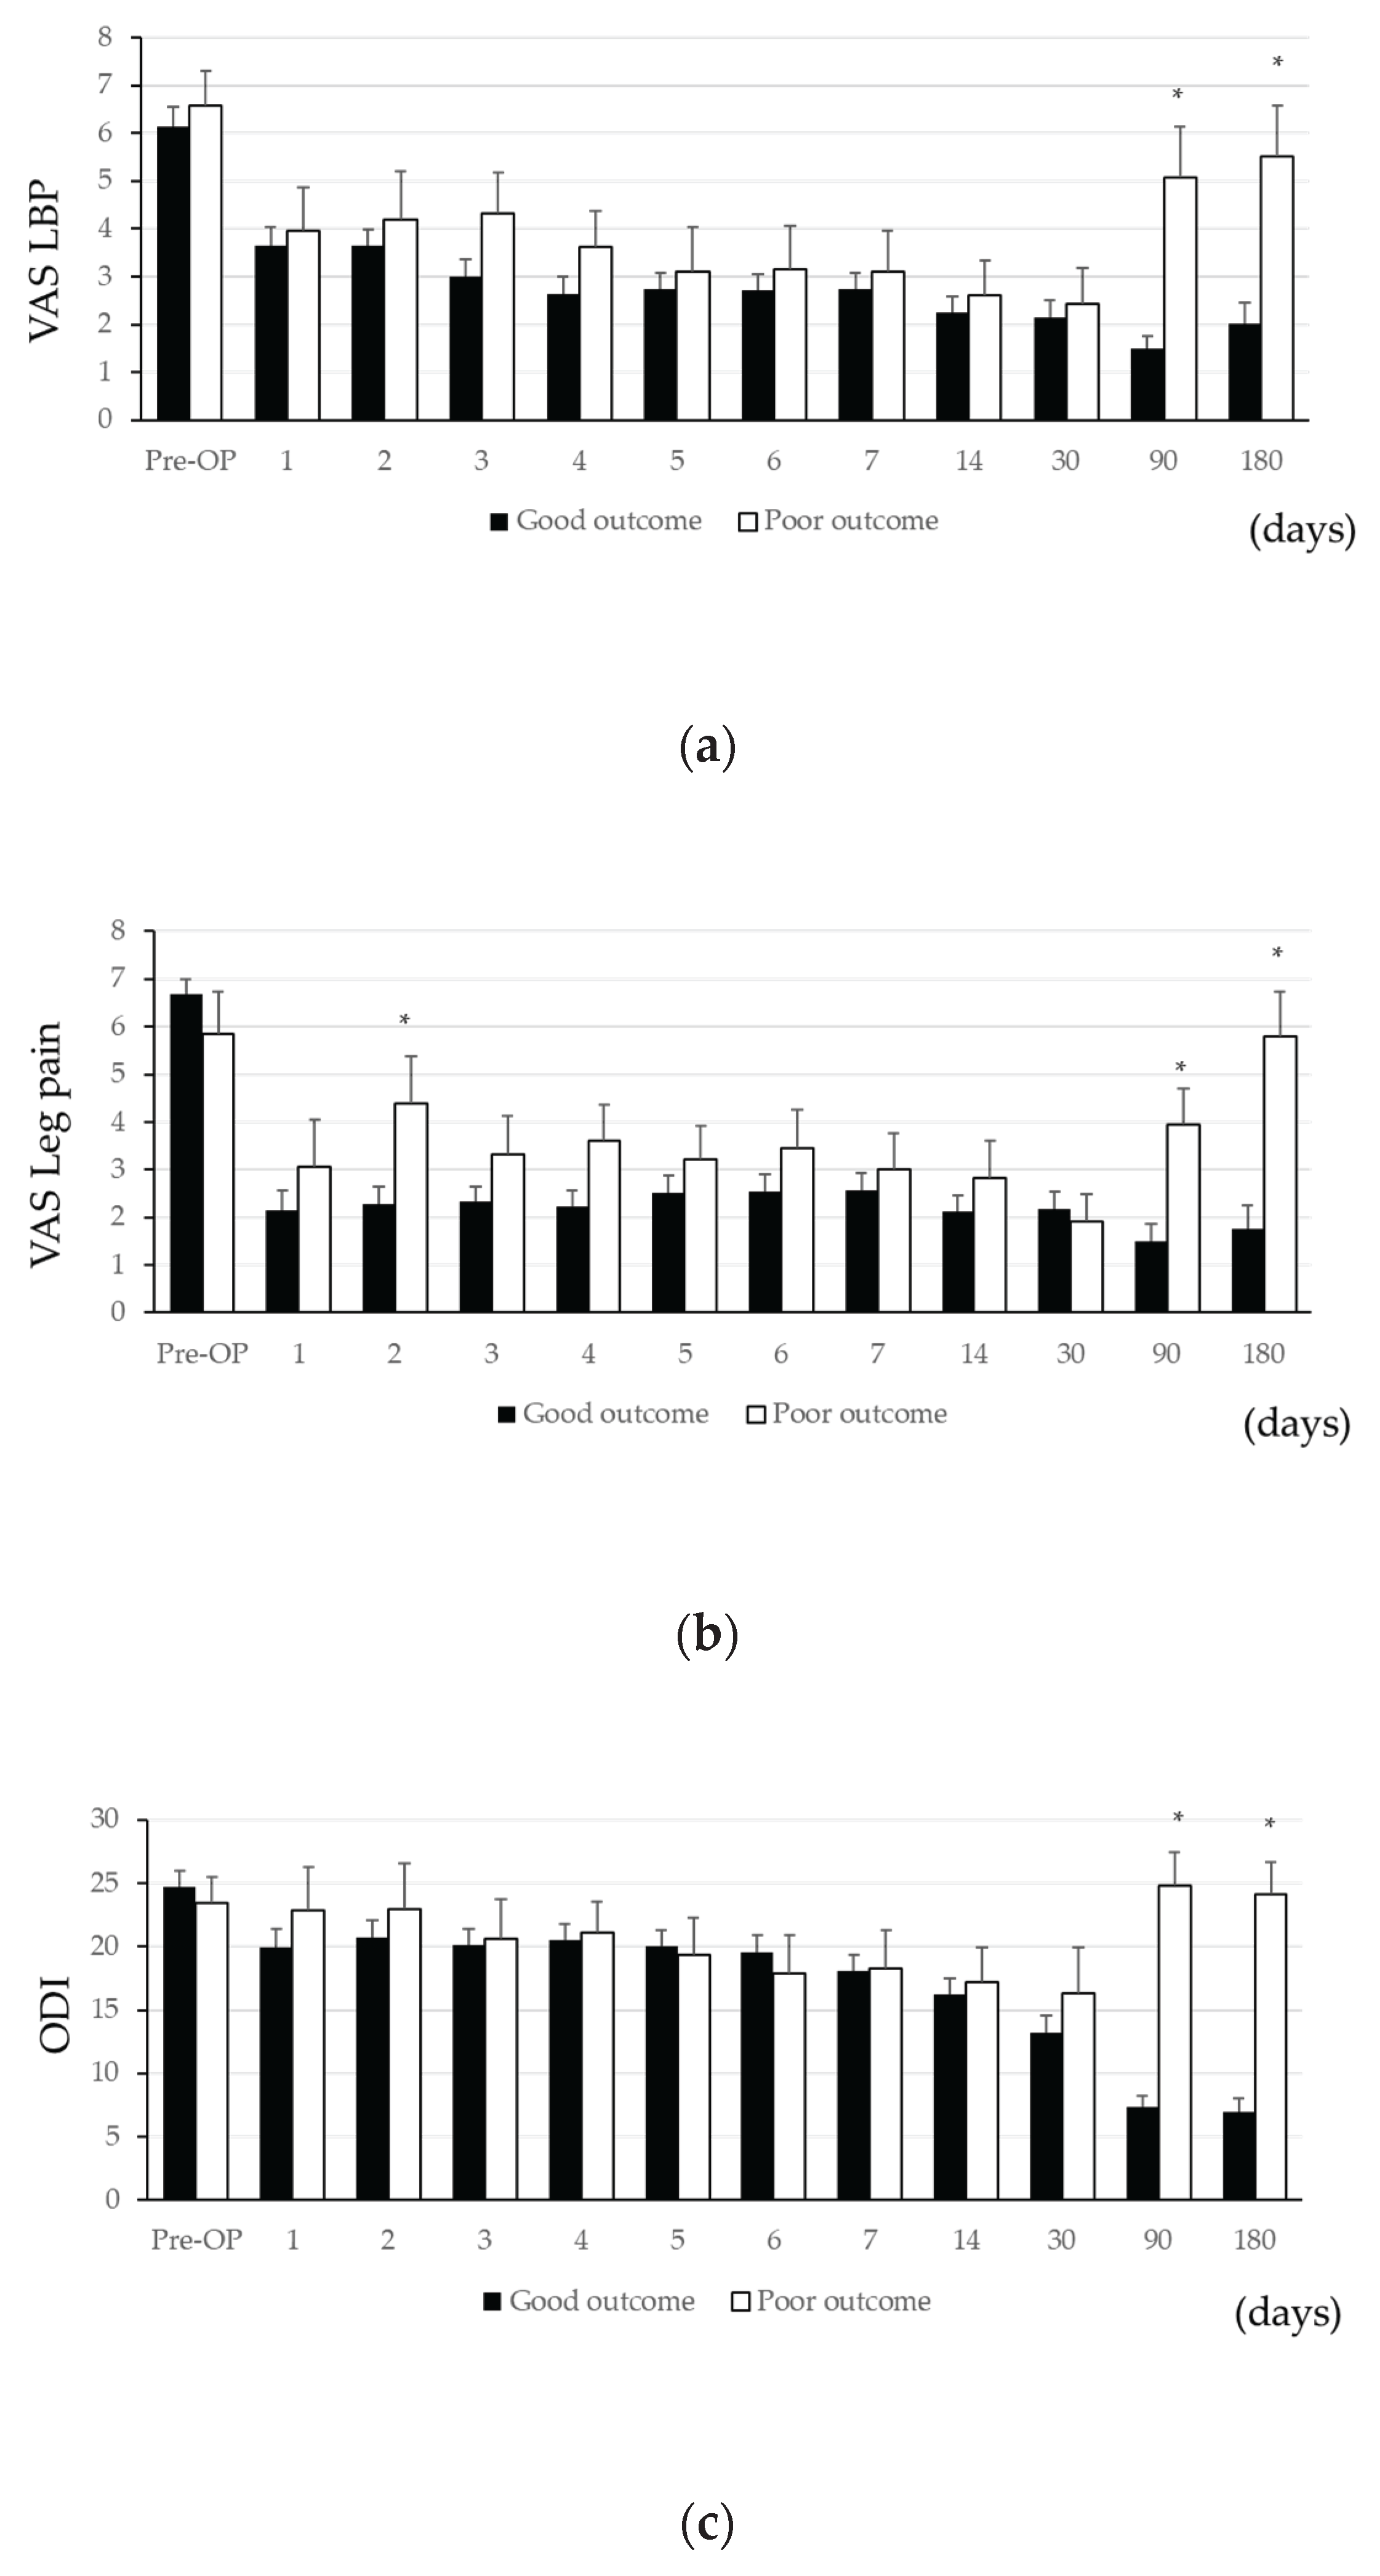
3.6. Comparison of Patient Demographics and Postoperative Course Between Good and Poor Outcomes Groups in Central/Paracentral LDH (Table 4, 6 and Figure 5)
Among the CP group, 48 of 57 patients (84.2%) achieved good outcomes. No significant differences were found in demographics or preoperative scores. LBP VAS did not differ significantly until day 90 and 180, when the G group showed lower scores. Similarly, leg pain VAS differed at day 2 and again from day 90 onward. ODI differences followed the same trend, with significant differences appearing only from day 90 onward, suggesting recurrence of symptoms and possible disc herniation recurrence in the P group.
Figure 5.
Of those with central/paracentral LDH: (a) Comparison of VAS Low Back Pain Over the Operative Course Between Good and Poor Outcomes (b) Comparison of VAS Low Leg Pain Over the Operative Course Between Good and Poor Outcomes (c) Comparison of ODI Scores Over the Operative Course Between Good and Poor Outcomes
3.7. Comparison of Patient Demographics and Postoperative Course Between Good and Poor Outcomes Groups in Foraminal LDH (Table 4, 7 and Figure 6, 7)
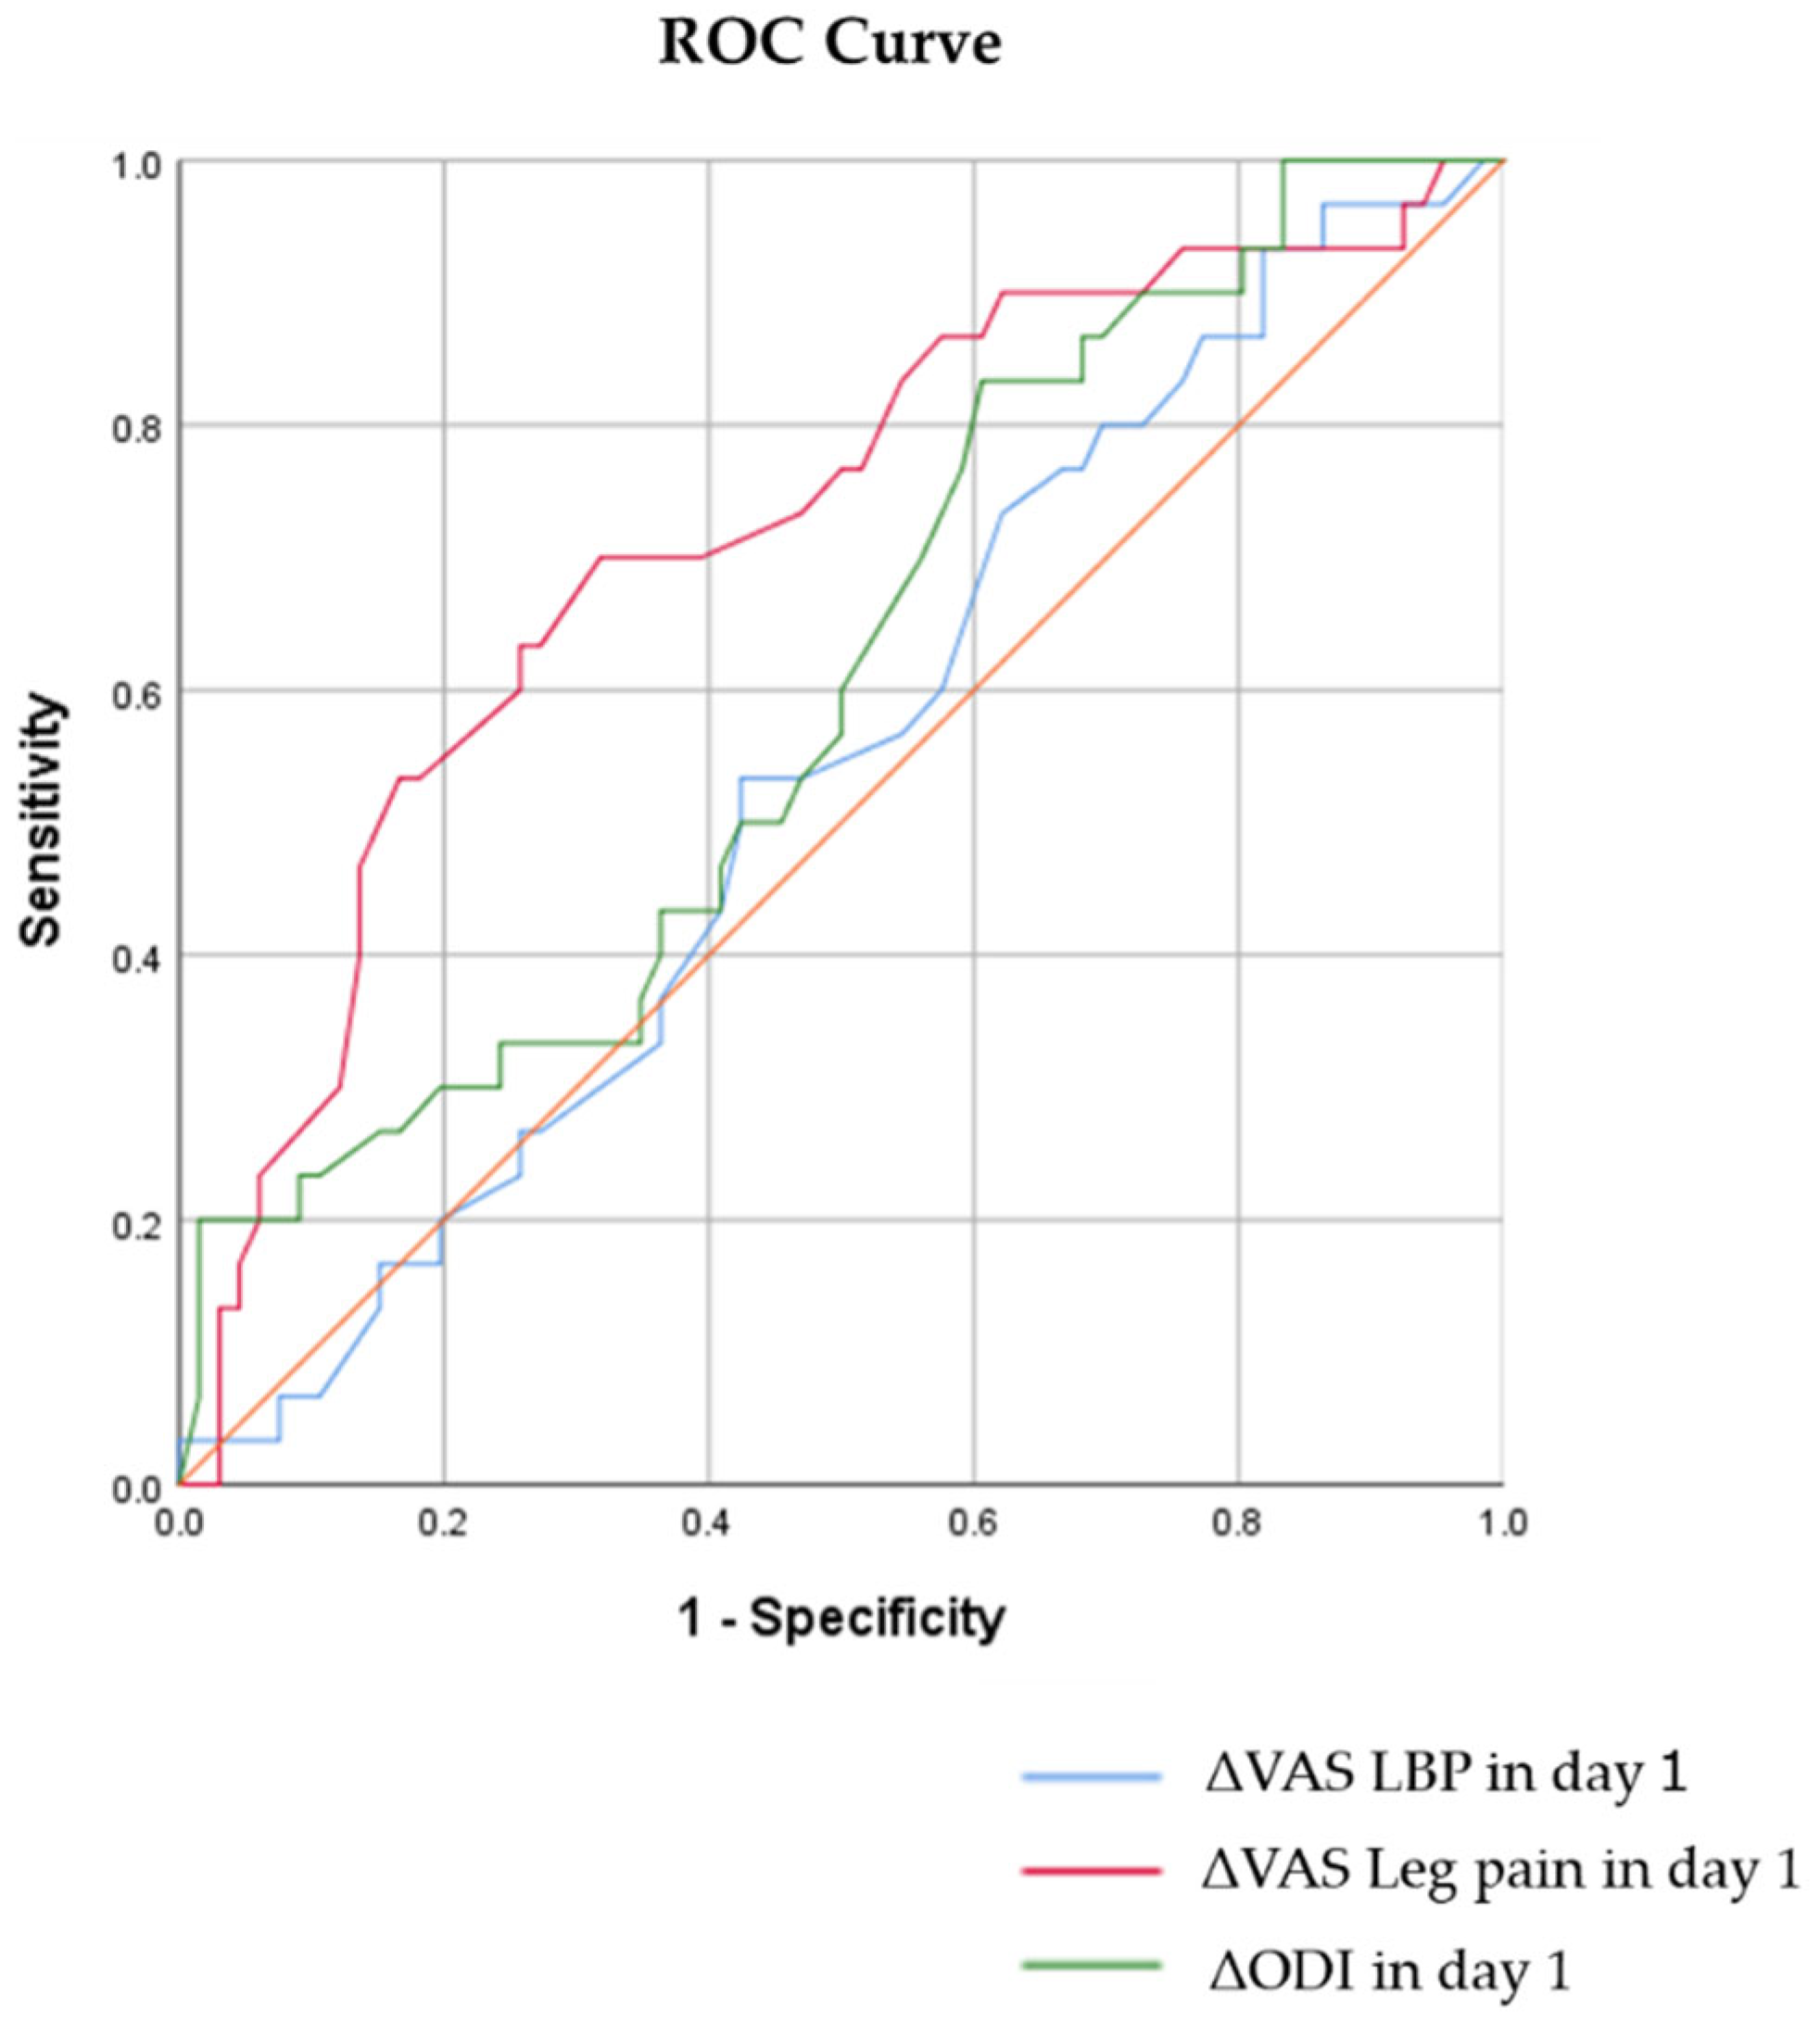
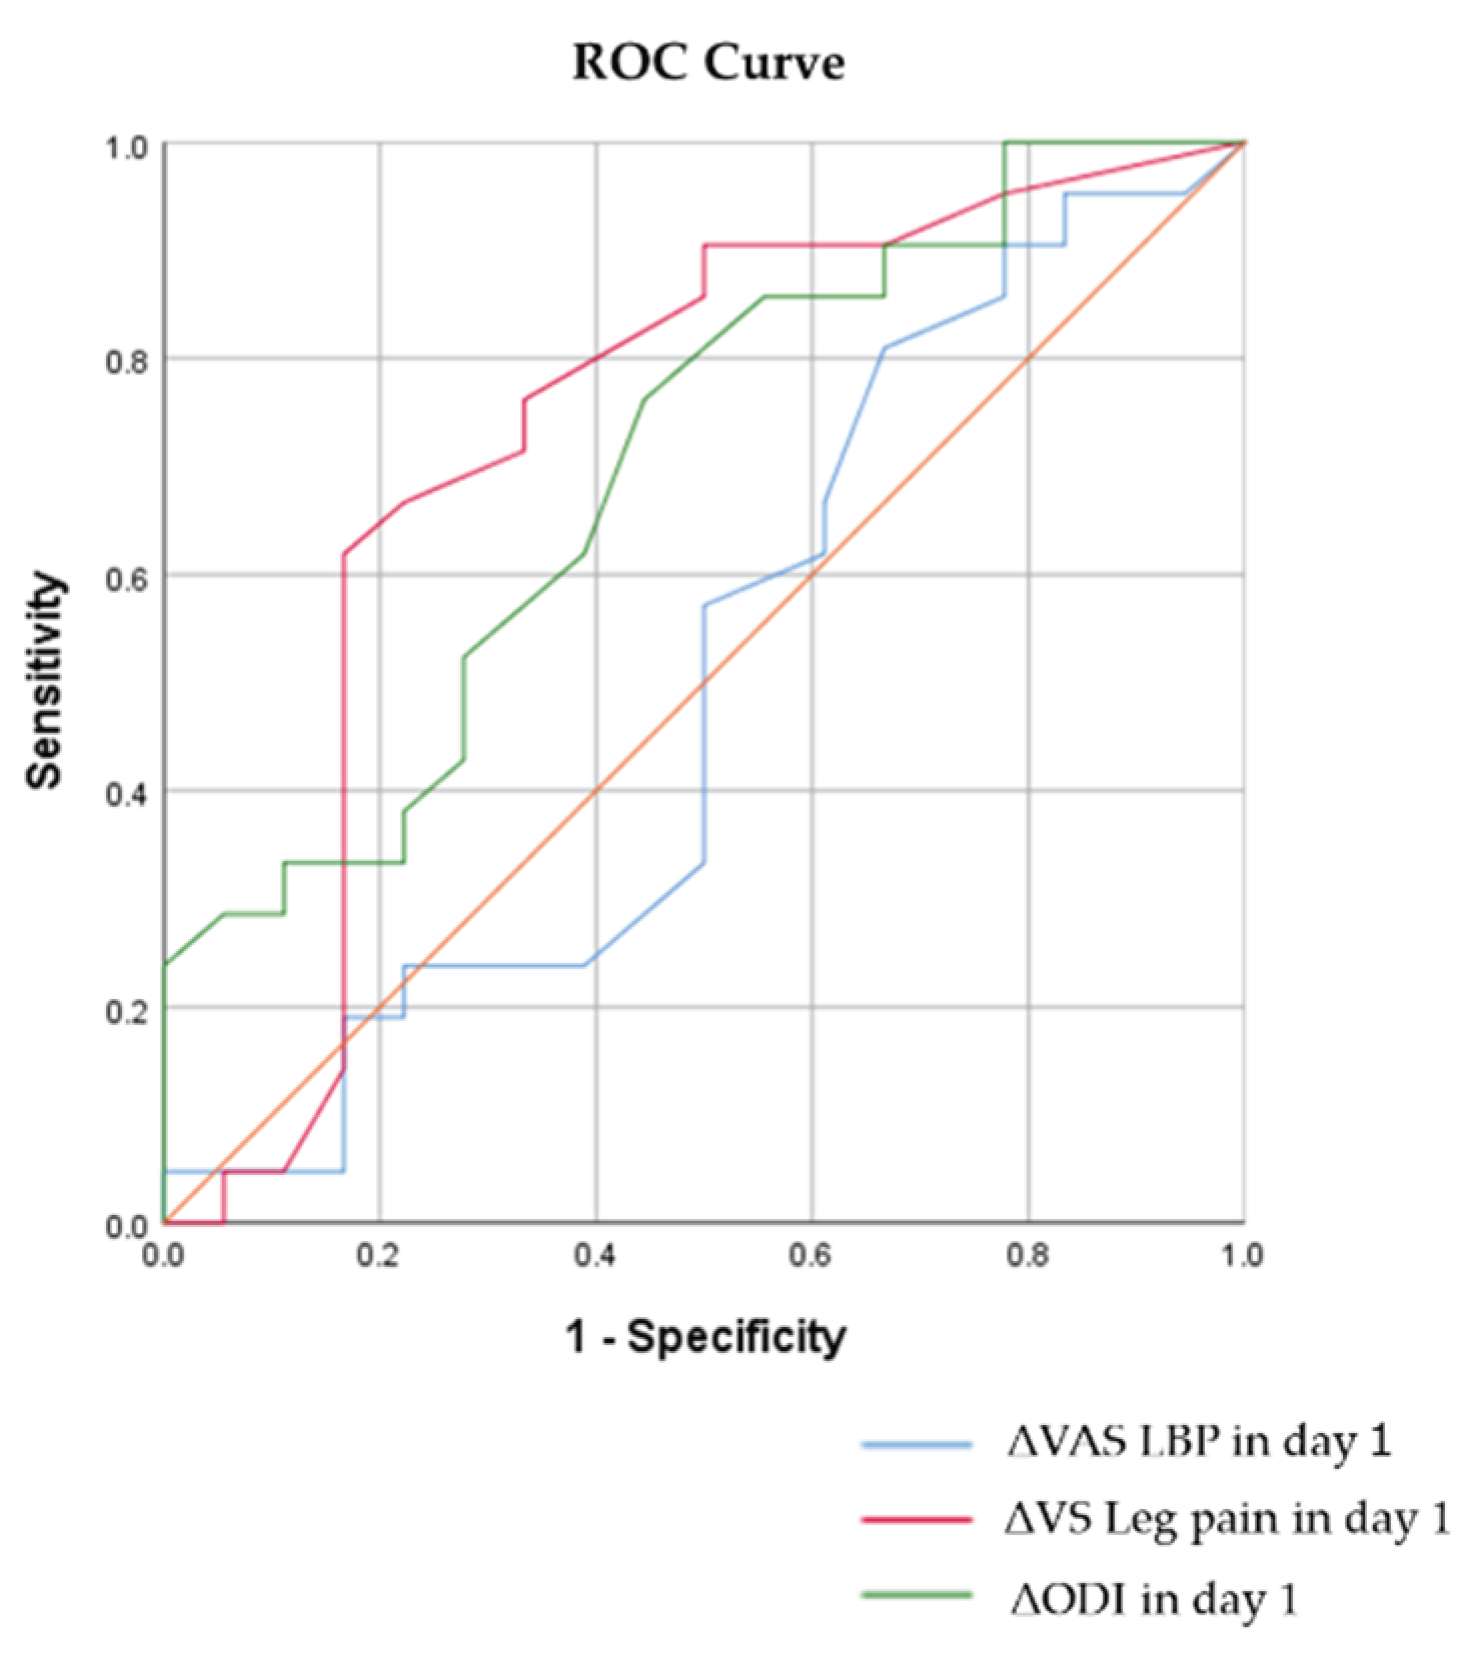
In contrast, only 18 of 39 F group patients (46.1%) had good outcomes, significantly lower than the CP group (p<0.001). No significant demographic or preoperative differences were observed. LBP VAS and leg pain VAS were significantly lower in the G group from day 1 onward, with persistent differences through day 180. ODI scores also followed this pattern. ROC analysis showed fair correlation for leg pain VAS (AUC 0.726) and ODI (AUC 0.700), with cutoff values of -3.25 (sensitivity 71.4%, specificity 72.2%) and -5.5 (sensitivity 76.2%, specificity 55.6%), respectively. These findings suggest residual symptoms in poor outcome cases, possibly reflecting surgical failure.
Figure 6.
Of those with foraminal LDH: (a) Comparison of VAS Low Back Pain Over the Operative Course Between Good and Poor Outcomes (b) Comparison of VAS Low Leg Pain Over the Operative Course Between Good and Poor Outcomes (c) Comparison of ODI Scores Over the Operative Course Between Good and Poor Outcomes
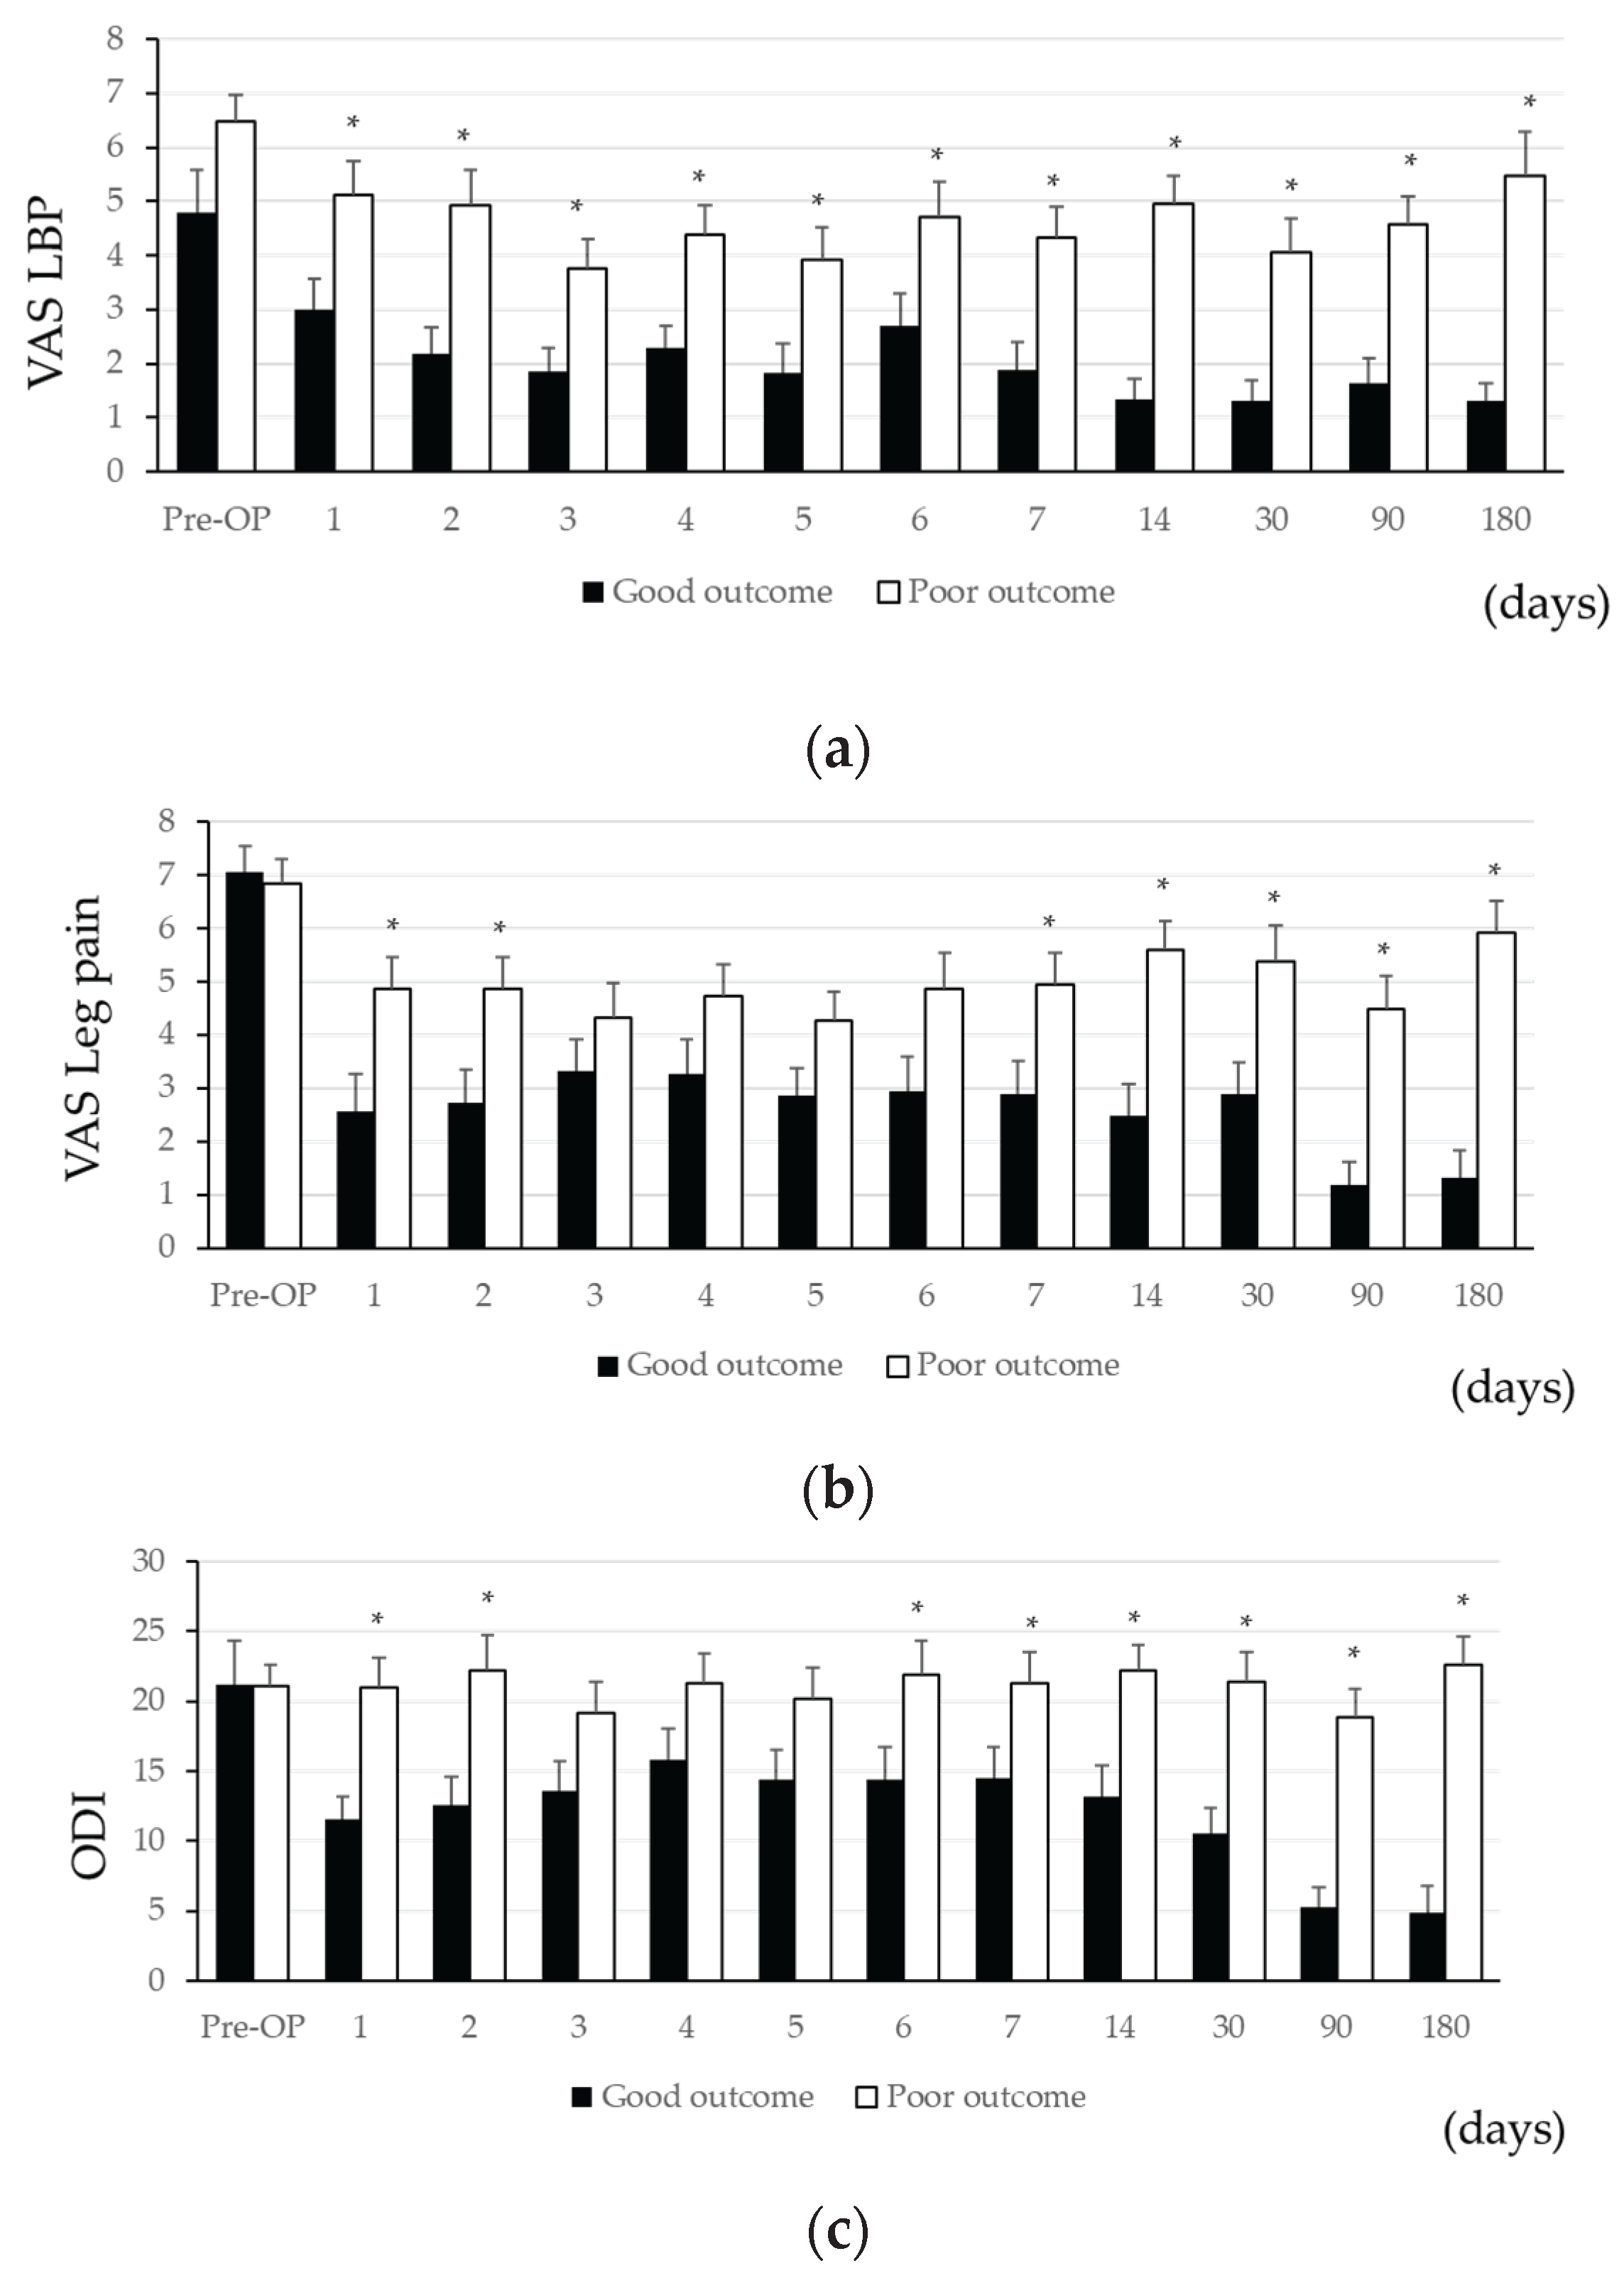
Figure 7.
ROC Curves for VAS (LBP & Leg Pain) and ODI on Day 1 After TELD
4. Discussion
In this study, we analyzed short-term clinical outcomes following TELD. LBP VAS scores improved to levels statistically indistinguishable from final follow-up within the first postoperative week, and leg pain VAS improved significantly by postoperative day 1. However, ODI scores showed gradual improvement, reaching significant changes over a 90-day period. Importantly, patients with foraminal LDH demonstrated significantly poorer outcomes compared to those with central or paracentral LDH. Additionally, in foraminal LDH cases, the degree of improvement in leg pain VAS and ODI on postoperative day 1 showed fair correlation with short-term outcomes. The cutoff values for predicting good outcomes were -3.25 for leg pain VAS (sensitivity: 71.4%, specificity: 72.2%) and -5.5 for ODI (sensitivity: 76.2%, specificity: 55.6%).
Previous studies have reported favorable outcomes of minimally invasive surgery (MIS) for central and paracentral LDH using interlaminar or transforaminal approaches. [17] While MIS has also been applied to foraminal LDH with reportedly good results, outcome variability remains. [18,19,20] Foraminal herniation frequently exerts pressure near the dorsal root ganglion, causing intense preoperative pain. Additionally, due to its location in the narrow, immobile foraminal space and often on the ventrocaudal side of the nerve root, visualizing and completely decompressing the herniation intraoperatively is technically challenging.
Several studies have identified poor prognostic factors including older age, prolonged symptom duration before surgery, smoking, obesity, and psychological stress. [21,22,23] Anatomically, vertically collapsed foramina due to advanced disc degeneration, multi-level disease, and segmental instability are implicated [24]. In our study, 57 central and paracentral LDH and 39 foraminal LDH cases were analyzed, with 84.2% and 46.1% achieving good short-term outcomes, respectively (p<0.001). Patients with foraminal LDH were significantly older (60.6 ± 1.8 vs. 48.6 ± 2.3 years, p<0.001), indicating a higher baseline risk. Interestingly, BMI was lower in the foraminal LDH cases (28.6 ± 1.1 vs. 32.3 ± 1.3, p=0.015), suggesting that high BMI did not negatively influence outcomes in this subset.
No cases demonstrated segmental instability, and prior lumbar surgery did not correlate with poor outcomes. While we did not assess disc degeneration or foraminal narrowing, such structural limitations likely constrained decompression effectiveness, particularly in foraminal herniation. The use of local anesthesia was more common in foraminal cases (48.7% vs. 28.1%, p=0.075), and across all 97 cases, poor outcome patients had significantly more frequent local anesthesia than good outcome patients (56.7% vs. 28.4%, p=0.039). Although previous reports suggest comparable efficacy between local and general anesthesia for transforaminal discectomy, some have noted superior short-term outcomes with general anesthesia in older adults, while others suggest long-term disadvantages for procedures performed under local anesthesia.
TELD is associated with minimal invasion of paraspinal muscles, potentially contributing to faster pain relief and functional recovery. Multiple studies have highlighted that short-term outcomes often correlate with long-term prognosis [25,26]. While some patients experience recurrence despite early improvements, and others achieve success through diligent rehabilitation, in general, favorable short-term outcomes predict favorable long-term results.
In our cohort of 97 patients, leg pain VAS reduction on postoperative day 1 showed a fair correlation with 3-to-6-month outcomes. Stratifying by herniation type revealed distinct patterns: central and paracentral LDH cases showed no correlation between postoperative outcomes at acute phase and final results, with poor outcomes attributed to symptom recurrence at 3 to 6 months. In contrast, foraminal LDH patients in the good outcome group demonstrated significantly better scores in all three measures (LBP VAS, leg pain VAS, ODI) from day 1 onward. Both leg pain VAS and ODI improvements showed fair correlations with short-term results.
Previous studies have also suggested correlations between early postoperative improvement and later outcomes [25,27,28,29]. In our analysis, the cutoff value for leg pain VAS on postoperative day 1 was -3.25 (sensitivity: 71.4%, specificity: 72.2%) and for ODI was -5.5 (sensitivity: 76.2%, specificity: 55.6%), indicating the potential to predict outcomes early. These results suggest that leg pain and lumbar function changes on the first postoperative day may serve as useful early indicators, particularly for evaluating the need for re-assessment or additional interventions in foraminal LDH cases.
Limitations in our study include not assessing smoking status, psychological factors, or anatomical characteristics such as herniation size, degree of disc degeneration, or spinal alignment. These unmeasured variables may have influenced outcomes. Moreover, postoperative MRI was not analyzed in this study, limiting the ability to differentiate between recurrent herniation and residual fragments in poor outcome cases.
5. Conclusions
Future studies should integrate detailed intraoperative assessments, advanced pre- and postoperative imaging, and quantitative morphological evaluation of disc pathology influencing outcomes. Incorporating procedural details from intraoperative videos and app-based monitoring of postoperative pain trajectories may further enable personalized postoperative management and early identification of patients at risk for suboptimal recovery.
Author Contributions
Conceptualization, K.S. and C.H; methodology, K.S. and C.H; validation, J.O., J.L., M.M., P.D., R.G., S.K., A.T. and O.K.; formal analysis, K.S.; i writing—original draft preparation, K.S. C.P..; data curation – K.S.; writing—review and editing, C.H., J.O., M.M., P.D., R.G., S.K., A.T., A.A., N.T., and O.K.; visualization, K.S.; supervision, C.H.; project administration, C.H.; funding acquisition, C.H.; All authors have read and agreed to the published version of the manuscript.
Funding
This study was supported by the Raisbeck family foundation.
Institutional Review Board Statement
The study was conducted in accordance with the Declaration of Helsinki, and individually approved by the Institutional Review Board of each participating university.
Informed Consent Statement
Informed consent was obtained from all subjects involved in the study.
Data Availability Statement
The datasets generated and/or analyzed during the current study contain protected health information (PHI) and are therefore not publicly available. Access to these data may be granted upon reasonable request and with appropriate permissions, in accordance with institutional and ethical guidelines.
Acknowledgments
The research team would like to extend thanks to the Endoscopic Spine Research Group (ESRG), of which Peter B. Derman, Christoph P. Hofstetter, Osama N. Kashlan, Sanjay Konakondla, and Albert E. Telfeian, Anubhav Amin, John Ogunlade, Mark Mahan, Meng Huang, Raymond Joseph Gardocki, are members. We also thank Cathryn Payne and Nguyen Tran (University of Washington) for coordination between institutions. The authors have reviewed and edited the output and take full responsibility for the content of this publication.
Conflicts of Interest
Christoph Hofstetter is a consultant for Joimax, Globus, and Kuros; and reports teaching for Joimax and AOSpine. John Ogunlade serves as a consultant for Arthrex. Peter Derman is a consultant for Arthrex, Joimax, and received royalties from DeGen Medicaland Accelus. The other authors have no personal, financial, or institutional interest in any of the drugs, materials, or devices described in this article
Abbreviations
The following abbreviations are used in this manuscript:
| TELD | Transforaminal Endoscopic Lumbar Discectomy |
| LDH | Lumbar Disc Herniation |
| LBP | Low Back Pain |
| VAS | Visual Analogue Scale |
| ODI | Oswestry Disability Index |
| POD | Postoperative Day |
| ROC | Receiver Operating Characteristic |
| AUC | Area Under the Curve |
| PROMs | Patient-Reported Outcome Measures |
| NSAIDs | Non-Steroidal Anti-Inflammatory Drugs |
| MRI | Magnetic Resonance Imaging |
| SAP | Superior Articular Process |
References
- Al Qaraghli, M.I. and O. De Jesus, Lumbar Disc Herniation. BTI - StatPearls.
- Gugliotta, M.; et al. Surgical versus conservative treatment for lumbar disc herniation: a prospective cohort study. (2044-6055 (Electronic)).
- Barber, S.M.; et al. Outcomes of endoscopic discectomy compared with open microdiscectomy and tubular microdiscectomy for lumbar disc herniations: a meta-analysis. Journal of Neurosurgery: Spine 2019, 31, 802–815. [Google Scholar] [CrossRef]
- Fujita, M.; et al. Comparative Study between Full-Endoscopic Discectomy and Microendoscopic Discectomy for the Treatment of Lumbar Disc Herniation. Medicina (Kaunas) 2020, 56. [Google Scholar] [CrossRef]
- Yang, C.C.; et al. Complications of Full-Endoscopic Lumbar Discectomy versus Open Lumbar Microdiscectomy: A Systematic Review and Meta-Analysis. World Neurosurg 2022, 168, 333–348. [Google Scholar] [CrossRef]
- Apaydin, A.S.; et al. Effects of different surgical treatments on pain, disability, anxiety and quality of life in lumbar disc herniation. (2444-054X (Electronic)).
- Chen, Z.; et al. Percutaneous Transforaminal Endoscopic Discectomy Versus Microendoscopic Discectomy for Lumbar Disc Herniation. Spine 2020, 45, 493–503. [Google Scholar] [CrossRef] [PubMed]
- Choi, G.; et al. Percutaneous Endoscopic Discectomy for Extraforaminal Lumbar Disc Herniations. Spine. 2007, 32, E93–E99. [Google Scholar] [CrossRef]
- Jasper, G.P.; Francisco, G.M.; Telfeian, A.E. Endoscopic transforaminal discectomy for an extruded lumbar disc herniation. Pain Physician 2013, 16, E31–E35. [Google Scholar] [CrossRef]
- Sivakanthan, S.; Hasan, S.; Hofstetter, C. Full-Endoscopic Lumbar Discectomy. Neurosurg Clin N Am 2020, 31, 1–7. [Google Scholar] [CrossRef]
- Leyendecker, J.; et al. Smartphone applications for remote patient monitoring reduces clinic utilization after full-endoscopic spine surgery. J Telemed Telecare 2025, 31, 866–872. [Google Scholar] [CrossRef] [PubMed]
- Prasse, T.; et al. Remote patient monitoring following full endoscopic spine surgery: feasibility and patient satisfaction. Journal of Neurosurgery: Spine 2023, 39, 122–131. [Google Scholar] [CrossRef] [PubMed]
- Rispoli, R.; Cappelletto, B. Telemedicine in practice: Patient selection and strategies adopted in spinal care during the COVID-19 era and beyond. (2229-5097 (Print)).
- Arriaga Criscuoli de Farias, F.; et al. Remote patient monitoring in spine surgery. Journal of Musculoskeletal Surgery and Research 2022, 6, 160–166. [Google Scholar] [CrossRef]
- Nakajima, I. Telecommunications for Disaster and Pandemics. New Breeze, 2013(Spring): p. 21.
- Wechsler, L.R.; et al. Teleneurology applications: Report of the Telemedicine Work Group of the American Academy of Neurology. (1526-632X (Electronic)).
- Liu, S.; et al. Minimally invasive MRIsurgery for lumbar disc herniation: a meta-analysis of efficacy and safety. International Journal of Surgery 2025, 111. [Google Scholar]
- Verla, T.; et al. The minimally invasive paramedian approach for foraminal disc herniation. Journal of Clinical Neuroscience 2020, 75, 62–65. [Google Scholar] [CrossRef]
- Gadjradj, P.S.; Harhangi, B.S. Percutaneous Transforaminal Endoscopic Discectomy for Lumbar Disk Herniation. Clinical Spine Surgery 2016, 29. [Google Scholar] [CrossRef]
- Wang, J.; et al. Prognostic factors for patient-reported satisfaction after percutaneous lumbar endoscopic discectomy at a minimum of two years' follow-Up. Sci Rep 2024, 14, 22194. [Google Scholar] [CrossRef] [PubMed]
- Mayer, H.M. [The delayed OP--indications for surgery of lumbar disc herniations]. (0044-3220 (Print)).
- Rubery, P.T.; et al. Preoperative Patient Reported Outcomes Measurement Information System Scores Assist in Predicting Early Postoperative Success in Lumbar Discectomy. (1528-1159 (Electronic)).
- Wilson, C.A.; et al. A systematic review of preoperative predictors for postoperative clinical outcomes following lumbar discectomy. The Spine Journal 2016, 16, 1413–1422. [Google Scholar] [CrossRef] [PubMed]
- Sugiura, K.; et al. Transforaminal Full-Endoscopic Surgery for Lumbar Foraminal Pathologies: A Comparative Clinical Effectiveness Study. Neurosurgery 2025, 96, S51–S62. [Google Scholar] [CrossRef]
- Whitmore, R.G.; et al. Predictive value of 3-month lumbar discectomy outcomes in the NeuroPoint-SD Registry. J Neurosurg Spine 2015, 23, 459–466. [Google Scholar] [CrossRef]
- Calek, A.K.; Hochreiter, B.; Buckland, A.J. Reassessing the minimum 2-year follow-up standard after lumbar decompression surgery: a 2-month follow-up seems to be an acceptable minimum. Spine J 2024, 24, 1244–1252. [Google Scholar] [CrossRef] [PubMed]
- Ziegler, D.S.; et al. The Association Between Early Postoperative Leg Pain Intensity and Disability at 1-Year and 2-Year Follow-Up After First-Time Lumbar Discectomy. Global Spine J 2021, 11, 81–88. [Google Scholar] [CrossRef]
- Shamim, B.; et al. Role of Visual Analogue Pain Score at Day 1 and 30 in Predicting Outcome after Full Endoscopic Lumbar Discectomy. Pakistan Armed Forces Medical Journal 2025, 75, 583–587. [Google Scholar] [CrossRef]
- Kim, C.H.; et al. Change of Pain Score for One Month after Endoscopic Lumbar Discectomy in Patients Who Showed Substantial Improvement of Pain and Who Did Not at Postoperative One Day. Korean J Spine 2011, 8, 97–101. [Google Scholar] [CrossRef]
Disclaimer/Publisher’s Note: The statements, opinions and data contained in all publications are solely those of the individual author(s) and contributor(s) and not of MDPI and/or the editor(s). MDPI and/or the editor(s) disclaim responsibility for any injury to people or property resulting from any ideas, methods, instructions or products referred to in the content. |
© 2025 by the authors. Licensee MDPI, Basel, Switzerland. This article is an open access article distributed under the terms and conditions of the Creative Commons Attribution (CC BY) license (http://creativecommons.org/licenses/by/4.0/).
Copyright: This open access article is published under a Creative Commons CC BY 4.0 license, which permit the free download, distribution, and reuse, provided that the author and preprint are cited in any reuse.


