
Submitted:
09 February 2026
Posted:
10 February 2026
You are already at the latest version
Abstract
The inherent temperature-dependent sublattice preference of constituent atoms in FCC_CoCuNi multi-principal element alloys (MPEAs) is theoretically predicted by combining a two-sublattice model based on the L12_AuCu3 prototype with computational thermodynamics, which extends beyond the commonly-believed, yet unreasonable randomly mixing solid solution hypothesis. Based on the predicted sublattice occupied fractions (SOFs) and available computer resource, two MPEAs atom distributing models with different sizes are established for different applications, respectively, where the bigger size model is further employed to analyze statistically the atom distributing character quantitatively and graphically, while the smaller size model is employed to study the lattice distortion of MPEAs further using first-principles calculations density functional theory. The atom distributing configurations of some representative heat treatment temperatures, as well as the hypothetical randomly mixing structure are compared. It is revealed that FCC_CoCuNi MPEAs exhibit strong temperature-dependent ordering behavior. The SOFs-based configurations are (Ni1.0000)1a(Co0.4445Cu0.4444Ni0.1111)3c, (Co0.0653Cu0.0721Ni0.8626)1a(Co0.4227Cu0.4204Ni0.1569)3c, and (Co0.1574Cu0.1593Ni0.6833)1a(Co0.3920Cu0.3913Ni0.2167)3c at 100 K, 900 K, and 1400 K, respectively. Overall, Ni atoms always prefer to 1a sublattice and the preference tendency reduce a little bit at considerable high temperatures. The configurational entropies of FCC_CoCuNi MPEAs increase with the increase of heat treatment temperature, while they are considerably lower than that of the hypothetical ideal random solid solution. Based on the atom distributing model of MPEAs, the local atomic cluster characteristics are further investigated by statistically analyzing the coordination numbers of the constituent atom coordinated with the same type of atoms. The radial distribution function (RDF) further verified the atom aggregating behavior. For most family of crystal planes in FCC_MPEAs, except {1 1 1}, there are obviously different atom distributing characters between the even and odd layers. The atom distributing model of some representative bulk structure and surface structure are afforded valuably for reference and application both in experimental and theoretical investigation further. Thus, rich and indispensable structural genome data are afforded for the further research and development of the promise FCC_CoCuNi MPEAs intensively.
Keywords:
multi-principal element alloys (MPEAs)
; alloy thermodynamics
; sublattice preference
; microstructure at atomic level
; lattice distorting behavior
; computational materials science
1. Introduction
Over the past two decades, high-entropy alloys (HEAs), synthesized by mixing multiple principal elements in equimolar or near-equimolar proportions, have been shown to possess exceptional properties [1,2,3,4] Among them, CoCuNi have emerged as promising candidates for various advanced applications [5,6,7]. Benefiting from synergistic effects, potential application in the field of catalysis compared to conventional oxides [8]. For instance, catalysts composed of low-cost CoCuNi MPEAs display excellent performance, close to the noble metal-based catalysts RuO2 or IrO2 in the hydrogen evolution reaction (HER) [9,10]. In addition, owing to their distinctive magnetic and magnetoresistive properties, Co-Cu alloys are recognized as robust candidate systems for synthesizing magnetic heterostructures [11], which can be potentially applied as materials for magnetic devices such as MEMS [12]. The incorporation of Ni contributes to enhancing the magnetic properties of Co-Cu systems [13,14,15], compared with that of Cr, Fe, or Mn. Karpuz et al. discussed the correlation of magnetic properties from the perspective of microstructure [16], it is found that adjusting the deposition potential exerts a crucial influence on the film composition, microstructure, and magnetic properties of ternary CoCuNi alloys simultaneously. Mondal et al. [17] prepared nanoscale ternary Cu50Co25Ni25 alloys at different annealing temperatures, verifying the correlation between microstructure and magnetic properties.
FCC_CoCuNi MPEAs have been successfully prepared via traditional vacuum arc melting methods, as well as new approaches including electrodeposition [18] and microemulsion [19] methods. However, till now, the inherent composition and temperature-dependent sublattice preference, or the atom distributing characteristics remain unclear, which hinders the intensive understanding and modulating the heat treatment process, microstructure, diverse properties and potential applications for this inexpensive MPEAs. Traditionally, atoms in MPEAs are generally assumed to be randomly distributed on the full crystal lattice structure, but in our view, such a hypothesis is unreasonable, since the inherent differences exist both for the various constituent sublattices and the various constituent atoms, let alone the influence of heat treatment temperature, are neglected in total, thus, severe miscalculations are inevitable. Most recently, Ding emphasis that the study of MPEAs should be switch from the traditional disorder-believed to ordered structure character care [20]. In fact, we realized this issue since 2011 [21], and sustained explorations have been carried out [21,22,23,24,25,26,27,28,29,30,31]. In our previous work, the possibilities of forming FCC high entropy alloys in equal-atomic systems CoFeMnNiM and CoFeMnNiSmM have been explored by considering the criteria of Gibbs free energy of formation and the configurational entropies simultaneously, due to the limitation of available computer resource, only the total energy at ground state were calculated using first-principles calculation based on Density functional theory (DFT). After carrying out long-time explorations, we proposed a general sublattice model that integrates computational thermodynamics with first-principles calculations based on combining DFT and density functional perturbation theory (DFPT) to predict sublattice preference and its order-disorder transitions [22]. The framework has been successfully applied to investigate the mechanical or chemical properties of some typical intermetallic compounds and MPEAs. For example, Hamid et al. [23] revealed that in Ni3Al-based γ’ phase (L12 structure) superalloys, Cr can significantly improve the microhardness of the alloy, while Mn exerts the most pronounced effect on reducing the bulk modulus and shear modulus based on the sublattice preference. Chen et al. [24,25] investigated the atom distributing behavior, lattice distorting behavior and mechanical properties of CoCrNi, CoNiV and CoCrFeNi MPEAs. For FCC_CoNiV MPEAs, Zhang et al. [26] found that the predicted temperature-dependent hardness of SOFs-based structure agree well with the available experimental results, while the special quasirandom structure (SQS) model is lower about 50%. Qiao et al. [27] revealed the non-periodic diffusion energy barrier waves for the C atom diffusing along the neighboring octahedra in FCC_CoNiV MPEA with (V1.0000)1a(Co0.4445Ni0.4444V0.1111)3c. Weng et al. systematically investigated the oxygen evolution reaction (OER) of FCC_CoFeGaNiZn [28], and HER of FCC_CoCrFeNi [29], and Su et al. [30] systematically investigated the OER of FCC_CoCuFeNiPd and CoCuFeNiRu. by systematically analyzing the intermediate adsorption behavior and free energy changes surface adsorption sites, they revealed that the average overpotential is in excellent agreement with the available experimental value for the SOFs-based model, significantly outperforming the results obtained from the SQS model. Qian et al. [31] revealed the influence of N content on structures and mechanical properties of FCC_(AlCrMoTiV)1-xNx high entropy nitrides, and the surface oxidation mechanism and mechanical properties of lightweight MPEAs AlCrMoTi and AlCrMoTiV based on sublattice preference. Even for the complex intermetallics with three sets of sublattices [32] or four sets of sublattice [33], the predicted SOFs agree well with the available experimental data.
In this work, the temperature-dependent sublattice preference of constituent atoms of FCC_CoCuNi MPEAs is predicted quantitatively and graphically. Based on the predicted SOFs, the atomic distribution characteristics and associated lattice distorting behavior are analyzed. The fundamental and essential structure model of some representative bulk structures and surface structures at atom scale are established based on the sublattice preference, which are expected to facilitate the potential application to explore the microstructure and diverse properties of FCC_CoCuNi MPEAs from experimental and theoretical aspects, promote especially the potential applications in catalytic and magnetic research fields.
This paper comprises four sections. Following the introduction in Section 1, Section 2 briefly outlines the theoretical models and the computational parameters used in calculations. Section 3 presents a detailed analysis of temperature-dependent sublattice preference, local ordering behavior, lattice distorting behaviors, and surface models. Finally, the conclusions of the study are summarized in Section 4.
2. Materials and Methods
2.1. Sublattice Model of MPEAs with FCC Structure
The crystal lattice structure information of the L12_AuCu3 prototype employed in simulating the FCC MPEAs is presented in Table 1, and the fundamental information of structures and properties of stable elements at room temperature involved in this study is shown in Table 2.
As mentioned in Section 1, considering the obvious difference between the constituent sublattice 1a and 3c, the difference between the three kinds of constituent atoms HCP_Co, FCC_Cu, and FCC_Ni, as well as the tremendous influence of heat treatment temperature on the microstructure and properties, in this work, the temperature-dependent sublattice preference of the different kind of constituent atoms of FCC_CoCuNi MPEAs are predicted theoretically by combining the two-sublattice model based on the AuCu3 prototype with L12 structure (L12_AuCu3) and computational thermodynamics, where the thermodynamic process of MPEAs formed from the constituent atoms is described quantitatively. The general approach has been reported in detail previously and summarized briefly here for following easily.
The general two-sublattice model of multi-component alloy phase is presented in Equation (1), the variable in the two-sublattice model, denotes the SOFs of element on sublattice , while represents the constituent elements within the alloy system, and corresponds to distinct sublattices defined by Wyckoff positions. and the corresponding FCC_CoCuNi MPEA is shown in Equation (2). The synthesis reaction equation of FCC_CoCuNi MPEA synthesized from the pure elements with stable crystal structure is shown in Equation (3). This equation expresses the overall stoichiometry of the alloy as a weighted distribution of SOFs across distinct Wyckoff positions, with 1/4 of the lattice sites belonging to the 1a sublattice and the remaining 3/4 to the 3c sublattice.
The Gibbs energy of formation of the synthesis reaction equation of FCC_CoCuNi MPEAs prepared from the pure elements with stable crystal lattice structure is independent of intermediate reaction pathways and depends solely on the initial and final states of the system. Based on these characteristics of state function, an alternative computational approach for Gibbs energy of formation is adopted: first, the Gibbs energies of formation of the end-member compounds are calculated. These are then transformed into complex alloy phases via a two-stage synthesis process. As an example, the chemical reaction pathway for the formation of CoCuNi MPEAs with an FCC structure from pure elements is illustrated in Figure 1. The total Gibbs energy of the system is subsequently calculated using Equation (4).
where the constitutes a critical parameter, representing the formation energy of the ordered end-member compound formed from stable elements at ambient temperature. The units of are normalized to (eV/atom) when the thermodynamic data are processed, and subsequently converted to J/(molatom). represents the SOFs on distinct sublattice. In this work, the thermodynamic database of end-member Gibbs free energies previously established by our research group is directly applied to calculate the alloy thermodynamics under phase equilibrium conditions, and thus the thermodynamic properties, SOFs, and configurational entropy at different temperatures can be obtained. in Equation (4) is the excess Gibbs free energy of formation describes the remaining part of the real Gibbs energy of formation of the phase when the first three terms have been subtracted from the real Gibbs energy, which is ignored in this paper. The main reason is that the excess Gibbs free energy is normally treated using some special polynomial involving interaction parameters, and the interaction parameters are optimized by fitting the available thermodynamic properties of the considered system. However, in this work, the available structural information such as sublattice preference and vacancy concentration, and thermodynamic properties of the considered systems are rather insufficient. We employed the quasi-harmonic approximation (QHA) calculations to consider the main part of thermodynamic properties at a definite temperature, so we ignored excess Gibbs free energy in this study although it is necessary to consider precisely in the future. As for the physical contribution to , in the present work, consider the complexity of the sublattice occupied configuration, the contribution of magnetic entropy is ignored. It is worth noting that the SOFs obtained based on the thermodynamic database were calculated using the Thermo-Calc software [34].
2.2. First-Principles Calculations
All first-principles calculations presented in this work are performed using the Vienna Ab initio Simulation Package (VASP) [35] based on DFT. Due to the presence of 3d transition metals in the studied systems, spin polarization is included. A plane-wave kinetic energy cutoff of 400 eV is applied for all calculations. Structural relaxations are performed using the conjugate gradient (CG) algorithm, with electronic convergence achieved when the total energy change is less than 1×10⁻⁵ eV. Structural convergence is defined by a force tolerance criterion of 0.05 eV/Å. The RMM-DIIS algorithm is used for the iterative solution of the Kohn-Sham equations. Sampling over the Brillouin zone employed a 2×2×2 Monkhorst-Pack k-point mesh [36], which yielded 4 irreducible k-points for the MPEAs modelled bases on the 3×3×3 supercell of FCC_L12_AuCu3 prototype.
3. Results and Discussion
3.1. Temperature-Dependent Sublattice Preference of FCC_CoCuNi MPEAs
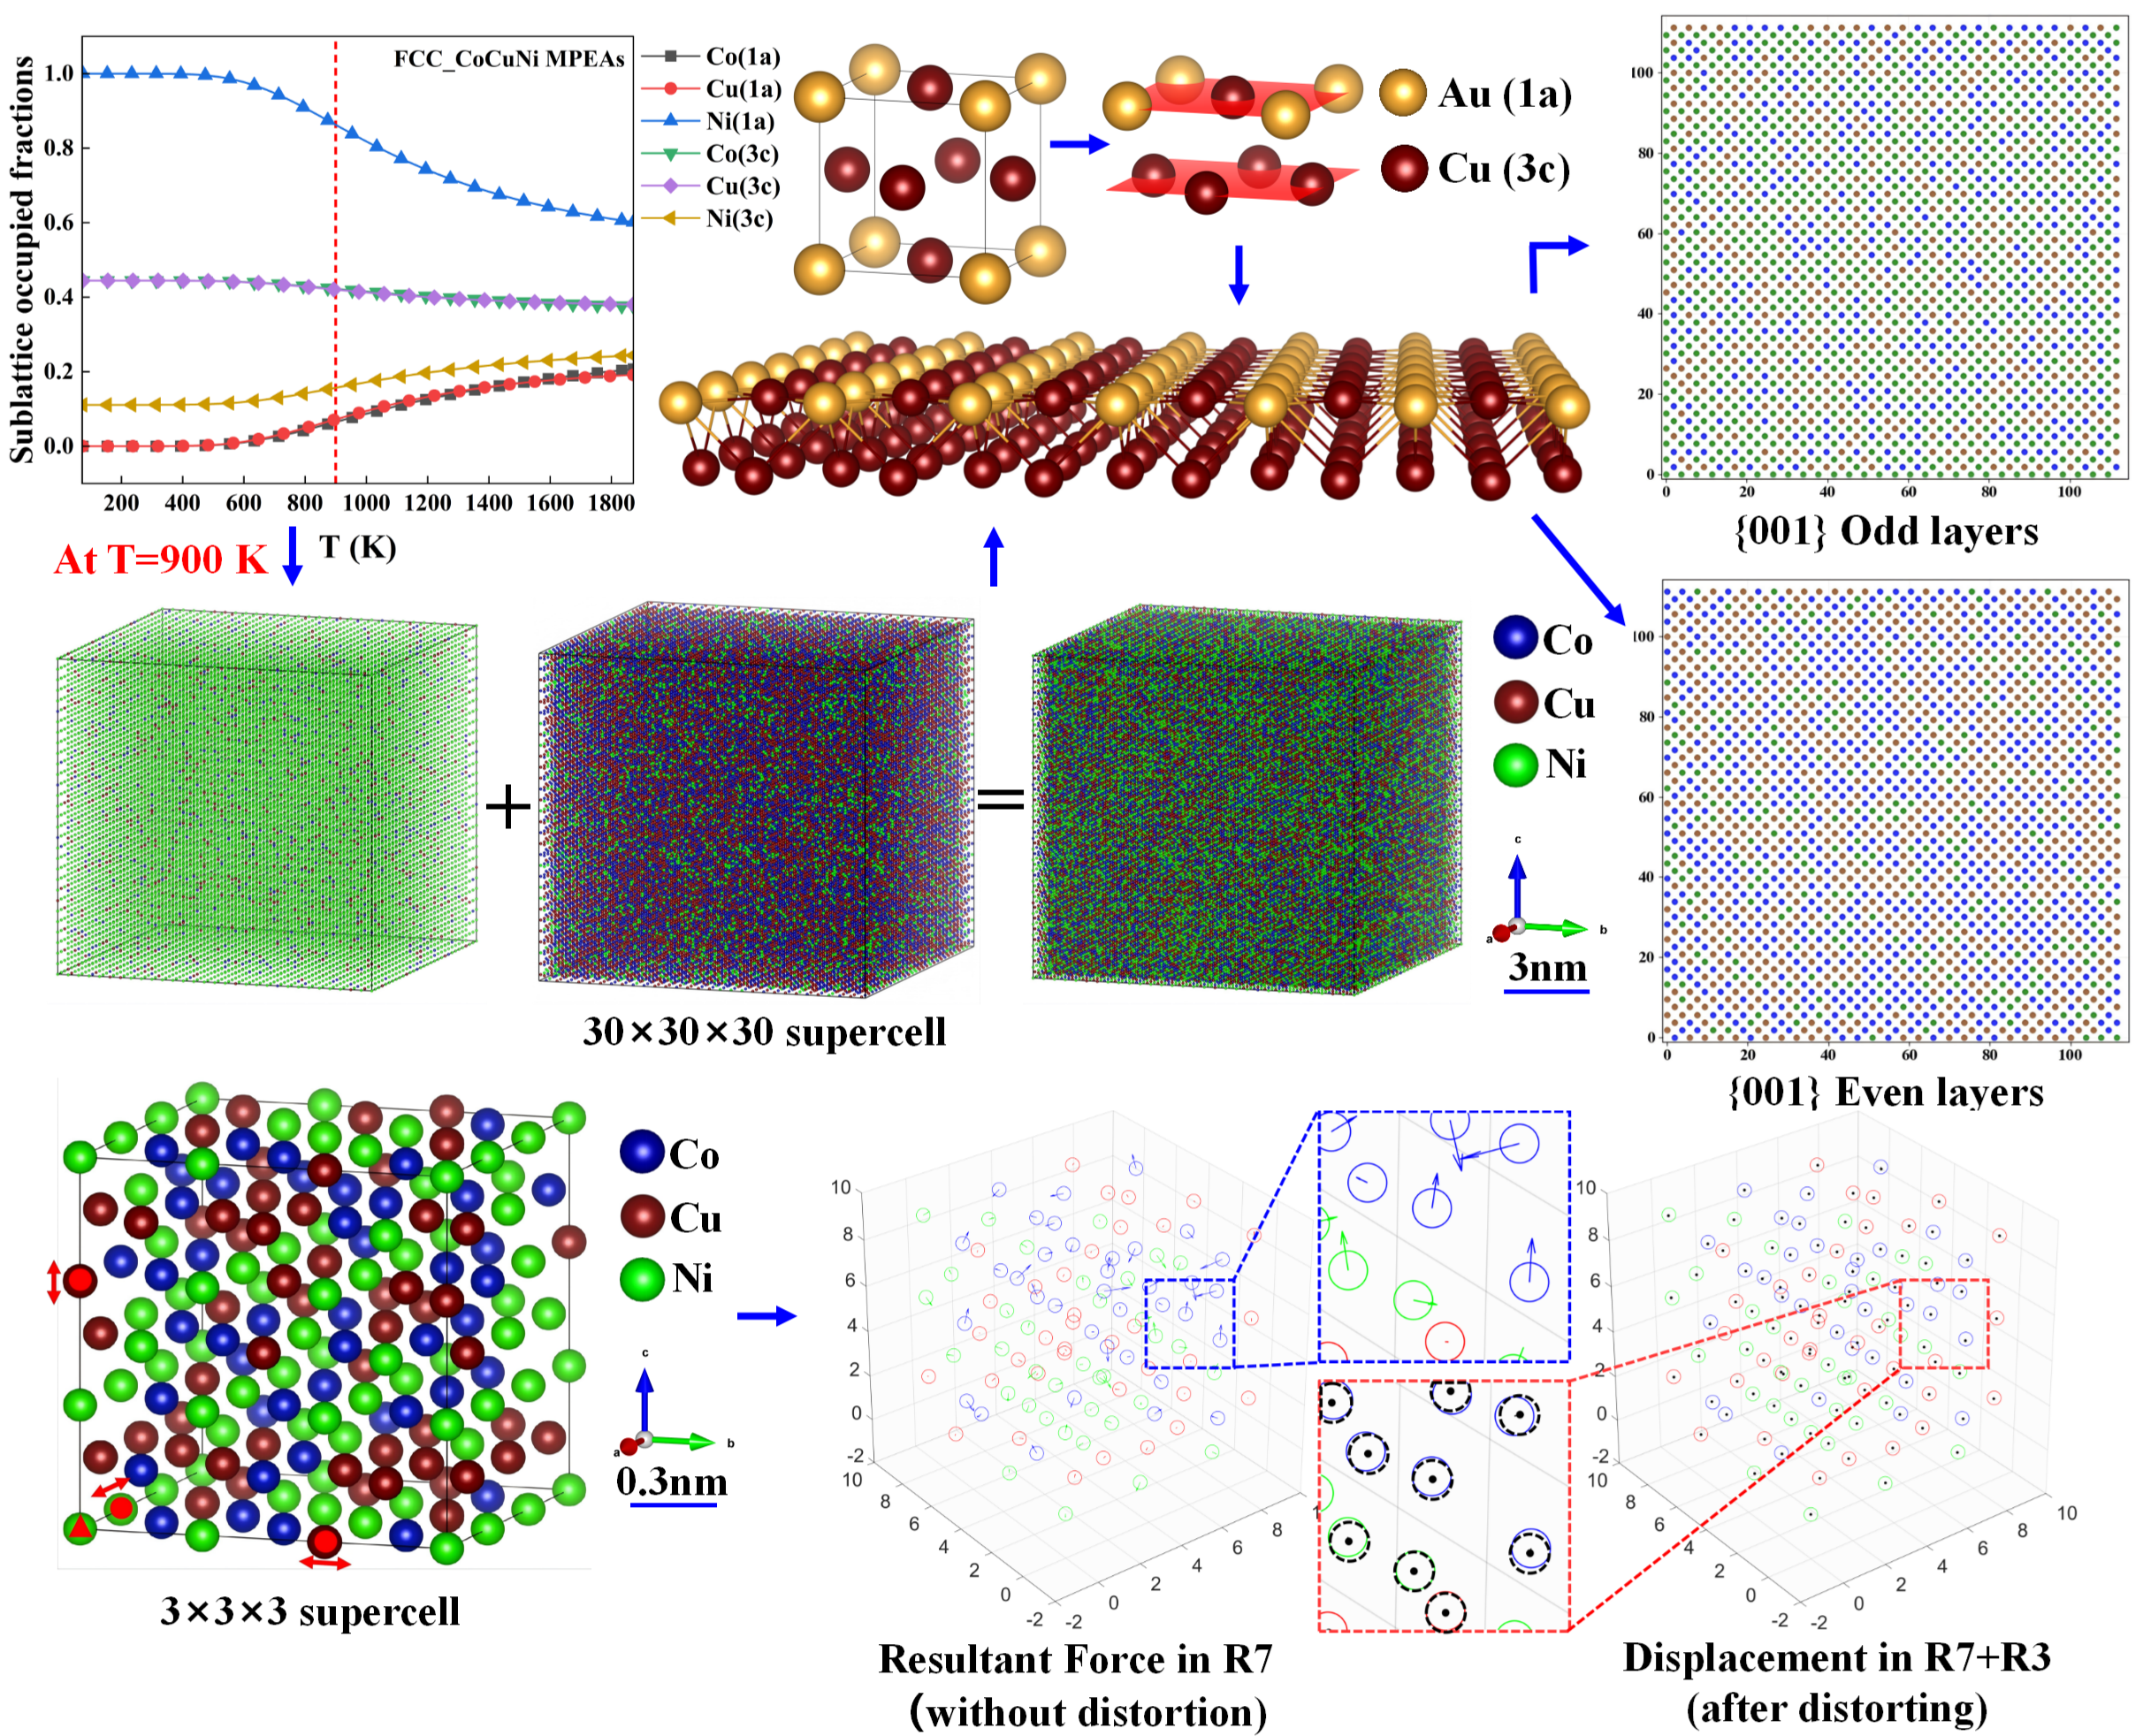
For the CoCuNi alloy with an FCC lattice structure, the sublattice occupied behavior of alloying atoms on the different kinds of sublattices is predicted and plotted as temperature-dependent SOFs, based on a thermodynamic database of end-member Gibbs free energy of formation functions established in this work, which has been decribled in our ealy publications.[22,23,25]. The temperature-dependent SOFs are presented in Figure 2.
From Figure 2, the obvious temperature-dependent sublattice preference behavior is observed in FCC_CoCuNi MPEAs. For example, the SOFs-based configurations are determined as (Ni1.0000)1a(Co0.4445Cu0.4444Ni0.1111)3c, (Co0.0653Cu0.0721Ni0.8626)1a(Co0.4227Cu0.4204Ni0.1569)3c, and (Co0.1574Cu0.1593Ni0.6833)1a(Co0.3920Cu0.3913Ni0.2167)3c at 100 K, 900 K, and 1400 K, respectively. Overall, Ni atoms predominantly occupy the 1a sublattice over the entire temperature range, whereas Co atoms and Cu atoms occupy the 3c sublattice, which exhibit analogous temperature-dependent trends. At low temperature below 500 K, Ni atoms occupy the full 1a sublattice, and the minor rest Ni atoms occupy the 3c sublattice, whereas all the Co and Cu atoms occupy the 3c sublattice. At middle temperature from 500 K to 1200 K, the sublattice preference of Ni change a little bit, tha is, gradually shifts from strong preferring to 1a sublattice to slight preferring to 1a sublattice, some of the Ni atoms replace sublattice with some of the Co and Cu atoms When the heat treatment is carried out above 1200 K, the atom site preferences are weak considerably although the dominant preferred sublattice of each kind of constituent element is maintained. Detailed digital temperature-dependent SOFs data are provided further application in the electronic Supplementary Materials.
The corresponding thermodynamic properties of formation of the FCC_CoCuNi MPEAs formed from the constituent atoms are predicted based on the formula Equation (4), where the stable structures at room temperature are taken as reference (SER), i.e., the reference state defined in CALPHAD community. The results are plotted in Figure 3. Including the temperature-dependent Gibbs free energy of formation (Figure 3a), enthalpy of formation (Figure 3b), entropy of formation (Figure 3c), configurational entropy (Figure 3d). For comparison, the temperature-dependent Gibbs free energy of formation (Figure 3a) and the configurational entropy (Figure 3d) of the hypothesis randomly mixing structure are also calculated and imposed, and the two kinds of configurational entropies are calculated based on Equations (5) and (6), where the SOFs of the randomly mixing structure of MPEAs is actually equal to the alloy composition, and for the ternary equimolar alloy, all the data are 0.333. We can see that temperature-dependent Gibbs free energy of formation of randomly mixing structure is always more positive that the SOFs structure, which means the SOFs structure is more stable in thermodynamics than the randomly mixing structure. Meanwhile, the randomly mixing structure over estimates the configurational entropies.
Normally, the perfect or ideal randomly mixing in real alloy systems can not achieve due to the inherent competitive bonding behaviors exist between the different types of the constituent atoms [37]. This observation indicates that the configurational entropy calculated from the randomly mixing configuration only predicts the atomic arrangement of the alloy at high temperatures and fails to captures the thermodynamic evolution of configurational entropy with the increase of heat treatment temperature. Although the reduced configurational entropy tends to increase the Gibbs free energy of formation, the magnitude of the decrease in the enthalpy of formation, as shown in Figure 3b, is substantially larger. This dominant effect of enthalpy on the thermodynamic equilibrium leads to a more negative overall the Gibbs free energy of formation, which suggests that the formation of the FCC_CoCuNi MPEAs within the SOFs framework possesses a stronger thermodynamic driving force. Overall, the configuration based on SOFs can more realistically reflect the thermodynamic behavior of MPEAs, since it takes into account the intrinsic atomic interactions and sublattice preferences inherent to these multi-component systems.
3.2. Graphical Characterization of the Atom Distribution and Local Range Ordering Behavior
To quantitatively characterize the sublattice preferences of the different atoms on the different kinds of sublattices, the atomic-scale spatial arrangement is visualized based on the SOFs predicted from thermodynamic equilibrium calculations in Section 3.1. For the FCC_CoCuNi MPEAs, atomic configurations at three different temperatures are modeled, which correspond to the phase equilibrium states under different heat treatment. The atom configurations based on SOFs of three representative heat treatment temperatures are determined as (Ni1.0000)1a(Co0.4445Cu0.4444Ni0.1111)3c at 100 K, (Co0.0653Cu0.0721Ni0.8626)1a(Co0.4227Cu0.4204Ni0.1569)3c at 900 K, and (Co0.1574Cu0.1593Ni0.6833)1a(Co0.3920Cu0.3913Ni0.2167)3c at 1400 K, respectively.
Considering the available computational resource limitations and statistical requirements, a 30×30×30 supercell model is constructed based on the ordered FCC L12_AuCu3 prototype structure, as illustrated in Figure 4. The model contains a total of 108,000 atoms and strictly satisfies the compositional constraints of each sublattice, thereby accurately representing the probabilistic occupancy of atoms under thermal equilibrium at the target temperature. Figure 5 presents the three-dimensional atomic spatial distributions of the FCC_CoCuNi MPEAs at different equilibrium temperatures. The scale bar is calibrated to reflect the actual integer dimensions, with annotations indicating the corresponding lattice nesting structure, the SOFs of different elements in various lattices, and the actual number of atoms occupying each sublattice. Through the visual analysis of this spatial distribution, the enrichment tendency of atomic types at each kind of sublattices can be identified directly.
To explore the so-called chemical short-range order (CSRO) or local ordering behavior, which is the emerging issue in MPEAs, we further quantitatively and graphically characterize the atom distributions by statistically analyzing the coordination environments of various constituent element in FCC_CoCuNi MPEAs at several representative heat treatment temperatures. We simplify the issue initially by focusing only on the first nearest neighbor (1NN) shell of the prescribed central atom . To ensure the reliability of the statistical analysis, here we construct three isolated cases based on SOFs at each temperature and comparing them with the ideal randomly mixing structure. See the detail number list in Table 3, where in atom pairs of , the atom marked with a star (*) denotes the central atom of the same type , surrounded by n equidistant atoms (only the 1NN distance is considered for simplification) that form pairs. It should be noted that the counts for small coordination numbers in Table 3, the atoms agree with the large coordination numbers are included accumulatively, that is, the configurations include atomic pairs of and above.
As we know, the coordination number of a pure metal atom in FCC_L12 is 12. Nevertheless, Statistical analysis reveals that for FCC_CoCuNi MPEAs in both phase equilibrium ordered and randomly mixing configurations, the 1NN count of like-atom pairs in the never exceeds 10, thus far from the full coordination number of 12. Since both Co and Cu atoms are predicted to occupy the 3c sublattice at low temperatures, thereby forming only eight types of 3c-3c coordination pairs centered on 3c sublattices. thereby limiting the maximum coordinating number n=8. In contrast, Ni atoms occupy both the 1a and 3c sublattices, so Ni*-nNi pairs make a higher coordinating chance with the same kind of constituent atom than Co and Cu.
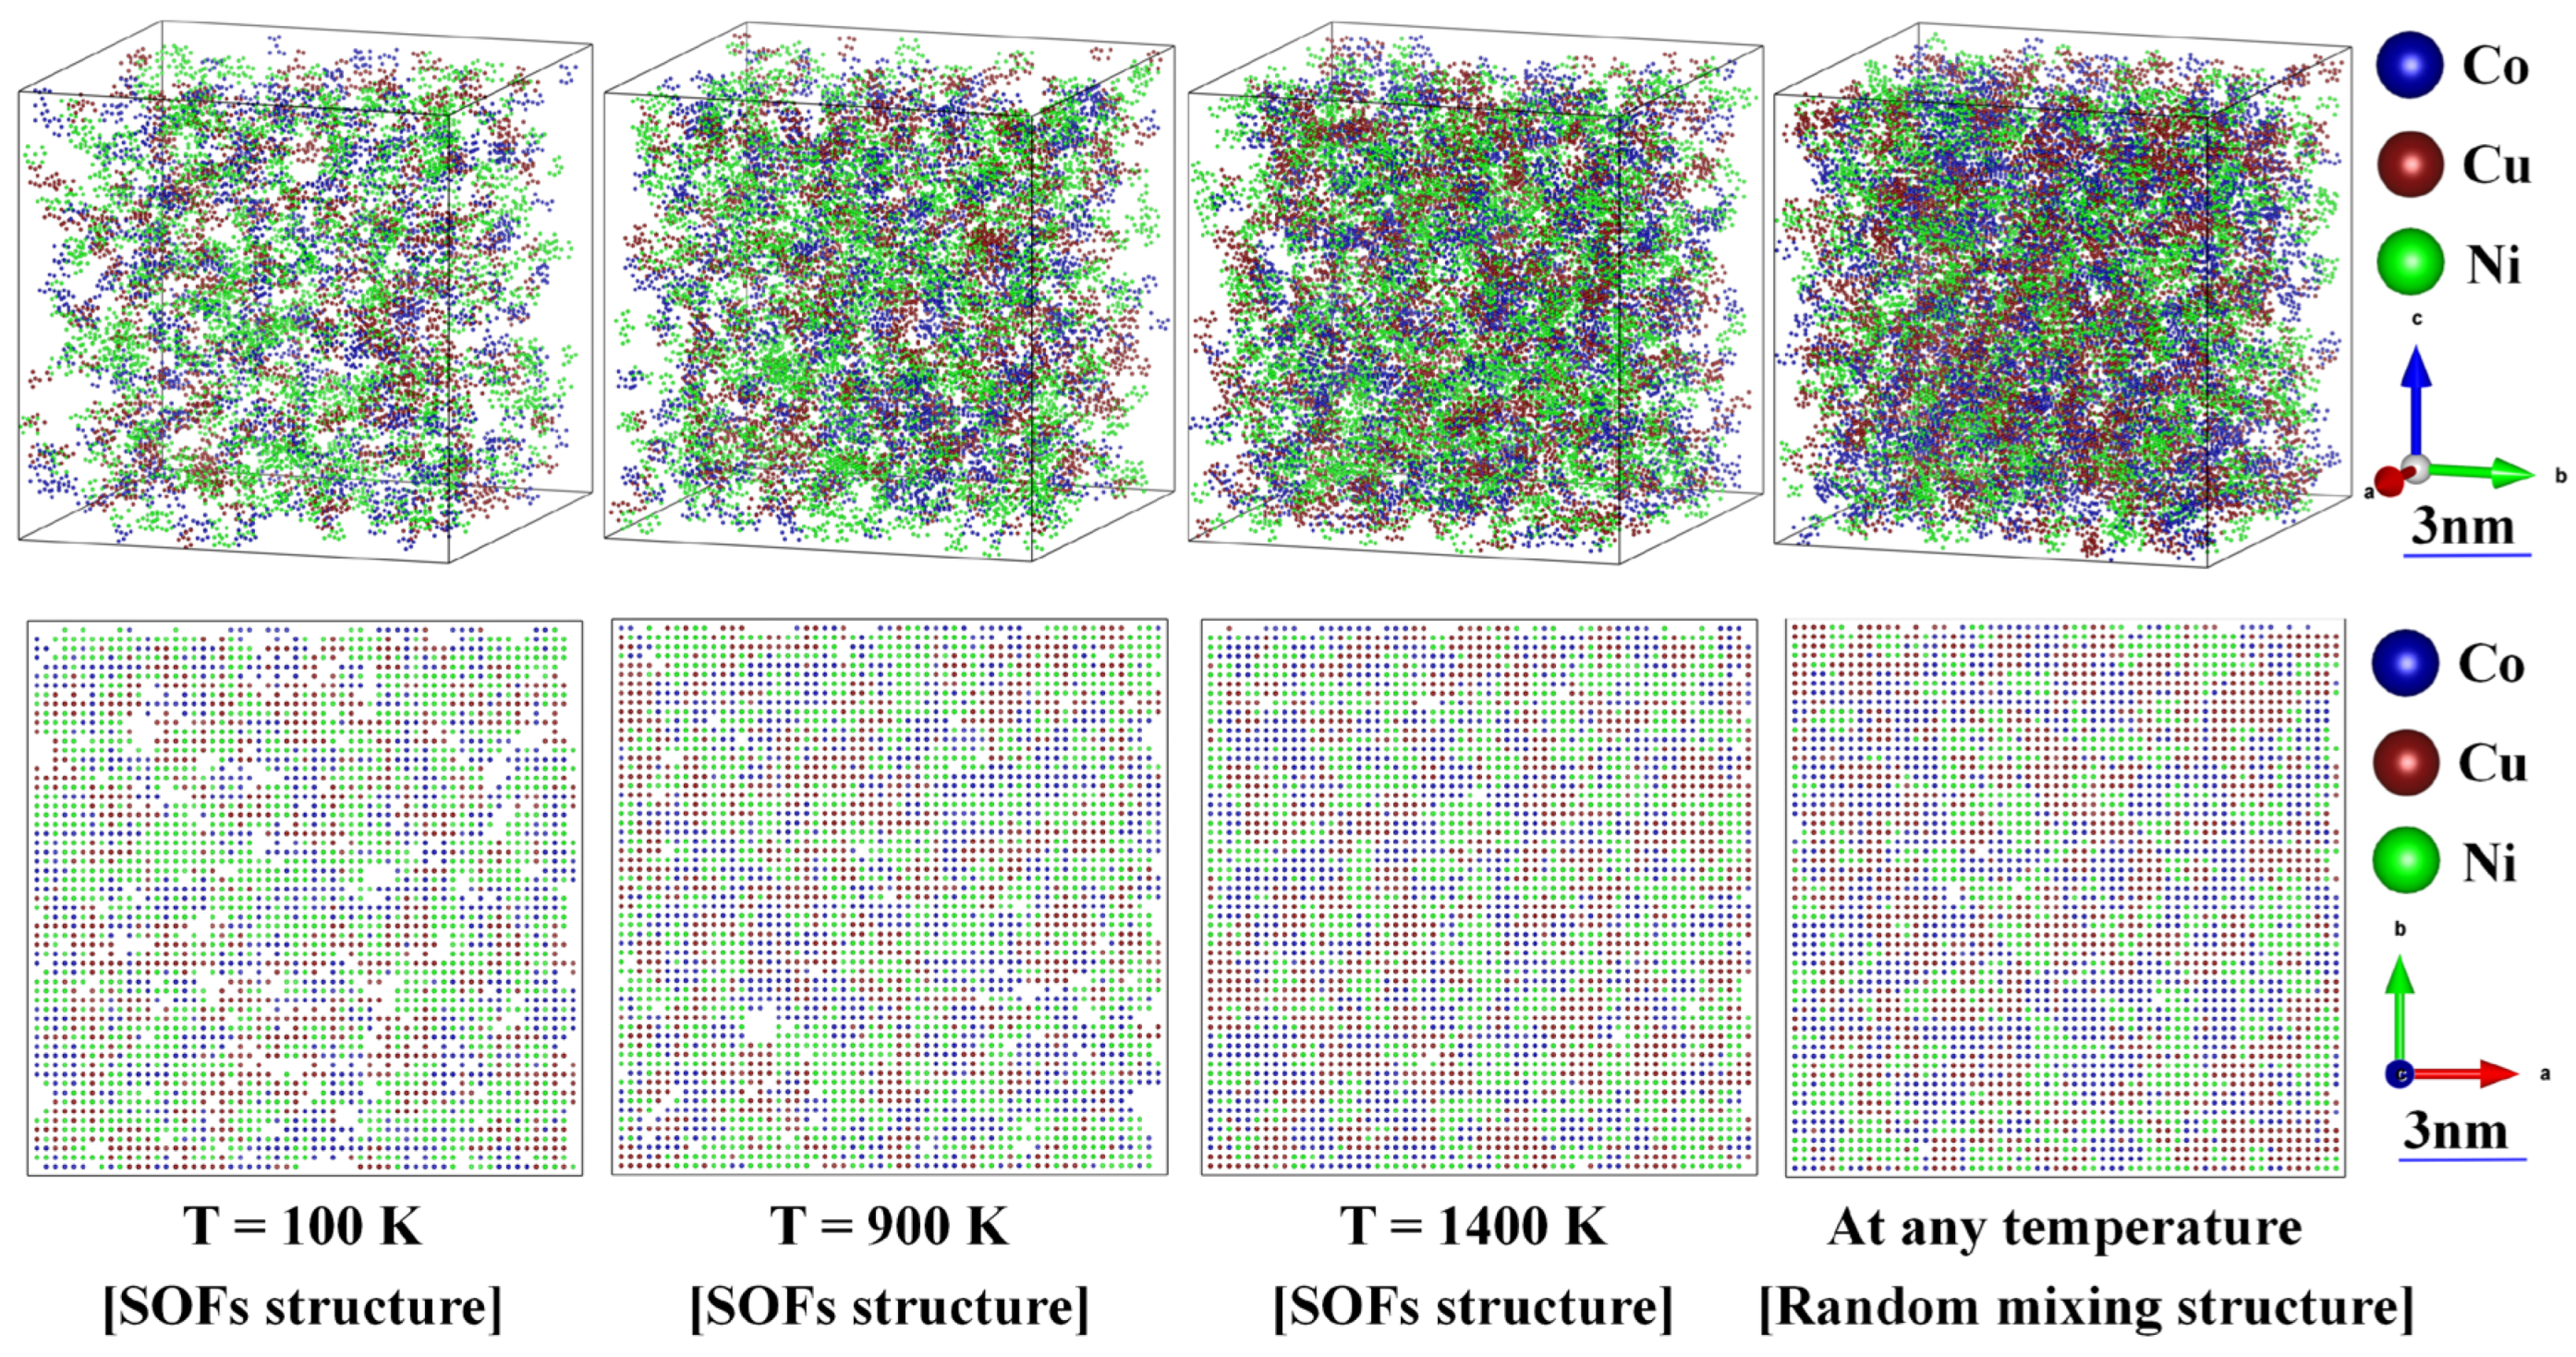
From Table 3, it is seen that when FCC_CoCuNi MPEAs were subjected to equilibrium heat treatment at 100 K, the maximum coordinating numbers n for Co*-nCo, Cu*-nCu, and Ni*-nNi clusters are 8, 8, and 9, respectively. For equilibrium heat treatment both at 900K and 1400 K, all the maximum coordinating numbers n for Co*-nCo, Cu*-nCu, and Ni*-nNi clusters are 9. Further analyze the cluster group number in FCC_CoCuNi MPEAs, indicates that they are temperature-dependent, the cluster group numbers for Co*-8Co, Cu*-8Cu, and Ni*-8Ni in Case 1 at 100 K were 5, 6, and 17, respectively. In contrast, the group numbers for Co*-9Co, Cu*-9Cu, and Ni*-9Ni in Case 1 at 1400 K were 6, 10, and 11, respectively. These results demonstrate that increasing the equilibrium temperature promotes a more uniform sublattice occupied distribution of each kind of element, which in turn increases both the maximum coordinating number within clusters and the cluster group number in FCC_CoCuNi MPEAs. In contrast, in the randomly mixing configuration, the maximum coordinating number n for Co*-nCo, Cu*-nCu, and Ni*-nNi clusters is consistently 10, which is also less than 12. Furthermore, as illustrated in Figure 7, the total number of coordination pairs in the disordered structure is significantly higher than that in the ordered SOFs structure, indicating that the randomly mixing configuration generally overestimates both the maximum cluster group number and the number of coordination pairs. Thus, in comparison to the unreasonable randomly mixing model, constructing large supercells based on SOFs better reflect the fine microstructure at the atomic scale affected by heat treatment temperature, and thereby provides more accurate atomic distribution configurations. These configurations are crucial for the reliable prediction of various properties of MPEAs.
The probability of a kind of constituent atom involved in the group with maximum coordinating number of can be calculated by combining the maximum coordination number and cluster group numbers. For example, when the maximum coordinating number is 10, and the cluster group number is , the probability of a kind of constituent atom involved in the group with maximum coordinating number of is,
where the means central atom plus coordinating atoms, 36,000 means there are 108,000 atoms in total, and 36,000 atoms for each type of the constituent atom in the equimolar ternary MPEAs based on 30×30×30 supercell of FCC_L12 AuCu3 prototype. Similarly, when the maximum coordinating number is 9 or 8, and the cluster group number is , the probability of a kind of constituent atom involved in the group with maximum coordinating number of is,
For FCC_CoCuNi in case 3 at 1400 K, the maximum coordination is , with the probability of a kind of constituent atom involved in the group with maximum coordinating number of is calculated in the following,
Figure 6.
The considerably large coordinating clusters in a sublattice preferring configuration of FCC_CoCuNi MPEAs with a 30×30×30 supercell based on the prototype of L12_AuCu3 containing 108,000 atoms at 1400 K. (a) The coordinating clusters; (b) The and above (containing ) coordinating clusters; (c) The and above (containing and ) coordinating clusters.
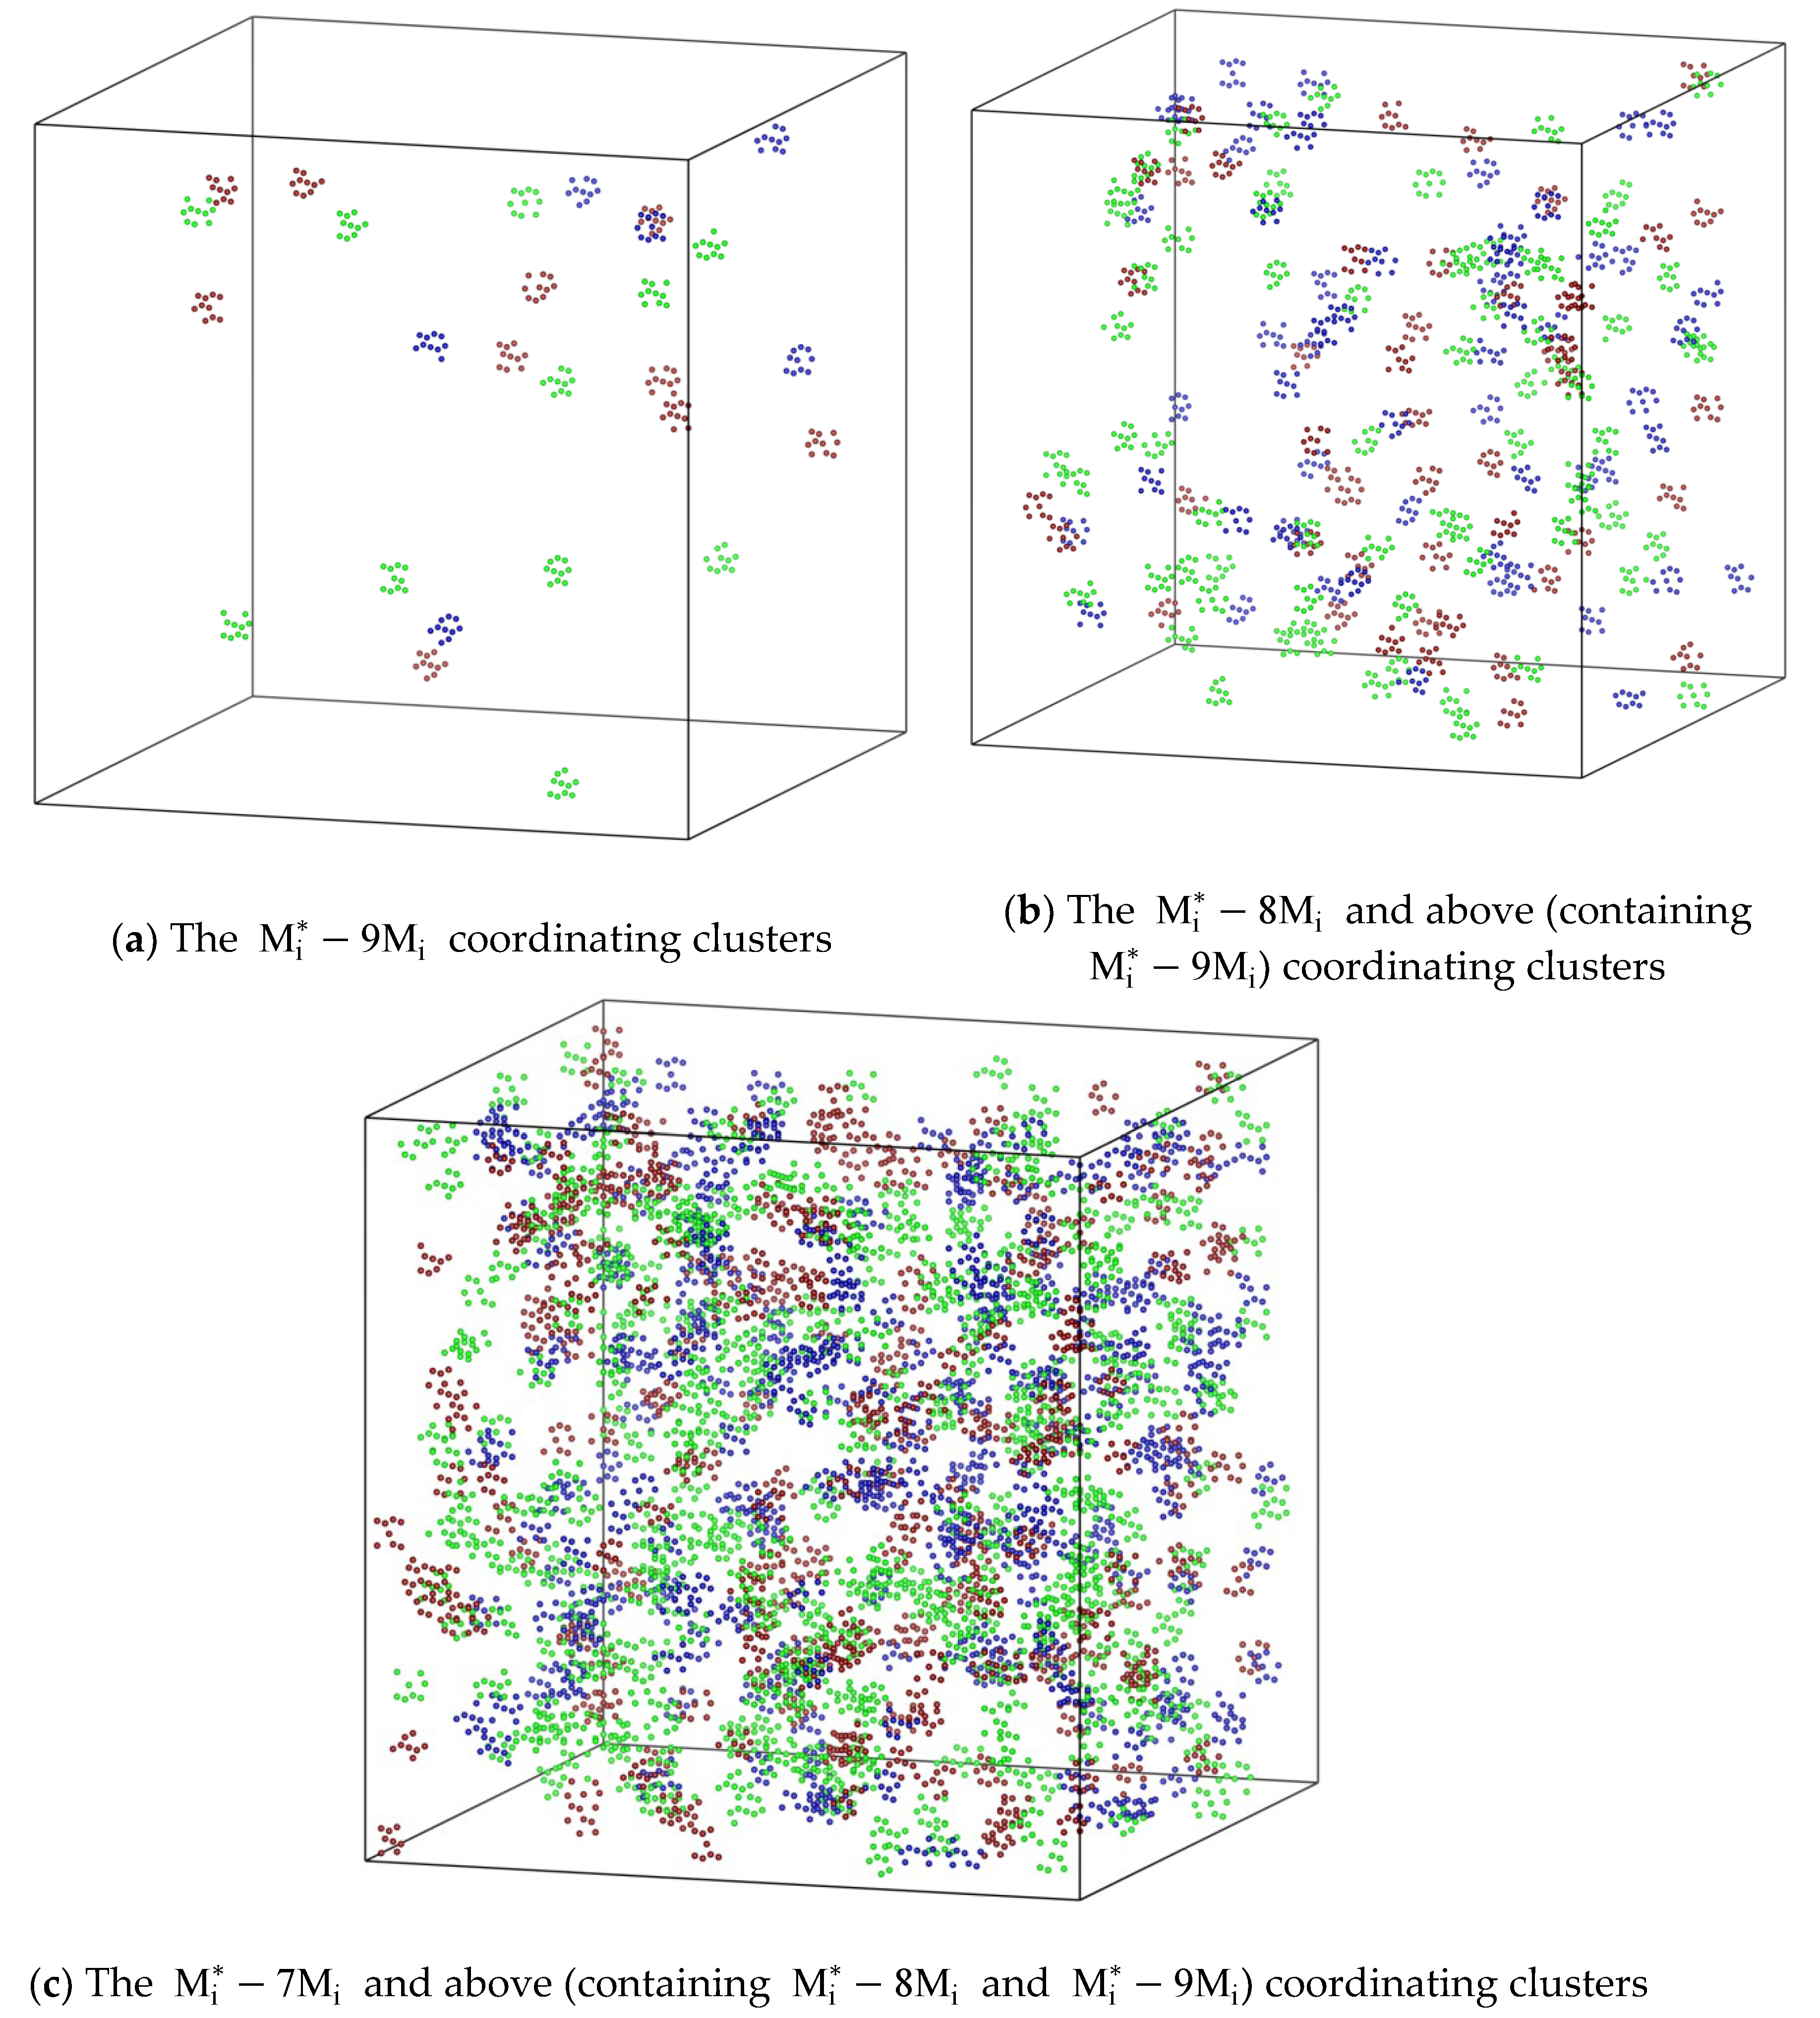
Figure 7.
The and above (containing , , and ) coordinating clusters in FCC_CoCuNi MPEAs structure based on SOFs and randomly mixing configuration at different temperatures, along with their corresponding (0 0 1) plane projection diagrams.
Figure 7.
The and above (containing , , and ) coordinating clusters in FCC_CoCuNi MPEAs structure based on SOFs and randomly mixing configuration at different temperatures, along with their corresponding (0 0 1) plane projection diagrams.
Radial distribution analysis for various atomic pairs is performed for the FCC_CoCuNi MPEAs based on the 30×30×30 supercell model. The radial distribution function (RDF) quantifies the spatial arrangement of the constituent atoms. It represents the ratio of the local particle density at a specific distance from a reference particle to the average global density of that particle type. Specifically, denotes the density of B type atoms at a radial distance r from a A type atom center, as defined by Equation (13):
where is the number of B atoms within a spherical shell of thickness at distance , and represents the average bulk density of B atoms. Figure 8a-c present the RDF analysis for the FCC_CoCuNi MPEAs with SOFs structure. The leftmost peak corresponds to the 1NN shell. Peak intensity scales directly with the relative atomic pair density. As shown in Table 3, the high-coordination number (n ≥ 6) clusters decreases in the order of Ni > Co ≈ Cu. However, if including low-coordination number (n < 6) clusters, the overall cluster abundance follows the sequence Co ≈ Cu> Ni. This distribution trend is consistent with the atomic coordination characteristics revealed by the RDF; further details are provided in the electronic Supplementary Materials. These findings reveal the inherent chemical short range ordering characters in FCC_MPEAs. Moreover, the RDF profiles confirm not only the ordered atomic arrangement within the 1NN shell but also provide important insights into the coordination features of the second and higher neighbor shells. In contrast, RDF analysis of the randomly mixing structure (see Figure 8d) can only capture the peak differences determined by the component content, but fails to present the shell specificity between atomic pairs revealed in the SOFs model. Consequently, the SOFs approach provides a more accurate description of the local atomic environment. This fidelity is crucial for precise understanding and prediction of material microstructure and resultant properties.
To elucidate the local distribution characteristics at the atomic scale, a systematic layer-by-layer analysis is performed for FCC_CoCuNi MPEAs based on a 30×30×30 supercell model of the L12_AuCu3 prototype and SOFs along different crystallographic planes. To minimize the influence of random errors, the 31st and 32nd atomic layers are selected as representative examples for analyzing the planar distribution features. Quantitative statistical results, as illustrated in Figure 9, reveal significant differences in the population distribution of different atomic species between odd and even layers within the {0 0 1} and {1 1 0} plane families. Specifically, the relative abundance of Ni atoms is markedly higher in odd-numbered layers, whereas Co and Cu atoms exhibit a pronounced preference for occupying even-numbered layers. This distribution behavior is primarily attributed to the sublattice preference. As illustrated in Figure 10, Ni atoms tend to predominantly occupy the 1a sublattices of the FCC L12_AuCu3 prototype, Co and Cu atoms predominantly occupy the 3c sublattices of the FCC L12_AuCu3 prototypey. Notably, no significant disparity is observed between adjacent layers in the {1 1 1} plane family, the atomic distribution in these planes closely resembles a randomly mixing model, indicating a high degree of interlayer uniformity. Furthermore, this distribution trend remains consistent in different odd layers or different even layers, confirming the statistical adequacy of the supercell size employed in this study. Schematic illustrations of the atomic distributions for various plane families at other different temperatures are provided in the electronic Supplementary Document.
Differences in compositional distribution across adjacent atomic layers inevitably leads to fundamentally different local chemical environments on the surface. This finding carries important implications for the study of catalytic properties in MPEAs, the bulk region and the near-surface region cannot be simply regarded as completely random solid solutions. The sublattice preference should be considered and thus the difference of the neighbor oven layer and odd layer should be cared when we further study the fine-microstructure and diverse properties experimentally and theoretically These features must be incorporated as a fundamental premise in constructing accurate models to rationally simulate the adsorption behaviors on catalyst surfaces.
3.3. Quantitative and Graphical Characterization of the Lattice Distortion of MPEAs
Considering computational resource constraints, 3×3×3 supercells are constructed based on the FCC_L12_AuCu3 prototype and the corresponding SOFs, following the same framework as the 30×30×30 supercells. The calculations are performed for FCC_CoCuNi MPEAs at 100 K, 900 K, and 1400 K. To achieve an optimal balance between computational cost and accuracy, a stepwise optimization strategy is employed. First, atomic positions and unit cell shape are fixed while the volume is optimized (ISIF = 7, NSW = 20; hereafter referred to as R7), yielding the equilibrium lattice parameters for the undistorted configuration. Subsequently, based on the optimized structure from the first step, a full relaxation is performed in which volume, cell shape, and atomic positions are all allowed to vary (ISIF = 3, NSW = 20; hereafter referred to as R3), thereby attaining global energy minimization. It should be noted that during the full relaxation calculation, a selective dynamics method is employed, where one atom is fixed as the original point, while three atoms are constrained to slide along the X, Y, and Z axes, respectively, to suppress the overall crystal rotation and avoid the shift of the full lattice. In Figure 11, the atoms marked with red triangles are fixed at the origin coordinates, while those indicated by red solid circles are only permitted to move along the X, Y, and Z directions. All atomic positions are described using Cartesian coordinates to preserve the spatial vector characteristics of lattice distortions, while distortion values are normalized using 1NN distances to ensure cross compositional comparability of distortion magnitudes.
The system underwent initial volume relaxation followed by complete structural relaxation. The corresponding lattice parameters, angles, volumes, and total energies are summarized in Table 4. To quantitatively characterize lattice distortion, the 1NN distance between adjacent atom pairs in the volume relaxing structure is adopted as the reference. The relative distortion is defined by Equation (14).
where, n denotes the total number of atoms in the supercell. For the 3×3×3 FCC supercell derived from the L12_AuCu3 prototype, n = 108. Since the coordinates of one atom are constrained at the origin, the number of displaceable atoms corresponds to n-1. The position vectors and represent atomic coordinates of atom i in the undistorted and distorted configurations, respectively. The parameter denotes the 1NN distance in the volume relaxing reference structure. Thus, lattice distortion parameters are computed quantitatively from the simulation outputs using these definitions. The resulting distortion metrics are presented in Table 5. Upon completion of full structural relaxation, the crystal structure is optimized to its equilibrium state, resulting in a volume change and a reduction in the total energy of the system. As for the fundamental lattice parameters, the changes in lattice constants and angles are found to be minimal even after full relaxation. Therefore, it can be concluded that the FCC_CoCuNi MPEAs essentially retains its simple cubic structure.
To gain deeper insights into the micromechanical origin of lattice distortion, this study visually characterized the atomic resultant forces and distorted displacements of individual atoms in FCC_CoCuNi MPEAs before and after structural relaxation, as illustrated in Figure 12. In the unrelaxed initial configuration (R7) where atomic positions are constrained by the lattice, mere volume expansion is insufficient to eliminate the atomic-scale stress inhomogeneity induced by variations in the local chemical environment. Under these conditions, Co and Ni atoms experience significant forces due to the atomic size mismatch effect, with the resultant force acting on each atom denoted by arrows (Figure 12a). After full relaxation (R7 + R3), it reaches an equilibrium state with the minimum energy, where the degrees of freedom of atomic positions are fully released. Except for the atoms fixed by the selective dynamics method, which still sustain a small residual force, the forces acting on most atoms are nearly eliminated (Figure 12b), confirming that the optimization calculations meet the required standards. Notably, the lattice distortion of FCC_CoCuNi MPEAs is not significant in terms of the lattice parameters in Table 5. For the force acting on atom, specifically, Co atoms experience the largest force, followed by Ni atoms, while Cu atoms bear the weakest force. Meanwhile, the ranking of atomic distortion displacement is consistent with the above force distribution results. To characterize the slight atomic distortion displacement, hollow spheres with different colors are used to represent the atomic positions after lattice distorting whereas the solid black dots denote their initial positions before lattice distortion. At this stage, the geometric centers of individual atoms have displaced from their initial positions, indicating the presence of significant atomic distorted displacements (Figure 12c). The rearrangement of atomic positions by adjusting local bond lengths and bond angles effectively alleviates the non-equilibrium stress field in the initial configuration, leading to a systematic reduction in the net forces acting on all atoms.
In summary, lattice distortion in MPEAs is inevitable due to the non-equilibrium force fields experienced by the different types of constituent atoms, which is reflected in nature, that is, the total energy difference before and after distortion. However, these local atomic-scale strain fluctuations due to the sublattice preference of the different constituent atoms are one of the key factors governing the properties of MPEA. Therefore, quantitative and graphical studies on lattice distortion are crucial for clarifying its underlying mechanisms. Furthermore, based on the relaxed bulk structure, representative surface structural models of FCC crystals are cleaved. All constructed surface models are three-atomic-layer configuration with their stacking sequences explicitly labeled in the corresponding figures (see Figure 13), which can be adopted to simulate the surface phenomenon in diverse application with considerable reliability, Notably, two distinct stacking sequence models are established for the {0 0 1} and {1 1 0} surfaces, respectively. Three stacking sequence models are established for the {1 1 1} close-packed surface. The three-atomic-layer structure effectively balance electronic structure calculation precision with computational efficiency, and mitigates interference from bulk-phase atoms. These models are indispensable for the subsequent simulations of surface oxidation, nitridation, and catalytic behaviors.
4. Conclusions
The atom distributing configuration and lattice distortion behaviors of FCC_CoCuNi MPEAs are theoretically investigated based on the inherent sublattice preference of the different constituent atoms on different constituent sublattices. The sublattice preference are significantly affected by heat treatment temperatures. The sublattice preferences change continuously with the increase of the heat treatment temperature. The SOFs configurations are (Ni1.0000)1a(Co0.4445Cu0.4444Ni0.1111)3c, (Co0.0653Cu0.0721Ni0.8626)1a(Co0.4227Cu0.4204Ni0.1569)3c, and (Co0.1574Cu0.1593Ni0.6833)1a(Co0.3920Cu0.3913Ni0.2167)3c at 100 K, 900 K, and 1400 K, respectively. Thus, Ni predominantly occupies the 1a sublattice across the entire temperature range, while the 3c sublattice is mainly occupied by Co and Cu atoms, Increasing temperature, Ni tends to migrate to the 3c sublattice a little bit, and the occupation proportions of Co and Cu on the 1a sublattice increase synchronously.
The configurational entropy of FCC_CoCuNi MPEA increases with the increase of heat treatment temperature, while it is considerably lower than that of the hypothetical structure with randomly mixing solid solution. For example, the configurational entropies are 6.017, 7.383, and 8.399 J/(mol·K) at 100 K, 900 K, and 1400 K, respectively, while it is 9.114 J/(mol·K) in randomly mixing case.
Coordination environment analysis indicates that in the ordered structure based on SOFs, the maximum coordinating number n is 9 for Co*-nCo, Cu*-nCu, and Ni*-nNi, respectively. In contrast, randomly mixing models overestimate both the maximum cluster group number and the number of coordination pairs. Lattice distorting behaviors of the MPEAs subjected to heat treatment to the equilibrium state at 100 K, 900 K, or 1400 K and then quench to the ground state (0 K) are compared quantitatively and graphically. For instance, for the sample is heat treated at 900 K and then quenched to 0 K, the average atomic distorting energy is 0.008 eV/atom and the relative lattice distortion relative to the first nearest neighbor distance is 1.67%, and The corresponding changes of driving force field on atom are visualized.
Based on the relaxed bulk structure, some representative surface structural models are cleaved, which are indispensable structure models employed for further simulation on the surface oxidation, nitridation and catalyst behaviors. In particular, we emphasize that for most family of crystal planes of FCC_MPEAs, except {1 1 1}, there are obviously different atom distributing characters between the even and odd layers. Thus, it is necessary to model at least one even layer and one odd layer, and then assess the surface properties of the even and odd layers of MPEAs combinatorially to obtain the comprehensive surface properties of the corresponding MPEAs.
Current work intensively explores the temperature-dependent fine microstructure based on the inherent sublattice preference of constituent atoms on the different types of sublattice. Essential structure data and model are afforded for investigate and modulate the fine microstructure and diverse properties in the future.
Supplementary Materials
The following supporting information can be downloaded at: Preprints.org.
Author Contributions
Conceptualization, B. W., M. W. and F.-X. Z.; validation, Y. T., C.-S.F., F.-X. Z. and L.-M. C.; investigation, X.-Y. S., X.-L. Z., X. F., A.-Q. J., X.-Q. Z., H.-H. Q., H.-R. H., J.-K. C., H. G., X.-L. Y., C. D., andY. S.; data curation, X.-Y. S., M.-L. G. and X.-Y. C.; writing—original draft preparation, X.-Y. S., X.-L. Z., A.-Q. J., and X.-Q. Z.; writing—review and editing, B. W., B.-S. S., J.-K. H., M. W. and F.-X. Z.; visualization, M.-L. G. and D.-H. W.; supervision, B. W., M. W. and F.-X. Z. All authors have read and agreed to the published version of the manuscript.
Funding
This research was funded by the National Natural Science Foundation of China (50971043, 51171046), Key Research and Development Program of China (CISRI-21T62450ZD), Natural Science Foundation of Fujian Province (2021J01590), Student Research and Training Program (SRTP) of Fuzhou University (31234), and the Zunyi Normal University Research Project (ZunShi BS [2025]03).
Data Availability Statement
Data is contained within the article or Supplementary Material.
Conflicts of Interest
The authors declare no conflicts of interest.
References
- Miracle, D.B.; Senkov, O.N. A critical review of high entropy alloys and related concepts. Acta Materialia 2017, 122, 448–511. [Google Scholar] [CrossRef]
- Ali, N.; Zhang, L.; Liu, D.; et al. Strengthening mechanisms in high entropy alloys: A review. Mater Today Commun 2022, 33, 104686. [Google Scholar] [CrossRef]
- Fu, Y.; Liu, P.; Zhang, H.; Ding, X.; Sun, J. Accelerated design of high-strength refractory multi-principal element alloys from first-principles calculations. Journal of Materials Research and Technology 2025, 36, 10520–10534. [Google Scholar] [CrossRef]
- Zhang, H.; Cai, D.; Sun, X.; et al. Solid solution strengthening of high-entropy alloys from first-principles study. Journal of Materials Science & Technology 2022, 121, 105–116. [Google Scholar] [CrossRef]
- Wang, M.M.; Liu, L.J.; Wen, J.T.; et al. Multimetallic CuCoNi Oxide Nanowires In Situ Grown on a Nickel Foam Substrate Catalyze Persulfate Activation via Mediating Electron Transfer. Environ Sci Technol 2022, 56, 12613–12624. [Google Scholar] [CrossRef]
- Murakami, Y.; Murase, K.; Fukami, K. Smooth Thin Film of a CoNiCu Medium-Entropy Alloy Consisting of Single Nanometer-Sized Grains Formed by Electrodeposition in a Water-in-Oil Emulsion. The Journal of Physical Chemistry C 2023, 127, 4696–4703. [Google Scholar] [CrossRef]
- Söğüt, Ö.; Dönük, Ç.; Apaydın, G.; Bakkaloğlu, Ö.F. Examination of CoNiCu thin films by using XRF and XRD. Canadian Journal of Physics 2014, 92, 435–439. [Google Scholar] [CrossRef]
- Katiyar, N.K.; Biswas, K.; Yeh, J.W.; Sharma, S.; Tiwary, C.S. A perspective on the catalysis using the high entropy alloys. Nano Energy 2021, 88, 106261. [Google Scholar] [CrossRef]
- Chu, F.; Wang, J.; He, J.; et al. Rare-Earth-Induced Charge Polarization in Medium-Entropy Alloy Driving Fast Hydrogen Generation. Advanced Functional Materials 2025, e15235. [Google Scholar] [CrossRef]
- Ma, J.; Lu, B.; Wang, S.; et al. MOF-derived CuCoNi trimetallic hybrids as efficient oxygen evolution reaction electrocatalysts. New Journal of Chemistry 2020, 44, 2459–2464. [Google Scholar] [CrossRef]
- Maeda, A.; Tanuma, T.; Kume, M.; Shimizu, R.; Doi, A. GMR in corrugated Co/Cu multilayers. IEEE Transactions on Magnetics 1997, 33, 3535–3537. [Google Scholar] [CrossRef]
- Duch, M.; Esteve, J.; Gómez, E.; Pérez-Castillejos, R.; Vallés, E. Electrodeposited Co-Ni alloys for MEMS. Journal of Micromechanics and Microengineering 2002, 12, 400–405. [Google Scholar] [CrossRef]
- Karahan, I.; Bakkaloğlu, Ö.; Bedir, M. Giant magnetoresistance of electrodeposited Cu-Co-Ni alloy films. Pramana 2007, 68, 83–90. [Google Scholar] [CrossRef]
- Pané, S.; Gómez, E.; Vallés, E. Magnetoresistive granular Cu–Co–Ni coatings prepared by electrodeposition. Journal of Electroanalytical Chemistry 2006, 596, 87–94. [Google Scholar] [CrossRef]
- Yu, Z. Giant magneto resistance for CuCoNi granular films prepared by electrode position. In Proceedings of the IOP Conference Series: Materials Science and Engineering, 2019; p. 042091. [Google Scholar]
- Karpuz, A.; Kockar, H.; Alper, M. Microstructure dependence of magnetic properties on electrochemically produced ternary CuCoNi alloys. Journal of Materials Science: Materials in Electronics 2014, 25, 4483–4488. [Google Scholar] [CrossRef]
- Mondal, B.N.; Basumallick, A.; Chattopadhyay, P.P. Correlation of microstructure and magnetic properties in Cu–Co–Ni alloys. Materials Science and Engineering: B 2010, 166, 174–179. [Google Scholar] [CrossRef]
- Gómez, E.; Pané, S.; Vallés, E. Electrodeposition of Co–Ni and Co–Ni–Cu systems in sulphate–citrate medium. Electrochimica Acta 2005, 51, 146–153. [Google Scholar] [CrossRef]
- Saha, S.; Ramanujachary, K.V.; Lofland, S.E.; Ganguli, A.K. Cu-Co-Ni alloys: an efficient and durable electrocatalyst in acidic media. Materials Research Express 2016, 3, 016501. [Google Scholar] [CrossRef]
- Ding, J. Order or disorder, that is the question in high-entropy alloys. Nature Reviews Materials 2026, 1–2. [Google Scholar] [CrossRef]
- Zhang, C.-h.; Lin, M.-h.; Wu, B.; et al. Explore the possibility of forming fcc high entropy alloys in equal-atomic systems CoFeMnNiM and CoFeMnNiSmM. Journal of Shanghai Jiaotong University (Science) 2011, 16, 173–179. [Google Scholar] [CrossRef]
- Wu, B.; Zhao, Y.; Ali, H.; et al. A reasonable approach to describe the atom distributions and configurational entropy in high entropy alloys based on site preference. Intermetallics 2022, 144, 107489. [Google Scholar] [CrossRef]
- Ali, H.; Chen, R.; Wu, B.; et al. The site preference and doping effect on mechanical properties of Ni3Al-based γ′ phase in superalloys by combing first-principles calculations and thermodynamic model. Arabian Journal of Chemistry 2022, 15. [Google Scholar] [CrossRef]
- Chen, R.; Weng, L.; Zhang, C.; et al. The influence of site preference on the elastic properties of FCC_CoCrFeNi multi-principal element alloy. Journal of Alloys and Compounds 2023, 965, 171426. [Google Scholar] [CrossRef]
- Chen, R.; Xie, T.; Wu, B.; et al. A general approach to simulate the atom distribution, lattice distortion, and mechanical properties of multi-principal element alloys based on site preference: Using FCC_CoNiV and CoCrNi to demonstrate and compare. Journal of Alloys and Compounds 2023, 935, 168016. [Google Scholar] [CrossRef]
- Zhang, C.-b.; Qian, C.; Ye, Z.-a.; et al. Influence of ordering behaviors on thermodynamic and mechanical properties of FCC_CoNiV multi-principal element alloys. Transactions of Nonferrous Metals Society of China 2025, 35, 2320–2331. [Google Scholar] [CrossRef]
- Qiao, Y.; Chen, X.; Wu, B.; et al. A general approach to qualitatively and graphically characterize the diffuse behavior of interstitial nonmetallic atoms in multi-principal element alloys based on site preference. Materials Genome Engineering Advances 2025, 3. [Google Scholar] [CrossRef]
- Weng, L.; Su, L.; Xu, N.; et al. The preferred adsorption sites and catalytic mechanism of FCC_CoFeGaNiZn multi-principal element alloy for oxygen evolution reaction catalysis based on site preference of constituent atom on sublattice. Intermetallics 2024, 165. [Google Scholar] [CrossRef]
- Weng, L.; Zhang, X.; Su, L.; et al. Prediction of the catalytic mechanism of hydrogen evolution reaction enhanced by surface oxidation on FCC_CoCrFeNi and Co0.35Cr0.15Fe0.2Mo0.1Ni0.2 multi-principal element alloys based on site preference. Applied Surface Science 2024, 672. [Google Scholar] [CrossRef]
- Su, L.; Que, H.; Qian, C.; et al. Prediction of oxygen evolution reaction activity of FCC_CoCuFeNiPd and CoCuFeNiRu multi-principal element alloys based on sublattice preference of constituent atoms and the site preference of intermediates. Physical Chemistry Chemical Physics 2025, 27, 22064–22081. [Google Scholar] [CrossRef]
- Qian, C.; Chen, X.; Su, L.; et al. The influence of N content on structures and mechanical properties of FCC_(AlCrMoTiV)1-XNX high-entropy nitrides: A density functional theory (DFT) study based on site preference. Computational Materials Science 2025, 251. [Google Scholar] [CrossRef]
- Wu, B.; Zinkevich, M.; Aldinger, F.; Chu, M.; Shen, J. Prediction of the ordering behaviours of the orthorhombic phase based on Ti2AlNb alloys by combining thermodynamic model with ab initio calculation. Intermetallics 2008, 16, 42–51. [Google Scholar] [CrossRef]
- Zheng, Y.; Wu, B.; Zhang, C.; Dai, P. Prediction of the site occupations of the ThMn12-type intermetallics YFe12−xMox by combining thermodynamic model with ab-initio calculations. Intermetallics 2010. [Google Scholar] [CrossRef]
- Andersson, J.O.; Helander, T.; Höglund, L.; Shi, P.; Sundman, B. Thermo-Calc & DICTRA, computational tools for materials science. Calphad 2002, 26, 273–312. [Google Scholar] [CrossRef]
- Kresse, G.; Furthmuller, J. Efficient iterative schemes for ab initio total-energy calculations using a plane-wave basis set. Phys Rev B Condens Matter 1996, 54, 11169–11186. [Google Scholar] [CrossRef]
- Kratzer, P.; Neugebauer, J. The Basics of Electronic Structure Theory for Periodic Systems. Front Chem 2019, 7, 106. [Google Scholar] [CrossRef]
- Han, Y.; Chen, H.; Sun, Y.; et al. Ubiquitous short-range order in multi-principal element alloys. Nat Commun 2024, 15, 6486. [Google Scholar] [CrossRef] [PubMed]
Figure 1.
Alternative calculating path of thermodynamic function denoting ① = ② + ③.
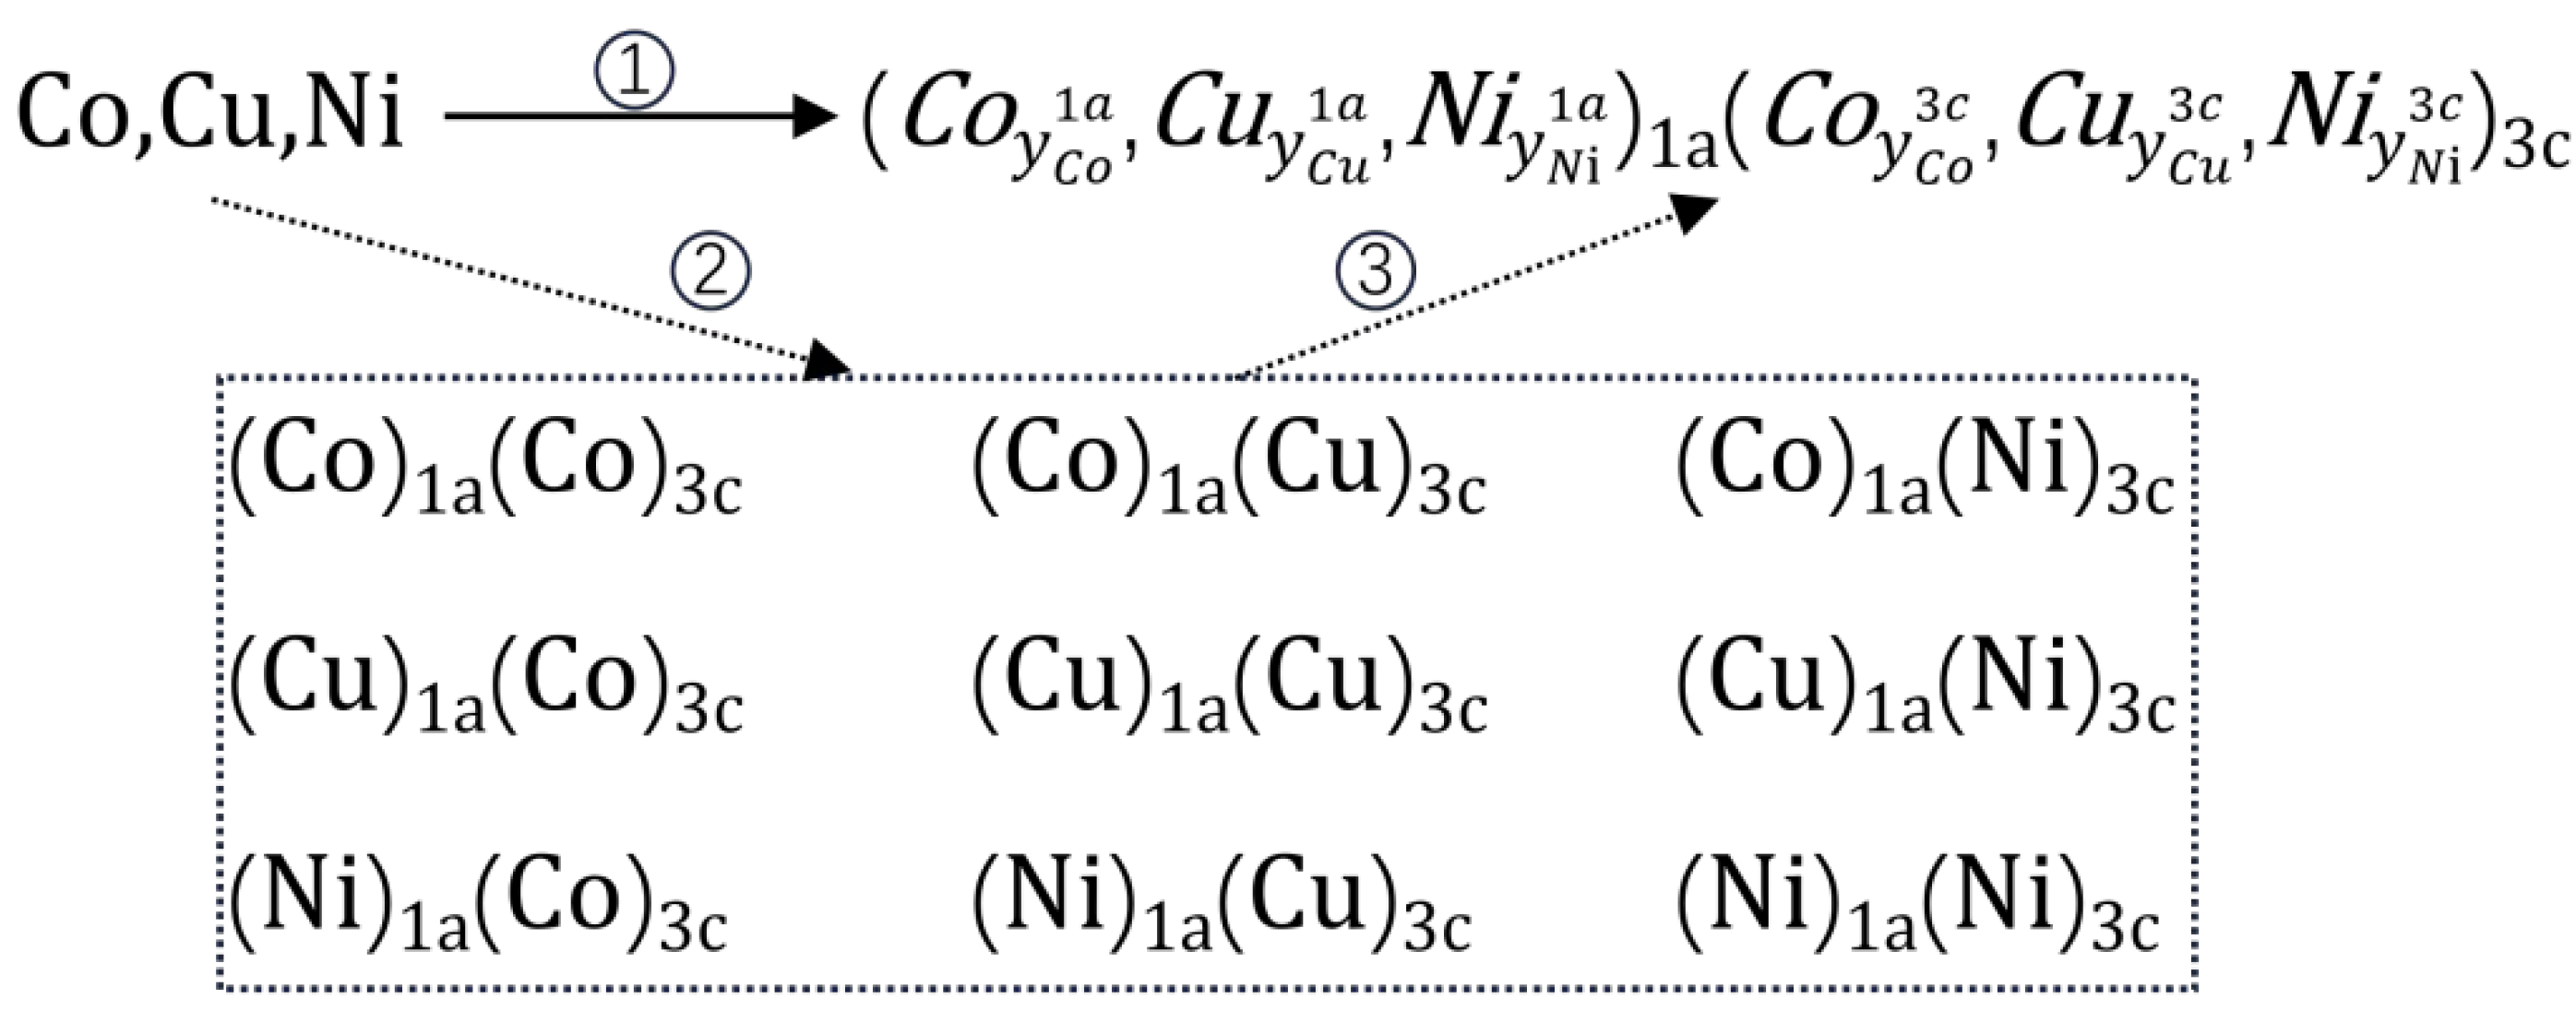
Figure 2.
The temperature-dependent SOFs of FCC_CoCuNi MPEAs.
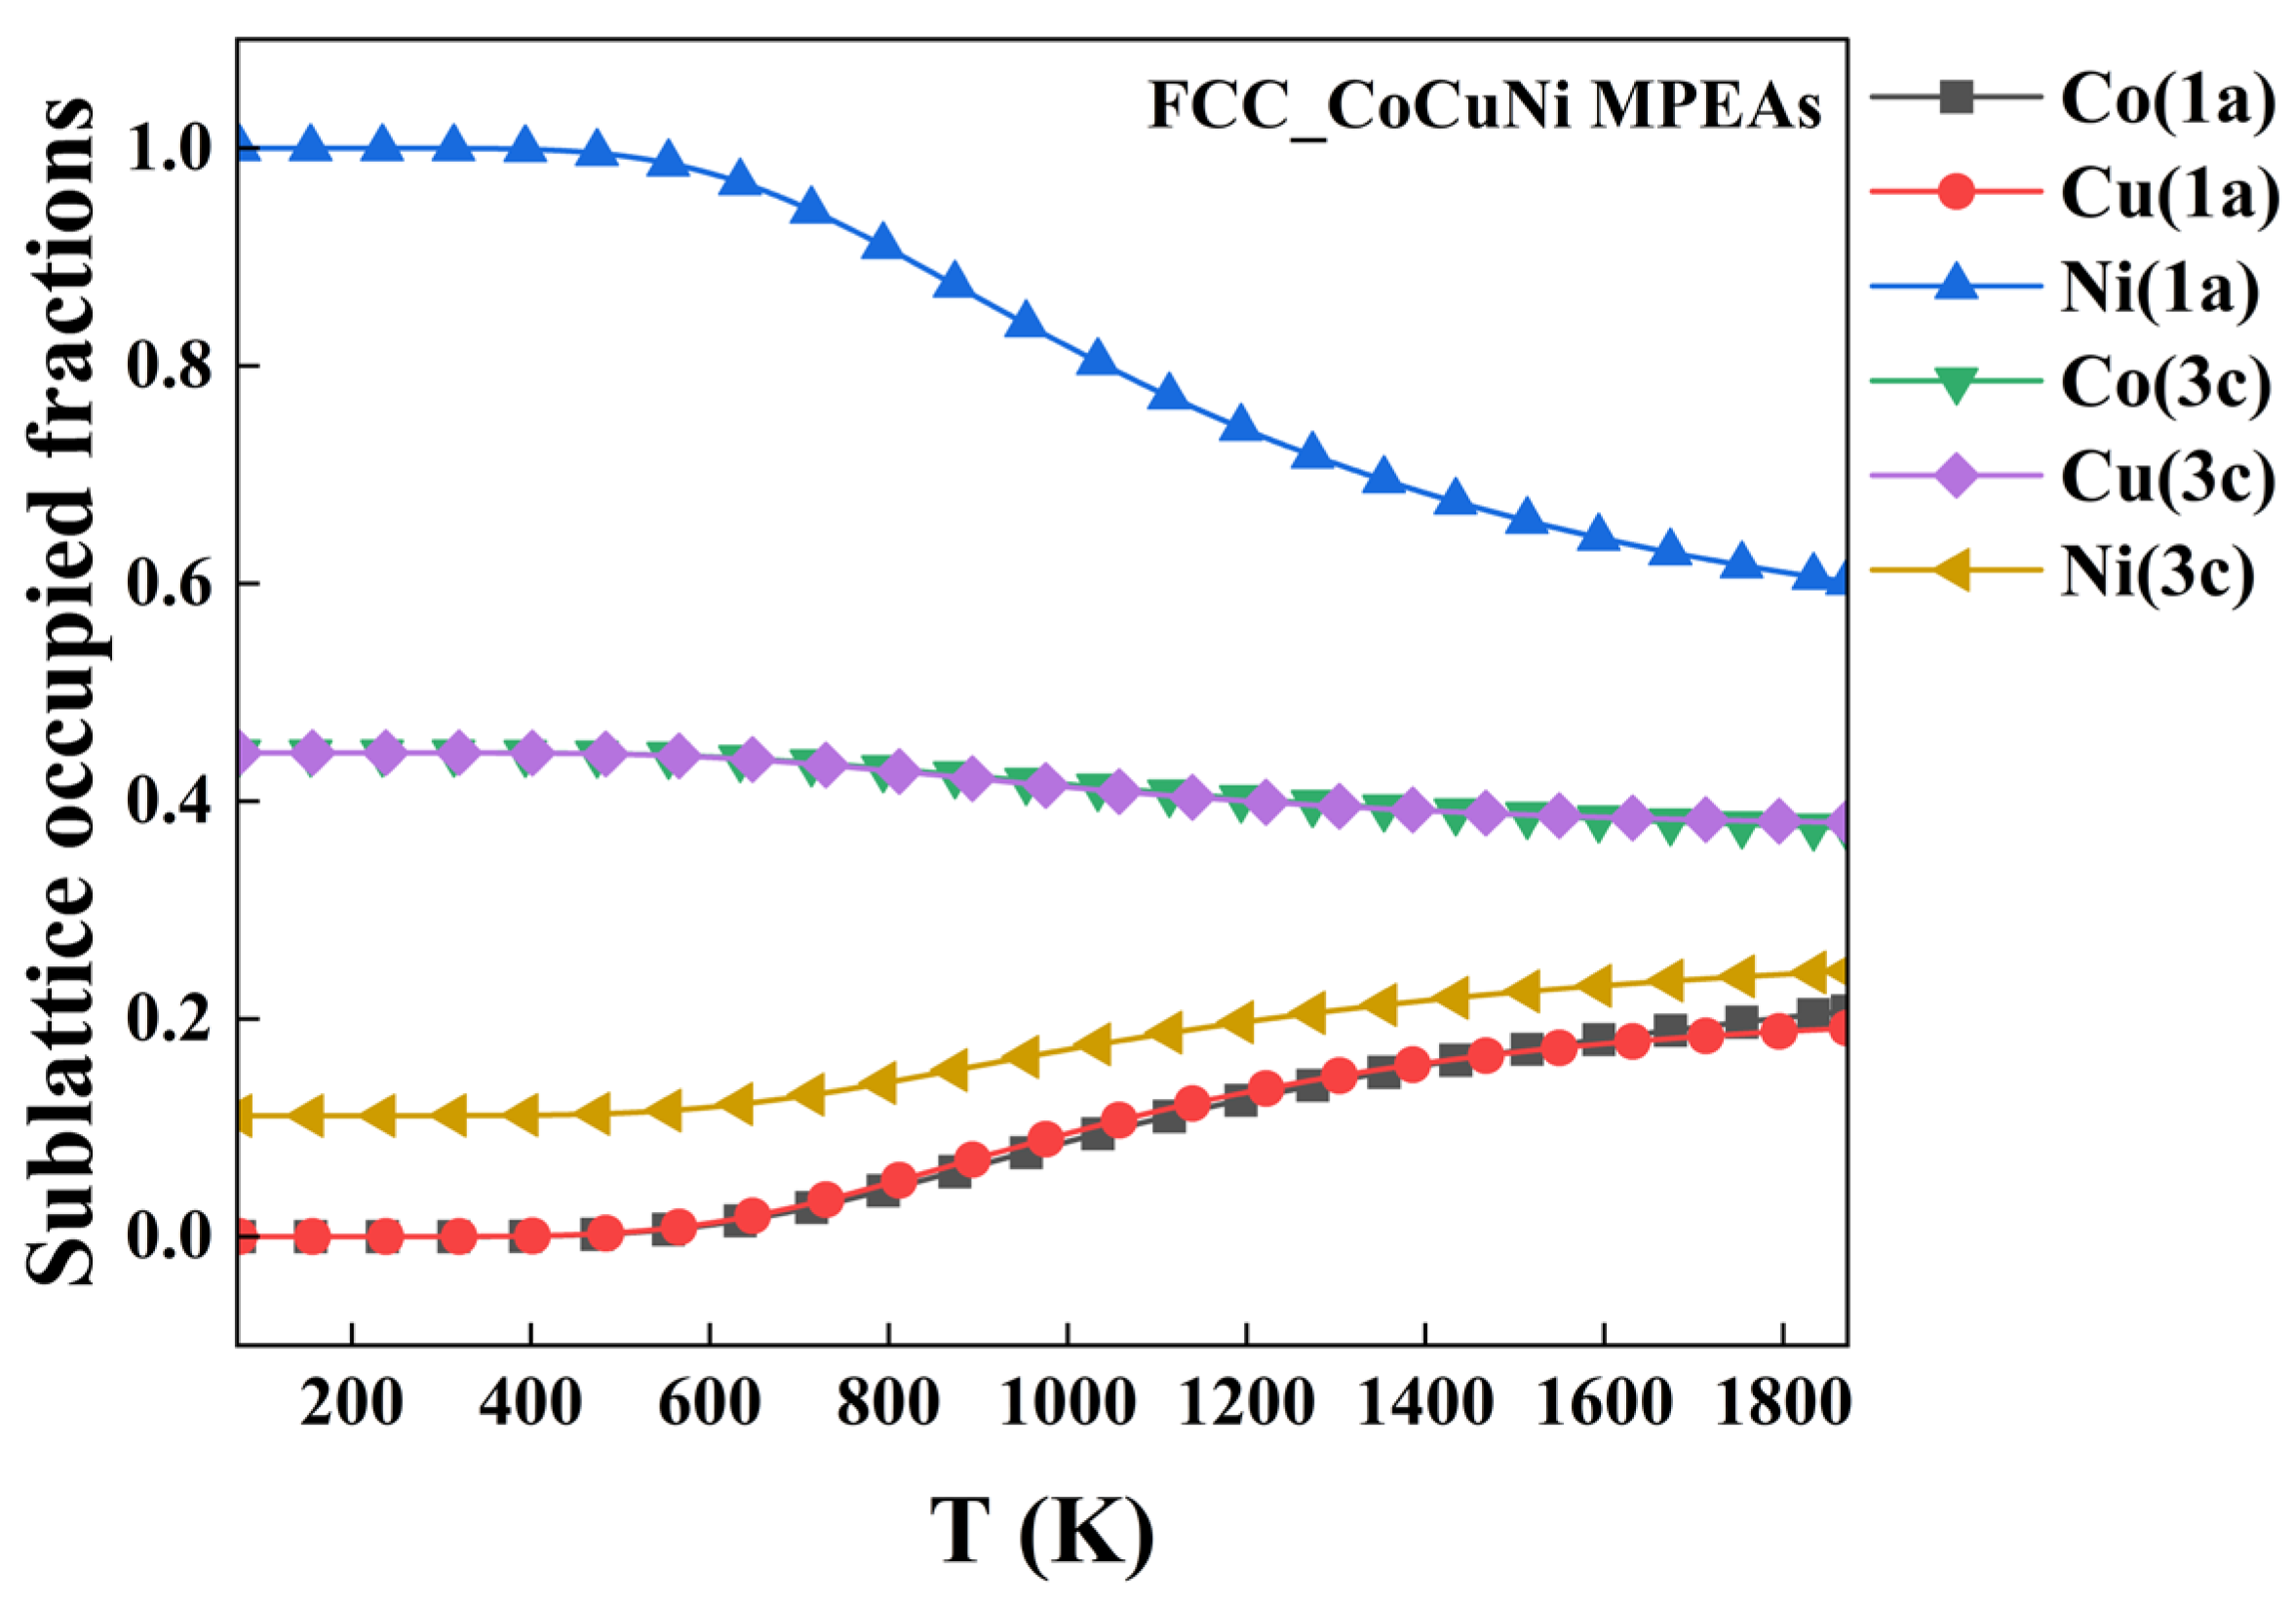
Figure 3.
Thermodynamic properties of SOFs-Structured FCC CoCuNi MPEAs as a function of heat treatment temperature: (a) Gibbs energy of formation, (b) enthalpy of formation, (c) entropy of formation, and (d) configurational entropy, all compared with the randomly mixing solid solution alloy.
Figure 3.
Thermodynamic properties of SOFs-Structured FCC CoCuNi MPEAs as a function of heat treatment temperature: (a) Gibbs energy of formation, (b) enthalpy of formation, (c) entropy of formation, and (d) configurational entropy, all compared with the randomly mixing solid solution alloy.
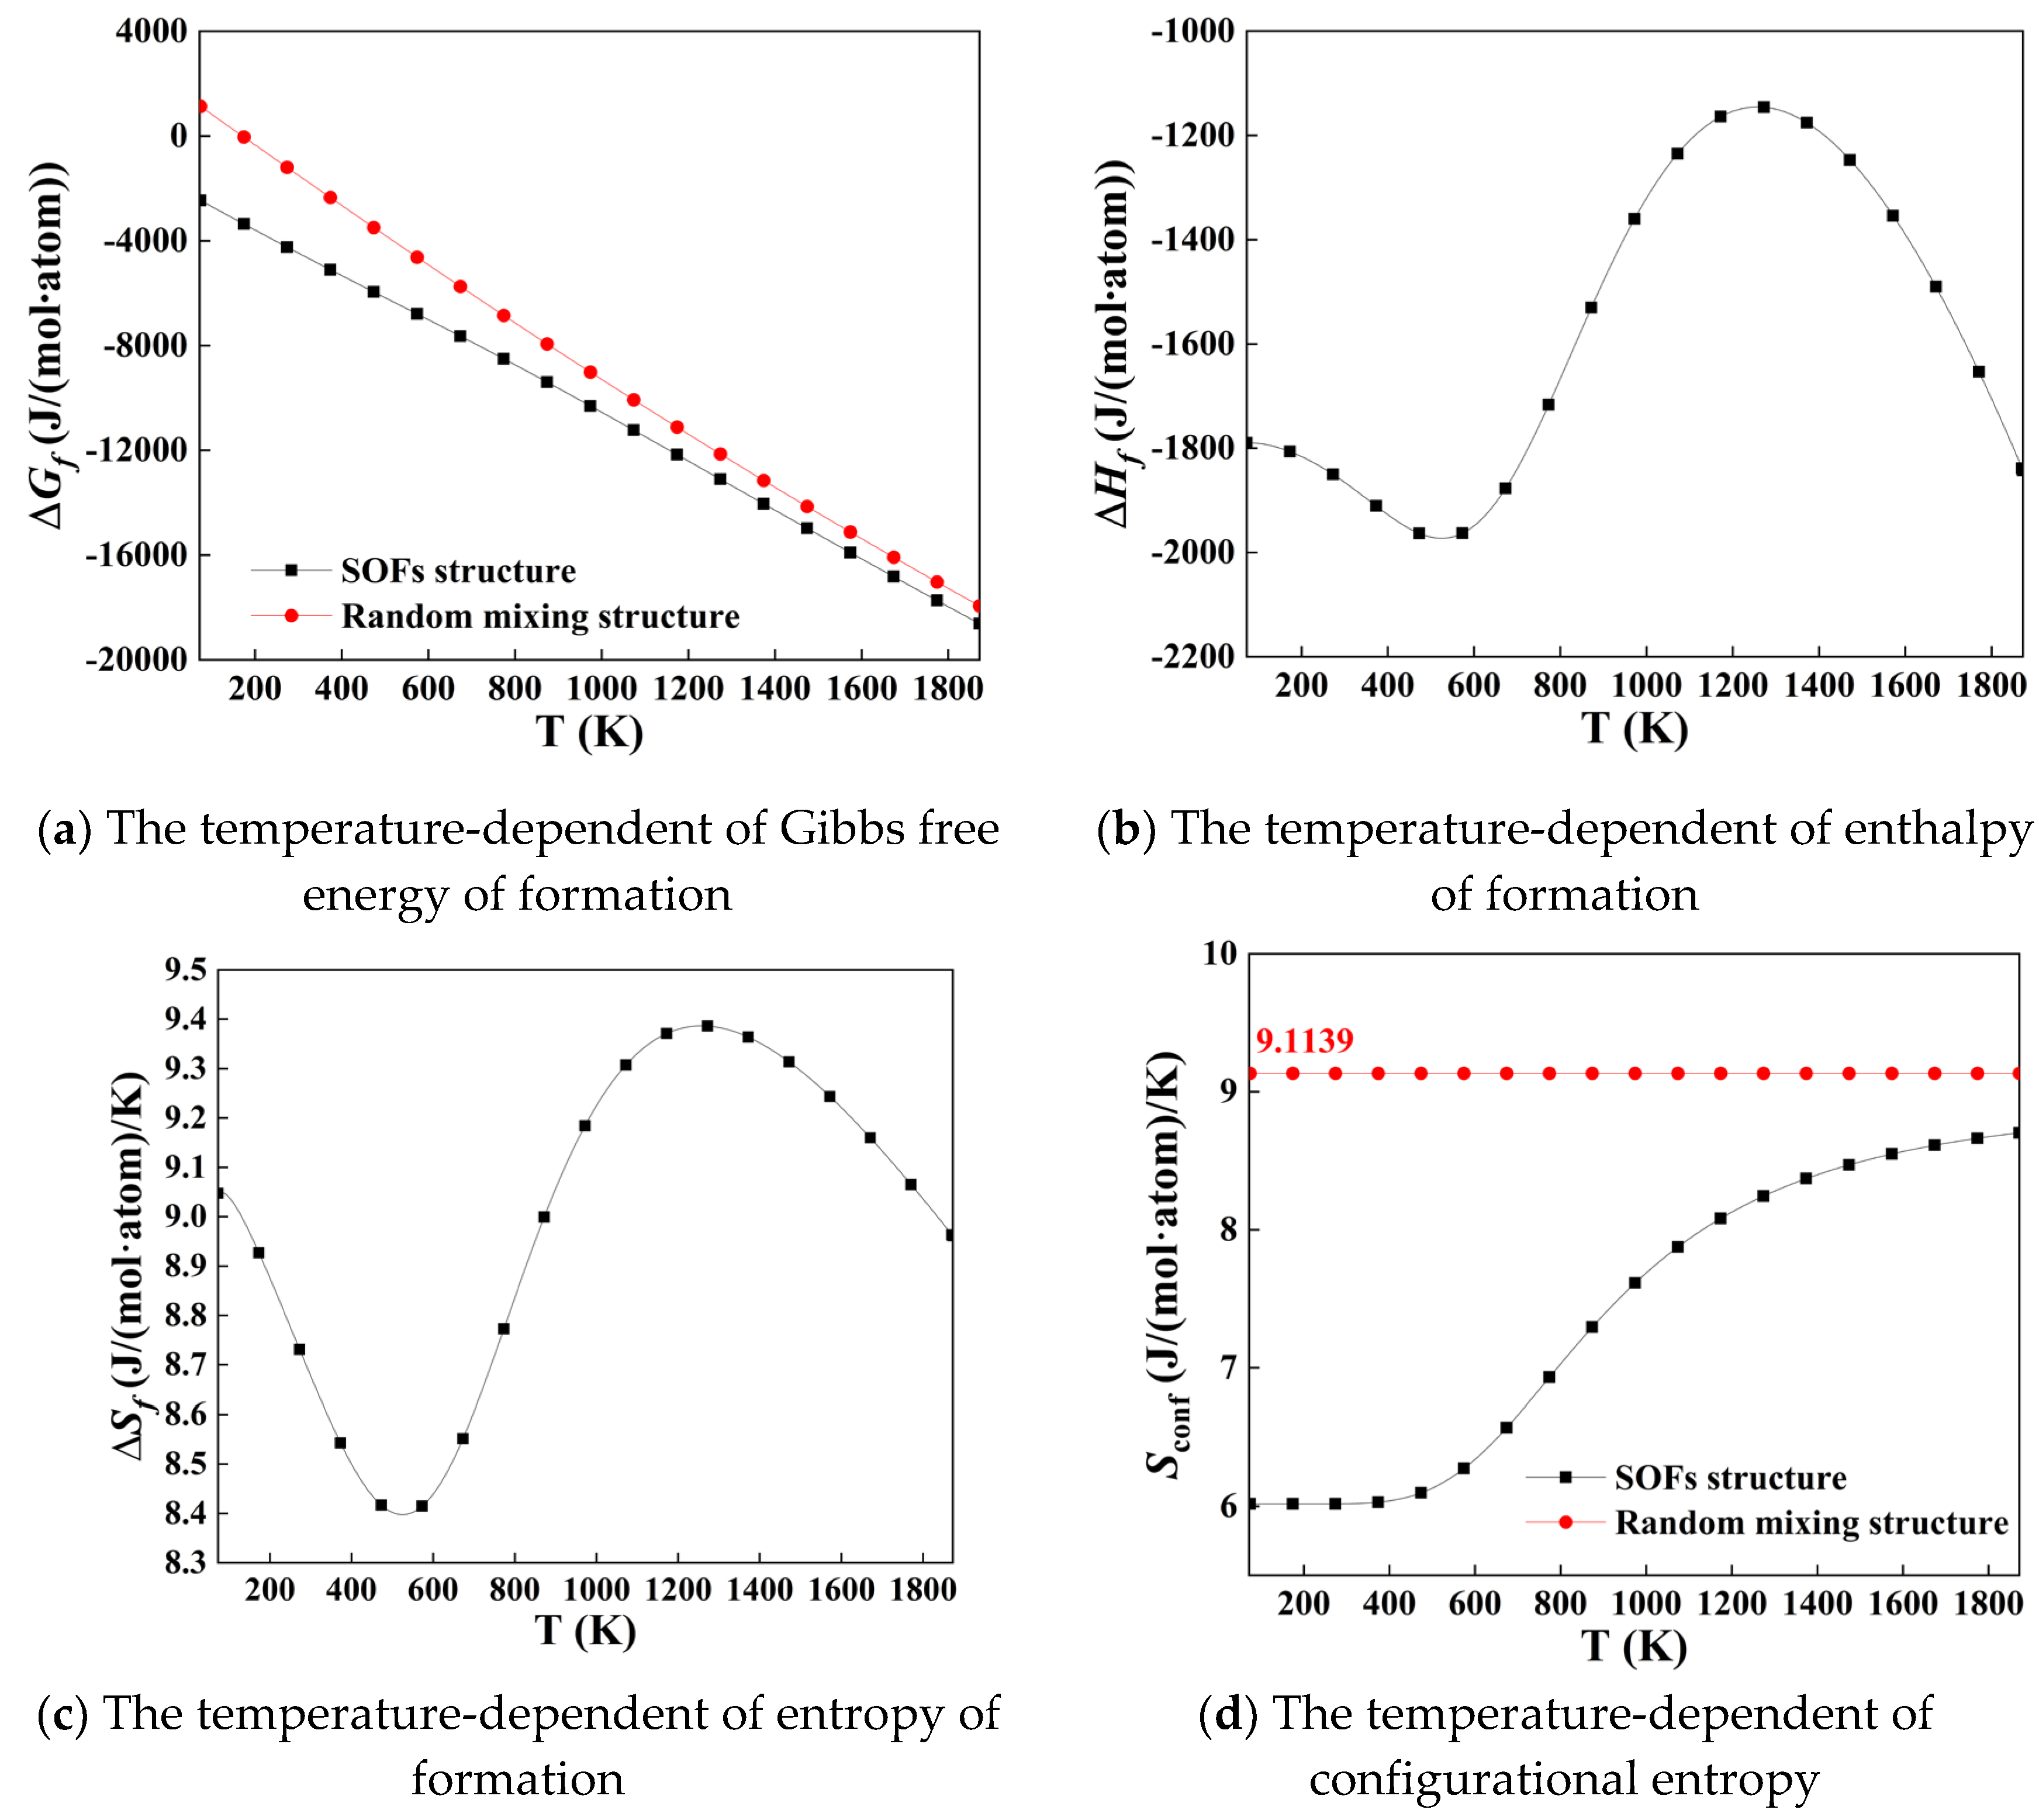
Figure 4.
The supercell of the ordered L12 prototype structure.
Figure 5.
Construction of a 30×30×30 supercell based on the prototype of L12_AuCu3 for FCC_CoCuNi MPEAs at (a) 100 K, (b) 900 K, and (c) 1400 K, respectively.
Figure 5.
Construction of a 30×30×30 supercell based on the prototype of L12_AuCu3 for FCC_CoCuNi MPEAs at (a) 100 K, (b) 900 K, and (c) 1400 K, respectively.
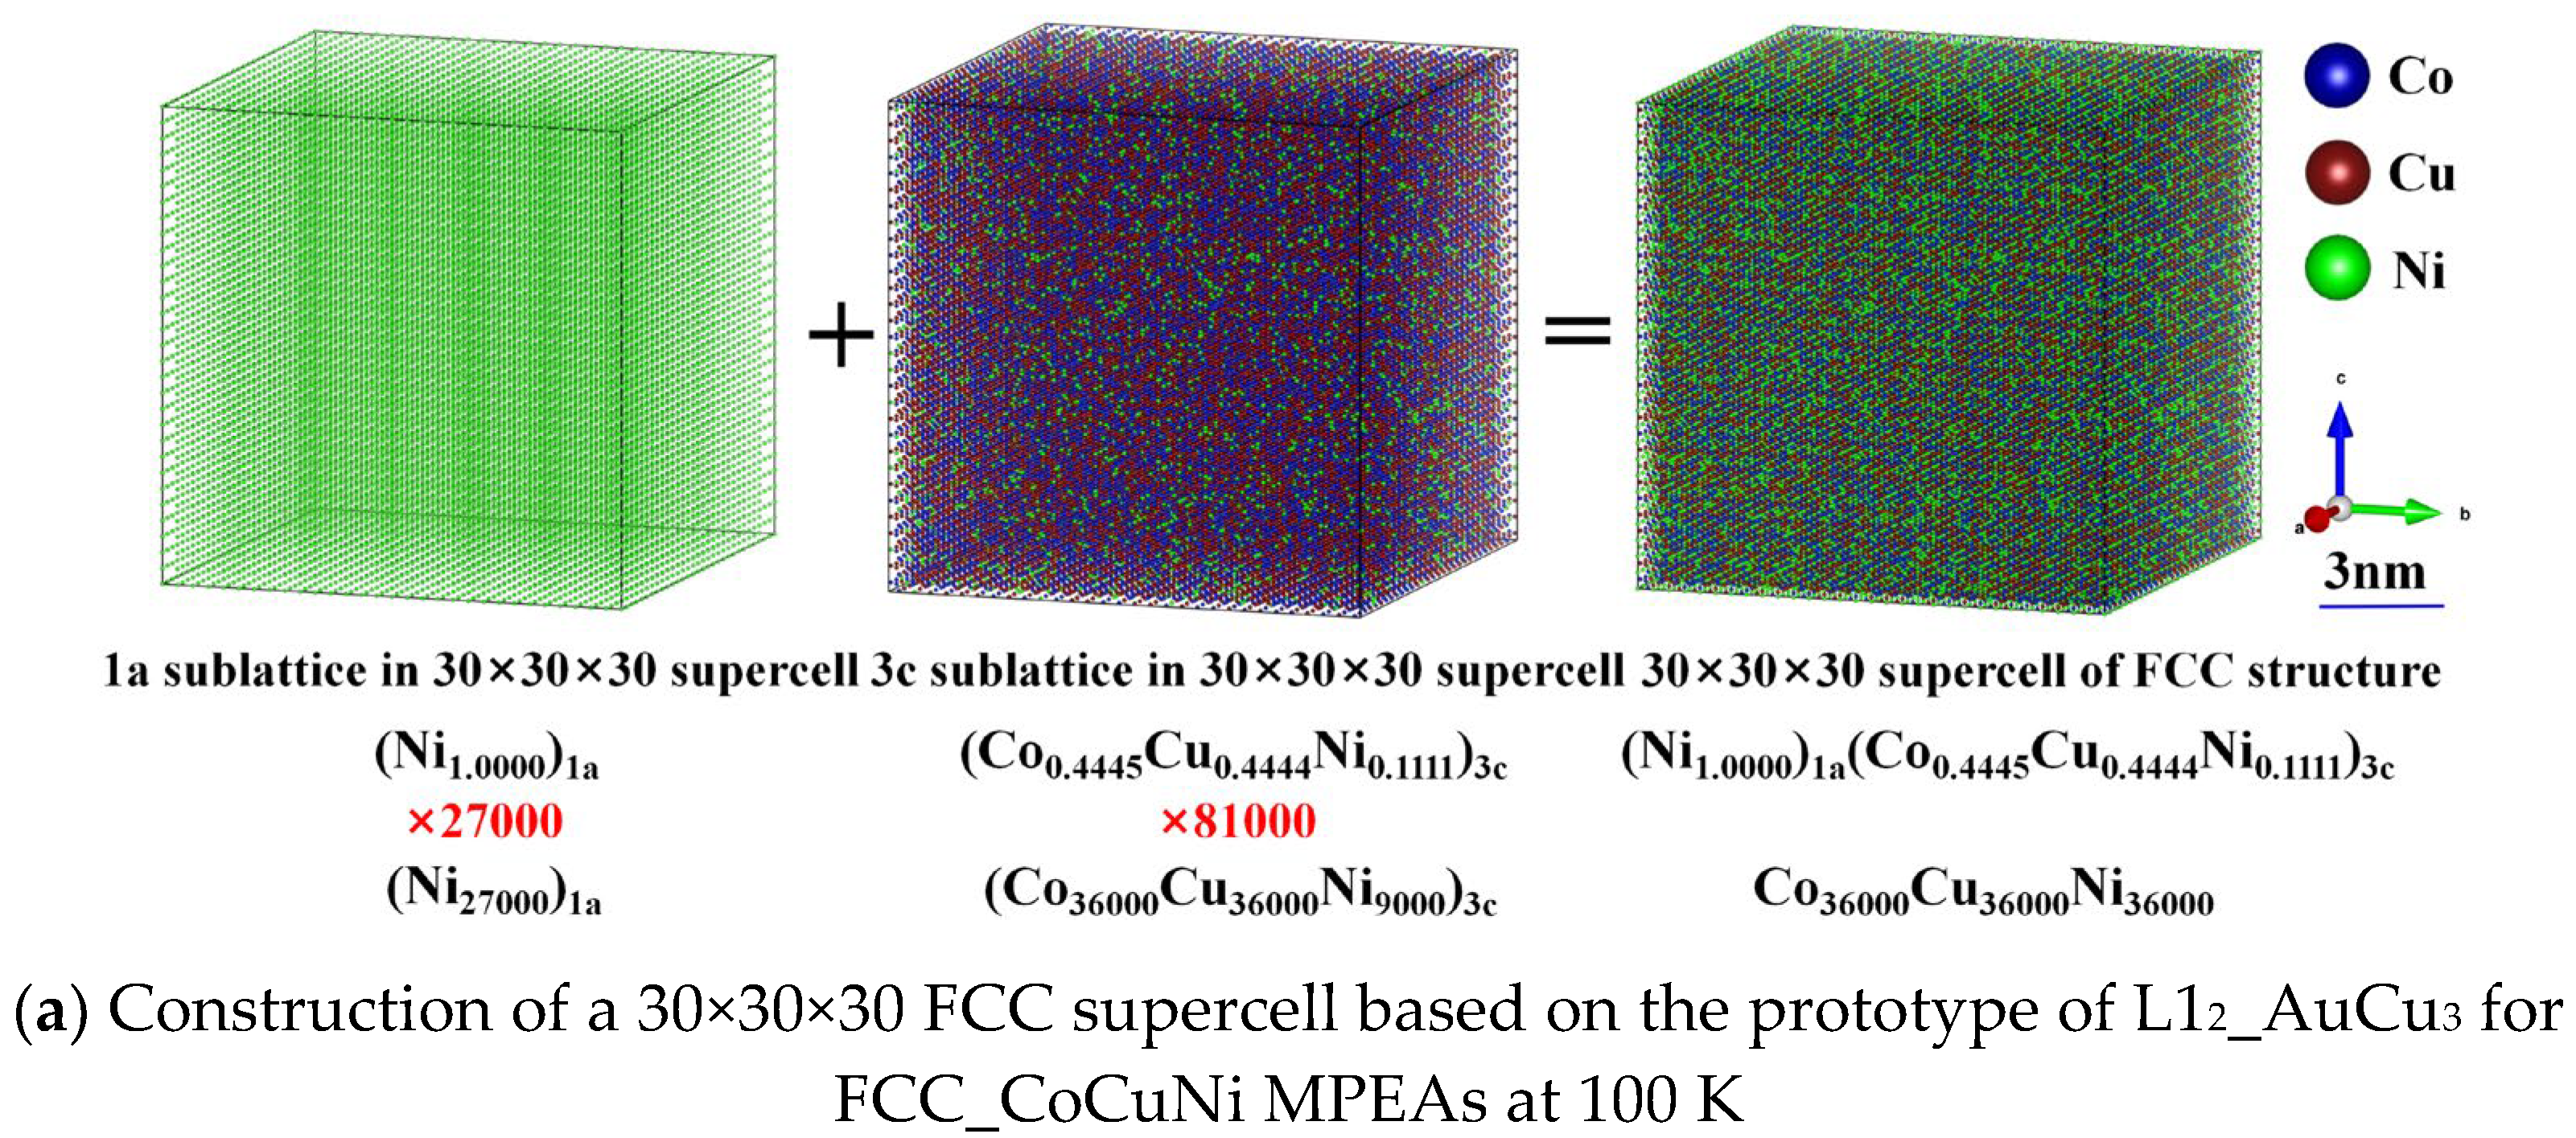
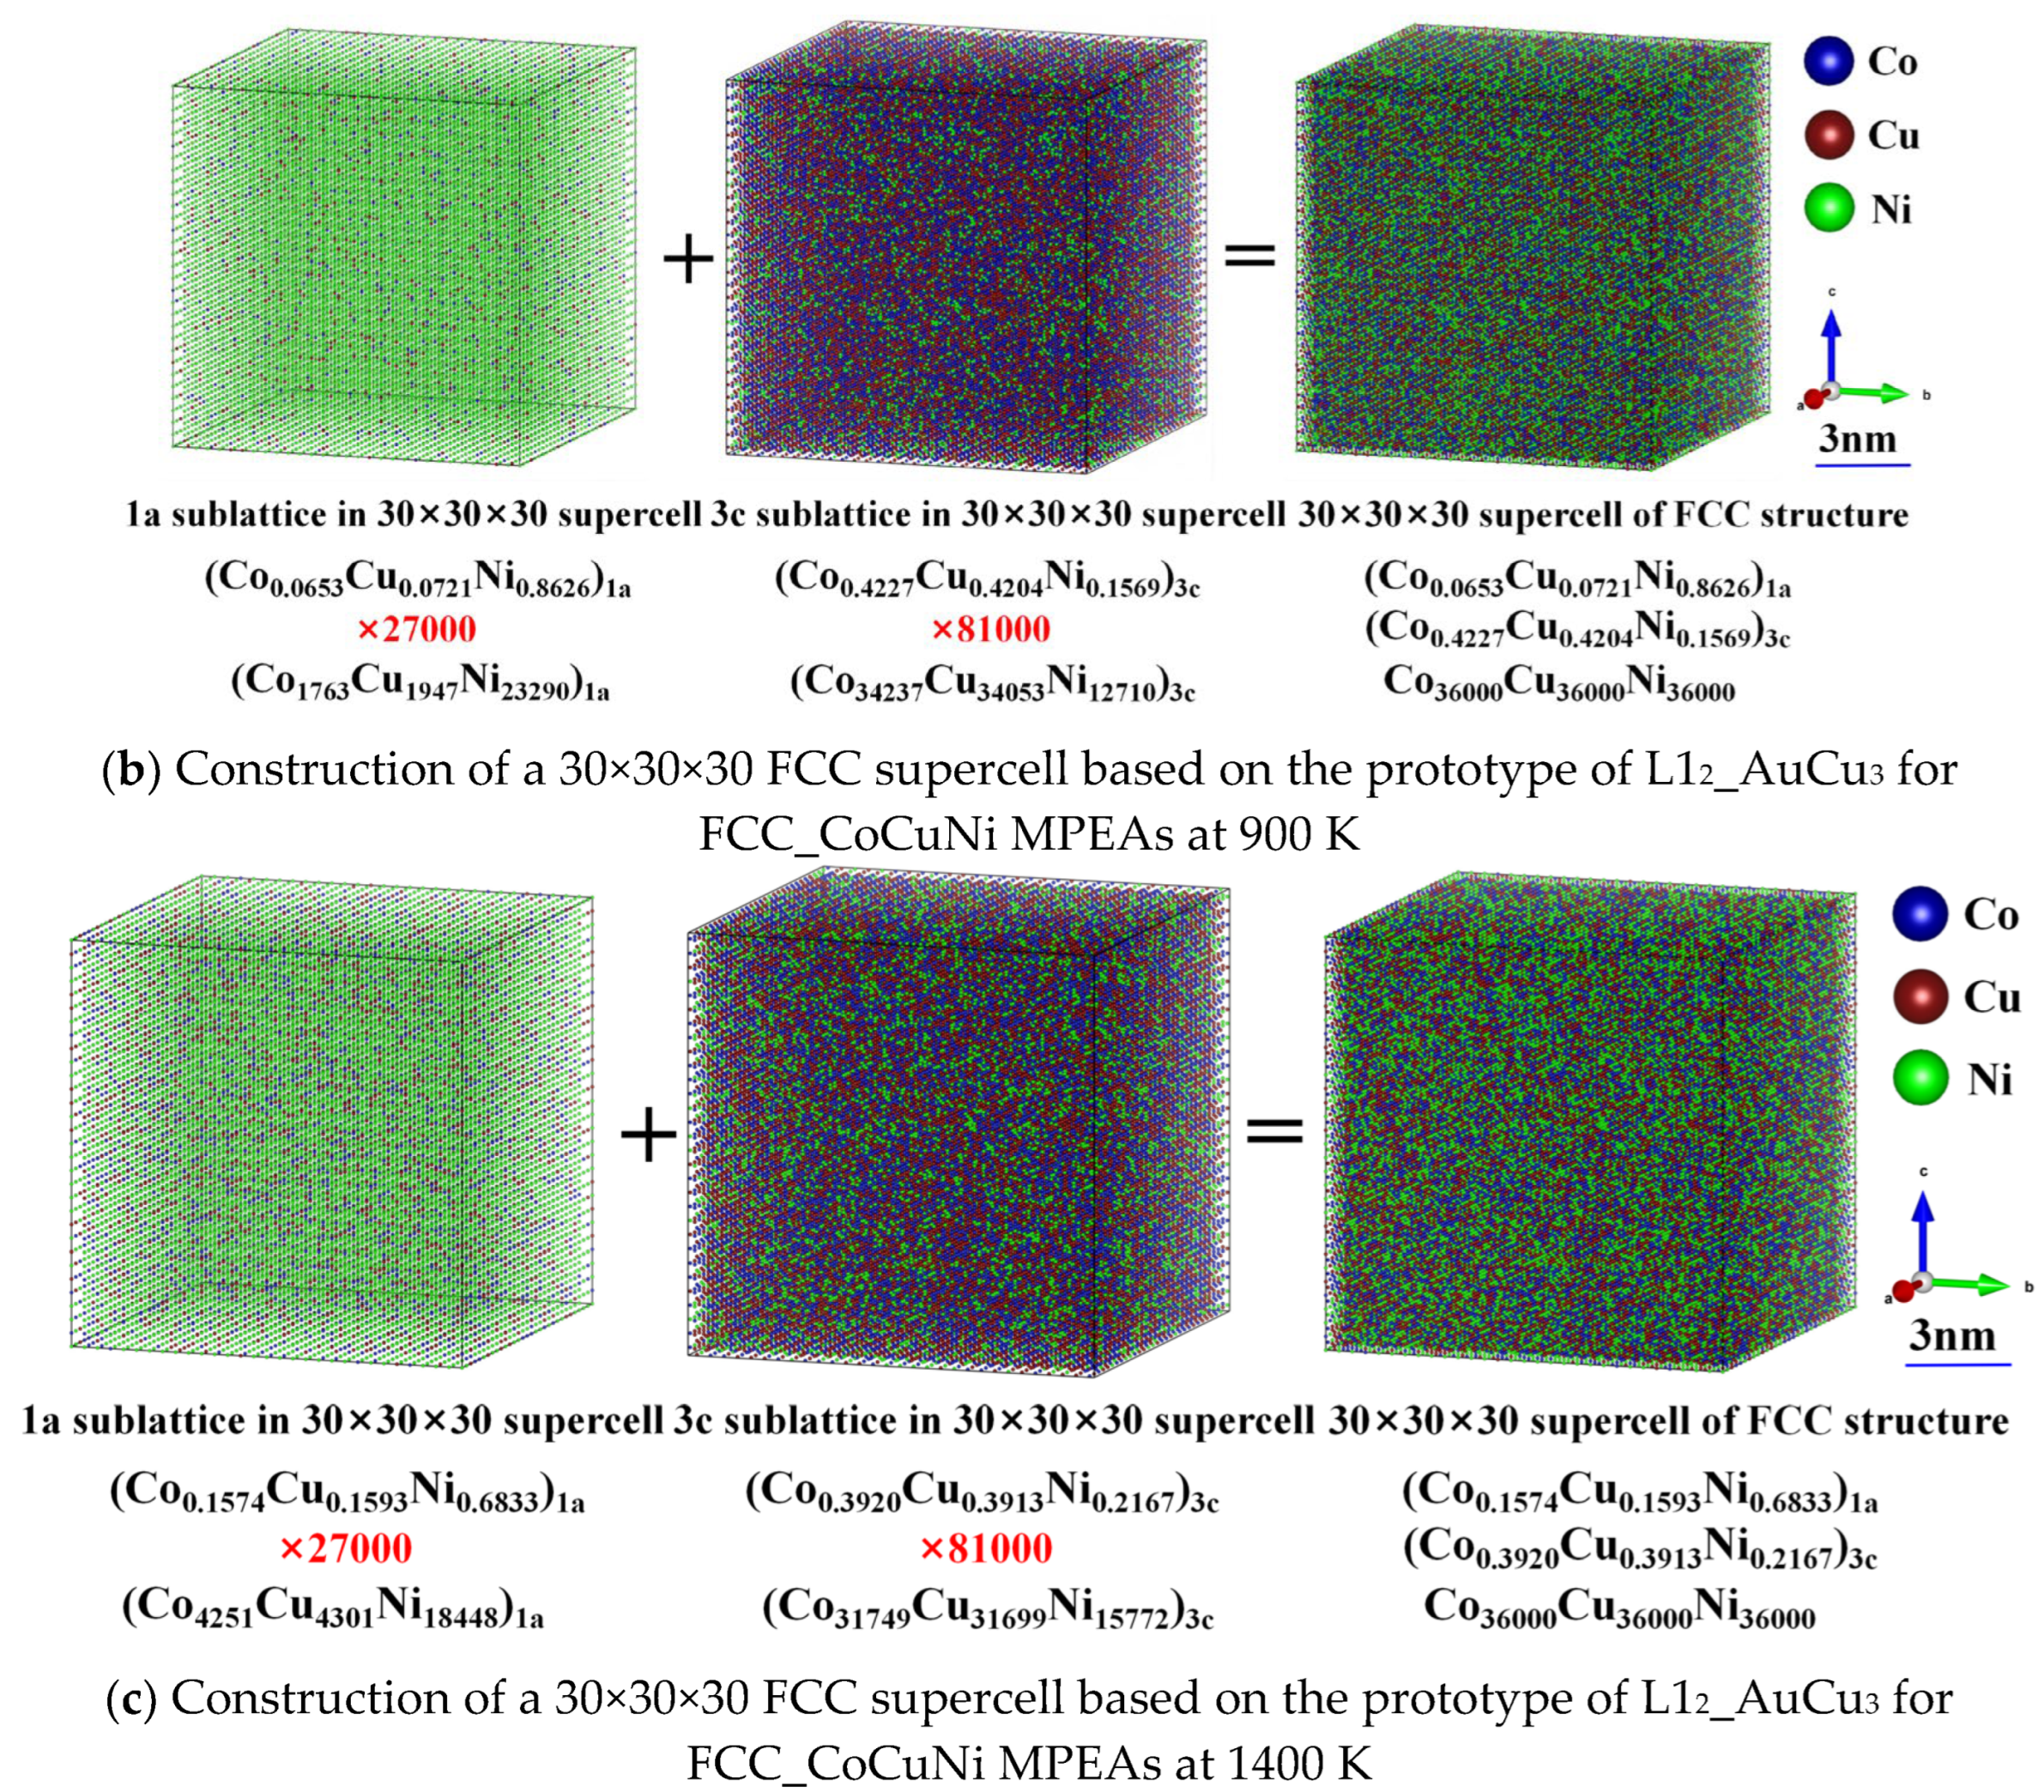
Figure 8.
Radial distribution functions of same type atom pairs. (a) SOFs structure at 100 K; (b) SOFs structure at 900 K; (c) SOFs structure at 1400 K; (d) randomly mixing structure.
Figure 8.
Radial distribution functions of same type atom pairs. (a) SOFs structure at 100 K; (b) SOFs structure at 900 K; (c) SOFs structure at 1400 K; (d) randomly mixing structure.
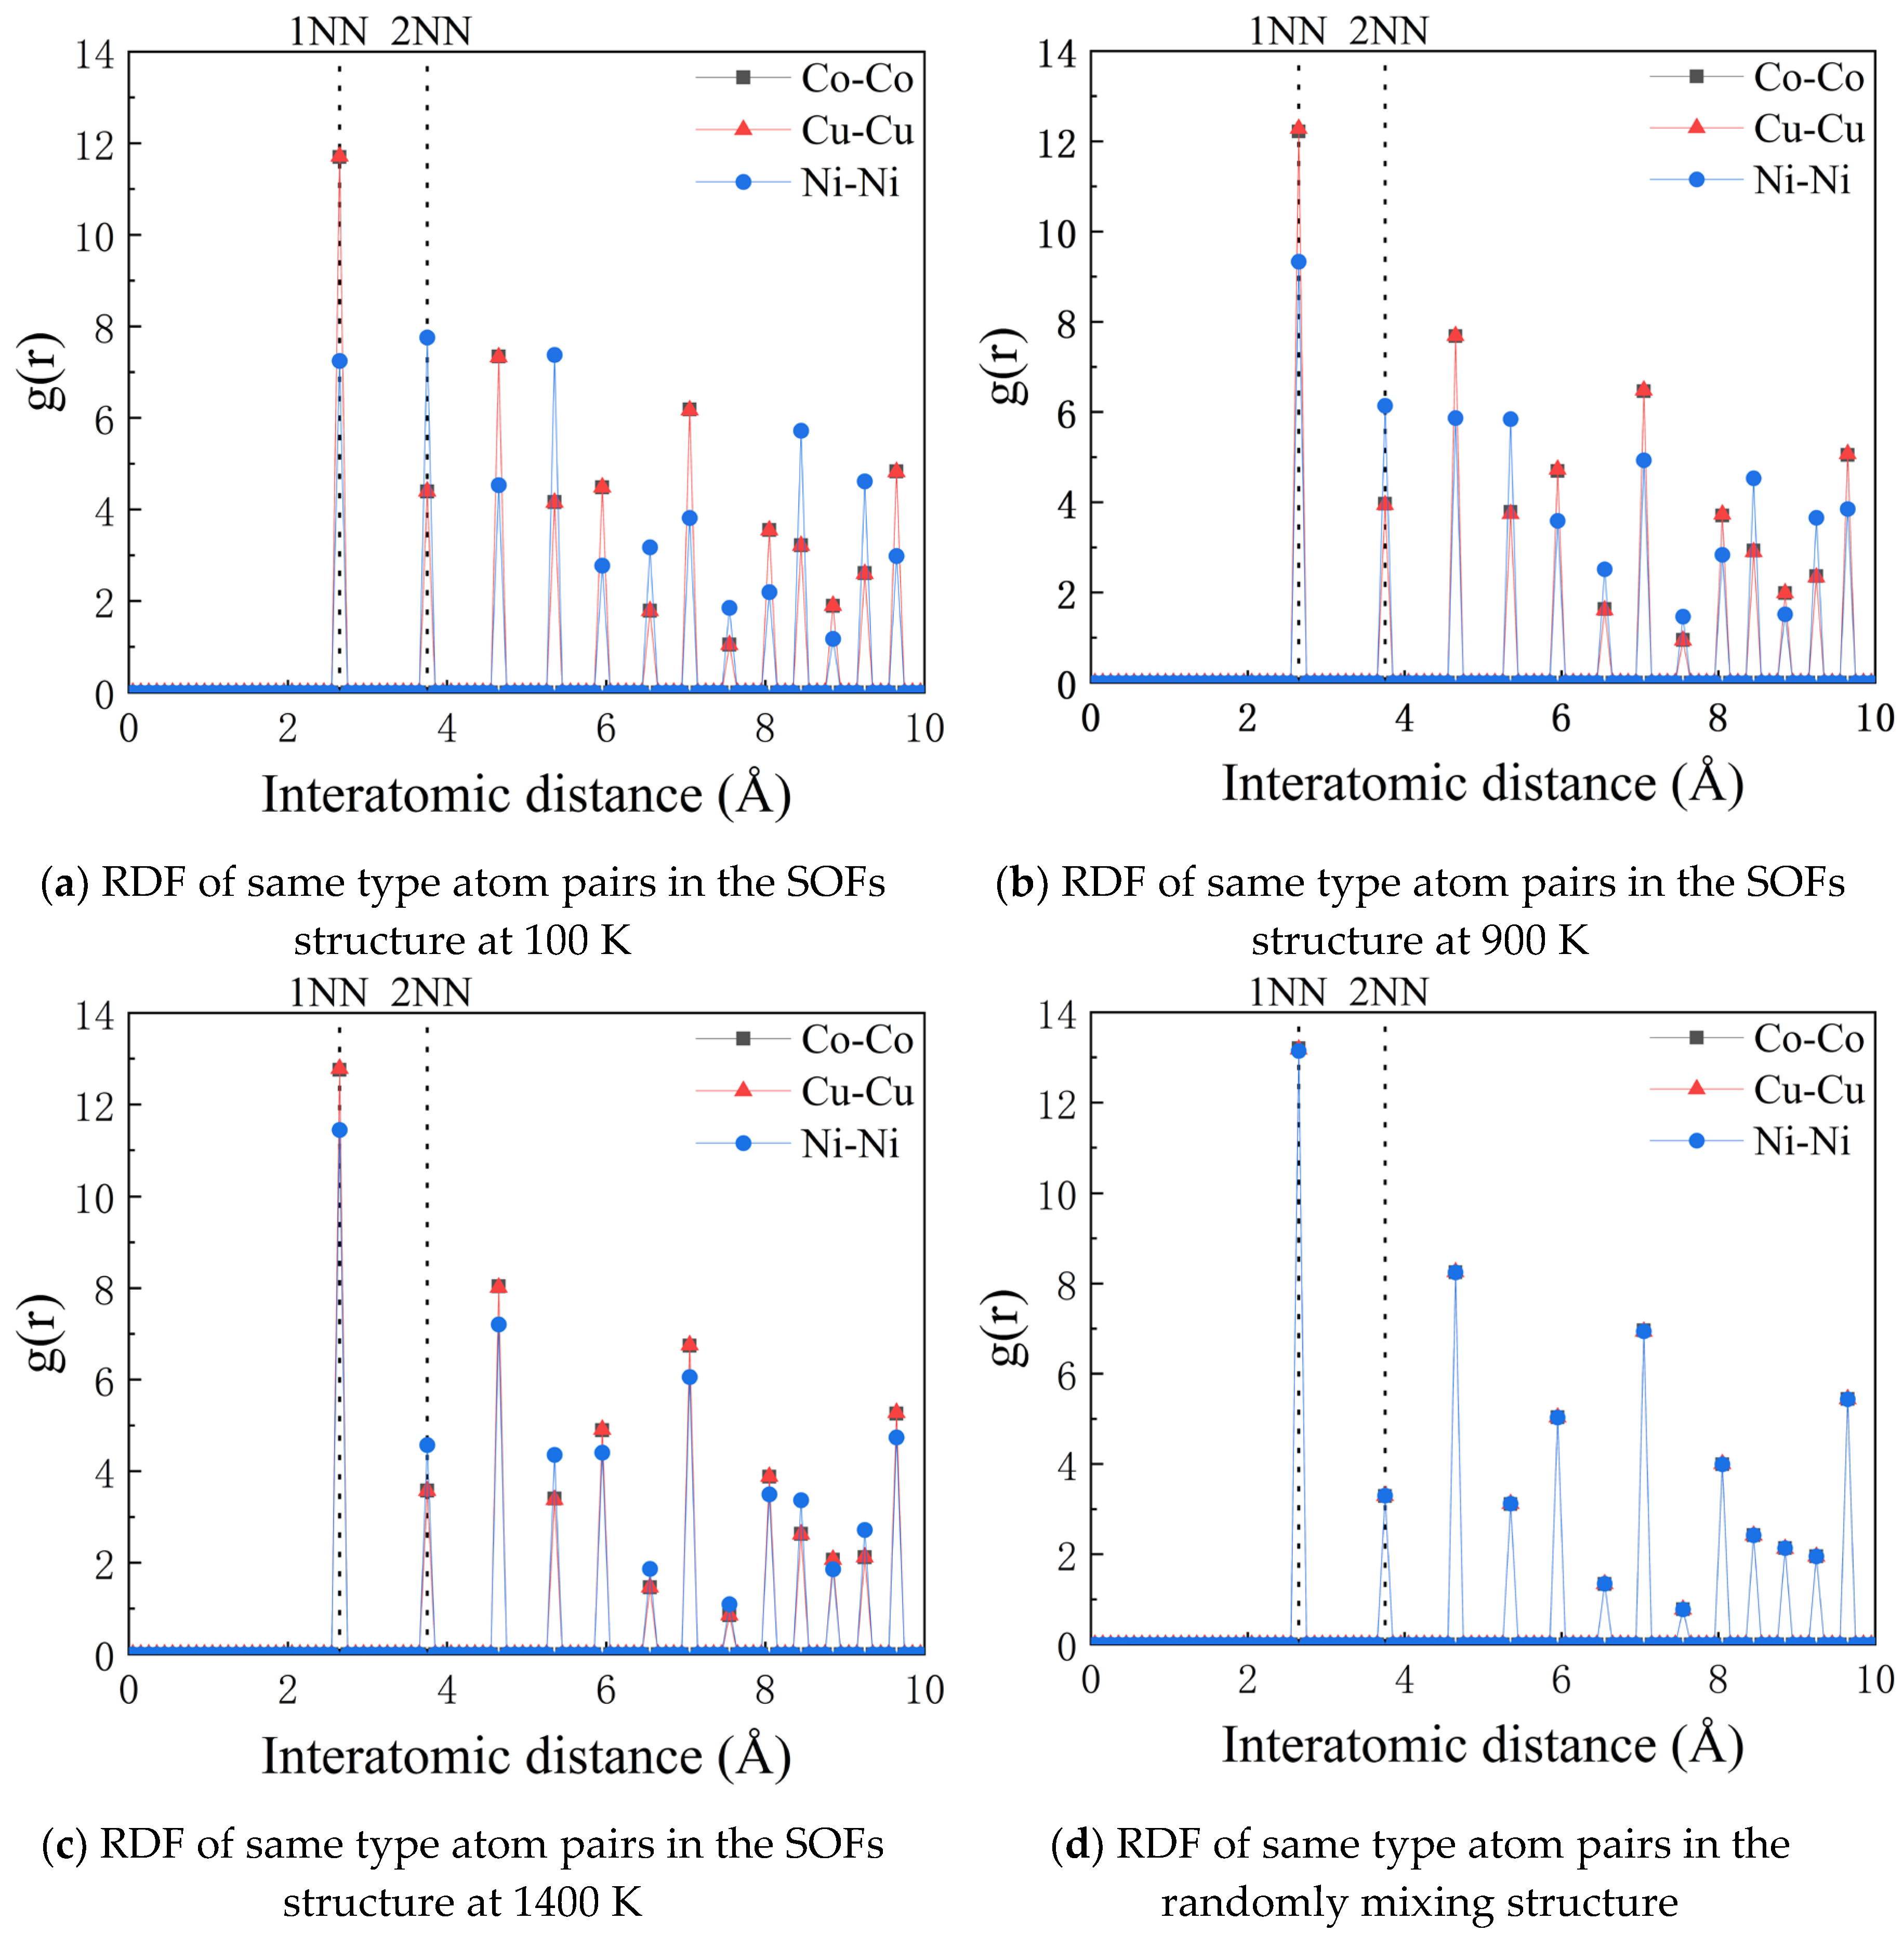
Figure 9.
Adjacent atomic layers of FCC_CoCuNi MPEAs with a 30×30×30 supercell at 100 K. (a-b) (0 0 1)-oriented 31st and 32nd atomic layers; (c-d) (1 1 0)-oriented 31st and 32nd atomic layers; (e-f) (1 1 1)-oriented 31st and 32nd atomic layers.
Figure 9.
Adjacent atomic layers of FCC_CoCuNi MPEAs with a 30×30×30 supercell at 100 K. (a-b) (0 0 1)-oriented 31st and 32nd atomic layers; (c-d) (1 1 0)-oriented 31st and 32nd atomic layers; (e-f) (1 1 1)-oriented 31st and 32nd atomic layers.
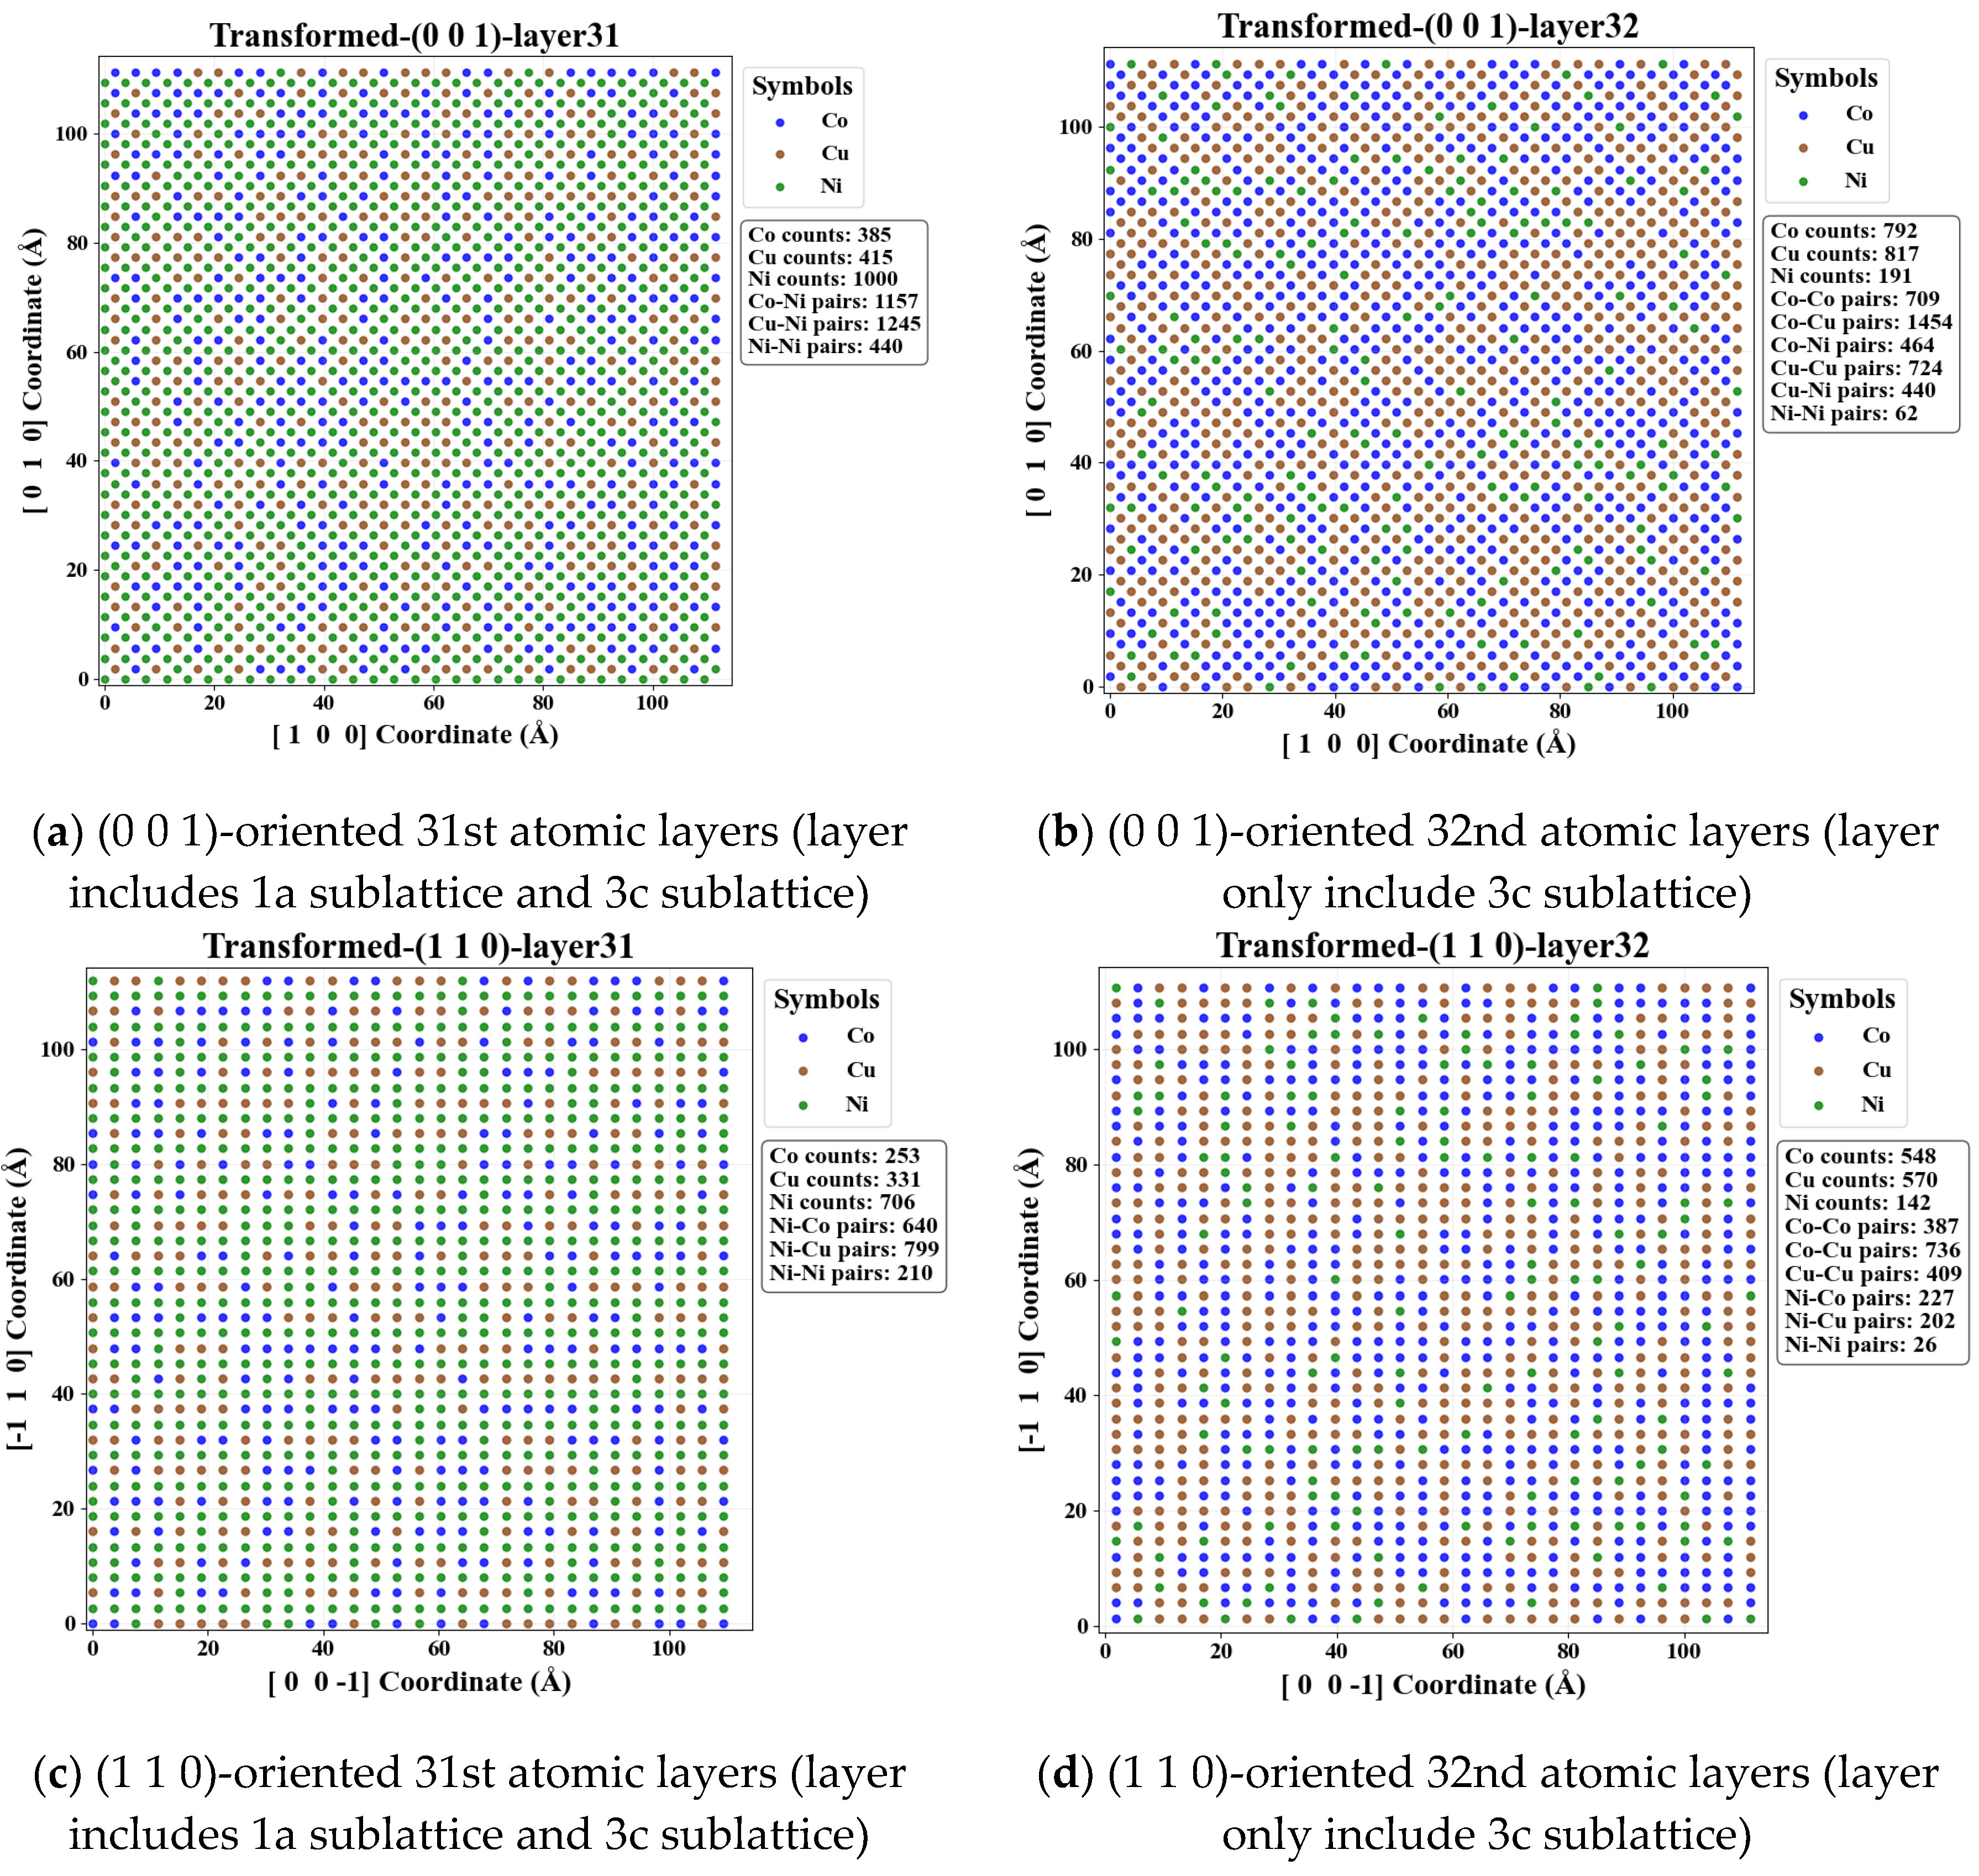
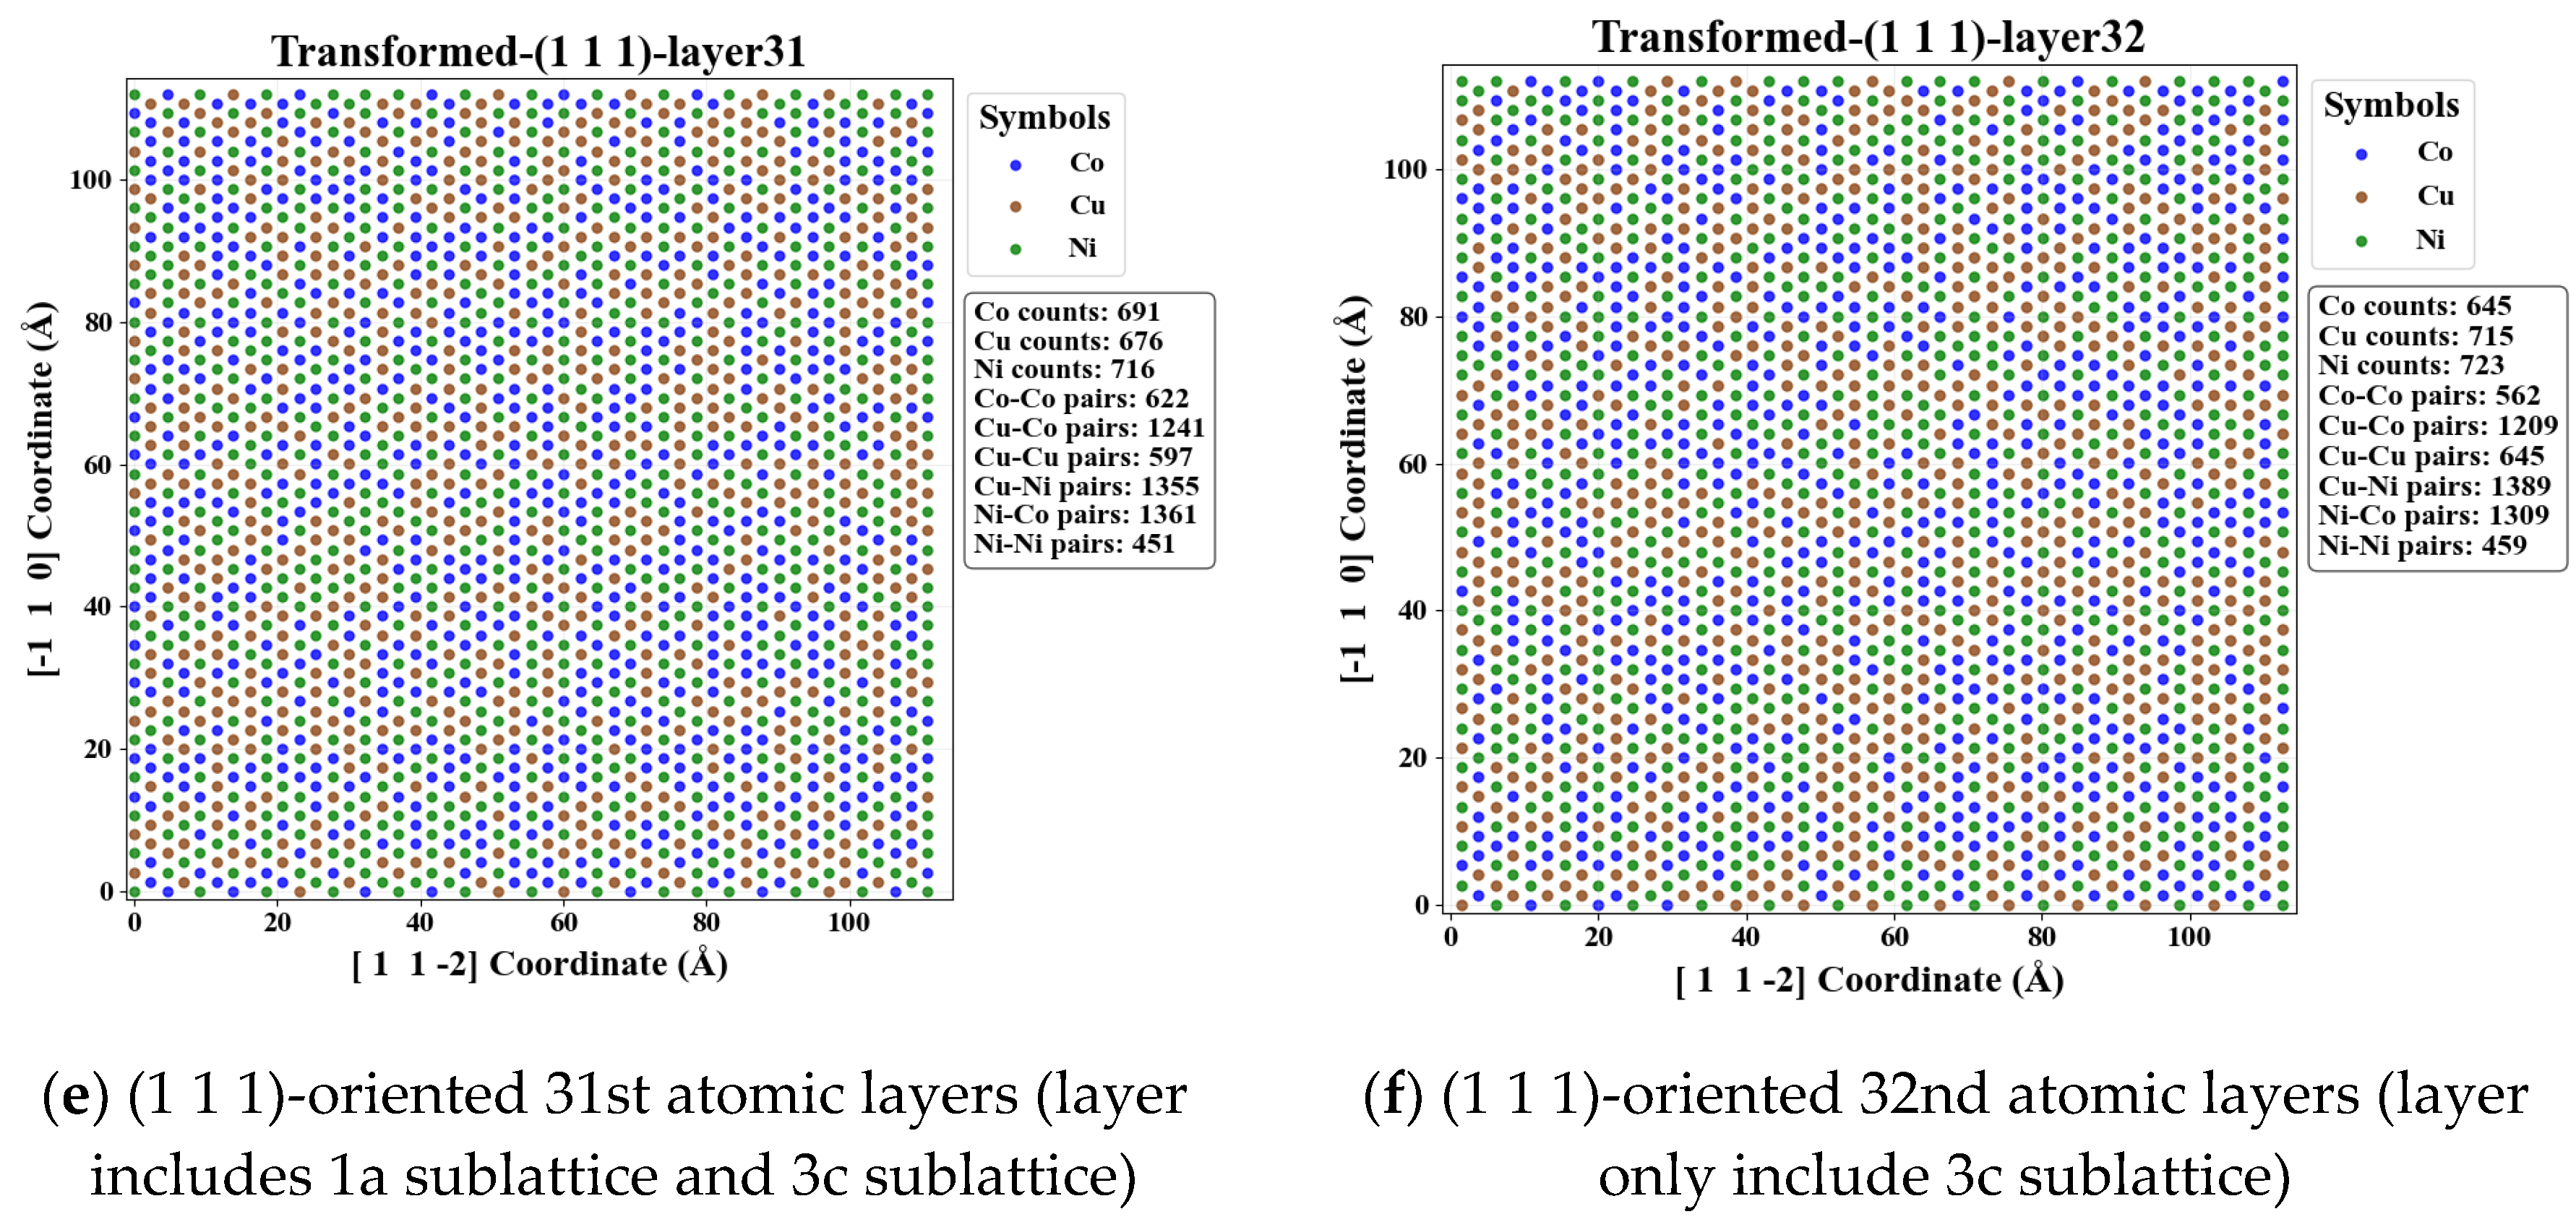
Figure 10.
Interlayer atomic sublattice differences of FCC_L12_AuCu3 supercell.
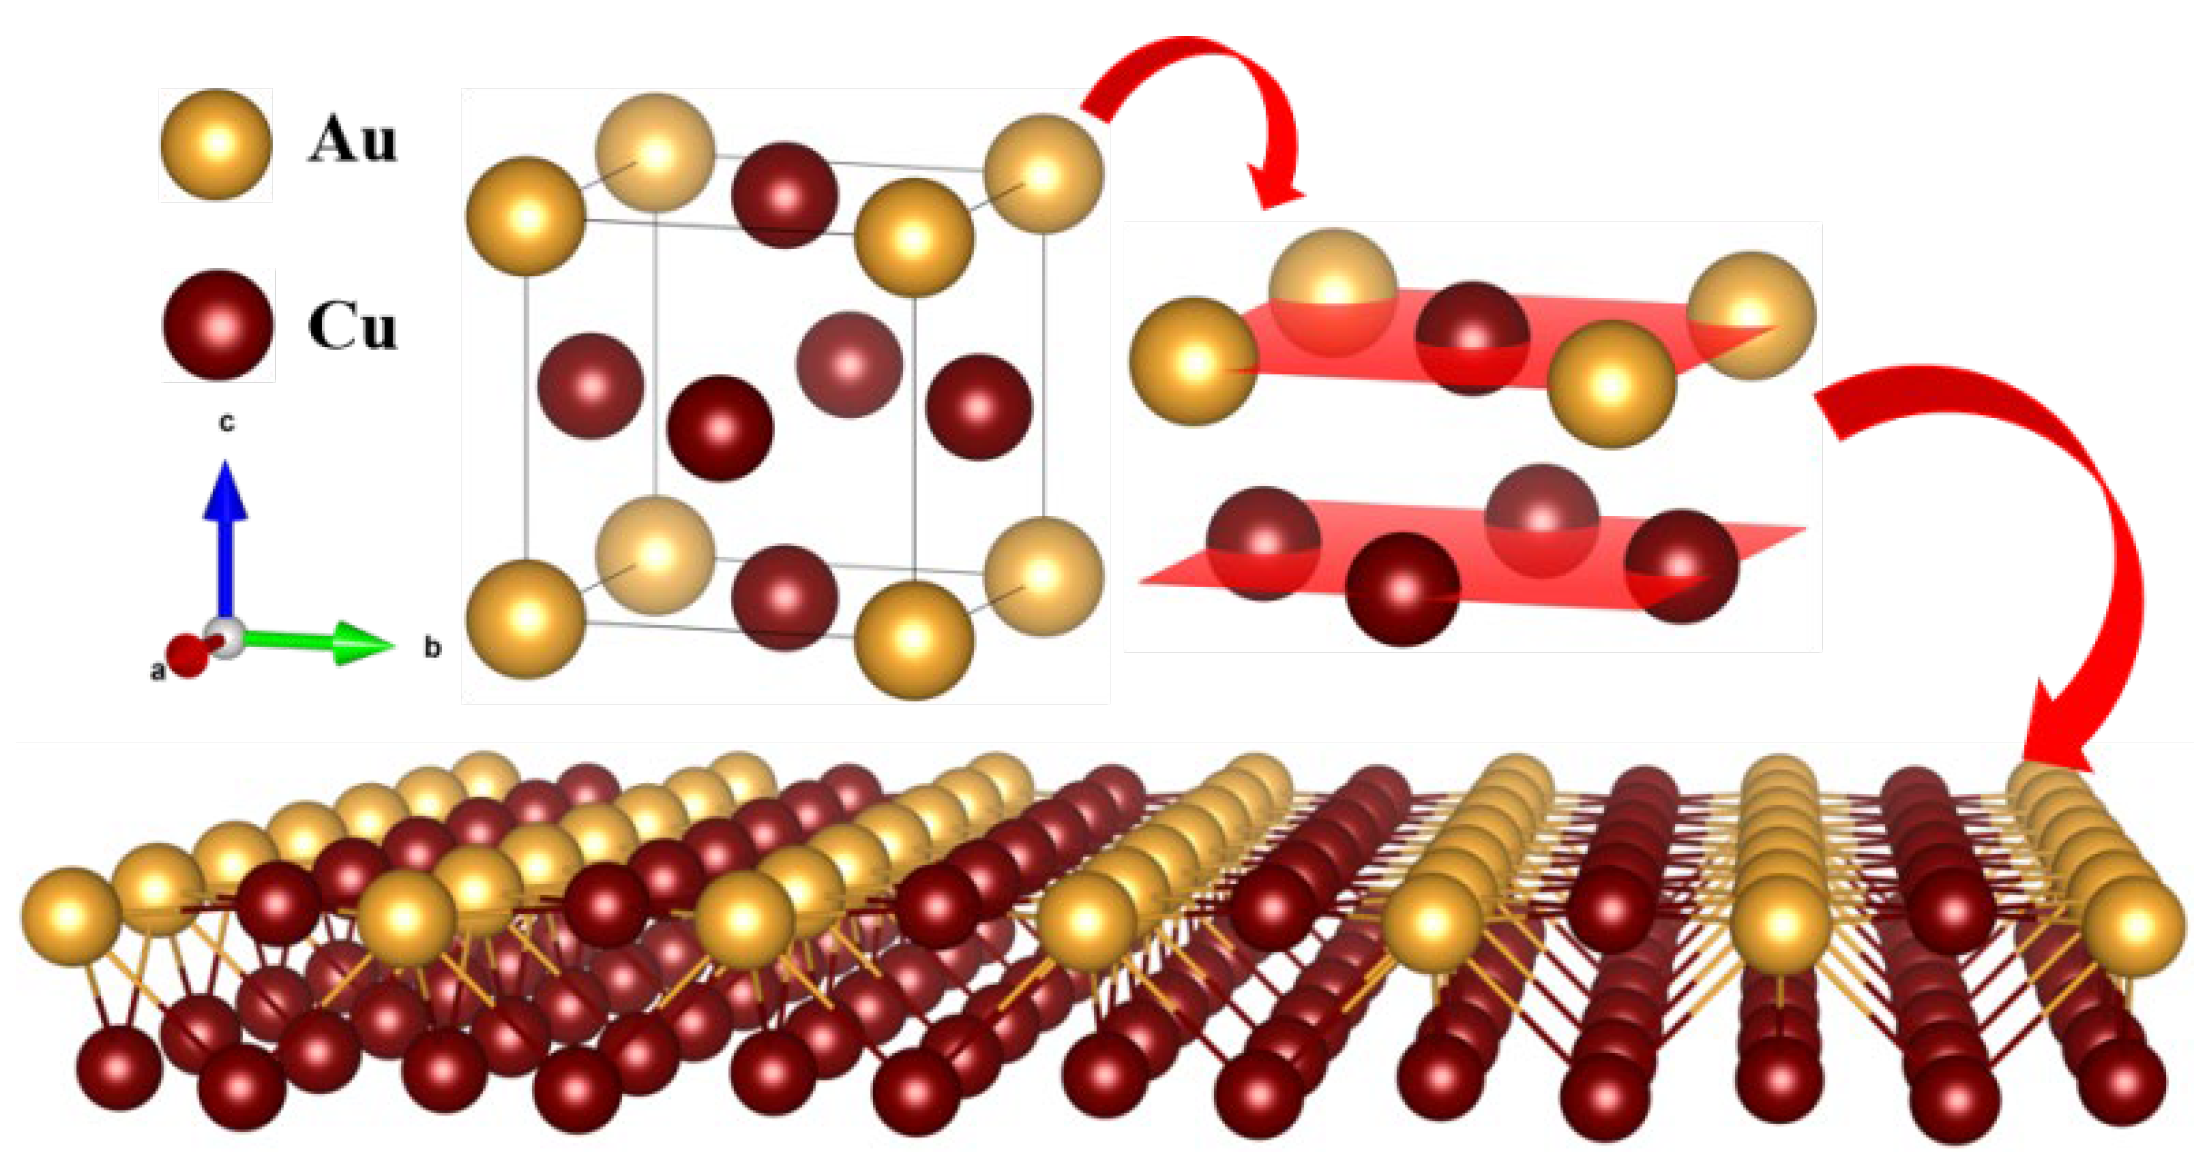
Figure 11.
Nested supercell model of a 3×3×3 FCC_CoCuNi MPEAs based on the L12_AuCu3 prototype and SOFs at (a) 100 K, (b) 900 K, and (c) 1400 K (Atoms fixed or constrained by selective dynamics are highlighted in red.).
Figure 11.
Nested supercell model of a 3×3×3 FCC_CoCuNi MPEAs based on the L12_AuCu3 prototype and SOFs at (a) 100 K, (b) 900 K, and (c) 1400 K (Atoms fixed or constrained by selective dynamics are highlighted in red.).
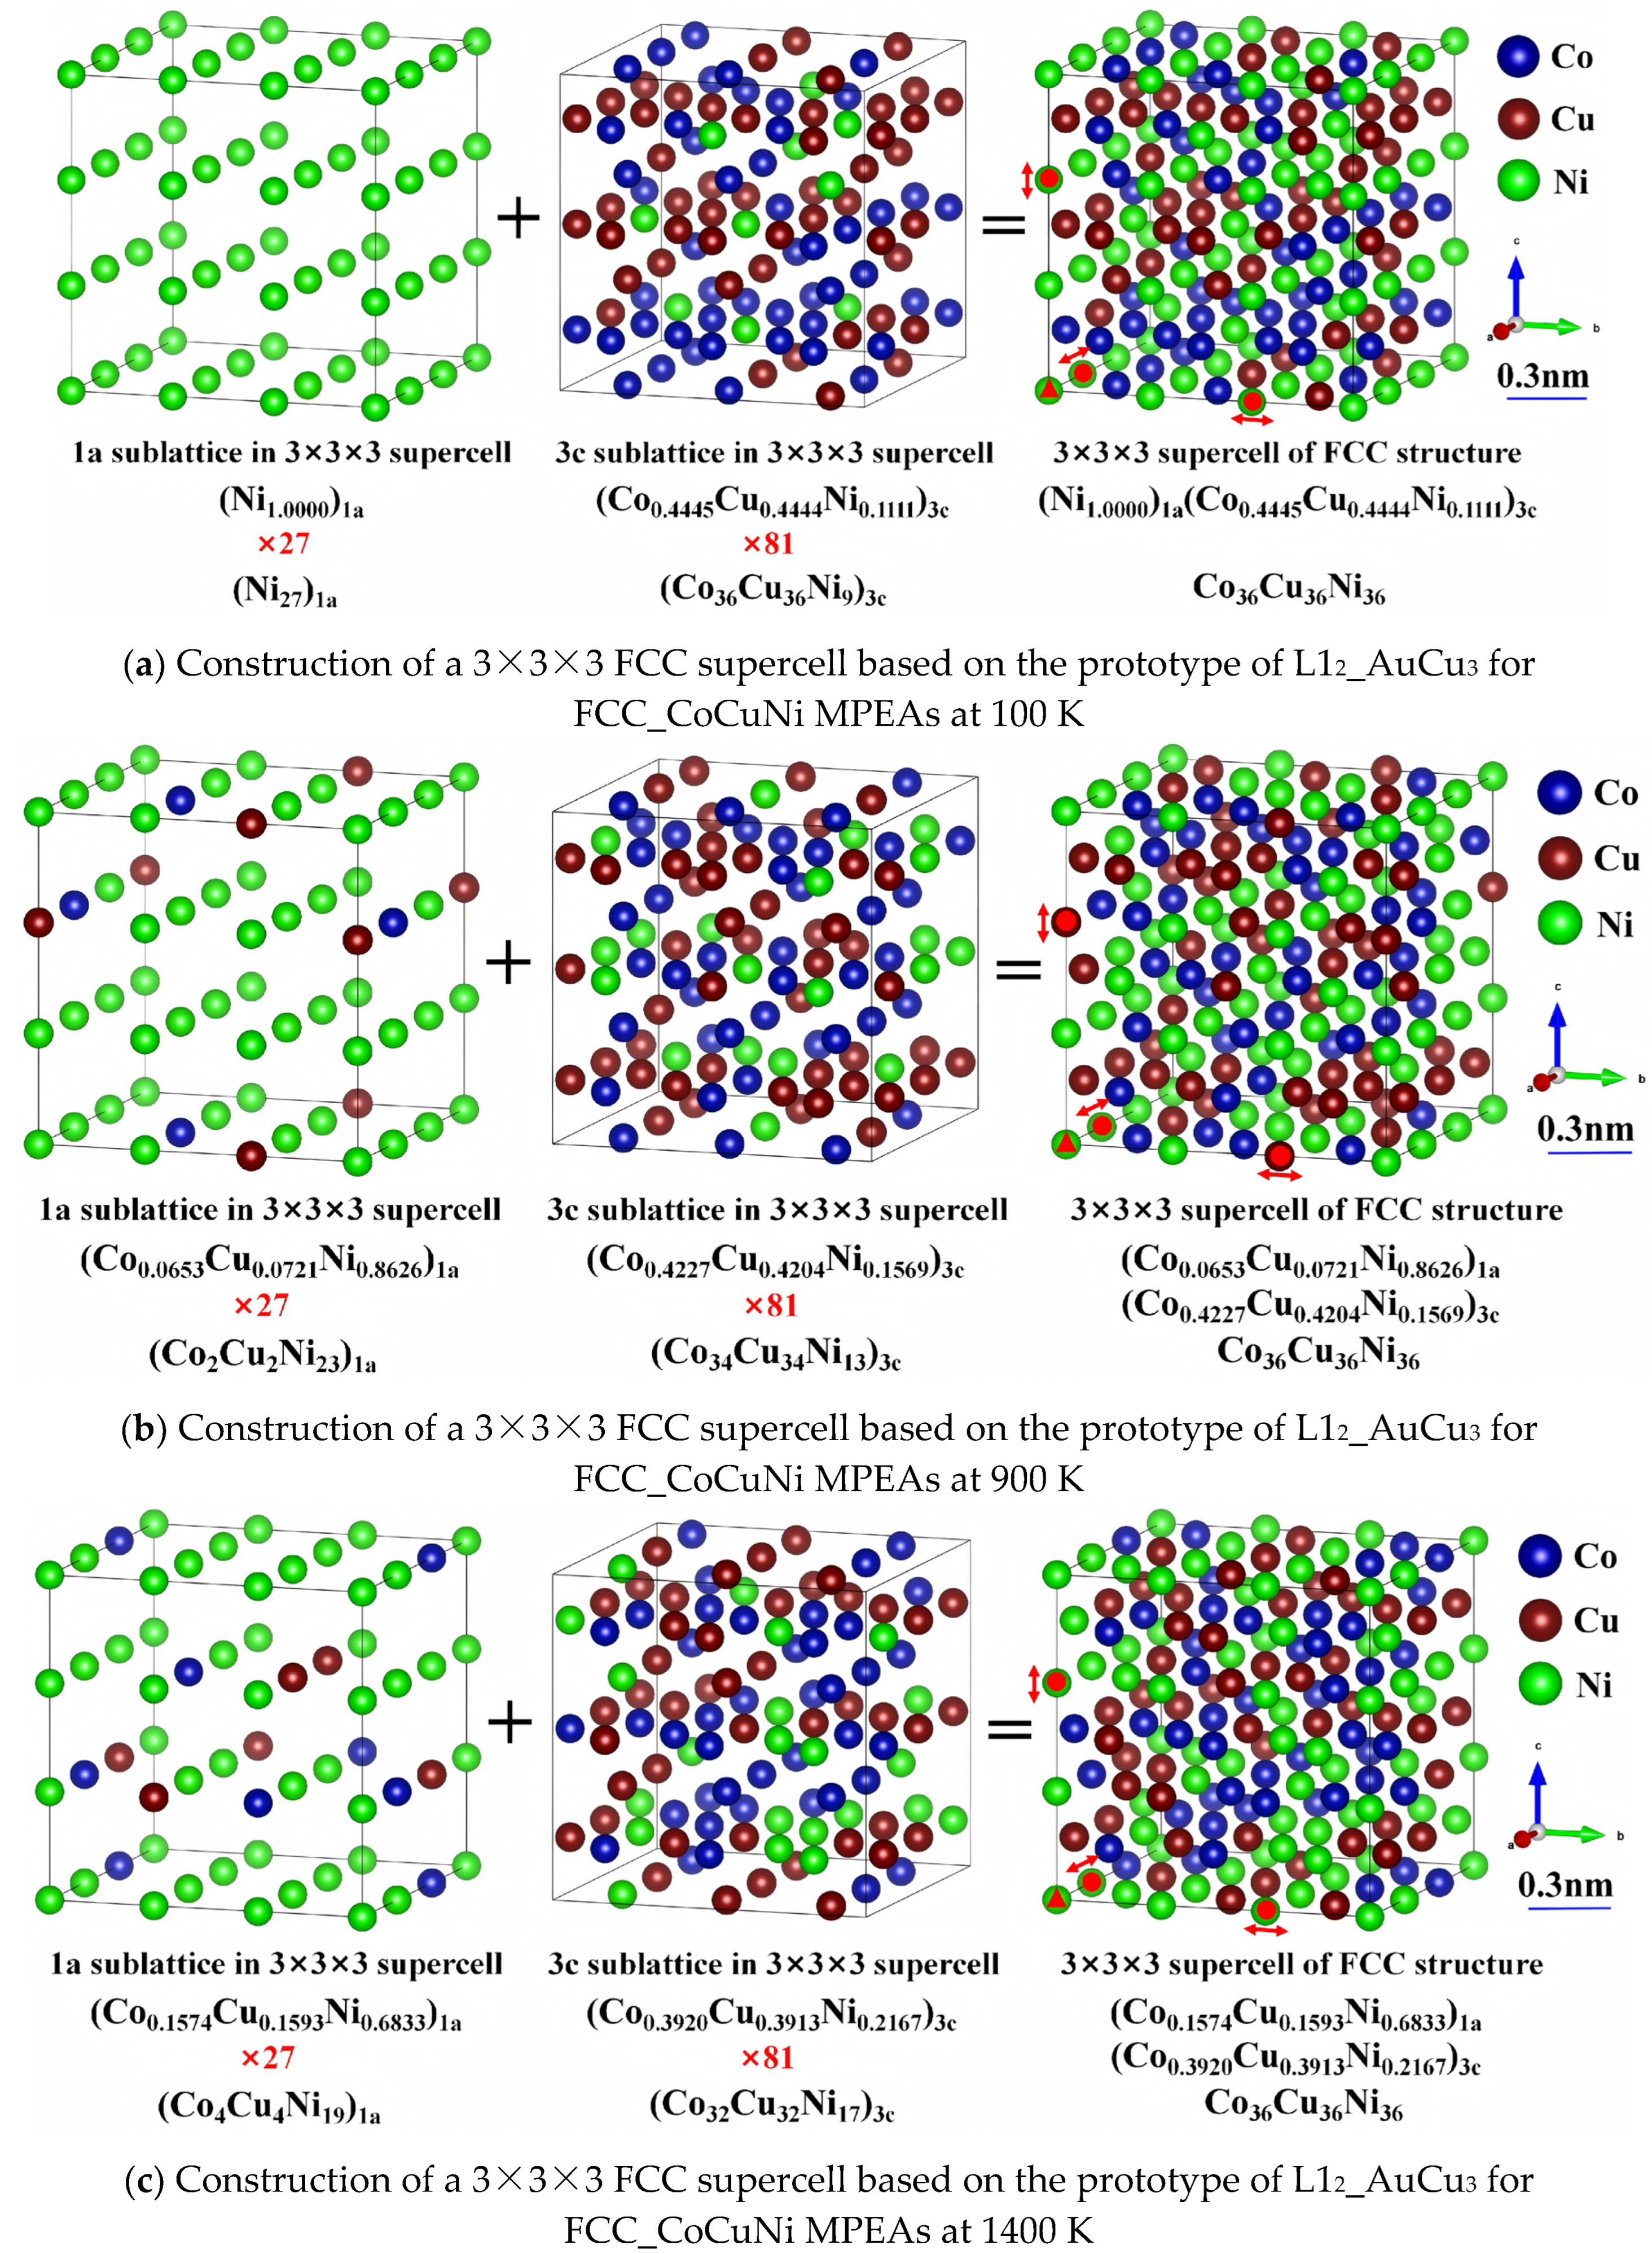
Figure 12.
Atomic resultant forces and distorted displacements of FCC_CoCuNi MPEAs with and without lattice distortion based on the SOFs at 900 K (a) resultant force acting on each atom without lattice distortion (R7); (b) resultant force acting on each atom with lattice distortion (R7 + R3); and (c) distorted displacements with lattice distortion (R7 + R3).
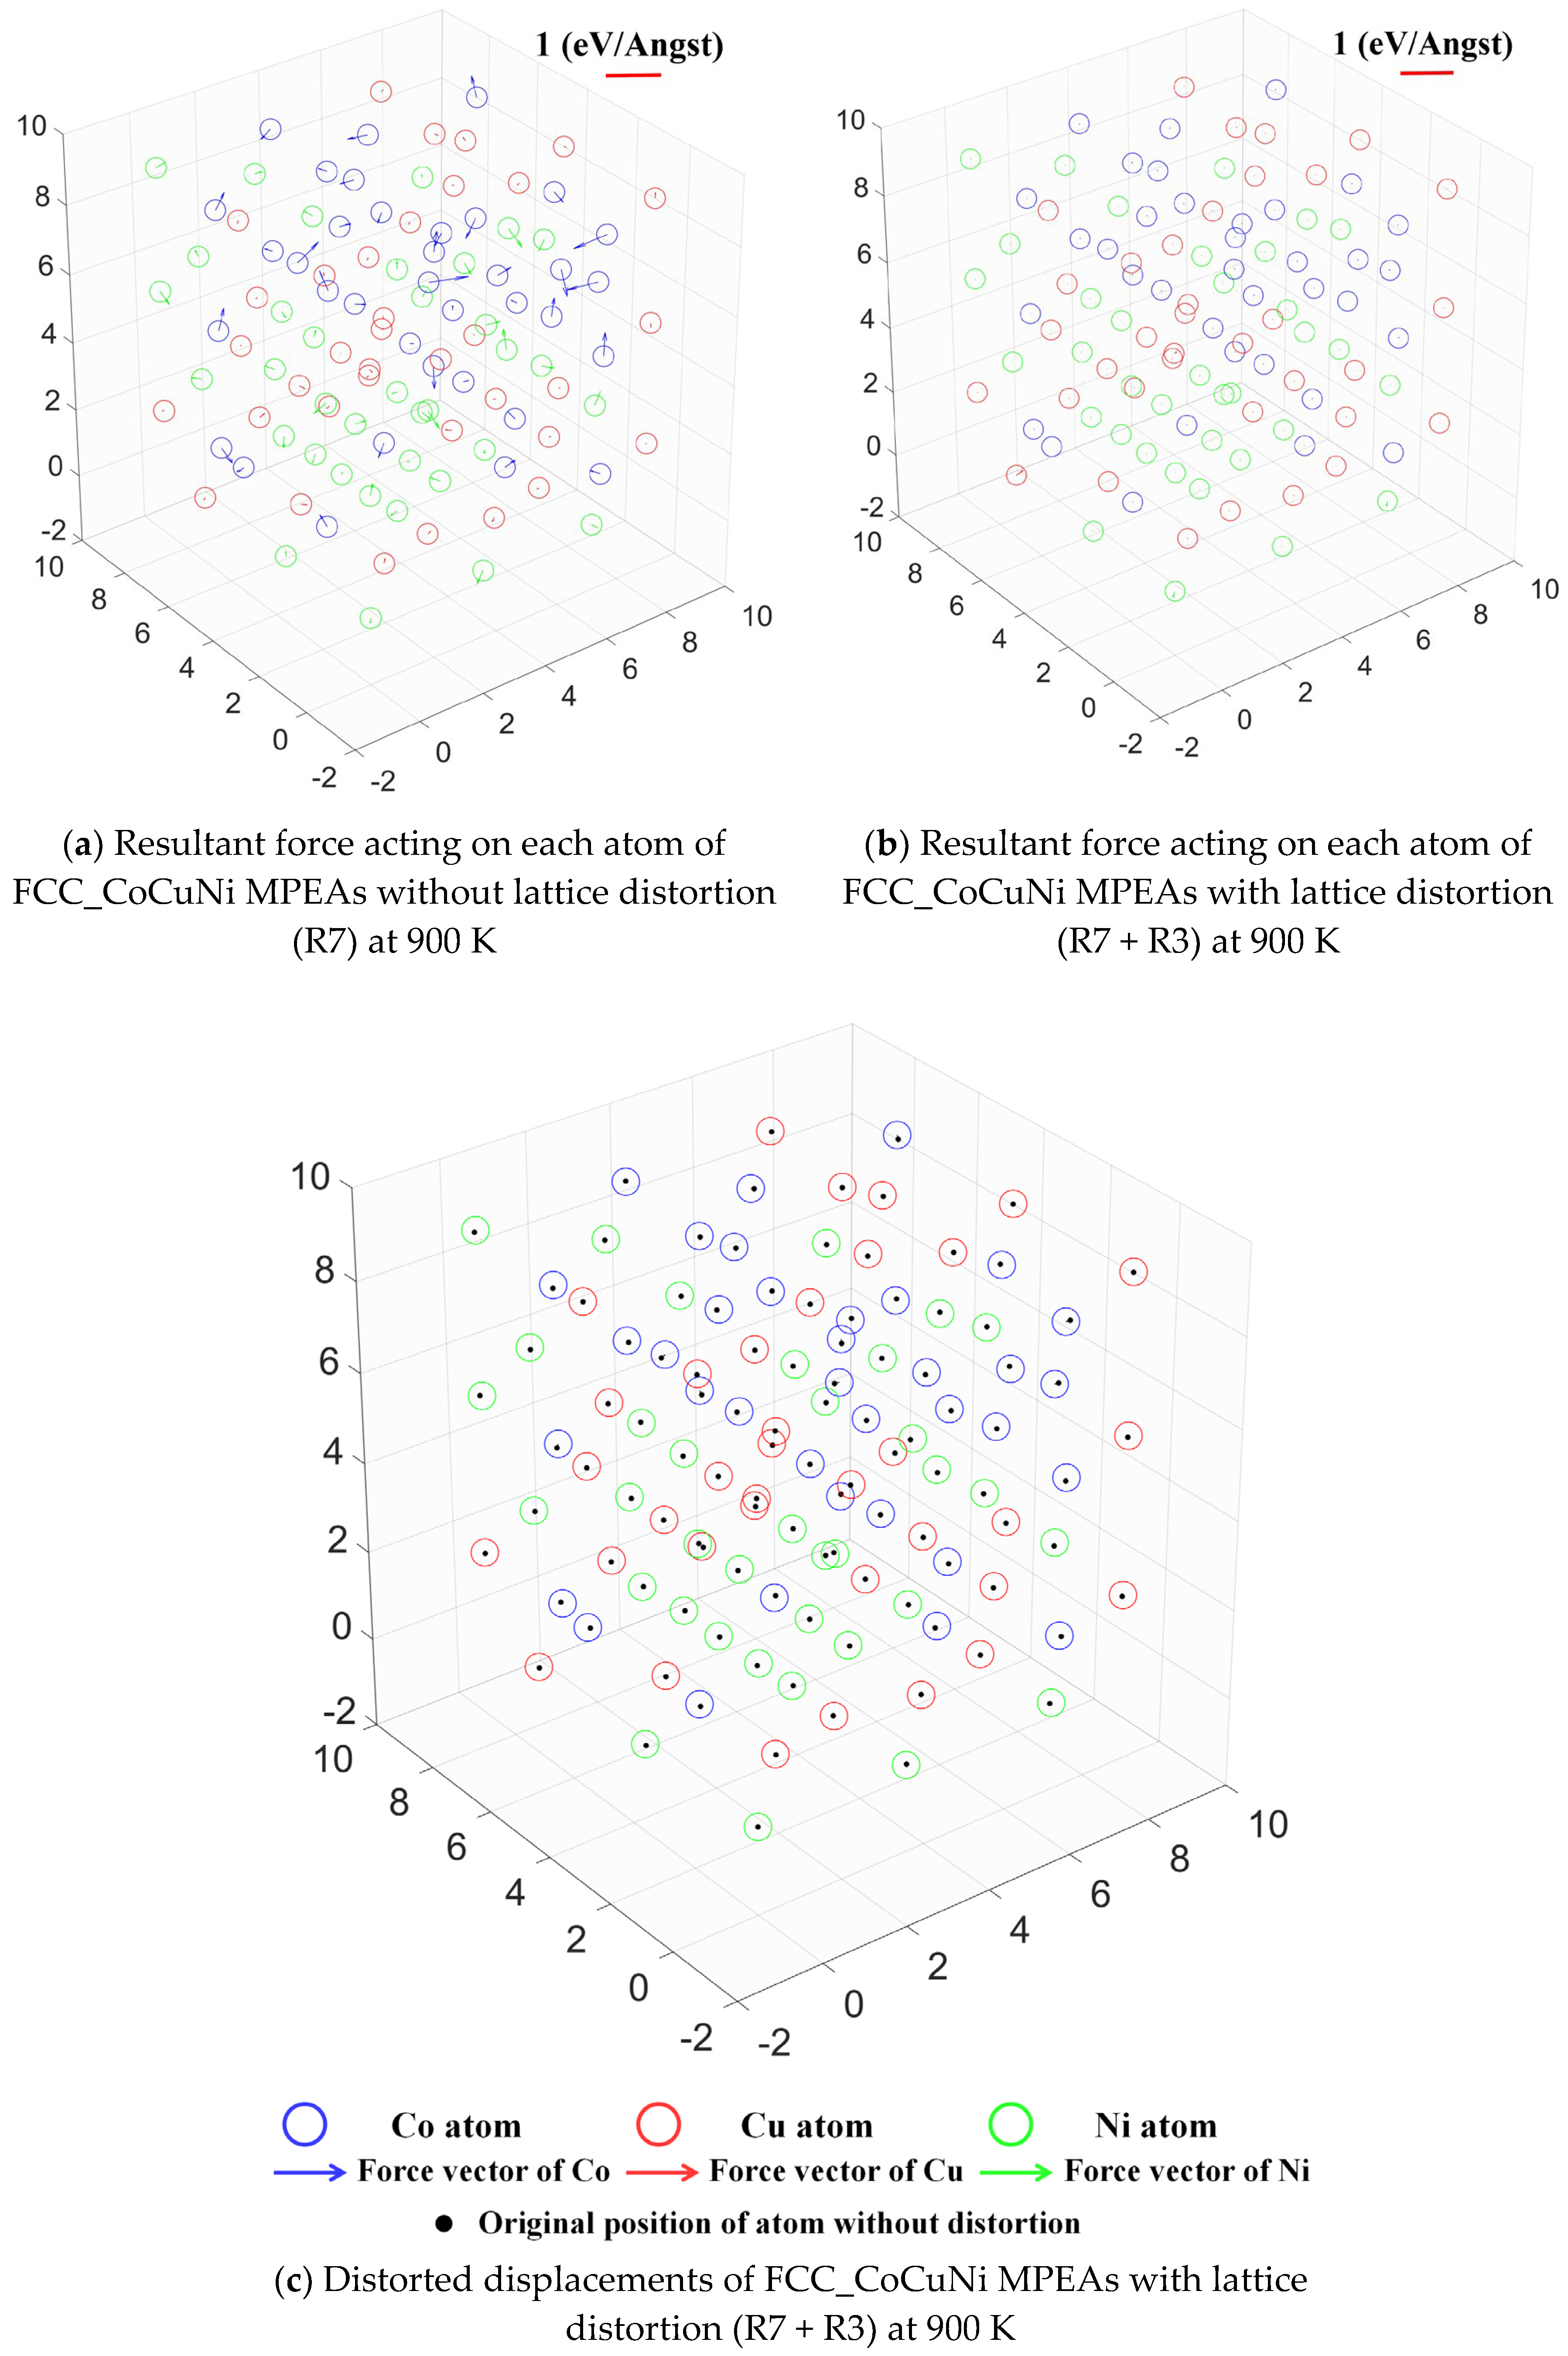
Figure 13.
Distinct stacking sequence models of the representative surface in FCC_CoCuNi MPEAs at 900 K. (a-c) (0 0 -1) bulk structure, Slab-model-1 and 2 ; (d-f) (-1 -1 0) bulk structure, Slab-model-1 and 2; (g-j) (-1 -1 -1) bulk structure, Slab-model-1, 2, and 3.
Figure 13.
Distinct stacking sequence models of the representative surface in FCC_CoCuNi MPEAs at 900 K. (a-c) (0 0 -1) bulk structure, Slab-model-1 and 2 ; (d-f) (-1 -1 0) bulk structure, Slab-model-1 and 2; (g-j) (-1 -1 -1) bulk structure, Slab-model-1, 2, and 3.
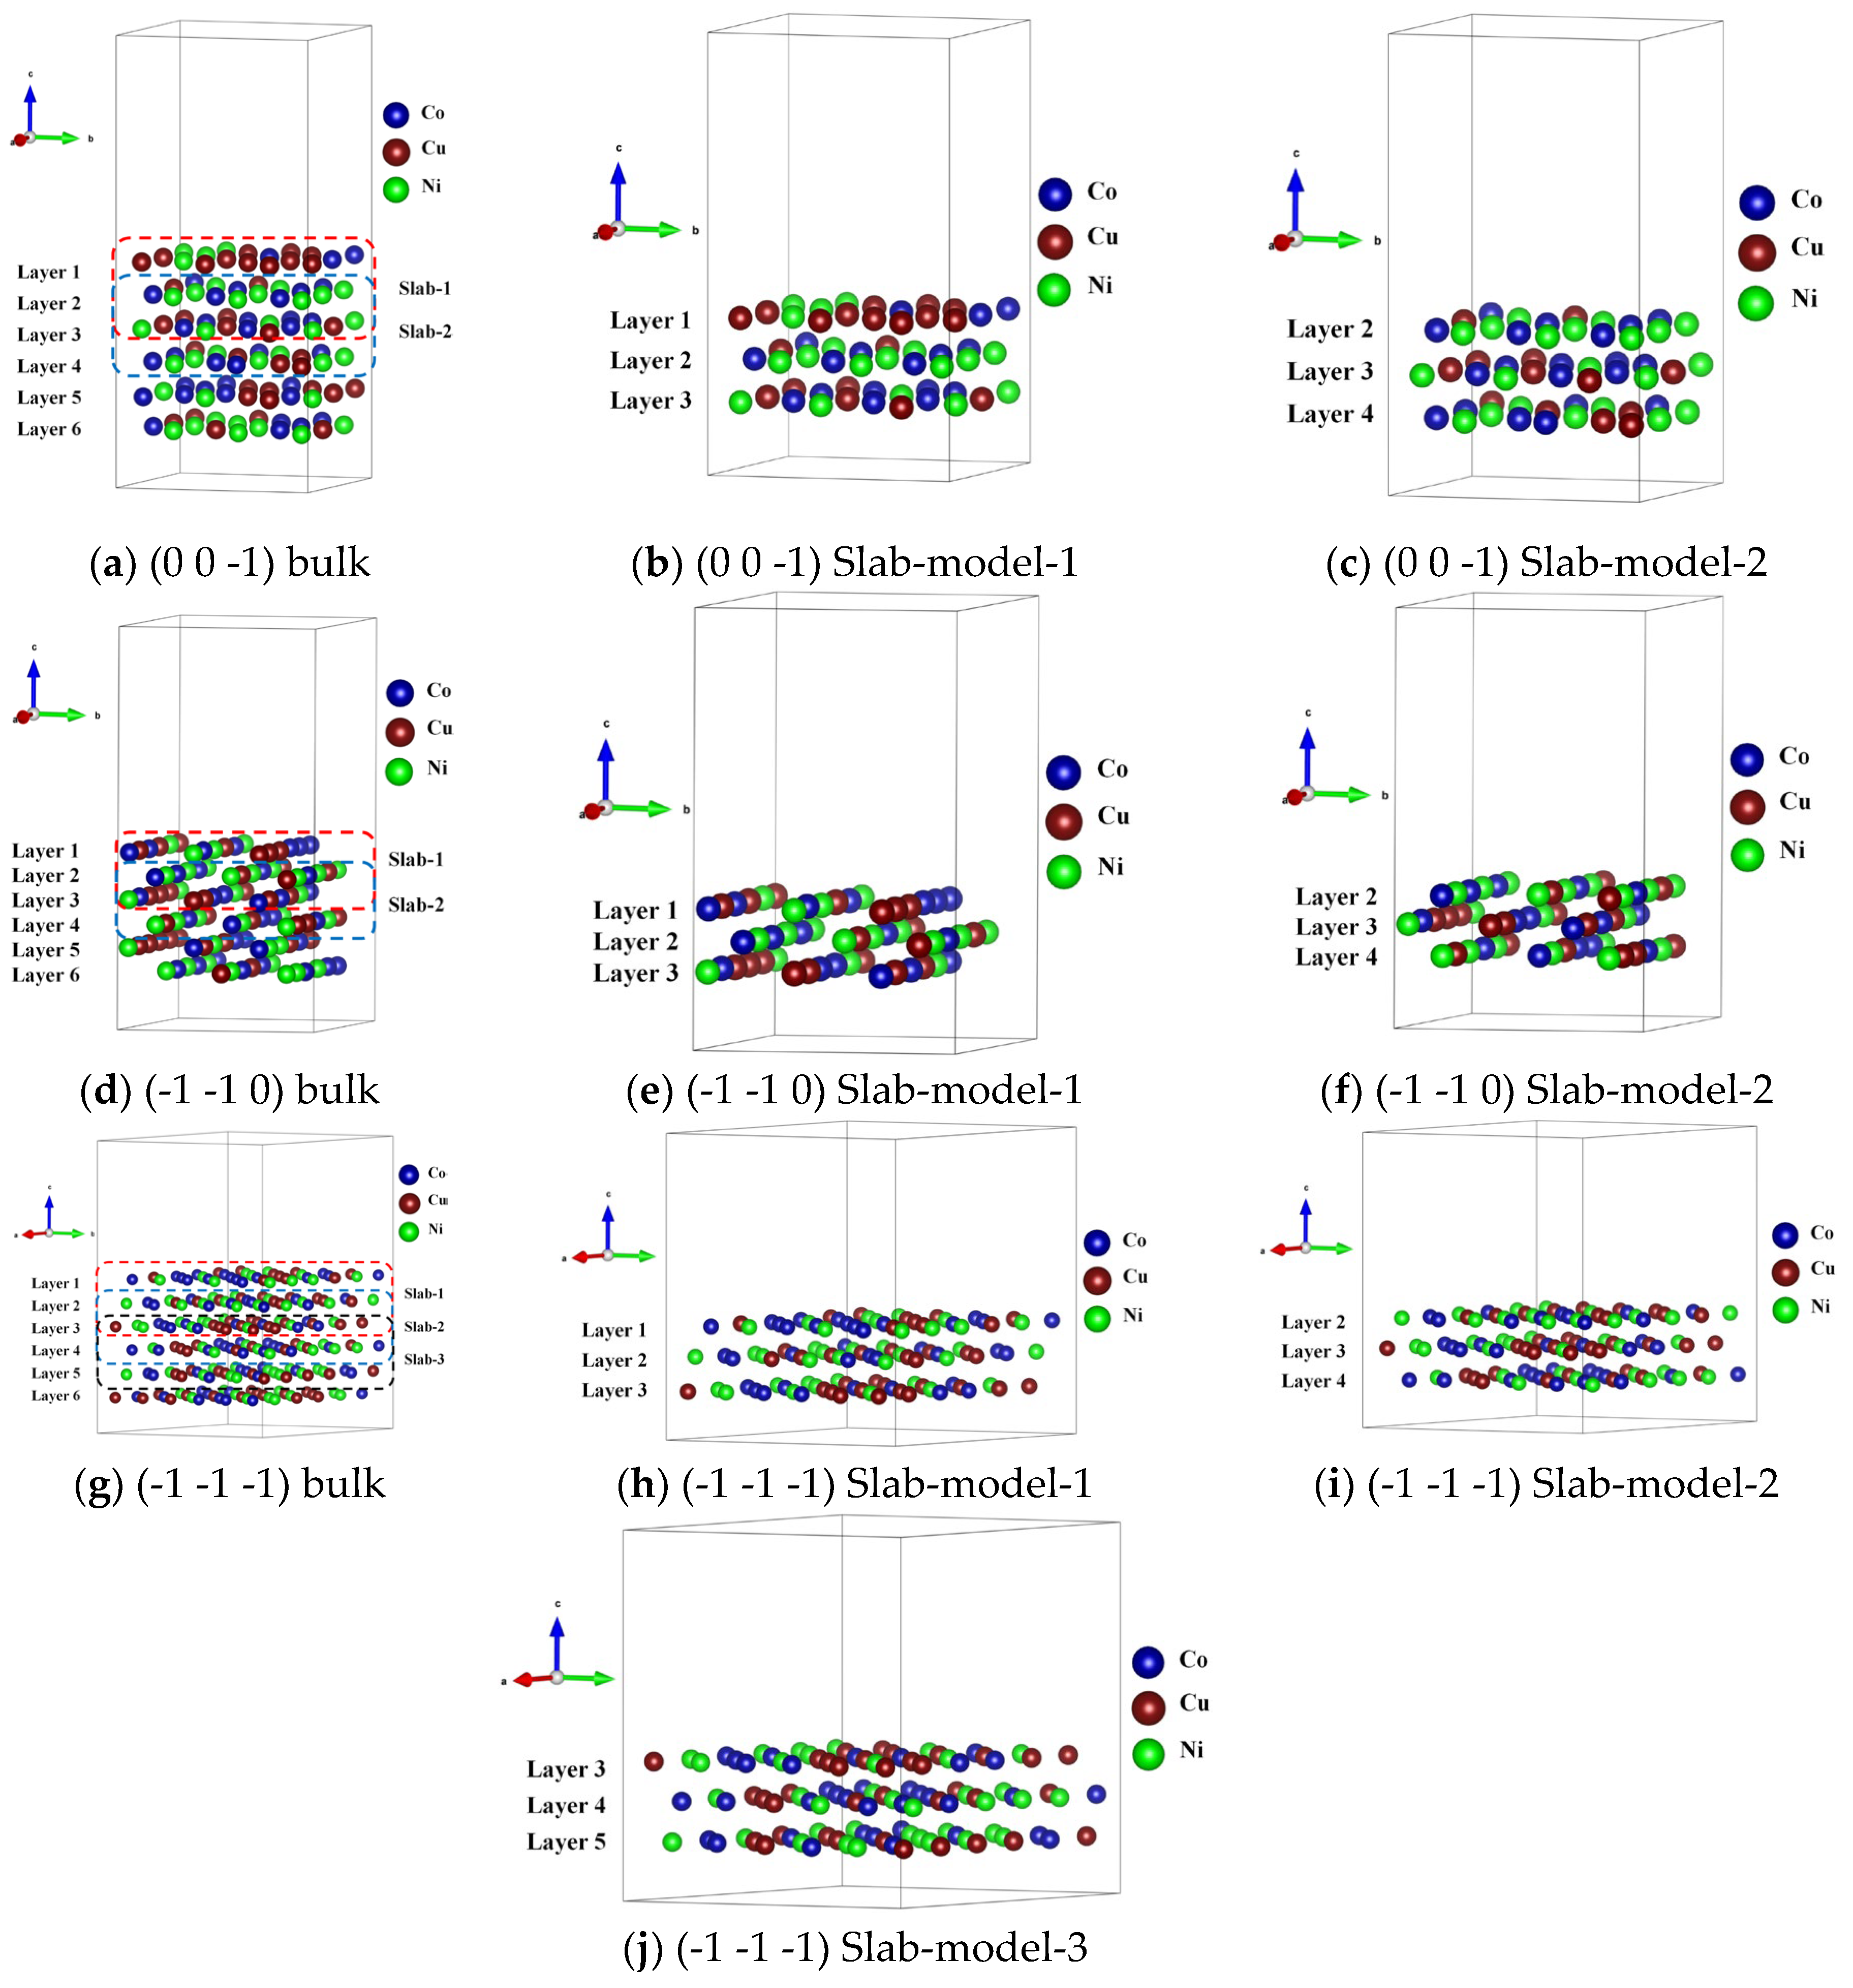

Table 1.
The crystal lattice structure information of the L12_AuCu3 prototype employed in simulating the FCC MPEAs.
Table 1.
The crystal lattice structure information of the L12_AuCu3 prototype employed in simulating the FCC MPEAs.
| Phase | Prototype | Pearson’s Symbol | Strukturbericht Designation | Space Group | Wyckoff positions | ||
| Symbol | Number | Multiplicity | Wyckoff letter | ||||
| FCC | AuCu3 | cP4 | L12 | Pm3m | #221 | 1 | a |
| 3 | c | ||||||
Table 2.
The fundamental information of structures and properties of stable elements reference (SER) at room temperature involved in this study.
Table 2.
The fundamental information of structures and properties of stable elements reference (SER) at room temperature involved in this study.
| Metal | Stable structure | Space No. |
Space Group |
Radius(Å) | χ | Atomic mass |
Outer Ele. |
Melting(K) |
| Co | HCP_A3 | 194 | P63/mmc | 1.25 | 1.88 | 58.93 | 3d74s2 | 1768 |
| Cu | FCC_A1 | 225 | Fm3m | 1.28 | 1.90 | 63.55 | 3d104s1 | 1358 |
| Ni | FCC_A1 | 225 | Fm3m | 1.25 | 1.91 | 58.69 | 3d84s2 | 1726 |
Table 3.
Statistical analysis of 1NN coordination characteristics of different central atoms (M*) coordinated with the same type of atoms included accumulatively in FCC_CoCuNi MPEAs containing 108,000 atoms under different equilibrium heat treatment conditions.
Table 3.
Statistical analysis of 1NN coordination characteristics of different central atoms (M*) coordinated with the same type of atoms included accumulatively in FCC_CoCuNi MPEAs containing 108,000 atoms under different equilibrium heat treatment conditions.
| M*-nM | Cluster group number | |||||||||||
| SOFs structure | Randomly mixing structure | |||||||||||
| 100K | 900K | 1400K | At any temperature | |||||||||
| Case1 | Case2 | Case3 | Case1 | Case2 | Case3 | Case1 | Case2 | Case3 | Case 1 | Case 2 | Case 3 | |
| Co*-10Co | 0 | 0 | 0 | 0 | 0 | 0 | 0 | 0 | 0 | 1 | 1 | 4 |
| Co*-9Co | 0 | 0 | 0 | 2 | 6 | 2 | 6 | 13 | 4 | 18 | 16 | 22 |
| Co*-8Co | 5 | 6 | 5 | 30 | 25 | 21 | 59 | 63 | 47 | 94 | 73 | 84 |
| Co*-7Co | 93 | 80 | 75 | 160 | 148 | 148 | 263 | 274 | 242 | 401 | 358 | 370 |
| Co*-6Co | 461 | 497 | 430 | 667 | 669 | 655 | 917 | 940 | 896 | 1268 | 1197 | 1173 |
| … | - | - | - | - | - | - | - | - | - | - | - | - |
| Cu*-10Cu | 0 | 0 | 0 | 0 | 0 | 0 | 0 | 0 | 0 | 4 | 2 | 1 |
| Cu*-9Cu | 0 | 0 | 0 | 3 | 2 | 3 | 10 | 6 | 5 | 18 | 18 | 11 |
| Cu*-8Cu | 6 | 3 | 5 | 27 | 23 | 20 | 48 | 54 | 52 | 95 | 81 | 66 |
| Cu*-7Cu | 66 | 70 | 61 | 157 | 163 | 140 | 230 | 258 | 235 | 383 | 387 | 346 |
| Cu*-6Cu | 438 | 460 | 411 | 662 | 705 | 657 | 914 | 919 | 902 | 1229 | 1254 | 1176 |
| … | - | - | - | - | - | - | - | - | - | - | - | - |
| Ni*-10Ni | 0 | 0 | 0 | 0 | 0 | 0 | 0 | 0 | 0 | 2 | 2 | 2 |
| Ni*-9Ni | 0 | 0 | 1 | 3 | 4 | 4 | 11 | 9 | 11 | 19 | 15 | 12 |
| Ni*-8Ni | 17 | 13 | 9 | 36 | 36 | 34 | 71 | 58 | 71 | 84 | 90 | 76 |
| Ni*-7Ni | 117 | 124 | 116 | 244 | 233 | 242 | 343 | 362 | 385 | 347 | 367 | 348 |
| Ni*-6Ni | 729 | 684 | 688 | 1070 | 1036 | 1055 | 1327 | 1353 | 1366 | 1186 | 1224 | 1162 |
| … | - | - | - | - | - | - | - | - | - | - | - | - |
Table 4.
The calculated crystal lattice structure data of FCC_CoCuNi MPEAs based on 3×3×3 supercell of L12-AuCu3 prototype.
Table 4.
The calculated crystal lattice structure data of FCC_CoCuNi MPEAs based on 3×3×3 supercell of L12-AuCu3 prototype.
|
Temperature (K) |
Relaxing mode | (Å) | (Å) | (Å) | (°) | (°) | (°) | (Å3) | (eV/atom) |
Magmom (uB) |
| 100 | Only volume relaxing | 10.665 | 10.665 | 10.665 | 90.000 | 90.000 | 90.000 | 1213.115 | -5.396 | 80.132 |
| Full relaxing | 10.676 | 10.682 | 10.677 | 90.005 | 89.991 | 89.999 | 1217.544 | -5.403 | 79.991 | |
| 900 | Only volume relaxing | 10.666 | 10.666 | 10.666 | 90.000 | 90.000 | 90.000 | 1213.240 | -5.387 | 80.347 |
| Full relaxing | 10.672 | 10.688 | 10.677 | 89.960 | 89.941 | 89.979 | 1217.855 | -5.396 | 80.352 | |
| 1400 | Only volume relaxing | 10.662 | 10.662 | 10.662 | 90.000 | 90.000 | 90.000 | 1211.950 | -5.387 | 80.473 |
| Full relaxing | 10.676 | 10.675 | 10.679 | 90.012 | 90.004 | 89.992 | 1217.019 | -5.395 | 80.453 |
Table 5.
The calculated lattice distortion data of FCC_CoCuNi MPEAs based on 3×3×3 supercell of L12-AuCu3 prototype.
Table 5.
The calculated lattice distortion data of FCC_CoCuNi MPEAs based on 3×3×3 supercell of L12-AuCu3 prototype.
|
Temperature (K) |
Average lattice constant (Å) |
(Å) (Volume relaxing) |
(Å) (Full relaxing) |
Absolute lattice distortion per atom (Å) |
Relative lattice distortion per atom (%) |
Distortion energy (eV) |
Unit atomic distortion energy |
| 100 | 3.559 | 2.510 | 2.507 | 0.038 | 1.50% | 0.741 | 0.007 |
| 900 | 3.560 | 2.510 | 2.507 | 0.042 | 1.67% | 0.852 | 0.008 |
| 1400 | 3.559 | 2.510 | 2.507 | 0.040 | 1.58% | 0.889 | 0.008 |
Disclaimer/Publisher’s Note: The statements, opinions and data contained in all publications are solely those of the individual author(s) and contributor(s) and not of MDPI and/or the editor(s). MDPI and/or the editor(s) disclaim responsibility for any injury to people or property resulting from any ideas, methods, instructions or products referred to in the content. |
© 2026 by the authors. Licensee MDPI, Basel, Switzerland. This article is an open access article distributed under the terms and conditions of the Creative Commons Attribution (CC BY) license (http://creativecommons.org/licenses/by/4.0/).
Copyright: This open access article is published under a Creative Commons CC BY 4.0 license, which permit the free download, distribution, and reuse, provided that the author and preprint are cited in any reuse.


