Submitted:
09 February 2026
Posted:
10 February 2026
You are already at the latest version
Abstract
Green-synthesized metal nanoparticles are increasingly investigated for their antioxidative, antimicrobial, and stress-protective properties as eco-friendly and cost-effective alternatives to conventional chemical synthesis. Although agri-food wastes represent biomolecule-rich and sustainable resources, they remain less explored as biological matrices for green metal nanoparticle synthesis compared with plant and microbial extracts. The aim of this study was to optimize the synthesis and evaluate the bioactivity of silver nanoparticles derived from bergamot pomace, a polyphenol-rich agri-food waste. Synthesis parameters, including extract concentration, pH, extract-to-metal ratio, temperature, and reaction time, were optimized, and the nanoparticles were characterized by UV–Vis spectroscopy, dynamic light scattering, zeta potential analysis, and electron microscopy (TEM, STEM). ATR-FTIR and proteomic analyses were employed to investigate the molecular mechanisms involved in nanoparticle reduction, capping, and stabilization. The bergamot pomace-based silver nanoparticles exhibited a surface plasmon resonance peak at 430 nm, spherical morphology, good colloidal stability, and average diameters of 15–20 nm, without irreversible aggregation. A putative synthesis mechanism was proposed, involving Ag⁺ bioreduction mediated by polyphenols, ascorbic acid, and oxidoreductase-associated proteins, followed by stabilization through protein corona formation. Seed nanopriming assays on tomato and lettuce, together with in vitro antimicrobial tests against Pseudomonas syringae pv. tomato and Xanthomonas campestris pv. vesicatoria, demonstrated phytostimulatory and antimicrobial effects at very low nanoparticle concentrations. Overall, this study highlights bergamot pomace as a valuable resource for green silver nanoparticle synthesis supporting its applicability in sustainable agriculture.
Keywords:
green synthesis
; bergamot pomace-based silver nanoparticles
; phyto-stimulation
; antimicrobial effect
1. Introduction
Over the last few years, nanotechnology is gaining attention from the scientific community, especially for the nanoparticles (NPs) production and use. The NPs hold unique properties due to their specific size, shape, composition, larger surface area to volume ratio, and purity of individual components, that revolutionize the use of the materials, resulting in noteworthy improvements in thermal, mechanical, and barrier properties[1]. They find applications in numerous fields such as life sciences, medicine, material sciences, environmental protection and electronics[1]and in agriculture for increasing the crop production (nano-fertilizers), crop protection (nano-pesticides, etc.), plant bio-monitoring (nano-biosensors), and crop improvements (nano-gene-delivery) [2]. Among the NPs, the metal/metalloids nanoparticles (M-NPs) received particular interest as stress protection, antioxidant and antimicrobial agents[3]. However, the conventional methods to their synthesis (chemical and physical) are economically and environmentally unfavorable due to the energy consumption, use and release of toxic chemicals [4]. Alternatively, the green synthesis (GS-M-NPs), by plants, algae, and microorganisms, has been proposed as promising eco-friendly and cheaper approach due to the mild synthesis conditions (room temperature, water as solvent, etc.) and the presence of bioactive molecules which are able to reduce metal and metalloid ions and to stabilize M-NPs with desired shapes and sizes [4,5].
More recently, the agri-food waste as biological matrix for the GS-M-NPs production received more attention for their higher content in biomolecules, giving them added value and providing a “sustainable property” to the green synthesis [6,7,8]. Different waste residues has been utilized for the GS-M-NPs, such as fruit peel (orange and banana) [9,10] and straws of agricultural crops (wheat and corn) [11,12], representing a win-win strategy that combines scientific innovation with environmental protection, according to the principles of green chemistry and sustainable development [13].
Bergamot pomace waste (BP), also named “pastazzo”, is a solid biowaste generated (up to 50-65%) by fruit processing of the bergamot plants (Citrus bergamia Risso & Poiteau, Rutaceae) whose cultivation is mainly located at Reggio Calabria area (Southern Italy). This solid biowaste, consisting of peel, mesocarp, seeds, and juice, is a rich source of bioactive compounds including polyphenols (mainly flavonoids), phenols, ascorbic acid, terpenes, organic acids, pectins, carotenoids, proteins [14,15] suggesting its use as bioreducing and stabilizing agents in the green synthesis of the silver nanoparticles. Recently, peel extract of citrus plants [16,17,18,19,20,21,22,23], seeds [24], fruit juice [25,26], and leaves [27,28] were used for GS-M-NPs. To date, the use of bergamot plants and pomace waste for the phytosynthesis of M-NPs has not been investigated yet.
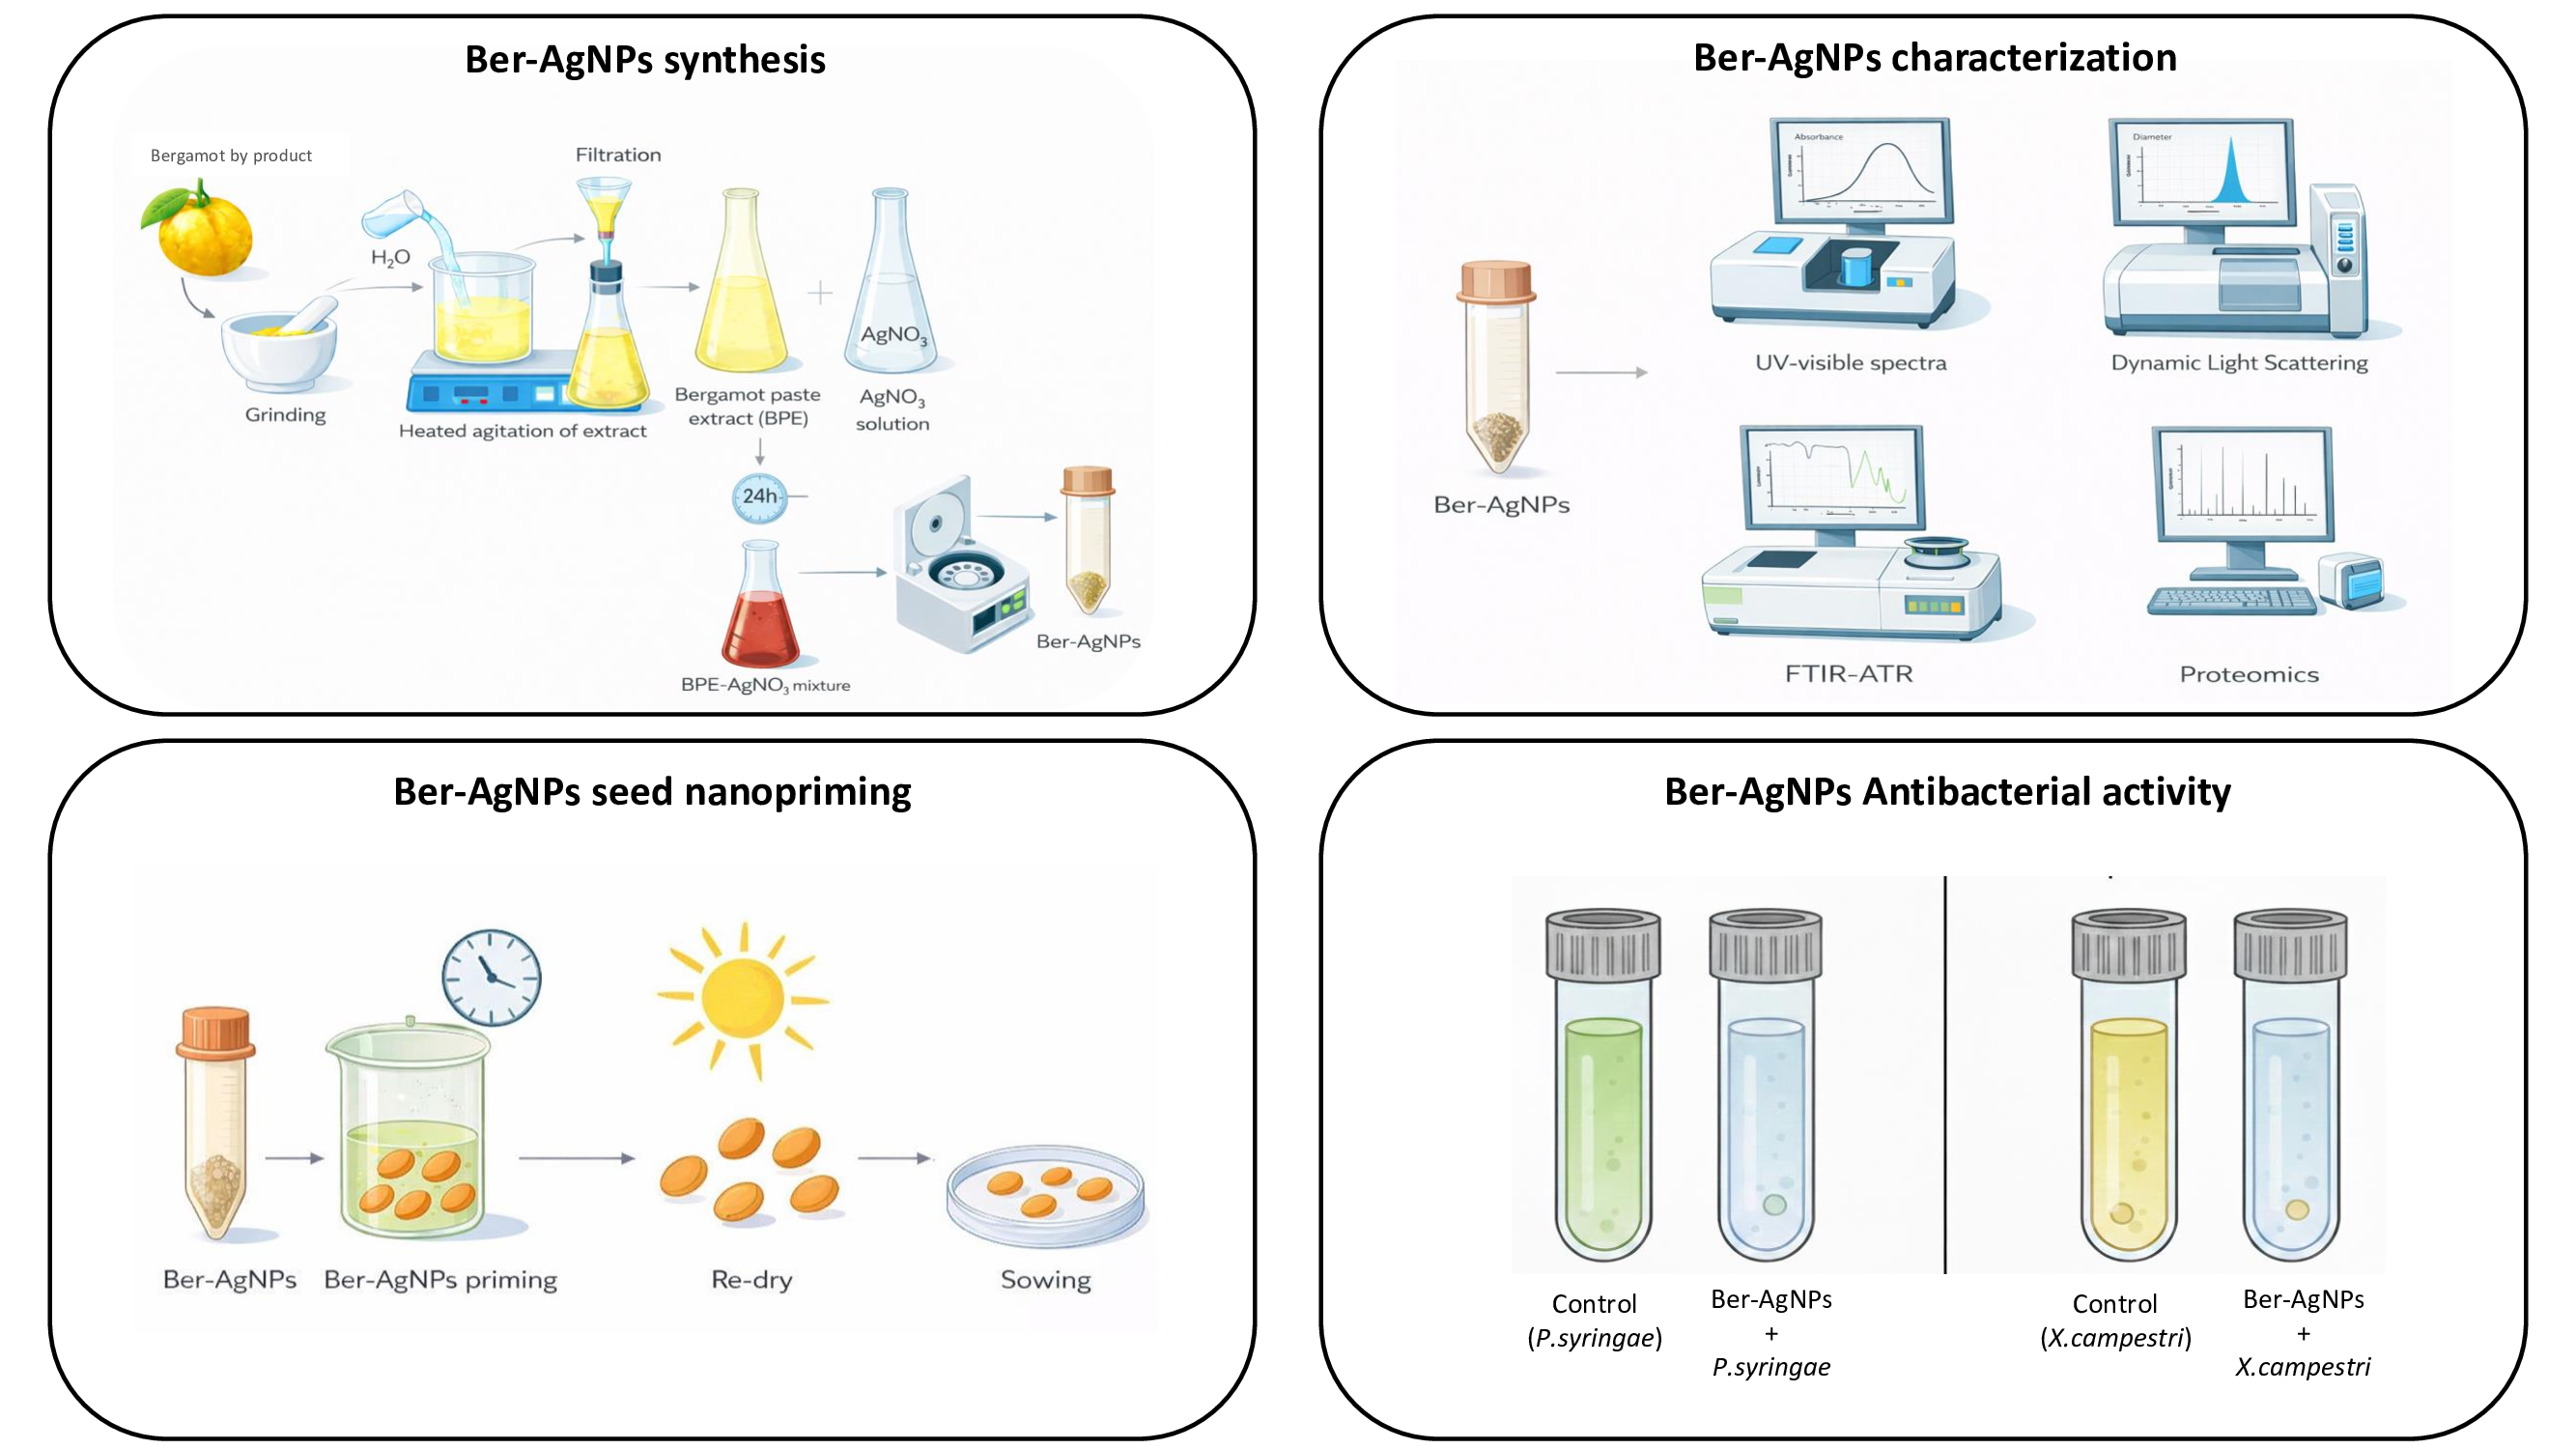
In the present study, the green synthesis of the bergamot pomace-based silver nanoparticles (Ber-AgNPs) were carried out by an optimization of the process conditions (e.g., extract concentration, reaction time, pH, temperature) and the Ber-AgNPs have been evaluated by physical-chemical characterization. In particular, the optimization process is more critical in green synthesis than in chemical or physical methods for the complexity and variability of biological systems and limited control over reaction parameters [29].
Among the agriculture application, the “seed nanopriming” by GS-M-NPs is an innovative and emerging method in plant nanobiotechnology to improve stress mitigation and crop production [2,30,31]. Since the complex interaction between NPs and diverse plant species, a successful seed nanopriming requires careful standardization and optimization such as NPs concentration, dosage, timing and duration of nanopriming, to avoid unintended outcomes [32]. Here, the optimization method of the seed nanopriming in two crop model, tomato and lettuce, using Ber-AgNPs have been carried out. Furthermore, the antimicrobial activity of the Ber-AgNPs have been assessed on two bacterial models, Pseudomonas syringae pv. tomato and Xanthomonas campestirs, to evaluate its crop protection ability.
2. Results and Discussion
2.1. Optimization of Reaction Conditions
2.1.1. Effect of Bergamot Pomace Extract (BPE) Concentration
The silver nanoparticles (AgNPs) formation was initially revealed by a visible colour change in both the BPE–silver nitrate (AgNO₃) mixtures, which shifted from coloureless in BPE 0.1% (BPE0.1) and pale yellow in BPE 1% (BPE1) at the beginning of the reaction (t0) to brownish-orange and black (t24) in BPE0.1 and BPE1, respectively (Figure S1). Their production was confirmed by UV–Vis spectra, which showed a surface plasmon resonance (SPR) band in the 400–450 nm range in both BPE concentrations. In particular, the BPE0.1 and BPE1 produced SPR peaks at 409 nm and 406 nm with an absorbance of 0.16 and 0.80, respectively (Figure S2). Further, the BPE1 pointed out a broader peak than BPE0.1 (Figure S2) and, according to Ntolia et al. [33], this could suggest a larger size and greater degree aggregation of AgNPs. Dynamic light scattering (DLS) measurements revealed a mean hydrodynamic size of 89.44 nm, a polydispersity index (PdI) of 0.187, and Z-potential value of -29.7 mV in the BPE0.1 nanoparticles (Table 1). By contrast, the BPE1 produced larger nanoparticles with a mean size of 91.06 nm, but with slightly higher polydispersity (0.296) and a lower colloidal stability indicated by Z-potential value (-22.3 mV) (Table 1) according to the UV–Vis spectra results (Figure S2). Hence, the BPE, at lower concentration (BPE0.1), was preferred for the biosynthetic process of the Ber-AgNPs respect the higher one (BPE1).
2.1.2. Effect of pH
According to Enayati Ahangar [34] the pH of the reaction mixture significantly influenced both the colour development of the BPE–AgNO₃ mixture. At pH4, the mixture remained colourless while at 7, 8.5 and 9, an evident colour change of the reaction mixture was observed (Figure S1). These results were confirmed by the spectroscopic analysis where the most intense absorbance peak and a SPR positioned at 409 nm were detected at pH 9 (Figure S2). By contrast, a lower absorbance and a red-shifted SPR (418 nm) were revealed at pH 7 and 8.5 (Figure S2). The DLS analysis showed similar results at different pHs except for the higher dimension at pH 7 (115.8 nm) and the better colloidal stability at pH 8.5 (-41.4 mV for Z-potential) (Table 2). Overall, pH 8.5, for lower diameter and higher colloidal stability, was preferred to pH7 and pH9.
2.1.3. Effect of extract-to-metal ratio
Both the 2:1 and the 1:1 BPE:metal ratio (v:v) induced a visible colour change in the reaction mixture, shifting from colourless (t0) to dark brown and brownish-orange, respectively, at t24 h (Figure S1), revealing a SPR peak at 411 nm (UV–Vis spectra), with higher absorbance intensity in the 2:1 ratio (Figure S2). Although, nanoparticles obtained with both BPE:metal ratio showed similar hydrodynamic size (86.35 and 8.44 nm, respectively) and Z-potential value (-30.9 and -29.7, respectively), the DLS analysis highlighted a lower PdI value in 1:1 ratio (0.187) compared to 2:1 ratio (0.238) (Table 3), indicating a better size uniformity as also reported for chitosan nanoparticles [35], and suggesting this ratio as the best performing for the biosynthetic process of the Ber-AgNPs.
2.1.4. Effect of Incubation Time
The BPE–AgNO₃ mixtures rapidly shifted from colourless (t0) to pale yellow (t1) and orange (t3 and t24) (Figure S1), and this result was confirmed by the SPR band development at 409 nm, which appeared already at t1, reaching the maximum absorbance at t24 (Figure S2). The DLS analysis showed no sharply variation for Z-potential and hydrodynamic size of the nanoparticles, at different incubation times, except for lower PdI at t24 (Table 4). Overall, considering the PdI value and higher UV-vis spectra absorbance at t24, the longer incubation time for the biosynthetic process of the Ber-AgNPs was preferred.
2.1.5. Effect of Incubation Temperature
Regardless the temperature, the Ber-AgNPs were formed as demonstrated by the colour change mixtures that shifted from colourless (t0) to brown-reddish at 15°C (T15) and orange-brown at both 20°C (T20) e 25°C (T25) after 24h (Figure S1). The DLS analysis showed a temperature-dependent increase in hydrodynamic diameter, with average sizes of 30.56 nm, 41 nm, and 50 nm at T15, T20, and T25, respectively (Table 5). However, the PdI values were relatively higher at T15 (0.518) and T20 (0.507), decreasing at T25, indicating an improvement of the Ber-AgNPs homogeneity (Table 5). Similar results were observed in the UV–Vis spectra showing a SPR peak at 408 nm with a higher absorbance value (1.8) at T25 (Figure S2). Further, the Z-potential values ranged from –22.8 mV at 15 °C to –32.6 mV at 20 °C and –30.4 mV at 25 °C, reflecting good colloidal stability under all temperatures (Table 5). These results suggested 25°C as the optimal incubation temperature.
2.2 Physical-Chemical Characterization
To confirm the optimized reaction parameters (0.1% of the BPE extract, pH 8.5 of the mixture, 1:1 ratio of BPE:AgNO3 concentration, 25°C of the incubation temperature, 24 h of incubation time) identified for the Ber-AgNPs production further analysis were conducted. After 24 h, the BPE-AgNO3 mixture changed the colour from colourless to orange, the UV–Vis spectral profiles pointed out a peak at 422 nm and absorbance of 1.29 (Figure 1), the DLS analysis indicated the presence of the Ber-AgNPs with 74.9 nm of diameter, low polydispersity (0.248) and stable negative Z-potential values (-32.74 mV) (Table 6). These results were in accordance to the AgNPs obtained by orange peel [17,20], Citrus limon [16,19], Citrus reticulata [18], Citrus clementina peel [36], and Citrus paradisi leaves [28].
By transmission (TEM) and scanning transmission (STEM) electron microscopy analysis, the size, morphology and structure of the Ber-AgNPs were deeply investigated. The TEM micrograph pointed out the spherical shape and the nano-sized dimension of the Ber-AgNPs ranging from 15-20 nm of diameter (Figure 2a). Instead, the STEM micrograph clearly revealed the absence of the irreversible Ber-AgNP’s aggregation demonstrating their good stability (Figure 2b).
To analyze the organic molecules from the BPE that reduce, cap, and stabilize the AgNPs, the Fourier Transform Infrared-Attenuated Total Reflectance (FTIR-ATR) was conducted. The BPE FTIR-ATR spectrum displayed: 1) the characteristic vibrational bands of polyphenol-rich plant material, where a broad band centred around 3200–3600 cm–1, attributed to O–H stretching of phenolic and carboxylic hydroxyl groups (often hydrogen-bonded in plant matrices)[37,38]; 2) an aliphatic C–H stretching as weaker bands near 2920–2850 cm–1[37,38]; 3) a strong band in the 1700–1600 cm–1 region, corresponding to C=O stretching of conjugated carbonyls (e.g. flavonoid ketones, esters or carboxylic acids) and C=C aromatic ring vibrations [37,39]; 4) an additional features between 1600–1500 cm–1 from aromatic C=C and N–O (nitroaromatic) stretches [40] and finally, 5) prominent peaks at ~1300–1000 cm– 1, in the fingerprint region, due to C–O stretches of phenolic, alcoholic or ether groups, and C–N vibrations (Figure 3) [37,40]. Nikam et al. [38] reported O–H bending and C–O bands in Baliospermum extract around 1367–1319 cm–1 and 1247–1093 cm–1, while Rautela et al. [39] assigned two bands at 1745 and 1643 cm–1 in their teak seed extract to C=O (ester/acid) and N–C=O (amide) groups. Thus, the BPE spectrum was dominated by polyphenolic O–H, aromatic C=C/C=O and C–O vibrational modes, consistent with its high flavonoid content (Figure 3).
Upon formation of Ber-AgNPs, several of the above bands shifted and changed intensity, indicating the organic moieties interaction with the inorganic Ag0 core. Notably, the broad O–H stretching band typically became slightly sharper and moved to higher wavenumber (for example, a shift from ≈3350 to ≈3400 cm–1) (Figure 4), reflecting partial involvement of phenolic hydroxyls in silver reduction and hydrogen-bonding to the nanoparticle surface [38,39]. Similarly, the strong carbonyl-related band around 1700–1650 cm–1 usually shifted downward (red-shifts by ~10–20 cm–1) upon nanoparticle formation (Figure 4). In our spectra, this band moved from ~1700 cm–1 in the extract (Figure 3) to ~1680 cm–1 in the Ber-AgNPs (Figure 4), consistent with coordination of carbonyl oxygen to Ag+ and partial electron density withdrawal upon reduction [39,40]. Rautela et al. [39] observed analogous shifts in their green synthesis: bands at 1745 and 1643 cm–1 in the seed extract were altered in the AgNP spectrum, confirming carboxyl and amide involvement. Other vibrational bands also exhibited some modifications. For instance, extract peaks at ~1250 and 1080 cm–1 might shift or decreased (Figure 4) as phenolic C–O groups donate electrons to reduce Ag+. In Malik et al. [41], the 1253 cm–1 and 1083 cm–1 peaks of Cynara extract appeared at 1261 and 1080 cm–1 in the AgNPs. Aliphatic C–H bands near 2920 and 2850 cm–1 also typically persisted but might weaken slightly if some alkyl groups were oxidized or involved in capping. New weak absorptions could appear below 600 cm–1 in the AgNPs spectrum, often attributed to Ag–O or Ag–N stretching modes of surface complexes [41]. Indeed, Malik et al. [41] reported a distinct band at 530 cm–1 in their AgNPs spectrum, which they ascribed to the Ag+→Ag0 reduction (Ag–O vibrations). Although low in intensity, such bands supported the metal–ligand bonds formation (Figure 4). Table 7 shows the comparative peaks between native BPE and Ber-AgNPs.
The observed spectral shifts implied specific interactions between the BPE biomolecules and AgNPs. The red-shift of the C=O stretching band suggested the carbonyl oxygens (from flavonoid ketones or carboxylates) coordination to Ag+, withdrawing electron density and lengthening the C=O bond. This coordination was a common capping mechanism in green syntheses [39,40]. Likewise, the narrowing and shift of the O–H band indicated that some phenolic OH groups were partially deprotonated or formed hydrogen bonds to the Ag surface during reduction [38]. In essence, polyphenols (e.g. naringin, neohesperidin present in bergamot pomace), acting as both reductants and ligands, reduced Ag+ to Ag0 and then adsorbed via their oxygen (and possibly nitrogen) functionalities, stabilizing the nascent nanoparticles. The amine and amide bands (if present) also shifted, evidencing proteinaceous or alkaloid components binding the metal [39]. The net effect was an organic corona on the AgNPs comprising oxidized polyphenol residues and other phytochemicals, which conferred colloidal stability. Overall, the FTIR behaviour described for the Ber-AgNPs closely matched the results obtained from different Citrus biomass [17,20,28]: where the phenolic O–H and carbonyl groups acted as the principal reducing and capping moieties, and the observed spectral shifts confirmed the nanoparticle formation and stabilization by phytochemicals. These matching results reinforced that BPE was an efficient dual reducing–stabilizing agent in green AgNPs synthesis.
2.3. Proteomic Analysis
Although secondary metabolites are generally considered the main drivers of both reduction and capping mechanisms of metal nanoparticles phytosynthesis, proteins and enzymes may also play a supportive role to the primary reaction mechanism [42]. Further, the intense FTIR signals in the Amide I band (1600–1700 cm⁻¹) (Figure 3), mainly caused by the C=O stretching vibration of the peptide bond, suggested the presence of putative BPE proteins involved in the reduction/capping mechanisms. These observations prompted us to carry out a proteomic analysis in order to verify their contribution to the Ber-AgNPs phytosynthesis process. In particular, a combined data dependent (DDA) and independent (DIA) acquisition strategy was applied for protein amount estimation and proteome profiling, respectively. Based on DDA analysis, the total protein amount associated with Ber-AgNPs was estimated at approximately 3µg in 4.8 mg, while the DIA analysis enabled the identification of a total of 1,111 proteins (Table S2). Among these, 281 proteins were identified with at least two unique peptides and considered greater confidence identification (Table S3). Of this subset, 219 proteins were assigned to Citrus species, while 62 corresponded to human proteins (Table S4). Functional annotation using ARGOT2.5 enabled the assignment of Gene Ontology (GO) terms to proteins associated with Ber-AgNPs. Particular attention was given to oxidoreductive activity, since it represented a plausible core involved in the reduction of Ag⁺ and subsequent stabilization of the nanoparticle through the protein shell formation [43,44]. Among the annotated proteins, a subset with high predictive confidence (ARGOT_PPV (Positive Predictive Value) ≥ 0.70; ARGOT_score ≥ 7) was selected, for reliable functional interpretation (Figure 5, Table S5).
The identified proteins were mainly distributed within the Molecular Function (MF) domain and predominantly represented by NAD(P)H-dependent enzymes, peroxidases, and intracellular oxidoreductases—chemical species, highlighting redox metabolism as a central biochemical feature of the Ber-AgNPs-associated proteome. In particular, the aldose-6-phosphate reductase (NADPH) activity (GO:0042542; BP; A0A067DTF7), involved in carbon-skeleton reduction, showed the highest functional confidence (ARGOT_PPV 0.871; score 18.6). Its strong NADPH requirement and high reducing capacity make it an excellent candidate for participating in Ag⁺ reduction, supporting a NADPH-driven electron transfer mechanism during the silver nucleation, as reports by Hietzschold et al. [45]. Also the Enoyl-[ACP] reductase (NADH) (GO:0004318; A0A067ERC6; PPV 0.803; score 11.80), a classical enzyme of fatty acid biosynthesis, exhibits high reducing ability and uses NADH, making it a potential contributor to direct Ag⁺ reduction. The presence of ferredoxin–NADP⁺ reductase (GO:0004324; A0A067FV31; PPV 0.706; score 7.63), a highly efficient electron-transfer enzyme typical of photosynthetic systems, suggests a possible direct contribution of electrons from NADPH to silver ions, through a mechanism analogous to well-known biological metal-reduction processes [46]. The Allene-oxide cyclase activity (GO:0046423; A0A067CZV7; PPV 0.858; score 16.21; Quantity 51,781), a component of the oxylipin pathway involved in oxidative stress responses, may contribute to silver nucleation by modulating the local redox environment. Further, the Acyl-CoA oxidase (GO:0003997; A0A067F1V3; PPV 0.827; score 12.93), an oxidative enzyme involved in lipid metabolism, represents a physiological source of H₂O₂, potentially contributing to redox conditions that favor silver ion reduction, as reported by Černý et al. (2018) [47]. Two proteins (e.g. disulfide isomerase and thioredoxin-like proteins) annotated as intramolecular oxidoreductases transposing S–S bonds (GO:0016864; A0A067GYQ8, PPV 0.810 and score 12.13), were involved in the remodeling of disulfide bonds, being characterized by Cys–X–X–Cys motifs, surface thiols or disulfides, flexible domains that bind metal surfaces. Although not directly involved in nanoparticles formation but in their applications [48], they may plausibly contribute to nanoparticles capping through interactions with silver surfaces by the breaking of S-S bonds (reduction to sulfhydryl groups, -SH) or the formation of S-Ag bonds. The thioredoxin peroxidase/peroxiredoxin (GO:0008379; A0AAP0LQT3; PPV 0.778; score 10.61), a key component of the antioxidant network, enables to transfer the reducing equivalents through reactive cysteine residues and potentially supporting both Ag⁺ interaction and early stabilization of metallic nuclei. A complementary role is played by L-ascorbate peroxidase (GO:0016688; A0A067GLJ3; PPV 0.766; score 10.08), a crucial enzyme for peroxide detoxification in plants, able to modulate local reactive oxygen species (ROS) levels and create a microenvironment favorable to Ag⁺ reduction. Proteins associated with the superoxide metabolic process (GO:0006801; A0A067FC44; PPV 0.755; score 9.64) and hydrogen peroxide catabolic process (GO:0042744; A0A067FC15; PPV 0.755; score 9.62) also contribute to maintain a low oxidative potential, reducing the superoxide radicals and removing the excess H₂O₂, respectively, contributing to stabilize Ag⁰ nuclei and supporting controlled nanocrystal growth. Finally, the lactoperoxidase (GO:0140825; A0A067FBN7; PPV 0.755; score 9.60), due to its high peroxidative activity, can directly interact with metal ions, contributing to the electron-donating processes required for silver nucleation. Additionally, an oxidoreductase acting on single donors (GO:0016702; A0AAP0MUY4; PPV 0.748; score 9.30), typically involved in monooxygenase reactions and complex redox balances, may possess a putative role during the early steps of Ag⁺ reduction.
2.4. Putative Mechanism of Ber-AgNPs Synthesis
Based on the FTIR and UV-Vis characterization (mainly data) and proteomic results and taking in account the green silver nanoparticles phytosynthesis from citrus biomass [19,20,49,50], the Ber-AgNPs synthesis could occur through a three-step mechanism involving (i) bioreduction of Ag⁺ ions via chelation, (ii) nucleation and growth of Ag⁰ nuclei, and (iii) capping and stabilization by phytochemicals and proteinaceous macromolecules included in the BPE. Concerning the first step, Trouillas et al. [51] and Bose and Chatterjee [52] demonstrated that Ag+ reduction was mediated by the carbonyl and hydroxyl groups of flavonoids, via chelation at the catechol moiety, which promoted the necessary electron transfer. Here, the silver ions chelation probably occurred by the functional phytocompounds, particularly flavonoids (such as neohesperidin and naringin), pectins, and phenolic acids included in the BPE. In particular, the electrostatic attraction between the positively charged silver ions and the nucleophilic groups (hydroxyl and carboxyl groups and oxygen of carbonylic group visible in FTIR spectra, (Figure 4) could facilitate the Ag+ chelation, forming an intermediate metal-organic complex. Similar hypothesis has been proposed by Mohamed and Elshahawy [49] for the AgNPs formation by orange peel extract. Further, the FTIR spectrum revealed a marked shift in the broad O–H stretching band (~3250 cm⁻¹), indicative of phenolic hydroxyl groups oxidation into quinonoid structures, coupled to the reduction of Ag⁺ to Ag⁰, as reported by the following redox process:
In particular, the bioreduction proceeds through two parallel pathways, i.e. the phytochemical and enzymatic reduction. The phytochemical pathway could be primarily driven by the antioxidant activity of polyphenols and ascorbic acid included in the BPE. As suggested by several authors, the hydroxyl groups on the flavonoid rings underwent the oxidation process (often via keto-enol tautomerism), releasing electrons able to reduce the Ag⁺ ions [53,54]. On the other hand, the enzymatic pathway, although lesser important than phytochemical one, could facilitate electron transfer reactions lowering the activation energy required for nucleation phase, where Ag⁺ ions aggregated to form small clusters. In this respect, the proteomic analysis confirmed the presence of oxidoreductases associated with the nanoparticles, such as acyl-CoA oxidase, thioredoxin peroxidase/peroxiredoxin, enoyl-[ACP] reductase (NADH), ferredoxin–NADP⁺ reductase, and aldose-6-phosphate reductase (NADPH) (Table S5 and Figure 5). The color change of the solution to dark brown (Figure S1) and the appearance of the SPR peak at ~423 nm in the UV-Vis spectrum (Figure 1) confirmed the AgNPs formation. The position and sharpening of this peak over time were consistent with isotropic growth and uniform particle distribution. This stage was governed by the local concentration of Ag⁺, reducing agents, and the steric or electrostatic influence of bio-macromolecules. The third step involved the stabilization and capping of the Ag⁺ nuclei via protein corona formation. The FTIR data showed distinct alterations in the amide I (~1650 cm⁻¹) and amide II (~1540 cm⁻¹) regions, suggesting that proteins in the BPE, including glycine-rich domains, disulfide bridges, and aromatic residues such as tyrosine, adsorbed onto the nanoparticle surface. To prevent the Ag⁺ clusters from aggregating into large, unstable bulk metal, the larger biomolecules in the BPE (large flavonoid, pectins and mainly proteins) could act as capping agents by a steric and electrostatic stabilization. Probably, proteins such as oxidoreductases transposing S–S bonds and other stress-related proteins could physically bind to the nanoparticle surface, forming a biological "cap" or protein corona to the Ber-AgNPs surface (Table S5 and Figure 5) creating a steric barrier. This protein corona, combined with the electrostatic repulsion provided by the pectin and amino acid residues, conferred the high stability (-32.74 mV Z-potential) observed in the Ber-AgNPs, ensuring their dispersion in solution for extended periods. Proteins, peptides and carbonyl groups of amino acid had a strong affinity to bind with metallic Ag0 to form a coating layer around the AgNP, conferring a colloidal stabilization in solution [55]. Furthermore, proteins associated with superoxide metabolic processes and hydrogen peroxide catabolism (e.g., peroxidases) and allene-oxide cyclase (Table S5 and Figure 5) actively scavenged excess ROS generated during the reaction maintaining a "low oxidative potential," which prevented the uncontrolled aggregation of Ber-AgNPs.
Taken together, the data suggested two different role in Ber-AgNPs formation: both small molecules (polyphenols) and proteins act synergistically driving a nucleation process via redox chemistry, while proteins mediate post-synthetic stabilization through surface adsorption and steric hindrance. This dual-mode mechanism is a hallmark of efficient green nanosynthesis and aligns with models previously described for other plant-based AgNPs. Figure 6 shows a schematic representation of the proposed biosynthetic mechanism of Ber-AgNPs mediated by phytochemicals and proteins from BPE.
2.5. Seed Nanopriming
The seed nanopriming treatment required firstly to establish the triphasic seed germination process by imbibition curves to individuate the temporal hydration range to avoid lose of seed desiccation tolerance and viability afterwards the root emergency [56,57]. The kinetic germination curve of tomato seeds (Solanum lycopersicum L. var san marzano nano) showed the typical triphase feature with the II phase, the most sensible for the nanopriming process, ranged between 8-48 hours (Figure S3a). Similarly, the lettuce seed (Lactuca sativa L. var. romana) germination showed the triphasic curve but the II phase ranged between 2-10 hours. The protrusion of the root in lettuce was noted at 13 hours of water imbibition (Figure S3b).
To optimize the Ber-AgNPs concentration, the tomato seeds were primed for 24 hours with 0.5, 5, and 10 µg/mL of Ber-AgNPs and compared with seeds not primed (UP) and hydroprimed (HP). Although, no significant differences on germination percentage (G%) were observed among treatments (Figure S4a), the mean germination time (MGT) results revealed that Ber-AgNPs–treated seeds, at all tested concentrations, and HP seeds, germinated faster than UP ones (Figure S4b) confirming the beneficial effect of seed priming on germination speed as observed by Charachimwe et al. in chickpea [58]. Moreover, significant differences among treatments in post-germination parameters such as seedling vigor index (SVI) and seedling length (Figure 7) were observed. In particular, the UP seeds showed the lowest SVI value (2874±130) compared to HP (4402±204) and the Ber-AgNPs which significantly improved this parameter at all concentrations, reaching the highest value (5544±310) and declining at 10 µg/mL (4147±193) suggesting a dose-dependent effect (Figure 7a). Similar pattern was observed for the seedling length, where 5 µg/mL Ber-AgNPs developed the longest seedlings (60.8 ± 1.97 mm) (Figure 7b). Instead, in lettuce seeds, 0.5 µg/mL resulted the best treatment, especially in post-germination process, where SVI and seedling length significantly increased (Figure 8).
Similar results on tomato were obtained by Ansari et al. [59] that observed positive effects of AgNP phytosynthesized at <20 µg/mL; conversely, no effects were recorded by Rutkowski et al. [60] and Sonawane et al. [61]. Concerning lettuce seeds, a positive effect of metal nanoparticles was also reported by Antune et al. [62]. However, the Ber-AgNPs effects on both tomato and lettuce seed nanopriming showed a distinct hormetic dose-response: low doses (<5 for tomato and 0.5 µg/mL for lettuce) stimulated biological processes while higher doses inhibited them (>10 for tomato and 5 µg/mL for lettuce). This putative mechanisms of metal nanoparticles on seed nanopriming is well-documented in literature. For example, the higher concentration of Ag+ ions induced an uncontrolled oxidative stress and chromosomal aberrations compared to lower ones, that generated a mild stress signal resulting in the upregulation of antioxidant enzymes (SOD, CAT, APX) and aquaporins, priming the embryo for a rapid growth [63,64]. The MGT shortening and the enhanced radicle protrusion rate at 5 µg/mL and 0.5 µg/mL Ber-AgNPs in tomato and lettuce seeds, respectively (Figures S4 and S5) which could be due to a faster metabolic reactivation compared to hydropriming (HP) or unprimed (UP) controls. Indeed, recent results demonstrated that AgNPs could penetrate the seed coat creating the "nanopores," thereby increasing hydraulic conductivity and water uptake efficiency (imbibition) to onset seed metabolic process [64].
To optimize the nanopriming-time, tomato seeds treated with 5 µg/mL Ber-AgNPs and hydroprimed were dipped at two different times (8 and 24h). Not primed seeds (UP) were used as control. The seed nanopriming-time did not reveal any statistically significant differences in G% among the treatments (Figure S6a), except for the MGT values which were lower at 24h respect than 8h (Figure S6b). Indeed, seeds treated with 5 µg/mL Ber-AgNPs and with water alone (HP) germinated faster (39 and 40h, respectively) and the unprimed seeds (UP) (54h) (Figure S6b). The most interesting results were observed in post-germination parameters, where SVI and seedling length were significantly influenced by priming-time, showing a higher SVI and seedling length in 5 µg/mL Ber-AgNPs after 24h compared to 8h and UP and HP values (Figure 9). These results were in contrast with Ansari et al. [59], who observed positive effects of AgNPs on tomato seed germination after 2 hours of nanopriming, and in Rutkowski et al. [60] and Sonawane et al. [61], who reported any effects on the germination process after soaking tomato seeds in AgNPs solutions for 24 hours.
Althought the nanopriming-time of lettuce seeds (4 and 8h) did not influence the G% and MGT (Figure S7), as already observed in tomato, it significantly affected the post-germination process, showing higher SVI and seedling length after 4 h of Ber-AgNPs 0.5 µg/mL treatment compared to 8 hours and also to UP and HP (Figure 10).
These findings suggested the importance of "priming-time" optimization to prevent "soaking-injury" or hypoxia, ensuring a sufficient nanoparticle internalization. An optimized time allows seeds to reach the critical moisture content required to trigger repair mechanisms (DNA repair, protein synthesis) without fully transitioning into germination before sowing [56].
To investigate the effects of both the Ag+ ion and the BPE on the germination process, tomato seeds were treated with AgNO3 5 µg/mL, BPE 5 µg/mL, Ber-AgNPs 5µg/mL and hydroprimed (HP) and no primed (UP) seeds were included as control. Although, any statistically difference in G% and MGT was observed among treatments (Figure S8), Ber-AgNPs caused the highest SVI (5944) and seedling length (69 mm) compared to all the other treatments (Figure 11). In lettuce, any differences among all the treatments were observed for the G%; conversely, 0.5 µg/mL Ber-AgNPs and HP significantly reduced the MGT, indicating a fast lettuce seed germination (Figure S9). Only the 0.5 µg/mL Ber-AgNPs caused a statistically increase of SVI and seedling length parameters (Figure 12). These results highlighted the best performance of Ber-AgNPs compared to the AgNO3 and BPE. Probably, the Ber-AgNPs, capped with phytocompounds from the BPE, provided a slow-release mechanism for Ag+ ions stimulating the ROS-mediated signaling pathway in seeds. Further, this organic capping not only stabilizes the Ber-AgNPs but may also provide additional bioactive signaling molecules that synergistically enhance seedling establishment, a benefit not observed with chemical-synthesized nanoparticles.
Overall, these results indicate the absence of phytotoxicity of the Ber-AgNPs and the positive effect of Ber-AgNPs nanopriming treatment on early growth stages of tomato and lettuce seedlings, confirming the previous data obtained from chemical or green synthesized metal nanoparticles in both species [59,60,61,65,66].
2.6. In Vitro Antibacterial Activity
The results confirmed the antibacterial activity of Ber-AgNPs, against two bacterial plant pathogens, Pseudomonas syringae DC3000 pv. tomato and Xanthomonas campestris pv. Vesicatoria, which inhibited their growth in a dose-dependent manner, as already reported for the biogenic AgNPs [67,68]. However, different responses between bacteria were observed: 5 µg/mL of Ber-AgNPs (TNP 5) caused 50% reduction in P. syringae pv. tomato growth compared to untreated controls, while 20 and 50 µg/mL (TNP20 and TNP 50, respectively) showed a complete inhibition (Figure 13). The antagonistic activity was even more pronounced against X. campestris pv. vesicatoria, where at lower concentration (TNP 5) 90% bacterial growth inhibition was recorded (Figure 13). This dose-responsive behavior was typical of nanoparticle-mediated antimicrobial action, probably due to their greater interaction with bacterial cell components [69,70,71]. To note, a different sensitivity to Ber-AgNPs between the two pathogens: X. campestris displayed greater susceptibility compared to P. syringae, modifying the response observed to ionic silver (AgNO₃), where X. campestris demonstrated significantly higher resistance compared to P. syringae at 5 µg/mL AgNO₃ (TM 5) (Figure 13). This suggested that the Ber-AgNPs nanostructure could bypass certain resistance mechanisms that X. campestris possessed against free silver ions (Ag+), such as the specific extracellular polymeric substance (EPS) and xanthan gum production, able to chelate free Ag+ ions before they reach the cell membrane [72]. In contrast, Ber-AgNPs are capable of penetrating the EPS matrix due to their size and surface properties, and, once inside, they could ensure the bioactive Ag+ ions release directly at the target site as observed in algal cells [73]. Another hypothesis of different bacterial sensitivity was often attributable to differences in cell wall structure, membrane composition, efflux pump systems, or the presence of protective biofilms. For example, Pseudomonas spp. developed robust alginate biofilms and possess efficient efflux pumps able to confer higher resistance to various antimicrobial compounds and nanoparticles [74,75]. In contrast, the heightened susceptibility of X. campestris to Ber-AgNPs could stem from distinct cell surface properties or a reduced ability to detoxify or expel internalized Ag+ [76] . The antibacterial effects of AgNPs are multifaceted and do not rely on a single mechanism, which contributes to their broad-spectrum activity and reduced likelihood of resistance development compared to conventional antibiotics [69,77]. The primary mechanisms include the release of Ag⁺ from the nanoparticle surface, which are highly reactive and interfere with critical bacterial processes. These ions can bind to and damage bacterial DNA, inhibiting replication and transcription, thus leading to genetic damage [78]. AgNPs also target the bacterial cell membrane, altering its permeability and integrity, which results in the leakage of intracellular contents and ultimately cell lysis [76,78]. Furthermore, AgNPs can generate ROS, inducing oxidative stress within the bacterial cell, and interact with proteins and enzymes, leading to their denaturation and disruption of metabolic pathways [78,79]. This comprehensive attack on multiple cellular targets makes AgNPs highly effective against a wide range of pathogens.
Comparing the antimicrobial effects of the Ber-AgNPs (TNP), AgNO3 (TM) and BPE alone (TE), we observed that the BPE alone did not inhibit the bacterial growth conversely to the AgNO3 solution (Figure 13), indicating that the antimicrobial activity was attributable to the Ber-AgNPs themselves, rather than the extract.
3. Materials and Methods
3.1. Waste Biomaterial and Chemicals
Bergamot (Citrus bergamia Risso & Poiteau, Rutaceae) pomace were provided by citrus industry (Fascì s.a.s) located at Reggio Calabria (Italy) and stored at −80 °C. Subsequently, the BP was freeze-dried (CHRIST - Alpha 1–4 LD plus) for 5 days and the lyophilized BP was ground into a fine powder and stored at -20°C. The silver nitrate was purchased by Merck KGaA, Darmstadt, Germany. All the chemicals used in the proteomic analysis were purchased from Sigma- Aldrich (St. Louis, MO, USA) and all the aqueous solutions were prepared with type I deionized water (Wasserlab water purification system).
3.2. Optimization of Reaction Conditions
To optimize the reaction conditions affecting the biosynthetic process, this study employed a 'One Factor at a Time' (OFAT) strategy in which each individual parameter, such the BPE concentration, pH, BPE/AgNO3 mixture ratio, incubation time and temperature, varied independently, while the remaining ones were held constant [80] as reported in the experimental plain (Table S1). Starting values of the reaction conditions of each assay have been taken from literature, specific to the citrus biomass-based nanoparticles [19,20,28,36,81,82,83,84]. The optimal value of each parameter were selected by considering some physical-chemical analysis such as colour change, high absorbance at UV-visible spectrum and the best DLS results of each specific assays.
3.2.1. BPE Concentration
Two different amounts of freeze-dried bergamot pomace powder (0.1 and 1 g) were mixed with 100 mL of ultrapure deionized water and stirred at 140 rpm in a water bath (Julabo ShakeTemp SW22), at 50 °C for 30 minutes to obtain two extracts (BPE0.1 and BPE1). They were after centrifuged (Eppendorf Centrifuge 5804 R) at 10,000 rpm for 10 minutes, and the supernatants were filtered (Whatman No. 1 filter paper). The BPE0.1 and BPE1 were then adjusted to pH 9 by the addition of 0.2 M NaOH and then mixed at a 1:1 ratio (v/v) with an aqueous solution of 1 mM AgNO3. The resulting BPE–AgNO₃ mixtures were incubated under agitation in the dark in a water bath at 25 °C for 24 h during which the colour changes were observed and recorded by camera. Hence, the mixtures were collected and centrifuged at 10.000 rpm for 20 minutes, and the pellet was washed four times with deionized water and subsequently physico-chemically characterized. In particular, the Ber-AgNPs formation were monitored by UV-Vis spectrophotometry (PerkinElmer 79 Instruments - Lambda 35 UV/VIS Spectrometer) in the 300–700 nm range, detecting the SPR peak at 400 and 450 nm, specific for the silver nanoparticles, and recording the absorbance [85]. The DLS analysis (Zetasizer Nano, Malvern®) were performed at 25 °C with a 657-nm wavelength laser and 90° scattering angle, to assess the Ber-AgNPs size (Z-average), polydispersity index (PdI), and surface charge (Z-potential).
3.2.2. pH
The BPE0.1 was adjusted to four different pH values, 4 (pH4), 7 (pH7), 8.5 (pH8.5), and 9 (pH9) by the addition of 0.2 M NaOH. The different BPE mixtures were mixed with 1 mM AgNO₃ at a 1:1 extract-to-metal ratio. Following the procedure outlined above, the pellet of the four different mixtures was used for physical-chemical characterization.
3.2.3. Extract:Metal Ratio
The BPE0.1, at pH 8.5, was mixed with 1 mM AgNO₃ at two different extract-to-metal ratios (1:1 and 2:1, v/v). Following the procedure outlined above, the pellet of the two different mixtures was used for physical-chemical characterization.
3.2.4. Incubation Time
The BPE0.1, at pH 8.5, was mixed with 1mM AgNO3 at a 1:1 extract-to-metal ratio. The mixture was left to shake at 25°C for three different times: 1 (t1), 3 (t3), and 24 hours (t24). Following the procedure outlined above, the pellet of the three different mixtures was used for physical-chemical characterization.
3.2.5. Incubation Temperature
The BPE0.1, at pH 8.5 and mixed with 1mM AgNO3 (1:1 ratio, v/v), was left to shake for 24h at different temperatures: 15°C (T15), 20°C (T20), and 25°C (T25). Following the procedure outlined above, the pellet of the three different mixtures was used for physical-chemical characterization.
3.3. Ber-AgNPs Chemical-Physical Characterization
The optimized Ber-AgNPs pellet was freeze-dried to obtaining the lyophilized Ber-AgNPs and their size and shape were assessed by transmission electron microscopy TEM (Talos F200S G2, Thermo Scientific) and scanning transmission electron microscopy (STEM) (NovaNanoSEM450, Thermo Scientific), using an accelerating voltage of 200kV with a resolution of 0.16 nm and 30 kV with a resolution of 2 nm, respectively.
The ATR-FTIR analysis were used for the evaluation of the BPE and inorganic AgNPs interaction to form a hybrid matter, the Ber-AgNPs. The ATR-FTIR spectra of BPE and Ber-AgNPs were collected at room temperature in the wavenumber range 600–4000 cm−1 with a resolution of 4 cm−1 and 64 scans using an IRSpirt-L/T (Shimadzu Italiasrl, Italy). The acquired spectra were processed (LabSolution IR Version 2.27) software interfaced with an ATR (attenuated total reflectance) sampling accessory with a single diamond crystal. A reference (background spectrum of air) was scanned under the same instrumental conditions before each sample measurement. A small pellet of sample was placed on the surface of the diamond ATR crystal and the sample spectrum collected.
3.4. Proteomic analysis of the Ber-AgNPs
3.4.1. Sample preparation
The optimized Ber-AgNPs were solubilized in 40 µL of a buffer composed by 2% sodium dodecyl sulphate (SDS), 40 mM dithiothreitol (DTT) and 200 mM TrisHCl (pH 8.0) and incubated at 37°C for 1 hour to reduce disulphide bonds. After reduction, samples were centrifuged at 10,000 g for 5 minutes and 25 µL of the supernatant was collected and brought to a final volume of 100 µL with water. Cysteine alkylation was performed by adding 12 µL of 200 mM iodoacetamide (IAA) dissolved in 200 mM TrisHCl (pH 8.0); the sample was incubated for 1h at 37°C. Finally, 2 µL of 100 mM DTT was added to quench residual IAA and the incubation was allowed to proceed at 37°C for 30 min.
3.4.2. Protein Aggregation Capture (PAC)
Fifteen microliters of sample were digested by protein aggregation capture (PAC)[86] using 5 µL of MagReSyn Hydroxyl beads (100 µg of beads, Resyn Biosciences) previously conditioned with 70% of acetonitrile (ACN, v/v).
Protein precipitation on the beads was performed by the addition of ACN to a final concentration of 70% (incubation in a thermomixer at room temperature with 1100 rpm for ten minutes).
After incubation, the sample was placed on a magnetic rack to separate and discard the supernatant. Four washing steps were performed: three washes with 100% ACN and one with 70% ethanol.
Finally, after removing the last wash, 51 µL of lysis buffer containing 50 mM triethylammonium bicarbonate (TEAB) and 200 ng of trypsin was added to the beads (incubation overnight at 37°C, 1100 rpm).
After 24 hours, the sample was placed on the magnetic rack to collect the solution containing the peptides; after collection, 50 µL of a solution constituted by 0.1% of formic acid (FA) was added to the beads (incubation at room temperature for 2 minutes at 1100 rpm) to gain the elution of the peptides still bound to the beads. Finally, the obtained peptides were dissolved in a volume of approximately 100 µL.
3.4.3. Protein Amount Estimation
To estimate the amount of protein in the sample, protein quantification was performed using a reference sample (MCF-7 digest) with a known amount of protein. Specifically, four different solutions (2,5 ng/µL, 5 ng/µL, 10 ng/µL, 20 ng/µL) were prepared using the MCF-7 digest.
3.4.4. LC-MS/MS Analysis
Peptides were separated by using an Easy nLC-1200 chromatographic instrument coupled to an Exploris 480 mass spectrometer (Thermo Scientific, Bremen, Germany).
For protein amount estimation, the sample and the reference sample (MCF-7 at different concentration) were analysed by data-dependent acquisition (DDA). Briefly, 2 µL of the peptides mixture were separated using a linear gradient of 75 min at a flow rate of 230 nL/min on a 15 cm, 75 µm i.d., in-house-made column packed with 3 µm C18 silica particles (Dr. Maisch). The binary gradient was performed using mobile phase A (0.1% FA, 2% ACN) and mobile phase B (0.1% FA and 80% ACN). Peptides elution was performed using the following gradient: from 4% B to 32% B in 60 min, from 32% to 100% B in 8 min; the column was cleaned for 5 min with 100% B. The mass spectrometer operated in DDA mode using a top- 12. In detail, the MS full scan was 375-1400 m/z with a resolution of 60,000, AGC target of 1 x 10⁶ and maximum injection time of 50 ms. The mass window for the isolation of the precursor was 1.6 m/z (resolution of 30,000, AGC target of 1 x 10⁶ and maximum injection time “custom”). HCD fragmentation was set at normalized collision energy of 30 and dynamic exclusion of 20 s.
The sample was analysed in triplicate by data-independent acquisition (DIA) method. In particular, 2 µL were separated using a linear gradient of 75 min at a flow rate of 300 nL/min on the column with the same characteristics described above. The gradient was the following: from 6% B to 14% B in 16 min, from 14% to 40% B in 32 min, from 40% B to 100% B in 8 min; the column was cleaned for 5 min with 100% B. In DIA mode, proteomic profile was acquired using the DIA method (scan range 350-1000 m/z) composed by (i) 24 windows with an isolation window of 15 m/z, (ii) 5 windows with an isolation of 30 m/z and (iii) 3 windows with an isolation windows of 50 m/z. Each window showed an overlap equal to 0.5 m/z.
3.4.5. Data-Dependent Acquisition (DDA)
Sample raw data were analysed by MaxQuant software (version 2.4.11.0). The used parameters were as follow: (i) Human database one protein one gene containing 20577 sequences and downloaded on 18 March 2022, (ii) Citrus database containing 126267 sequences and downloaded on 31 July 2025, (iii) first search peptide tolerance of 20 ppm, (iv)main search peptide tolerance of 4.5 ppm, (v) trypsin/P as an enzyme and (vi) missed cleavages equal two.
Carbamidomethylation of cysteines was set as static modification, and oxidation of methionine and protein N-terminal acetylation were allowed as variable modifications. The value of FDR was set to 0.01 and only the peptides with > 7 amino acid residues were selected for identification; only “unique + razor” ones were used for protein quantification.
The raw files of MCF-7 digest were used to build the calibration curve. The analysis was performed using the same parameters described above for samples analysis changing only the database: Human one protein one gene (20577 sequences, downloaded on 18 March 2022).
3.4.6. Data-Indipendent Acquisition (DIA)
The DIA raw files were analysed by Spectronaut (version 19.0) using the default parameters and the “only protein group specific” as proteotypicity filter for protein quantification. The following databases were used: (i) Human (one protein one gene, 20577 sequences) and (ii) Citrus database (126267 sequences).
3.4.7. Functional Annotation and Gene Ontology Analysis of Protein
The identified protein sequences were functionally annotated by computational inference using Protein ANNotation with Z-scoRE through high-performance homology searches and large-scale annotation based on sequence similarity [87].
The predictions provided include GO (Gene Ontology) annotations and various confidence scores. Specifically, the ARGOT_PPV (Positive Predictive Value) score was used, which estimates the probability that a specific GO annotation is correct (Table S6).
Functional enrichment at the protein domain level was assessed using the Domain Enrichment Prediction module. The analysis identified overrepresented domains and protein families among the annotated sequences, calculating the enrichment Z-score (cluster_GSZ) and the corresponding significance value (val_avg) for each domain. Domain descriptions were derived from structural databases (Pfam, SMART, CDD, and InterPro), allowing the Gene Ontology annotation to be supplemented with structural and functional information (Table S7).
GO term associations with the ARGOT_PPV value were classified into three domains: Biological Process (BP), Molecular Function (MF), and Cellular Component (CC). Subsequently, the complete list of GO terms was processed using the REVIGO server [88] to eliminate obsolete or highly redundant terms, using the entire UniProt database as a reference and the similarity measure, setting a semantic similarity cutoff (SimRel) of 0.7 to reduce redundancy between related GO terms.
3.5. Seed Nanopriming
3.5.1. Triphasic Germination Process of the Tomato and Lettuce Seeds
To obtain the imbibition curves, 20 seeds of both tomato (Solanum lycopersicum L. var san marzano nano) and lettuce (Lactuca sativa L. var. romana) were weighed at time 0 and then placed in Petri dishes (Ø = 9 cm) containing a sterile filter paper moistened with 5 mL of deionized water. Afterwards, the fresh weight of seeds was recorded at different time intervals up to the radicle emerged and the germination process was completed (1mm radicle length). The amount of water taken up by the seeds has been determined as the percent increase in weight of imbibed seeds with respect to the initial weight [89] and plotted against the imbibition time to obtain the imbibition curve, as proposed by Bewley et al. [90] which contains three phases: fast imbibition (phase I), little to no imbibition, usually longer than phase 1 (Phase II), and radicle protrusion and weight regain (phase III). Three experiments have been performed to obtain the curve imbibition.
3.5.2. Tomato seed Nanopriming
3.5.2.1. Optimization of Ber-AgNPs Concentration
Different concentrations of Ber-AgNPs (0.5, 5, and 10 ug/mL) were prepared from freeze-dried Ber-AgNPs and dispersed in deionized water using ultrasonic vibration for 30 minutes. Eighty seeds of tomato were surface-sterilized in 5% NaOCl for 5 min, rinsed thoroughly with deionized water and soaked in 40 mL of each Ber-AgNPs solution for 24 h. Priming were performed in borosilicate glass beakers at 25 °C, in the dark, under continuous aeration. Untreated seeds were used as unprimed controls (UP) while hydropriming (HP) with deionized water (soaked for 24 h) were used as positive control. In the post-priming treatment, seeds were dried back to their initial moisture content at 25 °C. After 2 days of drying, 20 seeds of each treatment were sterilized again and placed to germinate in Petri dishes (Ø 9 cm) in sterile filter paper moistened with 5 mL of deionized water. Dishes were placed in a growth chamber, in the dark, at 25°C and germination was monitored daily. The final germination percentage was determined after 5 days. Seedlings lengths were measured using ImageJ software. Germination parameters were calculated using the following equations:
where:
ni = number of seeds germinated in the time interval (ti)
ti = time (in days or hours) from the start of the experiment
∑ni = total seeds germinated
Each treatment was conducted with four independent replicates.
3.5.2.2. Optimization of Seed Nanopriming Time.
Eighty tomato seeds, previously sterilized as reported above, were dipped in 40 mL of each priming solution (HP, 0.5, 5, and 10µg/mL of Ber-AgNPs) for two different times (8h and 24h) while UP seeds were used as negative control. Different priming times were identified according to the seed transition phase into stage II of germination curve. Post-priming treatments, germination conditions, and measurements were conducted as described above.
3.5.2.3. Comparison with Metal and BPE Controls
To evaluate the effects of the metal (Ag) and the extract on the germination process during the tomato seed nanopriming, eighty seeds, previously sterilized as reported above, were dipped in 40 mL of each priming solution (HP, 5 µg/mL of Ber-AgNPs) and in 5 µg/mL of silver nitrate (AgNO3) and 5 µg/mL of BPE, as additional positive controls, for 24 h. Post-priming treatments, germination conditions, and measurements were conducted as described above.
3.5.3. Lettuce Seed Nanopriming
3.5.3.1. Optimization of Ber-AgNPs Concentration
Different concentrations of Ber-AgNPs (0.1, 0.5, 5, and 50 µg/mL) were, prepared as described above, including the UP and HP controls. Eighty lettuce seeds were surface-sterilized, as reported for tomato seeds, and soaked in 40 mL of each Ber-AgNPs solution for 4 h. Post-priming treatments, germination conditions, and measurements were conducted as described for tomato.
3.5.3.2. Optimization of Seed Nanopriming Time
Eighty lettuce seeds, previously sterilized as reported above, were dipped in 40 mL of each priming solution (HP and 0.5 µg/mL of Ber-AgNPs) for two different times (4h and 8h) and UP seeds were used as negative control. Different priming times were identified according to the seed transition phase into stage II of germination curve. Post-priming treatments, germination conditions, and measurements were conducted as described above.
3.5.3.3 Comparison with Metal and Bergamot Pomace Extract Controls
To evaluate the effects of the metal (Ag) and the extract on the germination process during the lettuce seed nanopriming, eighty seeds, previously sterilized as reported above, were dipped in 40 mL of each priming solution (HP, 0.5 µg/mL of Ber-AgNPs) and in 0.5 µg/mL of silver nitrate (AgNO3) and 0.5 µg/mL of BPE as additional positive controls, for 4 h. Post-priming treatments, germination conditions, and measurements were conducted as described above.
3.6. Statistical Analysis
All the seed nanopriming experiments were conducted using a completely randomized design with four independent replicates per treatment. Data was expressed as mean ± standard error (SE). Statistical analyses were performed using one-way analysis of variance (ANOVA) to evaluate the effect of treatments on germination percentage (G%), mean germination time (MGT), seedling length, and seedling vigor index (SVI). When significant differences were detected (p < 0.05), means were compared using Tukey’s post-hoc test.
3.7. Antibacterial Activity of Ber-AgNPs
The Ber-AgNPs antibacterial activity was evaluated against two main tomato bacterial pathogens, i.e. Pseudomonas syringae DC3000 pv. tomato and Xanhtomonas campestris pv. vesicatoria. Breifly, bacterial stocks conserved in 40% glycerol (1:1, v:v) were revived by culturing 100 µL in 100 mL of Luria Bertani (LB) broth, and the bacterial cultures were incubated at 37°C under constant agitation (125 rpm). After 24 h, they were transferred into sterile 2mL microtubes and cultured in LB broth supplemented with test agents: Ber-AgNPs, BPE, or AgNO3 solution, each at the 5, 20, and 50 µg/mL final concentrations. The LB broth containing identical concentrations of Ber-AgNPs, BPE, or AgNO₃, but without bacteria, served as negative controls (background controls), while bacteria pure cultures, in LB, served as positive control. All the treatments were incubated at 37 °C under constant agitation (125 rpm) for 24 h. The bacterial growth was assessed by measuring the optical density at 600 nm (OD₆₀₀) using a Mettler Toledo Easy UV spectrophotometer, and the antibacterial activity was evaluated calculating the difference of absorbance between the treated samples and the positive controls. The antibacterial tests were conducted using a completely randomized design with six independent replicates per treatment. Data were expressed as mean ± SE. Statistical analyses were performed using one-way analysis of variance (ANOVA) to evaluate the effect of treatments on bacterial growth (OD600). When significant differences were detected (p < 0.05), means were compared using Tukey’s post-hoc test.
5. Conclusions
The present study demonstrates the successful valorization of agro-industrial waste, specifically bergamot pomace, for the eco-friendly synthesis of stable and bioactive silver nanoparticles. The optimization process confirmed that the physicochemical properties of the nanoparticles are strictly dependent on synthesis parameters, yielding small, spherical, and highly stable particles capped by organic phytocompounds. The combined spectroscopic (FTIR, UV-Vis) and proteomic analyses elucidated the dual role of the extract's biomolecules in both reducing Ag⁺ ions and stabilizing the resulting nanostructures. Notably, the identification of specific spectral shifts in O–H, C=O, and amide regions supports the involvement of polyphenols and proteins in the nanoparticle formation process. Biologically, the Ber-AgNPs exhibited a dual functionality essential for sustainable agriculture. First, as a seed nanopriming agent, the Ber-AgNPs displayed a hormetic dose-response in tomato and lettuce seeds, where a low concentration (5 for tomato and 0.5 µg/mL) significantly enhanced germination kinetics, seedling vigor, and root development, probably modulating the "antioxidant system" and improving water uptake. Second, the Ber-AgNPs demonstrated potent antimicrobial activity against phytopathogens Pseudomonas syringae and Xanthomonas campestris, notably outperforming ionic silver derived from salt (AgNO3) and bergamot pomace extract alone. The proposed mechanism integrates molecular evidence from multiple analytical platforms and provides a comprehensive model of organic–inorganic interaction during biogenic nanoparticle synthesis. Such a multidisciplinary approach strengthens the relevance of this work for future biomedical, environmental, and materials science research and encouraging the exploitation of circular-economy solution for plant protection and biostimulation, offering a highly effective alternative to conventional agrochemicals.
Supplementary Materials
The following supporting information can be downloaded at: Preprints.org.
Author Contributions
Conceptualization, R.C. and A.S.; methodology, R.C., M.M.A. (antimicrobial test), I.G.L. (FTIR-ATR), L.P. (proteomics) and M.G. (proteomics); validation, A.S.; formal analysis, R.C., I.G.L. (FTIR-ATR), L.P. (proteomics), A.M. (proteomics) and M.G. (proteomics).; investigation, R.C., I.G.L. (FTIR-ATR), L.P. (proteomics) and M.G. (proteomics); resources, A.S.; data curation, R.C. and A.M. (proteomics); writing—original draft preparation, R.C., A.M. (proteomics), M.M.A. (antimicrobial test); writing—review and editing, A.S., M.R.A., I.G.L. and M.G. (proteomics); visualization, R.C., A.M. (proteomics), I.G.L.; supervision, A.S.; funding acquisition, A.S. All authors have read and agreed to the published version of the manuscript.”
Institutional Review Board Statement
Not applicable.
Informed Consent Statement
Not applicable.
Data Availability Statement
Data are contained within the article and Supplementary Materials.
Acknowledgments
We acknowledge the PhD course “Scienze Agrarie, Alimentari e Forestali” of the University “Mediterranea” of Reggio Calabria and Department AGRARIA for supporting RC. We are also thankful to Dr. Antonino Zumbo and Dr. Ilenia Carmen Palmisano for technical helping.
Conflicts of Interest
The authors declare no conflicts of interest.
Abbreviations
The following abbreviations are used in this manuscript:
| TEM | Transmission Electron Microscopy |
| STEM | Scanning Transmission Electron Microscopy |
| ATR-FTIR | attenuated total reflectance – Fourier transform infrared spectroscopy |
| NP | Nanoparticle |
| M-NPs | Metal/Metalloids nanoparticles |
| GS-M-NPs | Green synthesis of Metal/Metalloids nanoparticles |
| Ber-AgNPs | bergamot pomace-based silver nanoparticles |
| BPE | bergamot pomace extract |
| SPR | surface plasmon resonance |
| PdI | polydispersity index |
| DLS | Dynamic Light Scattering |
References
- Khan, Y.; Sadia, H.; Ali Shah, S.Z.; Khan, M.N.; Shah, A.A.; Ullah, N.; Ullah, M.F.; Bibi, H.; Bafakeeh, O.T.; Ben Khedher, N.; et al. Classification, Synthetic, and Characterization Approaches to Nanoparticles, and Their Applications in Various Fields of Nanotechnology: A Review. Catalysts 2022, 12. [Google Scholar] [CrossRef]
- Rhaman, M.S.; Tania, S.S.; Imran, S.; Rauf, F.; Kibria, M.G.; Ye, W.; Hasanuzzaman, M.; Murata, Y. Seed Priming with Nanoparticles: An Emerging Technique for Improving Plant Growth, Development, and Abiotic Stress Tolerance. J. Soil Sci. Plant Nutr. 2022, 22, 4047–4062. [Google Scholar] [CrossRef]
- Moulick, R.G.; Das, S.; Debnath, N.; Bandyopadhyay, K. Potential Use of Nanotechnology in Sustainable and ‘Smart’ Agriculture: Advancements Made in the Last Decade. Plant Biotechnol. Rep. 2020, 14, 505–513. [Google Scholar] [CrossRef]
- Miu, B.A.; Dinischiotu, A. New Green Approaches in Nanoparticles Synthesis: An Overview. Molecules 2022, 27. [Google Scholar] [CrossRef] [PubMed]
- Saha, J.; Begum, A.; Mukherjee, A.; Kumar, S. A Novel Green Synthesis of Silver Nanoparticles and Their Catalytic Action in Reduction of Methylene Blue Dye. Sustainable Environment Research 2017, 27, 245–250. [Google Scholar] [CrossRef]
- Rodríguez-Félix, F.; López-Cota, A.G.; Moreno-Vásquez, M.J.; Graciano-Verdugo, A.Z.; Quintero-Reyes, I.E.; Del-Toro-Sánchez, C.L.; Tapia-Hernández, J.A. Sustainable-Green Synthesis of Silver Nanoparticles Using Safflower (Carthamus Tinctorius L.) Waste Extract and Its Antibacterial Activity. Heliyon 2021, 7. [Google Scholar] [CrossRef] [PubMed]
- Flores-Contreras, E.A.; González-González, R.B.; Pablo Pizaña-Aranda, J.J.; Parra-Arroyo, L.; Rodríguez-Aguayo, A.A.; Iñiguez-Moreno, M.; González-Meza, G.M.; Araújo, R.G.; Ramírez-Gamboa, D.; Parra-Saldívar, R.; et al. Agricultural Waste as a Sustainable Source for Nanoparticle Synthesis and Their Antimicrobial Properties for Food Preservation. Frontiers in Nanotechnology 2024, 6. [Google Scholar] [CrossRef]
- Xu, C.; Nasrollahzadeh, M.; Selva, M.; Issaabadi, Z.; Luque, R. Waste-to-Wealth: Biowaste Valorization into Valuable Bio(Nano)Materials.
- Bagheri, S.; Moradi, P.; Nematollahi, F.; Zarinnia, V.; Abdossi, V. Investigating Green Synthesis of Silver Nanoparticles from Orange Peel (Citrus Sinensis) and the Effects of Chitosan, Sylamol, Nanosilver on Rhizopus Stolanifer in Tomato (Solanum Lycopersicum). Indian Journal of Ecology 2020, 47, 82–86. [Google Scholar]
- Pratikno, H.; Anggya, P.B.; Fadhila, F.; Chafidz, A.; Wara, D.P.R.W. Biosynthesis of Silver Nanoparticles Using Banana Raja (Musa Paradisiaca Var. Raja) Peel Extract: Effect of Different Concentrations of the AgNO3 Solution. Key Eng. Mater. 2021, 61–66. [Google Scholar] [CrossRef]
- Chen, Q.; Liu, G.; Chen, G.; Chen, T.; Mi, T. Preparation of Antibacterial Paper 2017, Vol. 12.
- Saratale, R.G.; Saratale, G.D.; Ghodake, G.; Cho, S.K.; Kadam, A.; Kumar, G.; Jeon, B.H.; Pant, D.; Bhatnagar, A.; Shin, H.S. Wheat Straw Extracted Lignin in Silver Nanoparticles Synthesis: Expanding Its Prophecy towards Antineoplastic Potency and Hydrogen Peroxide Sensing Ability. Int. J. Biol. Macromol. 2019, 128, 391–400. [Google Scholar] [CrossRef]
- Anadebe, V.C.; Chukwuike, V.I.; Ebenso, E.E.; Barik, R.C. Chapter 14 - Trends and Perspectives in Waste-Derived Nanoparticles and Circular Economy. Waste-Derived Nanoparticles 2024, 367–379. [Google Scholar]
- Guimarães, R.; Barros, L.; Barreira, J.C.M.; Sousa, M.J.; Carvalho, A.M.; Ferreira, I.C.F.R. Targeting Excessive Free Radicals with Peels and Juices of Citrus Fruits: Grapefruit, Lemon, Lime and Orange. Food and Chemical Toxicology 2010, 48, 99–106. [Google Scholar] [CrossRef] [PubMed]
- Shofinita, D.; Feng, S.; Langrish, T.A.G. Comparing Yields from the Extraction of Different Citrus Peels and Spray Drying of the Extracts. Advanced Powder Technology 2015, 26, 1633–1638. [Google Scholar] [CrossRef]
- Alkhulaifi, M.M.; Alshehri, J.H.; Alwehaibi, M.A.; Awad, M.A.; Al-Enazi, N.M.; Aldosari, N.S.; Hatamleh, A.A.; Abdel- Raouf, N. Green Synthesis of Silver Nanoparticles Using Citrus Limon Peels and Evaluation of Their Antibacterial and Cytotoxic Properties. Saudi J. Biol. Sci. 2020, 27, 3434–3441. [Google Scholar] [CrossRef]
- Gupta, S.; Choudhary, D.K.; Sundaram, S. Green Synthesis and Characterization of Silver Nanoparticles Using Citrus Sinensis (Orange Peel) Extract and Their Antidiabetic, Antioxidant, Antimicrobial and Anticancer Activity. Waste Biomass Valorization 2025, 16, 1101–1114. [Google Scholar] [CrossRef]
- Hussain, M.; Raja, N.I.; Mashwani, Z.U.R.; Naz, F.; Iqbal, M.; Aslam, S. Green Synthesis and Characterisation of Silver Nanoparticles and Their Effects on Antimicrobial Efficacy and Biochemical Profiling in Citrus Reticulata. IET Nanobiotechnol. 2018, 12, 514–519. [Google Scholar] [CrossRef]
- Khane, Y.; Benouis, K.; Albukhaty, S.; Sulaiman, G.M.; Abomughaid, M.M.; Al Ali, A.; Aouf, D.; Fenniche, F.; Khane, S.; Chaibi, W.; et al. Green Synthesis of Silver Nanoparticles Using Aqueous Citrus Limon Zest Extract: Characterization and Evaluation of Their Antioxidant and Antimicrobial Properties. Nanomaterials 2022, 12. [Google Scholar] [CrossRef]
- Mickky, B.; Elsaka, H.; Abbas, M.; Gebreil, A.; Shams Eldeen, R. Orange Peel-Mediated Synthesis of Silver Nanoparticles with Antioxidant and Antitumor Activities. BMC Biotechnol. 2024, 24. [Google Scholar] [CrossRef]
- Saratale, R.G.; Shin, H.S.; Kumar, G.; Benelli, G.; Ghodake, G.S.; Jiang, Y.Y.; Kim, D.S.; Saratale, G.D. Exploiting Fruit Byproducts for Eco-Friendly Nanosynthesis: Citrus × Clementina Peel Extract Mediated Fabrication of Silver Nanoparticles with High Efficacy against Microbial Pathogens and Rat Glial Tumor C6 Cells. Environmental Science and Pollution Research 2018, 25, 10250–10263. [Google Scholar] [CrossRef]
- Saravanan, M.; Vahidi, H.; Medina Cruz, D.; Vernet-Crua, A.; Mostafavi, E.; Stelmach, R.; Webster, T.J.; Ali Mahjoub, M.; Rashedi, M.; Barabadi, H. Emerging Antineoplastic Biogenic Gold Nanomaterials for Breast Cancer Therapeutics: A Systematic Review. Int. J. Nanomedicine 2020, 15, 3577–3595. [Google Scholar] [CrossRef]
- Usman, O.; Mohsin Baig, M.M.; Ikram, M.; Iqbal, T.; Islam, S.; Syed, W.; Al-Rawi, M.B.A.; Naseem, M. Green Synthesis of Metal Nanoparticles and Study Their Anti-Pathogenic Properties against Pathogens Effect on Plants and Animals. Sci. Rep. 2024, 14. [Google Scholar] [CrossRef]
- Mishra, P.; Ahmed, T.; Singh, L. A Comparative Study of Biosynthesized Silver-Nanoparticles from Citrus Maxima Peel, Pulp and Seed: A Special Retrospect for Antimicrobial Activity. J. Pharm. Res. Int. 2021, 454–463. [Google Scholar] [CrossRef]
- Sujitha, M. V.; Kannan, S. Green Synthesis of Gold Nanoparticles Using Citrus Fruits (Citrus Limon, Citrus Reticulata and Citrus Sinensis) Aqueous Extract and Its Characterization. Spectrochim. Acta A Mol. Biomol. Spectrosc. 2013, 102, 15–23. [Google Scholar] [CrossRef]
- Hashem, A.M.; Abuzeid, H.; Kaus, M.; Indris, S.; Ehrenberg, H.; Mauger, A.; Julien, C.M. Green Synthesis of Nanosized Manganese Dioxide as Positive Electrode for Lithium-Ion Batteries Using Lemon Juice and Citrus Peel. Electrochim. Acta 2018, 262, 74–81. [Google Scholar] [CrossRef]
- Vankar, P.S.; Shukla, D. Biosynthesis of Silver Nanoparticles Using Lemon Leaves Extract and Its Application for Antimicrobial Finish on Fabric. Applied Nanoscience (Switzerland) 2012, 2, 163–168. [Google Scholar] [CrossRef]
- Akhter, N.; Batool, M.; Yaqoob, A.; Shahid, M.; Muhammad, F.; Khan, J.; Mudassir, M.A.; Rasheed, M.; Javed, S.; Al Farraj, D.A.; et al. Potential Biological Application of Silver Nanoparticles Synthesized from Citrus Paradisi Leaves. Sci. Rep. 2024, 14. [Google Scholar] [CrossRef]
- Dikshit, P.K.; Kumar, J.; Das, A.K.; Sadhu, S.; Sharma, S.; Singh, S.; Gupta, P.K.; Kim, B.S. Green Synthesis of Metallic Nanoparticles: Applications and Limitations. Catalysts 2021, 11. [Google Scholar] [CrossRef]
- Kolbert, Z.; Szollosi, R.; Rónavári, A.; Molnár, Á. Nanoforms of Essential Metals: From Hormetic Phytoeffects to Agricultural Potential. J. Exp. Bot. 2022, 73, 1825–1840. [Google Scholar] [CrossRef]
- Nile, S.H.; Thiruvengadam, M.; Wang, Y.; Samynathan, R.; Shariati, M.A.; Rebezov, M.; Nile, A.; Sun, M.; Venkidasamy, B.; Xiao, J.; et al. Nano-Priming as Emerging Seed Priming Technology for Sustainable Agriculture—Recent Developments and Future Perspectives. J. Nanobiotechnology 2022, 20. [Google Scholar] [CrossRef] [PubMed]
- Song, K.; He, X. How to Improve Seed Germination with Green Nanopriming. Seed Science and Technology 2021, 49, 81–92. [Google Scholar] [CrossRef]
- Ntolia, A.; Chatzigiannakou, T.; Michailidis, N.; Aggeli, A. A Comprehensive Physicochemical Characterization of Silver Nanoparticles as a Prerequisite for Their Successful Biomedical Applications. Inorganics (Basel). 2025, 13. [Google Scholar] [CrossRef]
- Ahangar, E. The PH Role in Nanotechnology, Electrochemistry, and Nano-Drug Delivery Vol. 41.
- Masarudin, M.J.; Cutts, S.M.; Evison, B.J.; Phillips, D.R.; Pigram, P.J. Factors Determining the Stability, Size Distribution, and Cellular Accumulation of Small, Monodisperse Chitosan Nanoparticles as Candidate Vectors for Anticancer Drug Delivery: Application to the Passive Encapsulation of [14C]-Doxorubicin. Nanotechnol. Sci. Appl. 2015, 8, 67–80. [Google Scholar] [CrossRef]
- Saratale, R.G.; Shin, H.S.; Kumar, G.; Benelli, G.; Ghodake, G.S.; Jiang, Y.Y.; Kim, D.S.; Saratale, G.D. Exploiting Fruit Byproducts for Eco-Friendly Nanosynthesis: Citrus × Clementina Peel Extract Mediated Fabrication of Silver Nanoparticles with High Efficacy against Microbial Pathogens and Rat Glial Tumor C6 Cells. Environmental Science and Pollution Research 2018, 25, 10250–10263. [Google Scholar] [CrossRef]
- Pasieczna-Patkowska, S.; Cichy, M.; Flieger, J. Application of Fourier Transform Infrared (FTIR) Spectroscopy in Characterization of Green Synthesized Nanoparticles. Molecules 2025, 30. [Google Scholar] [CrossRef] [PubMed]
- Nikam, S.A.; Chaudhari, S.P. Biosynthesis of Silver Nanoparticles from Polyphenolic Extract of Baliospermun Solanifolium Using Central Composite Design. Pharmacognosy Res. 2022, 14, 405–411. [Google Scholar] [CrossRef]
- Rautela, A.; Rani, J.; Debnath (Das), M. Green Synthesis of Silver Nanoparticles from Tectona Grandis Seeds Extract: Characterization and Mechanism of Antimicrobial Action on Different Microorganisms. J. Anal. Sci. Technol. 2019, 10. [Google Scholar] [CrossRef]
- Kayed, K.; Issa, M.; Al-ourabi, H. The FTIR Spectra of Ag/Ag2O Composites Doped with Silver Nanoparticles. J. Exp. Nanosci. 2024, 19. [Google Scholar] [CrossRef]
- Malik, M.A.; Batterjee, M.G.; Kamli, M.R.; Alzahrani, K.A.; Danish, E.Y.; Nabi, A. Polyphenol-Capped Biogenic Synthesis of Noble Metallic Silver Nanoparticles for Antifungal Activity against Candida Auris. Journal of Fungi 2022, 8. [Google Scholar] [CrossRef]
- Edo, G.I.; Mafe, A.N.; Ali, A.B.M.; Akpoghelie, P.O.; Yousif, E.; Isoje, E.F.; Igbuku, U.A.; Zainulabdeen, K.; Owheruo, J.O.; Essaghah, A.E.A.; et al. Eco-Friendly Nanoparticle Phytosynthesis via Plant Extracts: Mechanistic Insights, Recent Advances, and Multifaceted Uses. Nano TransMed 2025, 4. [Google Scholar] [CrossRef]
- Hasan, S.M.; Hussain, S.; Yousuf, M.; Tapia-Hernández, J.A.; Raja, D.A. Protein-Based Silver Nanoparticles: Synthesis, Characterization, Administration, and Nanomedicine Applications. Int. J. Biomater. 2025, 2025. [Google Scholar] [CrossRef] [PubMed]
- Chugh, G.; Singh, B.R.; Adholeya, A.; Barrow, C.J. Role of Proteins in the Biosynthesis and Functioning of Metallic Nanoparticles. Crit. Rev. Biotechnol. 2022, 42, 1045–1060. [Google Scholar] [CrossRef] [PubMed]
- Hietzschold, S.; Walter, A.; Davis, C.; Taylor, A.A.; Sepunaru, L. Does Nitrate Reductase Play a Role in Silver Nanoparticle Synthesis? Evidence for NADPH as the Sole Reducing Agent. ACS Sustain. Chem. Eng. 2019, 7, 8070–8076. [Google Scholar] [CrossRef]
- Ahmed, K.B.A.; Senthilnathan, R.; Megarajan, S.; Anbazhagan, V. Sunlight Mediated Synthesis of Silver Nanoparticles Using Redox Phytoprotein and Their Application in Catalysis and Colorimetric Mercury Sensing. J. Photochem. Photobiol. B 2015, 151, 39–45. [Google Scholar] [CrossRef]
- Černý, M.; Habánová, H.; Berka, M.; Luklová, M.; Brzobohatý, B. Hydrogen Peroxide: Its Role in Plant Biology and Crosstalk with Signalling Networks. Int. J. Mol. Sci. 2018, 19. [Google Scholar] [CrossRef]
- Yang, J.; Yue, L.; Yang, Z.; Miao, Y.; Ouyang, R.; Hu, Y. Metal-Based Nanomaterials: Work as Drugs and Carriers against Viral Infections. Nanomaterials 2021, 11. [Google Scholar] [CrossRef] [PubMed]
- Mohamed, Y.M.A.; Elshahawy, I.E. Antifungal Activity of Photo-Biosynthesized Silver Nanoparticles (AgNPs) from Organic Constituents in Orange Peel Extract against Phytopathogenic Macrophomina Phaseolina. Eur. J. Plant Pathol. 2022, 162, 725–738. [Google Scholar] [CrossRef]
- Kodak, M.; Pratim Sarma, M.; Shamim, M.Z.; Bordoloi, N. Green Synthesis Of Silver Nanoparticles Using Citrus Sinensis Peel Extract Vol. 11.
- Trouillas, P.; Marsal, P.; Siri, D.; Lazzaroni, R.; Duroux, J.L. A DFT Study of the Reactivity of OH Groups in Quercetin and Taxifolin Antioxidants: The Specificity of the 3-OH Site. Food Chem. 2006, 97, 679–688. [Google Scholar] [CrossRef]
- Bose, D.; Chatterjee, S. Biogenic Synthesis of Silver Nanoparticles Using Guava (Psidium Guajava) Leaf Extract and Its Antibacterial Activity against Pseudomonas Aeruginosa. Applied Nanoscience (Switzerland) 2016, 6, 895–901. [Google Scholar] [CrossRef]
- Chiorcea-Paquim, A.M. Electrochemistry of Flavonoids: A Comprehensive Review. Int. J. Mol. Sci. 2023, 24. [Google Scholar] [CrossRef] [PubMed]
- Shahidi, F.; Costa De Camargo, A.; Fuentes, J.; Speisky, H.; Shahidi, F.; Costa De Camargo, A.; Fuentes, J. Citation: Speisky, H Revisiting the Oxidation of Flavonoids: Loss, Conservation or Enhancement of Their Antioxidant Properties. 2022. [Google Scholar]
- Karthik, R.; Govindasamy, M.; Chen, S.-M.; Cheng, Y.-H.; Muthukrishnan, P.; Padmavathy, S.; Elangovan, A. Biosynthesis of Silver Nanoparticles by Using Camellia Japonica Leaf Extract for the Electrocatalytic Reduction of Nitrobenzene and Photocatalytic Degradation of Eosin-Y. J. Photochem. Photobiol. B 2017, 170, 164–172. [Google Scholar] [CrossRef]
- Paparella, S.; Araújo, S.S.; Rossi, G.; Wijayasinghe, M.; Carbonera, D.; Balestrazzi, A. Seed Priming: State of the Art and New Perspectives. Plant Cell Rep. 2015, 34, 1281–1293. [Google Scholar] [CrossRef]
- Lutts, S.; Benincasa, P.; Wojtyla, L.; Kubala, S.; Pace, R.; Lechowska, K.; Quinet, M.; Garnczarska, M. Seed Priming: New Comprehensive Approaches for an Old Empirical Technique. In New Challenges in Seed Biology - Basic and Translational Research Driving Seed Technology; InTech, 2016. [Google Scholar]
- Charachimwe, R.R.; Chandiposha, M.; Manjeru, P. The Effect of Seed Priming to Improve Germination Parameters and Early Growth of Chickpea (Cicer Arietnum L). International Journal of Agronomy 2023. [Google Scholar] [CrossRef]
- Ansari, M.; Ahmed, S.; Abbasi, A.; Khan, M.T.; Subhan, M.; Bukhari, N.A.; Hatamleh, A.A.; Abdelsalam, N.R. Plant Mediated Fabrication of Silver Nanoparticles, Process Optimization, and Impact on Tomato Plant. Sci. Rep. 2023, 13. [Google Scholar] [CrossRef] [PubMed]
- Rutkowski, M.; Krzemińska-Fiedorowicz, L.; Khachatryan, G.; Bulski, K.; Kołton, A.; Khachatryan, K. Biodegradable Silver Nanoparticles Gel and Its Impact on Tomato Seed Germination Rate in In Vitro Cultures. Applied Sciences (Switzerland) 2022, 12. [Google Scholar] [CrossRef]
- Sonawane, H.; Arya, S.; Math, S.; Shelke, D. Myco-Synthesized Silver and Titanium Oxide Nanoparticles as Seed Priming Agents to Promote Seed Germination and Seedling Growth of Solanum Lycopersicum: A Comparative Study. Int. Nano Lett. 2021, 11, 371–379. [Google Scholar] [CrossRef]
- Antunes, D.R.; Forini, M.M.L.H.; Coqueiro, Y.A.; Pontes, M.S.; Lima, P.H.C.; Cavalcante, L.A.F.; Sanches, A.O.; Caires, A.R.L.; Santiago, E.F.; Grillo, R. Effect of Hyaluronic Acid-Stabilized Silver Nanoparticles on Lettuce (Lactuca Sativa L.) Seed Germination. Chemosphere 2024, 364. [Google Scholar] [CrossRef]
- Méndez-Andrade, R.; Ruiz-Torres, N.A.; Wang, Y.; García-Cerda, L.A.; Vera-Reyes, I. Enhanced Tomato Seed Germination and Seedling Growth Through Oxidative Stress Using Biogenic Silver Nanoparticles. Terra Latinoamericana 2024, 42, 1–10. [Google Scholar] [CrossRef]
- Yang, L.; Zhang, L.; Zhang, Q.; Wei, J.; Zhao, X.; Zheng, Z.; Chen, B.; Xu, Z. Nanopriming Boost Seed Vigor: Deeper Insights into the Effect Mechanism. Plant Physiology and Biochemistry 2024, 214. [Google Scholar] [CrossRef]
- Karami Mehrian, S.; Heidari, R.; Rahmani, F.; Najafi, S. Effect of Chemical Synthesis Silver Nanoparticles on Germination Indices and Seedlings Growth in Seven Varieties of Lycopersicon Esculentum Mill (Tomato) Plants. J. Clust. Sci. 2016, 27, 327–340. [Google Scholar] [CrossRef]
- Bano, N.; Khan, S.; Hamid, Y.; Ullah, M.A.; Khan, A.G.; Bano, F.; Luo, J.; Li, T. Effect of Foliar Application of Nanoparticles on Growth, Physiology, and Antioxidant Enzyme Activities of Lettuce (Lactuca Sativa L.) Plants under Cadmium Toxicity. Environmental Science and Pollution Research 2023, 30, 99310–99325. [Google Scholar] [CrossRef] [PubMed]
- Jiang, L.; Xiang, S.; Lv, X.; Wang, X.; Li, F.; Liu, W.; Liu, C.; Ran, M.; Huang, J.; Xu, X.; et al. Biosynthesized Silver Nanoparticles Inhibit Pseudomonas Syringae Pv. Tabaci by Directly Destroying Bacteria and Inducing Plant Resistance in Nicotiana Benthamiana. Phytopathology Research 2022, 4. [Google Scholar] [CrossRef]
- Li, M.; Lei, T.; Li, J.; Li, X.; Wei, Z. Antibacterial Activity of Silver Nanoparticles against Xanthomonas Compestris Var. Compestris. ScienceAsia 2025, 51. [Google Scholar] [CrossRef]
- Khalifa, H.O.; Oreiby, A.; Mohammed, T.; Abdelhamid, M.A.A.; Sholkamy, E.N.; Hashem, H.; Fereig, R.M. Silver Nanoparticles as Next-Generation Antimicrobial Agents: Mechanisms, Challenges, and Innovations against Multidrug-Resistant Bacteria. Front. Cell. Infect. Microbiol. 2025, 15. [Google Scholar] [CrossRef]
- Loo, Y.Y.; Rukayadi, Y.; Nor-Khaizura, M.A.R.; Kuan, C.H.; Chieng, B.W.; Nishibuchi, M.; Radu, S. In Vitro Antimicrobial Activity of Green Synthesized Silver Nanoparticles against Selected Gram-Negative Foodborne Pathogens. Front. Microbiol. 2018, 9. [Google Scholar] [CrossRef]
- Zhang, H.; Zheng, T.; Wang, Y.; Li, T.; Chi, Q. Multifaceted Impacts of Nanoparticles on Plant Nutrient Absorption and Soil Microbial Communities. Front. Plant Sci. 2024, 15. [Google Scholar] [CrossRef] [PubMed]
- Mikhailova, E.O. Silver Nanoparticles: Mechanism of Action and Probable Bio-Application. J. Funct. Biomater. 2020, 11. [Google Scholar] [CrossRef]
- Zheng, S.; Zhou, Q.; Chen, C.; Yang, F.; Cai, Z.; Li, D.; Geng, Q.; Feng, Y.; Wang, H. Role of Extracellular Polymeric Substances on the Behavior and Toxicity of Silver Nanoparticles and Ions to Green Algae Chlorella Vulgaris. Science of the Total Environment 2019, 660, 1182–1190. [Google Scholar] [CrossRef]
- Elfadadny, A.; Ragab, R.F.; AlHarbi, M.; Badshah, F.; Ibáñez-Arancibia, E.; Farag, A.; Hendawy, A.O.; De los Ríos-Escalante, P.R.; Aboubakr, M.; Zakai, S.A.; et al. Antimicrobial Resistance of Pseudomonas Aeruginosa: Navigating Clinical Impacts, Current Resistance Trends, and Innovations in Breaking Therapies. Front. Microbiol. 2024, 15. [Google Scholar] [CrossRef] [PubMed]
- Kamer, A.M.A.; El Maghraby, G.M.; Shafik, M.M.; Al-Madboly, L.A. Silver Nanoparticle with Potential Antimicrobial and Antibiofilm Efficiency against Multiple Drug Resistant, Extensive Drug Resistant Pseudomonas Aeruginosa Clinical Isolates. BMC Microbiol. 2024, 24. [Google Scholar] [CrossRef]
- Trzcińska-Wencel, J.; Wypij, M.; Terzyk, A.P.; Rai, M.; Golińska, P. Biofabrication of Novel Silver and Zinc Oxide Nanoparticles from Fusarium Solani IOR 825 and Their Potential Application in Agriculture as Biocontrol Agents of Phytopathogens, and Seed Germination and Seedling Growth Promoters. Front. Chem. 2023, 11. [Google Scholar] [CrossRef] [PubMed]
- More, P.R.; Pandit, S.; De Filippis, A.; Franci, G.; Mijakovic, I.; Galdiero, M. Silver Nanoparticles: Bactericidal and Mechanistic Approach against Drug Resistant Pathogens. Microorganisms 2023, 11. [Google Scholar] [CrossRef] [PubMed]
- Shahid, A.; Faizan, M.; Raza, M.A. POTENTIAL ROLE OF SILVER NANOPARTICLES (AgNPs) AND ZINC NANOPARTICLES (ZnNPs) FOR PLANT DISEASE MANAGEMENT. Agrobiological Records 2023, 14, 59–69. [Google Scholar] [CrossRef]
- Rodrigues, A.S.; Batista, J.G.S.; Rodrigues, M.Á.V.; Thipe, V.C.; Minarini, L.A.R.; Lopes, P.S.; Lugão, A.B. Advances in Silver Nanoparticles: A Comprehensive Review on Their Potential as Antimicrobial Agents and Their Mechanisms of Action Elucidated by Proteomics. Front. Microbiol. 2024, 15. [Google Scholar] [CrossRef]
- Prathna, T.C.; Chandrasekaran, N.; Raichur, A.M.; Mukherjee, A. Biomimetic Synthesis of Silver Nanoparticles by Citrus Limon (Lemon) Aqueous Extract and Theoretical Prediction of Particle Size. Colloids Surf. B Biointerfaces 2011, 82, 152–159. [Google Scholar] [CrossRef]
- Kaviya, S.; Santhanalakshmi, J.; Viswanathan, B.; Muthumary, J.; Srinivasan, K. Biosynthesis of Silver Nanoparticles Using Citrus Sinensis Peel Extract and Its Antibacterial Activity. Spectrochim. Acta A Mol. Biomol. Spectrosc. 2011, 79, 594–598. [Google Scholar] [CrossRef]
- Dell’Annunziata, F.; Mosidze, E.; Folliero, V.; Lamparelli, E.P.; Lopardo, V.; Pagliano, P.; Porta, G. Della; Galdiero, M.; Bakuridze, A.D.; Franci, G. Eco-Friendly Synthesis of Silver Nanoparticles from Peel and Juice C. Limon and Their Antiviral Efficacy against HSV-1 and SARS-CoV-2. Virus Res. 2024, 349. [Google Scholar] [CrossRef]
- Niluxsshun, M.C.D.; Masilamani, K.; Mathiventhan, U. Green Synthesis of Silver Nanoparticles from the Extracts of Fruit Peel of Citrus Tangerina, Citrus Sinensis, and Citrus Limon for Antibacterial Activities. Bioinorg. Chem. Appl. 2021, 2021. [Google Scholar] [CrossRef]
- Vi Thien Thao, N.; Thi Mai, N.; Do Thanh Thang, T.; Huy Vu, P.; Thi Luong, N.; Thi Hong Thuy, L. OPTIMISATION OF THE GREEN SYNTHESIS PROCESS OF COPPER NANOPARTICLES USING LIME (Citrus Aurantifolia) EXTRACT USING RESPONSE SURFACE METHODOLOGY WITH THE BOX-BEHNKEN MODEL; 2025; Vol. 25. [Google Scholar]
- Chand, K.; Cao, D.; Eldin Fouad, D.; Hussain Shah, A.; Qadeer Dayo, A.; Zhu, K.; Nazim Lakhan, M.; Mehdi, G.; Dong, S. Green Synthesis, Characterization and Photocatalytic Application of Silver Nanoparticles Synthesized by Various Plant Extracts. Arabian Journal of Chemistry 2020, 13, 8248–8261. [Google Scholar] [CrossRef]
- Batth, T.S.; Tollenaere, M.A.X.; Rüther, P.; Gonzalez-Franquesa, A.; Prabhakar, B.S.; Bekker-Jensen, S.; Deshmukh, A.S.; Olsen, J. V. Protein Aggregation Capture on Microparticles Enables Multipurpose Proteomics Sample Preparation. Molecular and Cellular Proteomics 2019, 18, 1027–1035. [Google Scholar] [CrossRef] [PubMed]
- Törönen, P.; Medlar, A.; Holm, L. PANNZER2: A Rapid Functional Annotation Web Server. Nucleic Acids Res. 2018, 46, W84–W88. [Google Scholar] [CrossRef] [PubMed]
- Supek, F.; Bošnjak, M.; Škunca, N.; Šmuc, T. Revigo Summarizes and Visualizes Long Lists of Gene Ontology Terms. PLoS One 2011, 6. [Google Scholar] [CrossRef]
- Abenavoli, M.R.; Cacco, G.; Sorgonà, A.; Marabottini, R.; Paolacci, A.R.; Ciaffi, M.; Badiani, M. The Inhibitory Effects of Coumarin on the Germination of Durum Wheat (Triticum Turgidum Ssp. Durum, CV. Simeto) Seeds. J. Chem. Ecol. 2006, 32, 489–506. [Google Scholar] [CrossRef] [PubMed]
- Bewley, J.D.; Bradford, K.J.; Hilhorst, H.W.M.; Nonogaki, H. Seeds: Physiology of Development, Germination and Dormancy; 2013. [Google Scholar]
Figure 1.
UV–Vis spectra of Ber-AgNPs synthesis using optimized reaction parameters (0.1% of the BPE extract, pH 8.5 of the mixture, 1:1 ratio of BPE:AgNO3 concentration, 25°C of the incubation temperature, 24 h of incubation time).
Figure 1.
UV–Vis spectra of Ber-AgNPs synthesis using optimized reaction parameters (0.1% of the BPE extract, pH 8.5 of the mixture, 1:1 ratio of BPE:AgNO3 concentration, 25°C of the incubation temperature, 24 h of incubation time).
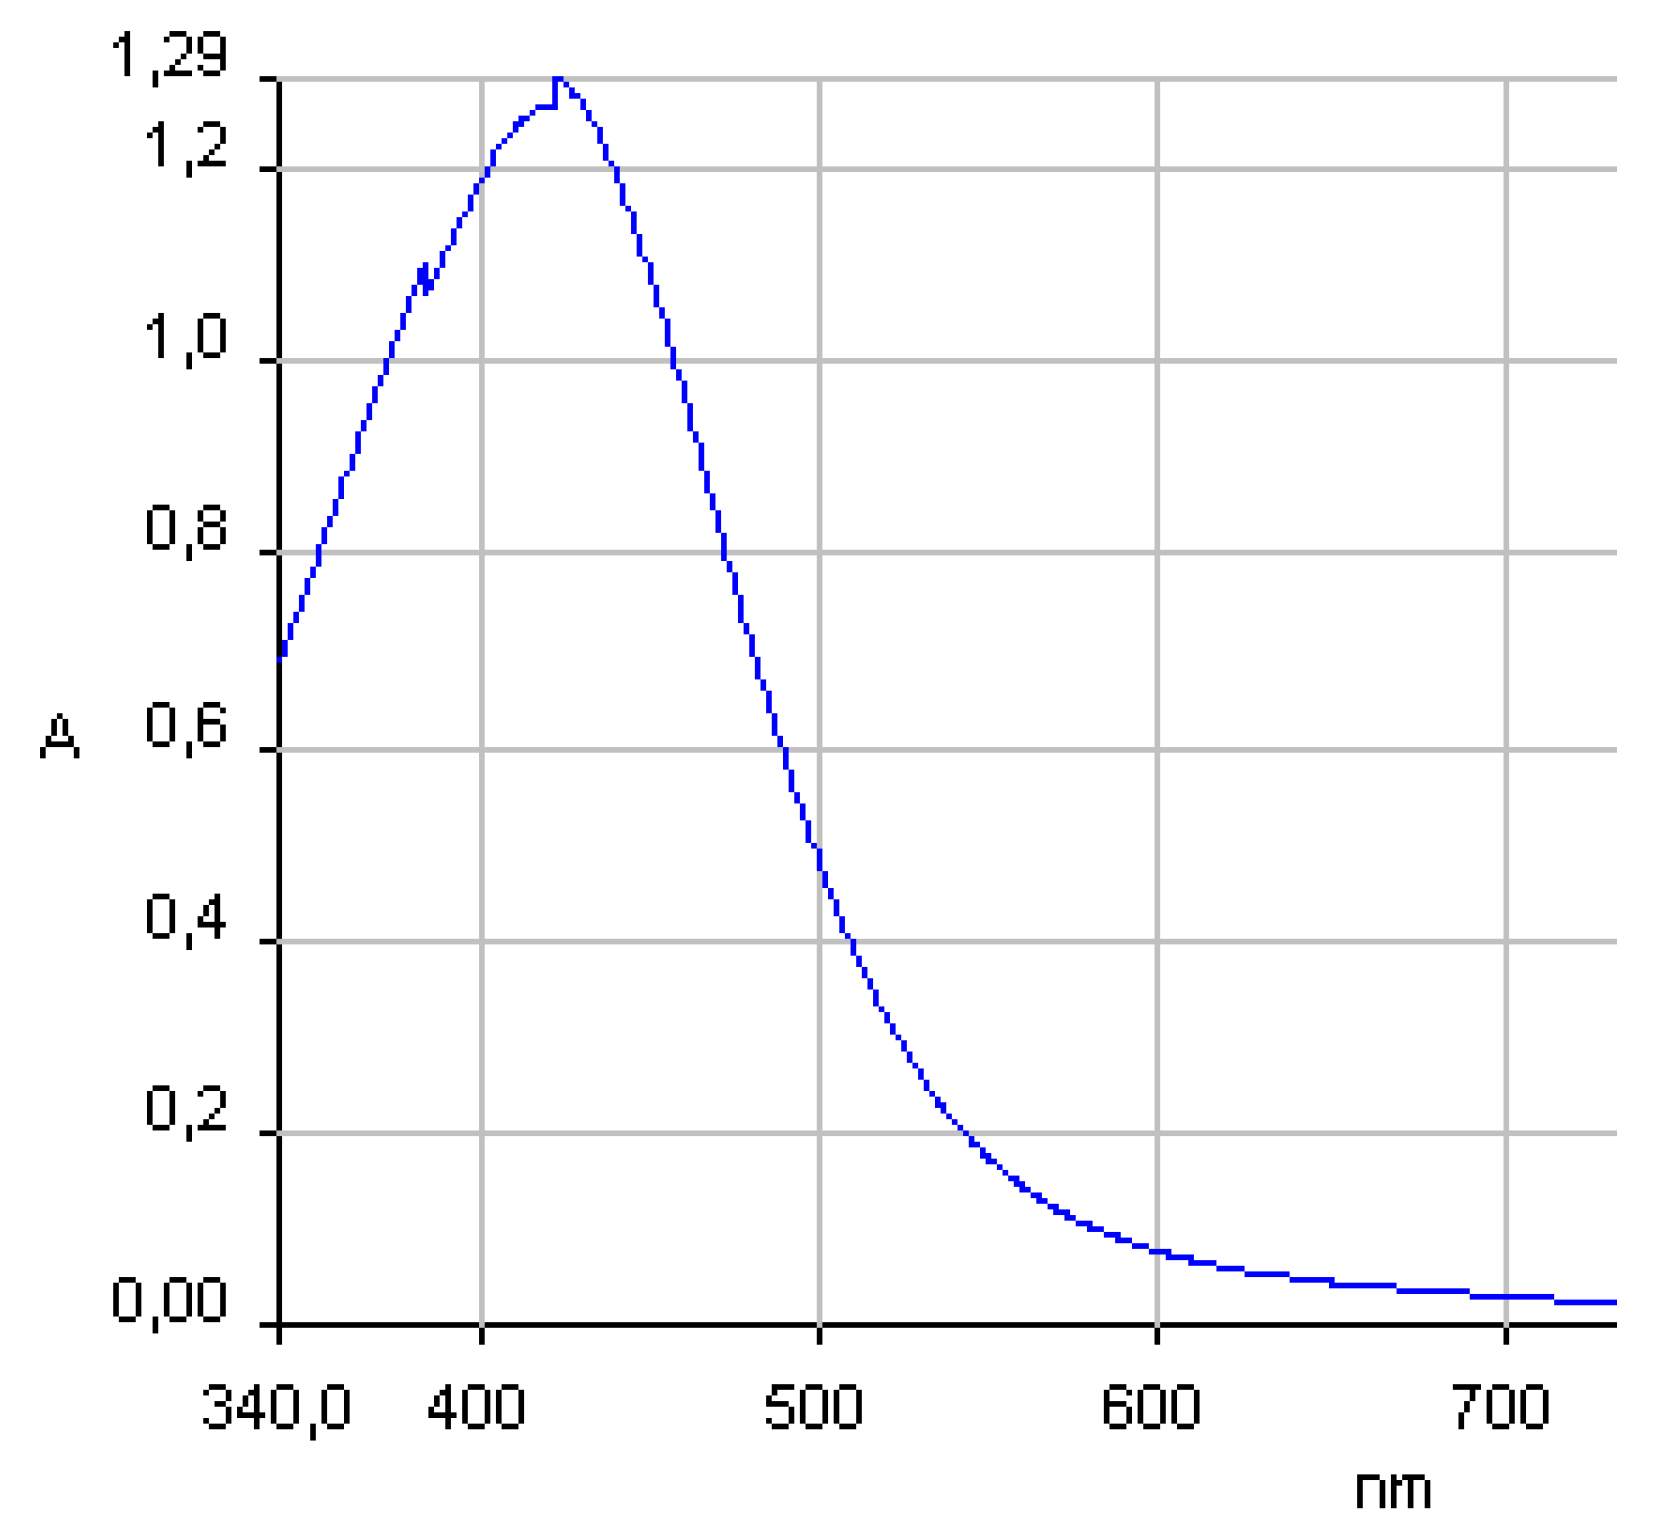
Figure 2.
High resolution (a) transmission and (b) scanning trasmission electron microscopic image of Ber-AgNP.
Figure 2.
High resolution (a) transmission and (b) scanning trasmission electron microscopic image of Ber-AgNP.
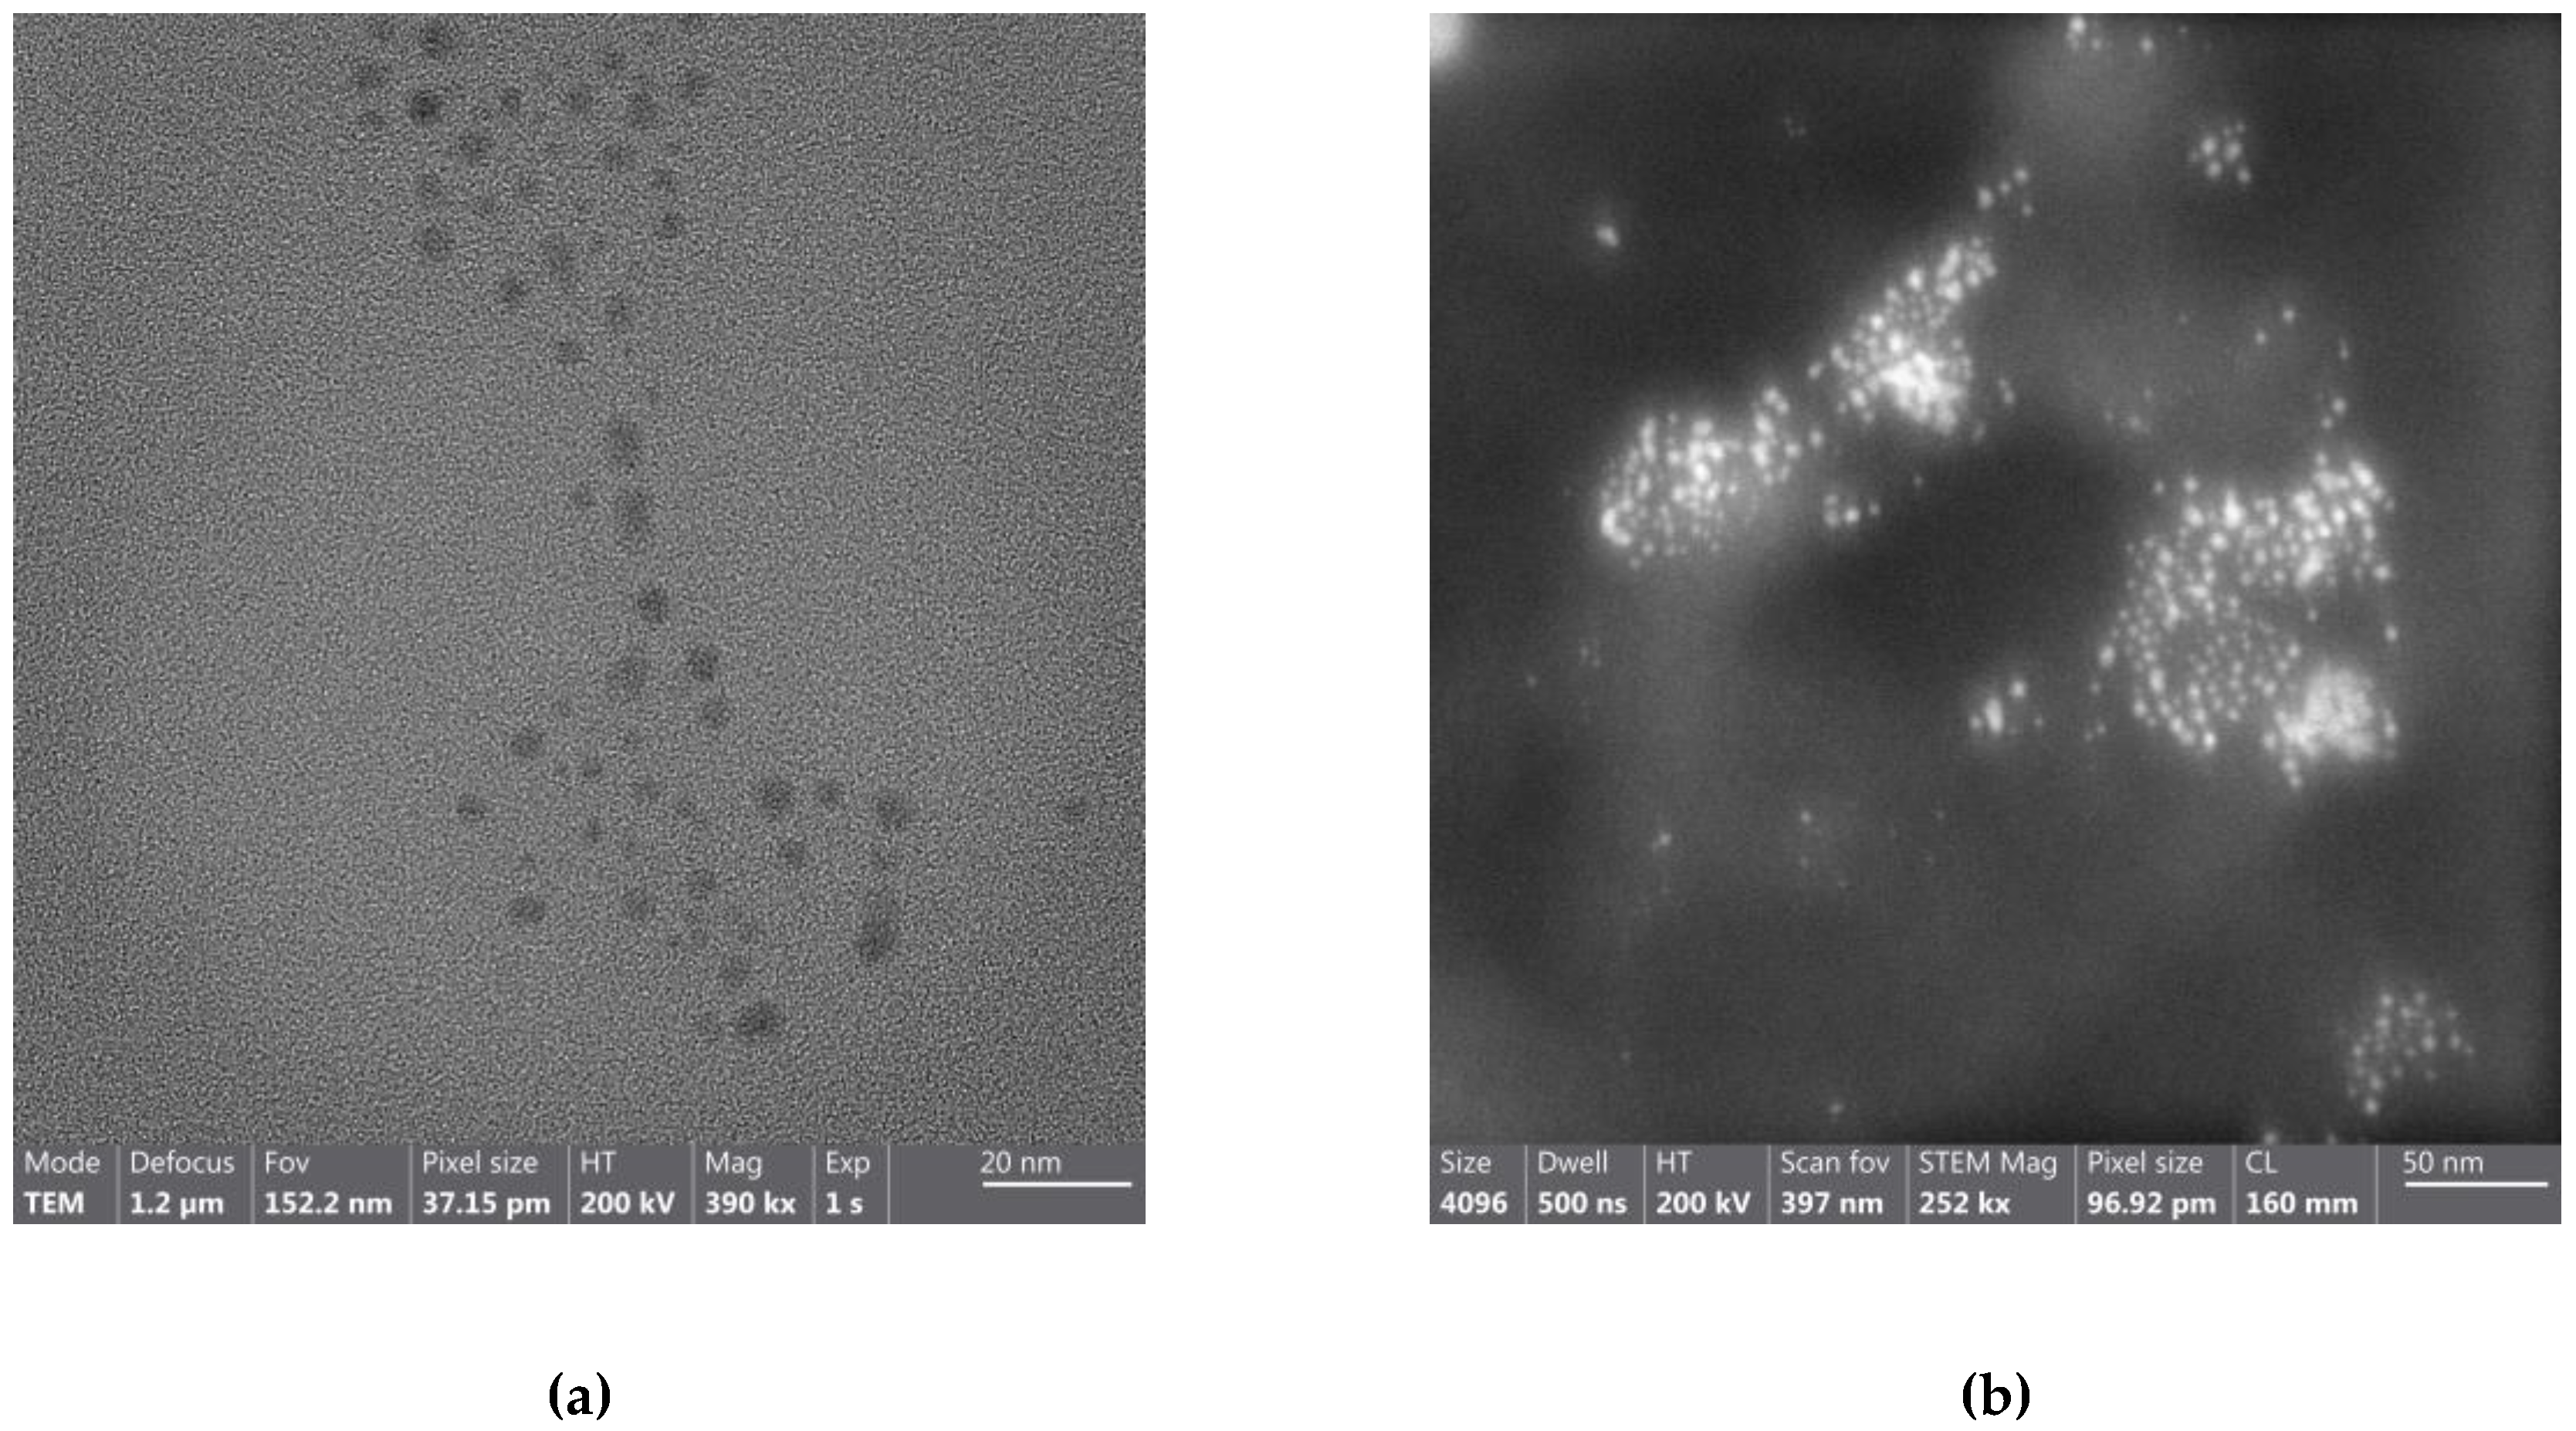
Figure 3.
Fourier Transform Infrared-Attenuated Total Reflection (FTIR-ATR) spectrum of BPE
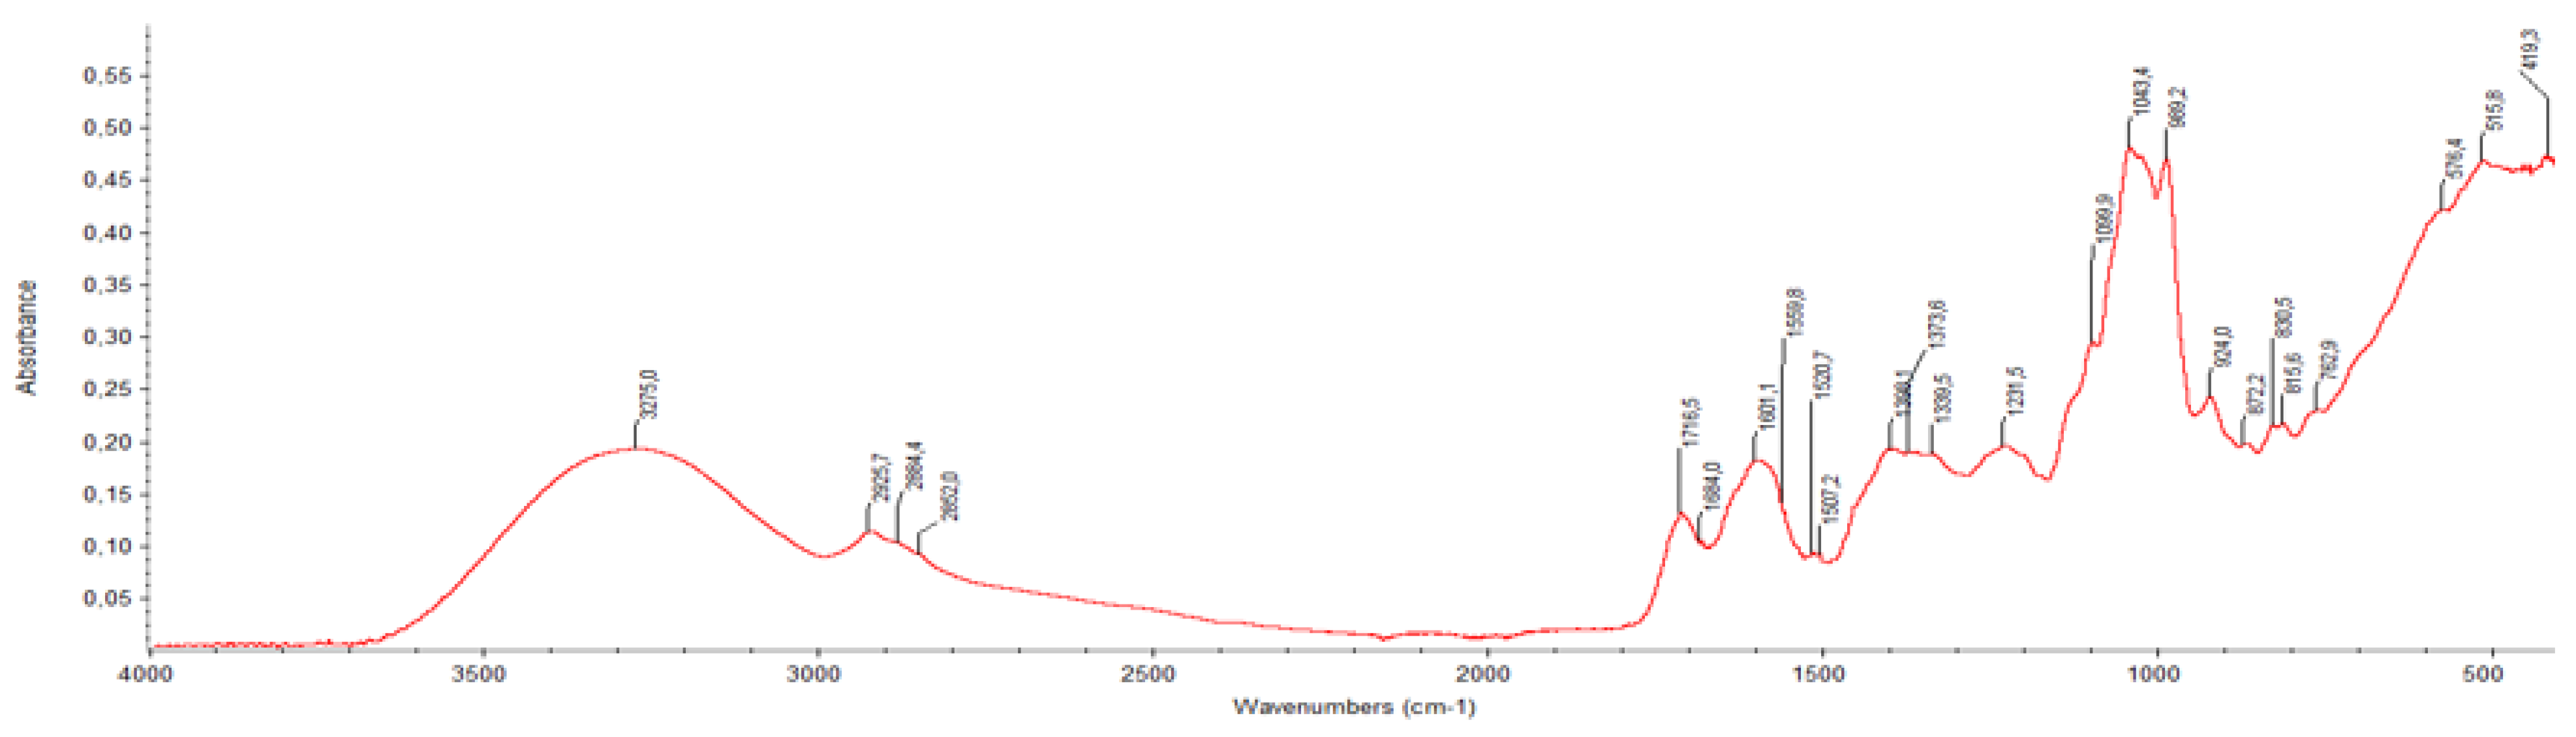
Figure 4.
FTIR-ATR spectrum of Ber-AgNPs
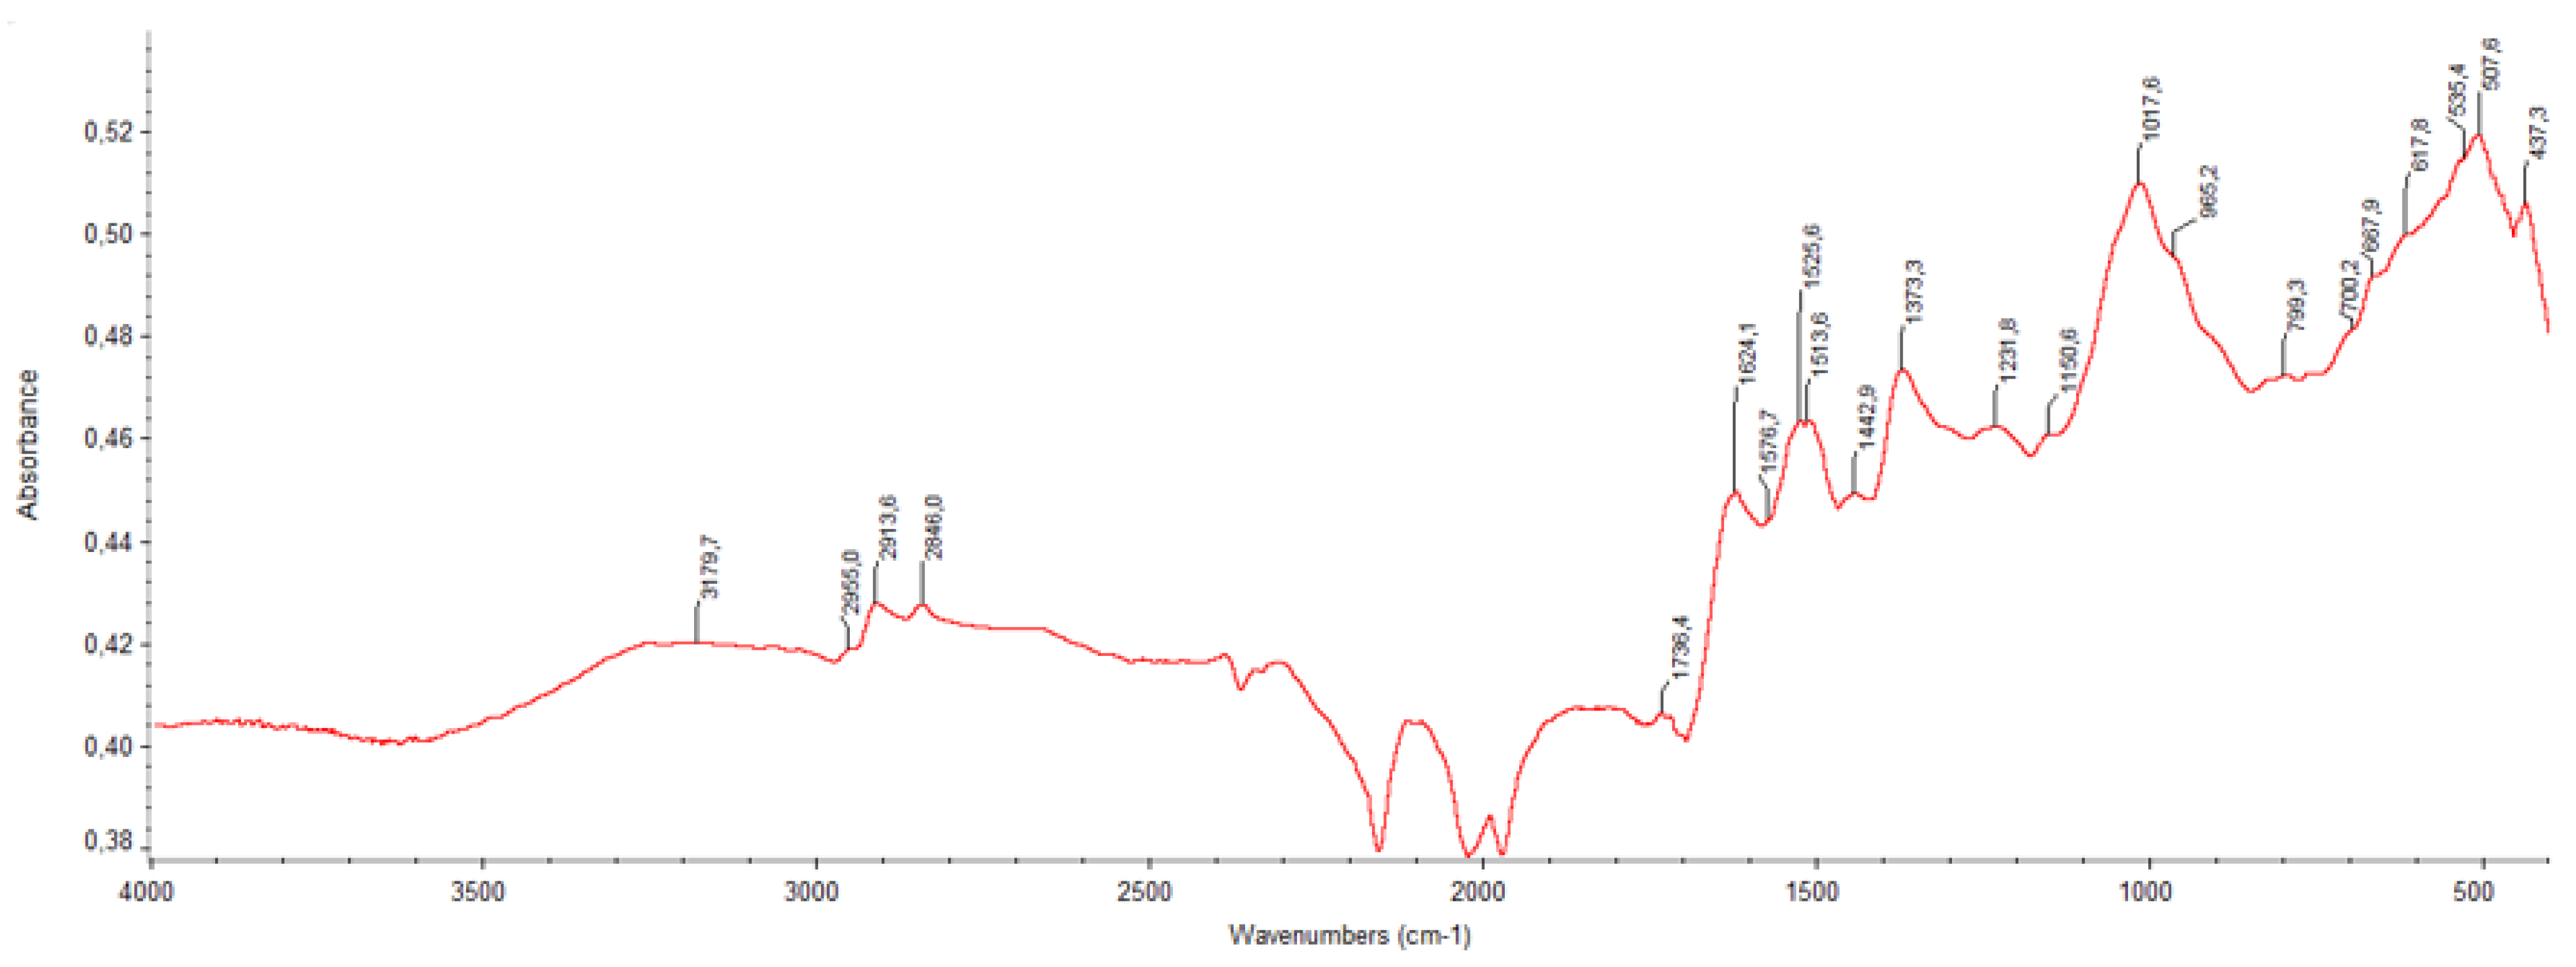
Figure 5.
Dot plot of annotated proteins. ARGOT_PPV (Positive Predictive Value) represents the estimated probability that a given Gene Ontology annotation is correct, providing a measure of annotation confidence, while ARGOT score reflects the overall strength of the functional prediction based on sequence similarity and supporting evidence. Quantity indicates the relative protein abundance derived from DIA-based quantitative proteomic analysis.
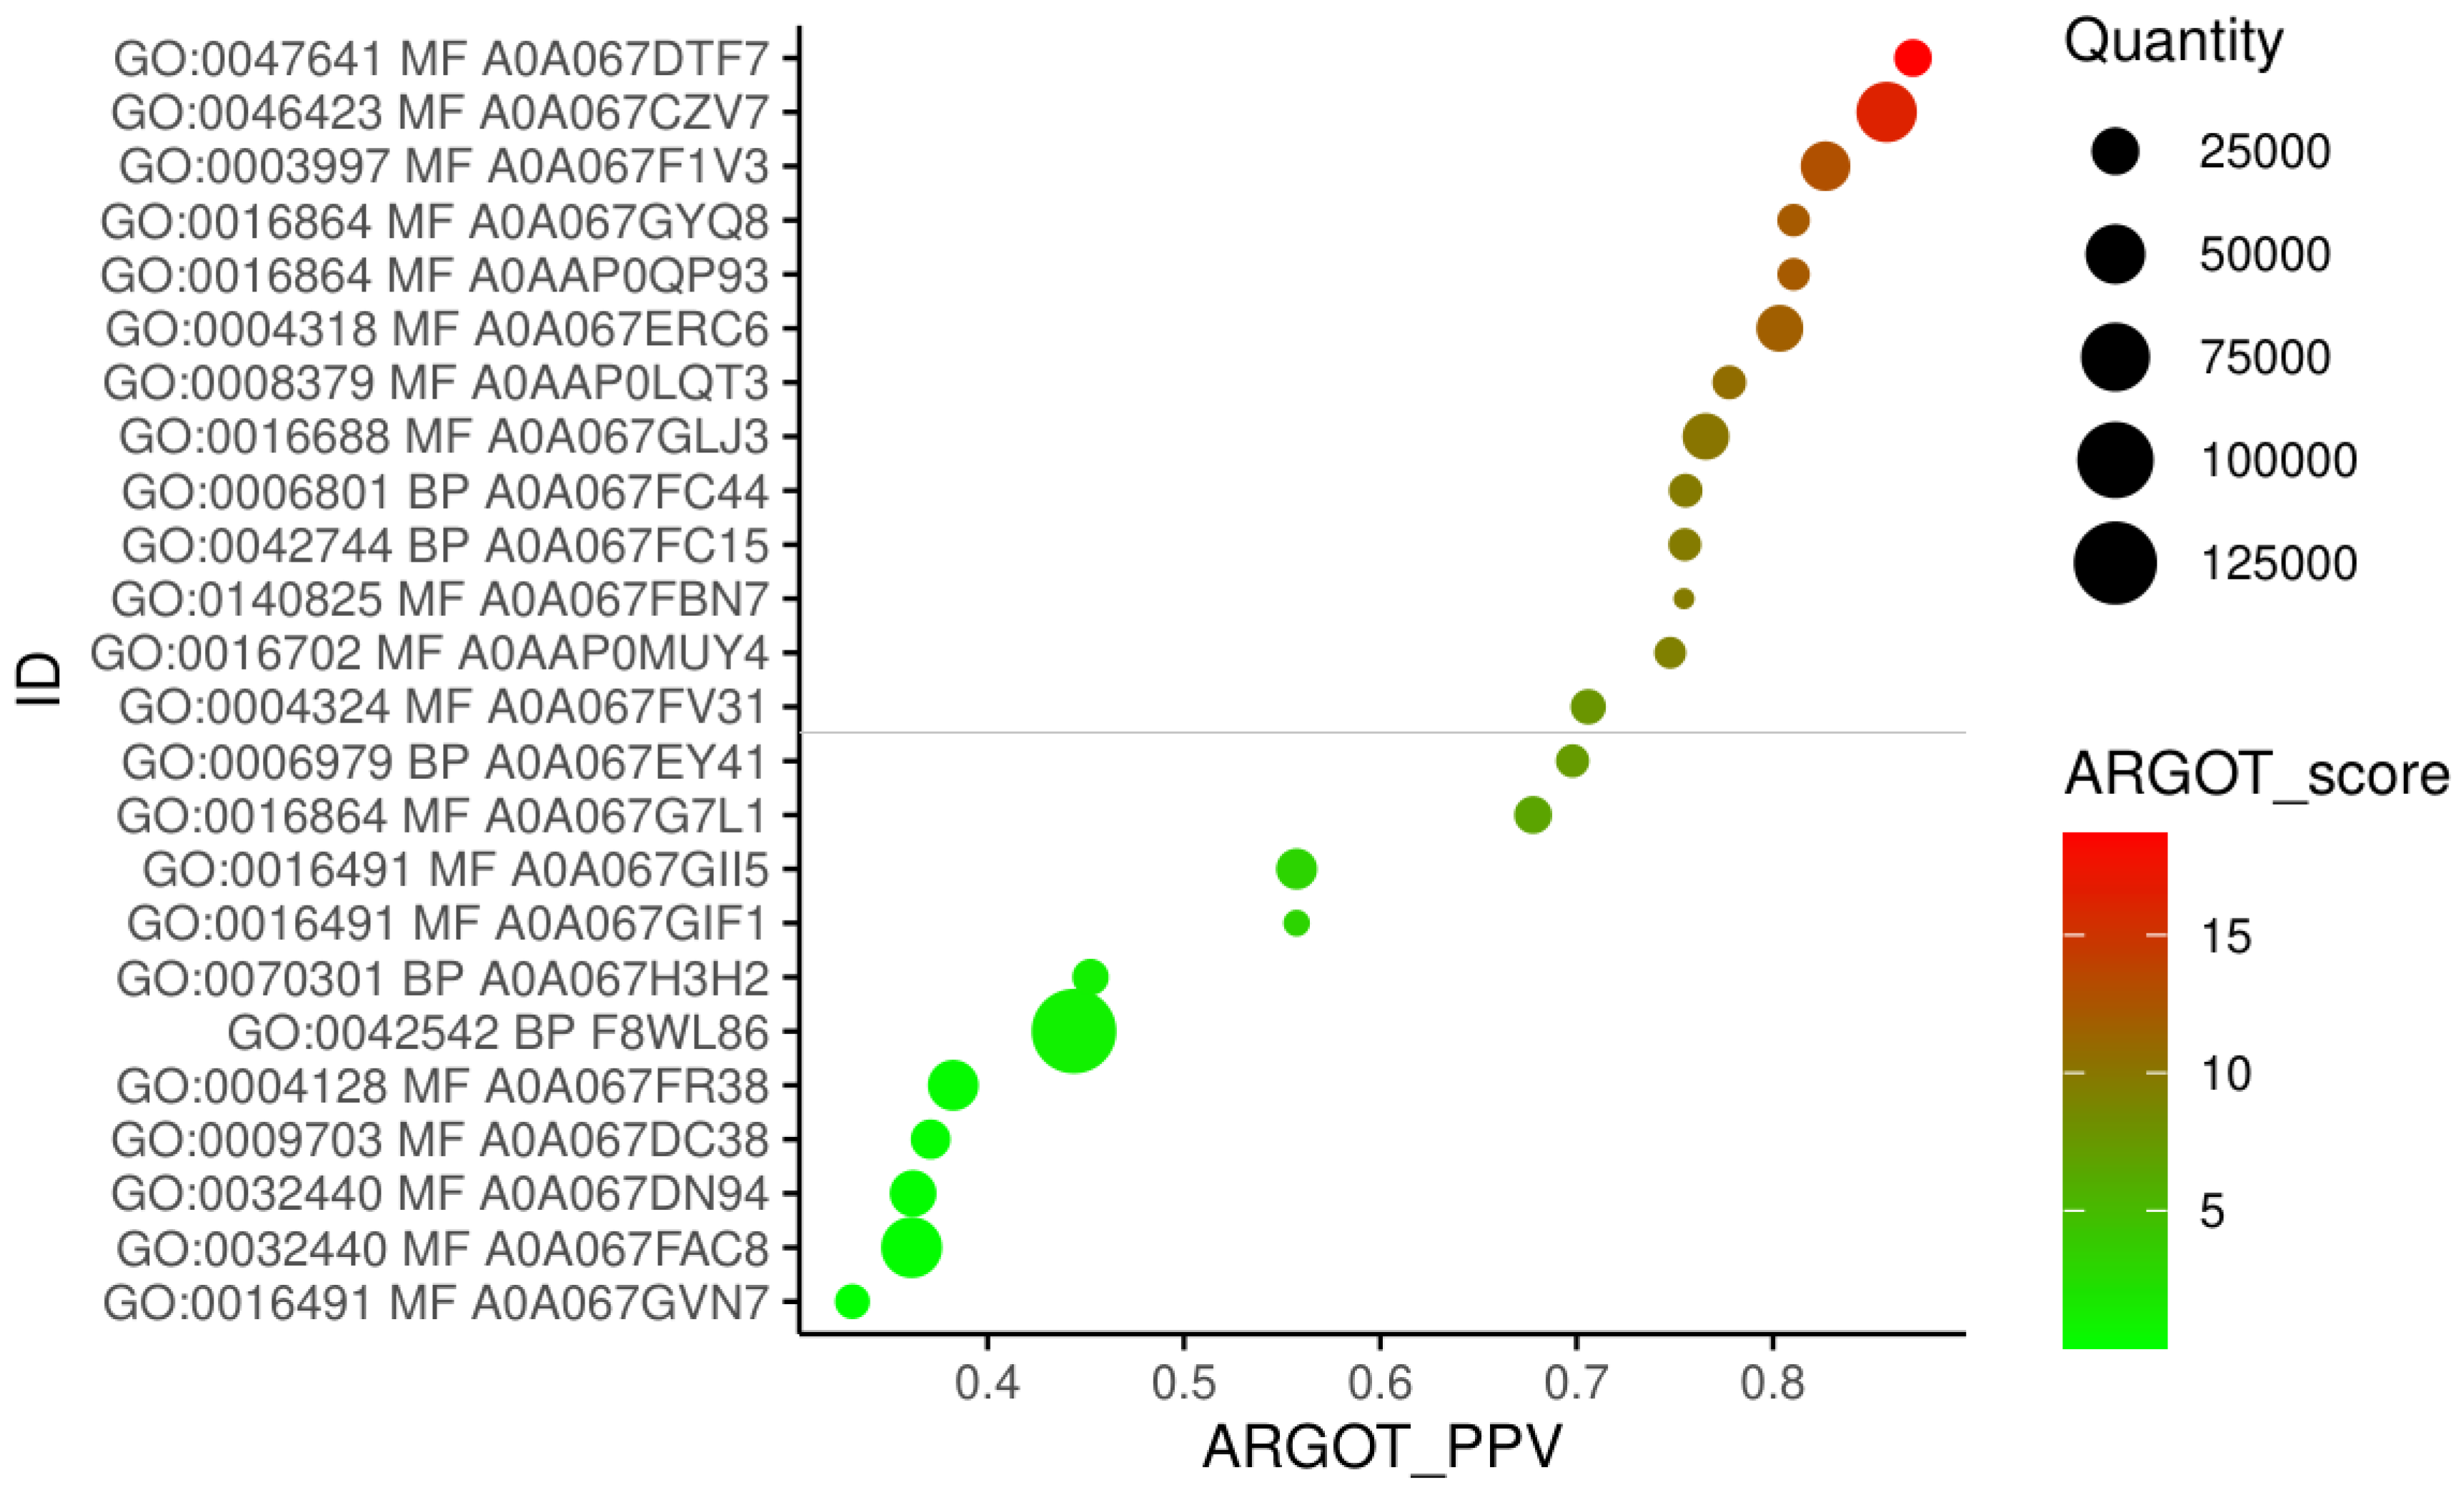
Figure 6.
Figure 6. Schematic representation of putative biosynthesis of Ber-AgNPs
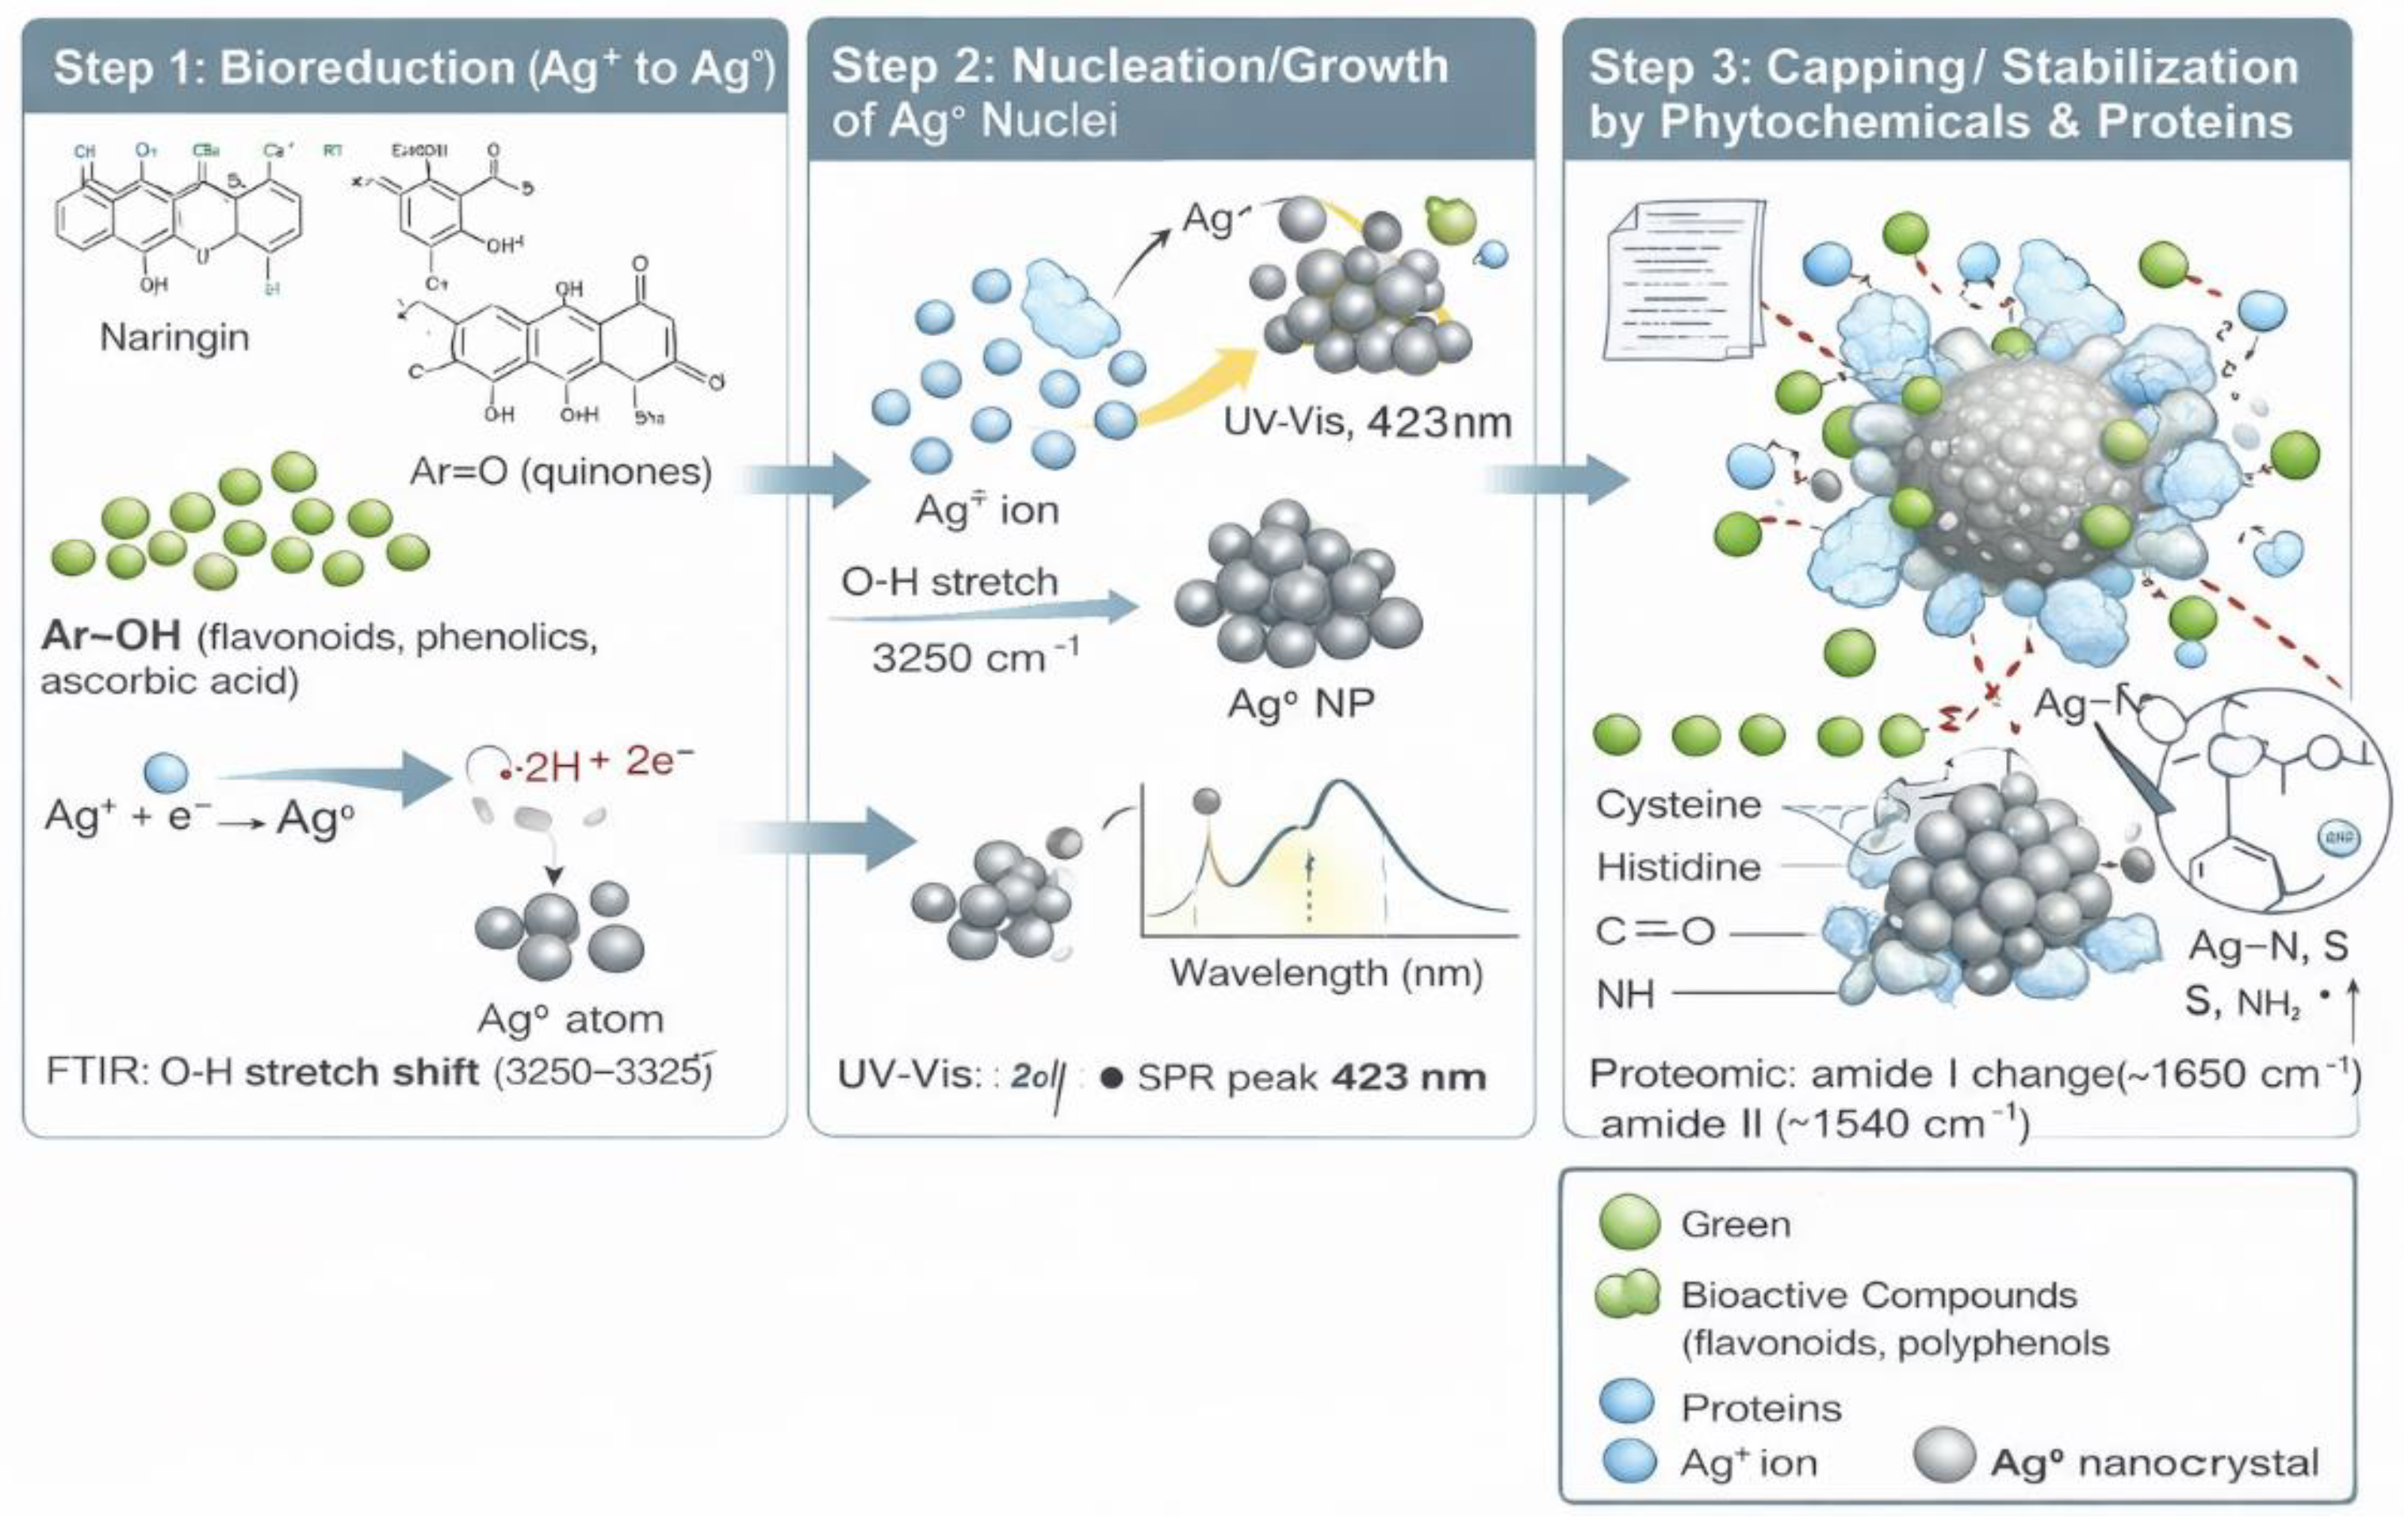
Figure 7.
(a) Seedling Vigour Index (SVI) and (b) seedling length (mm) of tomato seeds primed with different Ber-AgNPs concentrations (0.5, 5 and 10 µg/mL) and water (HP) and not primed (UP). Significant differences among means are represented by different letters in treatment bars (Tukey’s test, p < 0.05, n=4). Vertical lines with caps represent the ± standard error.
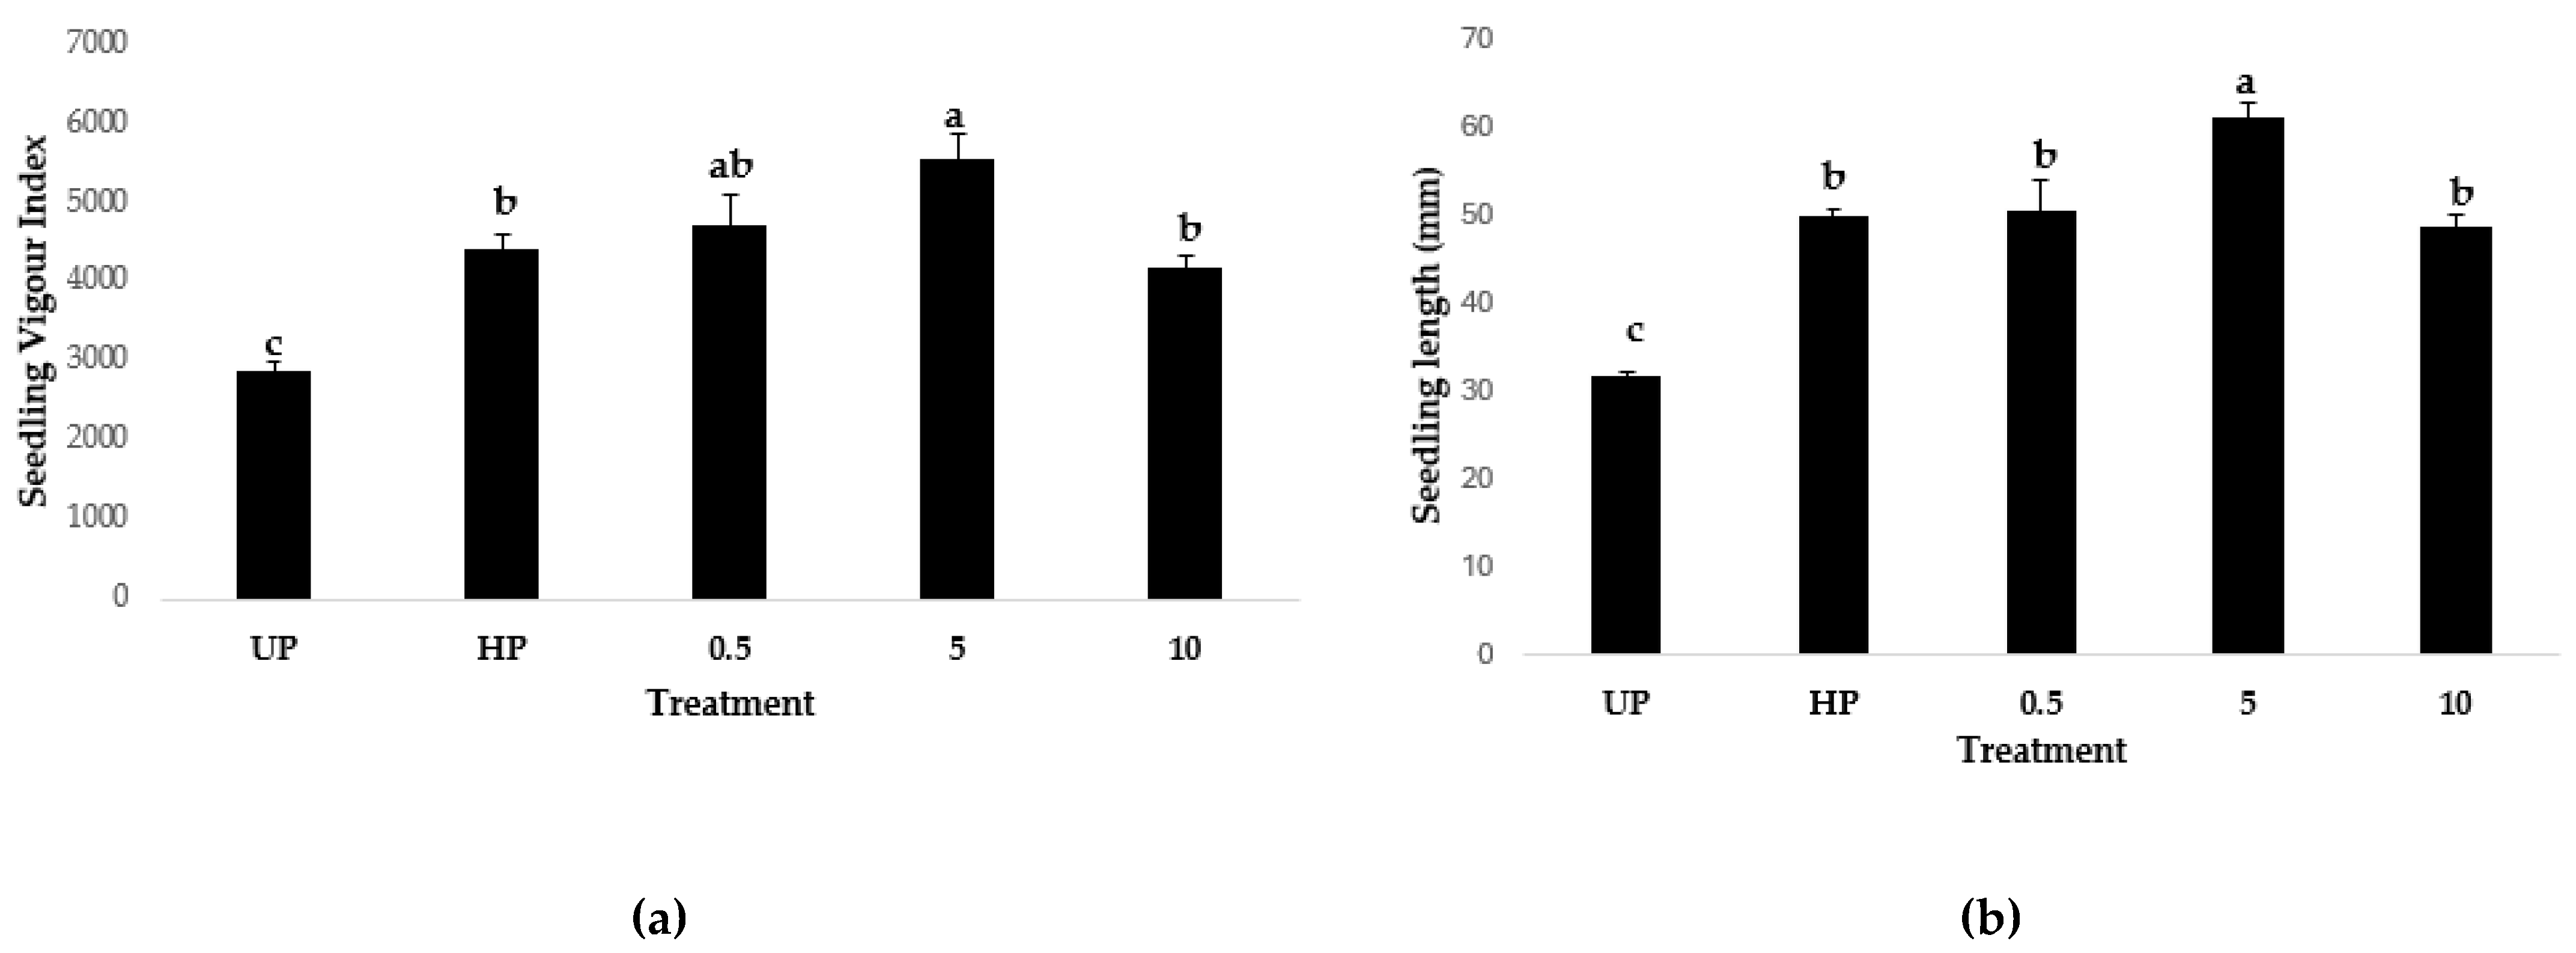
Figure 8.
(a) Seedling Vigour Index (SVI) and (b) seedling length (mm) of lettuce seeds primed with different Ber-AgNPs concentrations (0.1, 0.5, 5 and 50 µg/mL) and water (HP) and not primed (UP). Significant differences among means are represented by different letters in treatment bars (Tukey’s test, p < 0.05, n=4). Vertical lines with caps represent the ± standard error.
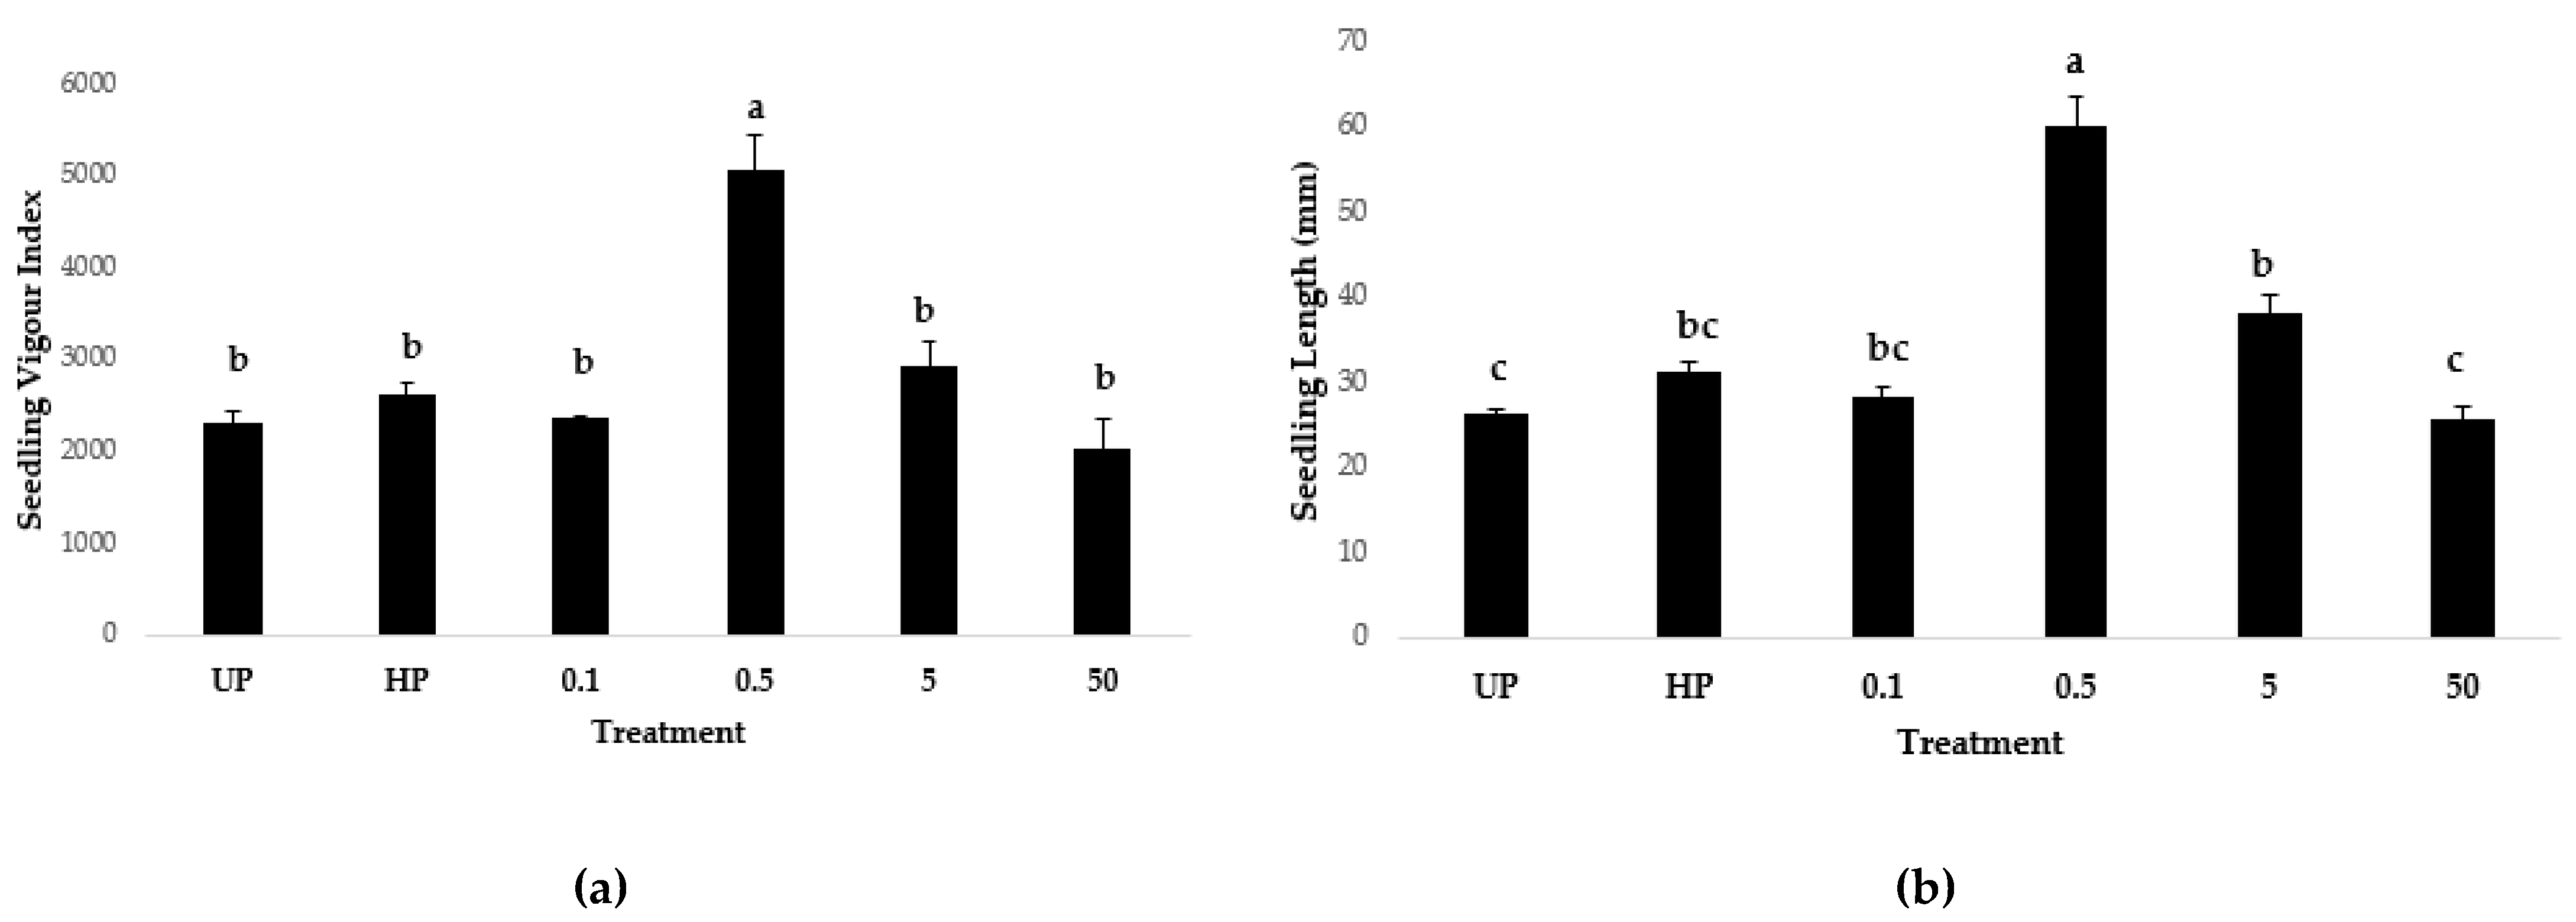
Figure 9.
(a) Seedling Vigour Index (SVI) and (b) seedling length (mm) of tomato seeds primed with 5 µg/mL Ber-AgNPs and water (HP) for different priming time (8h and 24h) and not primed seeds (UP). Significant differences among means are represented by different letters in treatment bars (Tukey’s test, p < 0.05, n=4). Vertical lines with caps represent the ± standard error.
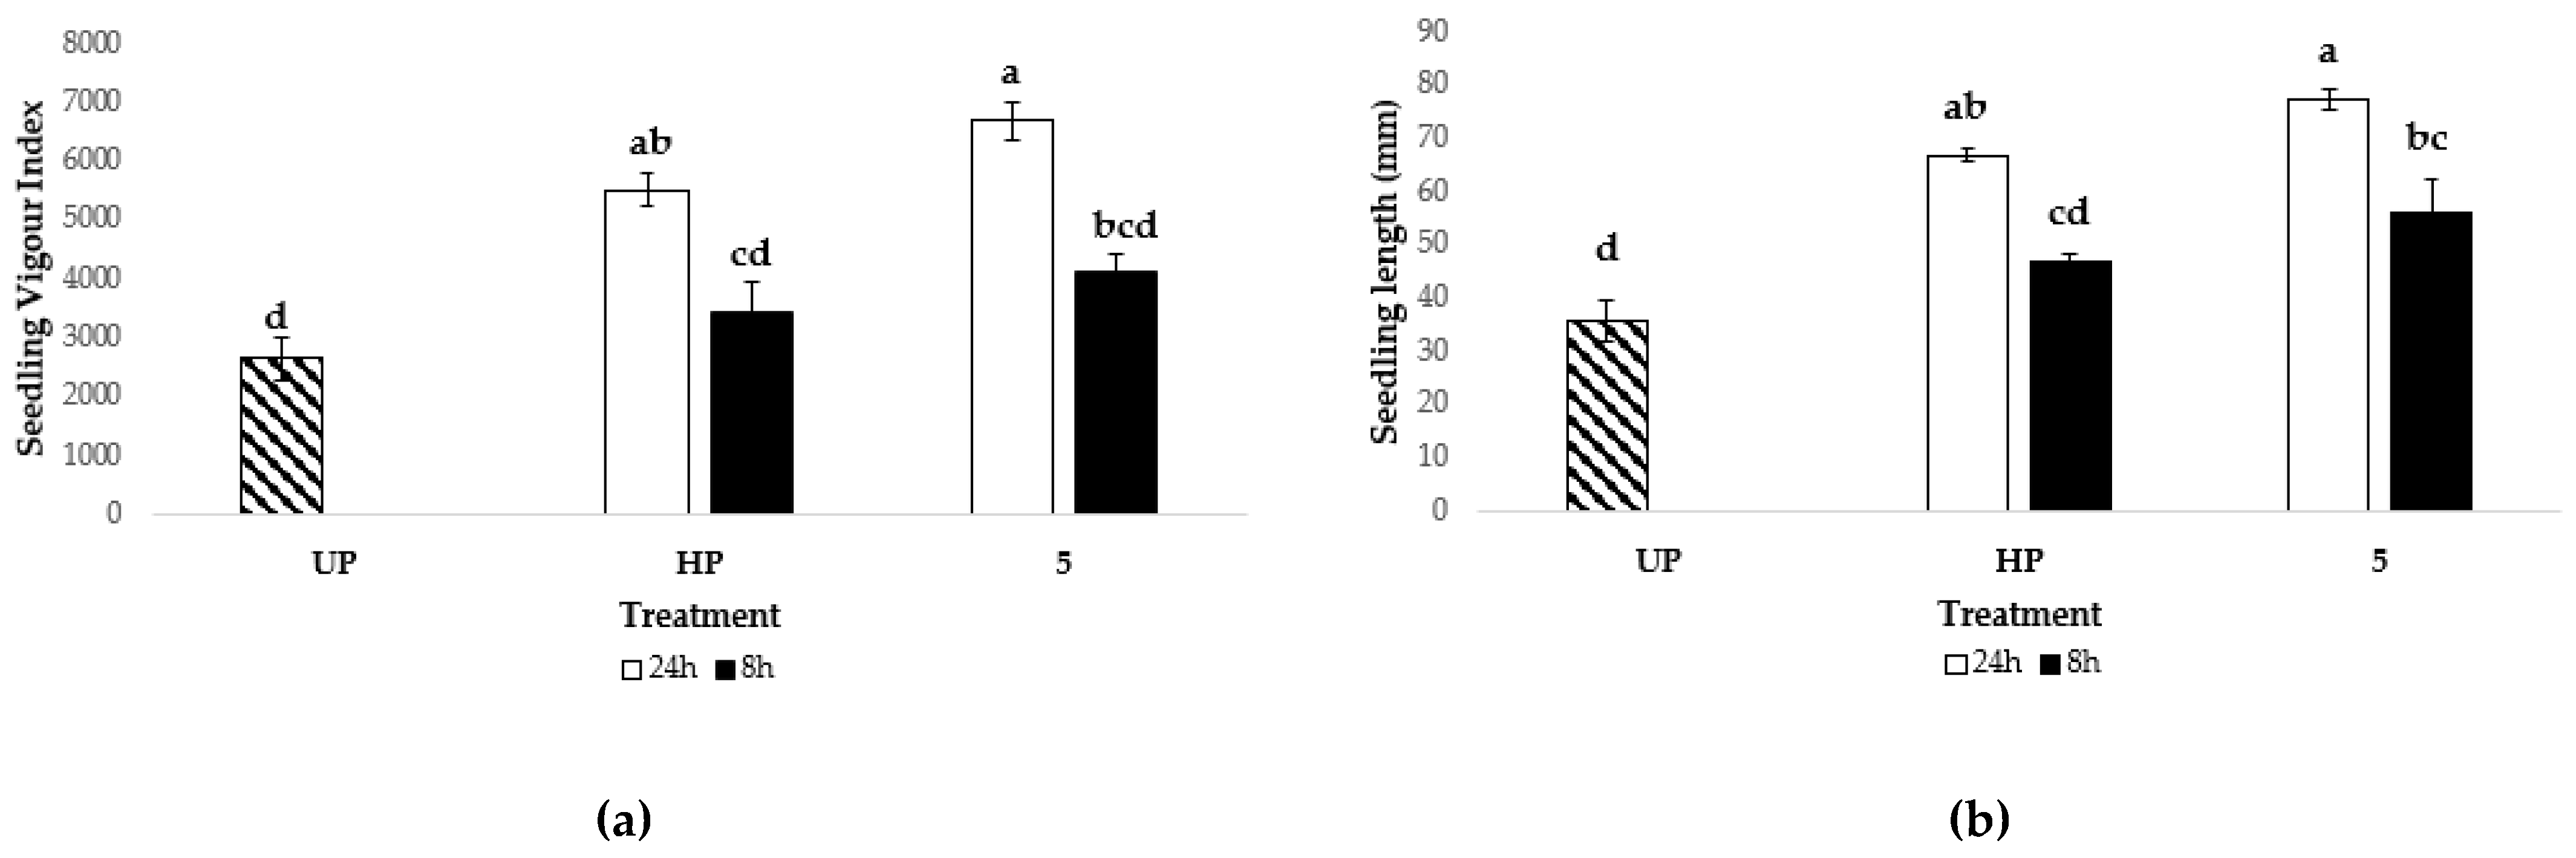
Figure 10.
(a) Seedling Vigour Index (SVI) and (b) seedling length (mm) of lettuce seeds primed with 0.5 µg/mL Ber-AgNPs and water priming (HP) for different priming duration (8h and 4h) and not primed seeds (UP). Significant differences among means are represented by different letters in treatment bars (Tukey’s test, p < 0.05, n=4). Vertical lines with caps represent the ± standard error.
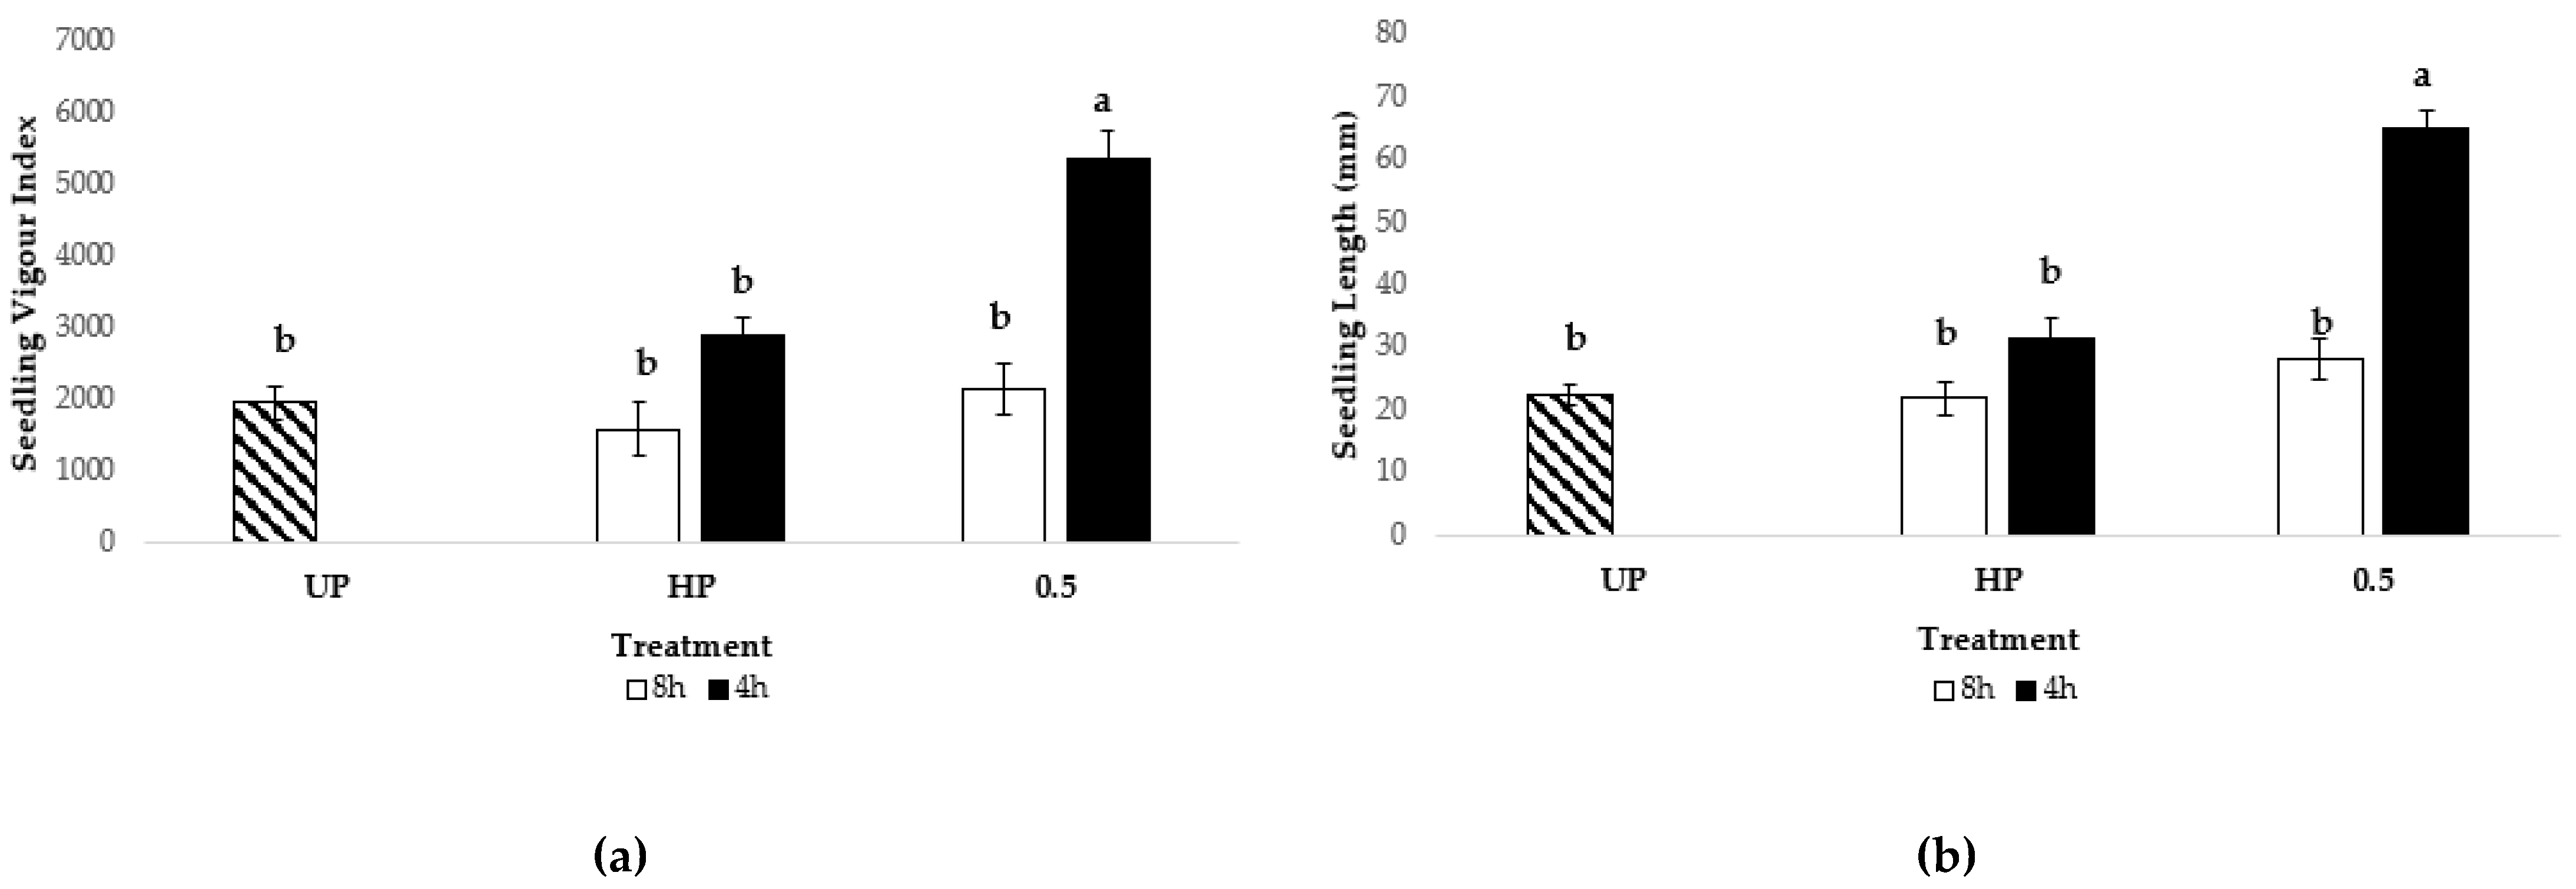
Figure 11.
(a) Seedling Vigour Index and (b) seedling length (mm) of tomato seeds primed with 5µg/mL Ber-AgNPs (Ber-AgNP), 5µg/mL bergamot pomace extract (BPE), 5µg/mL silver nitrate solution (AgNO3), and water (HP) and not primed (UP). Significant differences among means are represented by different letters in treatment bars (Tukey’s test, p < 0.05, n=4). Vertical lines with caps represent the ± standard error.
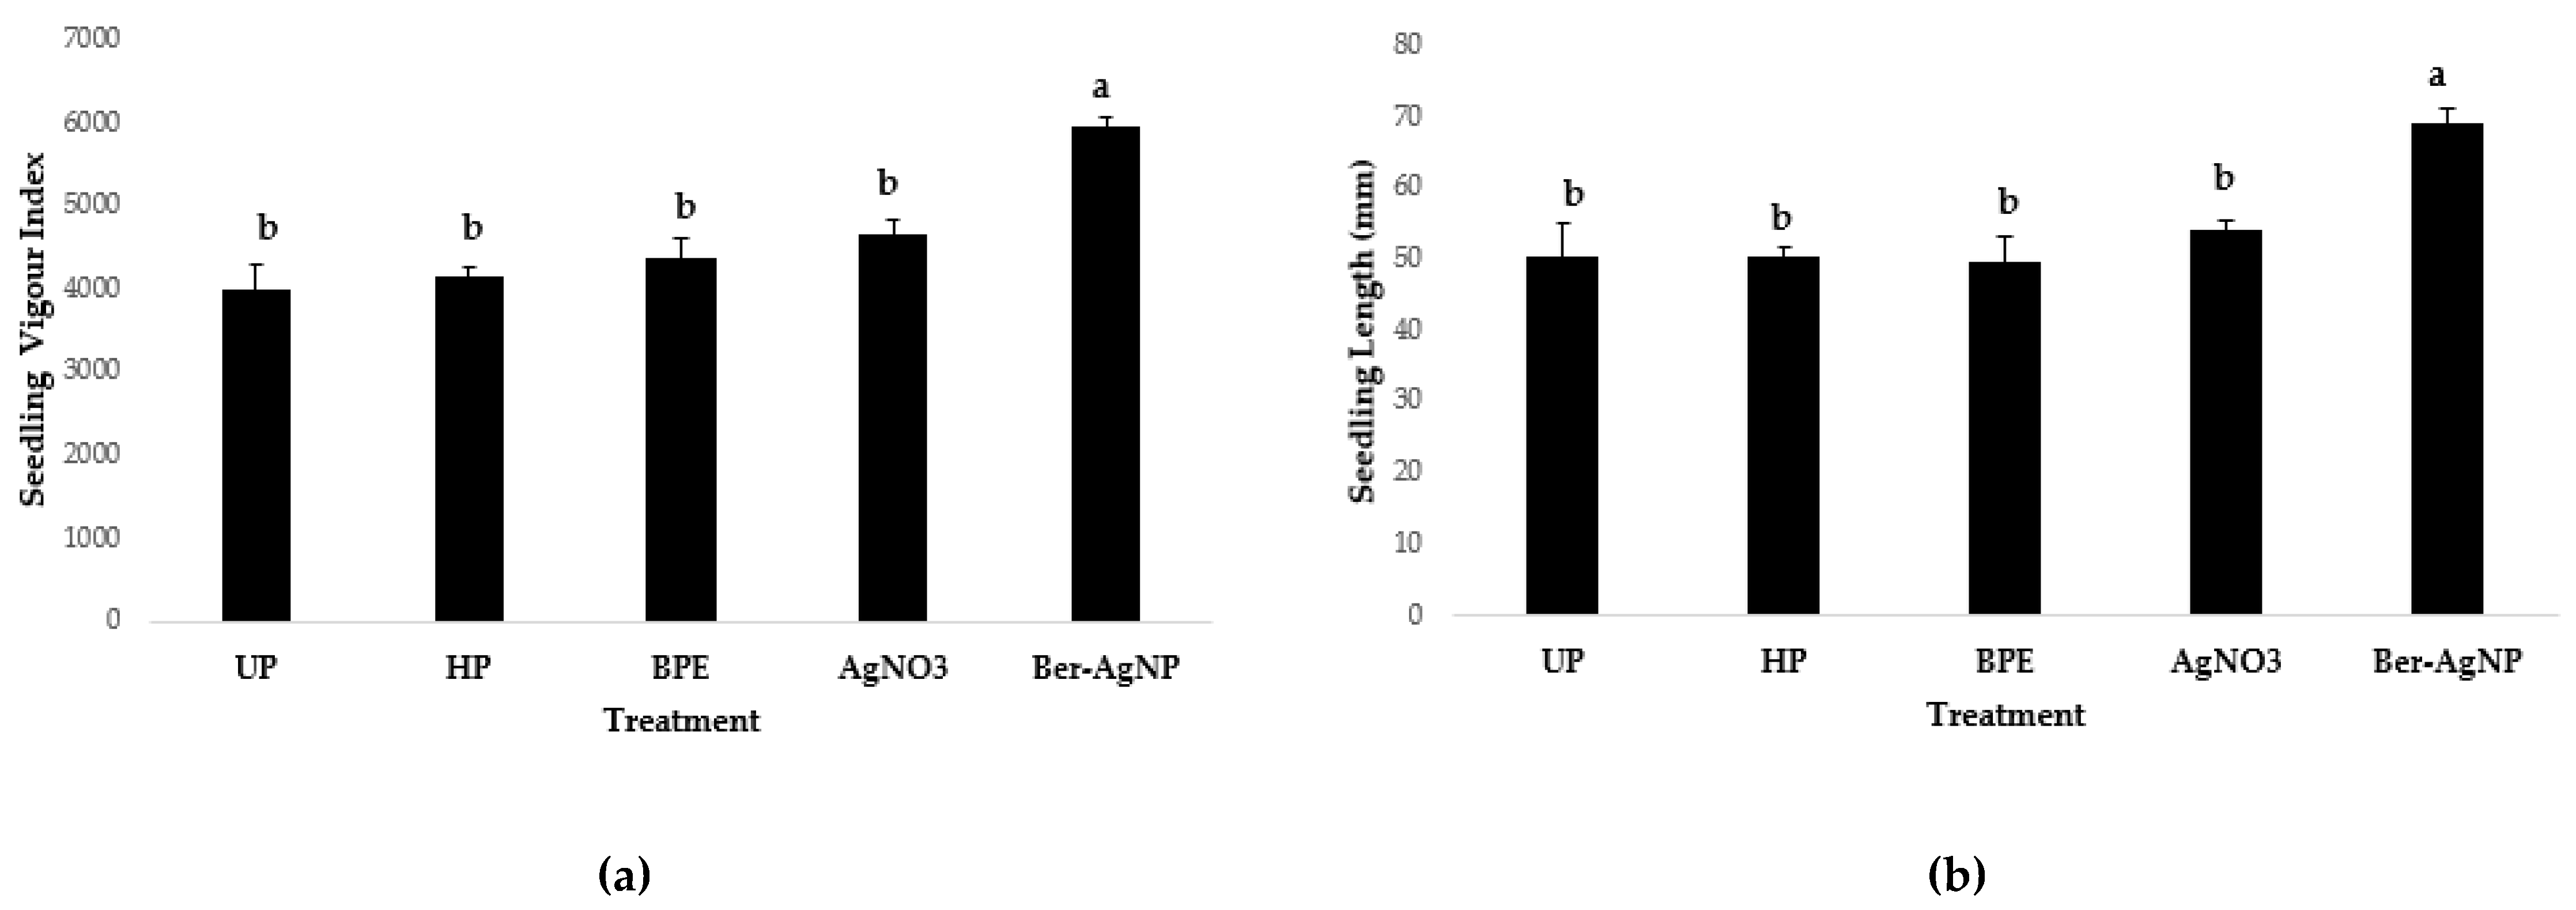
Figure 12.
(a) Seedling Vigour Index and (b) seedling length (mm) of lettuce seeds primed with: 0.5µg/mL Ber-AgNPs (Ber-AgNP), 0.5µg/mL bergamot pomace extract (BPE), 0.5µg/mL AgNO3 solution (AgNO3), and water (HP) and not primed seeds (UP). Significant differences among means are represented by different letters in treatment bars (Tukey’s test, p < 0.05, n=4). Vertical lines with caps represent the ± standard error.
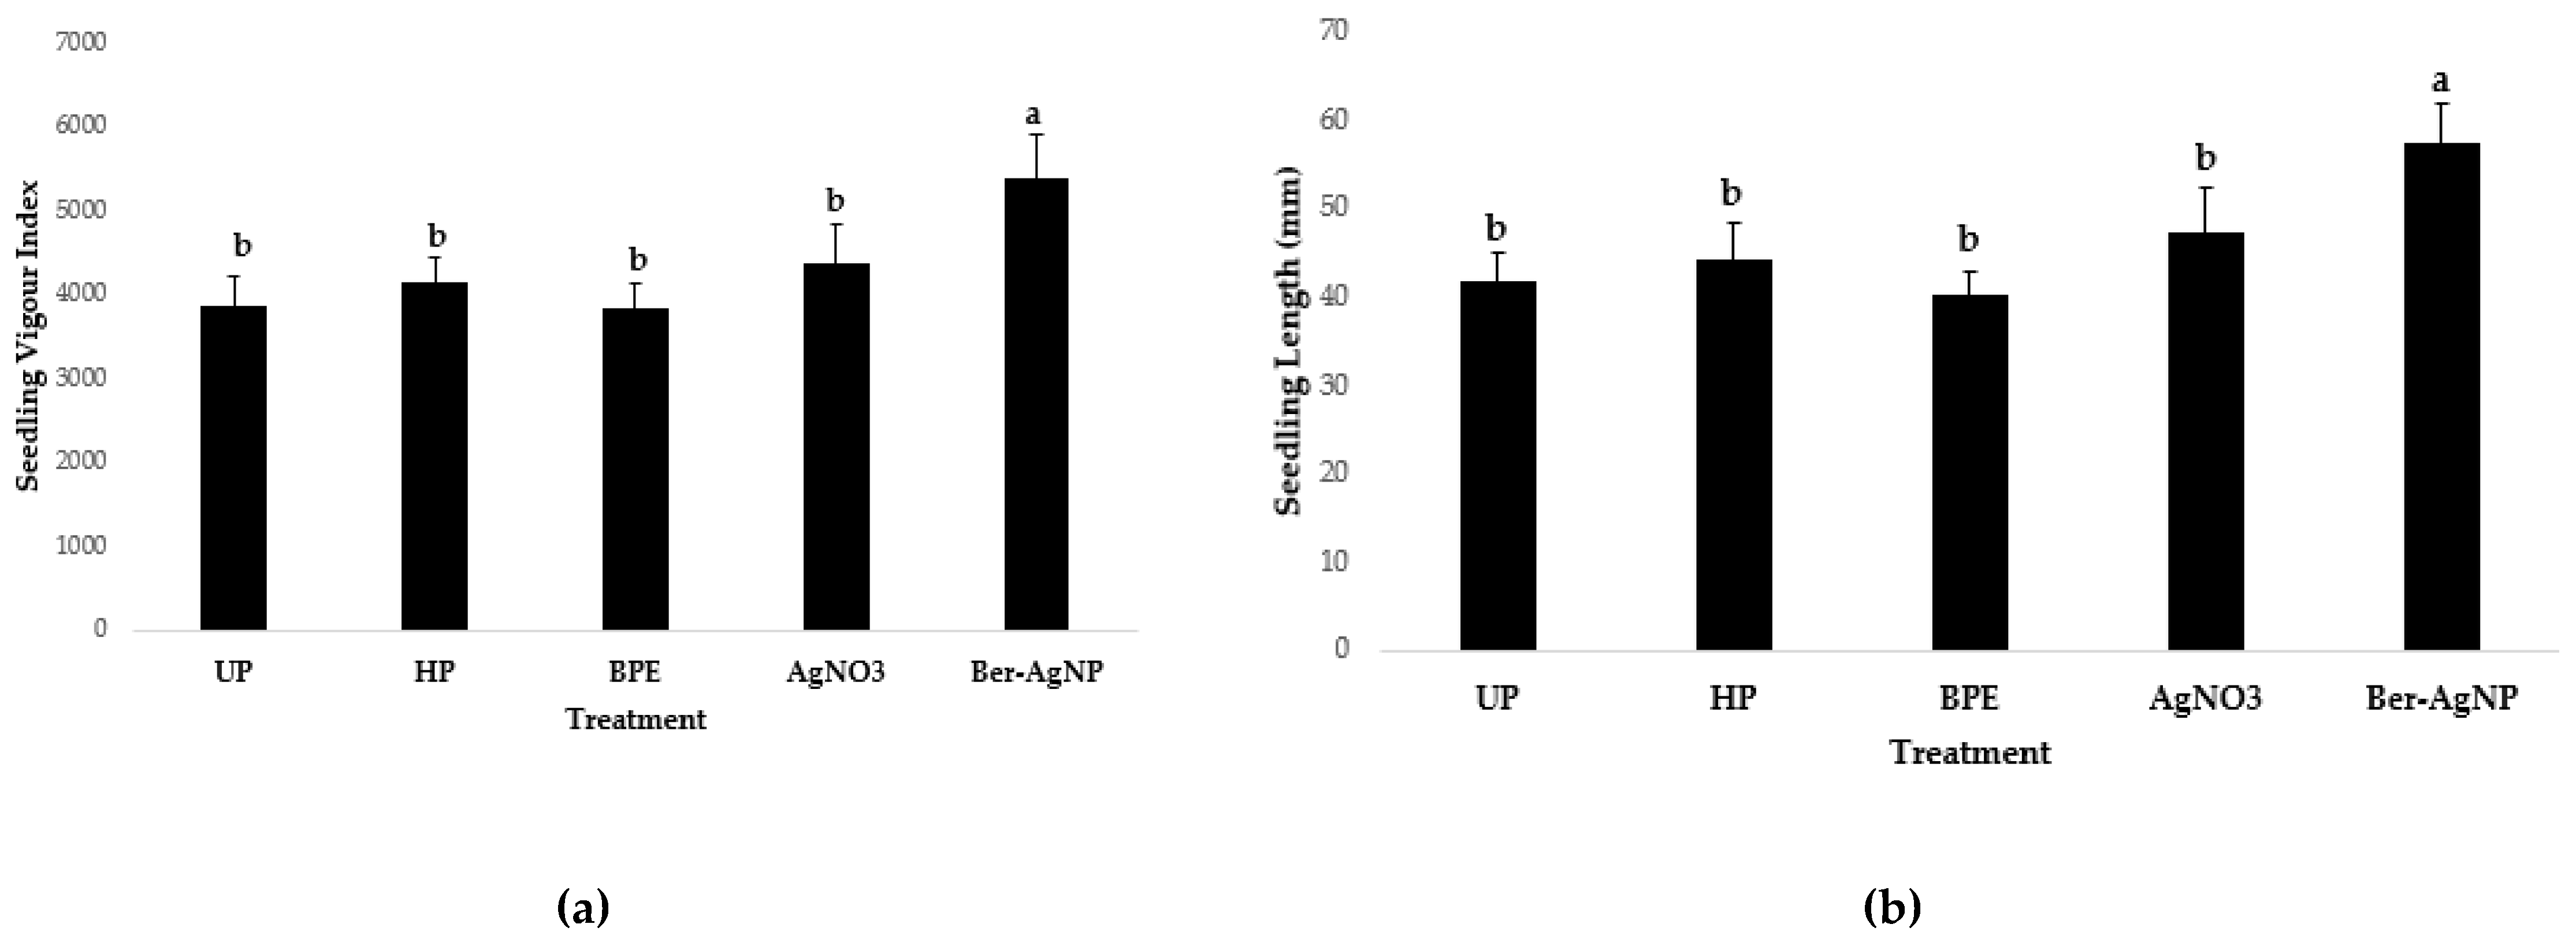
Figure 13.
(a) In vitro Pseudomonas syringae pv tomato and (b) Xanthomonas campestris pv. vesicatoria growth in presence of different Ber-AgNPs (TNP), bergamot pomace extract (TE) and AgNO3 (TM) concentrations, (5, 20, and 50 µg/mL). CbP and CbX represented the bacterial cultures, P. syringae and X. campestris, respectively, in LB without Ber-AgNPs. Significant differences among means are represented by different letters in treatment bars (Tukey’s test, p < 0.05, n=6). Vertical lines with caps represent the ± standard error.
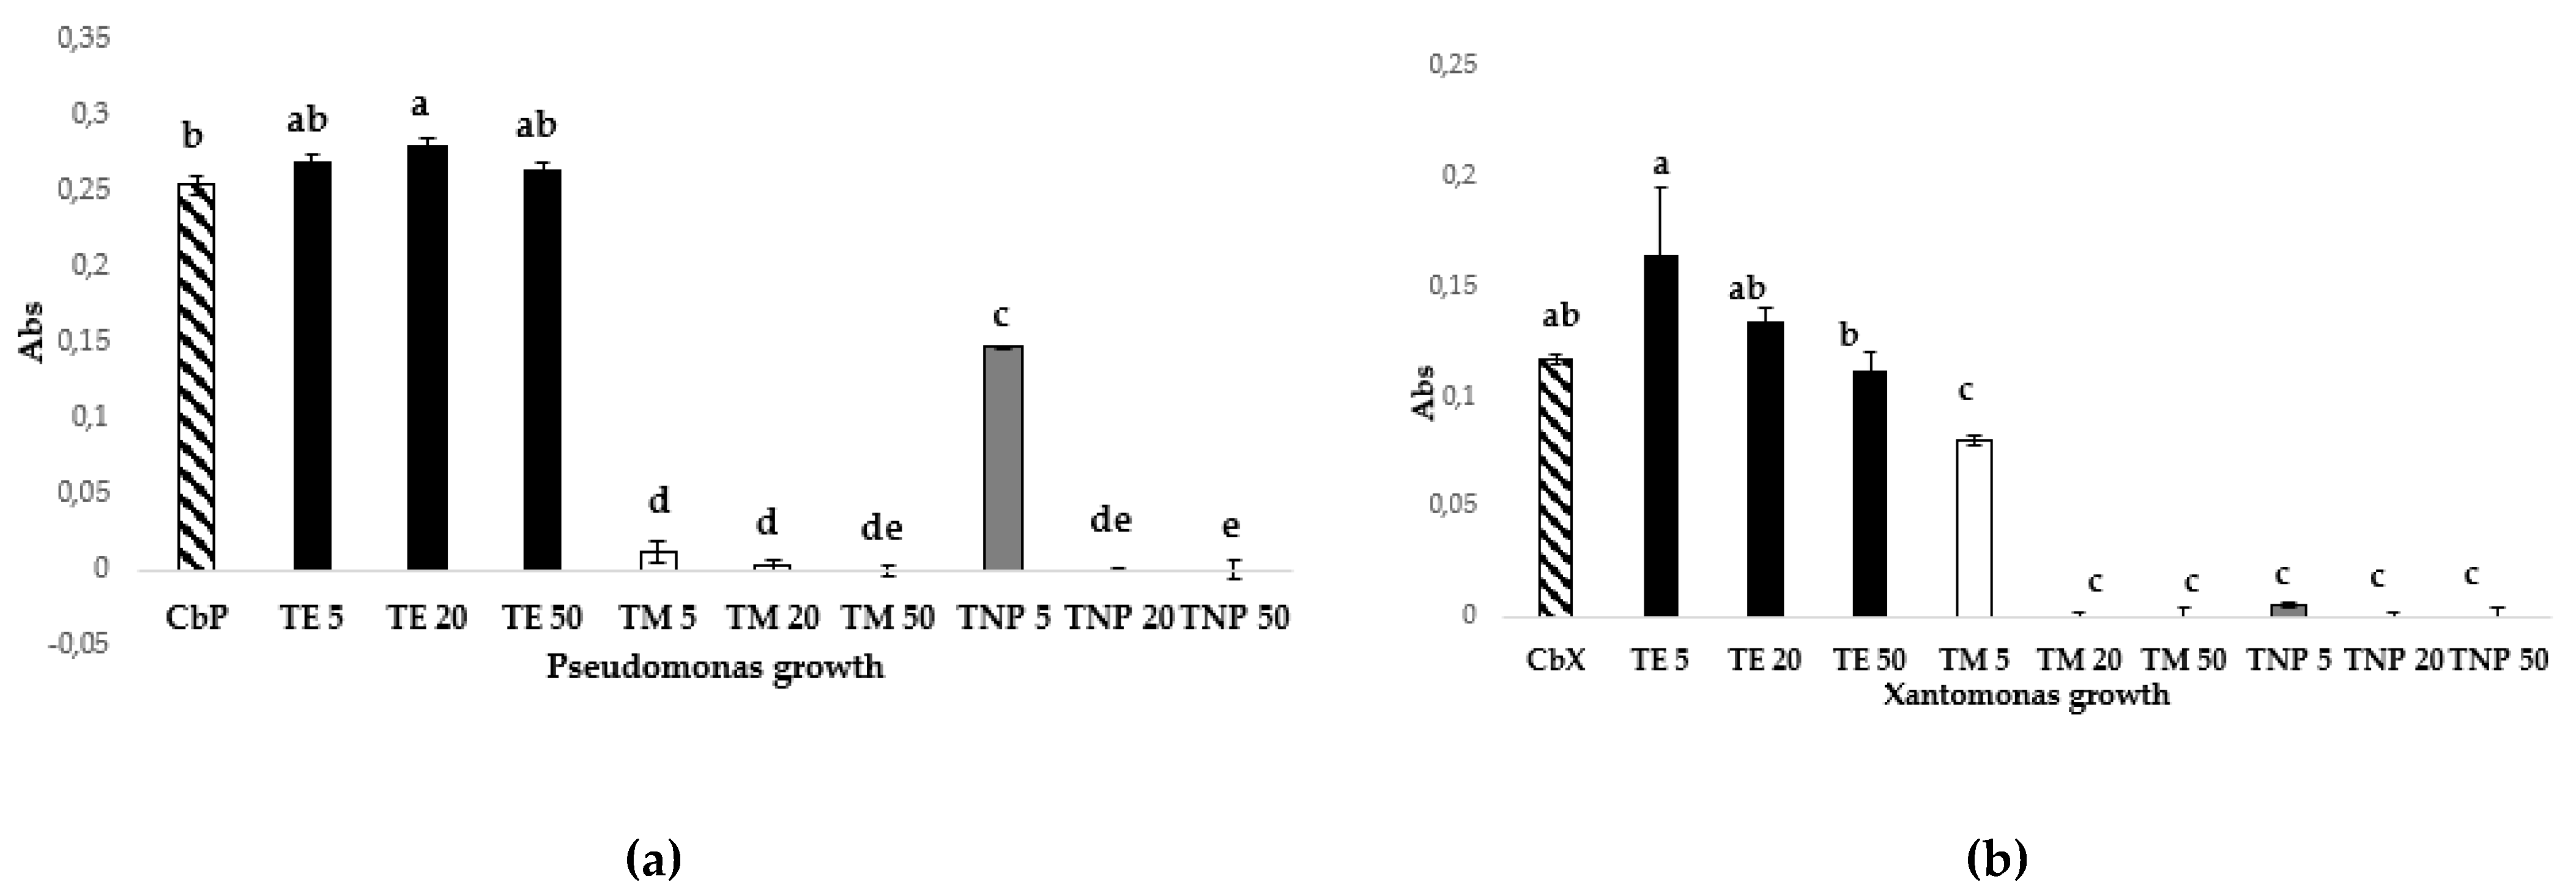

Table 1.
Physical characteristics (size, PdI, and Z-potential) of the phytosynthesized bergamot silver nanoparticles (Ber-AgNPs) at two different concentrations (BPE1 and BPE0.1) (assay 1 and 2, Table S1).
Table 1.
Physical characteristics (size, PdI, and Z-potential) of the phytosynthesized bergamot silver nanoparticles (Ber-AgNPs) at two different concentrations (BPE1 and BPE0.1) (assay 1 and 2, Table S1).
| Sample | Z-Average (d.nm) | PdI | Z-potential (mV) |
| BPE1 | 91.06 | 0.296 | -22.3 |
| BPE0.1 | 89.44 | 0.187 | -29.7 |
Table 2.
Physical characteristics (size, PdI, and Z-potential) of the phytosynthesized Ber-AgNPs at different pH values: 7 (pH7), 8.8 (pH8.5) and 9 (pH9) (assay 3, 4, and 5; Table S1).
Table 2.
Physical characteristics (size, PdI, and Z-potential) of the phytosynthesized Ber-AgNPs at different pH values: 7 (pH7), 8.8 (pH8.5) and 9 (pH9) (assay 3, 4, and 5; Table S1).
| Sample | Z-Average (d.nm) | PdI | Z-potential (mV) |
| pH7 | 115.8 | 0.237 | -31.3 |
| pH8.5 | 86.81 | 0.289 | -41.4 |
| pH9 | 86.08 | 0.262 | -34.1 |
Table 3.
Physical characteristics (size, PdI, and Z-potential) of the phytosynthesized Ber-AgNPs at two different bergamot pomace extract (BPE):metal ratio (v:v) (2:1 and 1:1 ratio) (assay 6 and 7; Table S1).
Table 3.
Physical characteristics (size, PdI, and Z-potential) of the phytosynthesized Ber-AgNPs at two different bergamot pomace extract (BPE):metal ratio (v:v) (2:1 and 1:1 ratio) (assay 6 and 7; Table S1).
| Sample | Z-Average (d.nm) | PdI | Z-potential (mV) |
| 2:1 ratio | 86.35 | 0.238 | -30.9 |
| 1:1 ratio | 89.44 | 0.187 | -29.7 |
Table 4.
Physical characteristics (size, PdI, and Z-potential) of the phytosynthesized Ber-AgNPs at different incubation times: 1 (t1), 3 (t3) and 24 hours (t24) from starting reaction mixture (assay 9, 10, and 11; Table S1).
Table 4.
Physical characteristics (size, PdI, and Z-potential) of the phytosynthesized Ber-AgNPs at different incubation times: 1 (t1), 3 (t3) and 24 hours (t24) from starting reaction mixture (assay 9, 10, and 11; Table S1).
| Sample | Z-Average (d.nm) | PdI | Z-potential (mV) |
| t1 | 53.35 | 0.285 | -32.3 |
| t3 | 46.57 | 0.371 | -33 |
| t24 | 58.81 | 0.268 | -32.5 |
Table 5.
Physical characteristics (size, PdI, and Z-potential) of the phytosynthesized Ber-AgNPs at different incubation temperatures: 15°C (T15), 20°C (T20), and 25°C (T25) (assay 12, 13, and 14; Table S1).
Table 5.
Physical characteristics (size, PdI, and Z-potential) of the phytosynthesized Ber-AgNPs at different incubation temperatures: 15°C (T15), 20°C (T20), and 25°C (T25) (assay 12, 13, and 14; Table S1).
| Sample | Z-Average (d.nm) | PdI | Z-potential |
| T15 | 30.56 | 0.518 | -22.8 |
| T20 | 41 | 0.507 | -32.6 |
| T25 | 50 | 0.313 | -30.4 |
Table 6.
Physical characteristics (size, PdI, and Z-potential) of the phytosynthesized Ber-AgNPs synthesis using optimized reaction parameters (0.1% of the BPE extract, pH 8.5 of the mixture, 1:1 ratio of BPE:AgNO3 concentration, 25°C of the incubation temperature, 24 h of incubation time).
Table 6.
Physical characteristics (size, PdI, and Z-potential) of the phytosynthesized Ber-AgNPs synthesis using optimized reaction parameters (0.1% of the BPE extract, pH 8.5 of the mixture, 1:1 ratio of BPE:AgNO3 concentration, 25°C of the incubation temperature, 24 h of incubation time).
| Sample | Z-Average (d.nm) | PdI | Z-potential |
| Ber-AgNPs | 74.9 | 0.248 | -32.74 |
Table 7.
Comparative Peak Assignment Table
| Wavenumber (cm⁻¹) | BPE | Ber-Ag-NPs | Compound Assignment / Notes |
| ~3250 | Broad, intense | Slightly shifted/sharper | O–H stretching (phenols, flavonoids, alcohols) |
| 2923, 2854 | Present | Decreased intensity | C–H stretching (aliphatic –CH₂/–CH₃) |
| 1710–1690 | Strong | Shifted (~1680) | C=O stretching (carboxylic acids, ketones, esters) |
| 1610–1580 | Medium-strong | Slightly reduced | C=C aromatic ring stretching; possibly conjugated C=O |
| 1454–1430 | Visible | Less intense | CH₂ bending, asymmetric COO⁻ stretching |
| 1384 | Distinct band | Intensity drop | Phenolic O–H bending; COO⁻ symmetric stretch |
| 1323–1245 | Multiple peaks | Slight shift/loss | C–O stretching (phenols, ethers); C–N in proteins |
| 1170–1030 | Complex region | Peak displacement | C–O–C ether linkages; C–O phenolic and alcoholic groups |
| ~698–617 | Weak/moderate | New/shifted peaks | Possible Ag–O or Ag–N interactions (Ag coordination signals) |
| ~516 | Weak shoulder | Slightly intensified | Fingerprint region; may include metal–oxygen stretching (Ag–O) |
Disclaimer/Publisher’s Note: The statements, opinions and data contained in all publications are solely those of the individual author(s) and contributor(s) and not of MDPI and/or the editor(s). MDPI and/or the editor(s) disclaim responsibility for any injury to people or property resulting from any ideas, methods, instructions or products referred to in the content. |
© 2026 by the authors. Licensee MDPI, Basel, Switzerland. This article is an open access article distributed under the terms and conditions of the Creative Commons Attribution (CC BY) license.
Copyright: This open access article is published under a Creative Commons CC BY 4.0 license, which permit the free download, distribution, and reuse, provided that the author and preprint are cited in any reuse.


