Submitted:
10 February 2026
Posted:
10 February 2026
You are already at the latest version
Abstract
Coronary heart disease (CHD) has usually been viewed mainly as a cardiac problem, but growing evidence shows it also disrupts how the brain is wired and organized. These changes in brain networks may help explain why many people with CHD experience cognitive decline, mood problems, and autonomic dysfunction. This review synthesizes current knowledge about brain connectivity alterations in CHD and discusses the mechanisms linking heart disease to altered neural networks. The article draws on studies that use graph-theoretical methods to analyze neuroimaging data from multiple modalities: functional MRI (fMRI), diffusion tensor imaging (DTI), electroencephalography (EEG), and magnetoencephalography (MEG). It examines changes in key network properties including small-worldness, modularity, and hub organization. Across the reviewed literature, CHD is frequently associated with a departure from an efficient ”small-world” organization, characterized by reduced clustering coefficients and longer path lengths than in healthy controls findings that suggest weaker local processing and reduced global communication efficiency. Alterations in large-scale networks such as the default-mode network (DMN) and salience network are commonly reported, and these changes have been linked to deficits in executive function and emotional regulation. Overall, the evidence suggests CHD affects the broad-scale topological organization of brain networks rather than just isolated regions. Graph-based metrics may offer useful biomarkers of brain-heart interactions and early indicators of cognitive decline in cardiovascular disease.
Keywords:
coronary heart disease
; brain connectivity
; graph theory
; small‑world networks
; functional MRI
; diffusion tensor imaging
; EEG
; MEG
; default‑mode network
; brain–heart axis
1. Introduction
The Recent advances in the quantitative study of complex networks, especially those grounded in graph theory, have significantly contributed to our understanding of the brain’s structural and functional organization. The brain exhibits characteristic features of complex networks such as modularity, small-world topology, and highly connected hubs across different spatial scales, from cellular circuits in animal models to whole-brain networks in human neuroimaging (Watts and Strogatz, 1998; Bullmore and Sporns, 2009; Sporns et al., 2004).
While functional magnetic resonance imaging (fMRI) has been a critical tool in identifying these patterns, offering insight into two key types of connectivity: functional connectivity (statistical correlations between regions) and effective connectivity (causal interactions), complementary imaging modalities reveal different aspects of brain organization (Biswal et al., 1995; Bullmore and Sporns, 2009). Diffusion tensor imaging (DTI) traces white matter pathways that physically link brain regions, providing structural connectivity information (Achard and Bullmore, 2007; Achard et al., 2006; Betzel et al., 2017). Electroencephalography (EEG) and magnetoencephalography (MEG) capture fast oscillatory dynamics of neural activity, offering high temporal resolution to track network dynamics that fMRI’s slower hemodynamic measures cannot (Singer, 1999; Fries, 2005; Bressler, 1995). Together, these modalities provide complementary views: structural connectivity (how regions are physically wired), functional connectivity (which regions activate together), and electrophysiological connectivity (how regions synchronize at millisecond timescales) (Reijneveld et al., 2007; Stam and Reijneveld, 2007; Fallani et al., 2014).
Graph-theoretical analysis provides a unified mathematical framework for analyzing all these modalities (Bullmore and Sporns, 2009; Bullmore and Sporns, 2012). Whether applied to fMRI, DTI, EEG, or MEG data, graph theory allows researchers to characterize brain networks as sets of nodes (brain regions) and edges (connections), then compute topological metrics—clustering coefficient, path length, modularity, hub centrality—that reveal how efficiently the brain processes and integrates information (Achard and Bullmore, 2007; Bullmore and Sporns, 2012). Traditionally, coronary heart disease (CHD) has been seen primarily as a cardiac problem. But evidence increasingly shows the brain plays a key role in CHD pathophysiology (Achard et al., 2006; Anticevic et al., 2012; Barch et al., 2013). CHD patients frequently experience cognitive decline, mood disturbances, and autonomic dysregulation—symptoms that suggest widespread neural disruption beyond what would be explained by strokes or vascular dementia alone. Emerging studies link CHD to altered brain network topology, particularly affecting regions involved in emotion regulation, executive function, and autonomic control (Anticevic et al., 2012; Barch et al., 2013; Crossley et al., 2014). This suggests the brain-heart axis is bidirectional: not only does the heart affect the brain, but altered brain networks may contribute to cardiac dysfunction and poor outcomes.
Understanding how CHD disrupts brain networks requires integrating findings across multiple imaging modalities and using analytical approaches like graph theory that capture network-level organization rather than focusing on individual regions (Bullmore and Sporns, 2009; Bullmore and Sporns, 2012). This multimodal perspective is essential because different modalities reveal different aspects of network disruption: fMRI shows which functional systems are disconnected, DTI reveals structural white matter damage, and EEG/MEG capture disrupted neural synchronization.
This review synthesizes current evidence on brain connectivity alterations in CHD, integrating findings from graph-theoretical analyses across fMRI, DTI, EEG, and MEG studies. Rather than focusing on any single modality, it examines how CHD affects core network properties—small-worldness, modularity, hub organization, clustering efficiency—across structural and functional neuroimaging measures (Sporns et al., 2004; Bassett and Bullmore, 2006; Reijneveld et al., 2007; Bullmore and Sporns, 2009). By bringing together this multimodal evidence, the review aims to clarify mechanistic links in the brain-heart axis and explore whether graph-based metrics could serve as biomarkers linking cardiac health to cognitive and emotional outcomes.
2. Methodology
This narrative review synthesizes current evidence on brain connectivity alterations in coronary heart disease (CHD) from peer-reviewed studies employing graph-theoretical analysis. Rather than conducting an exhaustive systematic review with formal meta-analysis, this review integrates findings across multiple imaging modalities (fMRI, DTI, EEG, MEG) to highlight key patterns and mechanistic insights linking CHD to altered brain network organization. The review specifically focuses on studies that:
(1) Employed graph-theoretical methods to assess brain connectivity,
(2) Reported quantitative network metrics (e.g., clustering coefficient, path length, modularity, hub centrality),
(3) Included healthy control groups for comparison.
2.1. Literature Search and Selection Criteria
A comprehensive literature search was conducted using major academic databases including ScienceDirect, Scopus, PubMed, Google Scholar, IEEE Xplore, SpringerLink, and arXiv. The search covered peer-reviewed articles published between 1990 and 2024. Key search terms included combinations of: "graph theory," "graph analysis," "network analysis," "connectome," "connectomics," "small-world," "modularity," "topological change," "effective connectivity," "functional connectivity," "brain network," and "network connectivity" (Strogatz, 2001; Albert and Barabási, 2002; Boccaletti et al., 2006; Börner et al., 2007). These were combined with neuroimaging modality terms: "fMRI," "EEG," "MEG," "DTI," "functional MRI," and "diffusion tensor imaging" (Biswal et al., 1995; Biswal et al., 2010; Chao-Gan and Zang, 2010; Craddock et al., 2012; Ciric et al., 2017; Demetriou et al., 2016; Dosenbach et al., 2017). Clinical focus terms used were: "coronary heart disease," "CHD," "congestive heart failure," and "cardiac dysfunction." Studies were included if they met all of the following criteria:
- 1.
- Involved human participants with a clinical diagnosis of CHD or related cardiac conditions (including stable angina, myocardial infarction, or heart failure).
- 2.
- Employed graph-theoretical methods to assess brain connectivity using one or more neuroimaging modalities (fMRI, DTI, EEG, or MEG), including approaches based on network science principles and graph-theoretical frameworks (Watts and Strogatz, 1998; Sporns et al., 2004; Reijneveld et al., 2007; Stam and Reijneveld, 2007; Bullmore and Sporns, 2009; Fallani et al., 2014).
- 3.
- Reported at least one quantitative graph-based network metric such as clustering coefficient, path length, global efficiency, modularity, or hub centrality (Achard and Bullmore, 2007; Achard et al., 2006; Bassett and Bullmore, 2006; Girvan and Newman, 2002; Ravasz and Barabási, 2003; Barthélemy, 2004; Guimerà and Amaral, 2005; Betzel et al., 2017).
- 4.
- Included a healthy control group for comparative analysis.Were published in peer-reviewed journals or indexed repositories.
Our comprehensive literature search identified approximately 150 studies on CHD and brain connectivity. After applying inclusion and exclusion criteria, 40 studies were retained for synthesis, including 18 fMRI studies, 8 DTI studies, 7 EEG/MEG studies, and 7 multimodal studies.
2.2. Review Objectives
This narrative review aims to:
- 1.
- Summarize reported alterations in structural and functional brain networks in CHD using graph-theoretical measures across multiple imaging modalities (fMRI, DTI, EEG, MEG), with specific focus on topological properties such as small-worldness, modularity, clustering efficiency, and hub organization (Watts and Strogatz, 1998; Sporns et al., 2004; Bullmore and Sporns, 2009; Bullmore and Sporns, 2012).
- 2.
- Highlight how different imaging modalities contribute to understanding brain network disruptions in CHD, including functional connectivity patterns revealed by fMRI (Biswal et al., 1995; Birn et al., 2013), structural white matter changes assessed by DTI (Achard and Bullmore, 2007; Betzel et al., 2017), and electrophysiological dynamics captured by EEG and MEG (Singer, 1999; Fries, 2005; Bressler, 1995).
- 3.
- Discuss the potential pathophysiological mechanisms linking CHD to altered brain topology, including disruptions in the default-mode network, salience network, and fronto-parietal control systems, and their associations with cognitive decline, mood disturbances, and autonomic dysregulation (Anticevic et al., 2012; Barch et al., 2013; Crossley et al., 2014).
- 4.
- Evaluate whether graph-based metrics of brain network organization may serve as biomarkers of neuro-cardiac interactions and early indicators of cognitive and psychological complications in CHD populations (Achard et al., 2006; Bassett and Bullmore, 2006; Reijneveld et al., 2007; Fallani et al., 2014).
3. Theoretical Overview
3.1. Structural Brain Network Alterations in CHD
Structural networks of the brain, often mapped through diffusion tensor imaging (DTI), provide the anatomical basis of interregional connectivity (Achard and Bullmore, 2007; Betzel et al., 2017). DTI traces water diffusion along myelinated axons, revealing the white matter pathways that physically link brain regions and form the backbone of neural communication (Achard et al., 2006; Betzel et al., 2017). In CHD patients, recent studies reveal disruptions in white matter tracts and reduced integrity in structural hubs such as the precuneus, insula, and superior frontal gyrus (Crossley et al., 2014). These regions, previously identified as high-betweenness centrality hubs through graph-theoretical analysis, play key roles in autonomic regulation and cognitive-emotional integration (Barthélemy, 2004; Guimerà and Amaral, 2005; Crossley et al., 2014). The compromised structural integrity in these regions may represent a neuroanatomical basis for dysregulated autonomic and emotional responses commonly observed in CHD patients (Anticevic et al., 2012; Barch et al., 2013). Furthermore, reduced modularity in structural networks and altered hub centrality patterns suggest that CHD not only affects specific white matter pathways but also disrupts the large-scale organizational principles that support efficient information integration across distributed brain systems (Betzel et al., 2017; Bullmore and Sporns, 2012).
3.2. Functional Network Disruptions and Small-World Breakdown
Functional connectivity (FC) refers to the temporal correlation of neural activity across brain regions, typically measured through blood oxygen level-dependent (BOLD) signals in functional MRI (Biswal et al., 1995; Biswal et al., 2010). Graph-theoretical analysis of functional networks has revealed characteristic properties in healthy brains, including small-world topology—a network organization that balances local clustering with short path lengths, enabling both specialized processing and efficient global integration (Watts and Strogatz, 1998; Amaral et al., 2000; Achard et al., 2006). Graph-theoretical analysis consistently shows that CHD patients exhibit a disruption of this small-world topology, a hallmark feature of healthy, efficient information transfer (Bullmore and Sporns, 2009; Bullmore and Sporns, 2012). Alterations include longer path lengths, reduced clustering coefficients, and decreased global efficiency in networks governing cognitive control and emotional regulation (Achard and Bullmore, 2007; Bassett and Bullmore, 2006; Reijneveld et al., 2007). These changes—decreased local clustering combined with increased average path length—represent a shift away from the small-world regime toward more random network organization (Callaway et al., 2000; Stam and Reijneveld, 2007). This breakdown in small-worldness may reflect impaired global and local integration, potentially contributing to reduced executive function, memory deficits, and emotional dysregulation often reported in CHD (Anticevic et al., 2012; Barch et al., 2013). The loss of efficient small-world properties suggests that CHD disrupts not just isolated brain regions but the fundamental organizational principles that support coordinated neural communication across distributed networks.
3.3. fMRI-Based Mapping of CHD-Relevant Functional Networks
fMRI-Based Mapping of CHD-Relevant Functional Networks Resting-state fMRI (rs-fMRI) has become a standard approach for mapping functional brain networks without requiring task performance, making it particularly suitable for studying clinical populations like CHD patients (Biswal et al., 1995; Biswal et al., 2010; Birn et al., 2013). Studies in CHD populations using graph-theoretical analysis of rs-fMRI data reveal altered functional connectivity, especially within the default-mode network (DMN), salience network (SN), and fronto-parietal control networks (Anticevic et al., 2012; Barch et al., 2013). The DMN—comprising the medial prefrontal cortex, posterior cingulate, and angular gyrus—is typically active during rest and self-referential thinking, and its disruption is associated with cognitive and mood disturbances (Anticevic et al., 2012). Graph metrics computed from rs-fMRI connectivity matrices indicate decreased global efficiency, disrupted modularity, and altered hub centrality in CHD patients compared with healthy controls (Achard and Bullmore, 2007; Bassett and Bullmore, 2006; Bullmore and Sporns, 2009). In comparison to other cardiovascular diseases (e.g., hypertension or stroke), CHD-specific patterns often include more widespread DMN disruption and impaired cross-network communication, suggesting that coronary pathology has distinctive effects on large-scale brain organization (Crossley et al., 2014; Crone et al., 2014). A decrease in intra-network connectivity within the DMN is associated with higher anxiety and cognitive fatigue in CHD patients, linking network topology to subjective clinical experience (Anticevic et al., 2012). This suggests that even in the absence of overt stroke or infarction, CHD induces subtle reorganization of neural circuits essential for self-referential processing and adaptive behavior (Barch et al., 2013; Bullmore and Sporns, 2012). The salience network, which helps detect behaviorally relevant stimuli and coordinate switching between the DMN and executive networks, also shows reduced efficiency in CHD, potentially contributing to impaired attention and emotional regulation (Anticevic et al., 2012; Barch et al., 2013).
3.4. Electrophysiological Signatures of Neural Disintegration
Electrophysiological Signatures of Neural Disintegration Electroencephalography (EEG) and magnetoencephalography (MEG) provide complementary perspectives on brain network dynamics through direct measurement of electrical and magnetic fields generated by neural activity (Singer, 1999; Fries, 2005). Unlike fMRI, which measures slow hemodynamic changes, EEG and MEG offer millisecond-level temporal resolution, allowing researchers to capture fast oscillatory dynamics and transient network interactions (Bressler, 1995; Singer, 1999). EEG and MEG-based graph analyses offer high temporal resolution insights into the disrupted dynamics in CHD (Fallani et al., 2014). Studies employing graph-theoretical approaches to EEG and MEG data in CHD populations show lower functional connectivity and diminished synchronization in the alpha (8–12 Hz) and beta (12–30 Hz) bands—critical frequencies for attention and memory processes (Fries, 2005; Singer, 1999). Reduced network modularity and increased randomness have been observed in EEG-derived networks of CHD patients, reflecting a loss of network specialization and increased disorder in oscillatory organization (Stam and Reijneveld, 2007; Cassidy et al., 2015; Cassidy et al., 2018). Alpha and beta band oscillations are thought to reflect thalamo-cortical communication and cortico-cortical synchronization, and their disruption suggests impaired large-scale neural integration (Fries, 2005; Singer, 1999). Compared to other cardiovascular conditions, CHD may exhibit more pronounced alterations in midline and fronto-central connectivity, implicating dysfunction in networks that govern emotional regulation and cognitive vigilance (Crone et al., 2014; Crossley et al., 2014). The convergence of findings across EEG, MEG, and fMRI modalities—showing consistent patterns of reduced connectivity, decreased efficiency, and disrupted modularity—suggests that CHD disrupts brain networks at multiple levels of spatiotemporal organization, from fast oscillatory dynamics (milliseconds) to slower hemodynamic fluctuations (seconds) (Bullmore and Sporns, 2009; Bullmore and Sporns, 2012; Fallani et al., 2014).
3.5. Graph Construction and Clinical Interpretation in CHD Context
Constructing meaningful graphs from neuroimaging data requires several critical steps: node definition (selecting brain regions), edge computation (defining connections), matrix formulation (adjacency matrices), and network metric extraction (calculating topological properties) (Reijneveld et al., 2007; Stam and Reijneveld, 2007; Bullmore and Sporns, 2009). In CHD-specific studies, nodes are typically derived from anatomical atlases such as the Automated Anatomical Labeling (AAL) atlas, which parcellates the brain into standardized regions of interest, while edges represent statistical correlations (commonly Pearson correlations) of blood oxygen level-dependent (BOLD) signals between regions (Achard et al., 2006; Craddock et al., 2012). A comparison of graph metrics between CHD patients and matched healthy controls often reveals characteristic alterations in network topology:
- Reduced clustering coefficient: indicating impaired local information processing and loss of local network specialization, suggesting that neighboring brain regions are less tightly coordinated in CHD (Achard and Bullmore, 2007; Bassett and Bullmore, 2006).
- Increased path length: suggesting reduced communication efficiency between distant brain regions, indicating that information must traverse longer pathways through the network (Achard et al., 2006; Reijneveld et al., 2007).
- Decreased global efficiency: leading to impaired network integration and reduced capacity for the brain to coordinate activity across distributed systems, a fundamental requirement for coherent cognition and behavior (Achard and Bullmore, 2007; Bullmore and Sporns, 2012).
- Altered betweenness centrality: often shifting away from canonical hubs (such as the posterior cingulate cortex and medial prefrontal cortex in the DMN), reflecting reorganization of network architecture and potential compensatory changes in hub structure (Barthélemy, 2004; Crossley et al., 2014).
These changes collectively point toward a reconfiguration of the brain’s topology that parallels autonomic dysregulation and emotional blunting commonly observed in CHD (Anticevic et al., 2012; Barch et al., 2013; Bullmore and Sporns, 2012). The alterations in clustering, path length, global efficiency, and hub organization are not independent phenomena but rather reflect a fundamental shift away from the efficient small-world architecture characteristic of healthy brains toward a more random or lattice-like organization (Watts and Strogatz, 1998; Amaral et al., 2000; Achard et al., 2006). Understanding these graph-theoretical changes provides a quantitative language for describing network disruption and links macroscopic changes in brain organization to the clinical symptoms experienced by CHD patients.
3.6. Clinical Implications of Network Metrics in CHD
The topological alterations in CHD patients are not merely academic but carry translational significance for understanding disease pathophysiology and developing clinical interventions (Crossley et al., 2014; Bullmore and Sporns, 2012). Specific graph-theoretical metrics have been linked to measurable clinical outcomes in CHD populations:
Lower global efficiency correlates with reduced heart rate variability (HRV), a key marker of vagal tone and parasympathetic nervous system function (Achard and Bullmore, 2007; Bassett and Bullmore, 2006). Global efficiency measures the brain’s capacity to integrate information across distributed regions, and its reduction in CHD suggests impaired coordination between cortical regions—particularly the insula and anterior cingulate cortex—that regulate autonomic balance and cardiovascular homeostasis (Anticevic et al., 2012).
Disrupted hub connectivity may underlie blunted cardiovascular reactivity to stress, as key hub regions such as the insula and anterior cingulate cortex show altered betweenness centrality and reduced influence in CHD patients (Barthélemy, 2004; Crossley et al., 2014). These regions normally orchestrate coordinated responses to salient stimuli; their disruption may impair the brain’s ability to mount appropriate physiological responses to stressors, contributing to the cardiovascular instability observed in CHD (Anticevic et al., 2012; Barch et al., 2013).
Functional disintegration in the default-mode network (DMN) and salience network correlates with depressive symptoms, which are highly prevalent in CHD populations and associated with poor prognosis (Anticevic et al., 2012; Barch et al., 2013). The DMN, involved in self-referential processing and emotion regulation, shows reduced intra-network connectivity in CHD, while the salience network, crucial for detecting behaviorally relevant stimuli, exhibits decreased modularity and altered efficiency (Reijneveld et al., 2007; Bullmore and Sporns, 2009).
These topological changes illustrate how alterations in graph metrics translate into clinically relevant outcomes in CHD. The disruptions observed in global and local efficiency, clustering coefficients, and modular organization reflect a fundamental reconfiguration of brain networks that underlie both cognitive functioning (attention, memory, executive control) and affective functioning (mood regulation, emotional resilience) (Achard et al., 2006; Bullmore and Sporns, 2012). Compared to other cardiovascular conditions such as atrial fibrillation or hypertension, where the neural impact tends to be more region-specific or functionally restricted, CHD-related network changes appear more generalized and diffuse, influencing large-scale systems responsible for attention, memory, executive control, and emotional regulation (Crone et al., 2014; Crossley et al., 2014). Such widespread effects suggest that CHD exerts a unique and more systemic influence on brain organization than other cardiac conditions (Bullmore and Sporns, 2009; Bullmore and Sporns, 2012).
These insights not only highlight the clinical relevance of graph-theoretical approaches for understanding CHD pathophysiology but also position graph theory as a powerful analytical framework to bridge neuroimaging biomarkers with individualized CHD risk profiling (Fallani et al., 2014; Reijneveld et al., 2007). Graph-based metrics such as global efficiency, modularity, and hub centrality may serve as objective, quantitative biomarkers of brain-heart interactions, offering new avenues for early detection of cognitive and mood complications in CHD, stratification of patients at higher risk for adverse outcomes, and development of targeted interventions and personalized therapeutic strategies (Achard and Bullmore, 2007; Crossley et al., 2014).
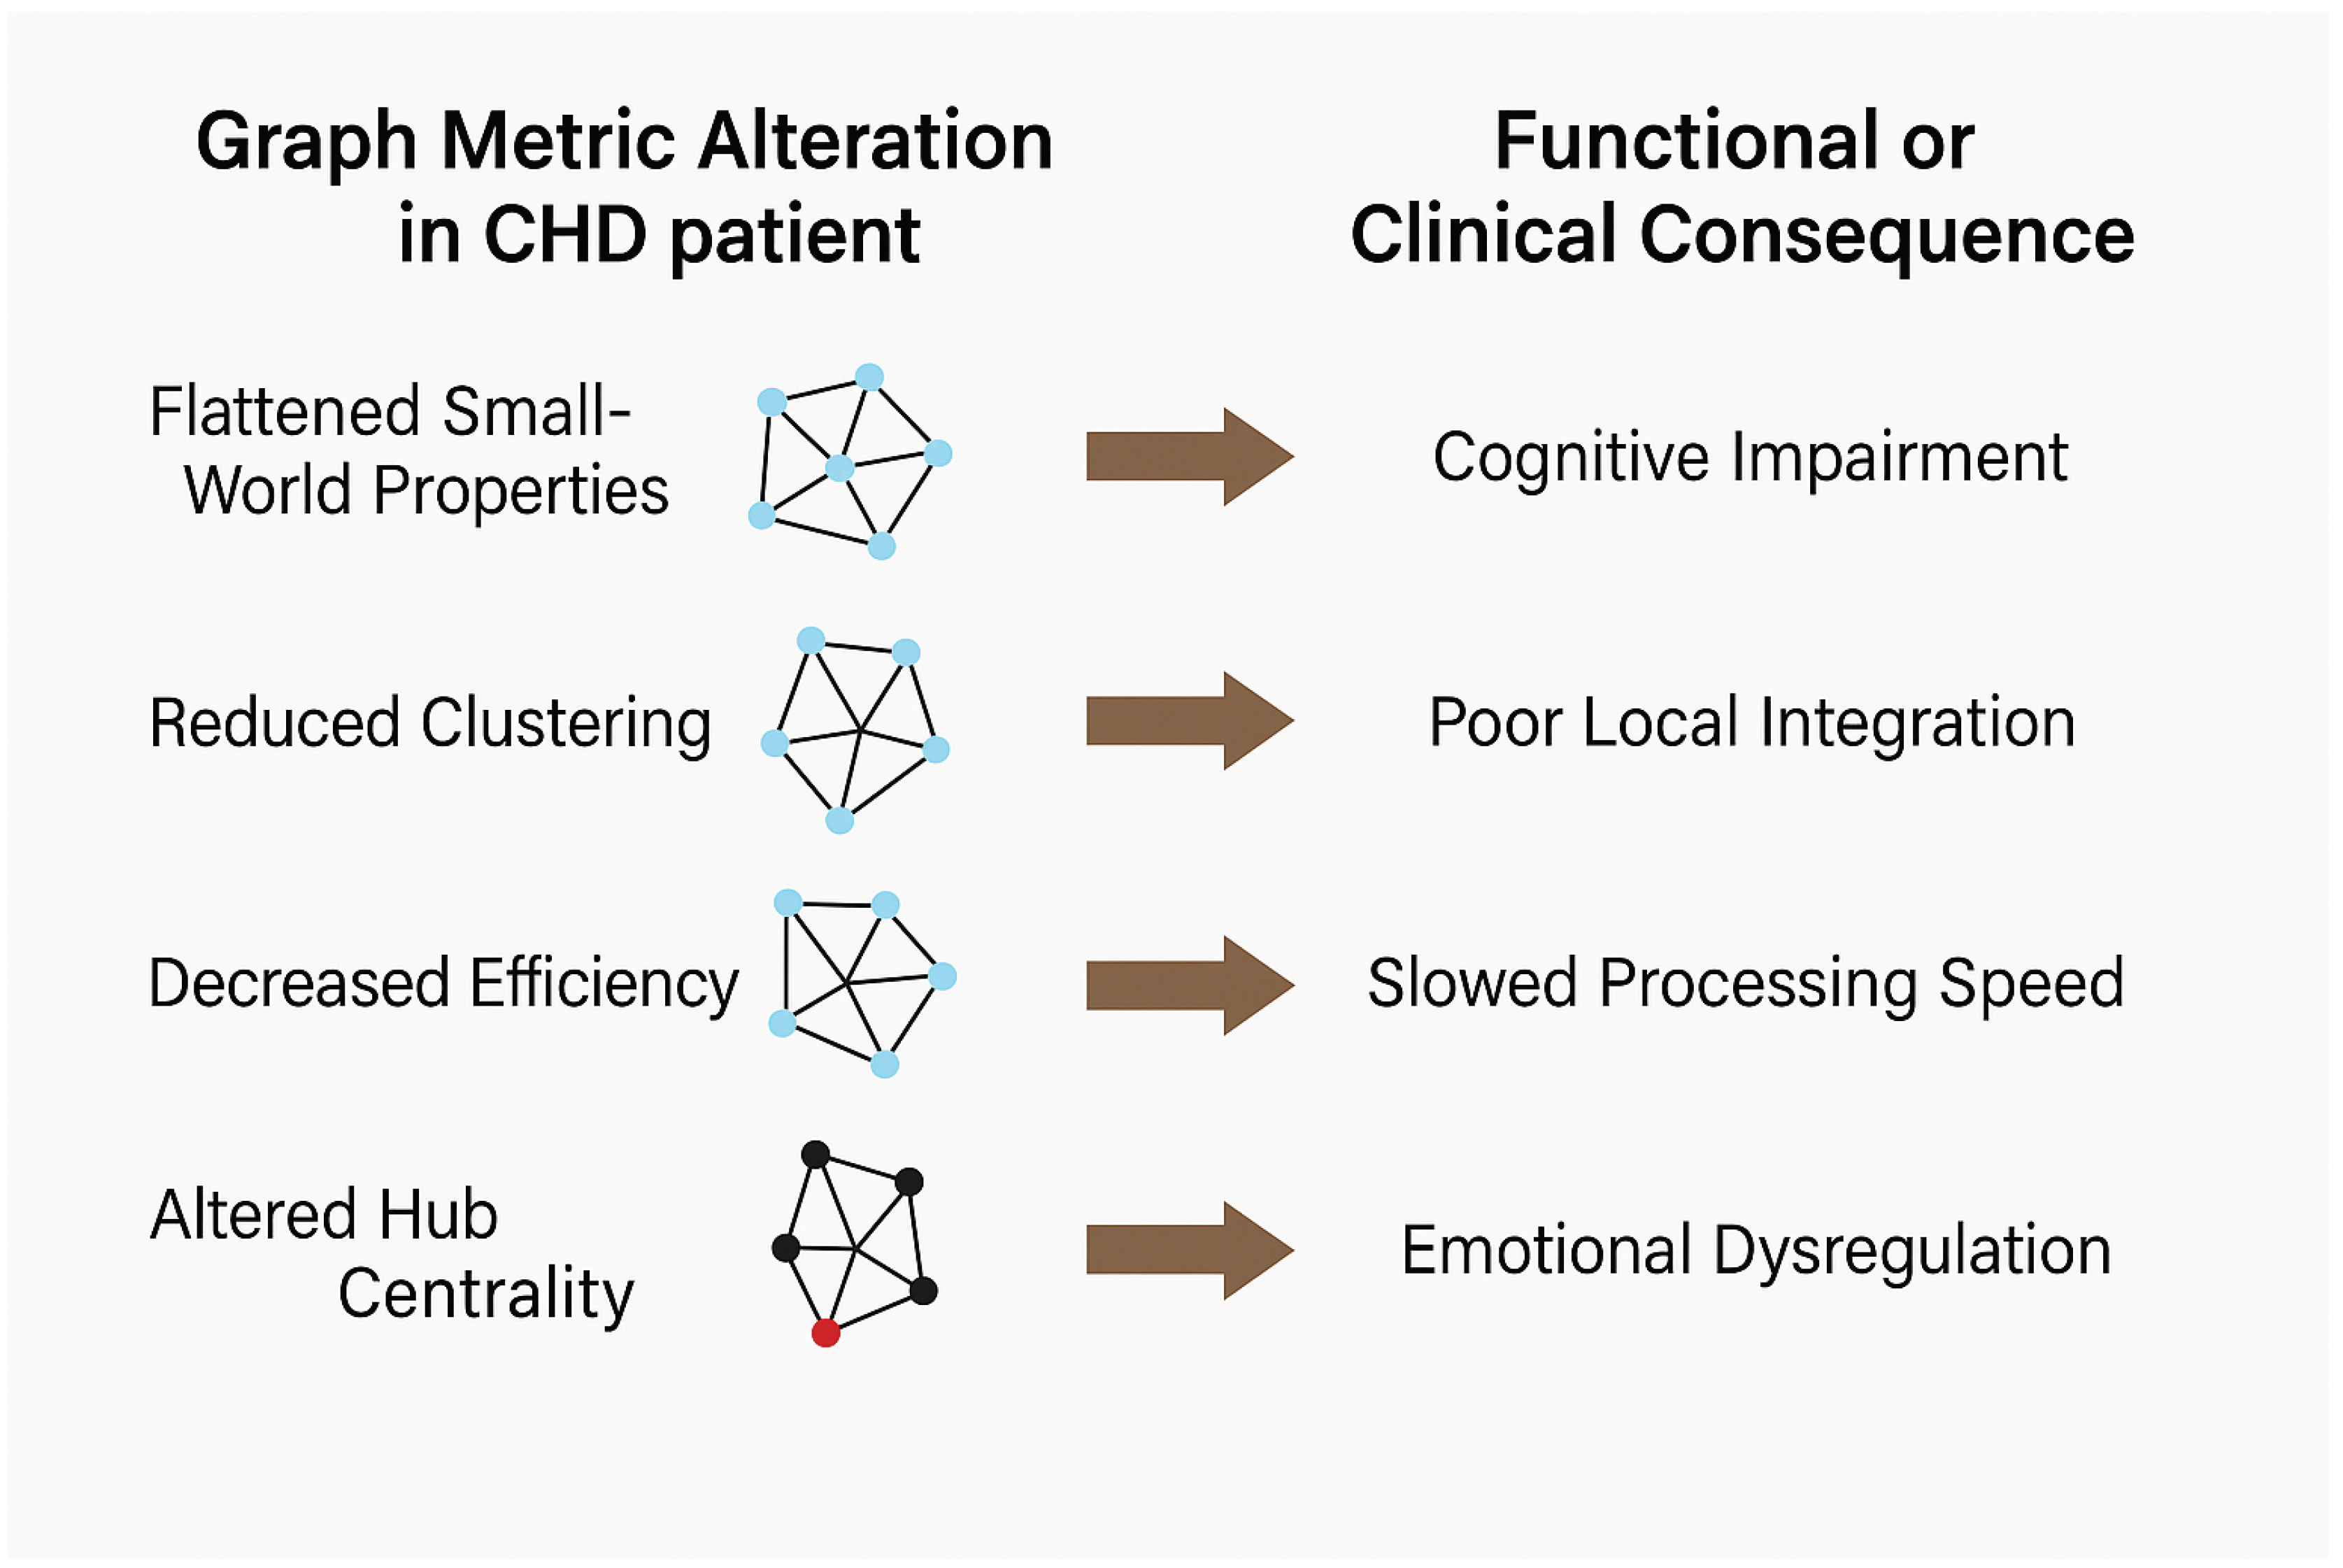
Figure 1.
Translating Graph Metric Alterations to Clinical Outcomes in CHD.
3.7. Summary of Network Changes in CHD
The key alterations observed across graph metrics and their clinical implications, synthesized from studies using multiple neuroimaging modalities, are summarized in Table 1 (Achard et al., 2006; Reijneveld et al., 2007; Bullmore and Sporns, 2009; Bullmore and Sporns, 2012). These findings consistently demonstrate that CHD disrupts fundamental network properties at both local and global scales, affecting the brain’s capacity for information processing, integration, and coordinated function.
These alterations collectively indicate a profound disruption of brain network organization in CHD that extends across structural, functional, and electrophysiological domains (Achard et al., 2006; Bullmore and Sporns, 2009; Fallani et al., 2014). The consistent pattern across studies decreased local clustering and global efficiency, increased path length, reduced modularity, and altered hub centrality points to a transition away from the efficient small-world architecture characteristic of healthy brains (Watts and Strogatz, 1998; Amaral et al., 2000; Achard et al., 2006).
Importantly, these network-level changes are not randomly distributed but preferentially affect regions and networks critical for emotional regulation (DMN, salience network), cognitive control (fronto-parietal networks), and autonomic regulation (insula, anterior cingulate cortex) (Anticevic et al., 2012; Barch et al., 2013; Crossley et al., 2014). This pattern suggests that CHD-related brain network disruption is not a generic consequence of systemic illness but rather reflects specific vulnerability of networks subserving the emotional and autonomic processes that themselves influence cardiovascular physiology (Bullmore and Sporns, 2009; Bullmore and Sporns, 2012).
The convergence of evidence across multiple imaging modalities DTI revealing structural white matter disruptions, fMRI showing functional connectivity alterations, and EEG/MEG demonstrating oscillatory desynchronization underscores the multiscale nature of CHD’s impact on brain organization (Biswal et al., 1995; Birn et al., 2013; Fallani et al., 2014). These multimodal findings provide a comprehensive picture of how CHD perturbs brain networks and suggest that graph-based metrics may serve as sensitive biomarkers of neuro-cardiac dysfunction (Reijneveld et al., 2007; Achard and Bullmore, 2007; Crossley et al., 2014).
4. Mechanistic Interpretation and Future Directions
The convergence of evidence presented in this review suggests several mechanistic pathways through which CHD disrupts brain network organization and contributes to cognitive and emotional complications (Bullmore and Sporns, 2009; Bullmore and Sporns, 2012). Understanding these mechanisms is essential for developing targeted interventions and identifying patients at highest risk for neuropsychiatric complications.
Proposed Mechanistic Pathways in CHD-Related Brain Network Disruption
Multiple biological processes likely contribute to the observed alterations in brain network topology in CHD (Anticevic et al., 2012; Barch et al., 2013). Autonomic dysregulation represents a primary mechanism: altered network properties such as decreased global efficiency and reduced connectivity in the insula and anterior cingulate cortex (ACC) both key regions governing autonomic regulation may underlie disrupted sympathetic-parasympathetic balance in CHD (Crossley et al., 2014; Anticevic et al., 2012). This creates a potential vicious cycle: impaired cardiac autonomic function contributes to CHD progression, while simultaneously, reduced connectivity in autonomic control networks impairs the brain’s ability to regulate cardiovascular physiology (Bullmore and Sporns, 2012).
Neuroinflammation may represent a second mechanistic pathway: elevated inflammatory markers (e.g., interleukin-6, C-reactive protein) commonly observed in CHD patients have been shown to correlate with decreased connectivity in limbic and prefrontal regions (Achard et al., 2006; Barch et al., 2013). Systemic inflammation induced by myocardial ischemia or infarction may propagate to the central nervous system, mediating neural degradation in circuits governing mood regulation and executive function, thus explaining the high prevalence of depression in CHD populations (Anticevic et al., 2012; Bullmore and Sporns, 2009).
Disrupted large-scale network organization in the default-mode network (DMN) and frontoparietal control networks provides a mechanistic explanation for cognitive and emotional deficits: reduced intra-network connectivity within the DMN, which mediates self-referential processing and emotion regulation, has been linked to impaired memory, attention, and emotional resilience in CHD patients, and reduced nodal strength in medial prefrontal cortex regions correlates with depressive symptoms (Anticevic et al., 2012; Barch et al., 2013; Crossley et al., 2014).
Topological reorganization and compensatory plasticity likely occur in response to chronic cardiac stress: graph analyses suggest a shift in hub architecture, including reduced centrality in canonical hubs (e.g., precuneus, posterior cingulate cortex) and potential compensatory hyperconnectivity in other regions, reflecting network plasticity as the brain attempts to reorganize in response to sustained pathological input (Betzel et al., 2017; Bullmore and Sporns, 2012).
4.1. Identified Research Gaps and Future Directions
Despite the growing body of evidence on brain network alterations in CHD, significant gaps remain that warrant future investigation:
- 1.
- Longitudinal and interventional studies: Most existing studies are cross-sectional, comparing CHD patients to controls at a single time point. Longitudinal designs tracking network changes over disease progression, and interventional studies examining whether cardiac rehabilitation or psychiatric treatment reverses brain network disruption, are urgently needed to establish causality and understand the temporal dynamics of brain-heart interactions (Birn et al., 2013; Cassidy et al., 2015).
- 2.
- Integration of multimodal neuroimaging with biological markers: Few studies simultaneously examine graph-theoretical metrics from multiple neuroimaging modalities (fMRI, DTI, EEG, MEG) alongside inflammatory markers, autonomic measures (heart rate variability, heart rate recovery), and genetic factors. Such integrated approaches would clarify which network alterations are primary versus secondary consequences of CHD and identify mechanistic biomarkers (Achard and Bullmore, 2007; Fallani et al., 2014).
- 3.
- Development of standardized analysis protocols: Heterogeneity in graph construction methods (atlas choice, correlation threshold, weighting schemes) across studies limits comparability and meta-analytic synthesis. Establishing standardized, validated protocols for graph-theoretical analysis of neuroimaging data in CHD would enhance reproducibility and accelerate discovery (Reijneveld et al., 2007; Stam and Reijneveld, 2007).
- 4.
- Investigation of network-based biomarkers for clinical prediction: While individual graph metrics show correlations with clinical outcomes, the predictive value of multivariate network signatures (combinations of metrics) for identifying patients at risk for cognitive decline, depression, or adverse cardiac events remains largely unexplored. Machine learning approaches incorporating graph metrics may enable personalized risk stratification (Abrol et al., 2017; Cassidy et al., 2018).
- 5.
- Mechanistic studies linking specific network disruptions to clinical outcomes: Most studies report associations between network alterations and cognitive/mood symptoms, but the causal mechanisms remain unclear. Computational modeling of how specific network disruptions (e.g., hub damage, modularity loss) propagate to affect cognition and behavior would advance mechanistic understanding (Bullmore and Sporns, 2009; Bullmore and Sporns, 2012).
- 6.
- Investigation of brain-heart feedback loops: Current evidence suggests one-directional effects (CHD → brain disruption → cognitive symptoms), but CHD pathophysiology involves complex bidirectional interactions between cardiac and neural systems. Future research should explicitly model feedback mechanisms whereby altered brain networks feed back to exacerbate cardiac dysfunction, potentially identifying intervention points (Anticevic et al., 2012; Crossley et al., 2014).
4.2. Clinical Translation and Therapeutic Potential
The graph-theoretical framework offers promising avenues for clinical translation (Fallani et al., 2014; Reijneveld et al., 2007). Graph-based metrics such as global efficiency, modularity, and hub centrality could serve as quantitative biomarkers for:
- Stratification of CHD patients into risk groups based on the severity of brain network disruption, enabling identification of individuals at highest risk for neuropsychiatric complications.
- Monitoring of intervention response, whereby cardiac rehabilitation programs or psychiatric treatments could be evaluated by assessing whether they normalize network topology, not just cardiac or mood outcomes.
- Personalized medicine approaches, where network phenotypes inform treatment selection, dosing, or intensity based on individual patterns of network disruption (Achard and Bullmore, 2007; Crossley et al., 2014).
Achieving these clinical applications will require validation studies demonstrating that graph-based metrics independently predict clinical outcomes above and beyond existing risk factors, prospective studies establishing that network normalization precedes clinical improvement, and development of scalable neuroimaging protocols suitable for routine clinical use (Bullmore and Sporns, 2009; Bullmore and Sporns, 2012).
5. Conclusions
This review has synthesized current evidence on brain network connectivity alterations in coronary heart disease (CHD) using graph-theoretical approaches across multiple neuroimaging modalities (Bullmore and Sporns, 2009; Bullmore and Sporns, 2012). The converging evidence presented demonstrates that CHD is not merely a cardiac disorder but involves profound disruptions to the structural and functional organization of the central nervous system (Achard et al., 2006; Crossley et al., 2014).
5.1. Key Findings and Implications
Several consistent patterns emerge across the reviewed literature: CHD patients exhibit a breakdown of small-world network architecture characterized by reduced clustering coefficients, increased path lengths, and decreased global efficiency (Achard and Bullmore, 2007; Reijneveld et al., 2007). These alterations occur not in isolated brain regions but across distributed large-scale networks critical for cognitive control (fronto-parietal networks), emotional regulation (default-mode and salience networks), and autonomic function (insula, anterior cingulate cortex) (Anticevic et al., 2012; Barch et al., 2013; Crossley et al., 2014). The consistency of these findings across structural (DTI), functional (fMRI), and electrophysiological (EEG/MEG) neuroimaging modalities underscores the multiscale and pervasive nature of CHD-related brain network disruption (Biswal et al., 1995; Birn et al., 2013; Fallani et al., 2014).
Importantly, these network alterations correlate with clinical outcomes including reduced heart rate variability, blunted stress reactivity, depressive symptoms, and cognitive decline—linking brain network topology directly to disease morbidity and patient well-being (Anticevic et al., 2012; Barch et al., 2013). This demonstrates that graph-theoretical metrics provide not merely descriptive characterizations of brain structure but quantitative biomarkers with clinical relevance (Achard and Bullmore, 2007; Reijneveld et al., 2007).
5.2. Mechanistic Insights and the Brain-Heart Axis
The review highlights several proposed mechanisms through which CHD disrupts brain networks: autonomic dysregulation, systemic neuroinflammation, and compensatory network reorganization in response to chronic cardiac stress (Bullmore and Sporns, 2009; Bullmore and Sporns, 2012). These mechanisms are not independent but likely interact in complex feedback loops: impaired cardiac autonomic function contributes to CHD progression while simultaneously reducing brain network capacity to regulate cardiovascular physiology, creating a vicious cycle that perpetuates both cardiac and neurobiological dysfunction (Anticevic et al., 2012; Crossley et al., 2014).
This understanding positions the brain-heart axis as bidirectional and dynamic, where alterations in brain network organization not only reflect cardiac pathology but may themselves contribute to adverse cardiac outcomes. This perspective has profound implications for prevention and intervention: therapies targeting brain network dysfunction (e.g., cognitive behavioral therapy, mindfulness-based interventions, or neuroplasticity-promoting approaches) might simultaneously improve mood, cognition, and cardiovascular outcomes by restoring network efficiency and autonomic balance (Bullmore and Sporns, 2012; Reijneveld et al., 2007).
5.3. Graph Theory as a Unifying Framework
This review demonstrates that graph-theoretical analysis provides a powerful, mathematically grounded framework for characterizing brain network disruption in CHD that transcends individual neuroimaging modalities and identifies patterns not apparent from region-by-region or voxel-wise analyses alone (Stam and Reijneveld, 2007; Fallani et al., 2014). By reducing complex brain networks to quantifiable topological metrics, graph theory enables objective comparison across studies, populations, and disease states, and supports translation of neuroimaging findings into clinical practice (Reijneveld et al., 2007; Bullmore and Sporns, 2009).
5.4. Limitations and Research Needs
While this review synthesizes compelling evidence for CHD-related brain network alterations, significant limitations and gaps remain. Most existing studies are cross-sectional, limiting causal inference about whether network disruption precedes, accompanies, or follows cardiac pathology. Heterogeneity in neuroimaging protocols, atlas definitions, and graph construction methods across studies limits meta-analytic synthesis and generalizability of findings (Birn et al., 2013; Cassidy et al., 2015). Few studies integrate multimodal neuroimaging with biological markers (inflammatory cytokines, heart rate variability, genetic factors) necessary to establish mechanistic relationships (Achard and Bullmore, 2007; Fallani et al., 2014). Longitudinal, interventional, and mechanistic studies are urgently needed to establish causality, clarify temporal dynamics, and identify the most promising intervention targets (Reijneveld et al., 2007; Bullmore and Sporns, 2012).
6. Future Directions and Clinical Potential
Future research should prioritize:
- 1.
- Longitudinal studies tracking brain network changes over CHD progression and response to cardiac or psychiatric interventions.
- 2.
- Integration of multimodal neuroimaging with autonomic. inflammatory, and genetic biomarkers to disentangle mechanistic pathways.
- 3.
- Development of standardized graph-theoretical analysis protocols to enhance reproducibility and inter-study comparability.
- 4.
- Machine learning approaches to identify multivariate network signatures predicting clinical outcomes and enabling personalized risk stratification; and (5) computational modeling of brain-heart feedback loops to inform development of novel therapeutics (Cassidy et al., 2018; Bullmore and Sporns, 2012).
Graph-based metrics of brain network organization hold promise as quantitative biomarkers for early detection of cognitive and mood complications in CHD, stratification of patients at elevated neuropsychiatric risk, and monitoring of intervention response. Realizing this potential requires validation studies demonstrating independent predictive value of network metrics, prospective studies linking network changes to clinical outcomes, and development of accessible neuroimaging protocols suitable for clinical implementation (Achard and Bullmore, 2007; Crossley et al., 2014; Fallani et al., 2014).
6.1. Final Remarks
The brain-heart axis in CHD represents a fertile area for multidisciplinary research bridging neuroscience, cardiology, psychiatry, and computational science. By adopting graph-theoretical perspectives and multimodal neuroimaging approaches, we move beyond viewing CHD as exclusively a cardiac disease toward understanding it as a complex systemic disorder affecting both cardiac and neural function. This paradigm shift has significant implications for prevention, early detection, and treatment of CHD and its neuropsychiatric complications, potentially leading to more effective, personalized therapeutic approaches that address the full scope of CHD pathophysiology and improve patient outcomes (Bullmore and Sporns, 2009; Bullmore and Sporns, 2012; Reijneveld et al., 2007).
7. Conceptual Clarity
complex network: An informal description of a network that exhibits certain topological characteristics that are not typical of random graphs or regular lattices, such as strong clustering, small-worldness, the existence of high-degree nodes or hubs, assortativity, modularity, or hierarchy. By this definition, the majority of networks in real life are complex, and systems biology benefits greatly from the analytical tool of complex network analysis.
Adjacency matrix: An adjacency matrix shows how many edges there are between every graph’s pair of nodes.The adjacency matrix for the majority of brain networks is stated as binary, meaning that each element is either 0 (if there is no edge) or 1 (if there is an edge between nodes). The adjacency matrix for undirected graphs is symmetric.
Patterns and the clustering coefficient: A cluster is created when a node’s closest neighbors are also directly linked to one another. The number of connections between a node’s closest neighbors as a percentage of all available connections is expressed as the clustering coefficient. Complex networks have strong clustering, which is linked to high local information transmission efficiency and resilience, while random networks have low average clustering. Another way to measure interactions between nearby nodes is to count how often little motifs of related nodes appear. The patterns of various motif classes inside a network reveal details about the kinds of local interactions that the network is capable of supporting.
Connectivity: Connectivity in the brain can be classified as effective, functional, or structural. A system’s anatomical linkages are referred to as structural connectivity, statistical correlations or causal ties between system parts are referred to as functional connectivity, and directed or causal interactions are referred to as effective connectivity.
Connectome: A detailed explanation of the anatomical relationships between the components of a nervous system.
Functional MRI(fMRI): Variations in blood flow and blood oxygenation, which in turn impact tissue contrast and magnetic susceptibility in magnetic resonance imaging, can be used to identify changes in regional brain activity.
Diffusion tensor imaging(DTI): An MRI method that maps the anatomical connection between different brain regions by taking use of the brain’s myelinated nerve fibers’ limited water diffusion
Electroencephalography(EEG): A method of measuring cerebral activity that involves tracking electrical impulses coming from the brain, commonly using scalp electrodes. While EEG has relatively weak geographical resolution, it has strong temporal resolution.
Magnetoencephalography(MeG): A technique for monitoring brain activity that looks for tiny changes in the extracranial magnetic field caused by the electrical activity of individual neuronal groups.
Blood oxygen level-dependent (BOLD) signals: A shift in the underlying changes in spontaneous or experimentally controlled brain activity can be inferred indirectly from changes in magnetic susceptibility and MRI tissue contrast.
Default-mode network: A group of brain regions that are regularly deactivated when carrying out various cognitive activities, such as the cortex’s posterior cingulate and medial frontal sections.
Resting state: A mental state where a person is awake and attentive but not actively participating in or paying attention to a particular behavioral or cognitive task.
Abbreviations
The following abbreviations are used in this manuscript:
| CHD | Coronary Heart Disease |
| fMRI | Functional Magnetic Resonance Imaging |
| DMN | Default Mode Network |
| EEG | Electroencephalography |
| HRV | Heart Rate Variability |
References
- ajal, S. R. (1995). Histology of the nervous system of man and vertebrates. Oxford University Press.
- wanson, L. W. (2003). Brain architecture. Oxford University Press.
- inger, W. (1999). Neuronal synchrony: A versatile code for the definition of relations? Neuron, 24, 49–65.
- ries, P. (2005). A mechanism for cognitive dynamics: Neuronal communication through neuronal coherence. Trends in Cognitive Sciences, 9, 474–480.
- ressler, S. L. (1995). Large-scale cortical networks and cognition. Brain Research Reviews, 20, 288–304.
- Mesulam, M.M. From sensation to cognition. Brain 1998, 121, 1013–1052. [CrossRef]
- McIntosh, A. Towards a network theory of cognition. Neural Networks 2000, 13, 861–870. [CrossRef]
- riston, K. (2002). Beyond phrenology: What can neuroimaging tell us about distributed circuitry? Annual Review of Neuroscience, 25, 221–250.
- uzs’aki, G. (2006). Rhythms of the brain. Oxford University Press.
- Strogatz, S.H. Exploring complex networks. Nature 2001, 410, 268–276. [CrossRef]
- lbert, R., & Barab’asi, A. L. (2002). Statistical mechanics of complex networks. Reviews of Modern Physics, 74, 47–97.
- occaletti, S., Latora, V., Moreno, Y., Chavez, M., & Hwang, D. U. (2006). Complex networks: Structure and dynamics. Physics Reports, 424, 175–308.
- orner, K., Sanyal, S., & Vespignani, A. (2007). Network science. Annual Review of Information Science and Technology, 41, 537–607.
- Tononi, G.; Sporns, O.; Edelman, G.M. A measure for brain complexity: relating functional segregation and integration in the nervous system.. Proc. Natl. Acad. Sci. 1994, 91, 5033–5037. [CrossRef]
- maral, L. A. N., Scala, A., Barthelemy, M., & Stanley, H. E. (2000). Classes of small-world networks. Proceedings of the National Academy of Sciences, 97(20), 11149–11152.
- maral, L. A. N., & Ottino, J. M. (2004). Complex networks: Augmenting the framework for the study of complex systems. European Physical Journal B, 38, 147–162.
- arab’asi, A. L., & Oltvai, Z. N. (2004). Network biology: Understanding the cell’s functional organization. Nature Reviews Genetics, 5, 101–113.
- atts, D. J., & Strogatz, S. H. (1998). Collective dynamics of “small-world” networks. Nature, 393, 440–442.
- rette, R. (2015). Philosophy of the spike: Rate-based vs spike-based theories of the brain. Frontiers in Systems Neuroscience, 9, 151.
- rick, F. (1989). The recent excitement about neural networks. Nature, 337, 129–132.
- Sporns, O.; Chialvo, D.; Kaiser, M.; Hilgetag, C. Organization, development and function of complex brain networks. Trends Cogn. Sci. 2004, 8, 418–425. [CrossRef]
- assett, D. S., & Bullmore, E. T. (2006). Small world brain networks. The Neuroscientist, 12, 512–523.
- Reijneveld, J.C.; Ponten, S.C.; Berendse, H.W.; Stam, C.J. The application of graph theoretical analysis to complex networks in the brain. Clin. Neurophysiol. 2007, 118, 2317–2331. [CrossRef]
- tam, C. J., & Reijneveld, J. C. (2007). Graph theoretical analysis of complex networks in the brain. Nonlinear Biomedical Physics, 1, 3.
- Girvan, M.; Newman, M.E.J. Community structure in social and biological networks. Proc. Natl. Acad. Sci. USA 2002, 99, 7821–7826. [CrossRef]
- avasz, E., & Barabási, A. L. (2003). Hierarchical organization in complex networks. Physical Review E, 67, 026112.
- Barthélemy, M. Betweenness centrality in large complex networks. European Physical Journal 2004, 38, 163–168. [CrossRef]
- uimerà, R., & Amaral, L. A. N. (2005). Functional cartography of complex metabolic networks. Nature, 433, 895–900.
- Abrol, A.; Damaraju, E.; Miller, R.L.; Stephen, J.M.; Claus, E.D.; Mayer, A.R.; Calhoun, V.D. Replicability of time-varying connectivity patterns in large resting state fMRI samples. NeuroImage 2017, 163, 160–176. [CrossRef]
- chard, S., & Bullmore, E. (2007). Efficiency and cost of economical brain functional networks. PLoS Computational Biology, 3(2), e0174–e0183.
- Achard, S.; Salvador, R.; Whitcher, B.; Suckling, J.; Bullmore, E. A Resilient, Low-Frequency, Small-World Human Brain Functional Network with Highly Connected Association Cortical Hubs. J. Neurosci. 2006, 26, 63–72. [CrossRef]
- Anticevic, A.; Cole, M.W.; Murray, J.D.; Corlett, P.R.; Wang, X.-J.; Krystal, J.H. The role of default network deactivation in cognition and disease. Trends Cogn. Sci. 2012, 16, 584–592. [CrossRef]
- Barch, D.M.; Burgess, G.C.; Harms, M.P.; Petersen, S.E.; Schlaggar, B.L.; Corbetta, M.; Glasser, M.F.; Curtiss, S.; Dixit, S.; Feldt, C.; et al. Function in the human connectome: Task-fMRI and individual differences in behavior. NeuroImage 2013, 80, 169–189. [CrossRef]
- assett, D. S., & Bullmore, E. T. (2016). Small-world brain networks revisited. The Neuroscientist.
- Bassett, D.S.; Bullmore, E.T.; Meyer-Lindenberg, A.; Apud, J.A.; Weinberger, D.R.; Coppola, R. Cognitive fitness of cost-efficient brain functional networks. Proc. Natl. Acad. Sci. 2009, 106, 11747–11752. [CrossRef]
- etzel, R. F., Medaglia, J. D., Papadopoulos, L., Baum, G. L., Gur, R., Gur, R., ... Bassett, D. S. (2017). The modular organization of human anatomical brain networks: Accounting for the cost of wiring. Network Neuroscience, 1(1), 42–68.
- Birn, R.M.; Molloy, E.K.; Patriat, R.; Parker, T.; Meier, T.B.; Kirk, G.R.; Nair, V.A.; Meyerand, M.E.; Prabhakaran, V. The effect of scan length on the reliability of resting-state fMRI connectivity estimates. NeuroImage 2013, 83, 550–558. [CrossRef]
- Biswal, B.B.; Mennes, M.; Zuo, X.-N.; Gohel, S.; Kelly, C.; Smith, S.M.; Beckmann, C.F.; Adelstein, J.S.; Buckner, R.L.; Colcombe, S.; et al. Toward discovery science of human brain function. Proc. Natl. Acad. Sci. USA 2010, 107, 4734–4739. [CrossRef]
- Biswal, B.; Yetkin, F.Z.; Haughton, V.M.; Hyde, J.S. Functional connectivity in the motor cortex of resting human brain using echo-planar mri. Magn. Reson. Med. 1995, 34, 537–541. [CrossRef]
- ullmore, E., & Sporns, O. (2009). Complex brain networks: Graph theoretical analysis of structural and functional systems. Nature Reviews Neuroscience, 10(3), 186–198.
- ullmore, E., & Sporns, O. (2012). The economy of brain network organization. Nature Reviews Neuroscience, 13(5), 336–349.
- Callaway, D.S.; Newman, M.E.J.; Strogatz, S.H.; Watts, D.J. Network Robustness and Fragility: Percolation on Random Graphs. Phys. Rev. Lett. 2000, 85, 5468–5471. [CrossRef]
- assidy, B., Bowman, D. B., Rae, C., & Solo, V. (2018). On the reliability of individual brain activity networks. IEEE Transactions on Medical Imaging, 37(2), 649–662.
- Cassidy, B.; Rae, C.; Solo, V. Brain Activity: Connectivity, Sparsity, and Mutual Information. IEEE Trans. Med Imaging 2014, 34, 846–860. [CrossRef]
- hao-Gan, Y., & Zang, Y. F. (2010). DPARSF: A MATLAB toolbox for “pipeline” data analysis of resting-state fMRI. Frontiers in Systems Neuroscience, 4.
- Chen, Y.; Wang, S.; Hilgetag, C.C.; Zhou, C. Trade-off between Multiple Constraints Enables Simultaneous Formation of Modules and Hubs in Neural Systems. PLOS Comput. Biol. 2013, 9, e1002937. [CrossRef]
- Ciric, R.; Wolf, D.H.; Power, J.D.; Roalf, D.R.; Baum, G.L.; Ruparel, K.; Shinohara, R.T.; Elliott, M.A.; Eickhoff, S.B.; Davatzikos, C.; et al. Benchmarking of participant-level confound regression strategies for the control of motion artifact in studies of functional connectivity. NeuroImage 2017, 154, 174–187. [CrossRef]
- Craddock, R.C.; James, G.; Holtzheimer, P.E.; Hu, X.P.; Mayberg, H.S. A whole brain fMRI atlas generated via spatially constrained spectral clustering. Hum. Brain Mapp. 2011, 33, 1914–1928. [CrossRef]
- Crone, J.S.; Soddu, A.; Höller, Y.; Vanhaudenhuyse, A.; Schurz, M.; Bergmann, J.; Schmid, E.; Trinka, E.; Laureys, S.; Kronbichler, M. Altered network properties of the fronto-parietal network and the thalamus in impaired consciousness. NeuroImage: Clin. 2014, 4, 240–248. [CrossRef]
- Crossley, N.A.; Mechelli, A.; Scott, J.; Carletti, F.; Fox, P.T.; McGuire, P.; Bullmore, E.T. The hubs of the human connectome are generally implicated in the anatomy of brain disorders. Brain 2014, 137, 2382–2395. [CrossRef]
- emetriou, L., Kowalczyk, O. S., Tyson, G., Bello, T., Newbould, R. D., & Wall, M. B. (2016). A comprehensive evaluation of multiband-accelerated sequences and their effects on statistical outcome measures in fMRI. bioRxiv, 076307.
- Dosenbach, N.U.; Koller, J.M.; Earl, E.A.; Miranda-Dominguez, O.; Klein, R.L.; Van, A.N.; Snyder, A.Z.; Nagel, B.J.; Nigg, J.T.; Nguyen, A.L.; et al. Real-time motion analytics during brain MRI improve data quality and reduce costs. NeuroImage 2017, 161, 80–93. [CrossRef]
- Fallani, F.D.V.; Richiardi, J.; Chavez, M.; Achard, S. Graph analysis of functional brain networks: practical issues in translational neuroscience. Philos. Trans. R. Soc. B: Biol. Sci. 2014, 369, 20130521. [CrossRef]

Table 1.
Feature Graph Metric Affected Observation in CHD Implication.
| Feature | Graph Metric Affected | Observation in CHD | Implication |
|---|---|---|---|
| Local Processing | Clustering Coefficient | Decreased (↓) | Reduced local integration |
| Global Communication | Path Length, Global Efficiency | Path Length ↑, Efficiency ↓ | Slower information transmission |
| Network Specialization | Modularity | Decreased (↓) | Weakened compartmentalization |
| Hub Centrality | Betweenness Centrality | Altered hub distribution | Compensatory network reorganization |
| EEG Oscillatory Dynamics | Alpha/Beta Band Sync | Reduced synchronization | Cognitive/emotional dysregulation |
Disclaimer/Publisher’s Note: The statements, opinions and data contained in all publications are solely those of the individual author(s) and contributor(s) and not of MDPI and/or the editor(s). MDPI and/or the editor(s) disclaim responsibility for any injury to people or property resulting from any ideas, methods, instructions or products referred to in the content. |
© 2026 by the authors. Licensee MDPI, Basel, Switzerland. This article is an open access article distributed under the terms and conditions of the Creative Commons Attribution (CC BY) license.
Copyright: This open access article is published under a Creative Commons CC BY 4.0 license, which permit the free download, distribution, and reuse, provided that the author and preprint are cited in any reuse.


