
Submitted:
05 February 2026
Posted:
10 February 2026
You are already at the latest version
Abstract
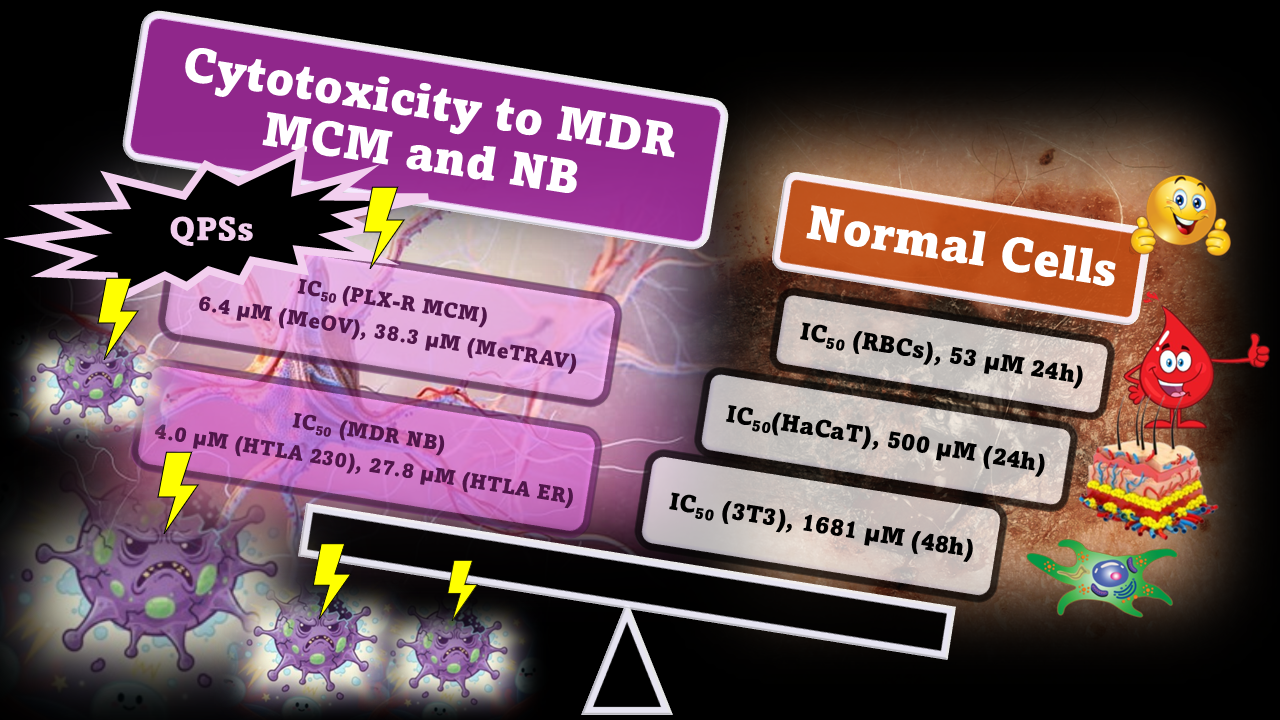
Background. Late-stage metastatic cutaneous melanoma (MCM) and neuroblastoma (NB) are the most aggressive skin and childhood cancers with survival rate < 50%, mainly due to the emergence of resistance to available drugs, thus requiring urgent solution. Quaternary phosphonium salts (QPSs) can exhibit up to strong anticancer effects, regardless the developed resistances. Methods. Triphenyl (1) and diphenyl (3 and 4) phosphonium salts were synthesized, treating commercial triphenyl phosphine and synthesized 11-diphenylphosphanyl-undecan-1-ol (2) respectively, with benzyl bromide. Upon fully characterization, they were tested, for the first time, on MeTRAV (BRAFV600D) and MeOV (BRAFV600E) vemurafenib (PLX)-resistant MCM cells, etoposide (ETO)-sensitive (HTLA 230) and multidrug resistant (MDR) (HTLA ER) NB cells, not tumorigenic human keratinocytes (HaCaT) and mouse embryonic fibroblasts (3T3), as well as red blood cells (RBCs). Results and Discussion. Viability of MeTRAV cells was decreased to 44.8% by admin-istration of 1 (100 µM), in intermediate-time (48h) treatments, while short-time exposure (24h) to 3 (≥ 75 µM) and 4 (≥ 50 µM) was sufficient to reduce their viability to 33.6 and 32.2%. Viability of MeOV was decreased under 50% with 5 µM concentrations of 1 and 25 µM of 3 and 4, while were exterminated (26.9, 20.6 and 21.8%) with higher concentrations after 48h exposure. Collectively, 1 was the better performant compound (IC50 = 6.4 µM, 48h). Viability of HTLA ER cells was decreased under 50% upon 72h administrations of 1 at concentrations ≥ 50 µM, 48h (≥ 75 µM) and 72h (≥ 50 µM) of 3 and after 72h (≥ 75 µM) of 4, but 72-hours exposure and high concentrations of all compounds were necessary for their extermination (31.2, 28.7, 29.7%). Viability of HTLA 230 cells was not < 50% when 1 and 4 were administered for only 24h, while their viability was < 50% after administration of 3 at all-times exposure. At high concentrations all compounds exterminated cells (33.6, 25.3%, 1, 48-72h; 38.6, 30.2, 24.7%, 3, 24-72h; 33.2%, 4, 72h). The best performant compounds were 1 (IC50 = 4.0 µM, HTLA 230) and 3 (IC50 = 27.8 µM, HTLA ER) at 72h exposure. The cytotoxic effects of compound 4 on MeTRAV cells, when exposed to 24/48h treatments were comparable to those of PLX on same cells in 72h ones. 1, in shorter 48h treatments of PLX-R MeOV, was 2.5forl more cytotoxic than PLX in 72h ones. All compounds were no cytotoxic to 3T3 cells, at all time of exposure, low cytotoxic to HaCaT cells in 24 and 48h treatments and softly cytotoxic to RBCs in 24h ones. Conclusions. Compound 1 could be a promising platform to develop new intermediate-time therapies for PLX-R MeOV cells, while 4, to develop 24- and 48-hours treatments for PLX-R MeTRAV cells. Also, all compounds could be developed as new treatment options for both ETO-sensitive and MDR late-stage HR-NB cells, being all more effective than ETO by 1.2, 2.0, 1.3 times (HTLA 230) and 3.2, 4.7 and 3.2 times (HTLA ER). All compounds could be interesting to be developed as adjuvants in already existing anticancer cocktails to treat MCM and/or NB.
Keywords:
metastatic cutaneous melanoma (MCM)
; high-risk neuroblastoma (HR-NB)
; quaternized phosphonium salts (QPSs)
; micro vesicles
; cell viability (%)
; haemolytic effects
; cytotoxicity on HaCaT and 3T3 cells
1. Introduction
Cutaneous melanoma (CM) is a malignant tumour, accounting for more than 90% of melanoma diagnoses, especially in young age white populations. It originates from melanocytes, which are cells responsible for the synthesis of melanin, found mostly in the skin [1], but present also in other tissue and organs [2]. Collectively, melanoma account for about 25, 30 and 60 new cases per 100 000 population in Europe, in the USA, and in Australia and New Zealand [3]. In Italy, CM is currently the third most frequent tumour in both sexes under the age of 50, with recorded diagnoses which reached the number of 17,000 in 2024 [3]. Metastatic cutaneous melanoma (MCM) is triggered by a complex interaction of UVR-mediated oncogenic aberrations such as BRAF, NRAS or KIT mutations with phenotypic risk factors, including lighter skin tones, sun sensitivity, or naevus count and type [1,4,5]. Mutations in BRAF human proto-oncogene have been identified in 50% of malignant melanomas [6], and approximately 40-70% of the cases show a missense mutation, with a substitution of valine with glutamic acid at codon 600, named as V600E[7]. The identification of oncogenic driver mutations, such as KRAS and BRAF, has led to the development of small-molecule inhibitors along the RAS-RAF-MEK-MAPK signalling pathway[8].
MCM management comprises different treatments, including surgery, chemotherapy, immune checkpoint modulator therapy, and/or radiation therapy. Unfortunately, such methods are frequently not effective in the treatment of metastatic and advanced melanoma[9]. In fact, various features, including brain metastases, PD-L1 expression, BRAF mutation, performance status, and prior adjuvant therapy, significantly impact the direction of advanced melanoma treatment[10]. Recent approaches to treat late-stage MCM have focused on biomarkers that play significant roles in cell growth, proliferation, migration, and survival[9]. In this context, tyrosine kinase inhibitors (TKIs) are FDA-approved drugs able to act on BRAF, MEK, RAS, c-KIT, VEGFR, c-MET and PI3K, whose overexpression is implicated in tumorigenesis [9]. The use of targeted systemic therapies as adjuvants to surgery when possible, or as an alternative or supplement to immunotherapy has revolutionized the management of metastatic melanoma [11].
Unfortunately, despite the new treatment strategies are more efficacious and less toxic in comparison to traditional therapies, targeted therapies are less effective after prolonged treatment due to the acquisition of resistance [9]. Therefore, it is crucial to understand the mechanisms underlying the acquisition of resistance, as this condition occurs in most malignancies. For example, chemoresistance is often observed in neuroblastoma (NB), one of the most common extra-cranial paediatric solid tumours [12,13,14], which, like CM, originates from neural crest cells [15] Indeed, although CM and NB arise at different ages, involve different tissue and have different metastatic spread, in both cases, the prognosis for high-risk patients is still poor.
To shed light on mechanisms involved in the acquisition of chemoresistance, we have previously selected and characterised both NB and CM cell lines resistant to commonly used drugs[16]. Regarding high-risk NB it has been reported that its aggressive phenotype is strongly associated with the amplification of the MYCN proto-oncogene [17]. High-risk NB patients are currently treated with combined therapies including etoposide together with doxorubicin, cisplatin, vincristine etc. However, although patients initially respond well to etoposide (ETO)-based therapy, which induces DNA damage and apoptosis through the inhibition of topoisomerase II and ROS production [16], most tumours relapse and acquire resistance. In this context, chronic ETO exposure has been shown to promote the development of multidrug resistance (MDR) in MYCN-amplified NB cells, enabling efficient DNA repair and escape from apoptosis. Mechanistically, prolonged ETO treatment induces genetic and epigenetic alterations, including deletion of the 13q14.3 locus, downregulation of miR-15a/16-1, and subsequent upregulation of BMI-1, which supports redox homeostasis and metabolic adaptation in drug-resistant cells, Figure 1 [16]. Similarly, also in CM cells, the chronic exposure to PLX, a drug specifically used in CM patients with BRAF V600E mutation, generated a chemo-resistant population which adapt well to the drug by maintaining an efficient oxidative metabolism and up-regulating the antioxidant cell defences.[18].
1.1. The Rational of The Study
Recently, we demonstrated for the first time, the potent and quite selective per se anticancer effects of a bola-amphiphilic (BA) molecule, containing two tri phenyl phosphonium (TPP) group linked by a 12-C alkyl chain, namely BPPB [19,20,21,22]. Although BA compounds were previously applied for several other uses [21,23], other than as anticancer devices [24], the anticancer effects of QPSs containing the TPP group, have been extensively demonstrated. Nevertheless, despite these promising properties, the development of new QPSs with enhanced anticancer activity and reduced toxicity to normal healthy cells, including erythrocytes, remains an active and unmet research, which needs further development [25,26,27,28]. These compounds attract scientist, because the TPP ion bears a positive charge delocalized over three phenyl rings and stabilized by resonance[21,29,30], which promotes the first step of their mechanism of action. In fact, the currently recognised mechanism of action of QPSs consists of an initially selective electrostatic interaction with the highly negatively charged constituents of tumour cells cytoplasmic membrane [21,29,30], which is facilitated by the characteristics of the TPP ion. Following the adhesion of TPP-compounds to cancer cells, CPSs also possess the ability to penetrate the hydrophobic layers of membrane, due to the overall lipophilic character of the cation. Not only they can enter the cancer cells, but can highly accumulate in their mitochondria, whose membrane potential is even more negative (-220 mV) than that of mitochondria of normal ones (-160 mV), thus strongly attracting TPP-molecules [31,32]. Once in mitochondria, TPP molecules can interfere with mitochondria functions, which represent the central point of the cell, inhibiting glycolysis, depolarizing the membrane potential, inhibiting the mitochondrial permeability transition pore, thus leading to cancer mitochondria disruption. These events kill cancer cells mainly by apoptotic death, thus making QPSs, engineering mitochondrial-targeted therapeutic agents[32]. Mitochondria are in fact, one of the most significant organelles in the intracellular environment, because of their crucial role in energy metabolism and in the regulation of apoptosis processes[33]. The high affinity pf TPP-containing QPSs for mitochondria has been confirmed by studies which have demonstrated their high affinity also for Gram-positive and Gram-negative bacterial superbugs [29,30], which, as known, are their ancient parents, from which mitochondria have evolved[34]. In this context, after having demonstrated the potent antibacterial effects of a mono-TPP containing compound on Gram-positive MDR isolates and those of BPPB vesicles cited previously, on both Gram-positive and Gram-negative superbugs [29,30], also a potent anticancer activity, perhaps mediated by interactions with mitochondria, was demonstrated for BPPB. Specifically, an early and late apoptotic mechanism of action was observed for BPPB against neuroblastoma (NB) cells sensitive to ETO and multidrug resistant (MDR) NB cells [20,22]. Moreover, BPPB anticancer effects were demonstrated against both BRAF mutant MeOV (BRAFV600E) and MeTRAV (BRAFV600D) metastatic cutaneous melanoma (MCM) cell lines sensitive to vemurafenib (PLX4032), and their PLX-resistant counterpart [19,21]. Practically, BPPB was active on different cancer cells regardless their resistance, thus confirming the extra-genomic mechanism of action of TPP compounds, based on mitochondria functions impairment, which overcomes the cells mutational mechanisms, thus overpowering the developed resistance and limiting its new emergence. Not less important, our TPP containing compounds demonstrated low levels of toxicity vs. different mammalian cells lines, primary neuron and astrocytes and low haemolysis in red blood cells (RBCs), thus confirming their selectivity for both bacteria and tumour cells. On this evidence, we decided that one of compounds to synthesize (compound 1) should have contained the TPP group. Despite also the tri-tert-butyl groups, used by Ermolaev et al. [35], had exceptional antibacterial outcomes like those of TPP-compounds previously reported, TPP-group was preferred because easier to achieve. Anyway, no alkyl chain was wanted, to differentiate 1 by the most already reported TPP compounds and the benzyl group was used in place of the alkyl chain, to achieve a quaternized phosphorous salt (QPS). For the same reason, the benzyl group should have characterized the other compounds, that anyway should have contained the alkyl chains, but not the TPP group, to investigate if also diphenyl compounds could possess anticancer activity. In fact, compounds 3 and 4 should have contained different alkyl chains encompassing the same number of carbon atoms, but with different hydrophilic-hydrophobic balances. The chain of 3 was terminated with a primary alcohol group, thus being more hydrophilic than that of 4 which terminated with a vinyl group. The TPP group was replaced by two phenyl rings plus the benzyl group, thus having the three benzyl derivatives wanted. Collectively, no designed compound should have been contained simultaneously the TPP-group and the alkyl chain as for the most active compounds previously reported [29,30,36] to verify if the simultaneous presence of the TPP group and of the alkyl chain is strictly necessary for having consistent biological effects. The first choice of having the benzyl group in the structure of desired phosphonium salts depended on its high reactivity in nucleophilic substitutions SN1 with weak bases as phosphorous atoms of phosphine precursors used here, thus assuring success also in case of strong steric hinderance. Anyway, the maintenance of this choice was due to the antibacterial effects of benzyl phosphonium salts previously demonstrated by other authors[37,38,39,40], and to the conscience that in general compounds that function as antibacterials, are effective also as anticancer devices[41]. Moreover, Terekhova et al., reported a series of benzyl phosphonium salts demonstrated from mediocre to potent anticancer effects against several cancer cell lines[28].
2. Results and Discussion
2.1. Synthesis of Phosphine Compound 2 and Benzyl Phosphonium Salts 1, 3 and 4
The aim of this study was finding novel compounds possessing cytotoxic effects against late-stage metastatic melanoma and neuroblastoma, also when tumour cells have acquired resistance to currently available drugs such as vemurafenib (PLX)[18] and several other anticancer drugs (paclitaxel, doxorubicin, etoposide (ETO))[16]. In fact, as reported, such tumours initially well controlled with therapies based on PLX and ETO, due to prolonged high concentration and aggressive treatments, develop resistance to such drugs, inactivating the therapy thus limiting the patient’s life expectancy[16,18]. To this end, three quaternized phosphonium salts have been designed, following the rational reported in Section 1.1. Chart 1 reported below shows their structures.
The not quaternized uncharged phosphine derivative 2 having a diphenyl-alkyl (11-undecanol chain) structure was synthesized, since necessary to achieve compounds 3 and 4 (Chart 1).
2.1.1. Benzyl Triphenyl Phosphonium Bromide 1
Compound 1 is known [42], and was synthesized according to the procedure previously described by Cui et al.[42], with slight modifications in terms of solvent and times, according to Scheme 1.
Specifically, 1.01 equivalents excess of triphenyl phosphine (Ph3P) was reacted with benzyl bromide in DCM in place of toluene used by Cui et al., refluxing for 24h instead of only 6h [42]. The formation of a white precipitate was observed during reaction, which increased on cooling. Diethyl ether (Et2O) was added to bring precipitation to completion. Compound 1 was isolated by filtration, obtaining a white solid with high level of purity and no need of further purification, in 97% yield, outperforming the result by Cui et al. [42]. Melting point of 1 was very different from that reported by Cui et al. but like those reported by Cabiddu et al. and an old patent published in 1959[43,44]. The structure of 1 and its high level of purity was confirmed by ATR-FTIR, 1H, 13C and 31P NMR, as well as by GC-MS and elemental analysis. Particularly, in the 1H NMR spectrum of 1, two multiplets and a triplet were found in the ranges 7.71-7.65, 7.26-7.22 ppm and at 7.45 ppm. The multiplet at high values comprehended a signal at 7.71 ppm related to six equivalent proton atoms in the TPP group. This signal was attributed to the couples of H-1,3, H-11,13 and H-16,18 according to numbering observable in the structure in Figure 2. Each of them presented a Jo = 7.38 Hz with H-2, H-12 and H-17 and a Jo = 7.73 Hz with the couples H-4,6, H-10,14 and H-15,19, whose signal was detected at 7.65 ppm. An additional J4H-P of 3.70 Hz was measured. Proton atoms H-4,6, H-10,14 and H-19,15 showed a Jo = 7.73 Hz with previously described H-1,3, H-16,18 and H-11,13 and a J4H-P of 13.30 Hz with phosphor atom. The triplet at 7.45 ppm was attributed at H-2, H-12 and H-17 which were coupled with the H-1,3, H-11,13 and H-16,18 with Jo = 7.38 Hz. The multiplet in the region 7.26-7.22 ppm contained a signal at 7.26 ppm assigned to H-23 and H-25. Each of them presented a Jo = 7.40 Hz with H-24 and a Jo = 7.61 Hz with H-22 and H-26, respectively. Another signal detected at 7.22 was assigned to equivalent H-22 and H-26, which were coupled with Jo = 7.61 Hz with equivalent H-23 and H-25 respectively, and with a J4H-P = 3.30 Hz with phosphor atom. H-24 gave a signal at 7.22 ppm, which was coupled with a Jo = 7.40 Hz with H-23 and H-25. The methylene group of benzyl group gave a signal at 5.97 ppm having a J2H-P of 15.19 Hz. The 13C NMR spectrum of 1 showed a signal at 135.10 ppm, which was attributed to equivalents C-2, C-12 and C-17, and a signal at 134.31 ppm, which was assigned to the equivalent couples of carbon atoms C-4,6, C-10,14 and C-15,19. These carbons were coupled with phosphorous atom (PA) with a J2C-P of 10.20 Hz. The signal at 132.20 ppm was assigned to equivalents C-22 and C-26, which were coupled with PA with a J3C-P of 5.39 Hz, while the signal at 130.23 was attributed to the couples of C-1,3, C-13,11 and 18,16, which were coupled with a J3C-P of 12.70 Hz with PA. At 130.00 ppm, the signal of the two equivalents C-23 and C-25 coupled with PA with a J4C-P of 3.20 Hz was observed. C-24 gave a signal at 129.60 ppm, quaternary C-21 gave a signal at 128.50 ppm, which disappeared in the DEPT135 experiment, coupled with PA with a J2C-P of 8.68 Hz. Equivalents quaternary C-5, C-8 and C-9 gave a signal at 117.08 ppm, which disappeared in the DEPT135 experiment, coupled with PA atom with a J1C-P of 86.20 Hz. Finally, the C-20 methylene group gave a signal at 28.10 ppm, which appears upside down in the DEPT135 experiment, coupled with PA with a J1C-P of 48.10 Hz. 31P NMR spectrum of 1 presented a single peak at 21.76 ppm. Copies of spectra of 1 are available in Section 1.1 (Supplementary Materials) as Figure S1.1-1.4.
2.1.2. 11-(Di-Phenyl-Phosphine)-1-Undecanol (2) [45]
Compound 2 is known. It can be prepared according to the procedure described by Petrucci and Kakkar via a three-step synthesis [46]. Specifically, authors prepared diphenyl alkanol derivatives with differently long alkyl chains (n = 10, 11 and 12), in very good yields, from the commercially available bromo alcohols. First, the alcohol groups were protected with a Me3Si group and then the resulting Me3SiO-(CH2) n bromide compounds were reacted with KPPh2, followed by desilylation with citric acid [46]. In the case of 2, the crude product was only washed, thus achieving the desired compound as colourless oil in 96% yield. Anyway, Hands et al., in their previous study on the reactions occurring when sodium hydride is mixed with ω-hydroxyalkyl-phosphonium salts, reported that upon intimate mixing in melt of 11-hydroxyundecyltriphenylphosphonium bromide and sodium hydride under heating at 120-140°C (bath) in a stream of nitrogen for 45 min, a mixture of four compounds formed after hydrolysis with ammonium chloride, including 11-hydroxyundecyldiphenylphosphine 2 [45]. The compounds were separated by column chromatography on alumina and the fraction eluted with benzene contained compound 2, which was recrystallized from ether in low-melting prisms (52°C) in 15% yield [45]. Despite the low yield, the reaction was carried out in very large scale (30-60 g) and in a unique step, starting from the proper triphenyl phosphonium salt, which, in our case, was preparable in high yield from the proper commercial bromo alcohol without need of sylanization [29]. On these considerations, 2 was here prepared following a procedure like that proposed by Hands et al. with substantial modifications, in terms of reaction conditions and isolation work-up (Scheme 2).
In place of melting reagents and heat at 120-140°C for 45 min, reagents were dissolved in DMSO and gently heated at 50 °C under stirring for 1h. The presence of solvent and lower temperature promoted the formation of the desired product in place of that of the other products found by Hands et al. thus improving the overall yield. Then, silica in place of alumina was used for chromatography, eluting 11-DPPOH with DCM/MeOH 9/1. These changes allowed to achieve 11-DPPOH in high yield of 81%. According to Hand et al. the formation of 6-DPPOH can be rationalised by assuming the initial deprotonation of the hydroxyl group by sodium hydride providing a 13-atoms betaine derivative (C-11 chain) (Scheme 3, blue route).
Note that, this step occurs only if sodium hydride is used. Conversely, when butyl lithium is used as deprotonation agent, the α-hydrogen atom to phosphorous atom is subtracted providing a phosphorus ylide derivative usable in Wittig reactions with carbonyl compounds. Alkene derivatives, via betaine intermediates of four atoms formation and their cyclization usually form (Scheme 3, red route). On the contrary, using sodium hydride, the 13-atom betaine formed, unlike to cyclize gives nucleophilic attack to one of the phenyl rings of another betaine forming the phenyl ether derivative and 11-DPPOH (2), via nucleophilic aromatic substitution (Scheme 3, route blue). The structure of 2 and its high level of purity was confirmed by ATR-FTIR, 1H, 13C and 31P NMR, as well as by GC-MS and elemental analysis. The numerated structure of 2 is shown in Figure 3.
Particularly, in the 1H NMR spectrum of 2, a signal at 7.46 ppm was observed, belonging to four equivalent proton atoms of the diphenyl system linked to the phosphorous atom (PA). Specifically, this signal was attributed to the couples of H-3,5 and H-10,14 according to numbering observable in the structure in Figure 3. Each couple showed a J3H-P = 7.00 Hz with PA and a Jo = 7.50 Hz with H-2,6 and H-11,13, respectively, whose signal was found at 7.05 ppm. These proton atoms in addition to be coupled with protons H-3,5 and H-10,14 were coupled with a lower Jo = 7.46 Hz with proton atoms H-1 and H-12, whose signal was detected at 6.97 ppm. Proton atoms H-24 linked to the hydroxyl group (CH2OH), which were chemically, but not magnetically equivalents, gave a triple doublet signal at 3.57 ppm and showed both a Jgem = 5.04 Hz and a Jvic. = 6.43 Hz with proton atoms H-23. The complex signal (quintet) of H-23 (1.53 ppm) showed two coupling constants (Jvic. of 6.43 and 6.86 Hz), with proton atoms H-24 and H-22, respectively. The signal of proton atoms H-22 was instead found at 1.33 ppm, showing couplings with proton atoms H-23 (Jvic. = 6.86 Hz) and H-21 (Jvic.= 6.80 Hz), whose signal was found at 1.37 ppm. These proton atoms (H-21), in addition to be coupled with proton atom H-22, presented a coupling (Jvic. of 7.70 Hz) with proton atom H-20, having signal at 1.28 ppm and in turn coupled with proton atom H-19 (1.27 ppm) with the same Jvic. of 7.70 Hz. The same coupling constant (Jvic. of 7.70 Hz) was also observed between proton atoms H-19 and H-18 (1.28 ppm) and H-18 and H-17 (1.28 ppm). Proton atoms H-17 were chemically but not magnetically equivalents, thus showing also a Jgem = 6.00 Hz and a Jvic = 7.54 Hz with protons H-16. These protons were not magnetically equivalents, thus showing a Jgem = 4.79 Hz coupling with proton atoms H-15 (Jvic = 7.23 Hz), whose signal was found at 1.54 ppm. In addition to be coupled with protons H-16, atoms H-15 showed to be coupled both with PA (J3H-P = 8.82 Hz) and with atoms H-9 (Jvic = 6.56 Hz), whose signal was detected at 2.29 ppm and was coupled also with PA with a (J2H-P = 8.00 Hz). The 13C NMR spectrum of 2 showed a signal at 138.80 ppm belonging to the equivalents quaternary C-4 and C-8 of diphenyl system, which disappeared in the DEPT135 experiment. The signal was coupled with PA with a J1C-P = 12.17 Hz. Conversely, the signal at 123.75 ppm was assigned to the equivalents carbon atoms C-3,5 and C-10,14, with resulted coupled with PA with a J2C-P = 17.76 Hz. The equivalents carbon atoms C-2,6 and C-11,13 gave a signal at 128.62 ppm coupled with PA with a J3C-P = 6.00 Hz. The last signal of the diphenyl system was detected at 128.38 ppm, which was assigned to the equivalents carbon atoms C-1,12, which presented a J4C-P coupling constant of 7.00 Hz. The remaining signals were attributed to the carbon atoms of the alkyl chain. The signal of C-24 linked to the hydroxyl group was found at 62.89 ppm. Signals not presenting coupling constants were found at 33.04 (C-23), 29.72 (C-19), 29.66 (C-20, 29.64 (C-21) and 26.28 (C-22) ppm, while signals coupled with PA were found at 29.84 (C-9, J1C-P = 12.24 Hz), 29.50 (C-18, J5C-P = 4.97 Hz), 29.25 (C-17, J4C-P = 5.00 Hz), 29.04 (C-16, J3C-P = 10.55 Hz) and 25.82 (C-15, J2C-P = 14.84 Hz) ppm. The signals of all CH2 groups appeared upside down in DEPT135 experiments. In the 31P NMR spectrum of 3 a single singlet was detected at 15.40 (s, 1P). Copies of spectra of 2 are available in Section 1.1 (Supplementary Materials) as Figure S1.5-1.8.
2.1.3. Benzyl-(11-Hydroxy-Undecyl)-Diphenyl-Phosphonium Bromide 3 and Benzyl-Diphenyl-Undec-10-Enyl-Phosphonium Bromide 4.
Compound 3 was unexpectedly obtained as 1/1 mixture with compound 4, following the procedure used to prepare compound 1, but using a different phosphine reagent in a different excess (1:1.2) (Scheme 4).
Compounds 3 and 4 are unknown and their structure were assigned based on the results from 1H and 31P NMR spectroscopy, chemometric-assisted ATR-FTIR, UV-Vis and 13C NMR analyses, as well as from GC-MS and elemental analysis, which evidenced their high level of purity. Compounds 3 and 4 were separated thanks to their different solubility in Et2O used to treat the crude oil under 24h stirring, hoping in its solidification. Oil crystallization did not occur, but two phases separated containing two different compounds. The upper ether phase contained dissolved the compound later identified as 4, while the oil not soluble in ether was then identified as the initially desired compound 3. Anyway, the solubility of the first compound in ether, its TLC Rf (0.2581, MeOH/Petrol 1/1) higher than that of compound not soluble in ether (0.1828, MeOH/Petrol 1/1), and the different results obtained by the Schiff test, which was negative for the first soluble compound (later named 4) and positive for the second insoluble one (later named 3), could mean absence of the hydroxyl initially present linked to the C-11 of the alkyl chain of 2 in the first, which was instead present in the second. The rational explanation of this early assumption consists in a partial acid catalysed thermal elimination of the OH group as water (E2 reaction) by the forming product 3, to provide the final two compounds (3 and 4). Partial E2 provided the no longer bearing the hydroxyl group compound 4, having instead the C-10 double bond resulting negative in the Schiff test, and compound 3. Scheme 5 describes the mechanism of this E2 reaction when it occurs on forming product 3.
The numerated structure of 3 is shown in Figure 4.
Particularly, in the 1H NMR spectrum of 3, a signal at 8.37 ppm was observed, belonging to four equivalent proton atoms of the diphenyl system, linked to the PA. Specifically, this signal was attributed to the couples of H-5,7 and H-11,15 according to numbering observable in the structure in Figure 4. Each couple showed a Jo = 7.73 Hz with H-2,4 and H-12,14, respectively and a J3H-P = 5.55 Hz with PA. At 7.60 ppm, the signal related to the equivalents H-3 and H-13 was observed. These proton atoms were coupled with H-2,4 and H-12,14, whose signal was detected at 7.52 ppm, with a Jo = 7.38 Hz. In addition to the coupling with H-3 and H-13, these proton atoms were coupled with equivalents H-5,7 and H-11,15 (Jo = 7.73 Hz) and with PA with a J4H-P = 5.04 Hz. The signal of H-18 and H-22 of benzyl group was observed at 7.45 ppm, showing couplings with H-19 and H-21 (Jo = 7.60 Hz) and with PA (J4H-P = 3.33 Hz). At 7.28 ppm the triplet of H-20 was observed, which was coupled with H-19 and H-21 (Jo = 7.40 Hz), whose signal was instead observed at 7.17 ppm. In addition to the coupling with H-20, these proton atoms showed to be coupled with H-18 and H-22, respectively (Jo = 7.60 Hz). The proton atoms of methylene of benzyl group gave a signal at 4.27 ppm, which was coupled with PA with a J1H-P = 13.90 Hz. The remaining signals were all the methylene groups of the alkyl chain. Specifically, the triple doublet signal at 3.65 ppm was assigned to methylene 32 linked to the hydroxyl (CH2OH), whose protons were chemically, but not magnetically equivalents, thus showing both a Jgem = 5.00 Hz and a Jvic. = 6.40 Hz with proton atoms H-31. The complex signal (quintet) of H-31 showed two coupling constants (Jvic. of 6.40 and 6.87 Hz), with proton atoms H-32 and H-30, respectively. The quintet signal of proton atoms H-30 was instead found at 1.32 ppm, showing couplings with proton atoms H-31 (Jvic. = 6.87 Hz) and H-29 (Jvic.= 6.80 Hz), whose signal was found at 1.23 ppm. These proton atoms, in addition to be coupled with proton atoms H-30, presented a coupling (Jvic. of 7.70 Hz) with proton atoms H-28 with signal at 1.16 ppm. The signals of subsequent proton atoms H-27, 26, 25, 24 and 23 were observed at 1.21, 1.19, 1.23, 1.45 and 1.47 ppm, respectively. Proton atoms H-25, 26, 27 and 28 were coupled with each other with the same Jvic. = 7.70 Hz, while not magnetically equivalent protons H-25 showed an additional geminal coupling constant of 6.0 Hz and a new Jvic. = 7.50 Hz with H-24, in turn coupled with H- 23 with a Jvic. = 7.23 Hz. Proton atoms H-23 presented additional coupling constants with those of methylene H-9 (Jvic. = 6.80 Hz) and with PA (J3H-P = 7.90 Hz). The 13C NMR spectrum of 3 showed a signal at 134.5 ppm belonging to the equivalents C-3 and C-13 of diphenyl system. The signal coupled with PA (J2C-P = 10.38 Hz) at 132.5 ppm was assigned to equivalents C-5,7 and C-11,15, while that at 130.96 ppm, coupled with PA too (J3C-P = 5.30 Hz), was assigned at equivalents C-18 and C-22. Equivalent carbon atoms C-2,4 and C-12,14 gave a signal at 130.4 and were coupled with PA with a J3C-P = 12.60 Hz. The signal at 128.9 ppm was attributed to equivalent carbon atoms C-19 and C-21, which were coupled with PA with a J4C-P = 3.20 Hz. The singlet at 128.5 ppm belonged to C-20, while the signal at 128.1 ppm, coupled with PA (J2C-P = 8.90 Hz), was attributed to the quaternary C-17, which disappeared in the DEPT135 experiment, like the signal of equivalents quaternary C-6 and C-10 observed at 117.4 ppm, which were coupled with PA with a J1C-P = 83.70 Hz. Singlet signals for carbon atoms of methylene groups in the alkyl chain numbered as C-32, C-31, C-28, C-29, C-27 and C-30 were observed at 62.30 (CH2OH), 32.40, 29.70, 29.60, 28.60 and 26.80 ppm, respectively. Conversely, the signals of carbon atoms C-24, C-25, C-26, C-16, C-9 and C-23, of methylene groups coupled with PA were detected at 30.30 (J3C-P = 13.85 Hz), 29.8 (J4C-P = 5.00 Hz), 29.5 (J5C-P = 4.97 Hz), 29.6 (J1C-P = 47.30 Hz), 23.2 (J1C-P = 45.20 Hz) and 21.9 (J2C-P = 4.05 Hz). The signals of all CH2 groups appeared upside down in DEPT135 experiments. In the 31P NMR spectrum of 3 a single singlet was detected at 23.82 (s, 1P). Copies of spectra of 3 are available in Section 1.1 (Supplementary Materials) as Figure S1.9-1.12.
1H and 13C NMR spectra of 4 were like those of 3 with some substantial differences, due to the presence of vinyl group. It gave peculiar signals in the NMR spectra. The numbered structure of 4 is shown in Figure 5.
Particularly, in the 1H NMR spectrum of 4, the same signals observed for compound 3 at 8.37, 7.60, 7.52, 7.45, 7.28, 7.17 and 4.27 ppm were observed for the same proton atoms, with the same multiplicity and coupling constants. New signals, peculiar to vinyl system, were observed at 5.76, 4.99 and 4.94 ppm. Particularly, the double-double triplet signal at 5.76 ppm was assigned to the proton atom of CH=CH2 system, numbered as 17a, which was coupled with proton atoms Ha and Hb, numbered as 18a and 18b with a Jcis = 12.08 Hz and Jtrans = 15.30 Hz, respectively. Proton 17a was also coupled with not magnetically equivalent proton atoms H-30 with different Jvic = 6.43 and 6.30 Hz. Moreover, the proton atoms 18a and 18b were in turn coupled with H-17a with Jcia = 12.08 Hz and Jtrans = 15.30 Hz. Proton atoms H-30 gave their signal at 2.07 ppm and were also coupled with proton atoms H-29 with a Jvic = 6.93 Hz. Additionally, they showed a large geminal coupling constant of 16.70 Hz, while proton atoms H-29 were also coupled with H-28 (Jvic = 6.88 Hz). In addition to this coupling, proton atoms H-28, which gave their signal at 1.24 ppm, since not magnetically equivalents, showed a small geminal coupling constant of 6.00 Hz, and a vicinal coupling constant of 7.54 Hz with H-27 (1.19 ppm), in turn coupled with proton atoms H-26 (Jvic = 7.70 Hz). The signal of proton atoms H-26 was observed at 1.20 ppm and was coupled both with proton atoms H-27 and H-25 with the same Jvic = 7.70 Hz. Like proton atoms H-28, H-25 ones (1.25 ppm) were not magnetically equivalent, thus showing also a geminal coupling of 6.00 Hz and a Jvic = 7.54 Hz with proton atoms H-24 (1.45 ppm), which were in turn coupled with protons H-23 (1.47 ppm) with a Jvic = 7.23 Hz. In addition to this coupling constant, H-23 showed a Jvic = 6.80 Hz with protons H-9 and a J3H-P = 7.90 Hz with PA. Finally, proton atoms H-9 at 3.12 ppm were also coupled with PA (J3H-P = 7.90 Hz). As for the 1H NMR spectrum, also the 13C NMR spectrum of 4 showed the same signals of 3 for the same carbon atoms and with the same coupling constants with PA (134.5, 132.5, 130.96, 130.4, 128.9, 128.5, 128.1, and 117.4 ppm). Signals of quaternary C- 6, C-10 and C-17 disappeared in the DEPT135 experiment. New singlet signals were instead observed for the vinyl system at 138.4 and 114.4 ppm, which were attributed at C-31 and C-32, respectively. Singlet signals were also observed for carbon atom C30, C-29, C-28 and C-27 at 33.6, 29.0, 29.0, and 28.3 ppm, since they were not coupled with PA. Conversely carbon atoms C-24 (30.3 ppm), C-25 (29.7 ppm), C-16 (29.6 ppm), C-26 (29.3 ppm), C-9 (23.2 ppm) and C-23 (21.9 ppm) were coupled with PA, thus showing J3C-P = 13.85 Hz, J4C-P = 5.00 Hz, J1C-P = 47.30 Hz, J5C-P = 4.97 Hz, J1C-P = 45.20 Hz and J2C-P = 4.05 Hz. The signals of all CH2 groups appeared upside down in DEPT135 experiments. In the 31P NMR spectrum of 4 a single singlet was detected at 23.82 (s, 1P). Copies of spectra of 4 are available in Section 1.1 (Supplementary Materials) as Figure S1.13-1.16.
2.2. ATR-FTIR Spectra of Compounds 1-4
ATR-FTIR spectra of all samples were acquired as detailed in Section 2.3. and the lists of most relevant bands have been reported in the characterization data of each compound (Sections 2.2.1-2.2.3). Copies of ATR-FTIR spectra of 1-4 are available in Section 1.2 of Supplementary Materials in Figure S2.1-2.4. In the following part of this Section, bands observed in the ATR-FTIR spectra of each sample has been discussed and bands assignment to functional groups of 1-4 was made according to Infrared Spectroscopy Absorption Table available online at https://chem.libretexts.org/Ancillary_Materials/Reference/Reference_Tables/Spectroscopic_Reference_Tables/Infrared_Spectroscopy_Absorption_Table (accessed on 22 November 2025) and literature reports [47,48,49]. In the ATR-FTIR spectrum of compound 1, weak bands at 3085, 3052 and 3010 cm-1 were due to the =C-H stretching of aromatic rings, while the aliphatic C-H stretching band of benzyl methylene, typically found at 2968 cm-1 in form of single band, was found as a double band, a band at 2859 cm-1 and a second band at lower values of wavenumber (2773 cm-1). Ammer et al. reported that both bands were due to the so called red-shift, which caused the shifting of C-H stretching vibration to lower wavenumbers giving two bands in place of one [47]. The red-shift is mostly the consequence of the hydrogen bond formation between a C-H proton atom acting as donor and an acceptor and in the preset case, the hydrogen bond between the C(α)-H of benzyl methylene and the ion pair of the bromide anion, as documented also by Arunan [48]. Note that the C(α)-H protons of benzyl triphenyl phosphonium salts, are particularly acidic thank to the stabilizing effects of triphenyl phosphonium system and of the phenyl ring. Therefore, the formation of C(α)-H···X- hydrogen bonds, between the phosphonium ion and its counterion X- is favourite [47]. Anyway, despite the hydrogen bond formation is more favourable in C(α)-H protons of benzyl derivatives, since more mobile, its formation with the consequent redshift of the C(α)-H stretching bands has been reported even for alkyl triphenyl phosphonium halides, thus illustrating that hydrogen bonding also plays a role for substrates of lower C-H acidity. Particularly, a red-shift was observed as single band in the FTIR spectrum of trans-2-pentenyl triphenyl phosphonium bromide (2777 cm-1) reported by Bergerl’son [50] and in that of alkyl bis-triphenyl phosphonium compound (BPPB), where C-H stretching band red-shifted at 2794 cm-1 [30]. The redshift is explained considering that, when a hydrogen bond forms, promoted both by the acidity of C-H proton atoms and by the nature of H acceptor X-, strong acceptors such as Cl- or Br- promote strong attraction between H and X-, and the attractive interaction between the positive H and the negative X- shortens the distance ···X- and lengthens the C-H bond, thus reducing the force constant and leading to a classical red-shifting [47]. Anyway, according to Ammer, in the spectra of benzyl derivatives used in their study two red-shifted bands were detected, which were the bands at 2859, and 2773 cm-1 found in 1. Conversely, only one shifted band was visible in the spectra of alkyl triphenyl phosphonium derivatives. Ammer et al. attributed the occurrence of two bands in benzyl derivatives to possible couplings with lower-frequency modes, or with the existence of two conformations, but authors prevented by making too risky assumptions [47]. In our opinion, the two bands present at 2859, and 2773 cm-1 were due only to and incomplete redshift of traditional C-H stretching band at 2868 cm-1, probably due to the steric hindering of phenyl ring which partially impeded the hydrogen bond formation. In addition, as reported by Ammar et al. the acceptor Br- can form hydrogen bonds also with proton atom in orto position in the phenyl rings of both the triphenyl phosphonium group and benzyl, thus reducing the C(α)-H···Br- attraction interaction between more than in systems were only the phenyl rings of TPP group exist. For the rest, the spectrum of 1 exhibited bands at 1456 and 1436 cm-1 as well as at 747, 718 and 689 cm-1 which were assigned to the C-H banding, and the C-P stretching, respectively. The spectrum of 3 showed the large band of the hydrogen bonded O-H stretching at 3366 cm-1 while the =C-H stretching gave bands at 3077, 3056, 3026 and 3012 cm-1. No redshift was observed, probably due to the absence of TPP group and traditional bands at 2924 and 2852 cm-1 were found for the symmetric and antisymmetric C-H stretching of methylene groups. The C-H banding gave bands at 1474 and 1437 cm-1 while the C-O stretching bands were observed at 1173 and 1120 cm-1. Finally, the bands at 743, 719 and 694 cm-1 were attributed to the C-P stretching vibration. As 2, compounds 3 and 4 not having the TPP group did not exhibit red-shifted bands for the C-H stretching but traditional bands at 2924/25 and 2852/53 cm-1. While 4 did not give band related to the presence of a hydroxyl, 3 provided a large band at 3354 cm-1 (hydrogen bonded O-H stretching) and bands at 1168, 1160 and 110 cm-1 (C-O stretching). Both compounds gave bands of the C-H banding at 1454/55 and 1437 cm-1, which the C-P stretching vibration was observed at 743, 720 and 693/94 cm-1.
2.3. UV-Vis Spectra
The UV-Vis spectra of all compounds exhibited profiles like those of bis-triphenyl alkyl phosphonium compounds described in literature [30,51]. Anyway, while diphenyl alkyl phosphine 2 and diphenyl benzyl alkyl phosphonium salts 3 and 4 presented three absorption peaks at 259, 265 and 271/72 nm and a shoulder peak at 253 nm, a bathochromic shift (redshift) to longer wavelengths (nm) was observed in the spectrum of 1. Particularly, in the UV-Vis spectrum of 1, the shoulder peak was no longer visible while the previous three peaks were observed at 261, 268 and 275 nm as reported for BPPB [30] and by Ceccacci et al. [51] for similar compounds, which all sheared the presence of TPP group. This phenomenon is often caused by increased conjugation, solvent polarity effects, or the presence of auxochromes. In the case of TPP compounds as 1 conjugation is remarkably higher than in diphenyl compounds as 2, 3 and 4, thus justifying this difference in UV spectra. Copies of UV-Vis curves of compounds 1-4 are available in Section 3 of Supplementary Materials as Figure S3.1a and S3.1b.
2.4. Principal Component Analysis (PCA) of ATR-FTIR UV-Vis and NMR Spectral Data
PCA is a multivariate chemometric technique frequently used to process datasets collecting very numerous correlated data (variables), most of which contain trivial information, to reduce them to a small number of not correlated orthogonal variables (Principal Components), providing the most important information [52], [53]. To carry out PCA, data must be arranged in a matrix of n columns × n rows as described in the Materials and Methods part [54]. In the following Sections, we have reported and discussed the results presented as score plots, obtained by processing the matrices containing the ATR-FTIR, UV-Vis and 13C NMR spectroscopic data of considered samples by PCA. Since both ATR-FTIR and UV-Vis spectroscopic data regarded values of intensity (transmittance or absorbance), it was possible to merge them in an overall matrix containing data from both analytical techniques which was processed by PCA too. In the score plots, score are the new coordinates of the processed samples in the new space of the PCs, where each sample assumes a position depending on its chemical composition and structure[55]. Samples located close to each other share similar physicochemical characteristics, while those placed far apart could differ for different functional groups [55].
2.4.1. PCA of ATR-FTIR and UV-Vis Spectral Data
Matrix A of 13,604 variables and matrix B of 17,005 variables, as well as matrix C of 364 variable and matrix D of 455 variables, where variables were the ATR-FTIR transmittance (%) values and the UV-Vis absorbance values of each considered sample respectively, were constructed as described in the experimental Section. Additionally, an overall matrix E of 17,460 variables, where variables were both the ATR-FTIR transmittance (%) values and the UV-Vis absorbance values of each considered sample was also constructed. The results from the PCA on all matrices A, B, C, D and E have been reported as score plots explaining a total variance of 100%, 99.2%, 100%, 99.7% and 98.99%, respectively. PCA results obtained processing all matrices were reported as score plots of PC1 vs. PC2. When matrix A was analysed PC1 explained 70.2% of total variance vs. PC2 which explained 28.3% (Figure S4.1a, in Section S4 of Supplementary Materials), while in the case of matrix B, PC1 explained 65.8% of total variance vs. PC2 which explained the 24.3% (Figure S4.1b, in Section S4 of Supplementary Materials). Conversely, when matrix C and D were analysed PC1 vs. PC2 explained 78.0% vs. 21.7 and 77.3% vs. 20.21% respectively of total variance (Figure S4.1c and S4.1d in Section S4 of Supplementary Materials). When either ATR-FTIR and UV-Vis spectral data of compounds 1-4 were processed (Figure a, c) samples were separated on PC1, where compounds possessing the diphenyl phosphonium group and the C11 alkyl chain were all located in the right side of the plot at positive scores, while compound 1 having the triphenyl phosphonium group and not the alkyl chain was positioned in the extreme left side of the plot at negative scores. On the other hand, inside the diphenyl alkyl family compounds were well separated on PC2. Compound 2, not having the benzyl group, was located distant from compounds 3 and 4 bearing it, which appeared very close to each other. When FTIR data were processed, 2 was found at negative score, whilst 3 and 4 were at similar positive scores, while when UV-Vis data were analysed, it was the contrary. In this latter case, compound 3 was closer to compound 2 than 4 since they sheared the presence of CH2OH group no longer present in compound 4 where a C=C double bond substituted the primary alcohol. When either ATR-FTIR and UV-Vis spectral data of compounds 1-4 and BPPB were processed (Figure b, d), locations identical to those observed in Figure a, c were observed for compounds 1-4. BPPB positioned in the left side of plot as 1 because as 1 it had the triphenyl phosphonium group, but at less negative scores and closer to compounds 2, 3 and 4 because differently from 1 it contained a C 12 alkyl chain like the C11 one of diphenyl derivatives. The score plot of PC1 (65.7% of total variance explained) vs PC2 (24.3% of total variance explained) obtained processing matrix E gave results identical to those observed in Figure S4.1b (Figure 6).
2.4.2. PCA of NMR Spectral Data
The 1H, 13C and 31P NMR data of considered samples were organized in matrices of 164 (compounds 1-4) and that of 246 variables (1-4 plus TPPOH and BPPB), constructed as described in the experimental Section 2, were named A and B respectively. The results from PCA on A and B have been reported as score plots of PC1 vs PC2 and of PC1 vs PC3. In the case of matrix A, the score plot of PC1 vs PC2 explained the 92.9 % of total variance (Figure 7a), where PC1 and PC2 explained the 63.3 and 29.6% respectively. Conversely, the score plot of PC1 vs PC3 explained the 70.4% of total variance (Figure 7b), subdivided in 63.3% (PC1) and 7.1% (PC2). In the case of matrix B, the score plot of PC1 vs PC2 explained the 82.8 % of total variance (Figure 7c), where PC1 and PC2 explained the 58.6% and 24.2%, respectively. On the contrary, the score plot of PC1 vs PC3 explained the 65.9% of total variance (Figure 7d), subdivided in 58.6% (PC1) and 7.3% (PC3).
When NMR data of only compounds 1-4 were used, in the score plot of PC1 vs PC2 the structural similarities and differences were well evidenced both on PC1 and PC2. On PC1, compounds having the benzyl group (1, 3 and 4) were on the right of the square plot located from about zero to positive scores > 4, while compound 2 not having this group appeared in the left side at negative scores > -6. Conversely, PC2 separated compounds based on the presence or absence of the alkyl chain and TPP group. Compound 1, lacking the alkyl chain and having the TPP group was positioned in the lower part of the score plot at negative scores (about -5), while compounds without the TPP group and having the alkyl chain (2, 3 and 4) appeared in the upper part of the plot at scores in the range 0-3. When the score plot of PC1 vs PC3 was observed, the structural similarities and differences were well evidenced only on PC1 where compounds appeared located as observed in the score plot previously considered, as expected.
When NMR data of compounds 1-4 added with those of TPPOH and BPPB were used, in the score plot of PC1 vs PC2 the structural similarities and differences were well evidenced both on PC1 and PC2. On PC1, compounds having the benzyl group (1, 3 and 4) were on the right of the square plot located from about zero to positive scores > 6, while compound 2, TPPOH and BPPB not having this group appeared in the left side at negative scores in the range 2-6 (absolute values). Conversely, despite separation based on structural characteristic was more difficult to be detected on PC2, a certain rational can be noticed. Compound 2 and TPPOH were located at the same negative score on PC2 (about -2.5), because their structures differed only for one phenyl ring, while BPPB and 1 were located at positive scores based on the weight that aromatic components had in the structure. In these terms, compounds 1 and BPPB were the most aromatic ones. Only separation of compounds 3 and 4 was curious and misleading, since 4 in place of 3 located at the same negative score of 2 and TPPOH, despite it is 3 that has the same undecanol chain as the two compounds. When the score plot of PC1 vs PC3 was observed, the structural similarities and differences were well evidenced only on PC1 where compounds appeared located as observed in the score plot previously considered, as expected. On the contrary, separation observable on PC3 was not rational.
2.5. Optical Microscopy Analyses
Bis-triphenyl phosphonium (TPP) compounds linked by a hydrophobic chain of carbon atoms, defined as bola-amphiphiles, when dispersed in aqueous solution at proper concentration, spontaneously self-assemble into spherical vesicles [30,51]. Such vesicles appeared micro dimensioned at optical microscope and nano dimensioned at the DLS analysis[29]. In this case, despite compounds 2, 3 and 4 do not possess the TPP groups, all compounds 1, 2, 3 and 4 were dispersed in water and dissolved in methanol (MeOH) according to the procedure detailed in the experimental Section and investigated using optical microscopy. The solutions were examined with a 40× and 100× objective, observing spherical poly dispersed vesicles, for all samples except for compound 1 which showed a tendency to crystallize on the glass for optical analysis when dissolved in MeOH and macroscopic crystals. On the other hand, when suspended in water, also compound 1 demonstrated micro dimensioned irregular vesicles. Regardless the objective used (40× or 100×), particles of 2, 3 and 4 appeared as polydisperse larger spherical vesicles or as smaller spheres of 1-14 µm. Sometimes larger spheres appeared made of the smaller vesicles better visible at 100× objective as already observed [30,51]. These findings evidenced that the capability to form spontaneously vesicles in water is not peculiar of bola-amphiphilic compounds but of amphiphilic compounds encompassing a cationic or not cationic head not specifically made of a TPP group and an alkyl chain [51]. Figure 8 shows the spherical vesicles provided by 2, 3 and 4 as they appear when observed with the 40× (Figure 8a) and 100× (Figure 8b) objectives, as well as crystals (MeOH) or vesicles formed by 1.
These findings, in addition to confirm that compounds bearing cationic TPP heads but also uncharged diphenyl (DP) ones, linked to hydrophobic chains form spherical vesicles of different sizes in water and MeOH, which can aggregate in larger one depending on the solution concentration and coexist with them [30]. As reported, 2, 3 and 4 were probably able to self-assemble in spherical vesicles, due to their planar headgroups, because self-assembly properties are strongly dependent on the complex interplay of non-covalent interactions (ionic, hydrophobic, and π-π) inside the aggregate [30]. In this regard, the π-π stacking between the aromatic rings on heads of compounds was crucial for the final aggregate morphology.
2.6. Biological Effects of Compounds 1, 3 and 4 on Tumoral and Not Tumoral Human Cells Models
The acquisition of drug resistance is the major limitation of current anticancer therapies in both MCM and NB, severely compromising long-term treatment efficiency [56,57]. Currently, vemurafenib (PLX4032) is approved for the treatment of patients with BRAFV600E-mutated MCM [58,59] and, although with less effects, of those with BRAFV600K, BRAFV600R and BRAFV600D mutations [60].
However, despite the encouraging results obtained with the first treatments, chronic exposure to PLX4032, frequently leads to the development of resistant tumour cell populations, ultimately resulting in cancer relapse [61].
Similarly, in high-risk MYCN-amplified NB, prolonged treatment d with etoposide (ETO) promotes the selection of MDR cells characterized by an efficient aerobic metabolism and reinforced antioxidant defences[16].
Chasseing the successful example of BPPB [19,20,21,22], three different QPSs, never tested as anticancer options, were here essayed against PLX-resistant MeOV and MeTRAV MCM cells, ETO-sensitive and MDR NB cells, human keratinocytes (HaCaT), and embryonic murine fibroblasts (3T3) cells, as well as red blood cells (RBCs).
2.6.1. Concentration- and Time-Dependent Anticancer Effects of 1, 3 and 4 on MeOV PLX-R and MeTRAV PLX-R Cell Viability
As shown in Figure 10 (images a, panels A, B and C), all three tested compounds strongly reduced the viability of MeOV cells. Compounds 1 was the most effective, especially at 48 hours exposure, reducing cell viability to 42.3% and 30.8% at 5 and 10 µM, respectively. Anyway, despite more tolerant than MeOV, also MeTRAV cells viability was remarkably reduced by the administration of all compounds, and especially of 3 and 4 [19,21]. Respect to 24-hours administrations, both cell populations remain equally tolerant or became partially tolerant to doses of 4 up to concentrations 10 and 25 (MeOV administered for 48 and 72 hours), and at all concentrations tested (MeTRAV administered for 72 hours only). Above such concentrations cell viability in MeOV cells decreased rapidly under 50% up to only 21.8-25.5%. Concerning sample 3, higher tolerance was observed only against MeTRAV cells, both in 48- and 72-hours treatments up to the highest concentration of 100 µM. MeOV cells became more tolerant to 1 in 72-hours treatments up to 75 µM, respect to 24-hours treatment and up to 100 µM, respect to 48-hours one, while MeTRAV cells became more tolerant to 1 both in 48- and 72-hours treatments respect to 24-hours treatments up to 75 µM.
The higher and significant anticancer activity of compound 1 against MeOV and of compounds 3 and 4 against MeTRAV cells, was already evident after short-time treatments. In a hypothetical future in vivo administration, such rapid efficacy could reduce the need for long-time exposure to these compounds, for each administration, thereby limiting the emergence of side effects, drug resistance, secondary tumorigenesis and costs impact, while improving patients’ compliance and their quality of life. In fact, the best cytotoxic effects vs. PLX-R MeTRAV cells were observed after 24 and 48h treatment with compound 4 (32.2%, ≥ 50 µM) and after 24h with compound 3 (33.6%, ≥ 75 µM). Conversely, the living MeOV cells (%) were already as few as 30.0 and 44.7%, when 75 and 25 µM concentrations of 3 were administered for 24 and 48 hours, respectively, while they decreased to 44.9 and 36.5%, when treated with 50 and 25 µM concentrations of 4, for 24 and 48 hours, respectively.
Notably, the max concentrations used of our compounds 1, 3 and 4, expressed in µg/mL for a direct comparison were up to 5.8-, 4.3- and 4.9-times lower than those used by Li et al. against non-resistant metastatic B16F10 melanoma cells (250 µg/mL) [62]. Despites such significant lower concentration administered for the same time at MCM cells, compound 1, administered at concentration 100 µM (43.3 vs. 250 µg/mL), reduced PLX-resistant metastatic MeOV and MeTRAV cells viability to percentages comparable to those reported by Li et al. Anyway, compounds 3 and 4, administered for 24 hours to the same cells at the same concentration of 100 µM (57.8 and 50.95 vs 250 µg/mL of Li et al), reduced their viability to concentrations by 1.2-1.5-fold (MeOV) and 1.3-1.5-fold (MeTRAV) lower than those observed by Li et al, when 250 µg/mL of SmIII-EGCG were administered to not resistant BF16F10 cells under the same conditions [62]. Moreover, in case of QPSs 1, 3 and 4, NIH/3T3 viable cells (%) observed after administration of 100 µM concentration of SmIII-EGCG for 24 hours would correspond to 81.6, 85.96 and 85.1% of viable cells. In this regard, our compounds 1 and 4 were less cytotoxic than compound by Li et al. against same normal cells (3T3) by 2-fold, while cytotoxicity of compound 3 was comparable (see later for details). IC50 values of compounds 1, 3 and 4, were calculated for both cell lines, based on cell viability data using GraphPad Prism software (version 8.0.1), as detailed in Section 3. For comparison of our compounds with PLX, which is a clinical approved inhibitor of oncogenic BRAF kinase, currently used to specifically treat BRAF-mutant MCM cells and was the first BRAF inhibitor to be tested in a phase III trial [63], cytotoxicity, data of PLX cytotoxicity against PLX-resistant MeOV and MeTRAV cells, previously determined, have been reported in Figure 11 [18], while the related IC50 values for PLX were reported in Table 1 together which the IC50 values of all our QPSs against all MCM cells calculated as detailed Section 3.
Collectively, the cytotoxic effects (IC50) of compounds 1 and 3 against PLX-R MeTRAV cells at 24-hours exposure were comparable to those exerted by PLX after 72 hours. In contrast, compound 4 at 24-48-hours displayed higher cytotoxicity by 1.3-1.4 times than those exerted by PLX at 72 hours-treatment [18]. Notably, in PLX-R MeOV cells, compound 1 was even more cytotoxic than PLX, showing 2.6- and 1.1-fold higher cytotoxicity after 48 and 72 hours of treatment, respectively [18].
A comparison between PLX activity and that of our compounds after 72 hours of exposure (due to the data available for PLX, [18]), in terms of residual viable cells (%) is shown in Figure 12.
Despite a lower concentration (1 µM versus 1.5 µM), reduction in MeTRAV cell viability by sample 1, was higher than that exerted by PLX. Also, when 5 and 10 µM concentrations of both compounds were administered (72 hours), such higher activity of 1 respect to that of PLX was observable also against MeOV cells. Specifically, viability (%) of MeOV cells after administration of 1 was 1-4, 1.6-fold lower than after administration of PLX.
2.6.2. Concentration- and Time-Dependent Effects of 1, 3 and 4 on HTLA 230 and MDR HTLA ER NB Cell Viability
As shown in Figure 13, all compounds induced both concentration- and time-dependent effects in NB cells sensitive to ETO and MDR ones. In all cases, 48-hours treatments were more efficacious than 24-hours, while 72-hours produced a further, despite slightly, increase in cytotoxicity compared with 48-hours. Moreover, HTLA ER cells were more tolerant than HTLA 230 cells. Specifically, compound 1 did not reduce HTLA 230 cell viability below 50% after 24 hours treatment at any of tested concentrations. However, longer exposures resulted in a significant decrease in cell viability, which reached 44.3% and 44.1% after 48 and 72hours, respectively, at concentrations of 50 and 10 µM. Conversely, after 72 hours exposure, HTLA ER viability was reduced to t 46.9, 37.3 and 31.2% at 50, 75 and 100 µM, respectively. Compound 3 showed a cytotoxic activity partially overlapping with, but not consistently superior to, that of compound 1, depending on cell line and exposure time. In HTLA 230 cells, compound 3 reduced cell viability below 50% already after 24 (49.7%) and 48 hours (45.9%) treatments, when administered at 75 µM and after 72-hours at 50 µM (41.7%), indicating a higher efficacy than compound 1 under short-time exposure conditions. In HTLA ER, compound 3 did not reduced cell viability below 50% after 24 hours at any tested concentration, similarly to compound 1. After 48 hours exposure, HTLA ER cell viability was reduced to 49.9 and 45.5%, at 75 and 100 µM, respectively. Prolonged exposure for 72 hours induced a further decrease in HTLA ER viability to 43.3, 38.5 and 28.7%, at 50, 75 and 100 µM, respectively, indicating only a modestly higher efficacy compared to compound 1 in the MDR cell population. Compound 4 showed a cytotoxic effect comparable to that of compound 1. In HTLA 230, compound 4 did not reduce cell viability under 50% after short-time treatment (24 hours) at any tested concentration, whereas a reduction below this threshold was observed at longer time exposure. In detail, HTLA 230 viability decreased to 45.4% after 48 hours at the highest concentration (100 µM), and to 40.6 and 33.2 % after for 72-hours, at 75 and 100 µM, respectively. Similarly to compound 1, compound 4 did not reduce HTLA ER viability below 50% after 24- and 48-hour treatments at any concentration. Conversely, the administration of compound 4 for 72 hours induced a significant decrease in HTLA ER viability to 42.2 and 29.7% (75 and 100 µM, respectively). Collectively, compound 4 demonstrated cytotoxic activity against both NB cells populations, which was slightly lower than that observed for compound 1 and markedly lower than that of 3.
Following the same procedure described for MCM cells, IC50 values of compounds 1, 3 and 4 were calculated for HTLA 230 and HTLA ER cells after 24, 48 and 72 hours of treatment, using GraphPad Prism software (version 8.0.1). For comparison with a clinically relevant therapy using etoposide (ETO) [63], previously published cytotoxicity data showing the effects of ETO in HTLA 230 and HTLA ER NB cells after 24 hours of exposure [18], have been reported in Figure 14. Figure 14a shows the bar graph of cell viability (%) vs. increasing ETO concentrations (1.25 -100 µM), while Figure 14b shows the corresponding dispersion graphs. IC50 values of ETO were calculated following the same method applied to our compounds and all resulted IC50 (µM) have been summarized in Table 2.
Although the activity of compounds 1, 3 and 4 against MDR HTLA ER maybe appear moderate when considered alone, it becomes highly promising when compared with that of ETO, which is one of the most widely used drugs for the treatment of high-risk NB. When IC50 values against both NB cell populations were compared, all QPSs resulted much more effective than ETO. At 24 hours of exposure, compound 1 was more cytotoxic than ETO by 1.2-times in HTLA 230 and by 3.2-times in HTLA ER. Compounds 3 and 4 showed even higher potency, being 2.0 and 1.3-fold more effective than ETO in HTLA 230 and 4.7 and 3.2-fold a in ER, respectively.
A direct comparison between the activity of ETO (24-hours exposure, the only data available for ETO) [18], and that of compounds 1, 3 and 4 at all concentrations tested (1-100 µM) for each compound, has been shown in Figure 15.
At low concentrations, mainly compounds 1 and 3 exerted cytotoxic effects against HTLA ER cells. At 1.0 µM, both compounds reduced cell viability to 91.7 (compound 1) and 96.9% (compound 3), whereas ETO, given at 1.25 µM, slightly increased cells proliferation (101.3%). Similar effects were observed at 5 µM concentrations versus 10 µM of ETO, while both compounds administered at 10 µM were more potent than ETO administered at the same concentration against both HTLA 230 and ER. Specifically, HTLA ER viability after treatment with compound 1 (5, 10 µM) was 87.9 and 84.4% versus 99.9% (ETO 10 µM), while compound 3 (5, 10 µM) reduced cell viability to 95.0 and 98.8%. At 10 µM, compounds 1 and 3 reduced viability of HTLA ER to 86.3 and 86.7%, respectively, compared with 87.3% of ETO. At the higher concentrations of 25, 50 and 100 µM, compound 1 was more efficient than ETO against both HTLA 230 and HTLA ER. In detail, compound 1 reduced HTLA 230 and HTLA ER cell viability to 63.6 and 86.4% at 25 µM, to 66.6 and 85.6% at 50 µM, and to 57.1 and 55.1% at 100 µM. Conversely, ETO reduced the viability of both NB populations to 76.5 and 98.4% at 25 µM, to 72.1 and 91.1% at (50 µM) and to 68.6 and 82.3% at 100 µM. Compound 3 showed a similar trend at higher concentrations, being more effective than ETO at 50 and 100 µM. At these concentrations, it reduced HTLA 230 and HTLA ER viability to 63.8 and 79.9% (50 µM) and to 38.6 and 54.7% (100 µM), respectively, whereas ETO reduced cell viability to 72.9 and 91.9% at 50 µM and to 68.6 and 82.3% at 100 µM. Finally, compound 4 also was more efficient than ETO when administered at the highest concentration tested. In fact, at 100 µM it reduced HTLA 230 viability to 53.4% compared with 68.6% observed for ETO, corresponding to an approximately 1.3-fold higher cytotoxic effect. A further comparison visualizing the dispersion graphs of cells viability (%) as a function of increasing concentrations of 1, 3, 4 and ETO has been reported in Figure 16.
At the highest concentrations tested (100 µM), all compounds (1, 3 and 4), reduced viability of both cells’ populations more effectively than ETO, demonstrating that these QPSs outperform ETO not only against MDR NB cells but also against HTLA230, which are considered sensitive to this clinical approved drug.
2.6.3. In vitro Haemolytic Toxicity of Compounds 1, 3 and 4 on Red Blood Cells (RBCs)
The haemolytic ratio percentage (%) caused by compounds 1, 3 and 4 has been assessed as recently reported with slight changes[64]. Briefly, EDTA-blood samples from six healthy donors were exposed to increasing concentrations (0.5-100 µM) of each compound, while untreated blood (0.0 µM) were used as control (CTR).
Haemolysis (%) and cell viability (%) are shown in Figure 17 (Figure 17a and 17c), while in Figure 17b and 17d the correspondent dispersion graphs have been reported.
As shown in Figure 17a and 17c, haemolysis (%) and reduction in RBC viability (%) were statistically significant at concentrations ≥ 20 µM for compound 1, and ≥ 5 µM for compounds 3 and 4. However, substantial haemolysis and marked loss of cell viability (below 50%) were observed only at concentrations ≥ 50 µM, corresponding to haemolytic ratios of 65.4 (compound 1), 77.5 (compound 3) and 71.0 % (compound 4). The comparison between viability (%) of RBCs and that of all cancer cells after the more efficient treatment, in terms of time and exerted cytotoxicity, when exposed to 10, 25 and 50 µM of 1, 3 and 4 has been shown in Figure 18.
As shown in Figure 18, at 10 µM concentrations, all compounds were generally more cytotoxic towards cancer cells than haemolytic towards RBCs, with the exception for compound 4 against HTLA ER, where RBC viability (86.7%) was slightly lower that of cancer cells (89.1%). At 25 µM, this trend was maintained for most compounds, except for samples 3 and 4 against MeTRAV and for compound 4 against both HTLA 230 and ER NB cells. At 50 µM, in most cases, except for sporadic circumstances on MeOV cells, haemolytic effects exceeded cytotoxicity. This behaviour is particularly relevant for a possible systemic clinical use of these QPSs, as it has indicated a therapeutic window in which cancer cells are preferentially targeted while minimizing haemolysis. However, for their hypothetical topical application in metastatic melanoma to treat skin lesions, this limitation is less critical. Skin metastases often represent the first sign of advanced disease or of recurrence [65] and, while sometimes asymptomatic, in advanced stages can develop ulceration, bleeding, superinfection and can cause symptoms related to compression on nearby tissues, that severely impact patient quality of life [65], which could be ameliorated by the topical administration of QPSs 1, 3 and 4. Anyway, as previously described for the other viability experiments, the dispersion graph of compound 1, 3 and 4 (concentrations vs RBCs viability; Figure 17d), was used to calculate the their HC50 values, defined as the concentrations required to induce 50% haemolysis. HC50 values for RBCs and IC50 values for all cancer cells at each time exposure were reported in Table 3 and a comparative analysis between HC50 and the best IC50 values observed for each compound was shown in Figure 19.
According to results shown in Table 3, in several cases the HC50 of the QPSs versus RBCs were lower than their IC50 against cancer cells (7 cases for 1, 9 for 3 and 11 for 4), indicating a considerable haemolytic toxicity. However, when HC50 values were compared with IC50 obtained under the most effective exposure times (Figure 19), all compounds were less haemolytic than cytotoxic against PLX-R MeOV cells. Compounds 1 and 3 were also more cytotoxic than haemolytic against most other cells, with the exception for PLX-R MeTRAV population. Conversely, compound 4, already identified as the least active anticancer QPS in this study, was generally more haemolytic than cytotoxic, except for PLX-R MeOV cells, indicating a lower selectivity for tumour cells.
2.6.4. Concentration- and Time-Dependent Effects of samples 1, 3 and 4 on HaCaT and 3T3 Cell Viability
To further investigate the potential clinical development of compounds 1, 3 and 4, either as topical drug for the treatment of resistant melanoma skin lesions or as components of chemotherapeutic regimens to counteract high-risk resistant NB, their effects were ascertained in non-cancerogenic cells. Specifically, HaCaT cells, an immortalized non-cancerous human keratinocyte cell line [66,67,68,69] and 3T3 cells, a fibroblast cell line derived from mouse embryonic tissue, were treated with compounds 1, 3 and 4 (1-100 µM) for 24, 48 and 72hours, and cell viability was subsequently assessed and reported as bar graphs in Figure 20.
3T3 cells were markedly more tolerant to compounds 1, 3 and 4 than HaCaT cells, and all compounds displayed very low toxicity toward this cell line. Among them, compound 3 was the least tolerated. However, cell viability remained high (~ 81-91%), depending on exposure time (Figure 20). Even under the most aggressive conditions (72-hours, 100 µM), cell viability exceeded 92% (compound 1), and 93% (compound 4), while treatment with compound 3 resulted in 79.5% viable cells. Conversely, HaCaT cells, especially at concentrations > 50 µM and after 48- and 72-hours exposure were more sensitive to QPSs than 3T3 ones. Specifically, compound 1 showed no cytotoxicity after 24-hours, inducing HaCaT proliferation (102.8%) at 100 µM, and only a slight cytotoxic was observed effect after 48-hours treatment (69.9% viable cells). A marked reduction in cell viability was observed only after 72-hours, when HaCaT viability, when cells were exposed to 100 µM 1, decreased to 37.9%. Compound 3 behaved similarly to compound 1 after 24-hour treatment, whereas at 48- and 72-hour treatments, its effects were comparable to those of compound 4. Specifically, compounds 3 and 4 reduced cell viability to 38.8% and 32.9% (48-hours exposure) at 75 and 50 µM, respectively, and to 39.1% (72-hours exposure) at 50 and 10 µM, respectively. A graphical comparison of the average cell viability (%) of 3T3 fibroblasts and cancer cell lines (MeOV, MeTRAV, HTLA 230 and HTLA ER) after exposure to 50 (Figure 21a) and 100 µM (Figure 21b) of compounds 1, 3 and 4 for 24, 48 and 72 hours has been shown in Figure 21.
Curiously, the average viability of 3T3 cells (89.9%) treated with all compounds at 100 µM was higher than that observed at 50 µM. Anyway, at 50 µM, only two cases out of 36 total conditions, i.e. compounds 1 and 4 after 72 hours exposure against PLX-R MeTRAV MCM cells, showed a slightly higher cytotoxicity toward 3T3 cells than toward cancer cells. Conversely, in all other cases, 3T3 cell viability was consistently higher than that of all cancer cell lines under the same exposure conditions. When 1, 3 and 4 were administered at 100 µM, 3T3 cell viability was always consistently higher than that observed for cancer cell lines. To enable a direct comparison between the cytotoxic effects of our QPSs on non-tumorigenic (HaCaT and 3T3) and cancer cells, the IC50 values for HaCaT and 3T3 cells were calculated using the same procedure and software described above. In the case of 4 administered to 3T3 cells for 24 hours, the IC50 values were derived from the equation of the best fitting curve, as the software flagged the standard calculation as unreliable. The IC50 values of all compounds for MCM and NB cell lines have been reported in Figure 22.
Figure 22 confirmed that for compound 1 and 3, PLX-resistant MeTRAV cells were more tolerant than MeOV, whereas the behaviour of NB was exposure-time dependent, with HTLA ER cells generally less sensitive than HTLA 230 ones. On the contrary, compound 4 exhibited similar IC50 values across all tested cell lines, ranging from 25.4 to 67.4 µM. HC50 values of all QPSs versus RBCs were quite high, but in several cases, they were lower than the corresponding IC50 values against cancer cells, indicating a certain level of time-dependent haemolytic toxicity. On the contrary, IC50 values obtained for 3T3 fibroblasts were significantly higher than those observed for cancer cells, especially for compounds 1 and 4. As previously reported, HaCaT cells were more sensitive to all QPSs than 3T3 cells, especially to compound 4. QPSs-induced cytotoxicity in HaCat was clearly time dependent, with 72-hours treatments being detrimental and 24-hours exposure ones were generally well tolerated. Importantly, all newly developed QPSs were significantly less haemolytic then the previously reported BPPB, by factors of 3.4 (1), 2.1 (3) and 2.0 (4). Additionally, 1 was markedly less cytotoxic toward HaCaT than BPPB by 123.4- (24 hours), 213.4- (48 hours) and 14.6-fold (72 hours). Similarly, 3 showed reduced cytotoxicity by 36.8- (24 hours), 144.5- (48 hours) and 29.75-fold (72 hours) fold, while 4 was less cytotoxic by 69.1- (24 hours), 60.0- (48 hours) and 7.5-fold (72 hours).
Moreover, the cytotoxicity of all QPSs toward HaCaT cells was substantially lower than that reported for cationic dendrimer nanoparticles (PAMAM) of fourth (G4), fifth (G5) and sixth (G6) generation, extensively reviewed for biomedical applications, according to what observed by Mukherjee et al. after 24 hour-exposure [69]. Specifically, based on the data obtained using the same MTT assay used in this study, 1 was less toxic than G4, G5 and G6 by 155.7-, 467.3- and 490.2-fold respectively, while 3 and 4 by 46.07-, 138.2- 145.0- and by 86.5-, 259.6- and 272.4-times, respectively [69].
2.6.5. Selectivity Index
The selectivity index (SI) of all QPSs for cancer cells in relation to RBCs, HaCaT and 3T3 cells was calculated to predict its therapeutic potential. Generally, the SI values against tumoral cells (TCs) in relation to non-tumoral cells (NTCs) is calculated using the formula (1).
SI = IC50 for NTCs/IC50 for TCs
The IC50 values determined after 24, 48 and 72 hours of exposure of MeOV, MeTRAV, HTLA 230, HTLA ER, HaCaT and 3T3 cells to QPSs 1, 3 and 4, together with the HC50 values determined for RBC following exposure to QPSs for the time of experiments as for protocol [64], were used to calculate the related SIs according to Eq. 1. SIs have been graphically reported in Figure 22.
Concerning RBCs, the selectivity of all QPSs towards tumour cells was generally low, being compound 4 the least selective, demonstrating SIs > 1 (1.2) only vs. MeOV in 48-hours treatments. On the contrary, 1 was the most selective compound, exhibiting SIs equal to 1.0 (24 hours), 8.3 (48 hours) and 3.6 (72 hours) vs. MeOV, 2.1 (48 hours) and 13.2 (72 hours) vs. HTLA 230 and 1.6 (72 hours) vs HTLA ER cells. In all remaining cases, including MeTRAV cells at all time exposure (SIs = 0.4, 0.7 and 0.9), HTLA 230 cells in 24-hours treatments (SIs = 0.5) and HTLA ER cells in 24- and 48-hours treatments (SIs = 0.3 and 0.5, respectively), selectivity index values were < 1, indicating poor selectivity versus cancer cells. Finally, compound 3 was sufficiently selective for MeOV (SIs = 1.4, 48-hours treatment), HTLA 230 (SIs = 1.3, 72-hours treatment) and HTLA ER cells (SIs = 1.2, 72-hours treatment), whereas all remaining SIs values were < 1. Notably, while positive SIs of compounds 3 and 4 in relation to their haemolytic toxicity versus RBCs were similar and close to 1 (1.2-1.4), those of compound 1 reached very higher values of 3.6 and 8.3 for MeOV and 13.2 for HTLA 230 cells. These findings suggest that compound 1 could be the safest candidate to minimize haemolytic toxicity in a potential future systemic clinical application. Concerning 3T3 cells, all compounds demonstrated SIs substantially higher than 1. Compound 1 was the less cytotoxic, with SIs values from 3.3 to 110, whereas compound 3 was the most aggressive, although still maintaining acceptable with selectivity index values in the range 2.2-12.8. Compound 4 exhibited an intermediate behaviour, with SIs values ranging from 3.2 to 66.2. In the cases of compound 3 and 4, the highest selectivity was observed against MeOV cells in 48-hours treatments (SIs = 12.7 and 66.2, respectively), followed by that for HTLA 230 treated with compound (3) for 72-hours treatments (SI = 8.8) and MeTRAV cells treated with compound 4 for 48-hours treatments (SI = 43.9). Conversely, compound 1 displayed its highest selectivity against HTLA 230 in 72-hours treatments (110.1), followed by that for MeOV in 48-hours treatments (SI = 66.1). As already evinced by IC50 values, HaCaT tolerability to all QPSs depended on both tumour cells type and time of exposure, with long-term treatments (72 hours) being the most detrimental. Specifically, compound 1 exhibited high selectivity toward all cancer cell lines in 24-48-hours treatments, with SI values ranging from 1.4 to 23.3. In contrast, after 72-hours exposure, SIs dropped in the range 0.1-0.9 for most cancer cell lines, with the exception for HTLA 230, towards which SI value remained substantially higher than 1 (SI = 3.3). Despite lower SIs were obtained, a similar scenario was observed for compound 3. This compound, which exhibited SIs values higher than 1 (1.1-4-1) against all cancer cell in 24- 48-hours treatments, in 72-hours treatments displayed SIs values < 1 (0.3-0.7) only for MCM cells, whereas selectivity toward NB cells remained > 1 (1.0-1.1). Collectively, the compound less selective for cancer cells was 4, especially towards NB cells. For HTLA 230 and HTLA ER cells, lower SIs > 1 were observed only in 24-hours treatments (2.5 and 1.7, respectively), whereas in all other conditions, SIs were <1 (0.1-0.4). Higher selectivity was instead observed for MCM cells, for which SIs < 1 (0.1-0.2) were obtained only after long-time exposure (72 hour).
Collectively, the newly developed QPSs showed, in several cases, significantly higher selectivity than the previously reported QPS BPPB[19] towards MCM cells, in relation to their cytotoxicity against HaCaT cells. Specifically, selectivity versus MeOV cells was increased by 2.5- and 2.9-fold for compound 1 in 24- and 48-hours treatments, respectively, an increase of 1.8-fold was observed only in 24-hours treatments, for compound 4. Moreover, selectivity of all compounds for MeTRAV cells, was higher than that of BPPB in the 24-hours treatments by 7.9-, 2.4- and 6.3-fold for compounds 1, 3 and 4, respectively [19]. Although a direct comparison between selectivity of QPSs for toward NB cells in relation to their cytotoxicity for 3T3 cells and that of BPPB was not possible for lack of data, an indirect comparison could be performed using the available SIs values of BPPB obtained on MRC-5 cells [23], which are non-immortalized human lung fibroblasts derived from embryonic tissue as 3T3 cells [70]. In this regard, except for compounds 3 and 4 in 24-hours treatments against HTLA 230 NB cells, all compounds were highly more selective toward both NB cell populations than BPPB [23]. Specifically, compound 1 was more selective for cancer cells than BPPB by 1.1-, 4.5- and 27.1-fold against HTLA 230 cells after 24-, 48- and 72-hours exposure, respectively, and by 3.7-, 5.0- and 12.3-fold against HTLA ER cells at the same exposure times of 24-, 48- and 72-hours. Compounds 3 and 4, although less selective than BPPB toward HTLA 230 NB cell in 24-hours treatments, exhibited higher selectivity in all other experimental conditions. Specifically, by 1.6-2.2-fold (compound 3) and 3.6-4.6-fold (compound 4) towards HTLA 230 and by 1.3-7.1-fold (compound 3) and 1.3-19.1-fold (compound 4) towards HTLA ER NB cells. Finally, as above-anticipated, SIs of compound 1 versus MCM cells in relation to its toxicity against 3T3 cells in 24-hours exposure, was higher than that of SmIII-EGCG by Li et al, by 1.6- (MeTRAV) and 1.8-fold (MeOV).
2.6.6. Comparison of 1, 3 and 4 Biological Effects with Those of BPPB Using PCA
The data matrix comprising 292 variables, constructed as explained in Experimental Section, was processed by PCA, as made previously. The total variance (100%) was explained by three components (PC1 explained 75.20%, PC2 18.17% and PC3 11.63% of total variance). The results were reported as score plot of PC1 versus PC2, explaining the 88.4% of total variance.
Figure 23.
Score plot of PCA results represented as scores of compounds 1, 3, 4 and BPPB in PC1 (70.2% of variance) versus those in PC2 (18.2% of variance). The red cross indicates the intersections at zero scores of PC1 with PC2.
Figure 23.
Score plot of PCA results represented as scores of compounds 1, 3, 4 and BPPB in PC1 (70.2% of variance) versus those in PC2 (18.2% of variance). The red cross indicates the intersections at zero scores of PC1 with PC2.
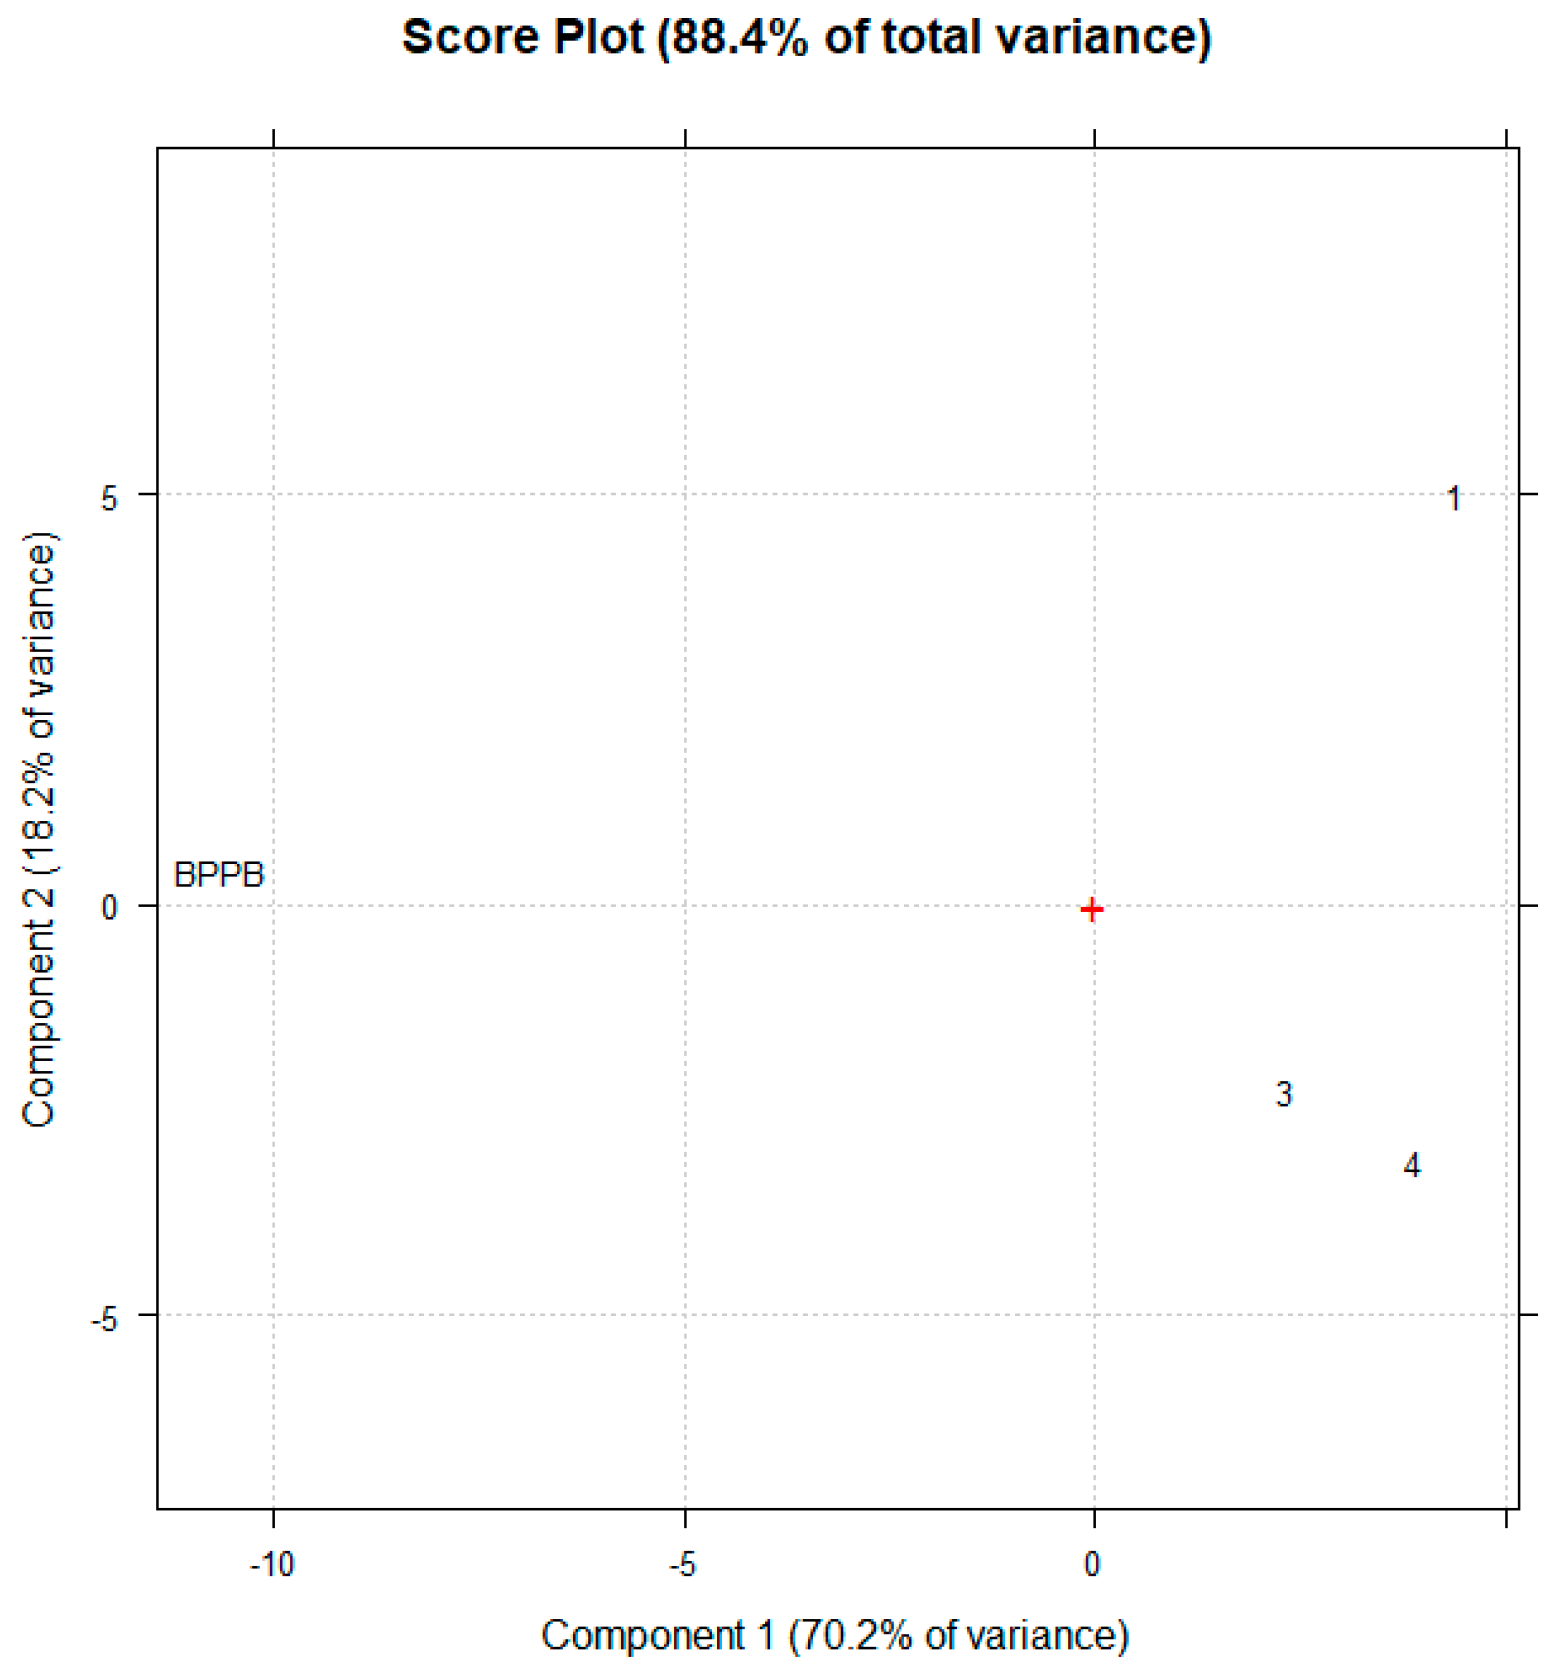
Compounds 1, 3 and 4 were clustered at positive PC1 scores (close to +5), clearly separated from BPPB, which was located at negative PC1 scores (> -10), indicating a markedly different biological activity. In fact, although BPPB was significantly more active against both NB and CMM cells, in terms of IC50 values, it was also more cytotoxic to not tumorigenic cells, resulting in lower SI values. In contrast, the new QPSs displayed a safer overall biological profile, supporting their potential suitability for future therapeutic applications. Separation of QPSs on PC1, locating compound 1 at positive scores (+5), well separated by compounds 3 and 4 which located both at negative scores (around –2.5), could indicate its high efficiency in treating cancer cells and its high SIs, frequently observed.
3. Materials and Methods
3.1. Chemicals and Instruments
All solvents (Merck, Milan, Italy) were dried and purified according to standard procedures prior to use. When required, reactions were performed under inert atmosphere (Ar) in pre-flamed glassware. Anhydrous Na2SO4 was used for drying solutions, and the solvents were then routinely removed at ca. 40 °C under reduced pressure (ca 10–20 mmHg), using a rotary evaporator. All reagents employed in the present work were commercially available (Merck, Milan, Italy) and used without further purification. Flash column chromatography (FCC) was performed on silica gel (70–230 and 230–400 mesh, Merck, Darmstadt, Germany). Thin layer chromatography (TLC) was performed using aluminum-backed silica gel plates (Merck DC-Alufolien Kieselgel 60 F254, Merck, Washington, DC, USA), and detection of spots was made by UV light (254 nm) using a Handheld UV Lamp, LW/SW, 6W, UVGL-58 (Science Company®, Lakewood, CO, USA). Attenuated total reflectance (ATR) Fourier transform infrared (FTIR) analyses were carried out using a Spectrum Two FT-IR Spectrometer (PerkinElmer, Inc., Waltham, MA, USA) as previously reported [71]. 1H, 13C, and 31P NMR spectra were acquired on a Jeol 400 MHz spectrometer (JEOL USA, Inc., Peabody, MA, USA) at 400, 100, and 162 MHz, respectively. Standard 13C NMR spectra and DEPT135 experiments were reported. Chemical shifts were reported in ppm (parts per million) units relative to the internal standard tetramethylsilane (TMS = 0.00 ppm) and coupling constants (J) are reported in Hz. The splitting patterns were described as follows: s (singlet), d (doublet), t (triplet), q (quartet), m (multiplet), and br (broad signal). Gas chromatography-mass spectrometry (GC-MS) spectra were performed on a Varian Saturn 2000 ion trap GC-MS instrument (Artisan Technology Group ®, Champaign, Illinois, USA) equipped with a DB-5MS column (30 m, i.d. 0.25 mm) (Agilent, Santa Clara, CA, USA). Melting points are incorrect and were measured using an electric melting point device (Falc Instruments Srl, Treviglio, Bergamo, Italy), having accuracy ± 1.0 to 20°C and ± 2.5 to 300°C. Elemental analyses were carried out using an Elemental Analyzer (Fison Instruments Ltd., Farnborough, Hampshire, UK).
3.2. Synthesis of Phosphor-Containing Compounds 1-4
With the aim at finding novel compounds effectively active against difficult-to-treat late-stage cutaneous metastatic melanoma and neuroblastoma, due to cells mutations and resistance developed to vemurafenib (PLX)[18] and several anticancer drugs (paclitaxel, doxorubicin, etoposide)[16], four compound (1-4), were synthesized and fully characterized. Three compounds (1,3 and 4) were in the form of quaternized phosphonium salts containing the triphenyl benzyl or the diphenyl-benzyl alkyl phosphonium groups, while compound 2 was in the form of a not quaternized uncharged phosphine derivative, having only two phenyl rings and a 11-undecanol chain directly linked to phosphorous atom. Compound 2 was necessary to synthesize 3 and 4.
3.2.1. Benzyl triphenyl phosphonium bromide (1) [42]
Triphenylphosphine (1.35 g, 5.02 mmol) was added to a solution of commercial benzyl bromide (0.85 g, 4.97 mmol, 0.6 mL) in dichloromethane (DCM) (45 mL). The mixture was heated to reflux for 24 h, then left to reach room temperature and then maintained under stirring for additional 24 h, during which a precipitate formed. Diethyl ether (Et2O) was added to complete precipitation and the solid filtered to give the product in 97.3 % yield (2.09 g, 4.84 mmol), as white crystals with high level of purity and no need of further purification.
M. p.: 293-294 °C; 298°C (lit) [43], 298-301°C (lit) [44]. ATR-FTIR (ν, cm-1): 3085, 3052, 3010 (=C-H stretching), 2859, 2773 (C-H stretching), 1456, 1436 (C-H banding), 719, 689 (C-P stretching). 1H NMR (400 MHz, CDCl3, ambient °C): δ (ppm) = 7.71 (s, J = 7.7, 7.4, 3.7 Hz, 6 equivalent H), 7.65 (s, J = 13.3, 7.7 Hz, 6 equivalent H), 7.45 (t, J = 7.4 Hz, 3 equivalent H), 7.26 (s, J = 7.6, 7.4 Hz, 2 equivalent H), 7.22 (s, J = 7.6, 3.3 Hz, 2 equivalent H), 7.22 (t, J = 7.4 Hz, 1H), 5.97 ppm (d, J = 15.2 Hz, 2H CH2). 13C NMR (101 MHz, CDCl3, ambient °C): δ (ppm) = 135.1 (s, 3 equivalent C), 134.3, (d, J2C-P = 10.20 Hz, 6 equivalent C), 132.2 (d, J3C-P = 5.26 Hz, 2 equivalent C), 130.2 (d, J3C-P = 5.26 Hz, 2 equivalent C), 130.2 (d, conjugated J3C-P = 12.70 Hz, 6 equivalent C), 130.0 (d, J4C-P = 3.20 Hz, 2 equivalent C), 129.6 (s, 1C), 128.5 (d, not conjugated J2C-P = 8.68 Hz, 1C), 117.1 (d, aromatic J1C-P = 86.20 Hz, 3 equivalent C), 28.1 (d, aliphatic J1C-P = 48.10 Hz, CH2). 31P NMR (162 MHz, ambient °C): δ (ppm) = 21.76 (s, 1P). Calcd. for C25H22BrP, Mol. Wt. (MW): 433.32. Found exact mass: 432.06; (GC/MS) (m/z): m/e: 432.06 (100.0%), 434.06 (97.3%), 433.07 (28.1%), 435.07 (27.7%), 434.07 (3.8%), 436.07 (3.7%). Anal. Calcd. C, 69.29%; H, 5.12%; Br, 18.44%; P, 7.15%. Found: C, 69.57%; H, 4.98%; Br, 18.61%; P, 6.99%.
3.2.2. 11-(Di-Phenyl-Phosphine)-1-Undecanol 2 [45]
In a two-neck flask flamed under a stream of nitrogen, a 2/1 excess of sodium hydride (60% in mineral oil) (1.17 g, 48.68 mmol) was suspended in dimethyl sulfoxide (DMSO, 31 mL) and heated to 70°C to promote dissolution. Then, triphenyl-phosphonium undecane-11-olo was added [29](7.36 g, 14.33 mmol), observing an immediate orange coloration. The mixture was then stirred at 50°C for 1h until the reagent disappeared (TLC DCM/MeOH 9/1). The reaction was then quenched with NH4Cl- and the aqueous phase was extracted with Et2O (3 × 30 mL). The organic phases were unified and washed with H2O and dried over Na2SO4 overnight. After removal of the solvent under reduced pressure, a dark oil was obtained (6.32 g), which was subjected to flash column chromatography (FCC) to obtain pure 2, in form of orange oil (4.14 g, 11.61 mmol, 81.0% yield). Rf. 0.48 (Et2O/hexane 1/1).
Oil. ATR-FTIR (ν, cm-1): 3366 (O-H stretching), 3056 (=C-H stretching), 2924, 2852 (C-H stretching), 1484-1437 (C-H banding), 1173, 1120 (C-O stretching), 746, 721, 691 (C-P stretching). 1H NMR (400 MHz, CDCl3, ambient °C): δ (ppm) = 7.46 (t, J = 7.5, 7.0 Hz, 4 equivalent H), 7.05 (s, J = 7.5 Hz, 4 equivalent H), 6.97 (s, J = 7.5 Hz, 2 equivalent H), 3.57 (td, J = 6.4, 5.0 Hz, 2H, CH2), 2.29 (dt, J = 8.0, 6.6 Hz, 2H, CH2), 1.54 (dtt, J = 8.8, 7.2, 6.6 Hz, 2H, CH2), 1.53 (quin, J = 6.9, 6.4 Hz, 2H, CH2), 1.37 (s, J = 7.7, 6.8 Hz, 2H, CH2), 1.33 (s, J = 6.9, 6.8 Hz, 2H, CH2), 1.29 (s, J = 7.5, 7.2, 4.8 Hz, 2H, CH2), 1.28 (s, J = 7.7 Hz, 2H, CH2), 1.28 (s, J = 7.7 Hz, 2H, CH2), 1.28 (s, J = 7.7, 7.5, 6.0 Hz, 2 equivalent H, CH2), 1.27 ppm (s, J = 7.7 Hz, 2H, CH2). 13C NMR (101 MHz, CDCl3, ambient °C): δ (ppm) = 132.7 (d, J2C-P = 17.76 Hz, 4 equivalent C), 128.6 (d, J3C-P = 6.00 Hz, 4 equivalent C), 128.4 (d, J4C-P = 7.00 Hz, 2 equivalent C), 62.9 (s, CH2OH), 33.0 (s, CH2), 29.8 aliphatic J1C-P = 12.24 Hz CH2), 29.7, 29.7, 29.6 (3s, CH2), 29.5 (d, aliphatic J5C-P = 4.97 Hz, CH2), 29.3 (d, aliphatic J4C-P = 5.00 Hz, CH2), 29.0 (d, aliphatic J3C-P = 10.55 Hz, CH2), 26.3 (s, CH2), 25.8 (d, aliphatic J2C-P = 14.84 Hz, CH2). 31P NMR (162 MHz, ambient °C): δ (ppm) = 15.40 (s, 1P). Calcd. for C23H33OP, Mol. Wt.: 356.48. Found exact mass: 356.23. GC/MS (m/e): 356.23 (100.0%), 357.23 (26.1%), 358.23 (3.3%). Calcd.: C, 77.49%; H, 9.33%; O, 4.49%; P, 8.69%. Found: C, 77.16%; H, 9.61%; O, 4.47%; P, 9.00%.
3.2.3. Benzyl-(11-Hydroxyundecyl)-Diphenyl-Phosphonium Bromide (3) and Benzyl-diphenyl-undec-10-enyl-phosphonium bromide (4)
Commercial benzyl bromide (0.8115 g, 4.74 mmol, 0.6 mL), oily 11-(di-phenyl-phosphine)-1-undecanol (11-DPPOH, 1.99 g, 5.56 mmol) and DCM (7 mL) were stirred in a 50 mL two-necked round-bottomed flask equipped with a reflux condenser for 24 h. Then the mixture was left to reach room temperature and was maintained under stirring for additional 24 h. The solvent was removed under reduced pressure, and the oily residue was treated with diethyl ether (Et2O) (80 mL) and stirred overnight. Upon decantation two phases formed. The supernatant was separated and evaporated in vacuum obtaining 4 as a brown oil, which was negative Schiff test (OH absent) (0.9424 g, 1.84 mmol, 39.02%, Rf. 0.2581 (MeOH/Petrol 1/1)). The residue was dissolved in acetone, transferred and after removal of solvent at reduced pressure, 3 was obtained as dark-brown oil, which was positive Schiff test (OH) (1.01 g, 1.91 mmol, 40.3%, Rf. 0.1828 (MeOH/Petrol 1/1).
Compound 3. Brown oil. ATR-FTIR (ν, cm-1): 3334 (O-H stretching), 3056, 3026 (=C-H stretching), 2924, 2852 (C-H stretching), 1455-1437 (C-H banding), 1160, 1120 (C-O stretching), 743, 720, 694 (C-P stretching). 1H NMR (400 MHz, CDCl3, ambient °C): δ (ppm) = 8.37 (dd, J = 7.7, 5.6 Hz, 4 equivalent H), 7.60 (s, J = 7.4 Hz, 2 equivalent H), 7.52 (s, J = 7.7, 7.4, 5.0 Hz, 4 equivalent H), 7.45 (dd, J = 7.6, 3.3 Hz, 2 equivalent H), 7.28 (t, J = 7.4 Hz, 1H), 7.17 (t, J = 7.6, 7.4 Hz, 2 equivalent H), 4.27 (d, J = 13.9 Hz, 2H, CH2), 3.65 (td, J = 6.4, 5.0 Hz, 2H, CH2), 3.12 (dt, J = 11.9, 6.8 Hz, 2H, CH2), 1.53 (quin, J = 6.9, 6.4 Hz, 2H, CH2), 1.47 (s, J = 7.9, 7.2, 6.8 Hz, 2H, CH2), 1.45 (s, J = 7.5, 7.2 Hz, 2H, CH2), 1.32 (quin, J = 6.9, 6.8 Hz, 2H, CH2), 1.23 (s, J = 7.7, 6.80 Hz, CH2), 1.23 (s, J = 7.7, 7.5, 6.0 Hz, 2 equivalent H, CH2), 1.21 (s, J = 7.7 Hz, 2H, CH2), 1.19 (s, J = 7.7 Hz, 2H, CH2), 1.16 ppm (s, J = 7.7 Hz, 2H, CH2). 13C NMR (101 MHz, CDCl3, ambient °C): δ (ppm) = 134.5 (s, 2 equivalent C), 132.5 (d, J2C-P = 10.38 Hz, 4 equivalent C), 130.96 (d, not conjugated J3C-P = 5.30 Hz, 2 equivalent C), 130.4 (d, conjugated J3C-P = 12.60 Hz, 4 equivalent C), 128.9 (d, not conjugated J4C-P = 3.20 Hz, 2 equivalent C), 128.5 (s, 1C), 128.1 (d, not conjugated J2C-P = 8.90 Hz 1C), 117.4 (d, aromatic J1C-P = 83.73 Hz, 2 equivalent C), 62.3 (s, CH2OH), 32.4 (s, CH2), 30.3 (d, aliphatic J3C-P = 13.85 Hz CH2), 29.8 (d, aliphatic J4C-P = 5.00 Hz CH2), 29.6, 29.6 (2s, 2CH2), 29.5 (d, aliphatic J5C-P = 4.97 Hz CH2), 29.6 (d, aliphatic J1C-P = 47.30 Hz CH2), 28.6, 25.8 (2s, CH2), 23.2 (d, aliphatic J1C-P = 45.20 Hz CH2), 21.9 (d, aliphatic J2C-P = 4.05 Hz CH2). 31P NMR (162 MHz, ambient °C): δ (ppm) = 23.82 (s, 1P). Calcd. for C30H40BrOP, Mol. Wt. (MW): 527.52. Found exact mass: 526.20; (GC/MS) (m/e): 526.20 (100.0%), 528.20 (97.5%), 527.20 (33.4%), 529.20 (33.1%), 528.21 (5.6%), 530.20 (5.4%). Anal. Calcd. C, 68.31; H, 7.64; Br, 15.15; O, 3.03; P, 5.87. Found: C, 68.05%; H, 7.88%; Br, 14.93%; P, 5.58%.
Compound 4. Brown oil. ATR-FTIR (ν, cm-1): 3056, 3029 (=C-H stretching), 2925, 2853 (C-H stretching), 1454-1437 (C-H banding), 743, 720, 694 (C-P stretching). 1H NMR (400 MHz, CDCl3, ambient °C): δ (ppm) = 8.37 (dd, J = 7.7, 5.6 Hz, 4 equivalent H), 7.60 (s, J = 7.4 Hz, 2 equivalent H), 7.52 (s, J = 7.7, 7.4, 5.0 Hz, 1H), 7.45 (dd, J = 7.6, 3.3 Hz, 4 equivalent H), 7.45 (dd, J = 7.6, 3.3 Hz, 1H), 7.28 (t, J = 7.4 Hz, 1H), 7.17 (t, J = 7.6, 7.4 Hz, 2 equivalent H), 5.76 (ddt, J = 15.3, 12.1, 6.4, 6.3 Hz, 1H), 4.99 (d, J = 15.3 Hz, 1Hb), 4.94 (d, J = 12.1 Hz, 1Ha), 4.27 (d, J = 13.9 Hz, 2H, CH2), 3.12 (dt, J = 11.9, 6.8 Hz, 2H, CH2), 2.07 (s, J = 16.7, 6.9, 6.3 Hz, 2 equivalent H, CH2), 1.47 (s, J = 7.9, 7.2, 6.8 Hz, 2H, CH2), 1.45 (s, J = 7.5, 7.2 Hz, 2H, CH2), 1.37 (quin, J = 6.9 Hz, 2H, CH2), 1.25 (s, J = 7.7, 7.5, 6.0 Hz, 2 equivalent H, CH2), 1.24 (s, J = 7.5, 6.9, 6.0 Hz, 2 equivalent H, CH2), 1.20 (s, J = 7.7 Hz, 2H, CH2), 1.19 ppm (s, J = 7.7, 7.5 Hz, 2H, CH2). 13C NMR (101 MHz, CDCl3, ambient °C): δ (ppm) = 138.4 (s, 1C), 134.5 (s, 2 equivalent C), 132.5 (d, J2C-P = 10.38 Hz, 4 equivalent C), 130.96 (d, 3J2C-P = 5.30 Hz, 2 equivalent C), 130.4 (d, conjugated J3C-P = 12.60 Hz, 4 equivalent C), 128.9 (d, not conjugated J4C-P = 3.20 Hz, 2 equivalent C), 128.5 (s, 1C), 128.1 (d, not conjugated J2C-P = 8.90 Hz 1C), 117.4 (d, J1C-P = 83.73 Hz, 2 equivalent C), 114.4 (s, 1C), 33.6 (s, CH2), 30.3 (d, aliphatic J3C-P = 13.85 Hz CH2), 29.7 (d, aliphatic J4C-P = 5.00 Hz CH2), 29.6 (d, aliphatic J1C-P = 47.30 Hz CH2), 29.3 (d, aliphatic J5C-P = 4.97 Hz CH2), 29.03, 28.97, 28.31 (3s, CH2), 23.2 (d, aliphatic J1C-P = 45.20 Hz CH2), 21.9 (d, aliphatic J2C-P = 4.05 Hz, CH2). 31P NMR (162 MHz, ambient °C): δ (ppm) = 23.82 (s, 1P). Calcd. for C30H38BrP, Mol. Wt. (MW): 509.50. Found exact mass: 508.19; (GC/MS) (m/e): 508.19 (100.0%), 510.19 (97.3%), 509.19 (33.4%), 511.19 (33.0%), 510.20 (5.6%), 512.19 (5.2%). Anal. Calcd. C, C, 70.72; H, 7.52; Br, 15.68; P, 6.08. Found: C, 70.91%; H, 7.94%; Br, 15.99%; P, 5.95%.
3.3. ATR-FTIR Spectroscopy of Compounds 1-4
ATR-FTIR spectra of compounds 1-4 were recorded in triplicate directly on the solid samples in attenuated total reflection (ATR) mode. Acquisitions were made from 4000 to 600 cm-1, with 1 cm-1 spectral resolution, co-adding 32 interferograms, with a measurement accuracy in the frequency data at each measured point of 0.01 cm-1, due to the laser internal reference of the instrument. The frequency of each band was obtained automatically by using the “find peaks” command of the instrument software.
3.4. UV-Vis Analyses
Compounds 1-4 were dissolved in MeOH, and solutions were properly diluted. The UV-Vis spectrum of all samples was acquired at room temperature, using an Agilent Cary 100 UV/Vis Spectrophotometer (Agilent Technologies Italia S.p.A., Milan, Italy). Analyses were performed in triplicate and the images reported in the Results and Discussion section are representative of the acquisitions obtained for each sample.
3.5. Multivariate Analysis of ATR-FTIR, UV-Vis and NMR Spectral Data
3.5.1. ATR-FTIR and UV-Vis Spectral Data
ATR-FTIR data (transmittance, %) of all acquired spectra were arranged in a matrix of 3401 (wavenumbers cm-1) × 4 (compounds) = 13,604 measurable variables. Then, spectral data of previously reported triphenyl phosphonium salt (BPPB) were added to this matrix [30], obtaining a second dataset of 3401 (wavenumbers cm-1) × 5 (compounds) = 17,005 measurable variables. For each sample, the variables consisted of the values of transmittance (%) associated with the wavenumbers (3401) in the range 4000–600 cm-1. UV-Vis data (absorbance, %) of all acquired spectra were arranged in a matrix of 91 (wavelength nm) × 4 (compounds) = 364 measurable variables. Then, UV-Vis data of previously reported triphenyl phosphonium salt (BPPB) were added to this matrix [30], obtaining a second dataset of 91 (wavelength nm) × 5 (compounds) = 455 measurable variables. For each sample, the variables consisted of the values of absorbance associated with the wavelength (91) in the range 340–250 nm. Finally, a matrix 3492 × 5 (17,460 measurable variables) containing both the ATR-FTIR data and the UV-Vis data of compounds 1-4 and BPPB was constructed. The systems were simplified by exploiting the multivariate analysis, named principal component analysis (PCA), processing each matrix of spectral data using CAT (Chemometric Agile Tool freely available online at https://www.gruppochemiometria.it/index.php/software/19-download-the-r-based-chemometric-software), accessed on 23 November 2025). Before PCA, ATR-FTIR spectral data were scaled and centred, while UV-Vis data were first standardized by standard normal variate (SNV) method and then also scaled and centred. The results were reported as score plots of PC1 vs. PC2 and discussed in Section 3.
3.5.2. NMR Spectral Data
The values of δ (ppm) of all peaks present in the 1H, 13C and 31P NMR spectra of the sample which showed the highest number of peaks represented the first row of a matrix of four total rows, one for each compound 1-4. Then in rows 2-4 the values of δ (ppm) of peaks present in the spectra of remaining compounds were inserted, taking the first row as reference. Where certain peaks were missing, zero was inserted. A matrix of 41 (δ, ppm) × 4 (compounds) = 164 measurable variables was obtained. Then, the values of δ (ppm) of all peaks present in the 1H, 13C and 31P NMR spectra of previously reported triphenyl phosphonium salts, namely BPPB[30] and TPPOH [29], were added to the first dataset, using the same method, obtaining a second larger matrix of 41 (δ, ppm) × 6 (compounds) = 246 measurable variables. For each sample, the variables consisted of the values of δ (ppm) of all peaks present in their NMR spectra. The systems were simplified by exploiting PCA, as detailed in the previous section. Before PCA, 13C NMR spectral data were scaled and centred. The results were reported as score plot of PC1 vs. PC2 and PC1 vs. PC3 and discussed in Section 3.
3.5.3. Biological Findings
The most significant biological data obtained for compounds 1, 3 and 4 in terms of HC50, IC50 and SI values in this study together with those previously reported for BPPB were arranged in a data matrix consisting of four rows (compounds) and 73 columns (variables), for a total of 292 variables, and processed by PCA, as made previously. The total variance (100%) was explained by three components (PC1 explained 75.20%, PC2 18.17% and PC3 11.63% of total variance). Before PCA, data were scaled and centred. The results were reported as score plot of PC1 vs. PC2 and discussed in Section 3.
3.6. Optical Microscopy Analyses
Methanol (MeOH) and water solutions/suspensions of compounds 1-4 were investigated via optical microscopy (OM) analysis, to assess their possible capability to give vesicles in solvents. In the performed experiments, 30.1 mg of solid 1 and 53.2, 37.1 and 47.0 mg of oily compounds 2, 3 and 4, respectively were dissolved in 0.5 mL MeOH and under vigorous shake, until complete dissolution. The obtained solutions of 1, 2, 4, and 4 had concentrations of 60.2, 106.4, 74.2 and 94 mg/mL, respectively. Then, 7.5 mg of solid 1 and 12.7, 12.3 and 18.8 mg of oily compounds 2, 3 and 4, respectively were dissolved in 0.65 mL or 1.0 ml water and under sonication, until a partial suspension. As prepared samples were then observed using a Leica DM750 optical microscope (Leica Italy, Milan, Italy) equipped with 40× and 100× objectives. The camera used for image capture was a Leica ICC50W (Leica Italy, Milan, Italy). All images were processed using LAS EZ 3.4.0. software (Leica Italy, Milan, Italy).
3.7. Cytotoxicity Experiments Using Compounds 1, 3 and 4 on PLX-resistant MCM (MeOV and MeTRAV) Cells, as Well as on ETO-sensitive (HTLA 230) and MDR (HTLA ER) NB Cells
3.7.1. Cell Lines and Culture Conditions
PLX4032-resistant (PLX-R) MeOV and MeTRAV cells were selected and characterized as previously reported [18]. [21]. HTLA-230 human stage-IV NB cells were kindly provided by G. Gaslini Institute (Genoa, Italy). HTLA-ER cells were generated as previously reported [23]. All cell lines were maintained in RPMI 1640 medium (Euroclone Spa, Pavia, Italy) supplemented with 10% Fetal Bovine Serum (FBS, Euroclone Spa, Pavia, Italy), 1% L-Glutamine (Euroclone Spa, Pavia, Italy), and 1% Penicillin/Streptomicin (Euroclone Spa, Pavia, Italy) and grown in standard conditions (37 °C humidified incubator with 5% CO2).
3.7.2. Treatments
PLX-R MeOV and MeTRAV cell lines, as well as HTLA 230 and HTLA ER ones, were treated for 24, 48 and 72 h with increasing concentration (1–100.0 µM) of compounds 1, 3 and 4. The stock solutions of these compounds were prepared in 40,000-fold diluted DMSO, and preliminary experiments demonstrated that the final DMSO concentrations did not change any of the cell responses analysed. Cell cultures were carefully monitored before and during the experiments to ensure optimal cell density. Notably, samples were discarded if the cell confluence reached >90%.
3.7.3. Cell Viability Assay
Cell viability was determined by using the CellTiter 96® AQueous One Solution Cell Proliferation Assay (Promega, Madison, WI, USA), as previously described [72,73]. Briefly, cells (10,000 cells/well) were seeded into 96-well plates (Corning Incorporated, Corning, NY, USA) and then treated. Next, cells were incubated with CellTiter, and the absorbance at 490 nm was recorded using a microplate reader (EL-808, BIO-TEK Instruments Inc., Winooski, VT, USA). The cell survival rate, expressed as cell viability percentage (%), was evaluated based on the experimental outputs of treated groups vs. the untreated groups (CTR) and was calculated as follows: cell viability (%) = (OD treated cells − OD blank)/(OD untreated cells − OD blank) × 100%. Related bar graphs were of cell viability vs. increasing concentrations of 1, 3 and 4 were provided by GraphPad Prism 8.0.1 Software (GraphPad Software, Boston, MA, USA). The same software was used to calculate IC50 values. Particularly, the bar graphs were converted into the correspondent dispersion graphs. Then, upon conversion of µM concentrations (x) in Log10 (x), and using a non-linear model which considered the Log 10 (1, 3 and 4 concentrations) vs. the normalized response (variable or not variable slope), the IC50 values of all compounds for both cell populations at 24, 48 and 72 hours of treatment were derived.
3.8. In vitro Haemolytic Toxicity of Samples 1, 3 and 4, Using Red Blood Cells (RBCs)
Haemolytic ratio was evaluated, as recently reported with slight changes[64], in EDTA-blood samples from six healthy donors from the San Martino Hospital Transfusion Centre. In detail, red blood cells (RBCs) were isolated by diluting 0.2 mL of blood with 0.4 mL of phosphate-buffered saline (PBS) and centrifuged for 5 min at 10,000 g. The pellet, consisting of RBC, was washed 5 times with 1.0 mL PBS and finally resuspended with 2.0 mL PBS. The assay was carried out on 0.1 mL of resuspended RBCs added to 0.1 mL of H2O (positive control), 0.1 mL of PBS (negative control) or 0.1 mL of the different concentrations (0.1-50 µM) of the compounds to be tested. The samples were incubated for 60 min at 37°C and at the end they were centrifuged for 5 min at 10,000 rpm. Finally, 0.1 mL of supernatant was transferred to a transparent 96-well plate and measured by a spectrophotometer (Dynex Technologies; Chantilly, VA, U.S.A.) at 595 nm. The haemolytic ratio was calculated using the formula:
Haemolytic ratio (%) = (OD TEST - OD NEGATIVE CONTROL)/ (OD POSITIVE CONTROL - OD NEGATIVE CONTROL) × 100
Related bar and dispersion graphs of haemolytic ratio percentage (%) and of cell viability vs. increasing concentrations of 1, 3 and 4 were provided by GraphPad Prism 8.0.1 Software (GraphPad Software, Boston, MA, USA). The same software was used to calculate HC50 values of 1, 3 and 4 as previously described.
3.9. Evaluation of Cytotoxicity of Samples 1, 3 and 4 on Human Keratinocytes (HaCaT) and Murine Fibroblasts (3T3)
3.9.1. Cell Culture
Human skin keratinocytes cells (HaCaT) were obtained from the IRCCS Ospedale Policlinico San Martino, Proteomics and Mass Spectrometry Unit (Genoa, Italy), while 3T3 cells were purchases by Sigma Aldrich (Milan, Italy). Both cell lines were maintained in DMEM medium (Euroclone Spa, Pavia, Italy) supplemented with 10% Fetal Bovine Serum (FBS, Euroclone Spa, Pavia, Italy), 1% L-Glutamine (Euroclone Spa, Pavia, Italy), and 1% Penicillin/Streptomicin (Euroclone Spa, Pavia, Italy) and grown in standard conditions (37 °C humidified incubator with 5% CO2).
3.9.2. Treatments
HaCaT and 3T3 cells, cells were treated for 24, 48 and 72 h with increasing concentration (1–100.0 µM) of 1, 3 and 4. Cell cultures were carefully monitored before and during the experiments to ensure optimal cell density. Notably, samples were discarded if the cell confluence reached > 90%.
3.9.3. Viability Assay
Viability assay on HaCaT and 3T3 cells was performed as described in Section 3.8.3.
Related bar and dispersion graphs of cells (HaCaT and 3T3) viability (%) vs. increasing concentrations of 1, 3 and 4 were provided by GraphPad Prism 8.0.1 Software (GraphPad Software, Boston, MA, USA). The same software was used to calculate all IC50 values of 1, 3 and 4 as previously described.
3.10. Comparison Between the Biological Effects of 1, 3 and 4 and Those of BPPB by PCA
A matrix 73 × 4 (292 measurable variables) containing all biological data acquired for compounds 1, 3, 4 and BPPB was constructed. The systems were simplified by exploiting the multivariate analysis, named principal component analysis (PCA), processing it using CAT (Chemometric Agile Tool freely available online at https://www.gruppochemiometria.it/index.php/software/19-download-the-r-based-chemometric-software), accessed on 23 November 2025). Before PCA, data were scaled and centred. The results were reported as score plots of PC1 vs. PC2 and discussed in Section 2.
3.11. Statistical Analyses
Results have been expressed as means ± S.D. of four independent experiments in which different wells were analysed every time for each experimental condition. In the analysis of cell viability, the condition of untreated cells was set as 100% ± S.D. Statistical significance of differences was determined by one-way analysis of variances (ANOVA) followed by Dunnet’s multiple comparison test correction using GraphPad Prism 8.0.1 (GraphPad Software, San Diego, CA, USA). Asterisks indicate the following p-value ranges: * p < 0.05, ** p < 0.01, *** p < 0.001, **** p < 0.0001. p > 0.05 was not considered statistically significant and no symbol was used in the images.
4. Conclusions
Systematic studies on genetic alterations in human malignancies have supported the development of genotype-driven targeted drugs for several types of cancers, including metastatic cutaneous melanoma (MCM). Nonetheless, the occurrence of acquired resistance remains a major limitation in the treatment of MCM and other aggressive tumours, including late-stage high-risk neuroblastoma (HR-NB). In this context, it is urgently needed to find new alternative therapeutic strategies able to overcome chemoresistance, as triphenyl phosphonium (TPP)-derivatives, which are reported to act as membrane disruptors, but also as mitochondria targeting molecules. In this study, three novel TPP cationic vesicles were designed, synthesized and biologically characterized. All compounds showed significant cytotoxicity against PLX-resistant MCM cells and MDR HR-NB cells, with effective responses already after short time exposure, depending on cancer cells type and independently of oncogenic mutations. Compared with previously reported TPP-based systems, including BPPB, these new QPSs showed reduced haemolytic activity and lower/no toxicity toward non tumorigenic cells, while maintaining a marked anticancer effect. Selectivity index and PCA confirmed that the biological profiles of these new QPSs are distinct from that of BPPB and characterized by a more favourable safety-efficacy balance, particularly for compound 1 and 4. Collectively, compound 1 could be a promising platform to develop new intermediate-time treatment for PLX-R MeOV cells, while 4, to develop 24- and 48-hours treatments for PLX-R MeTRAV cells. Also, all compounds could be developed as new treatment options for both ETO-sensitive and MDR late-stage HR-NB cells. However, all compounds are interesting to be developed as adjuvants in already existing anticancer cocktails to treat PLX-resistant MCM and/or MDR HR-NB. Notably, most QPSs outperformed PLX in the 72-hours treatment of PLX-resistant MCM cells, depending on type of MCM cells, while all QPSs were more effective than ETO by 1.2, 2.0, 1.3 times (HTLA 230) and 3.2, 4.7 and 3.2 times (HTLA ER) in 24-hours treatments. Although further experiments are needed, these promising early findings pave the way for more in deep investigations on 3D cell models and then on animal models to support a future clinical development of QPSs as topical drug to treat skin melanoma lesions and for targeting MDR HR-NB. This study could be of particular interest for a wide audience, including analytic chemists, since differently from other studies on cancer, PCA was used to confirm both chemical and biological findings, with interesting results. Several graphic comparative representations are available making visualization of results and their understanding easier. The final overall merit of this study is having evidenced that new QPSs are distinct from previously reported ones, being characterized by a more favourable safety-efficacy balance, by using also unusual and eye-catching tools.
Supplementary Materials
The following supporting information can be downloaded at the website of this paper posted on Preprints.org. Figure S1.1. 1H NMR spectrum (400 MHz, CHCl3) of compound 1. Figure S1.2. 13C NMR spectrum (100 MHz, CHCl3) of compound 1. Figure S1.3. 13C NMR spectrum and DEPT135 experiment of compound 1. Figure S1.4. 31P NMR spectrum (161 MHz, CHCl3) of compound 1. Figure S1.5. 1H NMR spectrum (400 MHz, CHCl3) of compound 2. Figure S1.6. 13C NMR spectrum (100 MHz, CHCl3) of compound 2. Figure S1.7. 13C NMR spectrum and DPT135 experiment (100 MHz, CHCl3) of compound 2. Figure S1.8. 31P NMR spectrum (161 MHz, CHCl3) of compound 2. Figure S1.9. 1H NMR spectrum (400 MHz, CHCl3) of compound 3. Figure S1.10. 13C NMR spectrum (100 MHz, CHCl3) of compound 3. Figure S1.11. 13C NMR spectrum (600 MHz, CHCl3) and DEPT135 experiment of compound 3. Figure S1.12. 31P NMR spectrum (161 MHz, CHCl3) of compound 3. Figure S1.13. 1H NMR spectrum (400 MHz, CHCl3) of compound 4. Figure S1.14. 13C NMR spectrum (100 MHz, CHCl3) of compound 4. Figure S1.15. 13C NMR spectrum (100 MHz, CHCl3) and DEPT135 experiment of compound 4. Figure S1.16. 31P NMR spectrum (161 MHz, CHCl3) of compound 4. Figure S2.1. ATR-FTIR spectrum of 1. Figure S2.2. ATR-FTIR spectrum of 2. Figure S2.3. ATR-FTIR spectrum of 3. Figure S2.4. ATR-FTIR spectrum of 4. Figure S3.1. UV-Vis spectra of compounds 1-4 achieved reporting in graph the standardized csv data provided by the spectrometer using Microsoft 365 Excel software (a) and the not standardized one with peak labels added (b). Figure S.4.1. Score plot of PC1 vs. PC2 obtained processing matrix A (a), matrix B (b), matrix C (c) and matrix D (d) by PCA.
Author Contributions
Conceptualization, S.A., B.M., and C.D. Methodology, software, validation, formal analysis, investigation, resources, data curation, writing—original draft preparation, visualization, supervision, and project administration, S.A., and B.M. Specific contributions: M.G.S. carried out haemolysis experiments; S.T and E.K. help in biological investigations on all cells under the supervision of B.M. and C.D. P.G. carried out optical microscopy analyses. C.R. helped in the final analysis of biological results. Writing—review and editing, S.A., B.M., and C.D. All authors have read and agreed to the published version of the manuscript.
Funding
This research received no external funding.
Institutional Review Board Statement
Not necessary.
Informed Consent Statement
Not necessary.
Data Availability Statement
All data supporting reported results are included in this manuscript and related Supporting Information file.
Conflicts of Interest
The authors declare no conflicts of interest.
References
- Long, G. V; Swetter, S.M.; Menzies, A.M.; Gershenwald, J.E.; Scolyer, R.A. Cutaneous Melanoma. The Lancet 2023, 402, 485–502. [CrossRef]
- Drugs in Clinical Development for Melanoma. Pharmaceut. Med. 2012, 26, 171–183. [CrossRef]
- J Ferlay; M Ervik; FC Lam, et al Global Cancer Observatory: Cancer Today International Agency for Research on Cancer. Available online: https://gco.iarc.fr/today/en (accessed on 21 January 2025).
- Gandini, S.; Sera, F.; Cattaruzza, M.S.; Pasquini, P.; Abeni, D.; Boyle, P.; Melchi, C.F. Meta-Analysis of Risk Factors for Cutaneous Melanoma: I. Common and Atypical Naevi. Eur. J. Cancer 2005, 41, 28–44. [CrossRef]
- Bliss, J.M.; Ford, D.; Swerdlow, A.J.; Armstrong, B.K.; Cristofolini, M.; Elwood, J.M.; Green, A.; Holly, E.A.; Mack, T.; Mackie, R.M.; et al. Risk of Cutaneous Melanoma Associated with Pigmentation Characteristics and Freckling: Systematic Overview of 10 Case-control Studies. Int. J. Cancer 1995, 62, 367–376. [CrossRef]
- Davies, H.; Bignell, G.R.; Cox, C.; Stephens, P.; Edkins, S.; Clegg, S.; Teague, J.; Woffendin, H.; Garnett, M.J.; Bottomley, W.; et al. Mutations of the BRAF Gene in Human Cancer. Nature 2002, 417, 949–954. [CrossRef]
- Holderfield, M.; Deuker, M.M.; McCormick, F.; McMahon, M. Targeting RAF Kinases for Cancer Therapy: BRAF-Mutated Melanoma and Beyond. Nat. Rev. Cancer 2014, 14, 455–467. [CrossRef]
- Haq, R.; Fisher, D.E.; Widlund, H.R. Molecular Pathways: BRAF Induces Bioenergetic Adaptation by Attenuating Oxidative Phosphorylation. Clinical Cancer Research 2014, 20, 2257–2263. [CrossRef]
- Patel, B.; Patel, M.; Gami, B.; Patel, A. Cultivation of Bioenergy Crops in Gujarat State: A Consultative Survey Process to Understand the Current Practices of Landowners. Environ. Dev. Sustain. 2021, 23, 8991–9013. [CrossRef]
- Boutros, A.; Croce, E.; Ferrari, M.; Gili, R.; Massaro, G.; Marconcini, R.; Arecco, L.; Tanda, E.T.; Spagnolo, F. The Treatment of Advanced Melanoma: Current Approaches and New Challenges. Crit. Rev. Oncol. Hematol. 2024, 196, 104276. [CrossRef]
- Berk-Krauss, J.; Stein, J.A.; Weber, J.; Polsky, D.; Geller, A.C. New Systematic Therapies and Trends in Cutaneous Melanoma Deaths Among US Whites, 1986–2016. Am. J. Public Health 2020, 110, 731–733. [CrossRef]
- Marengo, B.; Monti, P.; Miele, M.; Menichini, P.; Ottaggio, L.; Foggetti, G.; Pulliero, A.; Izzotti, A.; Speciale, A.; Garbarino, O.; et al. Etoposide-Resistance in a Neuroblastoma Model Cell Line Is Associated with 13q14.3 Mono-Allelic Deletion and MiRNA-15a/16-1 down-Regulation. Sci. Rep. 2018, 8. [CrossRef]
- Schwab, M.; Westermann, F.; Hero, B.; Berthold, F. Neuroblastoma: Biology and Molecular and Chromosomal Pathology. Lancet Oncol. 2003, 4, 472–480. [CrossRef]
- Cheung, N.-K. V.; Dyer, M.A. Neuroblastoma: Developmental Biology, Cancer Genomics and Immunotherapy. Nat. Rev. Cancer 2013, 13, 397–411. [CrossRef]
- Morandi, F.; Airoldi, I.; Marimpietri, D.; Bracci, C.; Faini, A.C.; Gramignoli, R. CD38, a Receptor with Multifunctional Activities: From Modulatory Functions on Regulatory Cell Subsets and Extracellular Vesicles, to a Target for Therapeutic Strategies. Cells 2019, 8, 1527. [CrossRef]
- Colla, R.; Izzotti, A.; De Ciucis, C.; Fenoglio, D.; Ravera, S.; Speciale, A.; Ricciarelli, R.; Furfaro, A.L.; Pulliero, A.; Passalacqua, M.; et al. Glutathione-Mediated Antioxidant Response and Aerobic Metabolism: Two Crucial Factors Involved in Determining the Multi-Drug Resistance of High-Risk Neuroblastoma. Oncotarget 2016, 7, 70715–70737. [CrossRef]
- Seeger, R.C.; Brodeur, G.M.; Sather, H.; Dalton, A.; Siegel, S.E.; Wong, K.Y.; Hammond, D. Association of Multiple Copies of the N- Myc Oncogene with Rapid Progression of Neuroblastomas. New England Journal of Medicine 1985, 313, 1111–1116. [CrossRef]
- Garbarino, O.; Valenti, G.E.; Monteleone, L.; Pietra, G.; Mingari, M.C.; Benzi, A.; Bruzzone, S.; Ravera, S.; Leardi, R.; Farinini, E.; et al. PLX4032 Resistance of Patient-Derived Melanoma Cells: Crucial Role of Oxidative Metabolism. Front. Oncol. 2023, 13. [CrossRef]
- Alfei, S.; Torazza, C.; Bacchetti, F.; Signorello, M.G.; Passalacqua, M.; Domenicotti, C.; Marengo, B. Tri-Phenyl-Phosphonium-Based Nano Vesicles: A New In Vitro Nanomolar-Active Weapon to Eradicate PLX-Resistant Melanoma Cells. Int. J. Mol. Sci. 2025, 26, 3227. [CrossRef]
- Alfei, S.; Torazza, C.; Bacchetti, F.; Milanese, M.; Passalaqua, M.; Khaledizadeh, E.; Vernazza, S.; Domenicotti, C.; Marengo, B. TPP-Based Nanovesicles Kill MDR Neuroblastoma Cells and Induce Moderate ROS Increase, While Exert Low Toxicity To-Wards Primary Cell Cultures: An in Vitro Study . IJMS 2025, 26, 4991. [CrossRef]
- Alfei, S.; Zuccari, G.; Athanassopoulos, C.M.; Domenicotti, C.; Marengo, B. Strongly ROS-Correlated, Time-Dependent, and Selective Antiproliferative Effects of Synthesized Nano Vesicles on BRAF Mutant Melanoma Cells and Their Hyaluronic Acid-Based Hydrogel Formulation. Int. J. Mol. Sci. 2024, 25, 10071. [CrossRef]
- Alfei, S.; Giannoni, P.; Signorello, M.G.; Torazza, C.; Zuccari, G.; Athanassopoulos, C.M.; Domenicotti, C.; Marengo, B. The Remarkable and Selective In Vitro Cytotoxicity of Synthesized Bola-Amphiphilic Nanovesicles on Etoposide-Sensitive and -Resistant Neuroblastoma Cells. Nanomaterials 2024, 14, 1505. [CrossRef]
- Alfei, S.; Giannoni, P.; Signorello, M.G.; Torazza, C.; Zuccari, G.; Athanassopoulos, C.M.; Domenicotti, C.; Marengo, B. The Remarkable and Selective In Vitro Cytotoxicity of Synthesized Bola-Amphiphilic Nanovesicles on Etoposide-Sensitive and -Resistant Neuroblastoma Cells. Nanomaterials 2024, 14, 1505. [CrossRef]
- Nuraje, N.; Bai, H.; Su, K. Bolaamphiphilic Molecules: Assembly and Applications. Prog. Polym. Sci. 2013, 38, 302–343. [CrossRef]
- Dhanya, D.; Giuseppe, P.; Rita, C.A.; Annaluisa, M.; Stefania, S.M.; Francesca, G.; Vitale, D. V.; Anna, R.; Claudio, A.; Pasquale, L.; et al. Phosphonium Salt Displays Cytotoxic Effects Against Human Cancer Cell Lines. Anticancer Agents Med. Chem. 2018, 17. [CrossRef]
- Lukáč, M.; Pisárčik, M.; Garajová, M.; Mrva, M.; Dušeková, A.; Vrták, A.; Horáková, R.; Horváth, B.; Devínsky, F. Synthesis, Surface Activity, and Biological Activities of Phosphonium and Metronidazole Salts. J. Surfactants Deterg. 2020, 23, 1025–1032. [CrossRef]
- Bachowska, B.; Kazmierczak-Baranska, J.; Cieslak, M.; Nawrot, B.; Szczęsna, D.; Skalik, J.; Bałczewski, P. High Cytotoxic Activity of Phosphonium Salts and Their Complementary Selectivity towards HeLa and K562 Cancer Cells: Identification of Tri- n -butyl- n -hexadecylphosphonium Bromide as a Highly Potent Anti-HeLa Phosphonium Salt. ChemistryOpen 2012, 1, 33–38. [CrossRef]
- Terekhova, N. V.; Tatarinov, D.A.; Shaihutdinova, Z.M.; Pashirova, T.N.; Lyubina, A.P.; Voloshina, A.D.; Sapunova, A.S.; Zakharova, L.Ya.; Mironov, V.F. Design and Synthesis of Amphiphilic 2-Hydroxybenzylphosphonium Salts with Antimicrobial and Antitumor Dual Action. Bioorg. Med. Chem. Lett. 2020, 30, 127234. [CrossRef]
- Bacchetti, F.; Schito, A.M.; Milanese, M.; Castellaro, S.; Alfei, S. Anti Gram-Positive Bacteria Activity of Synthetic Quaternary Ammonium Lipid and Its Precursor Phosphonium Salt. Int. J. Mol. Sci. 2024, 25, 2761. [CrossRef]
- Alfei, S.; Zuccari, G.; Bacchetti, F.; Torazza, C.; Milanese, M.; Siciliano, C.; Athanassopoulos, C.M.; Piatti, G.; Schito, A.M. Synthesized Bis-Triphenyl Phosphonium-Based Nano Vesicles Have Potent and Selective Antibacterial Effects on Several Clinically Relevant Superbugs. Nanomaterials 2024, 14, 1351. [CrossRef]
- Jędrzejczyk, M.; Sulik, M.; Mielczarek-Puta, M.; Lim, G.Y.; Podsiad, M.; Hoser, J.; Bednarczyk, P.; Struga, M.; Huczyński, A. Anticancer Activity of Salinomycin Quaternary Phosphonium Salts. Eur. J. Med. Chem. 2025, 282, 117055. [CrossRef]
- Jeena, M.T.; Kim, S.; Jin, S.; Ryu, J.-H. Recent Progress in Mitochondria-Targeted Drug and Drug-Free Agents for Cancer Therapy. Cancers (Basel). 2019, 12, 4. [CrossRef]
- Liu, Y.; Sun, Y.; Guo, Y.; Shi, X.; Chen, X.; Feng, W.; Wu, L.-L.; Zhang, J.; Yu, S.; Wang, Y.; et al. An Overview: The Diversified Role of Mitochondria in Cancer Metabolism. Int. J. Biol. Sci. 2023, 19, 897–915. [CrossRef]
- Borges, D.G.F.; Carvalho, D.S.; Bomfim, G.C.; Ramos, P.I.P.; Brzozowski, J.; Góes-Neto, A.; F. S. Andrade, R.; El-Hani, C. On the Origin of Mitochondria: A Multilayer Network Approach. PeerJ 2023, 11, e14571. [CrossRef]
- Ermolaev, V. V.; Arkhipova, D.M.; Miluykov, V.A.; Lyubina, A.P.; Amerhanova, S.K.; Kulik, N. V.; Voloshina, A.D.; Ananikov, V.P. Sterically Hindered Quaternary Phosphonium Salts (QPSs): Antimicrobial Activity and Hemolytic and Cytotoxic Properties. Int. J. Mol. Sci. 2021, 23, 86. [CrossRef]
- Nunes, B.; Cagide, F.; Borges, F.; Simões, M. Antimicrobial Activity and Cytotoxicity of Novel Quaternary Ammonium and Phosphonium Salts. J. Mol. Liq. 2024, 401, 124616. [CrossRef]
- Kodjo Amengor, C.D.; Amaning Danquah, C.; Adusei, E.B.A.; Kekessie, F.K.; Ofosu-Koranteng, F.; Peprah, P.; Harley, B.K.; Orman, E.; Adu, J.; Saaka, Y. Synthesized Phosphonium Compounds Demonstrate Resistant Modulatory and Antibiofilm Formation Activities against Some Pathogenic Bacteria. Heteroatom Chemistry 2022, 2022, 1–9. [CrossRef]
- Terekhova, N. V.; Tatarinov, D.A.; Shaihutdinova, Z.M.; Pashirova, T.N.; Lyubina, A.P.; Voloshina, A.D.; Sapunova, A.S.; Zakharova, L.Ya.; Mironov, V.F. Design and Synthesis of Amphiphilic 2-Hydroxybenzylphosphonium Salts with Antimicrobial and Antitumor Dual Action. Bioorg. Med. Chem. Lett. 2020, 30, 127234. [CrossRef]
- Galkina, I.; Bakhtiyarova, Y.; Andriyashin, V.; Galkin, V.; Cherkasov, R. Synthesis and Antimicrobial Activities of Phosphonium Salts on Basis of Triphenylphosphine and 3,5-Di-Tert-Butyl-4-Hydroxybenzyl Bromide. Phosphorus Sulfur Silicon Relat. Elem. 2013, 188, 15–18. [CrossRef]
- Milenković, M.R.; Živković-Radovanović, V.; Andjelković, L. Synthesis and Antimicrobial Activity of (3-Formyl-4-Hydroxybenzyl)Triphenylphosphonium Chloride Acylhydrazones. Russ. J. Gen. Chem. 2020, 90, 1716–1720. [CrossRef]
- Valenti, G.E.; Alfei, S.; Caviglia, D.; Domenicotti, C.; Marengo, B. Antimicrobial Peptides and Cationic Nanoparticles: A Broad-Spectrum Weapon to Fight Multi-Drug Resistance Not Only in Bacteria. Int. J. Mol. Sci. 2022, 23, 6108. [CrossRef]
- Cui, M.; Li, Z.; Tang, R.; Jia, H.; Liu, B. Novel (E)-5-Styryl-2,2′-Bithiophene Derivatives as Ligands for β-Amyloid Plaques. Eur. J. Med. Chem. 2011, 46, 2908–2916. [CrossRef]
- Cabiddu, S.; Maccioni, A.; Secci, M. Application of the Wittig Syntheses. III. Electronic Effects of Substituents and Stereochemistry of the Reaction. Annali di Chimica (Rome, Italy) 1964, 54, 1153–1164.
- Improvements in the Production of Quaternary Phosphonium Halides 1959.
- Hands, A.R.; Mercer, A.J.H. Reactions of Sodium Hydride with ω-Hydroxyalkyl-Phosphonium, -Arsonium and -Ammonium Salts. J. Chem. Soc. C 1968, 0, 1331–1337. [CrossRef]
- Petrucci, M.G.L.; Kakkar, A.K. Heterogenizing Homogeneous Catalysis Using Molecular Self-Assembly of Long Alkane Chain Phosphines Bound to Rh(I) Complexes. Chemistry of Materials 1999, 11, 269–276. [CrossRef]
- Ammer, J.; Nolte, C.; Karaghiosoff, K.; Thallmair, S.; Mayer, P.; Devivie-Riedle, R.; Mayr, H. Ion-Pairing of Phosphonium Salts in Solution: C-H…halogen and C-H…π Hydrogen Bonds. Chemistry - A European Journal 2013, 19. [CrossRef]
- Arunan, E.; Desiraju, G.R.; Klein, R.A.; Sadlej, J.; Scheiner, S.; Alkorta, I.; Clary, D.C.; Crabtree, R.H.; Dannenberg, J.J.; Hobza, P.; et al. Definition of the Hydrogen Bond (IUPAC Recommendations 2011). Pure and Applied Chemistry 2011, 83, 1637–1641. [CrossRef]
- Daasch, L.; Smith, D. Infrared Spectra of Phosphorus Compounds. Anal. Chem. 1951, 23, 853–868. [CrossRef]
- Bergel’son, L.D.; Solodovik, V.D.; Shemyakin, M.M. Stereoregulated Synthesis of Unsaturated Compounds Communication 9. Stereochemistry of the Reactions of Aldehydes with ?,?-Unsaturated Triphenylphosphonium Ylides [Alkylidenetriphenylphosphoranes]. Bulletin of the Academy of Sciences, USSR Division of Chemical Science 1966, 15, 468–473. [CrossRef]
- Ceccacci, F.; Sennato, S.; Rossi, E.; Proroga, R.; Sarti, S.; Diociaiuti, M.; Casciardi, S.; Mussi, V.; Ciogli, A.; Bordi, F.; et al. Aggregation Behaviour of Triphenylphosphonium Bolaamphiphiles. J. Colloid Interface Sci. 2018, 531, 451–462. [CrossRef]
- Alfei, S.; Brullo, C.; Caviglia, D.; Zuccari, G. Preparation and Physicochemical Characterization of Water-Soluble Pyrazole-Based Nanoparticles by Dendrimer Encapsulation of an Insoluble Bioactive Pyrazole Derivative. Nanomaterials 2021, 11, 2662. [CrossRef]
- Alfei, S.; Schito, A.M.; Zuccari, G. Considerable Improvement of Ursolic Acid Water Solubility by Its Encapsulation in Dendrimer Nanoparticles: Design, Synthesis and Physicochemical Characterization. Nanomaterials 2021, 11, 2196. [CrossRef]
- Graikioti, D.; Athanassopoulos, C.M.; Schito, A.M.; Alfei, S. Synthesis and Characterization of Triphenyl Phosphonium-Modified Triterpenoids with Never Reported Antibacterial Effects Against Clinically Relevant Gram-Positive Superbugs 2025.
- Alfei, S.; Oliveri, P.; Malegori, C. Assessment of the Efficiency of a Nanospherical Gallic Acid Dendrimer for Long-Term Preservation of Essential Oils: An Integrated Chemometric-Assisted FTIR Study. ChemistrySelect 2019, 4, 8891–8901. [CrossRef]
- Erdei, E.; Torres, S.M. A New Understanding in the Epidemiology of Melanoma. Expert Rev. Anticancer Ther. 2010, 10, 1811–1823. [CrossRef]
- Leary, M.; Heerboth, S.; Lapinska, K.; Sarkar, S. Sensitization of Drug Resistant Cancer Cells: A Matter of Combination Therapy. Cancers (Basel). 2018, 10, 483. [CrossRef]
- Bollag, G.; Hirth, P.; Tsai, J.; Zhang, J.; Ibrahim, P.N.; Cho, H.; Spevak, W.; Zhang, C.; Zhang, Y.; Habets, G.; et al. Clinical Efficacy of a RAF Inhibitor Needs Broad Target Blockade in BRAF-Mutant Melanoma. Nature 2010, 467, 596–599. [CrossRef]
- Hallmeyer, S.; Gonzalez, R.; Lawson, D.H.; Cranmer, L.D.; Linette, G.P.; Puzanov, I.; Taback, B.; Cowey, C.L.; Ribas, A.; Daniels, G.A.; et al. Vemurafenib Treatment for Patients with Locally Advanced, Unresectable Stage IIIC or Metastatic Melanoma and Activating Exon 15 BRAF Mutations Other than V600E. Melanoma Res. 2017, 27, 585–590. [CrossRef]
- Joseph, R.; Swaika, A.; Crozier, J.A. Vemurafenib: An Evidence-Based Review of Its Clinical Utility in the Treatment of Metastatic Melanoma. Drug Des. Devel. Ther. 2014, 775. [CrossRef]
- Tanda, E.T.; Vanni, I.; Boutros, A.; Andreotti, V.; Bruno, W.; Ghiorzo, P.; Spagnolo, F. Current State of Target Treatment in BRAF Mutated Melanoma. Front. Mol. Biosci. 2020, 7. [CrossRef]
- Li, K.; Xiao, G.; Richardson, J.J.; Tardy, B.L.; Ejima, H.; Huang, W.; Guo, J.; Liao, X.; Shi, B. Targeted Therapy against Metastatic Melanoma Based on Self-Assembled Metal-Phenolic Nanocomplexes Comprised of Green Tea Catechin. Advanced Science 2019, 6. [CrossRef]
- Chapman, P.B.; Robert, C.; Larkin, J.; Haanen, J.B.; Ribas, A.; Hogg, D.; Hamid, O.; Ascierto, P.A.; Testori, A.; Lorigan, P.C.; et al. Vemurafenib in Patients with BRAFV600 Mutation-Positive Metastatic Melanoma: Final Overall Survival Results of the Randomized BRIM-3 Study. Annals of Oncology 2017, 28, 2581–2587. [CrossRef]
- Chandrasekhar, B.; Gor, R.; Ramalingam, S.; Thiagarajan, A.; Sohn, H.; Madhavan, T. Repurposing FDA-Approved Compounds to Target JAK2 for Colon Cancer Treatment. Discover Oncology 2024, 15, 226. [CrossRef]
- Di Raimondo, C.; Lozzi, F.; Di Domenico, P.P.; Campione, E.; Bianchi, L. The Diagnosis and Management of Cutaneous Metastases from Melanoma. Int. J. Mol. Sci. 2023, 24, 14535. [CrossRef]
- Boukamp, P.; Petrussevska, R.T.; Breitkreutz, D.; Hornung, J.; Markham, A.; Fusenig, N.E. Normal Keratinization in a Spontaneously Immortalized Aneuploid Human Keratinocyte Cell Line. J. Cell Biol. 1988, 106, 761–771. [CrossRef]
- Ölschläger, V.; Schrader, A.; Hockertz, S. Comparison of Primary Human Fibroblasts and Keratinocytes with Immortalized Cell Lines Regarding Their Sensitivity to Sodium Dodecyl Sulfate in a Neutral Red Uptake Cytotoxicity Assay. Arzneimittelforschung 2011, 59, 146–152. [CrossRef]
- Schoop, V.M.; Fusenig, N.E.; Mirancea, N. Epidermal Organization and Differentiation of HaCaT Keratinocytes in Organotypic Coculture with Human Dermal Fibroblasts. Journal of Investigative Dermatology 1999, 112, 343–353. [CrossRef]
- Mukherjee, S.P.; Davoren, M.; Byrne, H.J. In Vitro Mammalian Cytotoxicological Study of PAMAM Dendrimers – Towards Quantitative Structure Activity Relationships. Toxicology in Vitro 2010, 24, 169–177. [CrossRef]
- Zhang, K.; Na, T.; Wang, L.; Gao, Q.; Yin, W.; Wang, J.; Yuan, B.-Z. Human Diploid MRC-5 Cells Exhibit Several Critical Properties of Human Umbilical Cord-Derived Mesenchymal Stem Cells. Vaccine 2014, 32, 6820–6827. [CrossRef]
- Alfei, S.; Caviglia, D.; Piatti, G.; Zuccari, G.; Schito, A.M. Synthesis, Characterization and Broad-Spectrum Bactericidal Effects of Ammonium Methyl and Ammonium Ethyl Styrene-Based Nanoparticles. Nanomaterials 2022, 12, 2743. [CrossRef]
- Alfei, S.; Marengo, B.; Domenicotti, C. Polyester-Based Dendrimer Nanoparticles Combined with Etoposide Have an Improved Cytotoxic and Pro-Oxidant Effect on Human Neuroblastoma Cells. Antioxidants 2020, 9, 50. [CrossRef]
- Alfei, S.; Marengo, B.; Zuccari, G.; Turrini, F.; Domenicotti, C. Dendrimer Nanodevices and Gallic Acid as Novel Strategies to Fight Chemoresistance in Neuroblastoma Cells. Nanomaterials 2020, 10, 1243. [CrossRef]
Figure 1.
Molecular mechanisms underlying the chemoresistance of HTLA-ER cells. This figure illustrates the observed molecular mechanisms underlying chemoresistance of HTLA-ER cells and the events leading to apoptosis in ETO sensitive HTLA parental cells. Left panel: Short-term treatment with ETO of HTLA-230 cells reduces oxidative phosphorylation and decreases glutathione (GSH) levels inducing reactive oxygen species (ROS) overproduction, thus leading to DNA damage (H2AX). Consequently, ETO induced genotoxic stress increases pro-apoptotic Bax, reduces anti-apoptotic Bcl2 and stimulates P53-Ser15 phosphorylation, two events leading to apoptosis and chemosensitivity. Right panel: HTLA-ER cells can efficiently counteract ETO-induced ROS production by maintaining an efficient aerobic metabolism and increasing GSH levels. Long-term treatment with ETO causes a deletion of the 13q14.3 locus and the consequent downregulation of miRNAs 15a/16-1, stimulating several pro-survival signals which contribute to inducing chemoresistance. This image was reproduced from an open access article licensed under a Creative Commons Attribution 4.0 International License (http://creativecommons.org/licenses/by/4.0/), which permits use, sharing, adaptation, distribution and reproduction in any medium or format, of any content. Overall, despite initial chemosensitivity, both high-risk NB and MCM invariably evolves toward a chemo resistant phenotype that compromises the efficacy of current therapies. Therefore, there is an urgent clinical need for novel therapeutic strategies capable of overcoming resistance mechanisms, potentially through extra-genomic approaches that limit the adaptive evolution of cancer cells.
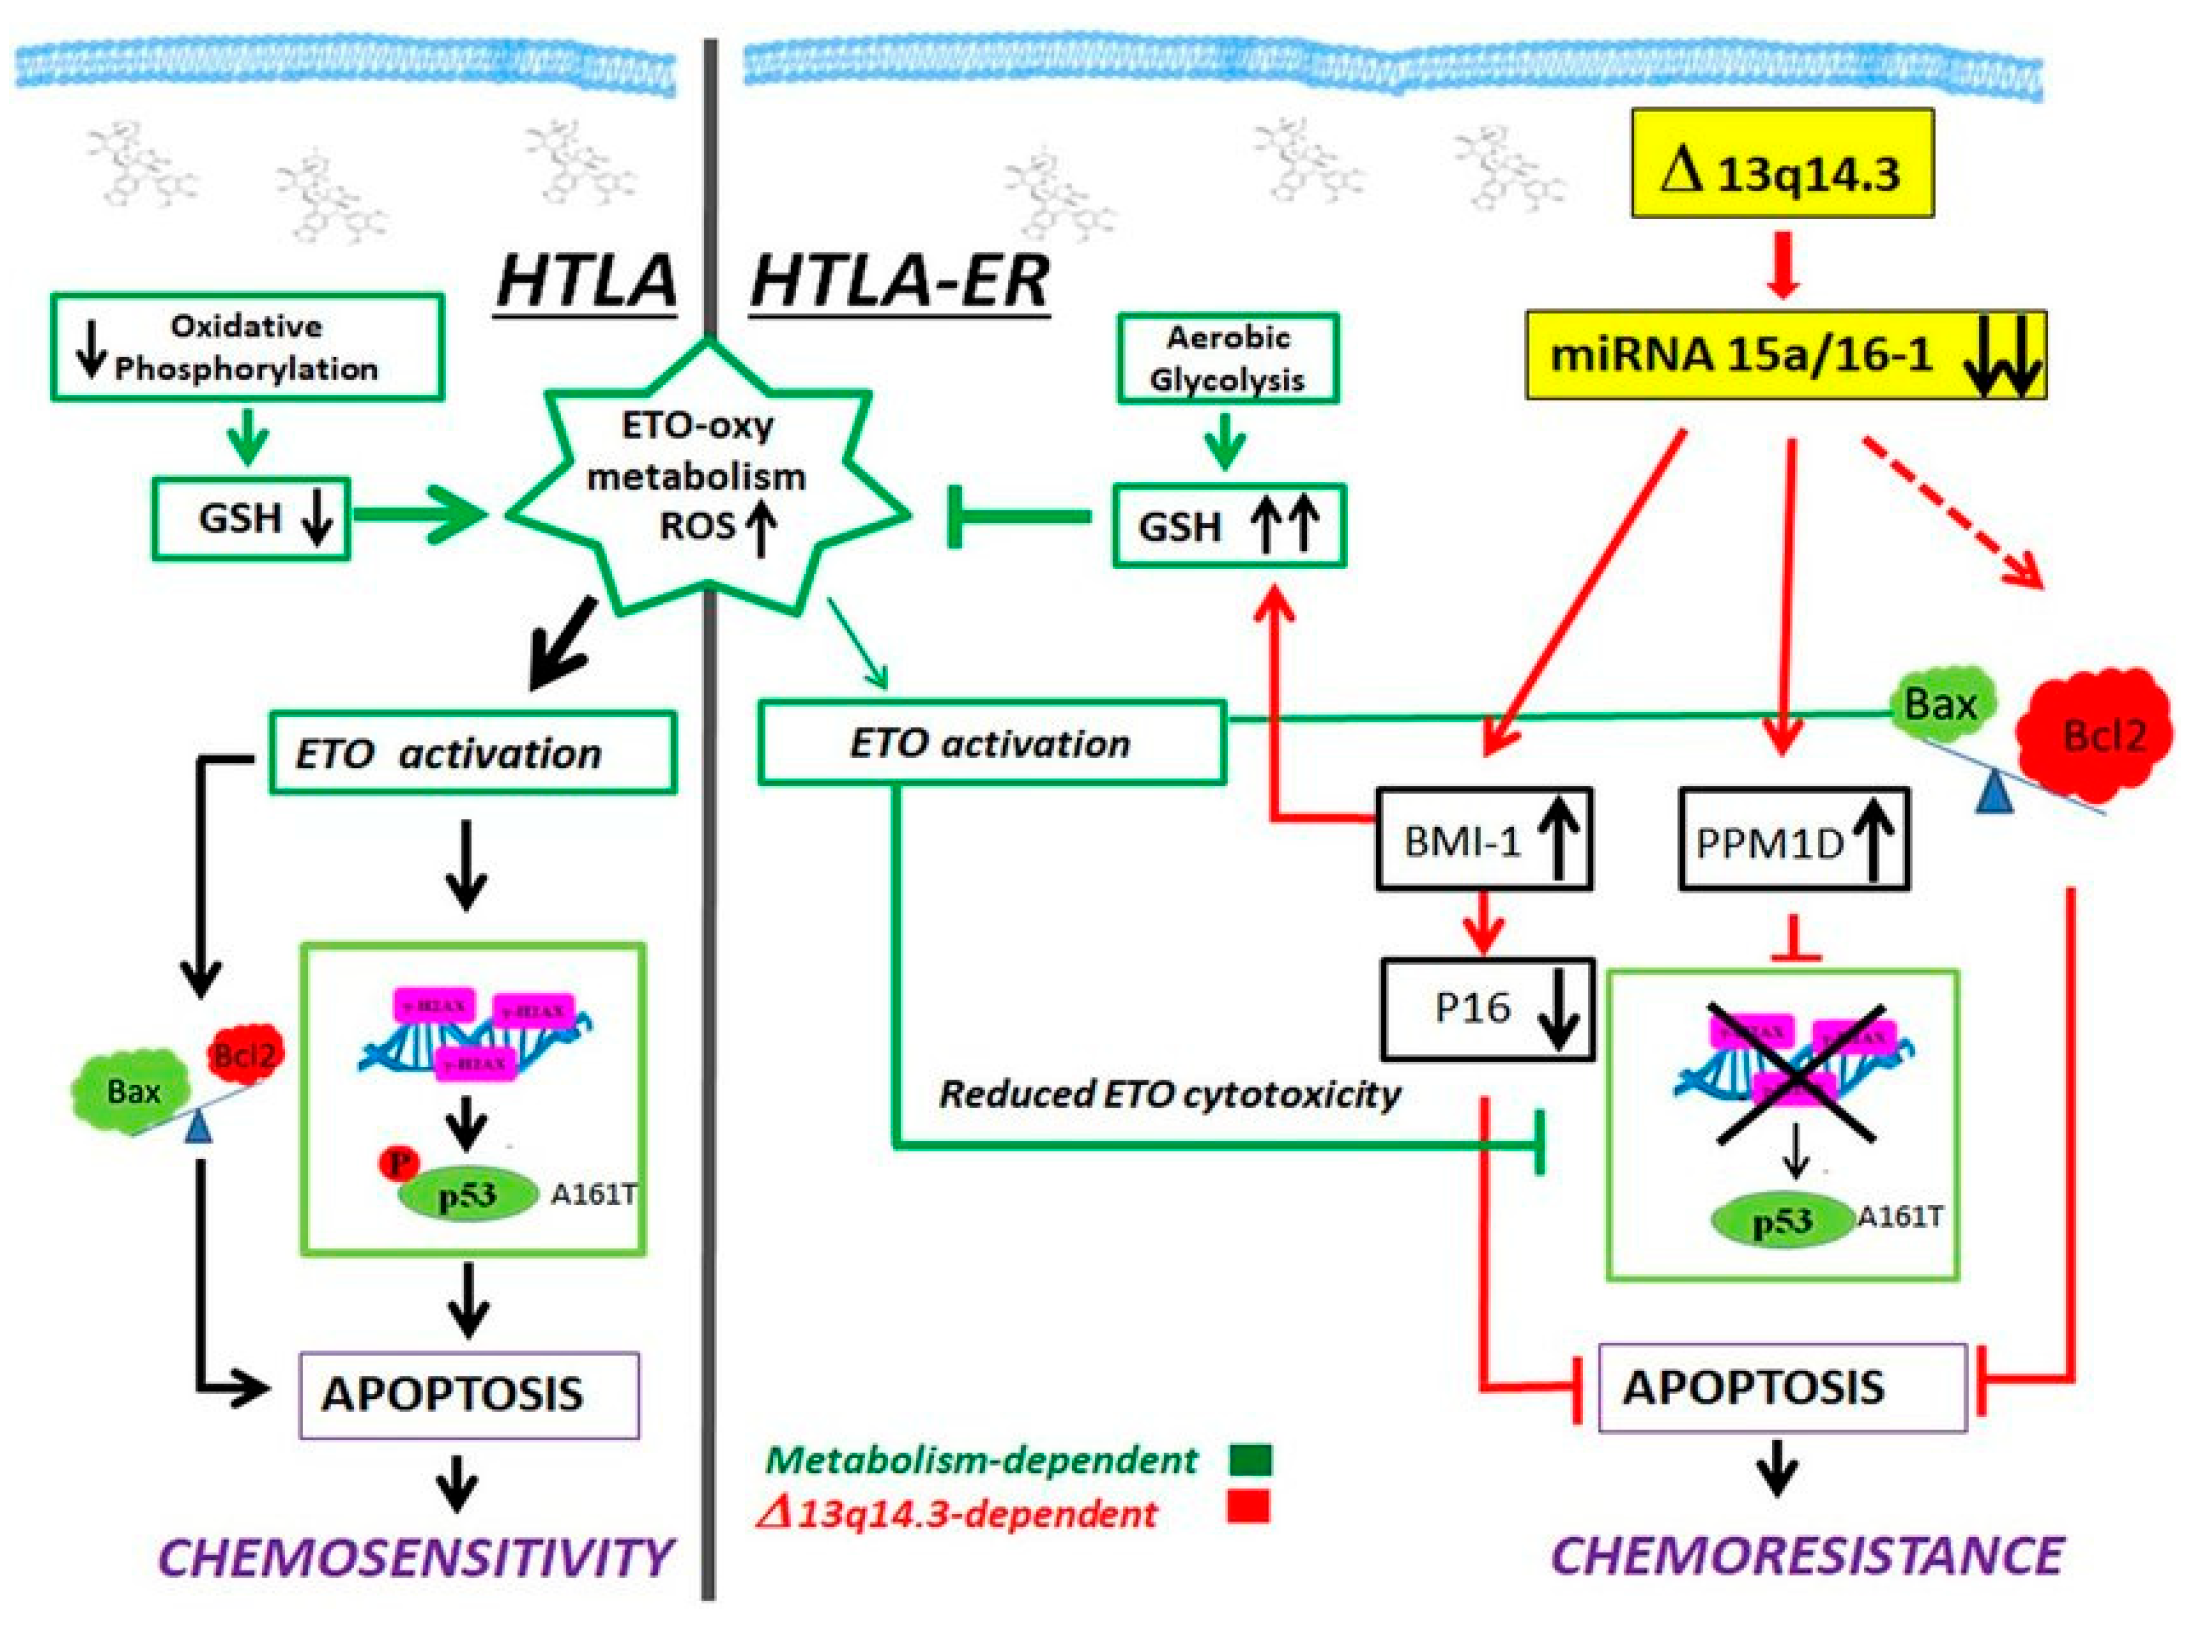
Chart 1.
Chemical structure of compounds 1-4. Not quaternized compound 2 was prepared as precursor for achieving compounds 3 and 4.
Chart 1.
Chemical structure of compounds 1-4. Not quaternized compound 2 was prepared as precursor for achieving compounds 3 and 4.
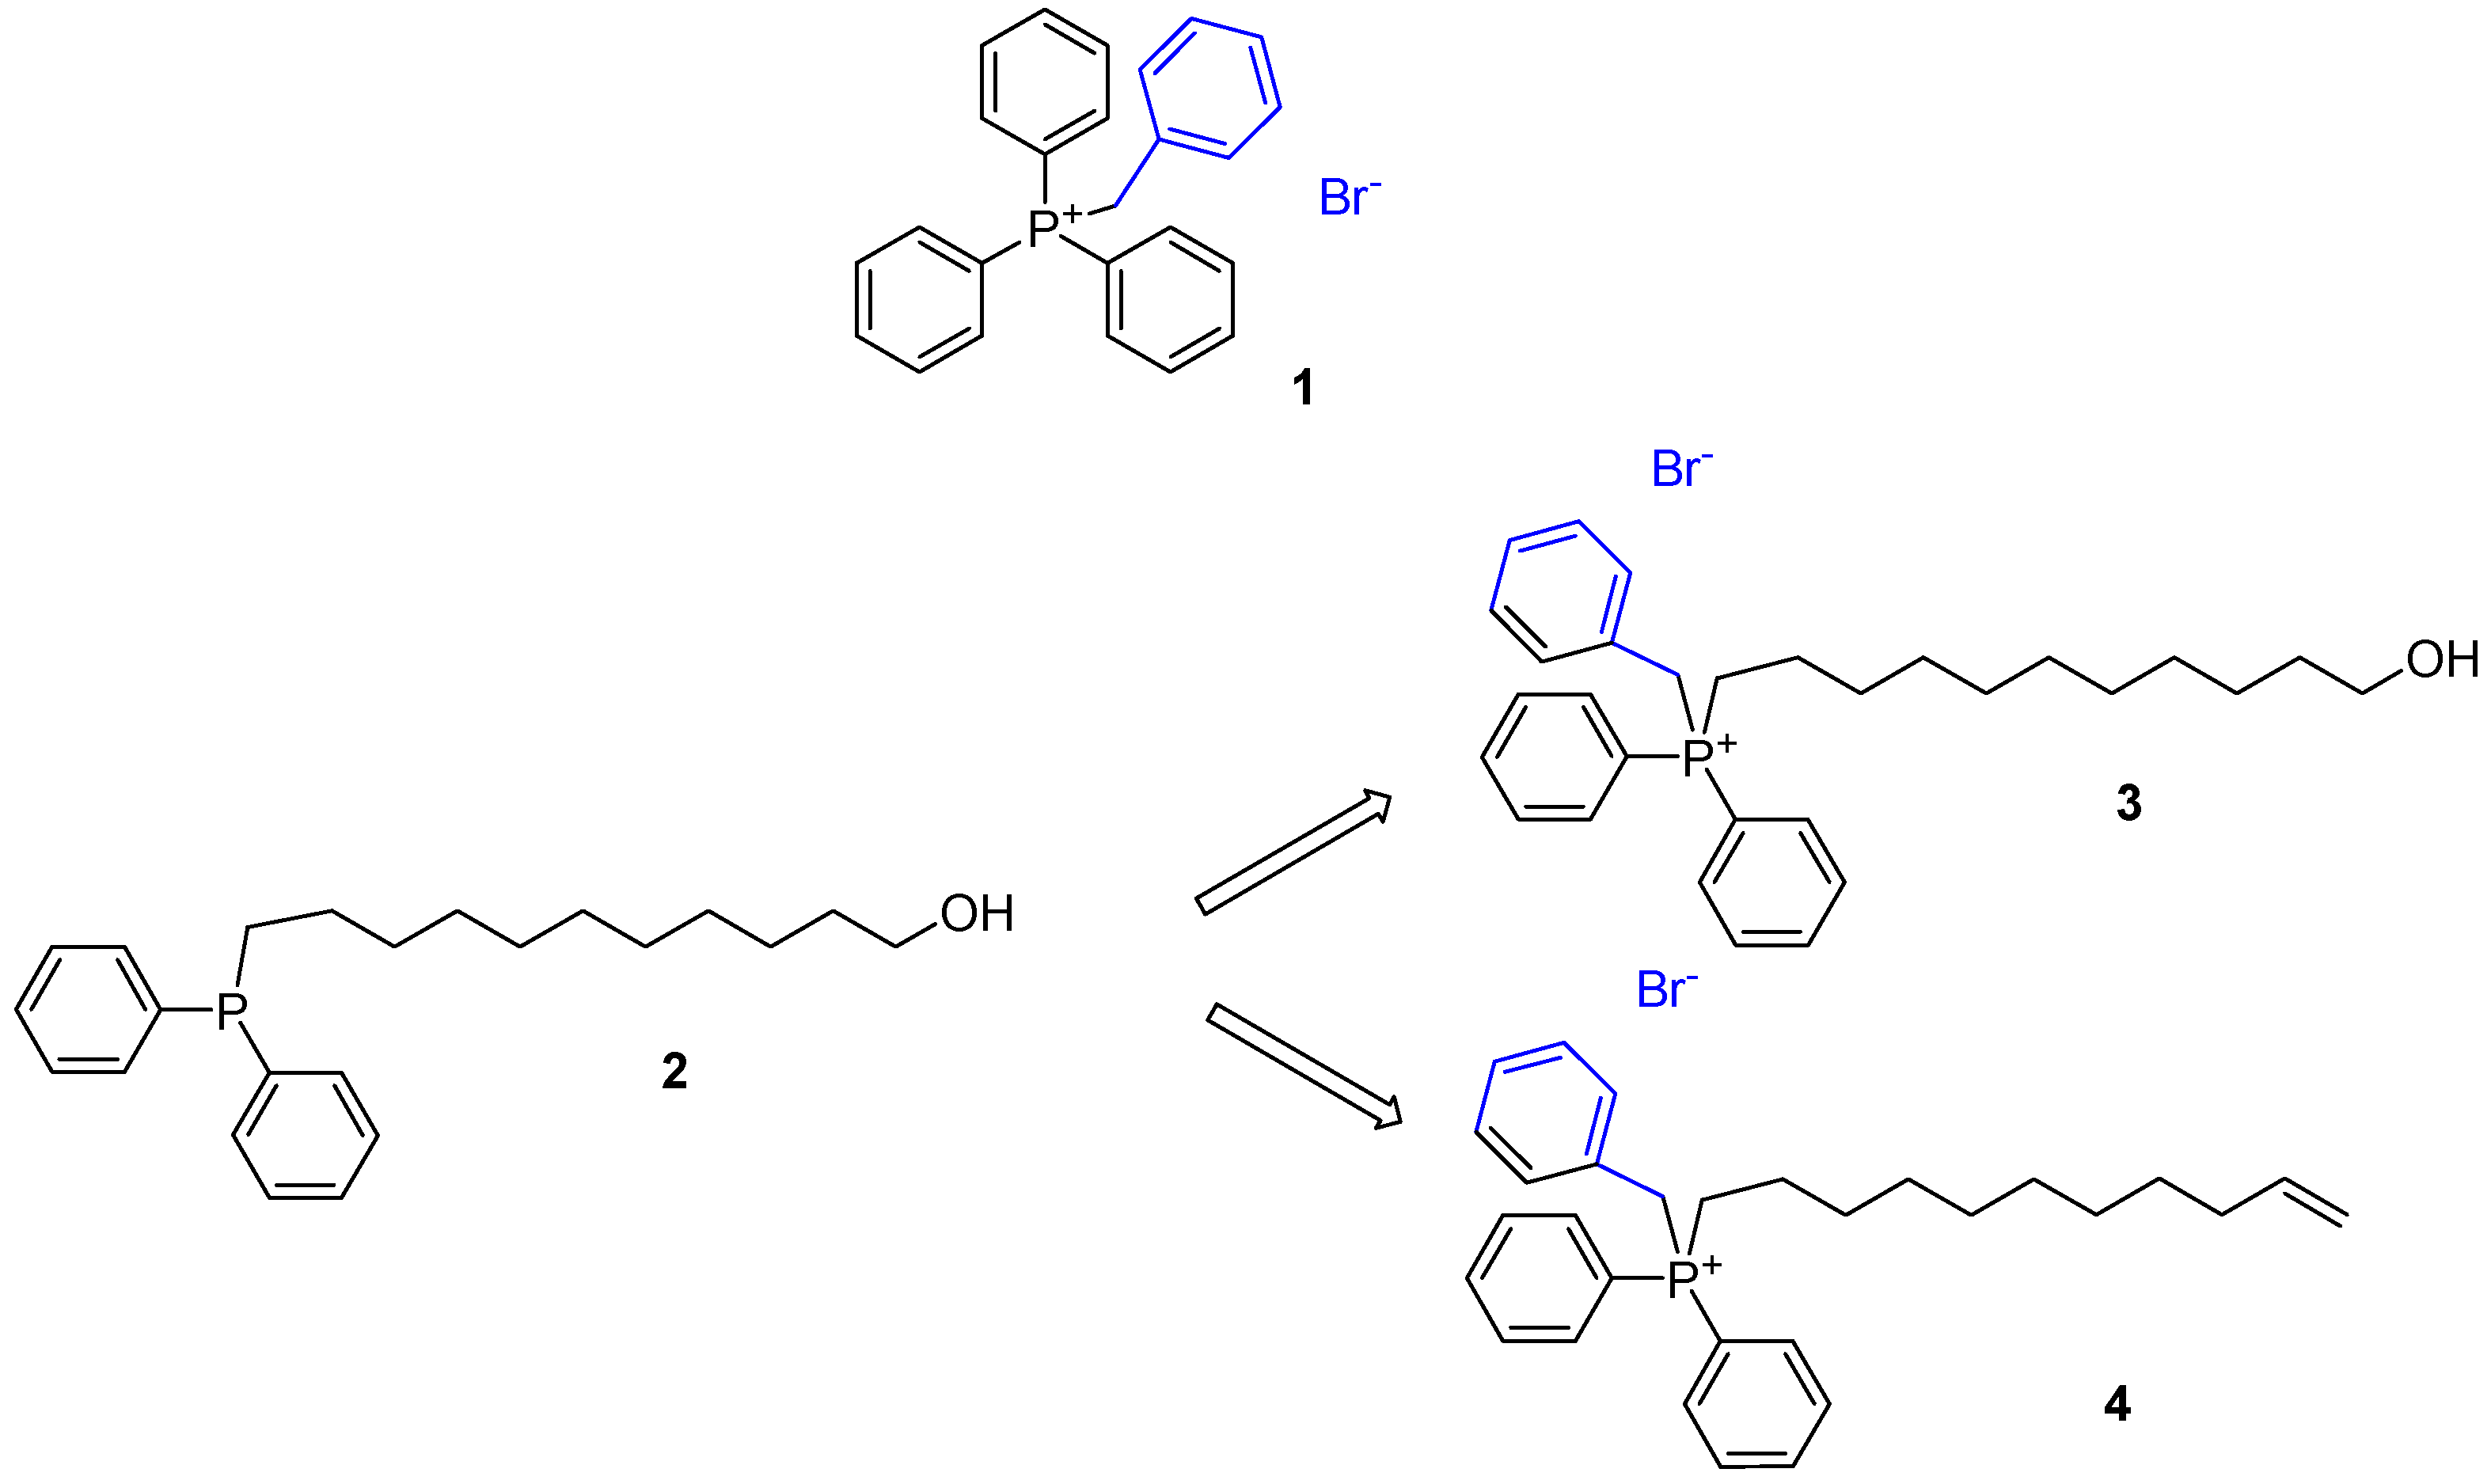
Figure 2.
Numbered chemical structure of compound 1.
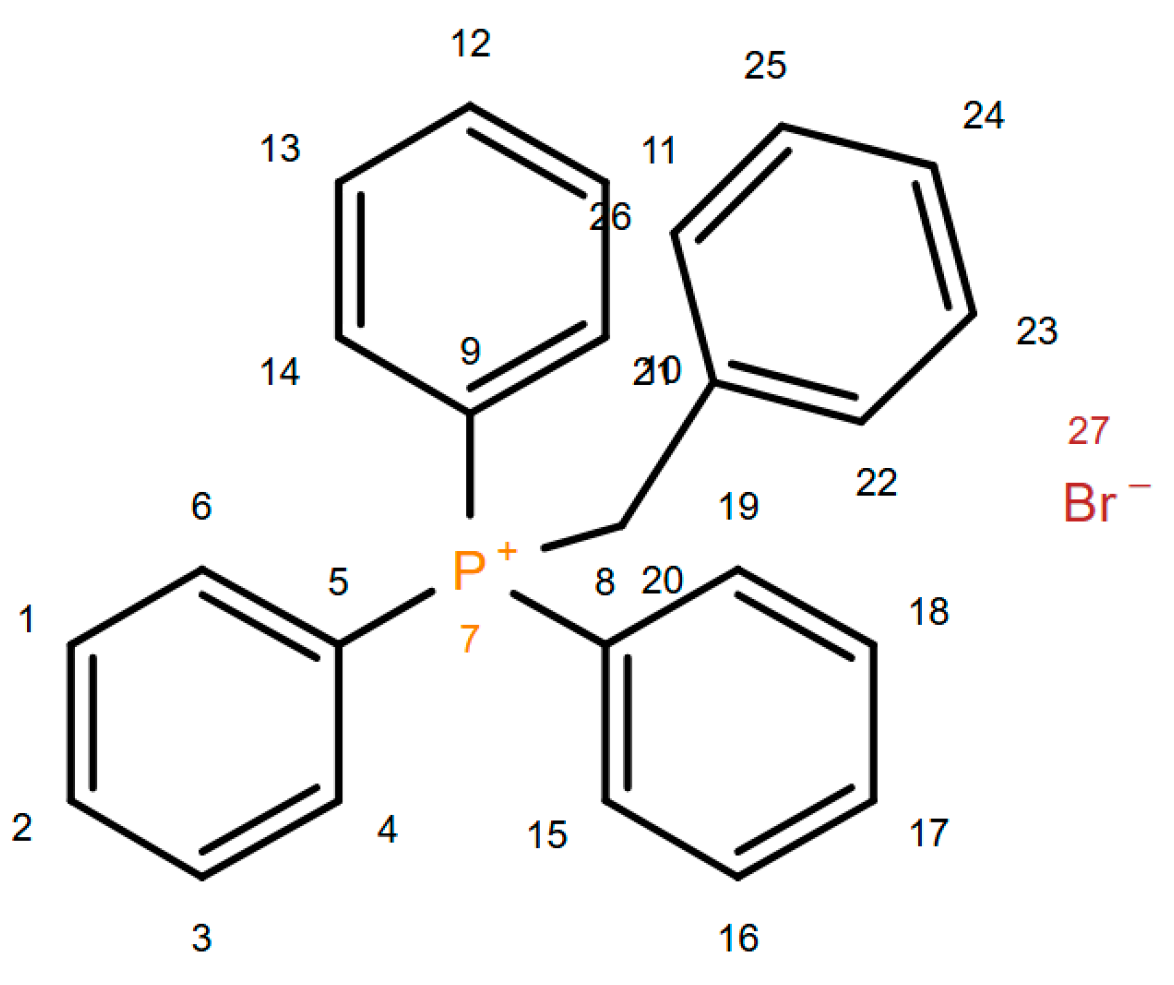
Scheme 1.
Synthetic procedure to prepare compound 1 [42]. DCM = dichloromethane.
Scheme 1.
Synthetic procedure to prepare compound 1 [42]. DCM = dichloromethane.
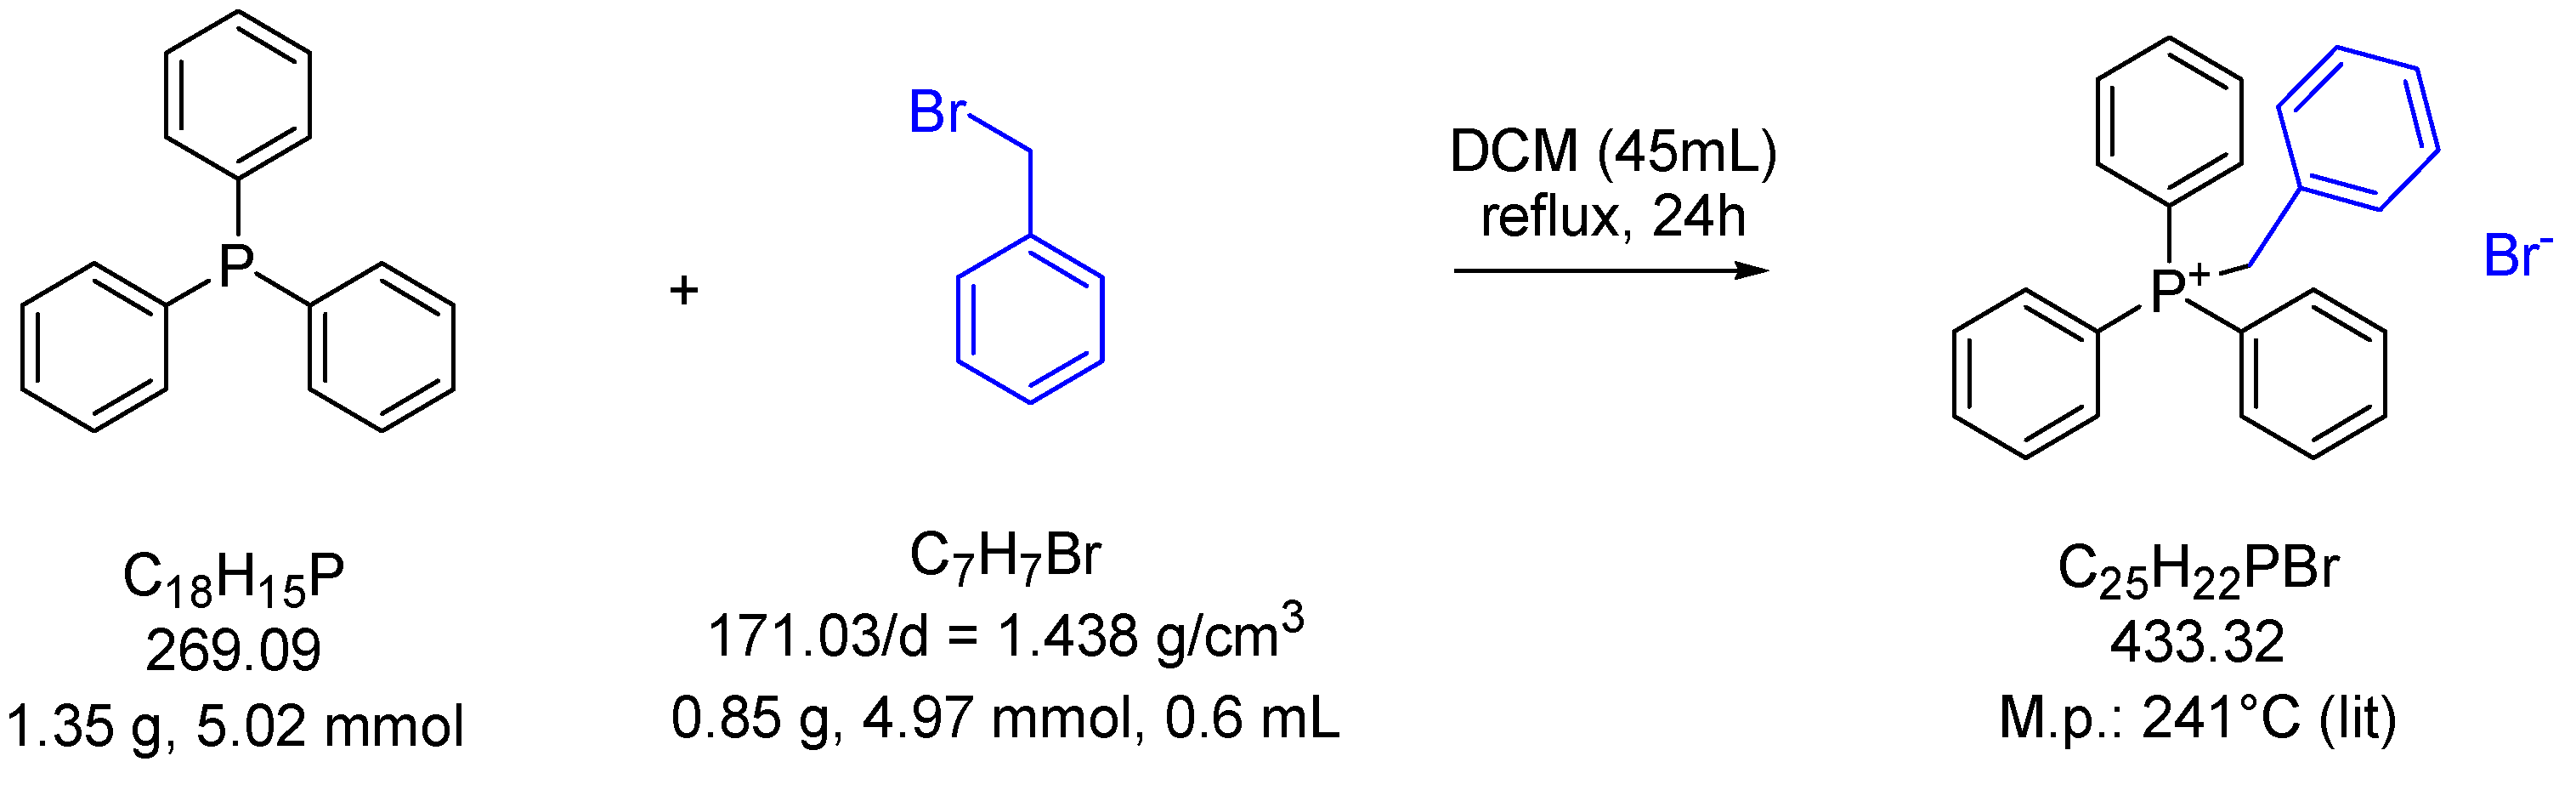
Scheme 2.
Synthetic procedure followed to prepare 2.
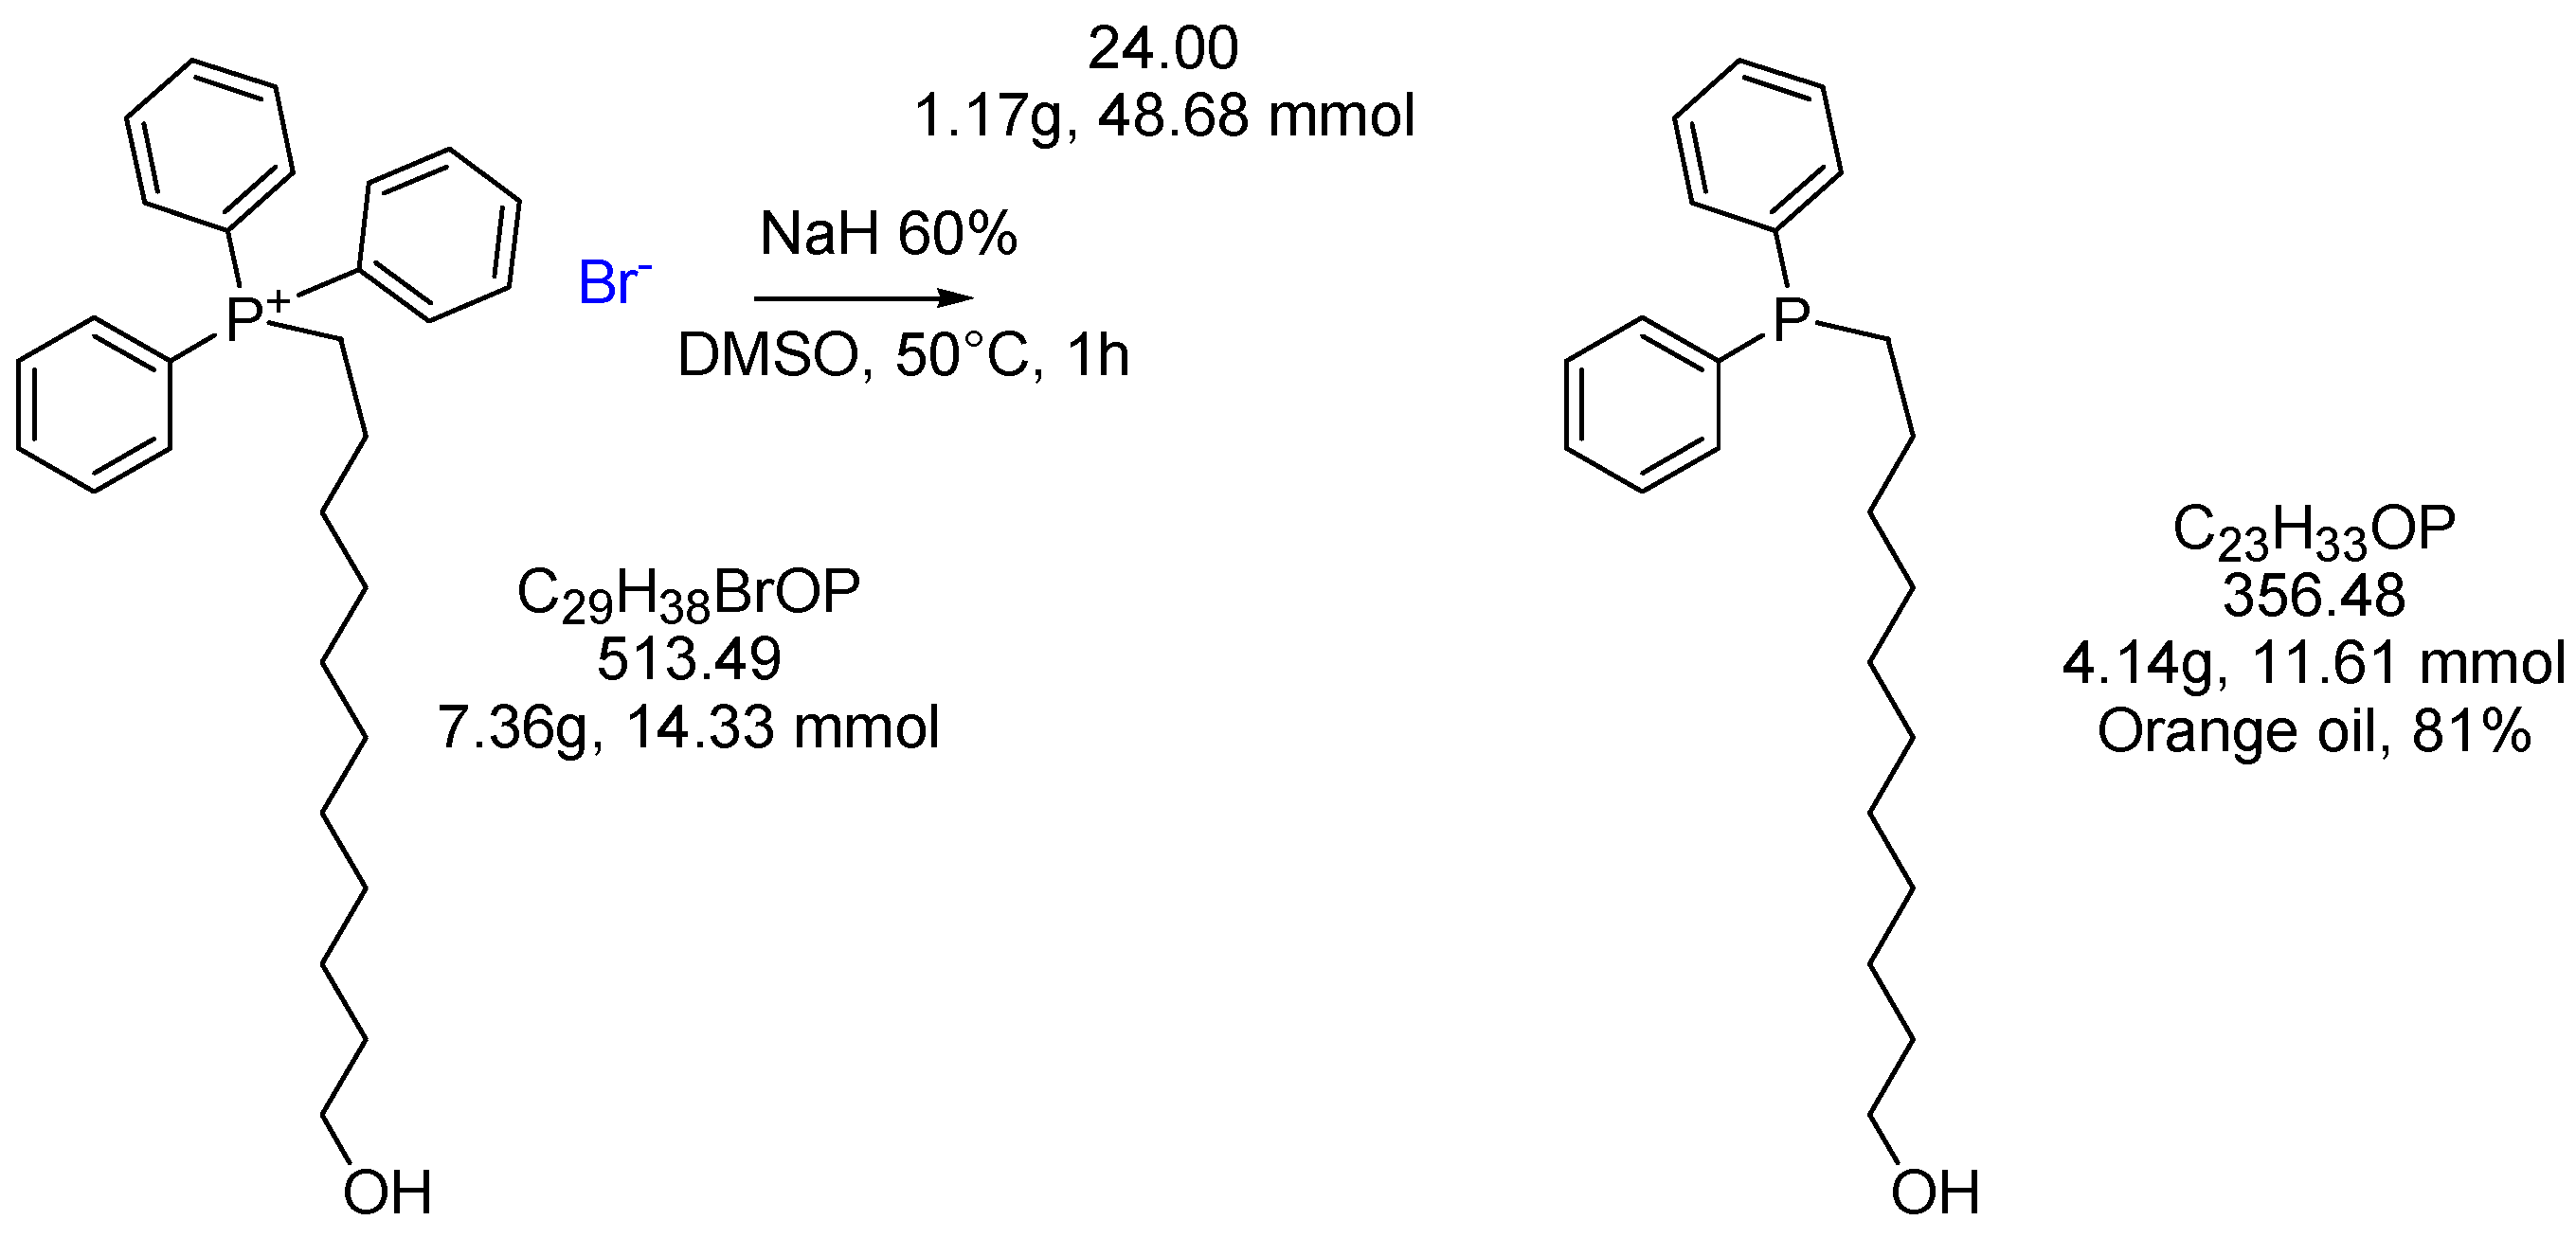
Scheme 3.
Mechanism proposed by Hands et al. for the formation of 11-DPPOH via use of NaH (blue route)[45], and conventional employment of triphenyl phosphonium salts in Wittig reactions to prepare alkene derivatives via α-deprotonation with BuLi (red route).
Scheme 3.
Mechanism proposed by Hands et al. for the formation of 11-DPPOH via use of NaH (blue route)[45], and conventional employment of triphenyl phosphonium salts in Wittig reactions to prepare alkene derivatives via α-deprotonation with BuLi (red route).
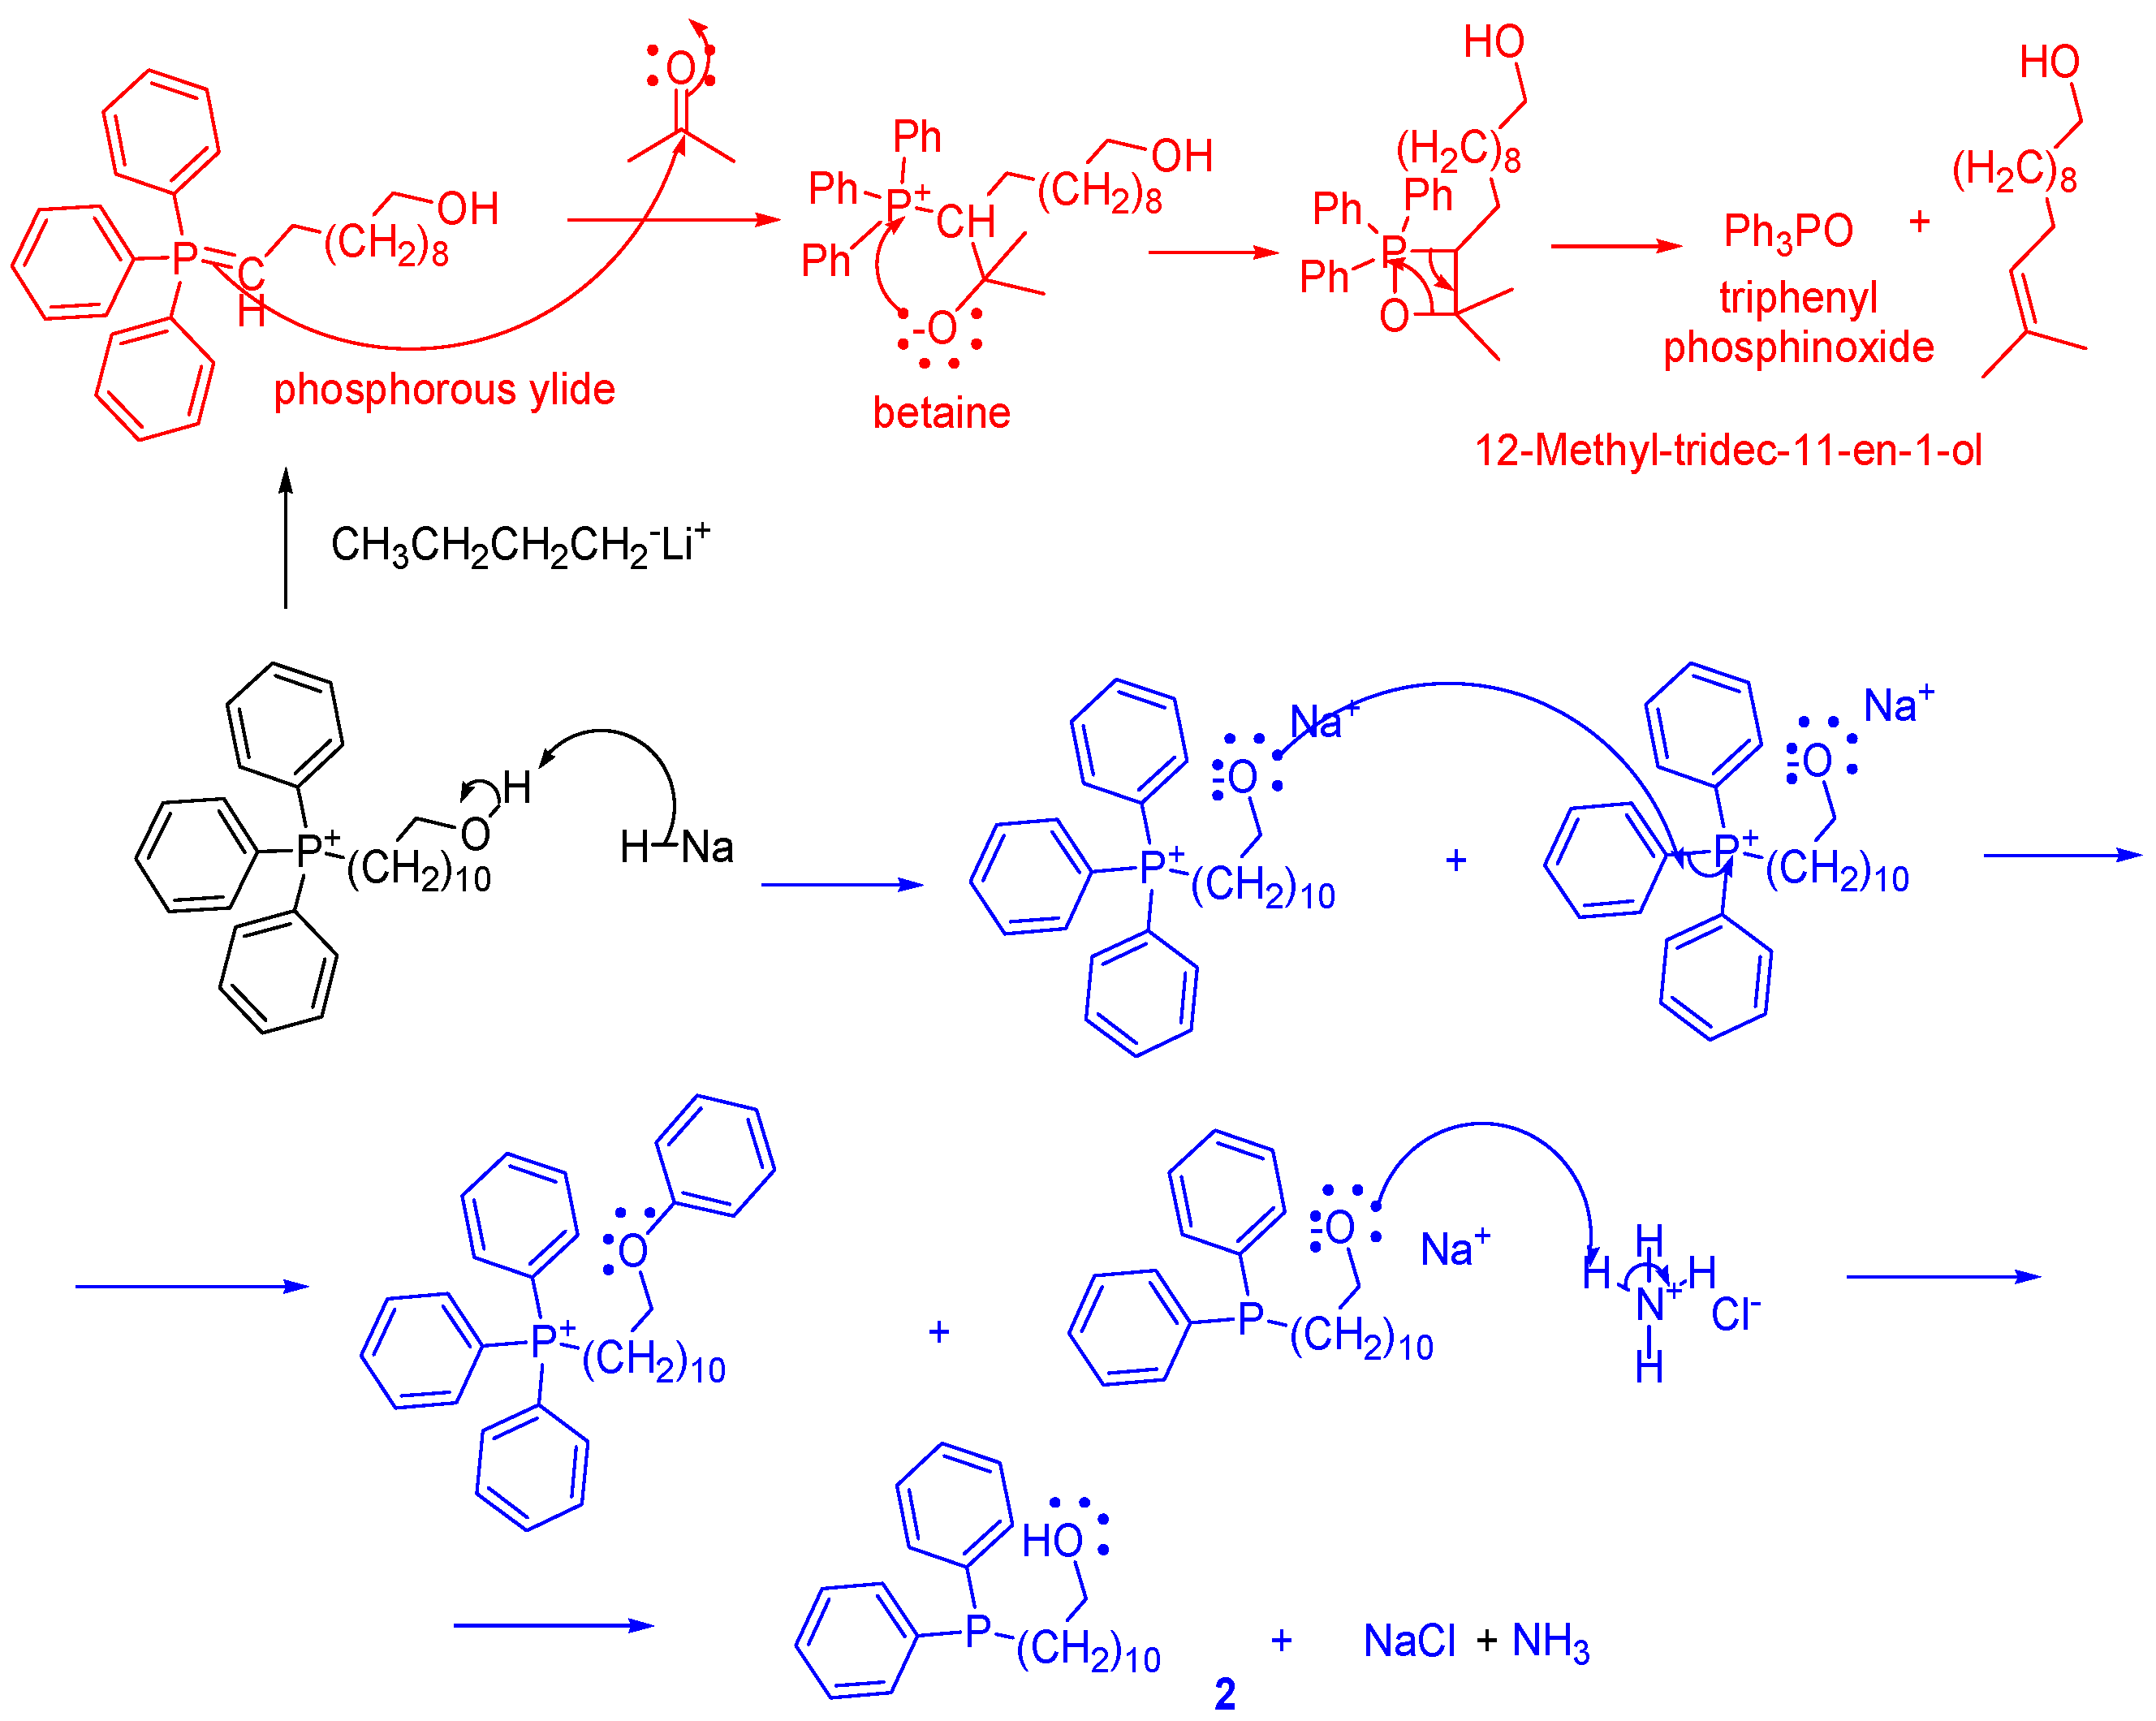
Figure 3.
Numbered chemical structure of compound 2.
Scheme 4.
Synthetic procedure to achieve compounds 3 and 4. DCM = dichloromethane.
Scheme 5.
Mechanism of the E2 reaction by compound 3 to provide compound 4.
Figure 4.
Numbered chemical structure of compound 3.
Figure 5.
Numbered chemical structure of compound 4.
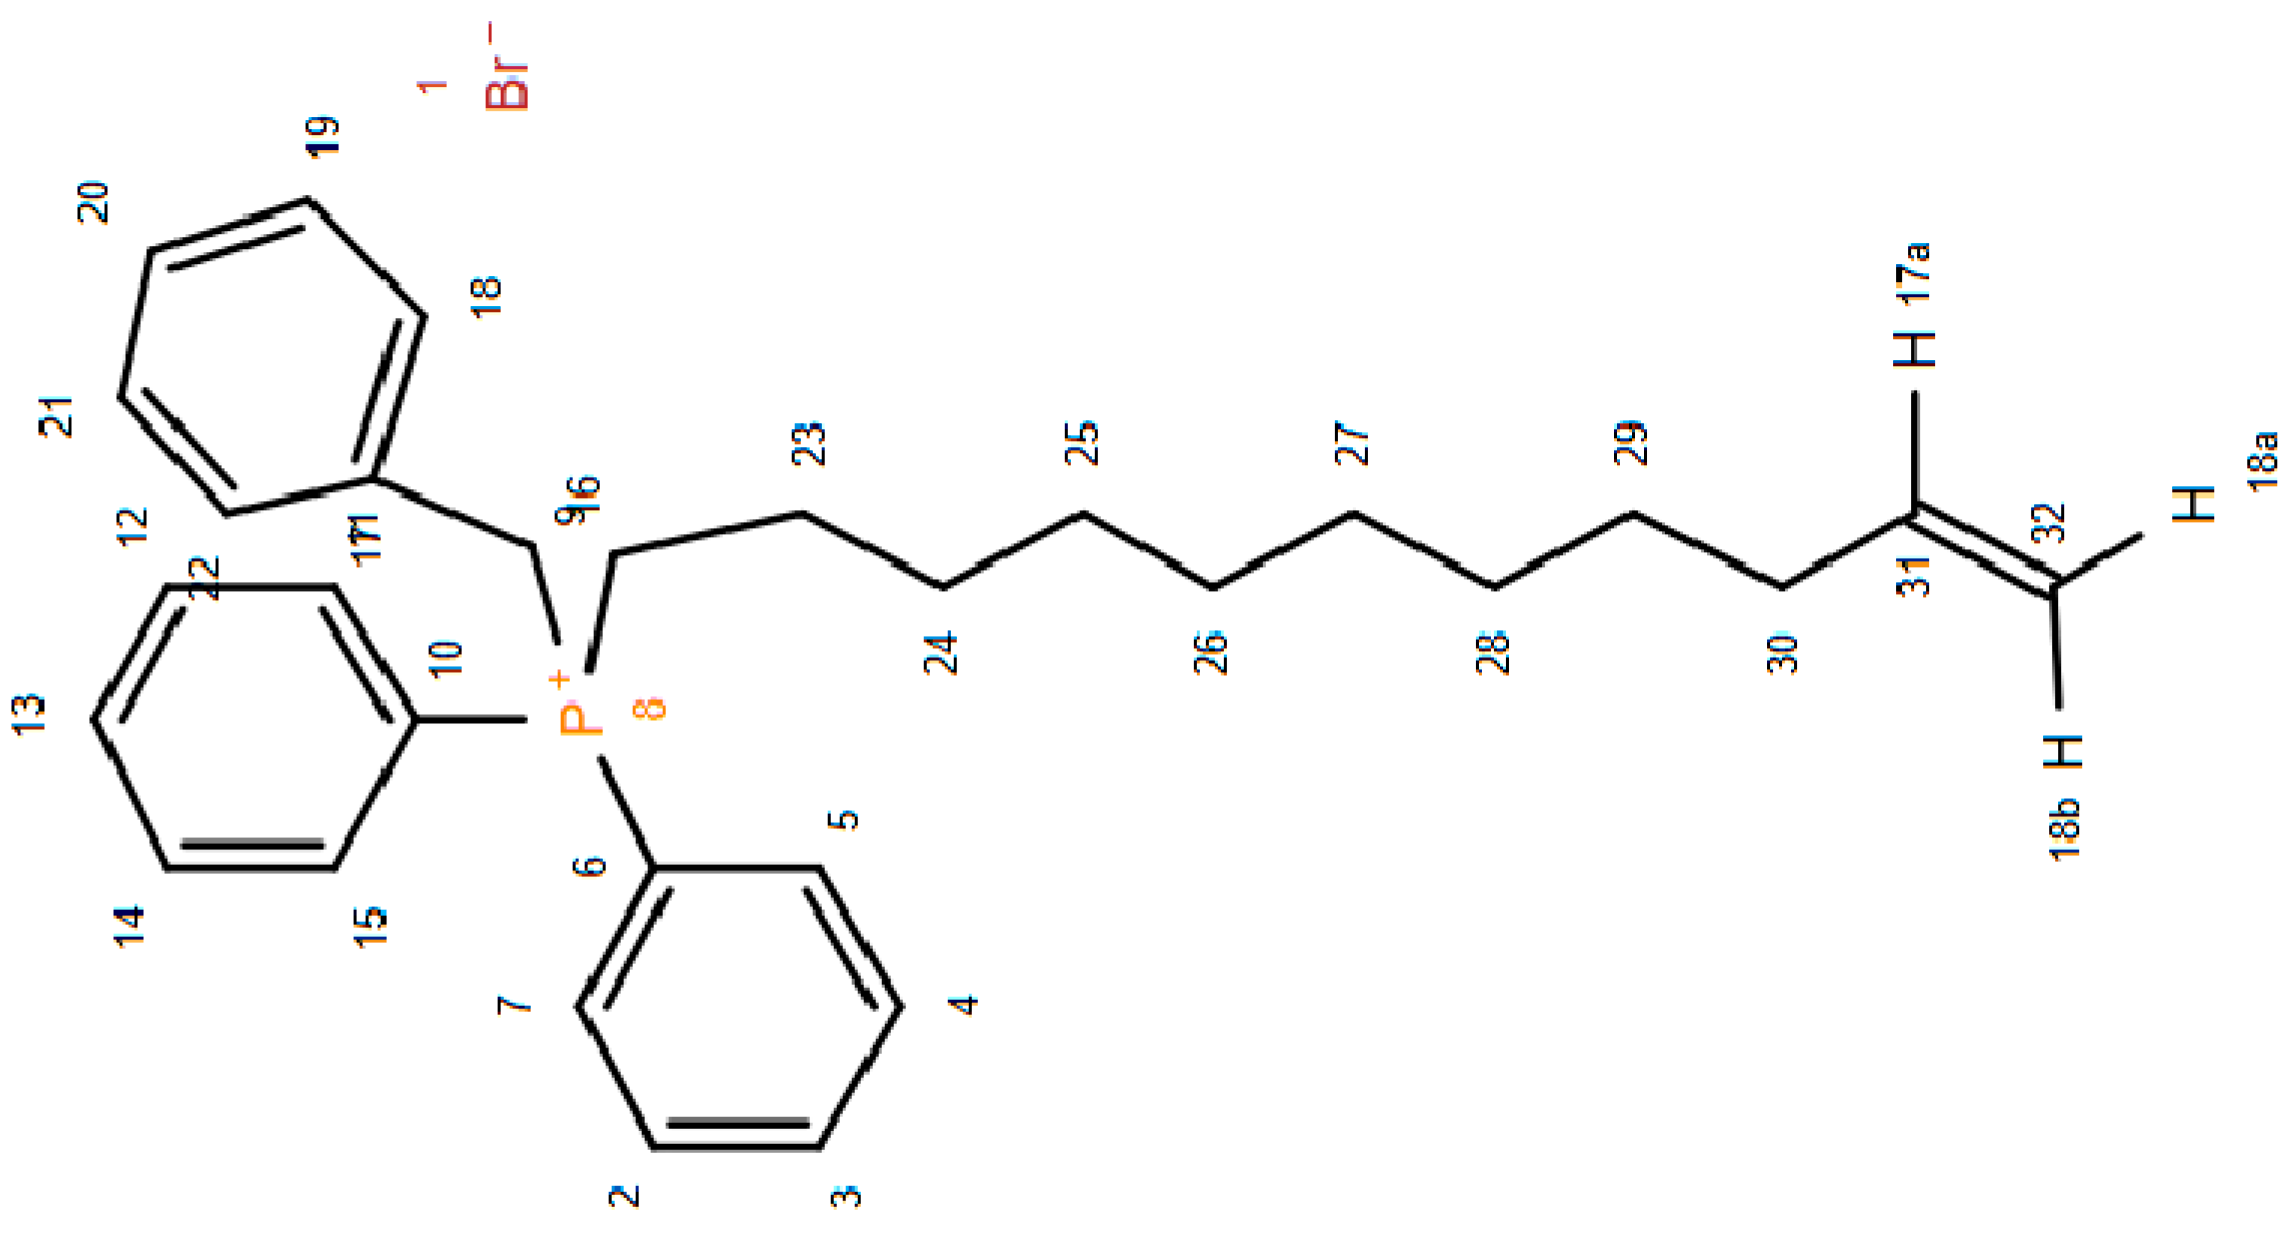
Figure 6.
Score plot of PC1 vs. PC2 obtained processing matrix E by PCA. Red cross indicates the PC1 intersection with PC2 at scores zero.
Figure 6.
Score plot of PC1 vs. PC2 obtained processing matrix E by PCA. Red cross indicates the PC1 intersection with PC2 at scores zero.
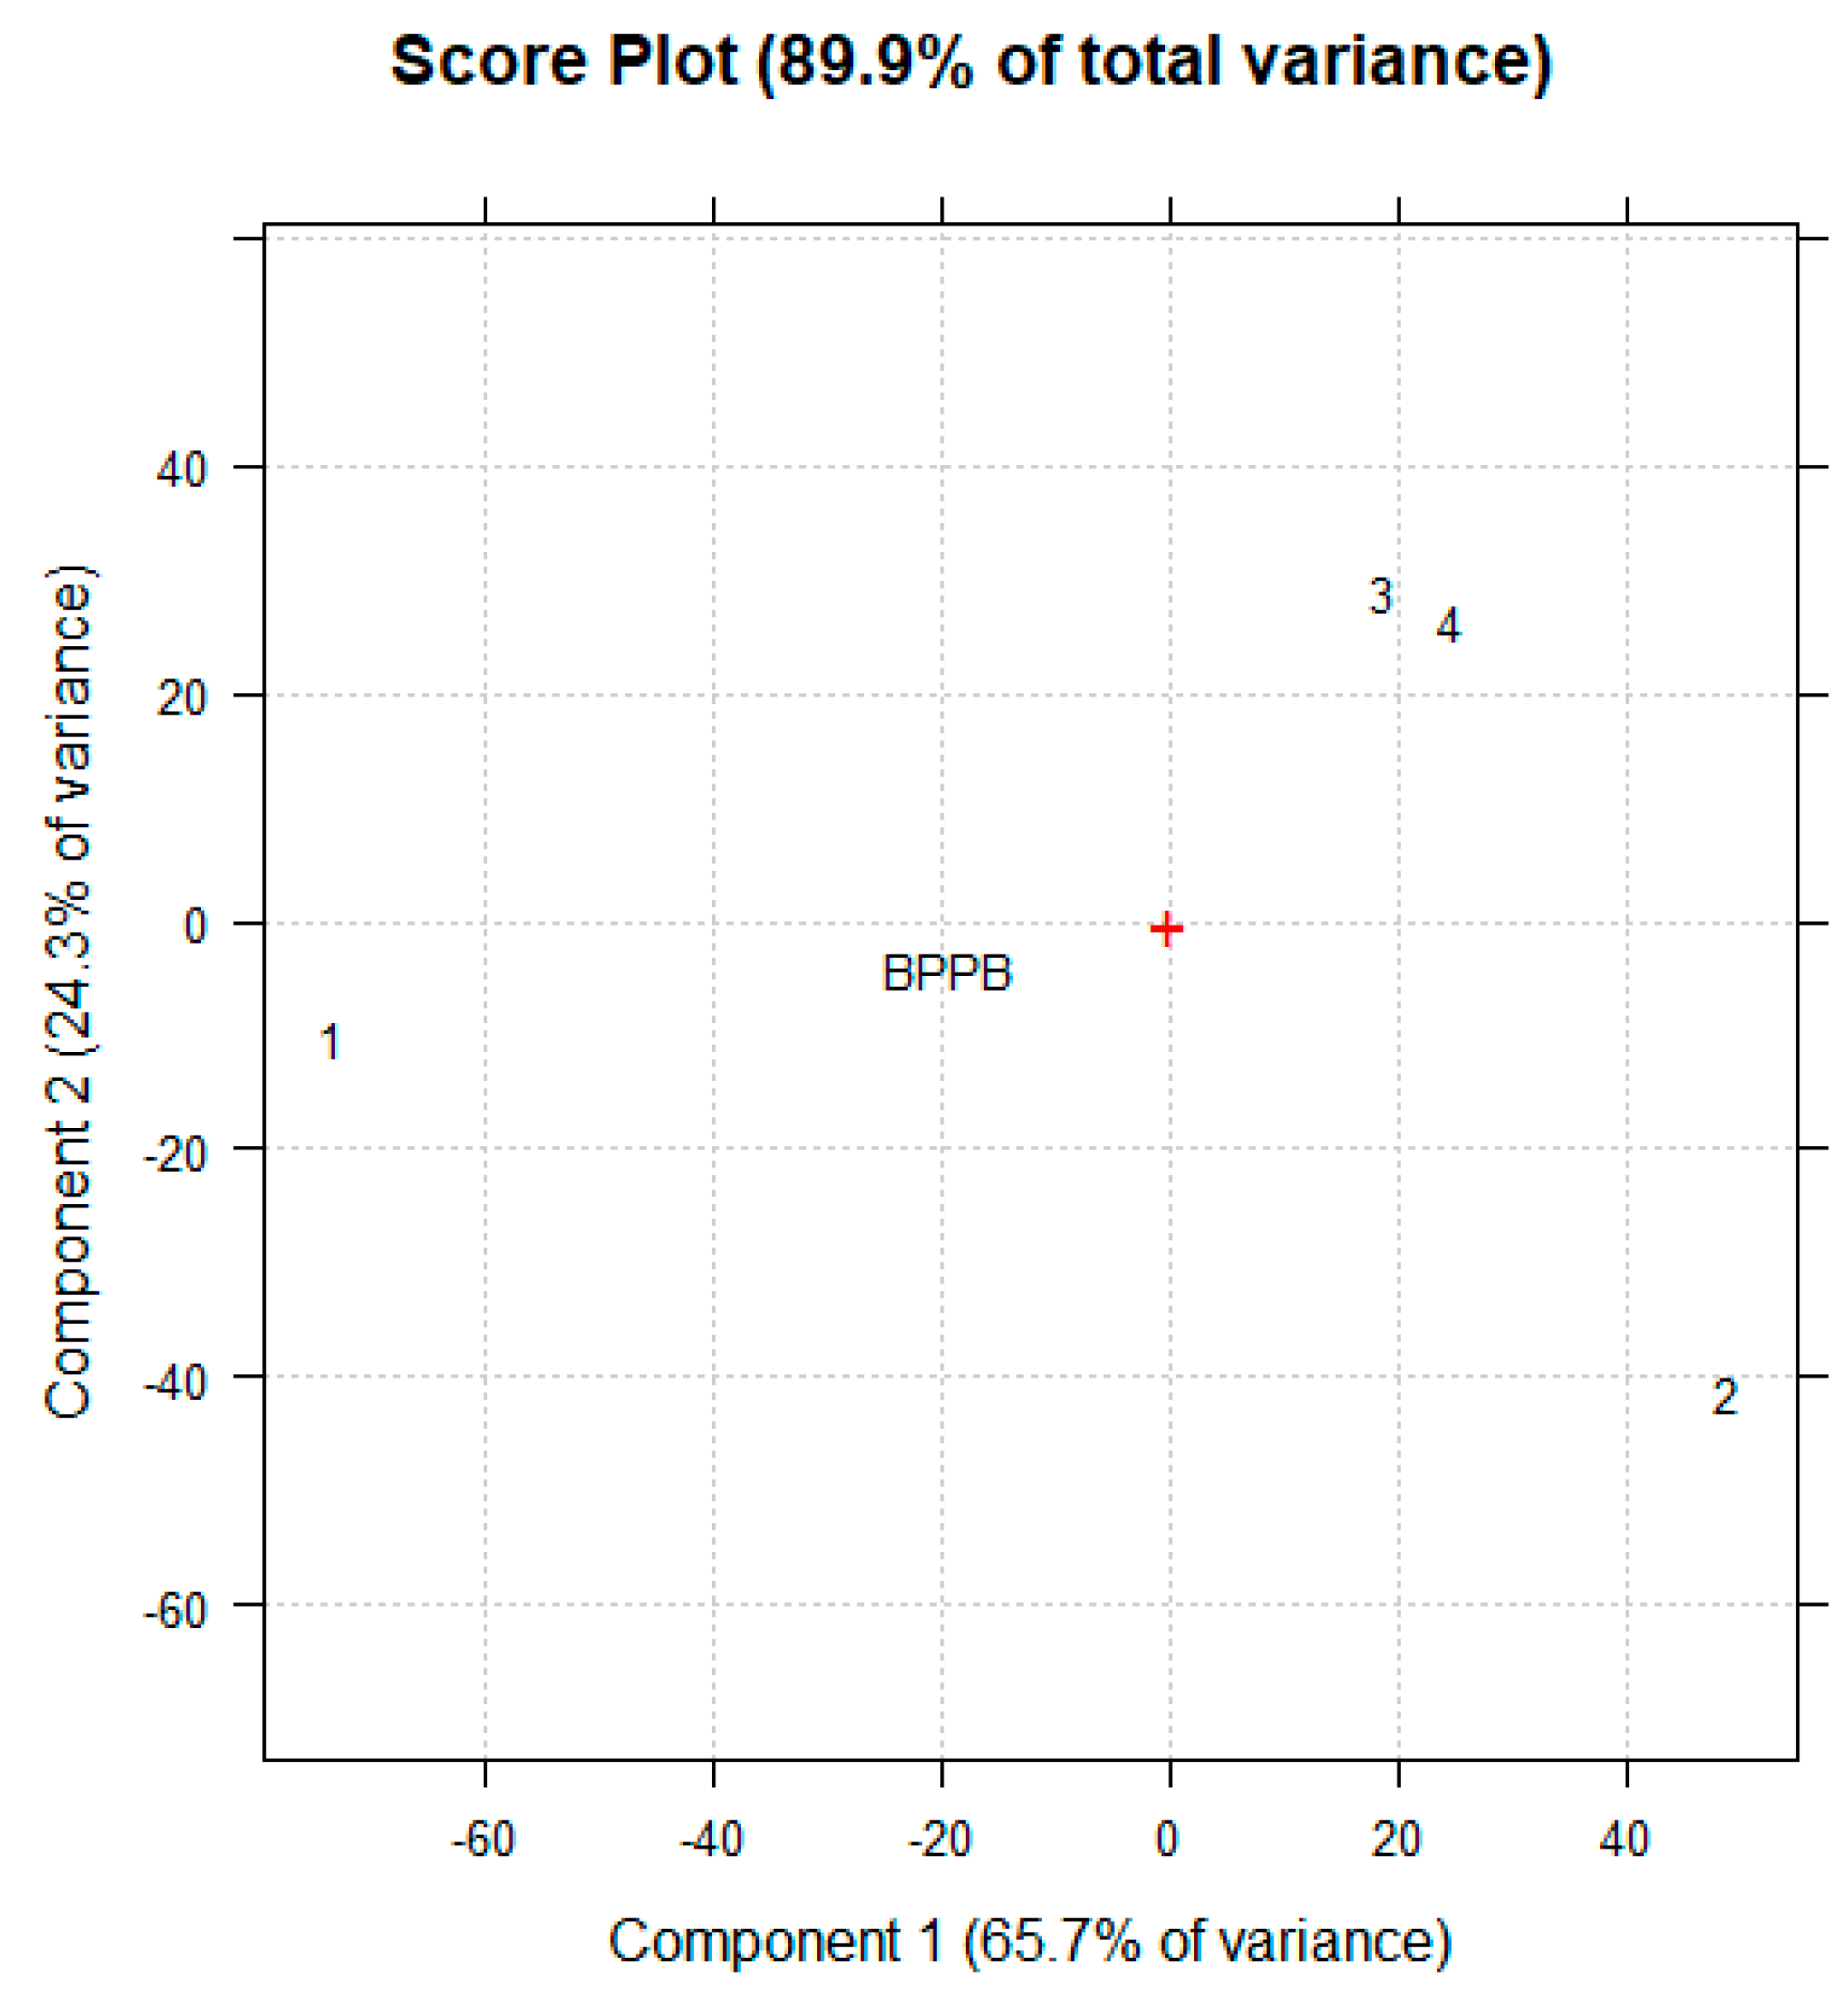
Figure 7.
Score plots of PCA carried out on the matrix of 164 variables, consisting in the values of δ (ppm) of the NMR spectral data of compound 1-4 expressed as PC1 vs PC2 (a) and as PC1 vs PC3 (b). Score plots of PCA carried out on the matrix of 246 variables consisting in the values of δ (ppm) of the NMR spectral data of compound 1-4 added with those of TPPOH and BPPB, expressed as PC1 vs PC2 (c) and as PC1 vs PC3 (d). Red crosses indicate the PC1 intersection with PC2 or PC3 at scores zero.
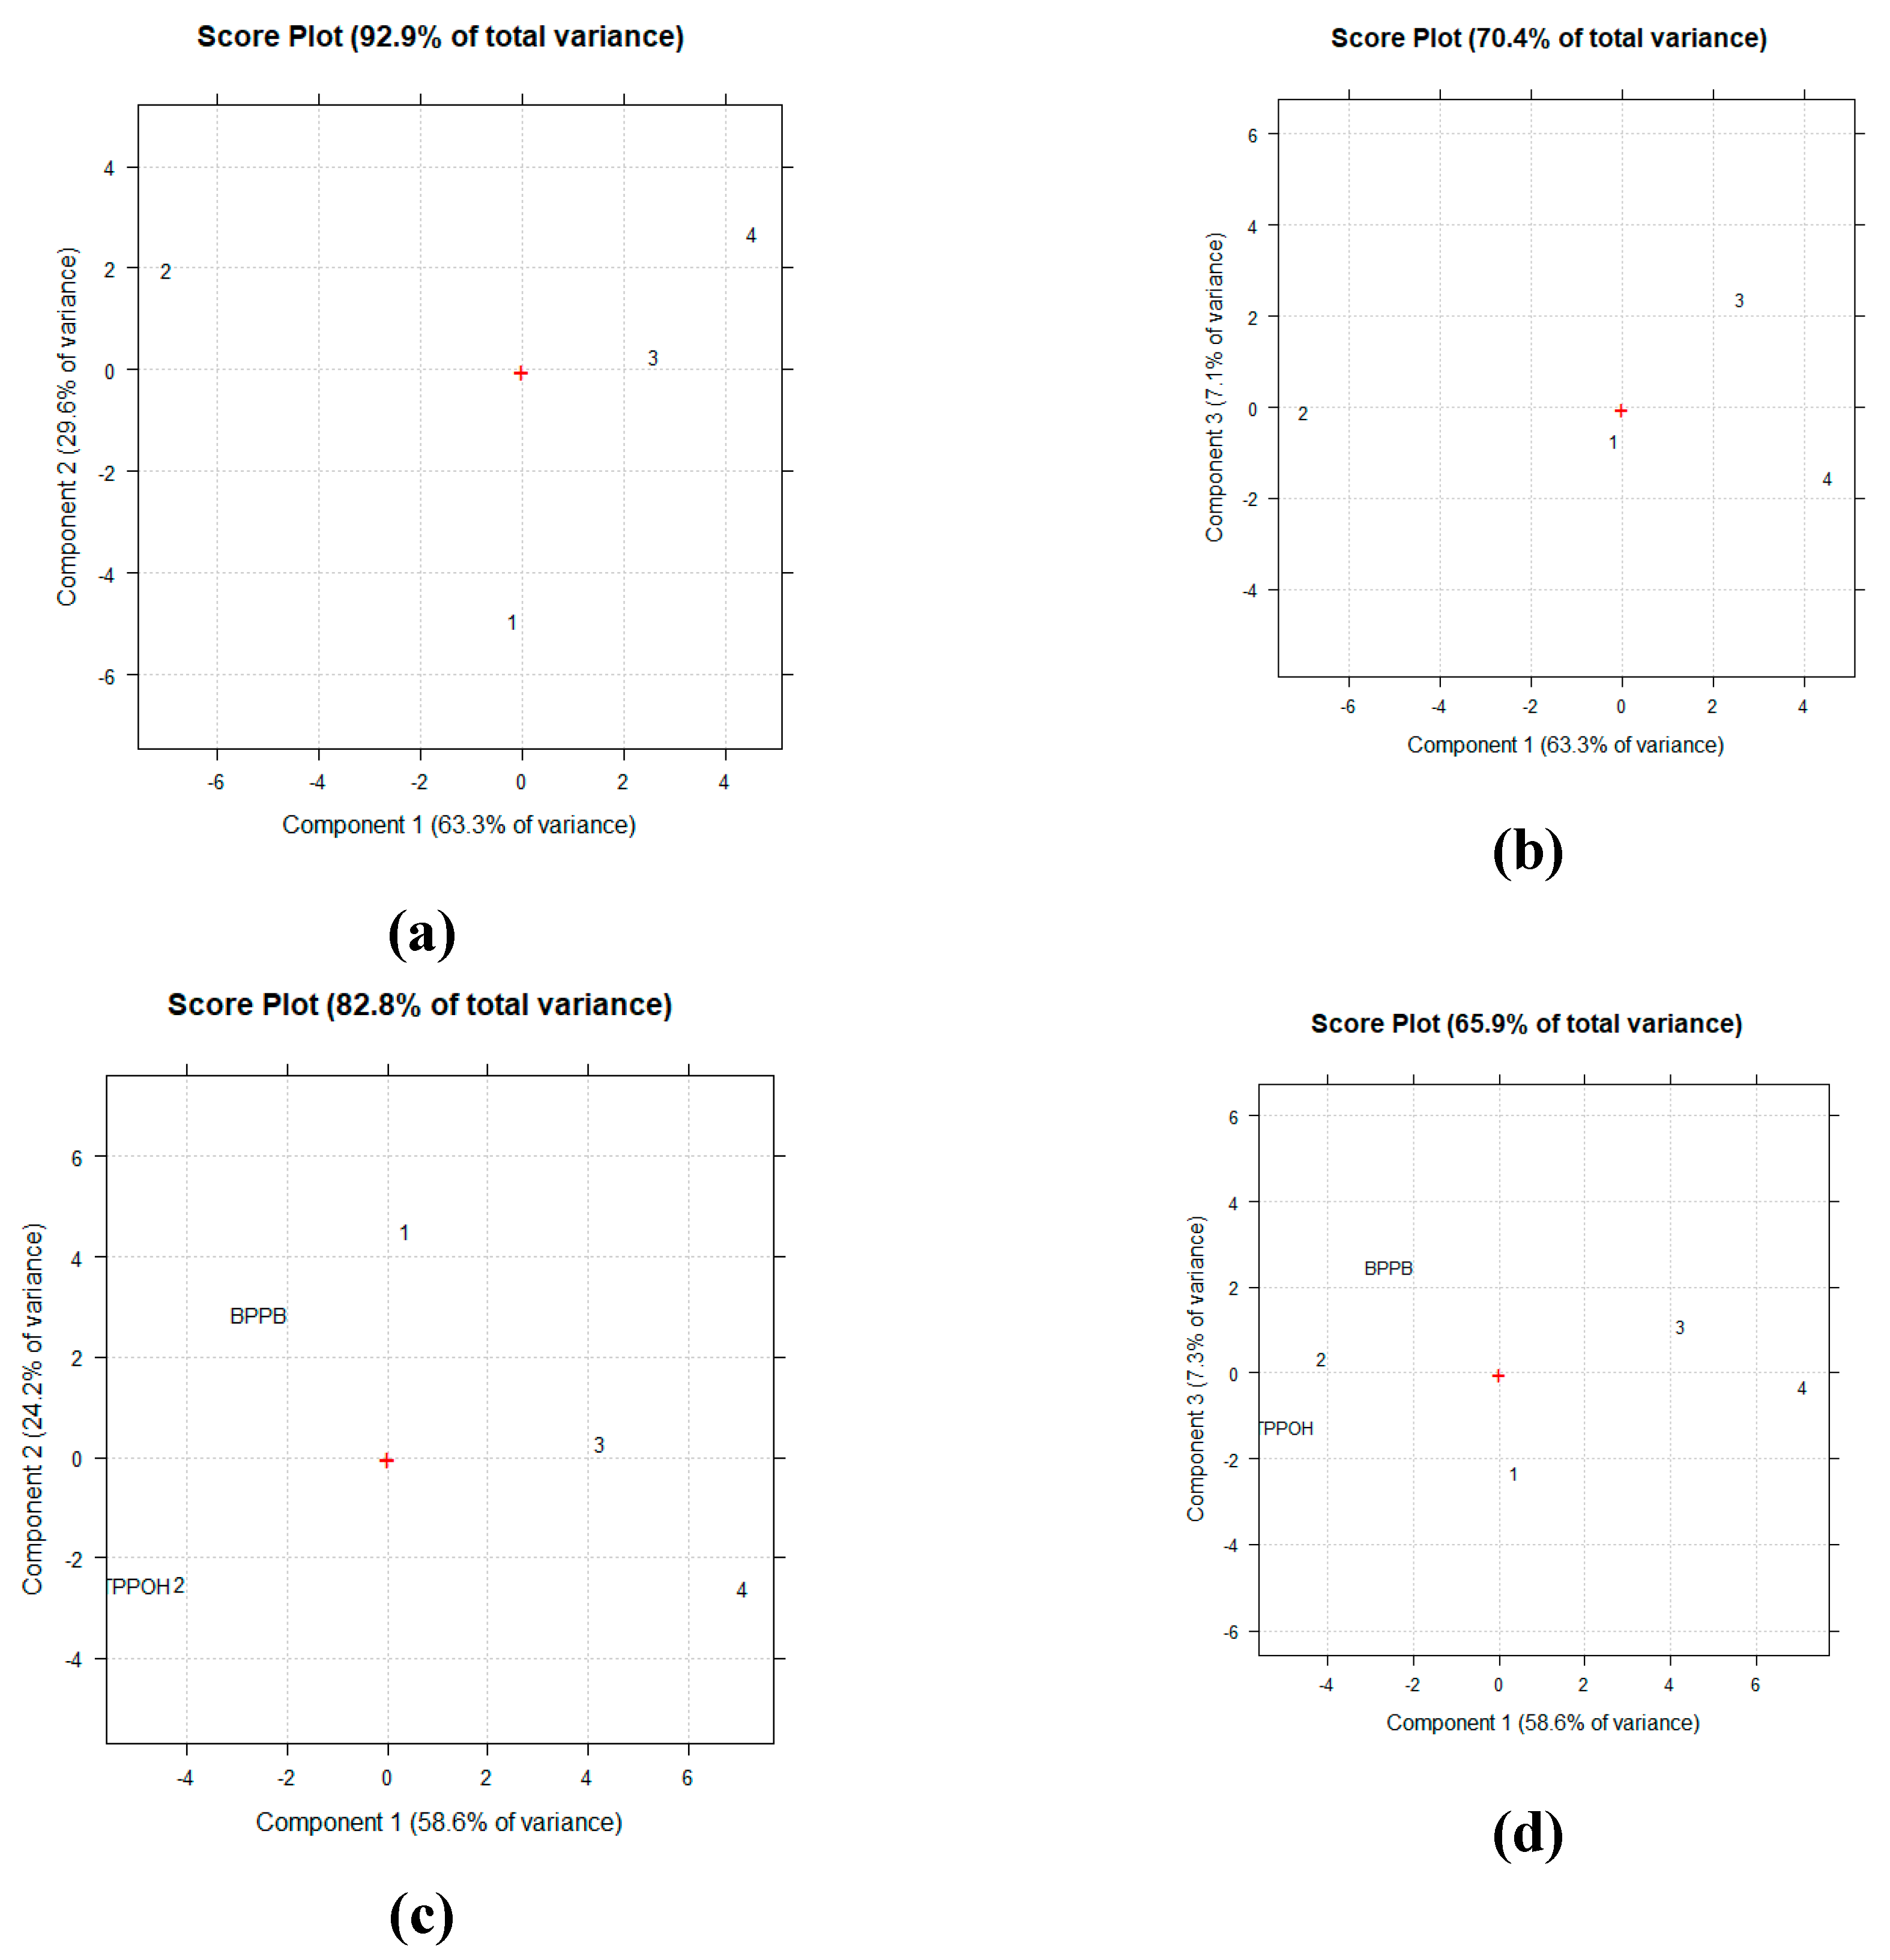
Figure 8.
Vesicular aggregates of 2 (A, B, C, D), 3 (E, F, G, H) and 4 (I, J, K,L), as well as crystals of 1 (M, N, O, P) in MeOH (A, C, E, G, I, K, M, O) and in water solution (B, D, F, H, J, L, N,P) observed with a 40× objective (A, B, E, F, I, J, M, N, ). Smaller spherical vesicles of same compound were better evidenced using the 100× objective (C, D, G, H, K, L, O, P).
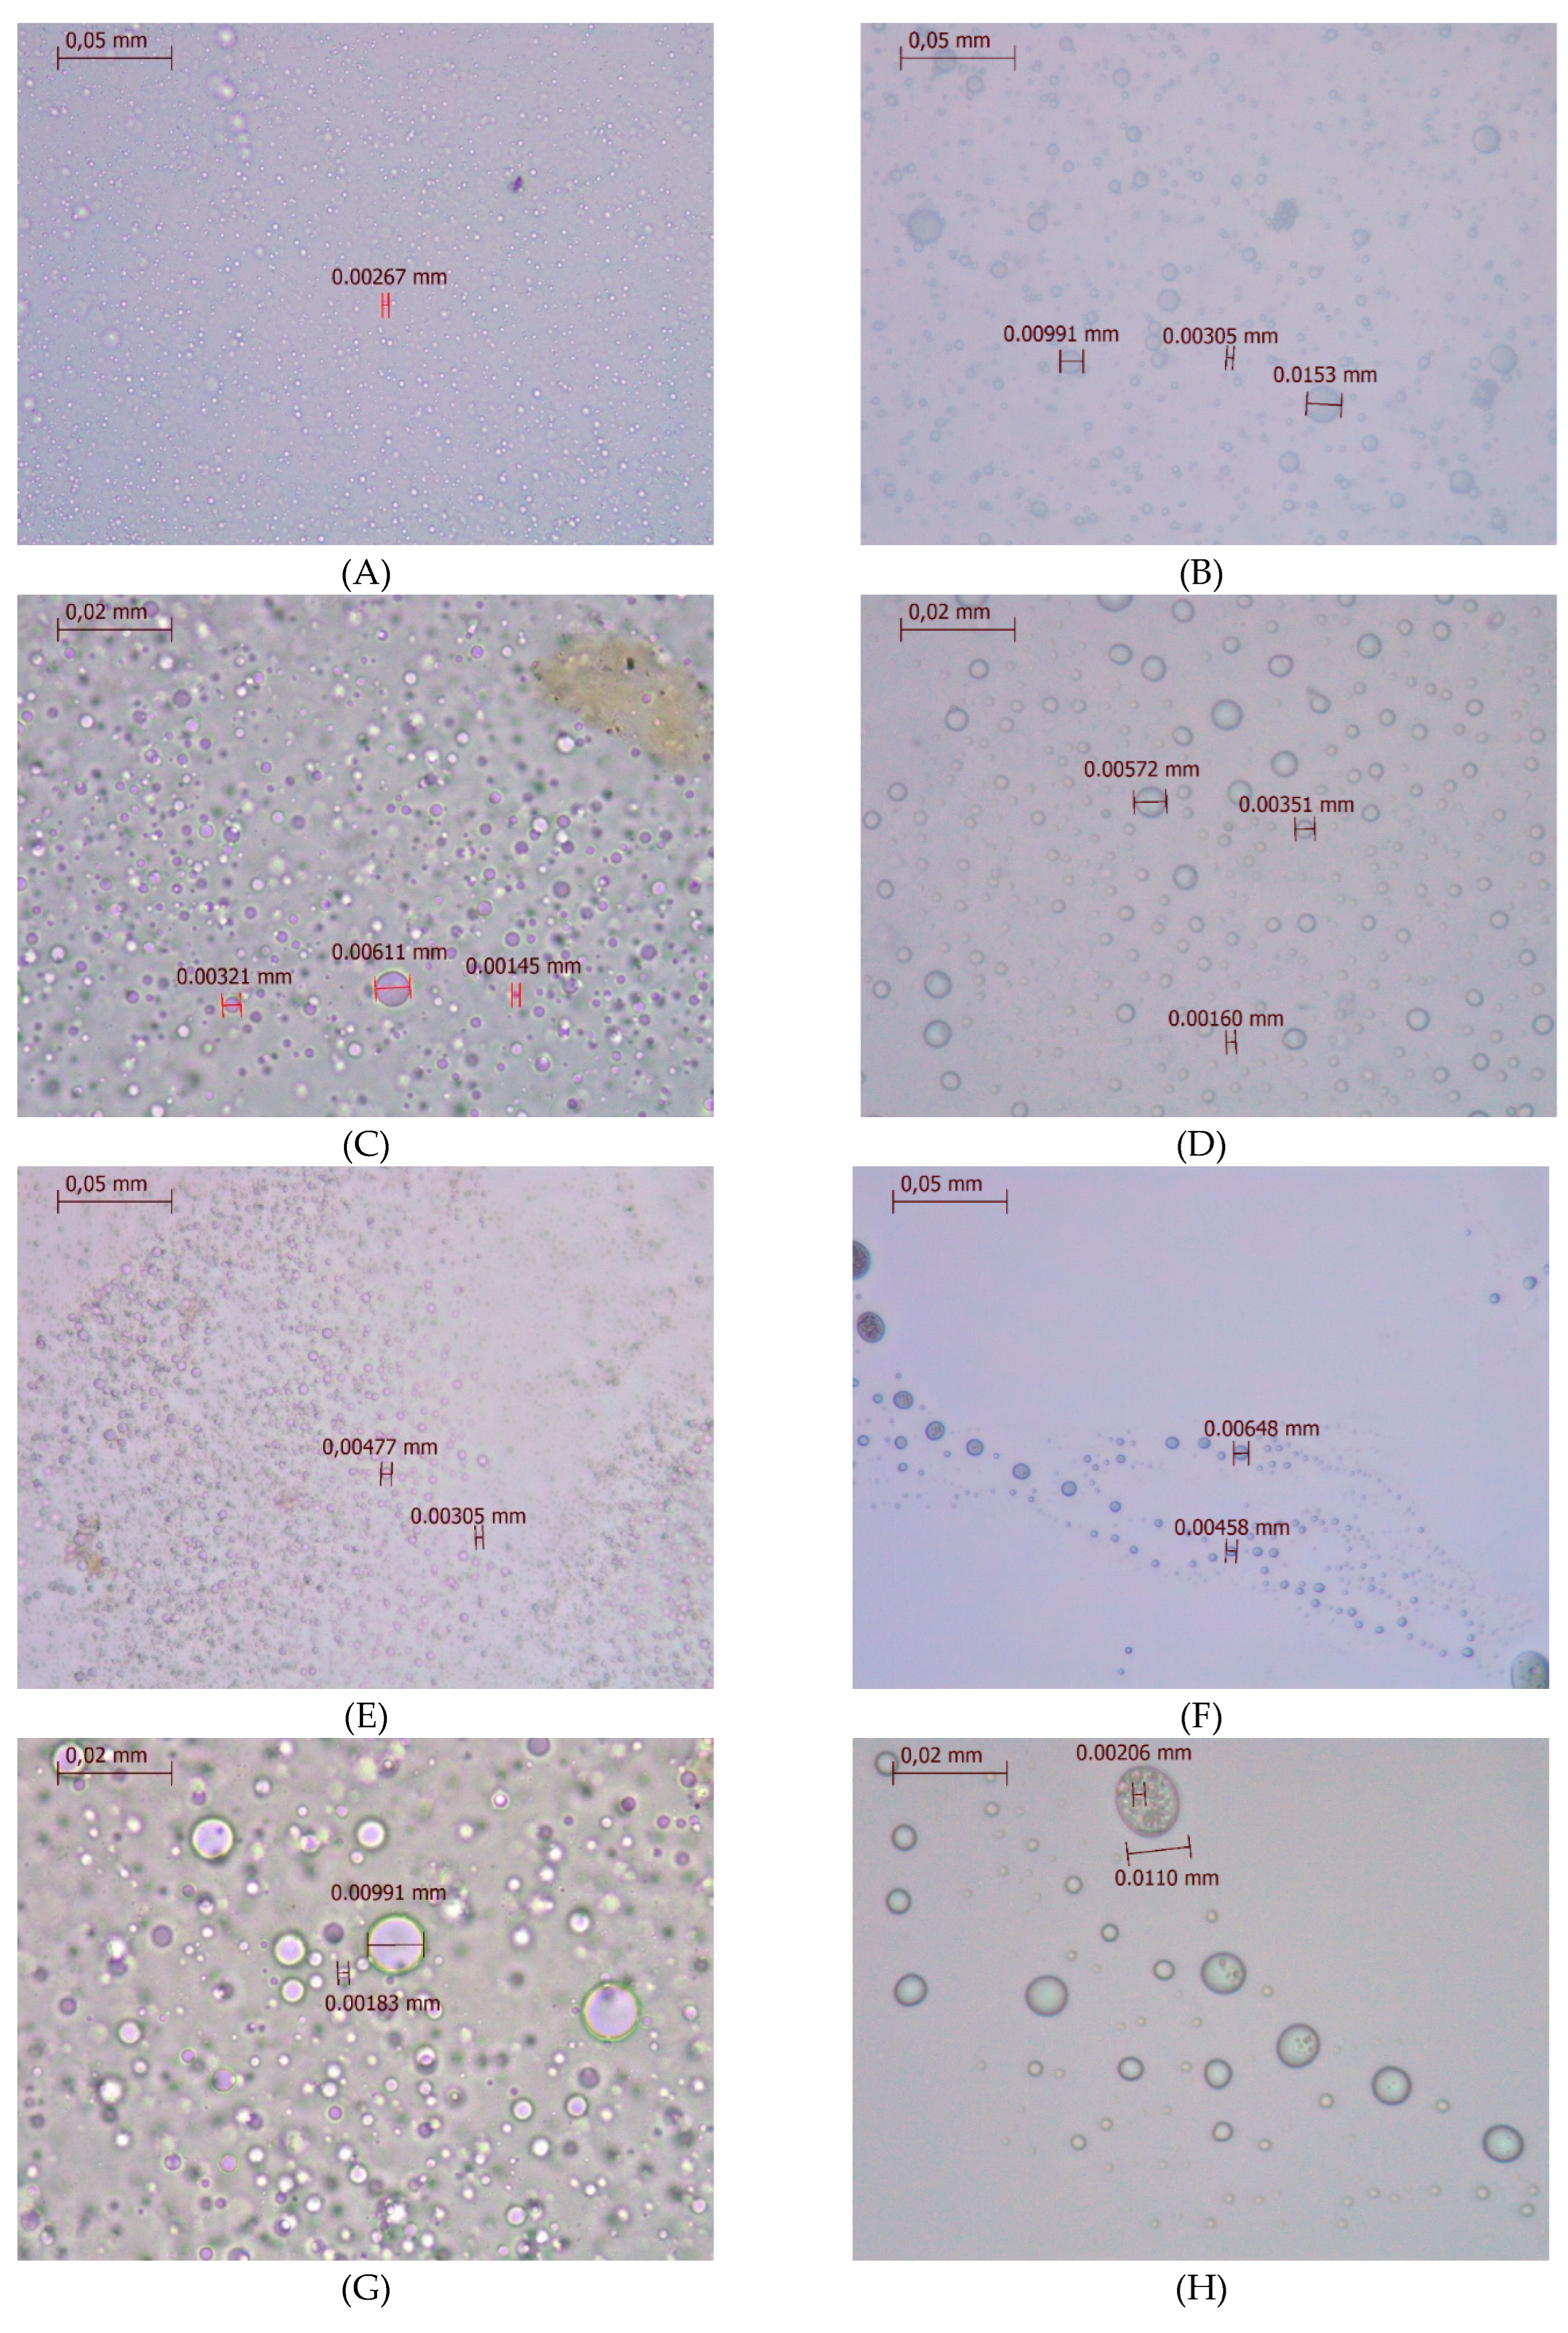
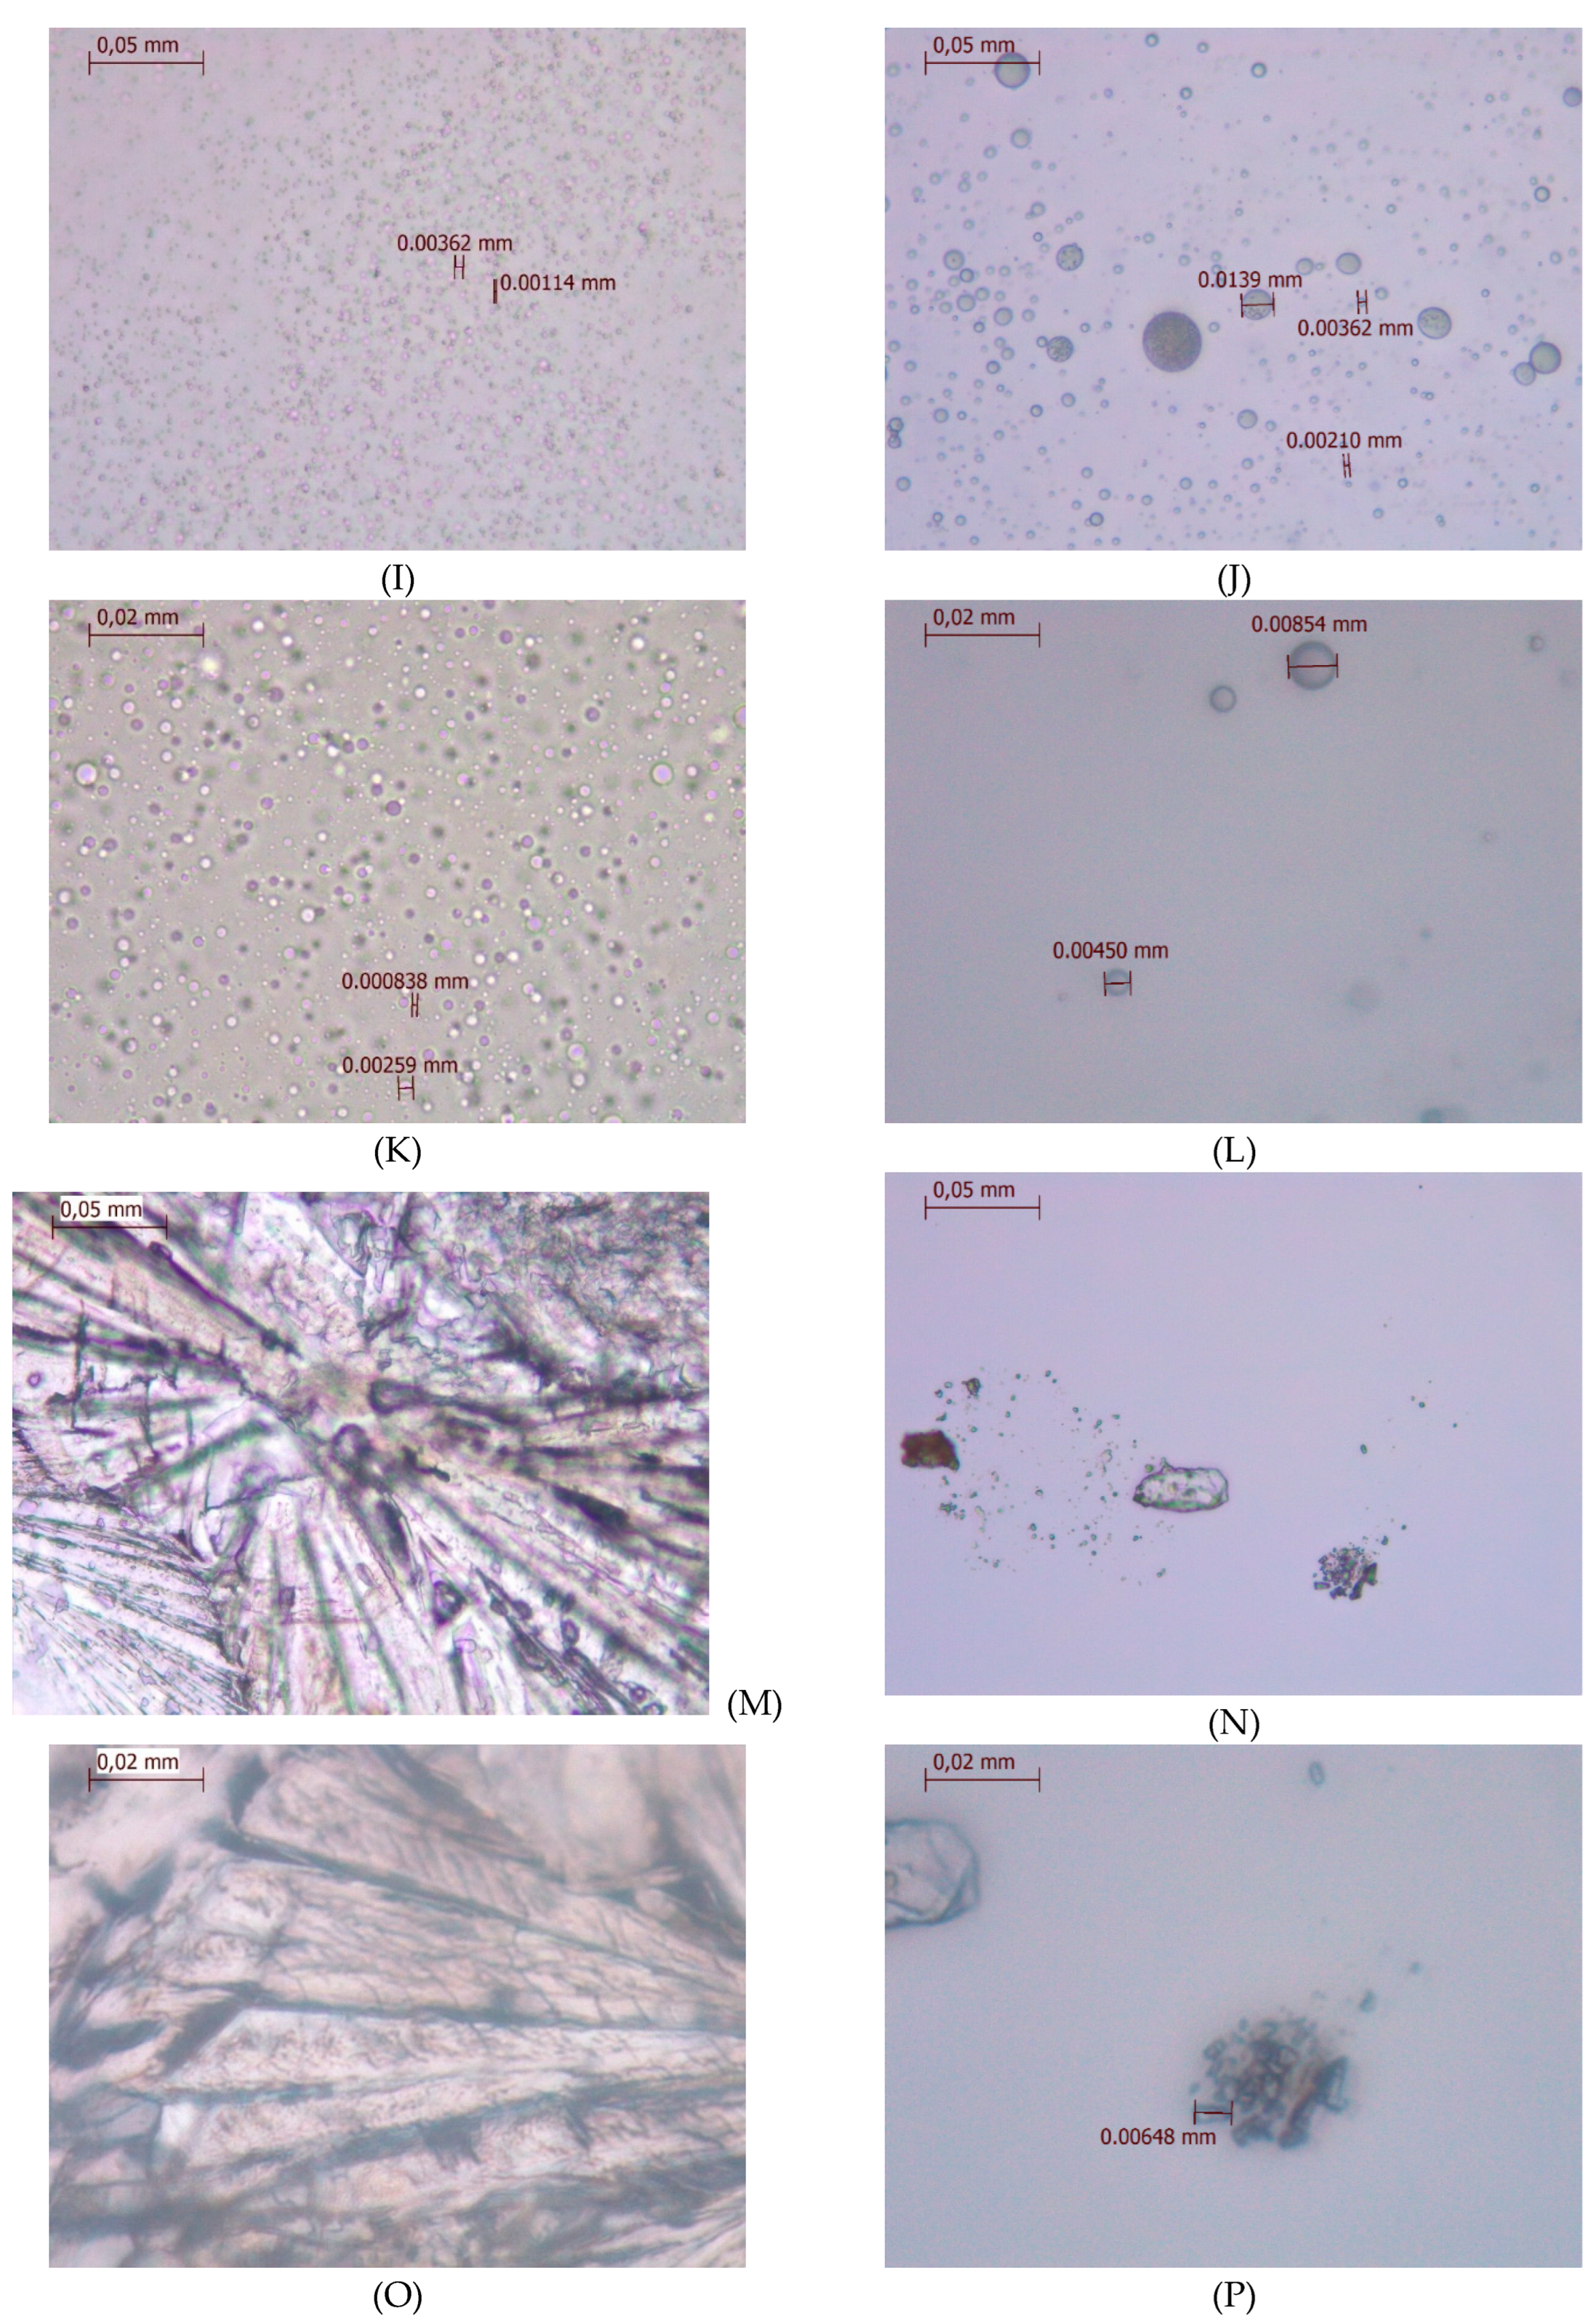
Figure 10.
Cell viability was evaluated in MeOV (a) and MeTRAV (b) PLX-R MCM cells exposed to increasing concentrations of 1 (A), 3 (B) and 4 (C) (1–100 µM) for 24, 48 and 72 h. Bar graphs summarize quantitative data of the means ± S.D. of four independent experiments (black spheres) run in triplicate. Significance refers exclusively to control (Ctr) using * symbol. Specifically, p > 0.05 no symbols; **** p < 0.0001; *** p < 0.001; p < 0.01 **; p < 0.05 * (one-way ANOVA followed by Dunnet’s multi-comparisons test). Numbers within bars at bottom indicate cell viability (%).
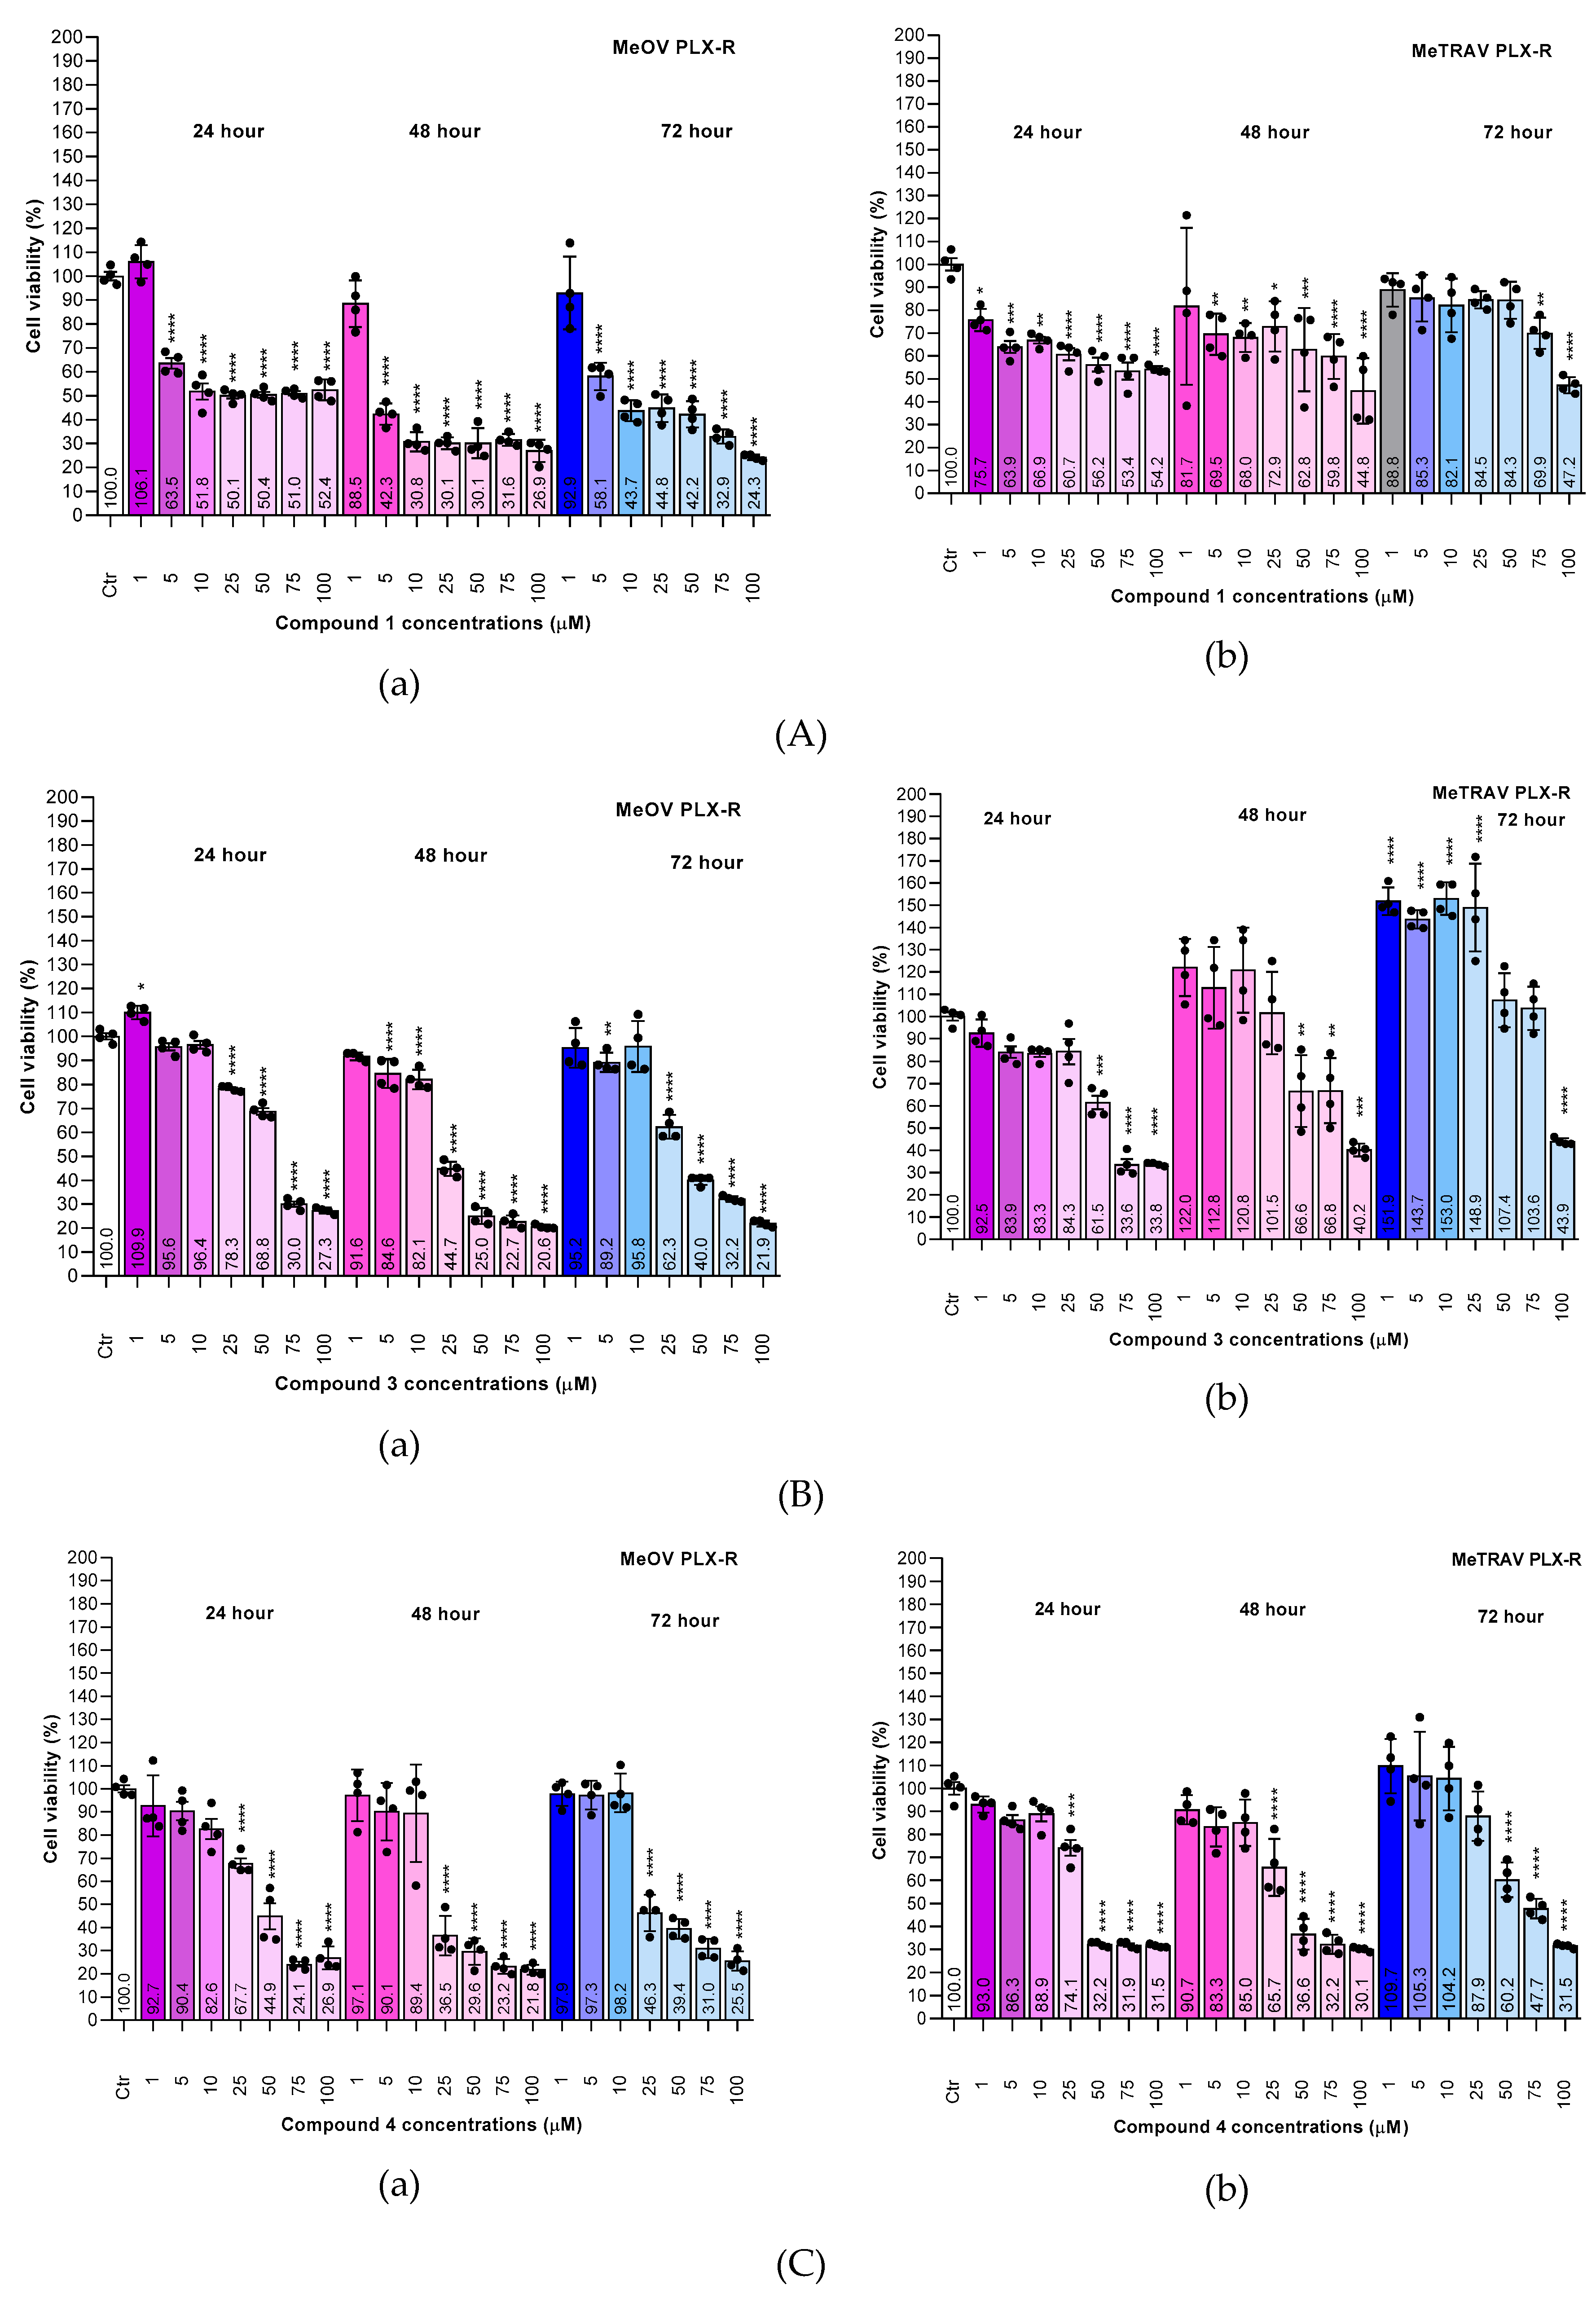
Figure 11.
Cell viability (%) was evaluated in MeOV (white bars without pattern (a) and blue line (b)) and MeTRAV (white bars with squared pattern (a) and pink line (b)) PLX-R MCM cells exposed to increasing concentrations of PLX (0.5–20 µM) for 72 h. Bar graphs summarize quantitative data of the means ± S.D. of four independent experiments (black spheres) run in triplicate. Significance refers exclusively to control (Ctr, green bar) and indicated with * symbol. Specifically, p > 0.05 no symbols; **** p < 0.0001; *** p < 0.001; p < 0.01 **; p < 0.05 * (one-way ANOVA followed by Dunnet’s multi-comparisons test). Numbers above bars indicate viable cells (%).
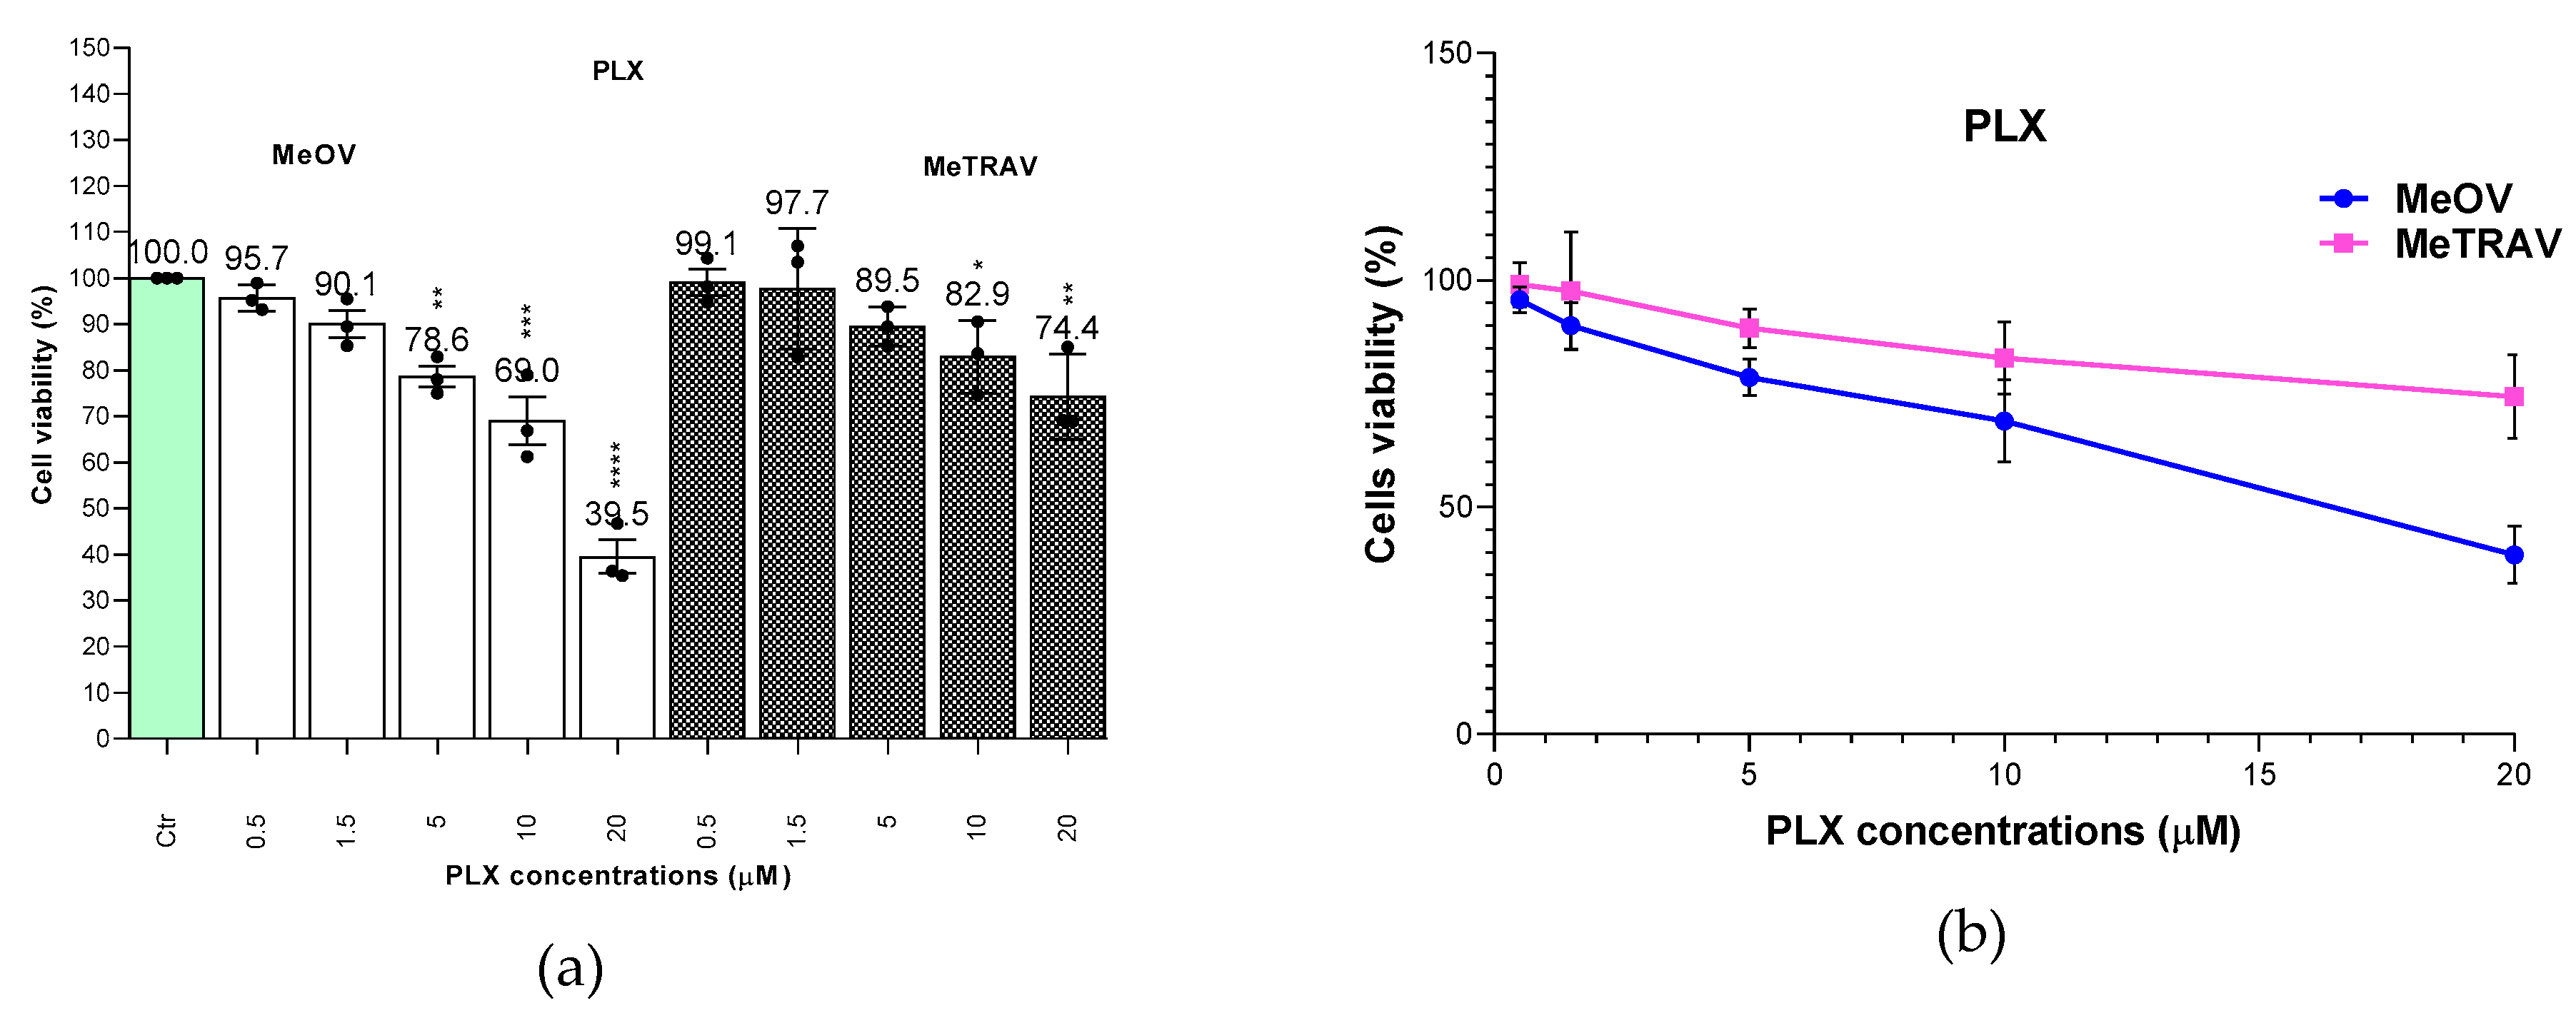
Figure 12.
Cell viability of PLX-R MeOV and MeTRAV cells following treatment with compounds 1, 3, 4 and PLX. MeOV (withe bars) and MeTRAV (grey bars) cells were exposed for 72 h to PLX (0.5, 1.5, 5, 10 and 20 µM white bars) or to compounds 1 (green bars), 3 (pink bars) and 4 (yellow bars) at concentrations of 1, 5, 10, 25, 50, 75 and 100 µM. Bar graphs summarize quantitative data of the means ± S.D. of four independent experiments (black spheres) run in triplicate. Numbers above bars indicate viable cells (%).
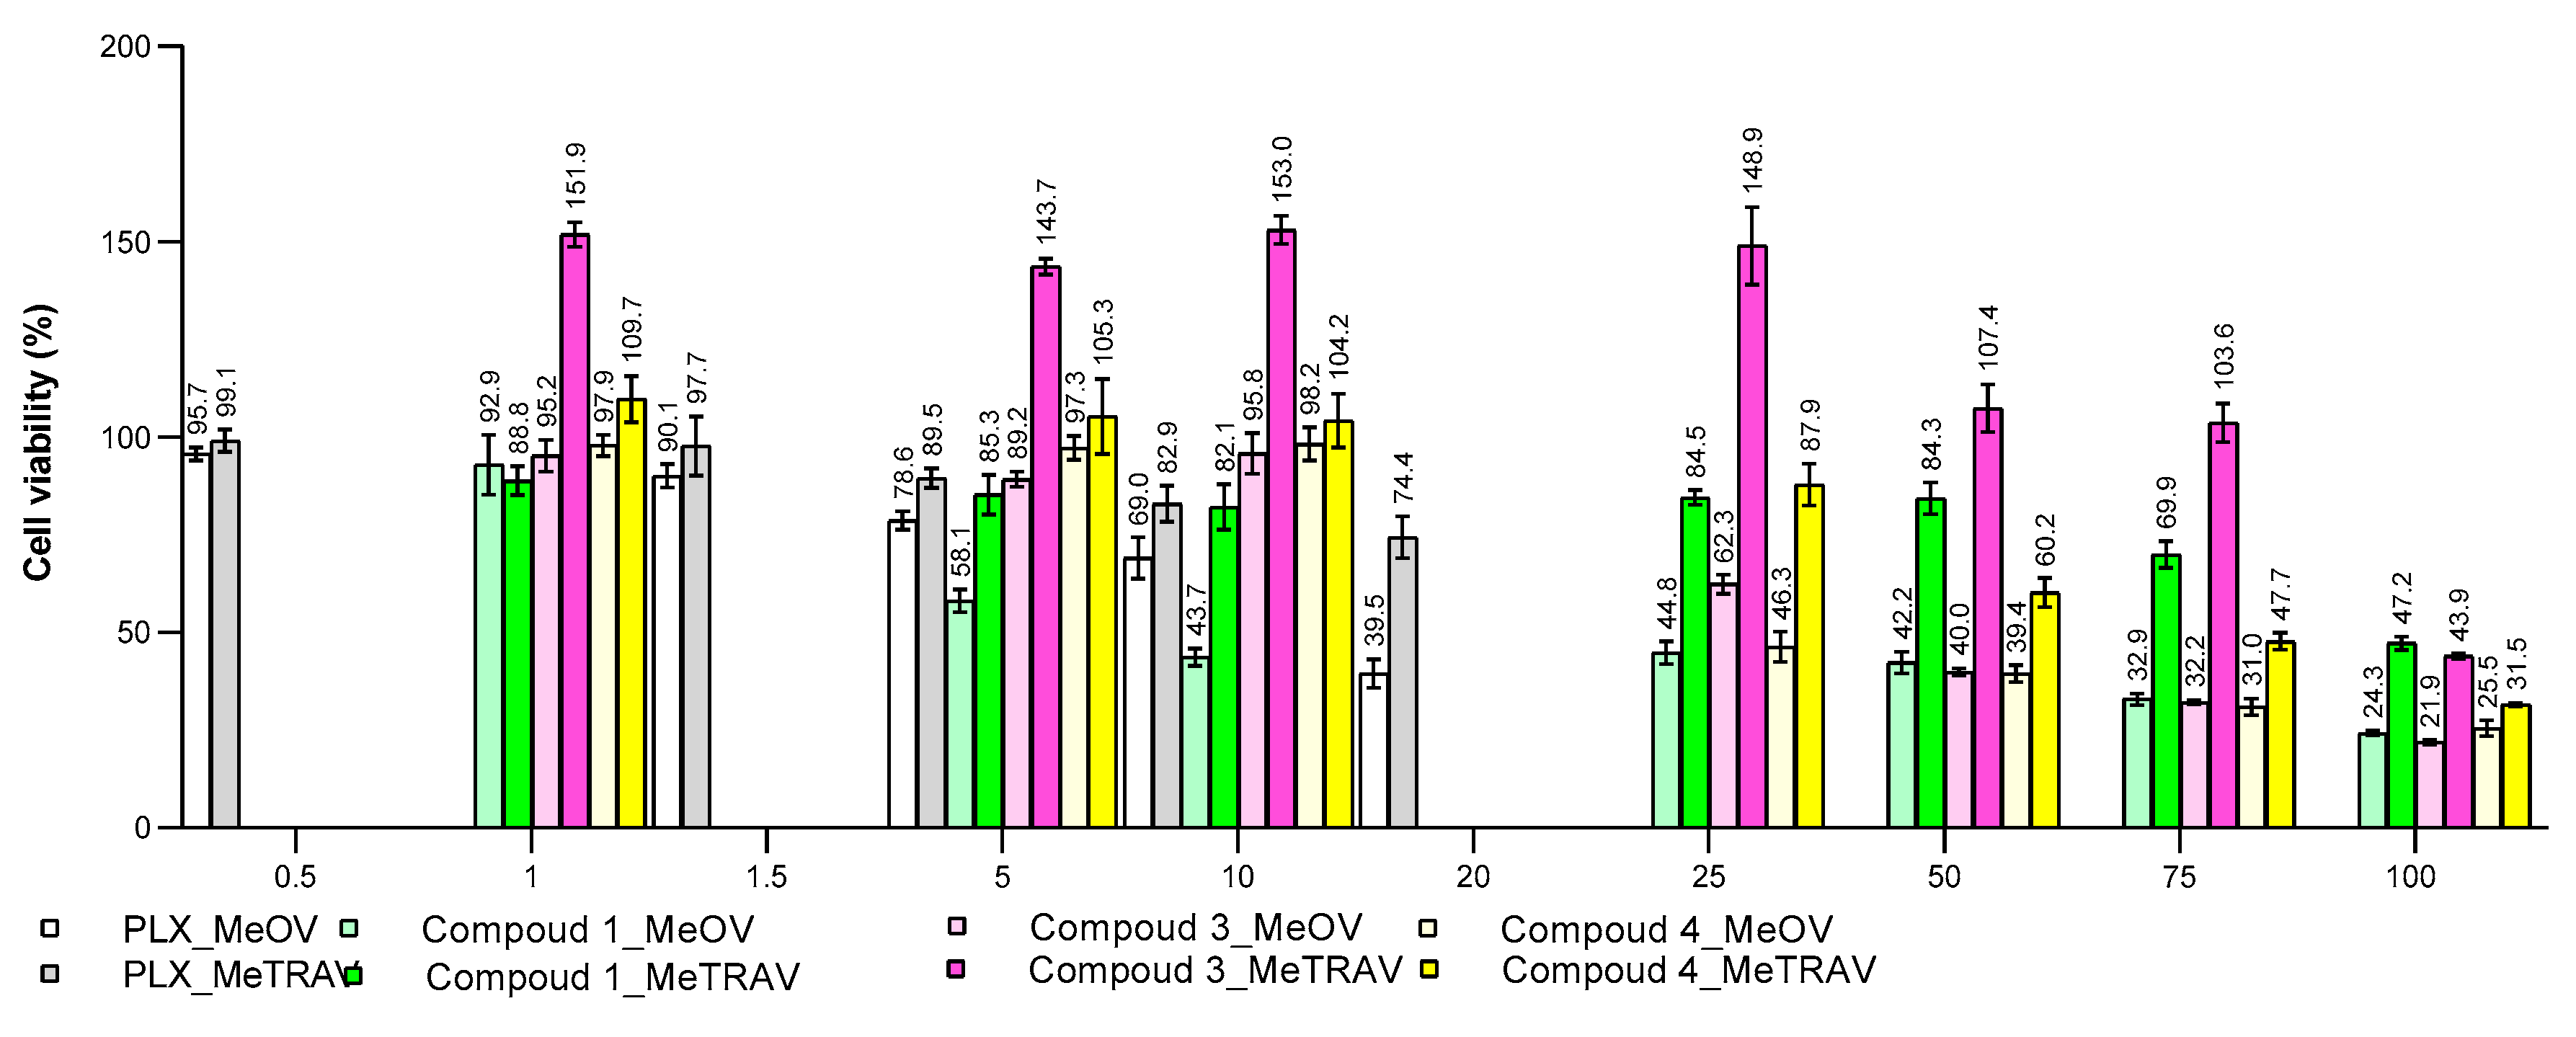
Figure 13.
Cell viability was evaluated in HTLA 230 (a) and HTLA ER (b) neuroblastoma cells exposed for 24, 48 and 72 h to increasing concentrations (1–100 µM) of 1 (A), 3 (B) and 4 (C). Bar graphs summarize quantitative data of the means ± S.D. of four independent experiments (black spheres) run in triplicate. Significance refers exclusively to control (Ctr, white bars) and has been indicated using * symbol. Specifically, p > 0.05 no symbols; **** p < 0.0001; *** p < 0.001; p < 0.01 **; p < 0.05 * (one-way ANOVA followed by Dunnet’s multi-comparisons test). Numbers within bars at bottom indicate viable cells (%).
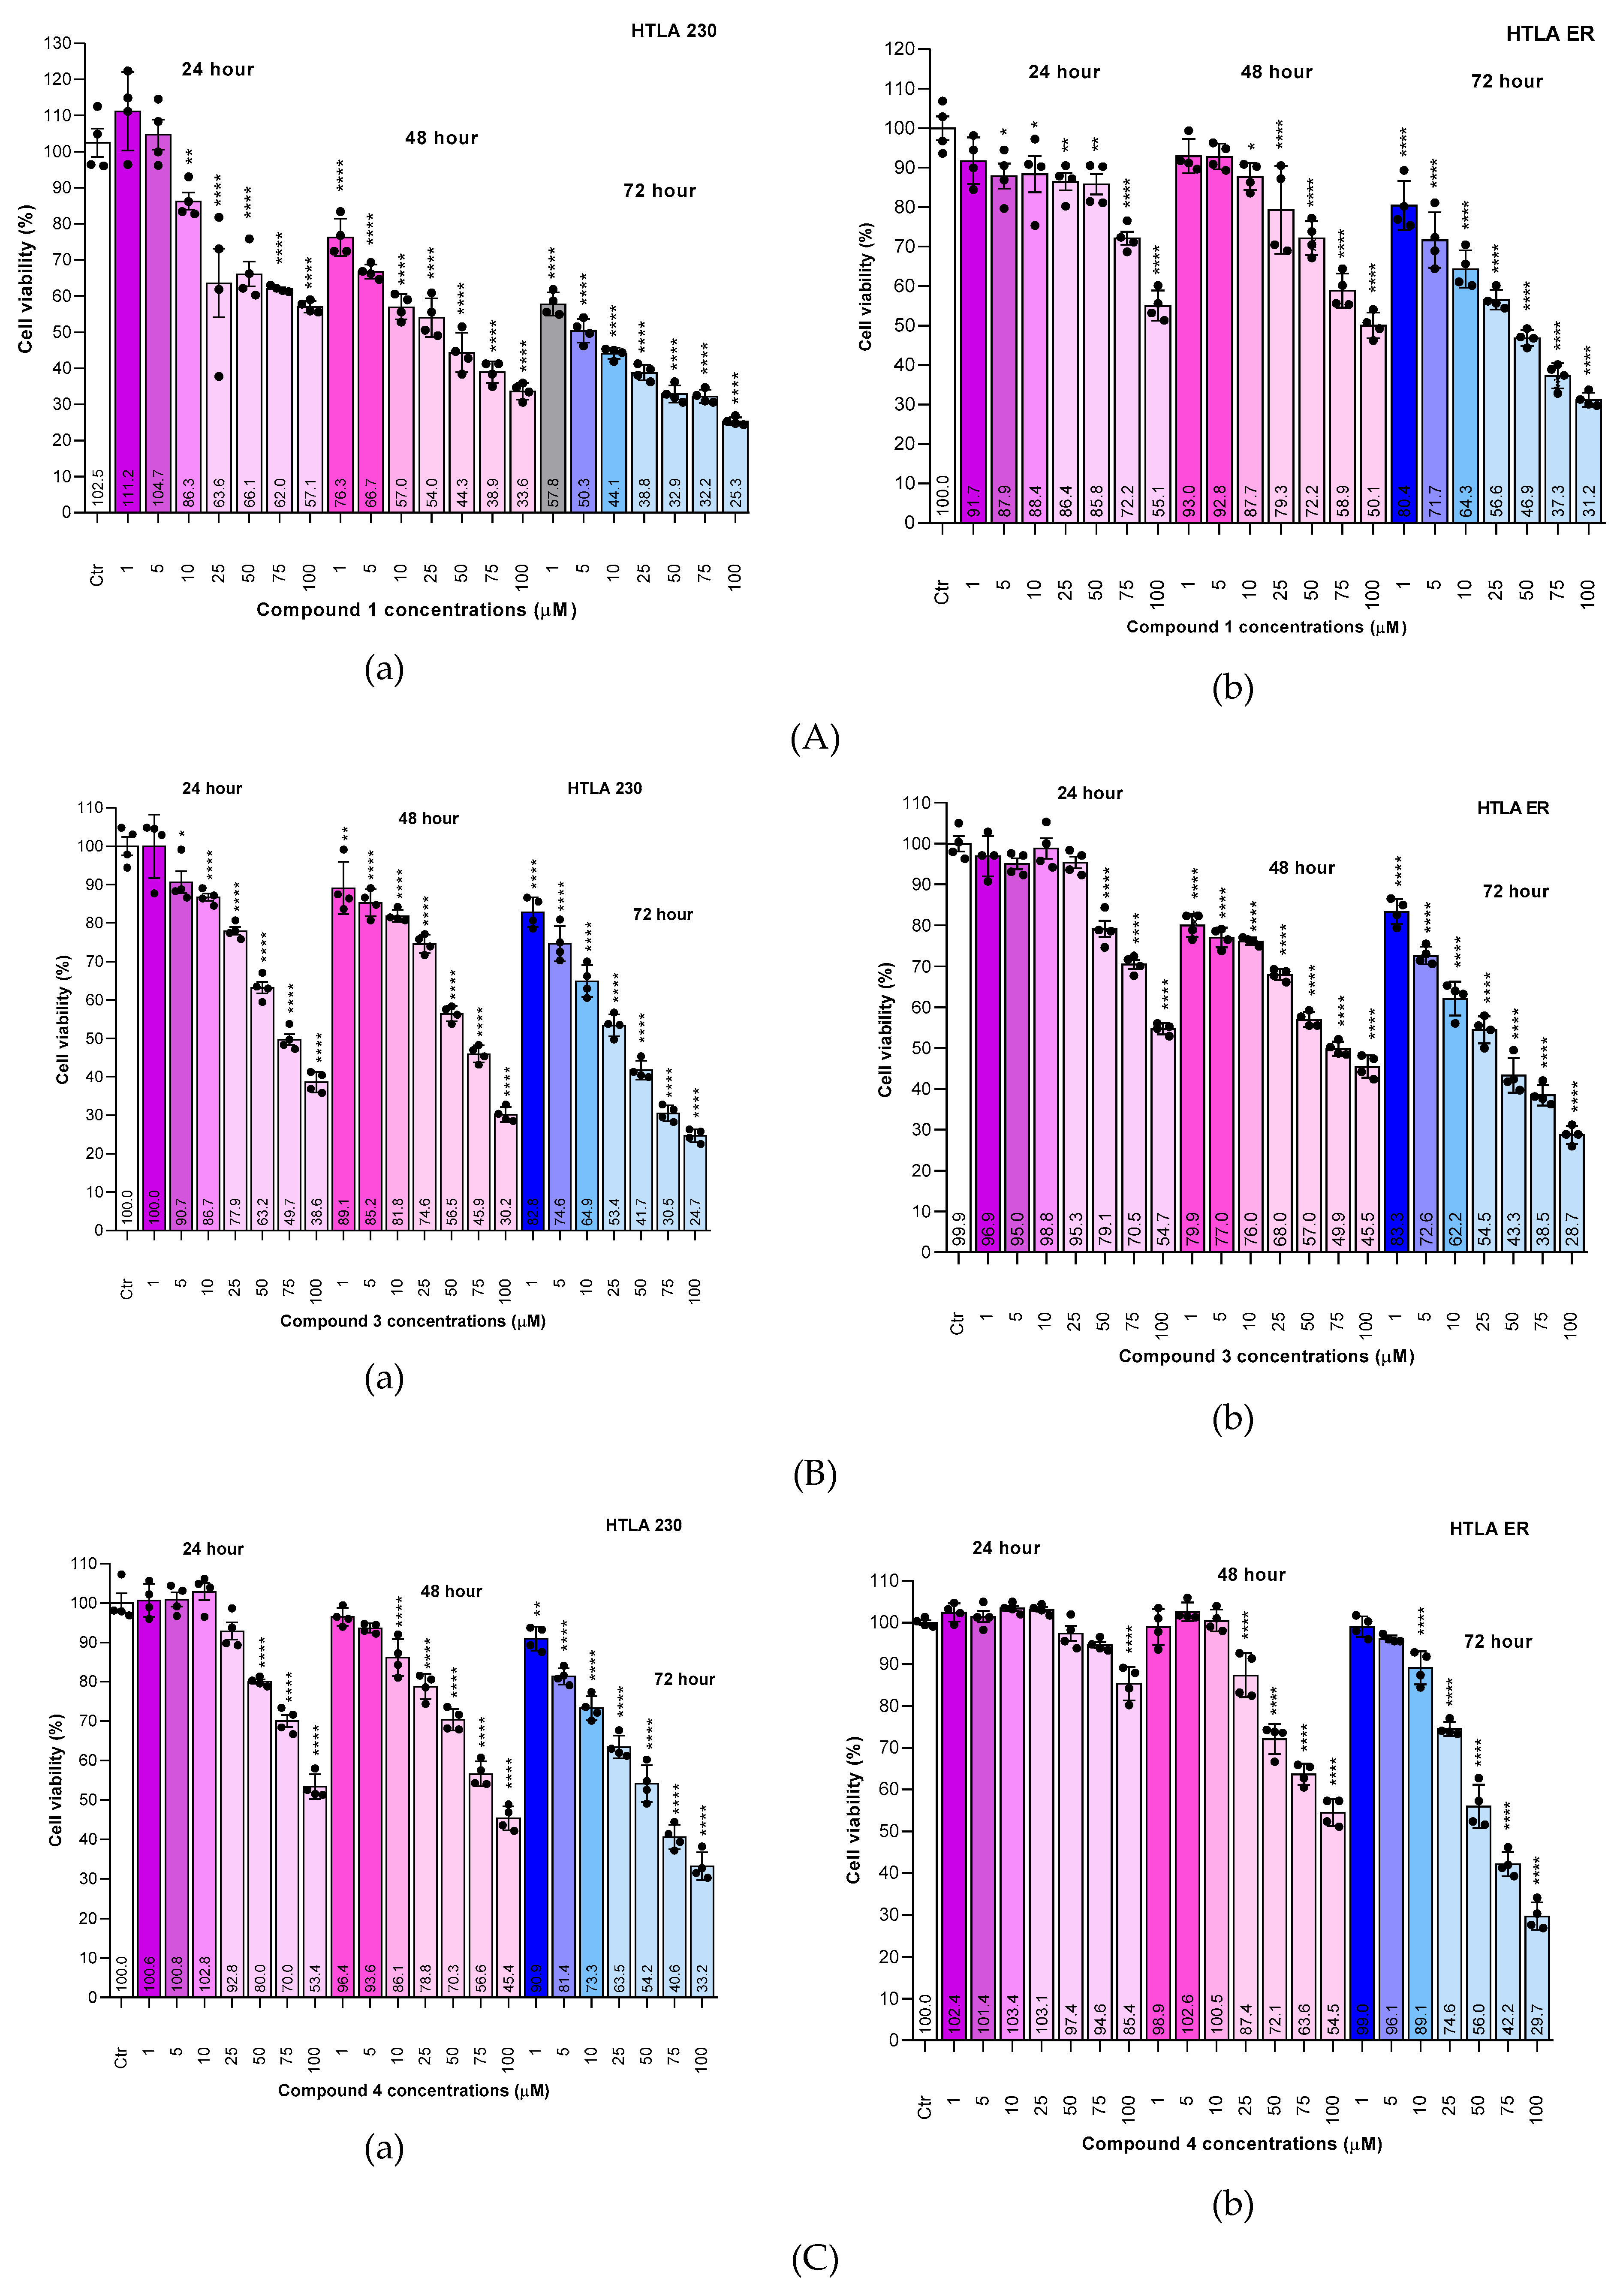
Figure 14.
Cell viability of HTLA 230 (white bars without pattern (a) and blue line (b)) and HTLA ER (white bars with squared pattern (a) and green line (b)) after 24 h exposure to increasing concentrations of ETO (1.25–100 µM). Cell viability of cells observed at 0 µM concentration was assumed as the control (Ctr, green bar). Bar graphs summarize quantitative data of the means ± S.D. of four independent experiments (black spheres) run in triplicate. Significance refers exclusively to control (Ctr) and was reported using * symbol. Specifically, p > 0.05 no symbols; **** p < 0.0001; *** p < 0.001; p < 0.01 **; p < 0.05 * (one-way ANOVA followed by Dunnet’s multi-comparisons test). Numbers above bars indicate viable cells (%).
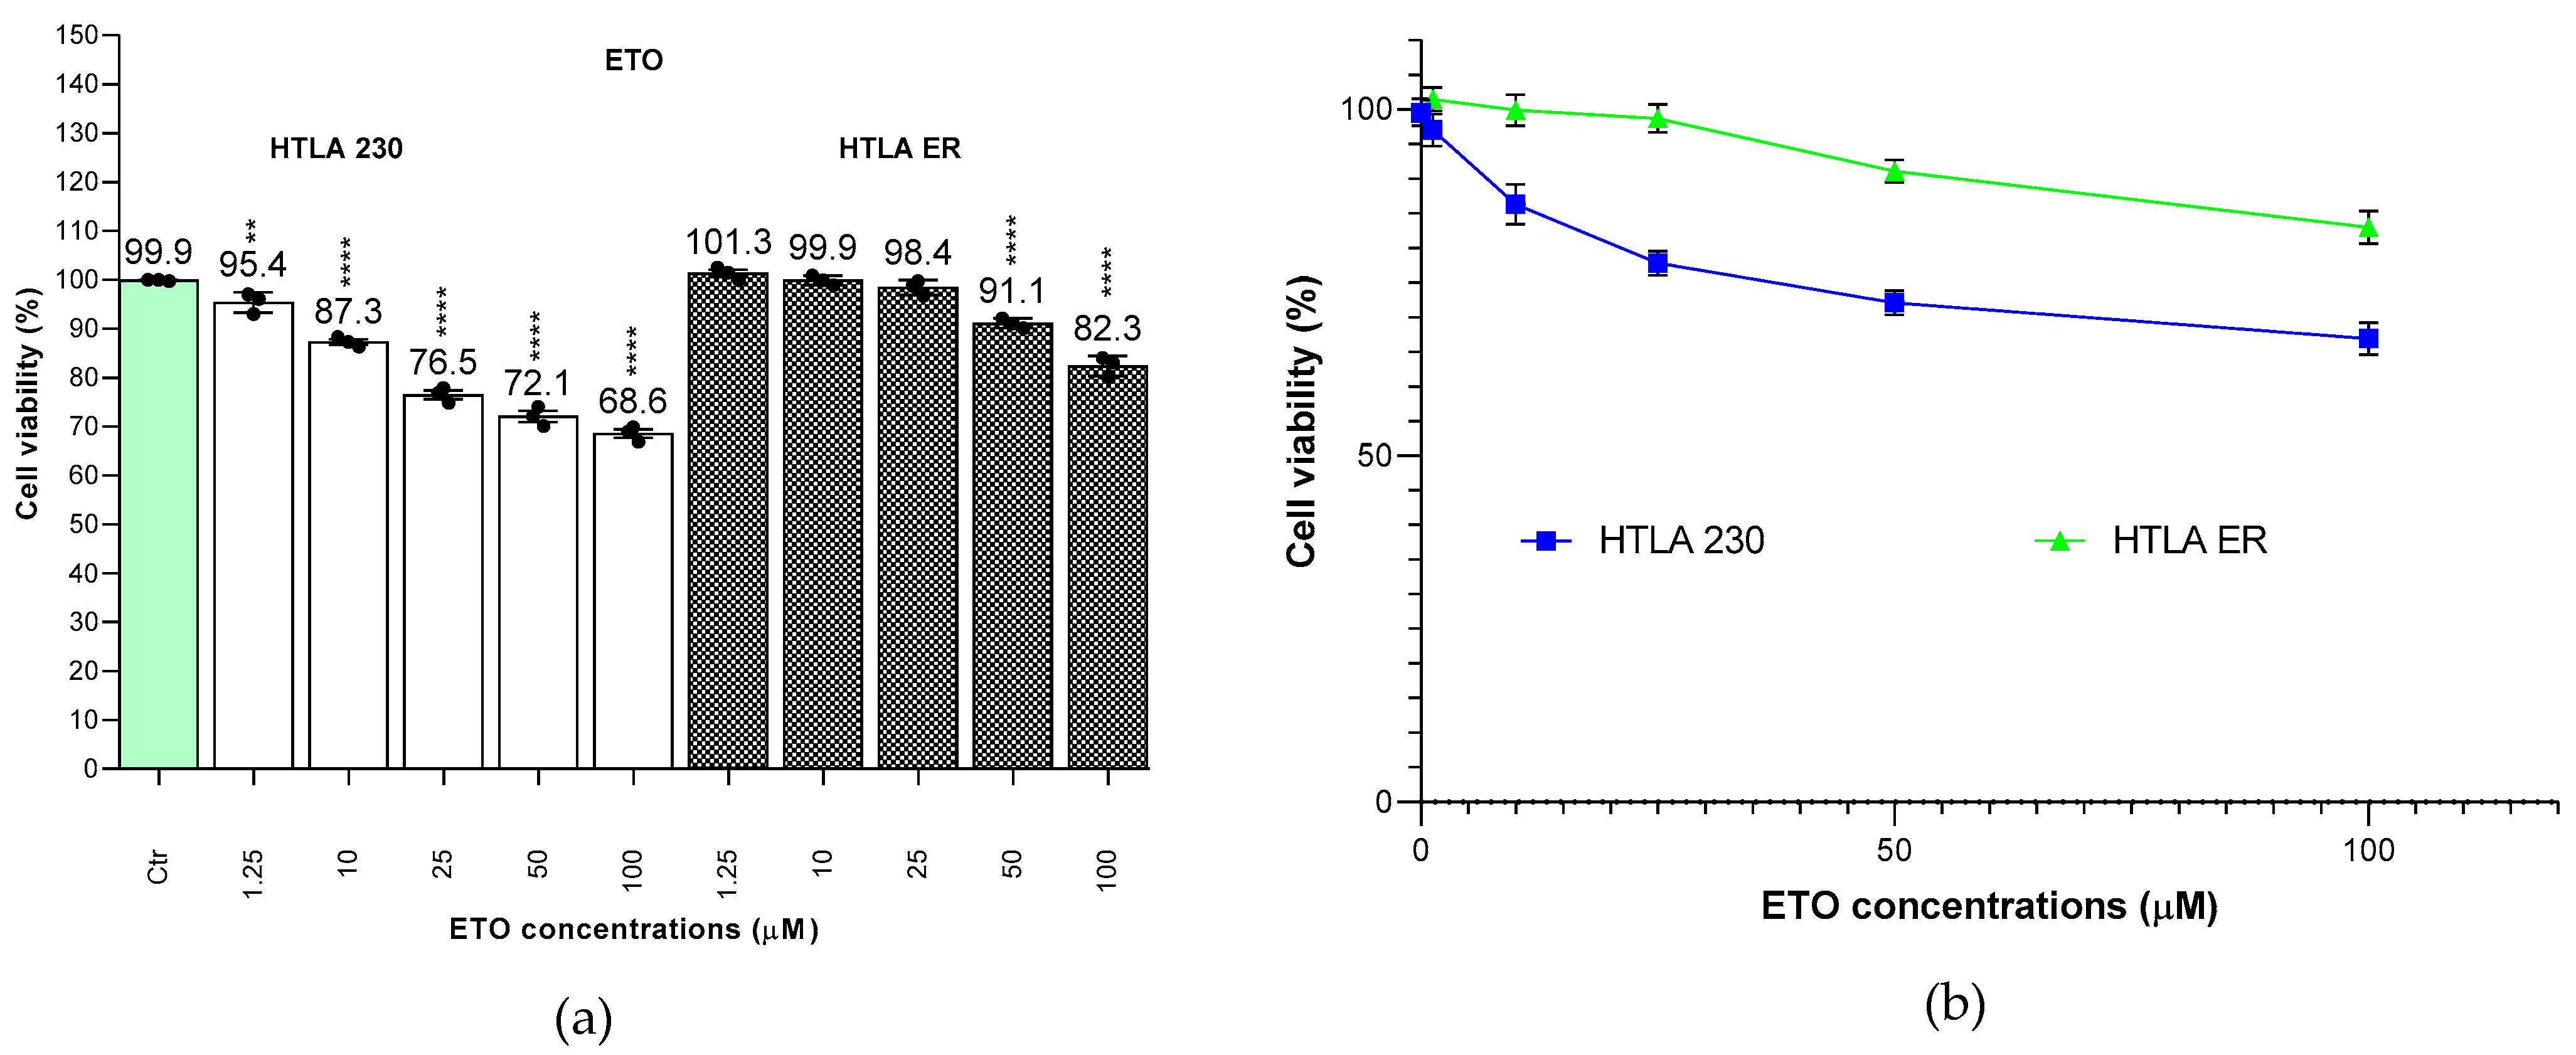
Figure 15.
Cell viability was evaluated in HTLA 230 (bars in softer colours or withe) and HTLA ER (bars in darker colours or grey) NB cells, at 24 hours of exposure to 1.25-100.0 µM ETO and to 1.0-100.0 µM concentrations of 1 (green), 3 (pink) and 4 (yellow bars). Bar graphs summarize quantitative data of the means ± S.D. of four independent experiments, run in triplicate. Numbers above bars indicate viable cells (%).
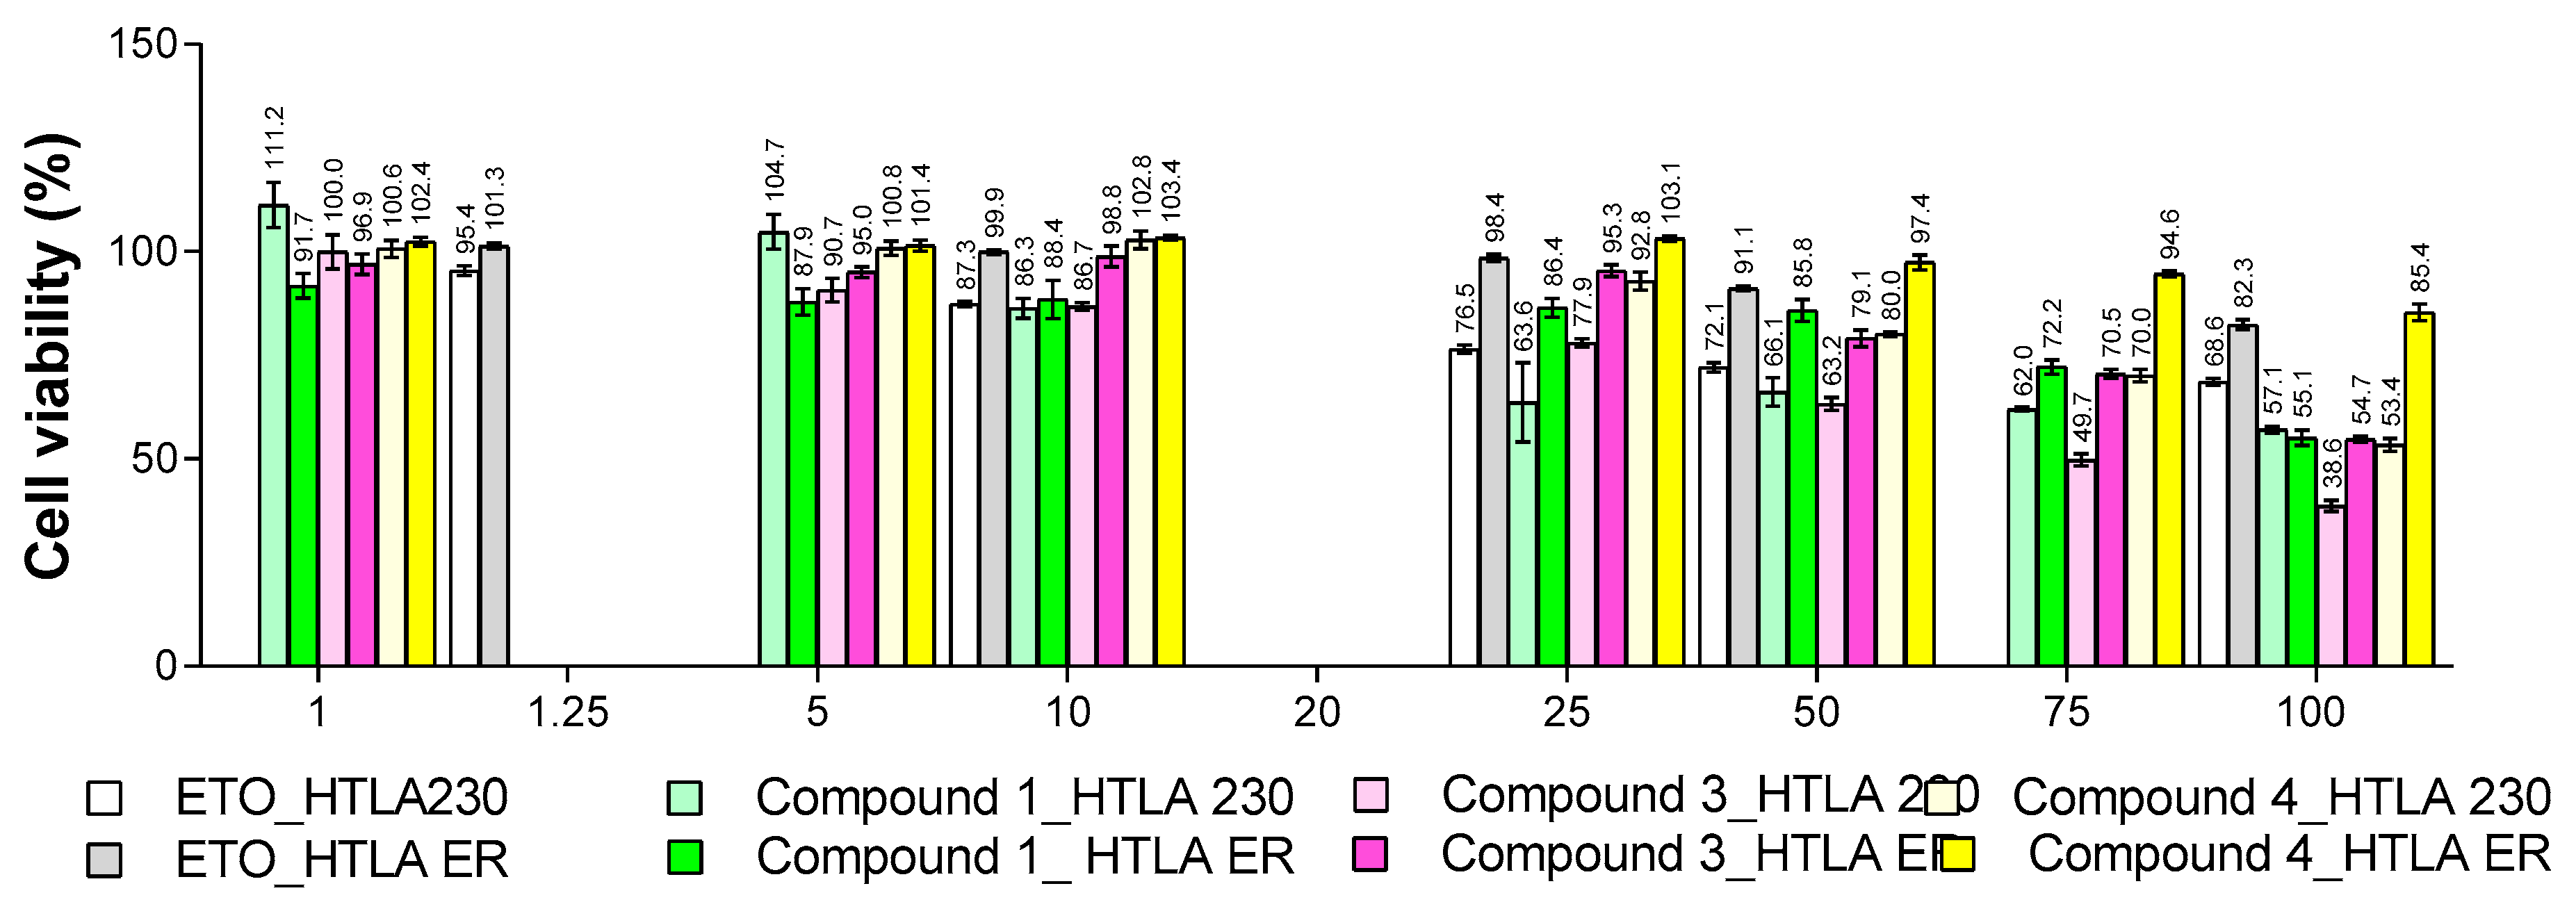
Figure 16.
Dispersion graphs of cell viability of HTLA 230 and HTLA ER NB cells exposed to 1.25, 25, 50 and 100.0 µM concentrations of ETO (sky-blue and green lines with square and round indicators, respectively) and to 1, 5, 10, 25, 50, 75 and 100 µM concentrations of 1, 3 and 4 (all other thinner lines without indicators) for 24 h.
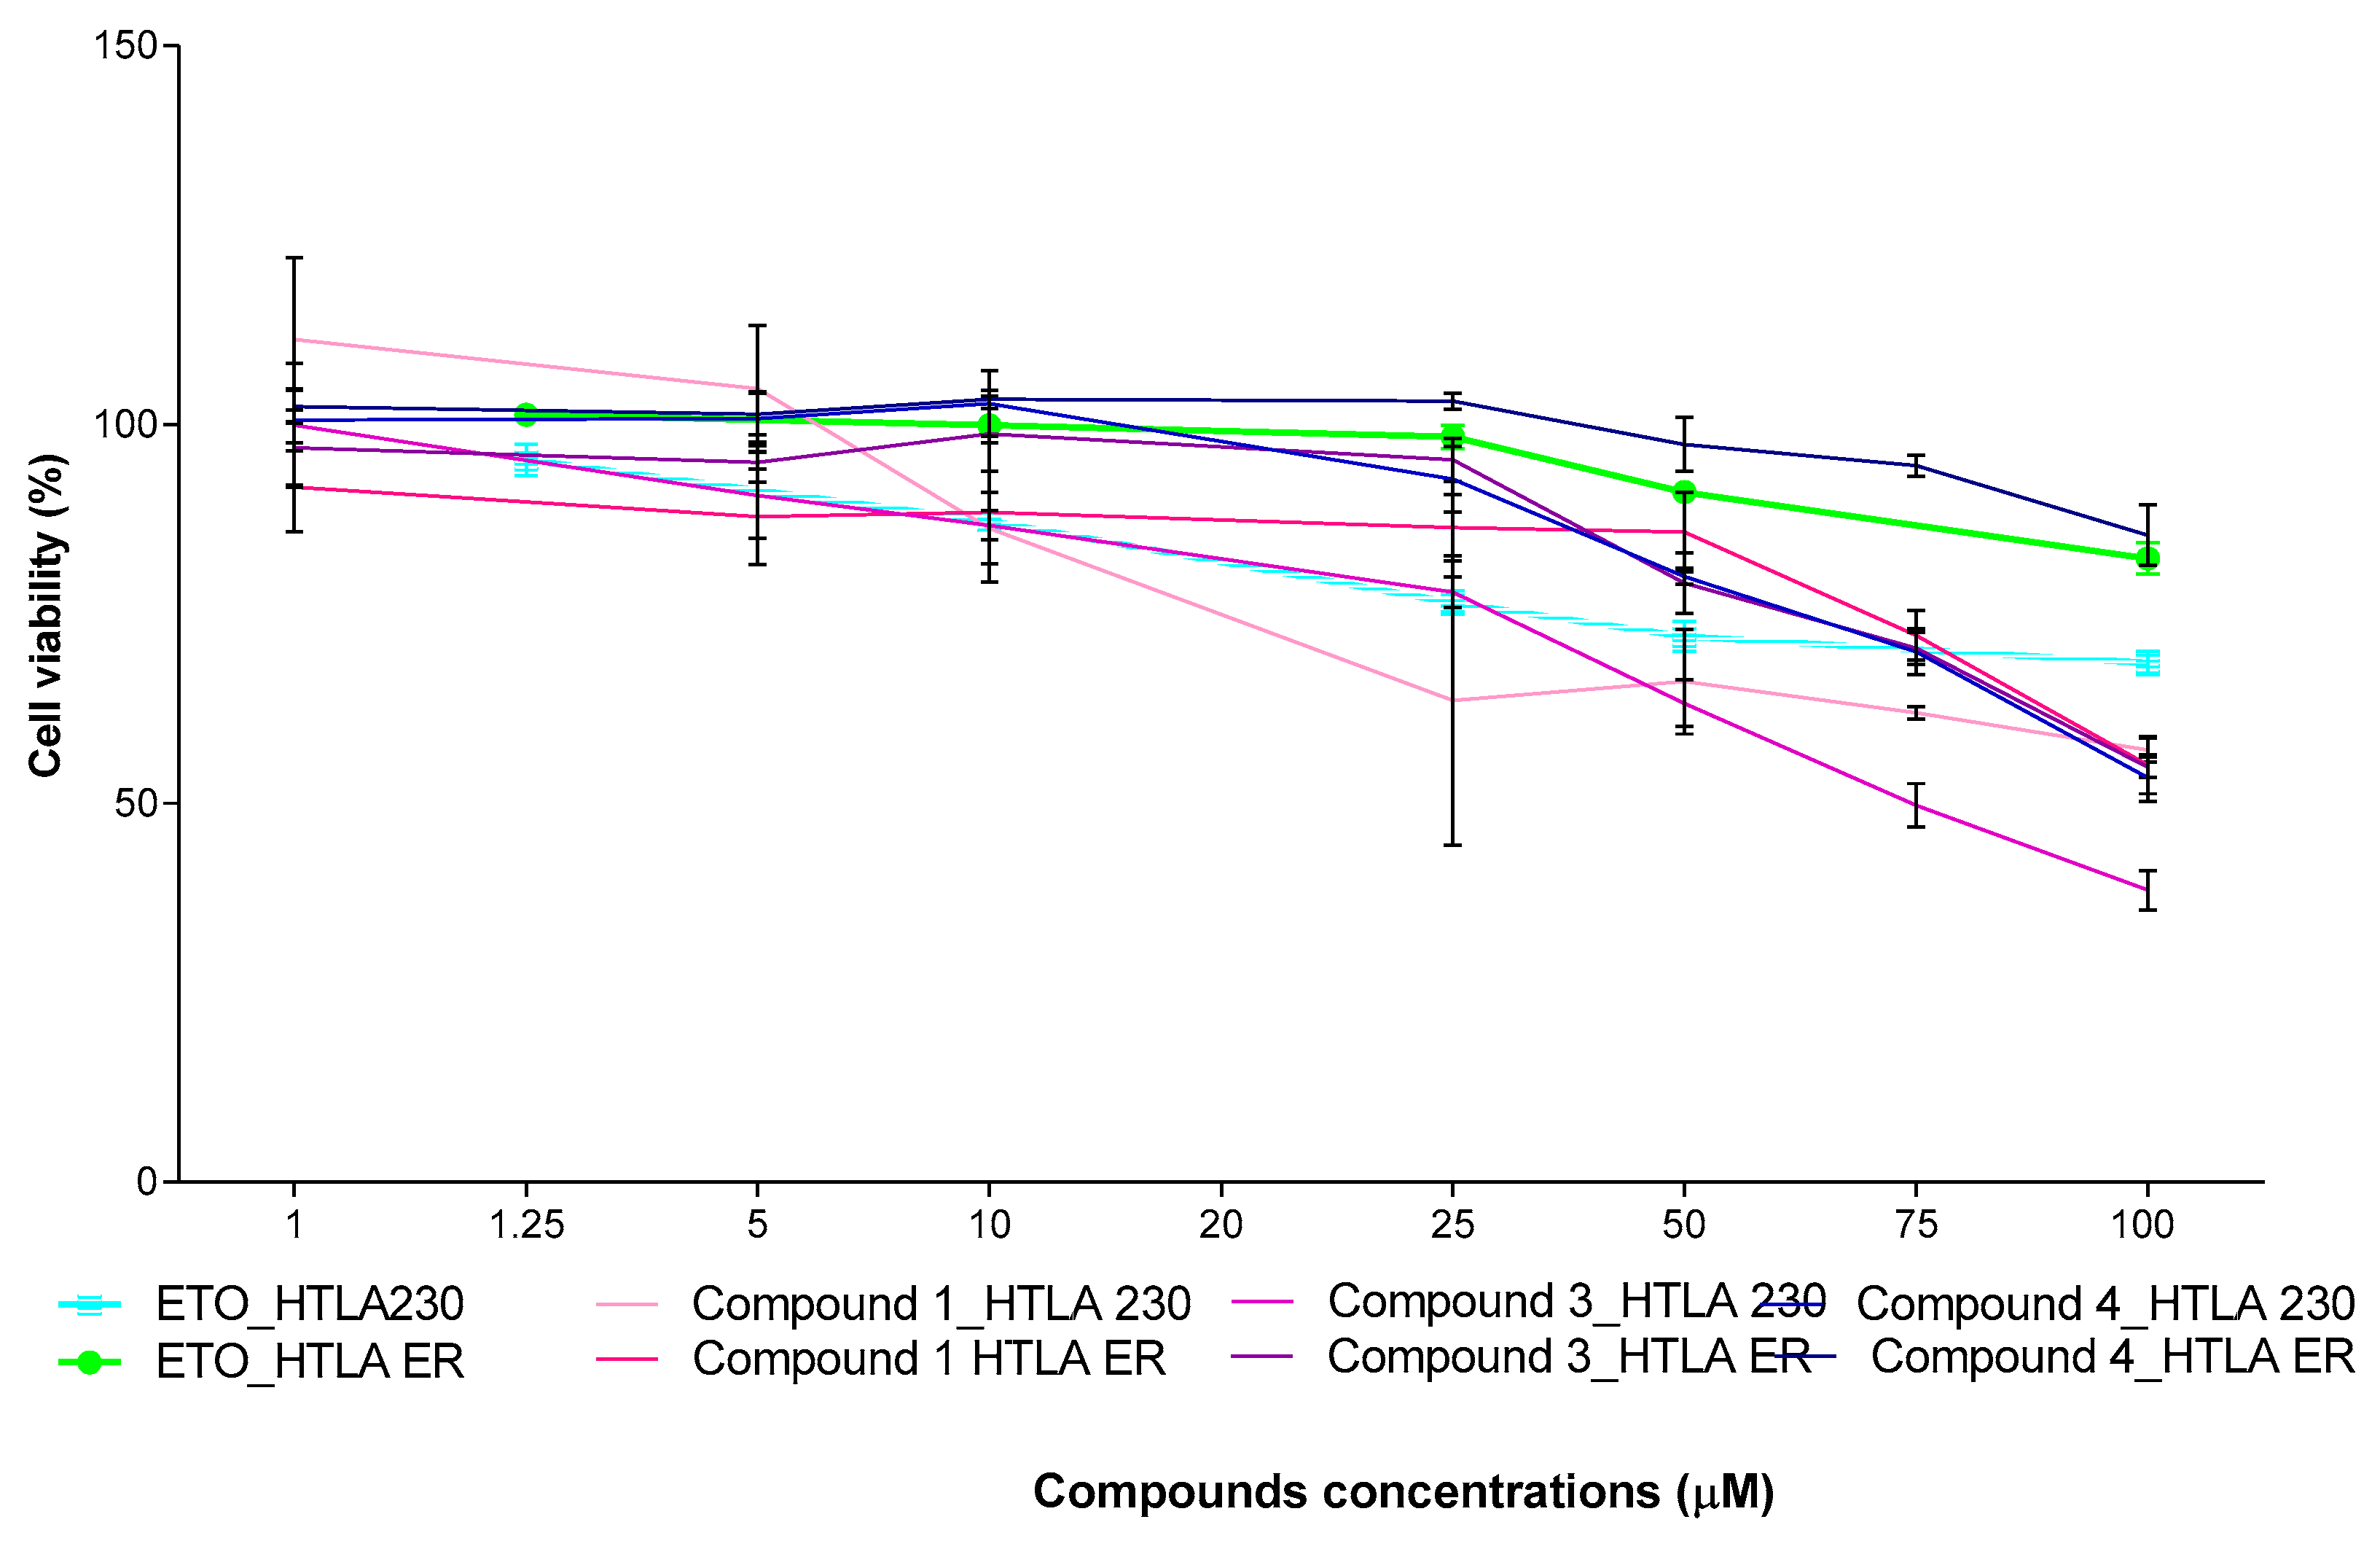
Figure 17.
Haemolytic activity and red blood cell viability following treatment with compounds 1, 3 and 4. Haemolytic ratio percentage (%) (a, b) and RBCs viability (%) (c, d) are shown as bar graph (a, c) and as corresponding dispersion graphs (b, d). Haemolysis (%) was determined by a recently reported protocol slightly modified[64]. Untreated RBCs were used as controls (Ctr, white bars). Cells were exposed to increasing concentrations (0.5-100.0 µM) of compounds 1, 3 and 4. Experimental data are expressed as the mean ± S.D. of the data obtained on blood from six healthy donors. Significance is indicated exclusively vs. control (Ctr) as follows: no symbols p > 0.05 and * p < 0.1, *** p < 0.001 and **** p < 0.0001 (one-way ANOVA followed by Dunnet multi-comparisons test). In dispersion graphs sample 1 is represented by blue lines, 3 by pink lines and 4 by green lines.
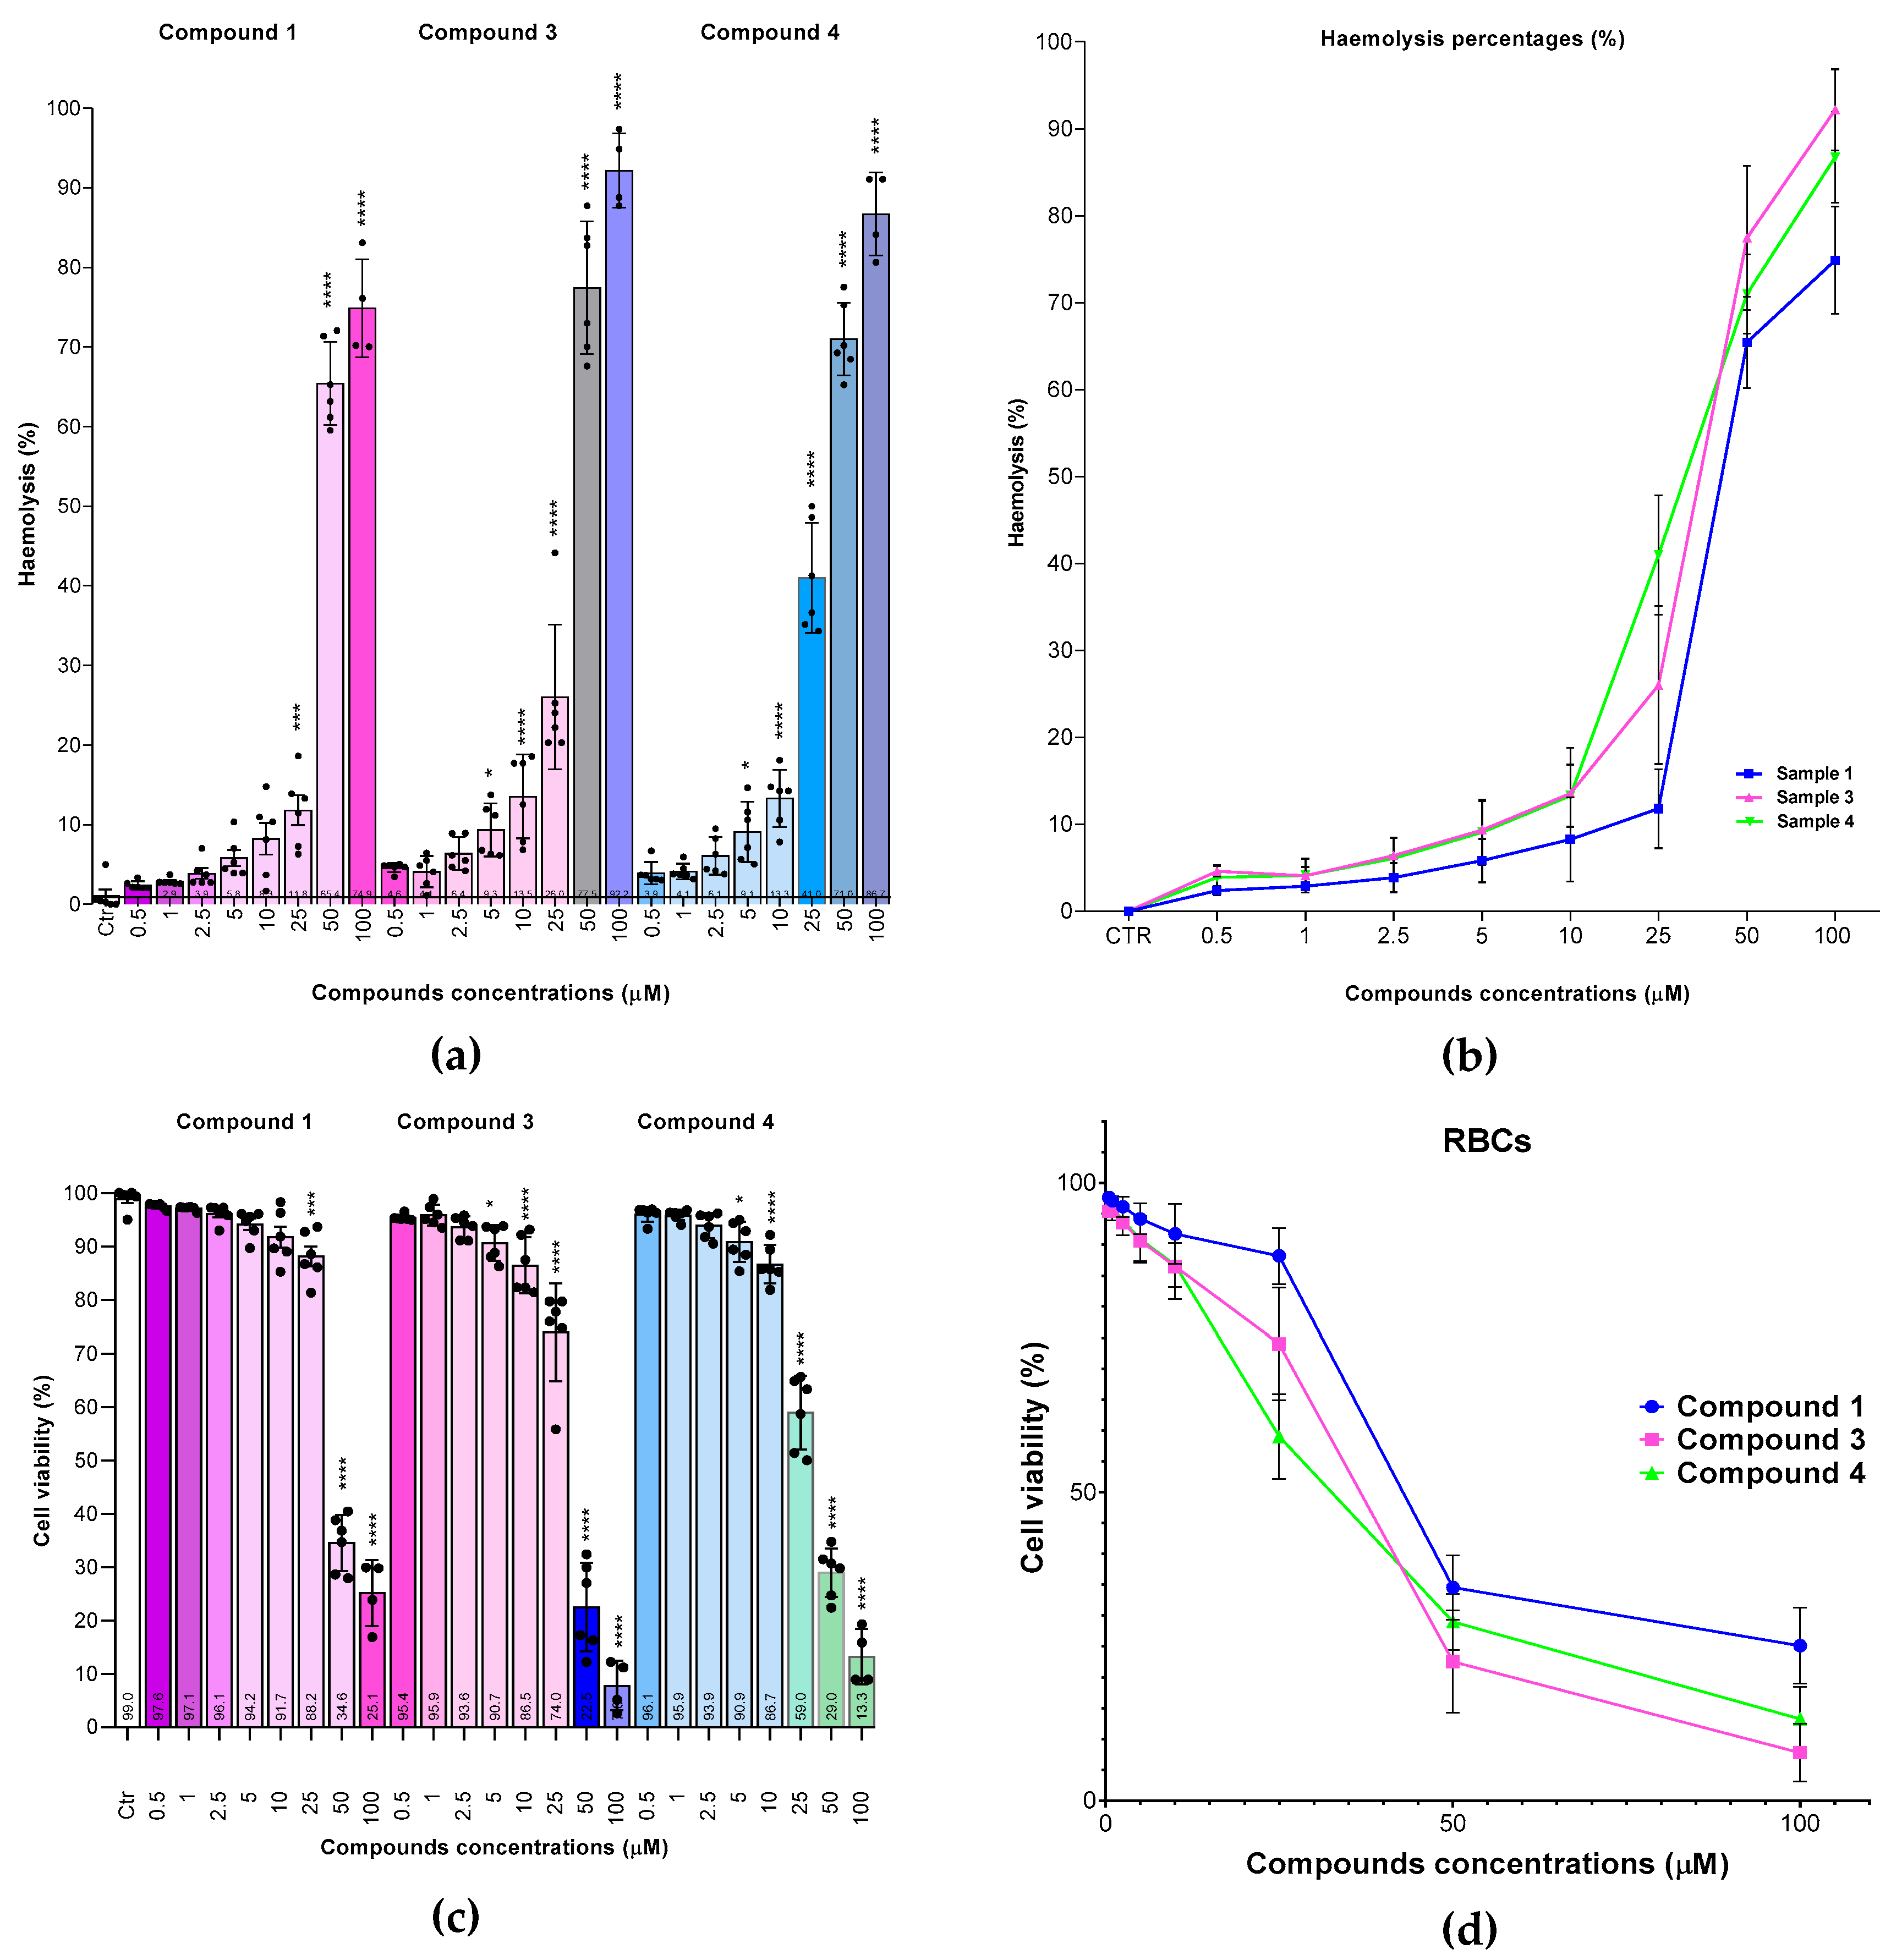
Figure 18.
Cell viability (%) was evaluated in RBCs (white to light-grey bars group), MeOV (green bars group) and MeTRAV (pink bars group) MCM cells, as well as in HTLA 230 (soft blue bars group) and HTLA ER (violet bars group) NB cells exposed to 10, 25 and 50 µM concentrations of 1 (first bar in all groups), 3 (second bar in all groups) and 4 (third bar in all groups). Each bar summarizes quantitative data of the means ± S.D. of independent experiments (black spheres) run in triplicate. Numbers at bottom within the bars indicate viable cells (%).
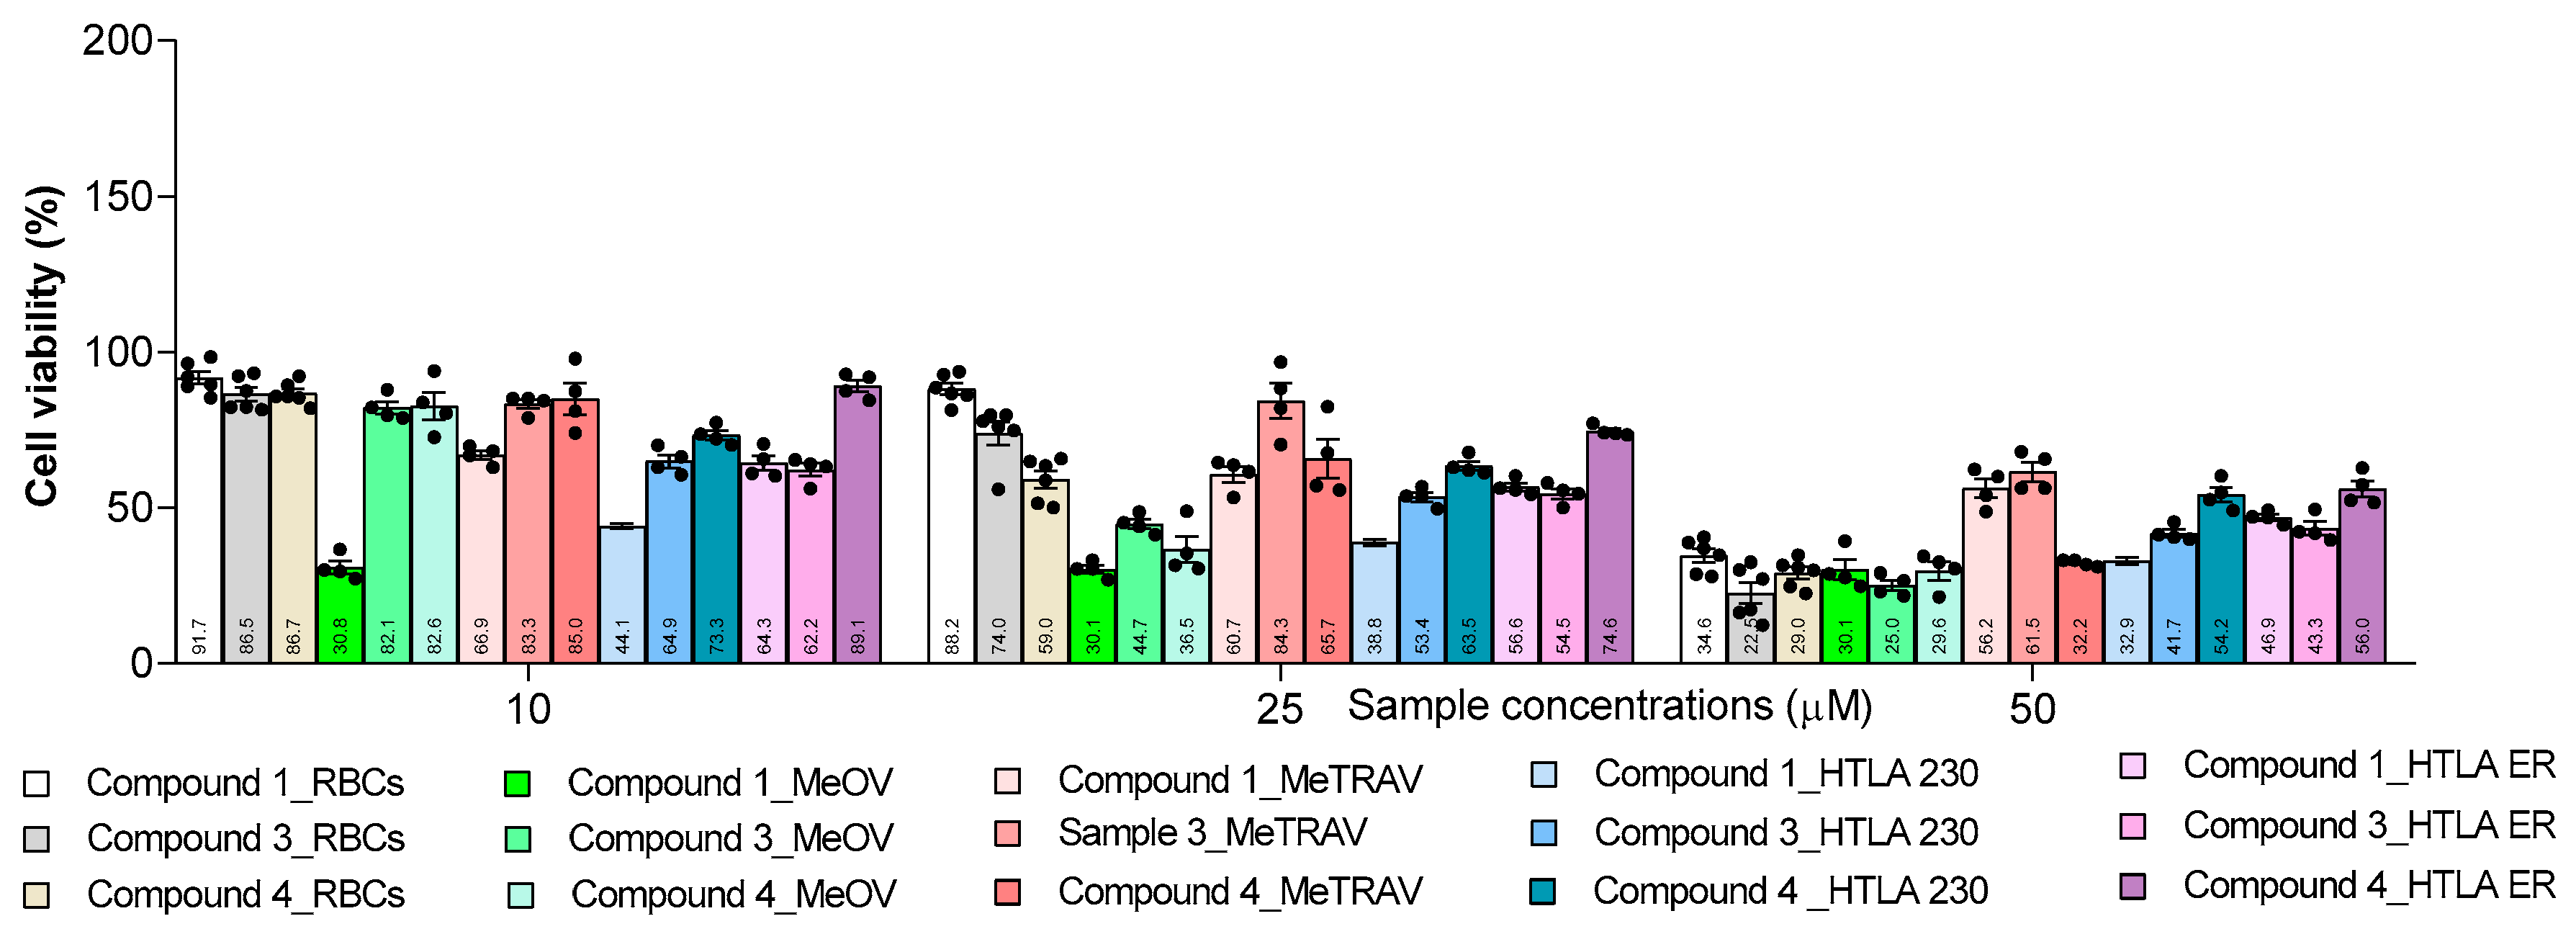
Figure 19.
Comparison between the HC50 values of compounds 1, 3 and 4 vs. RBCs and their IC50 values vs. all cancer cells, obtained considering the more efficient treatment in terms of exposure time and cytotoxic effects. Numbers above bars indicate the IC50 values.
Figure 19.
Comparison between the HC50 values of compounds 1, 3 and 4 vs. RBCs and their IC50 values vs. all cancer cells, obtained considering the more efficient treatment in terms of exposure time and cytotoxic effects. Numbers above bars indicate the IC50 values.
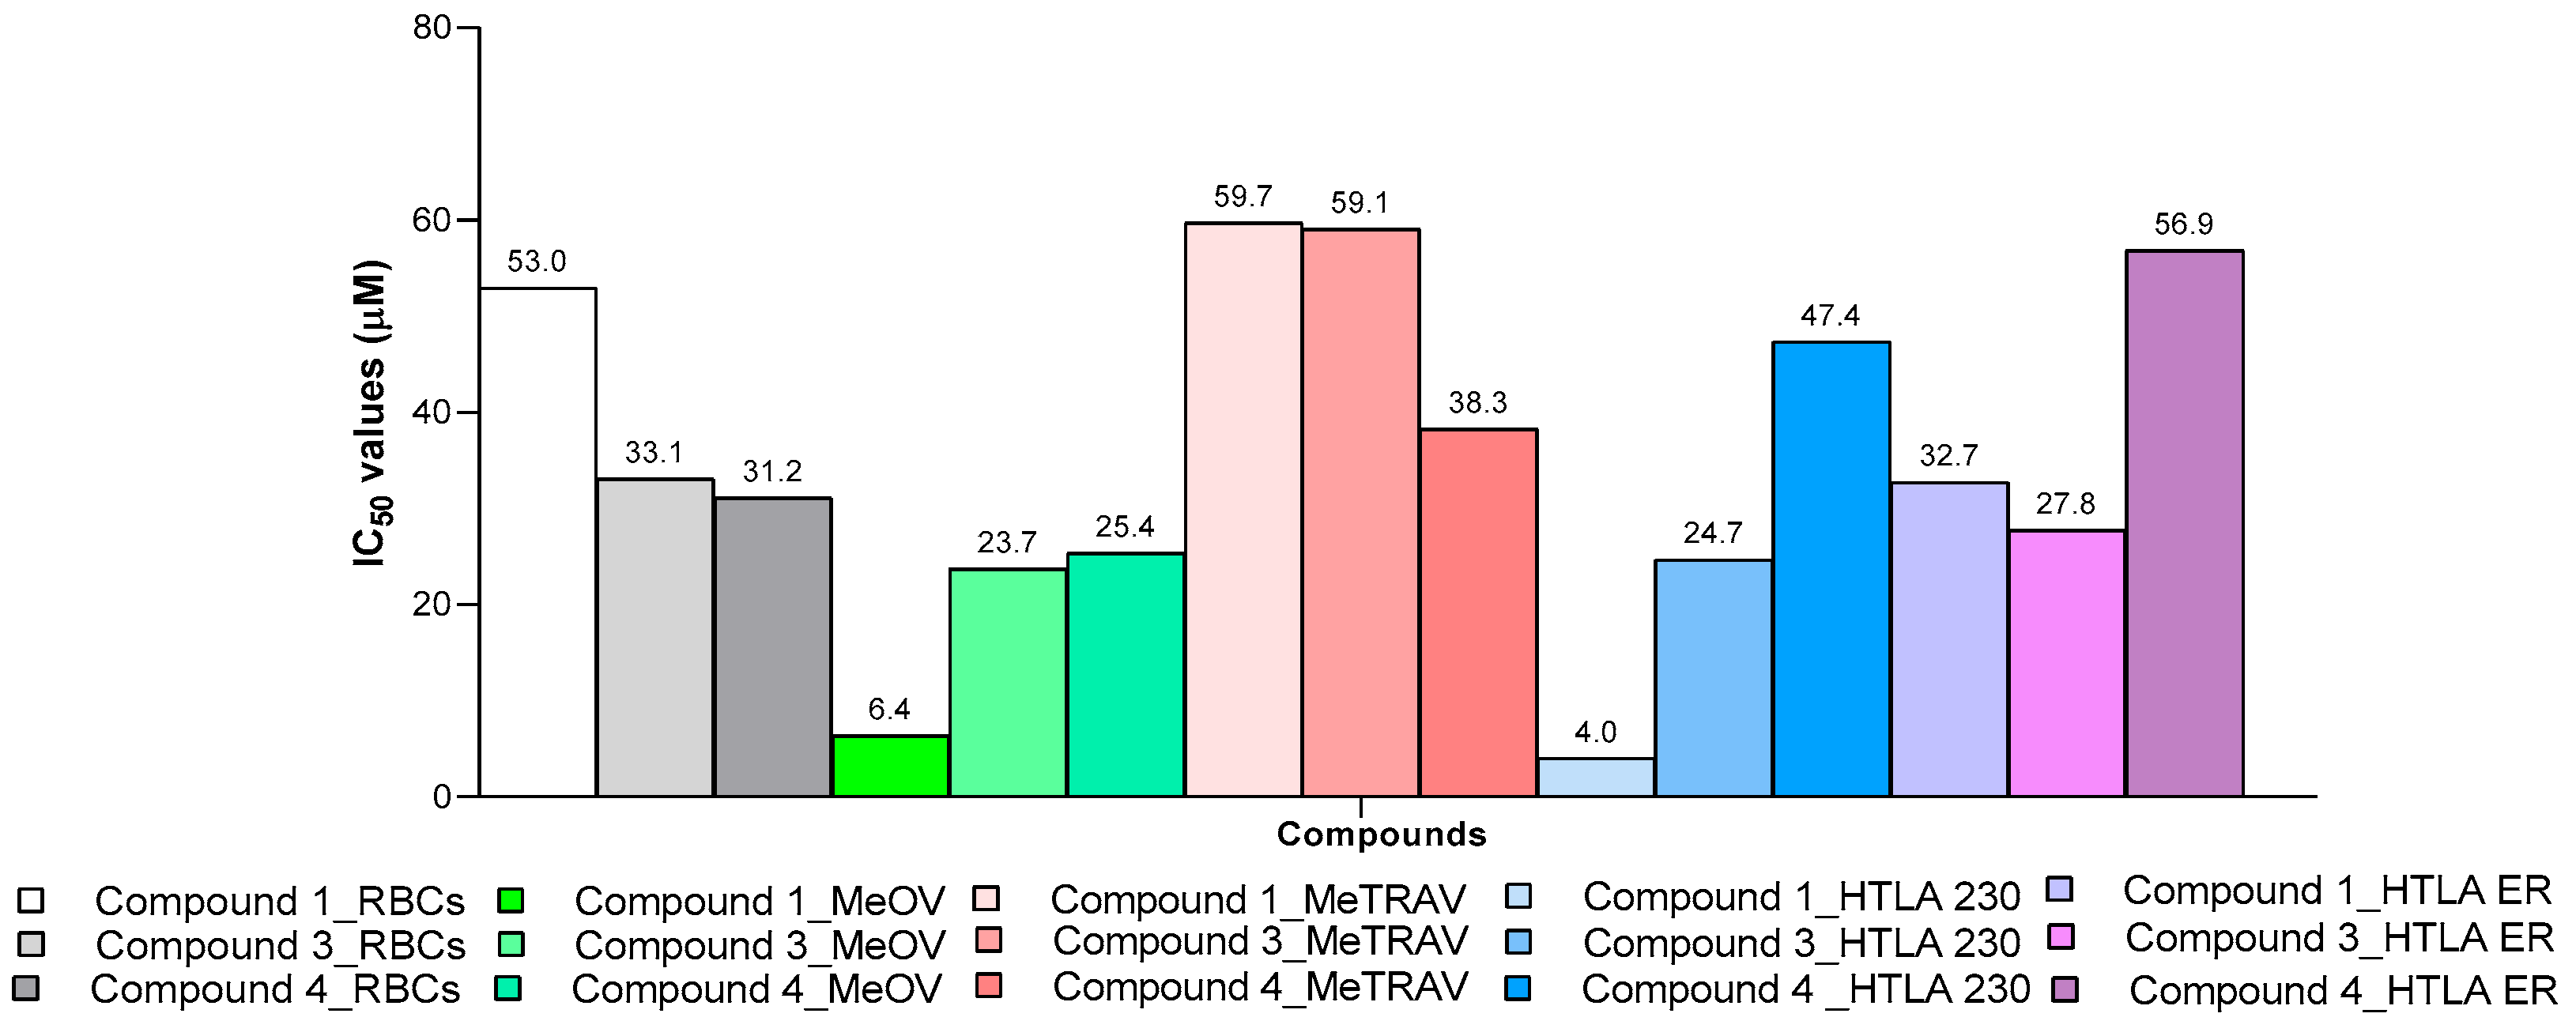
Figure 20.
Cell viability was evaluated in HaCaT (a) and 3T3 (b) cells when exposed to increasing concentrations of 1 (A), 3 (B) and 4 (C) (1–100 µM) for 24, 48 and 72 h. Bar graphs summarize quantitative data of the means ± S.D. of four independent experiments (black spheres) run in triplicate. Significance refers exclusively to control (Ctr, white bars) and was indicated using * symbol. Specifically, p > 0.05 no symbols; **** p < 0.0001; *** p < 0.001 (0.0002); p < 0.01 **; p < 0.05 * (one-way ANOVA followed by Dunnet’s multi-comparisons test). Numbers within bars at bottom indicate viable cells (%).
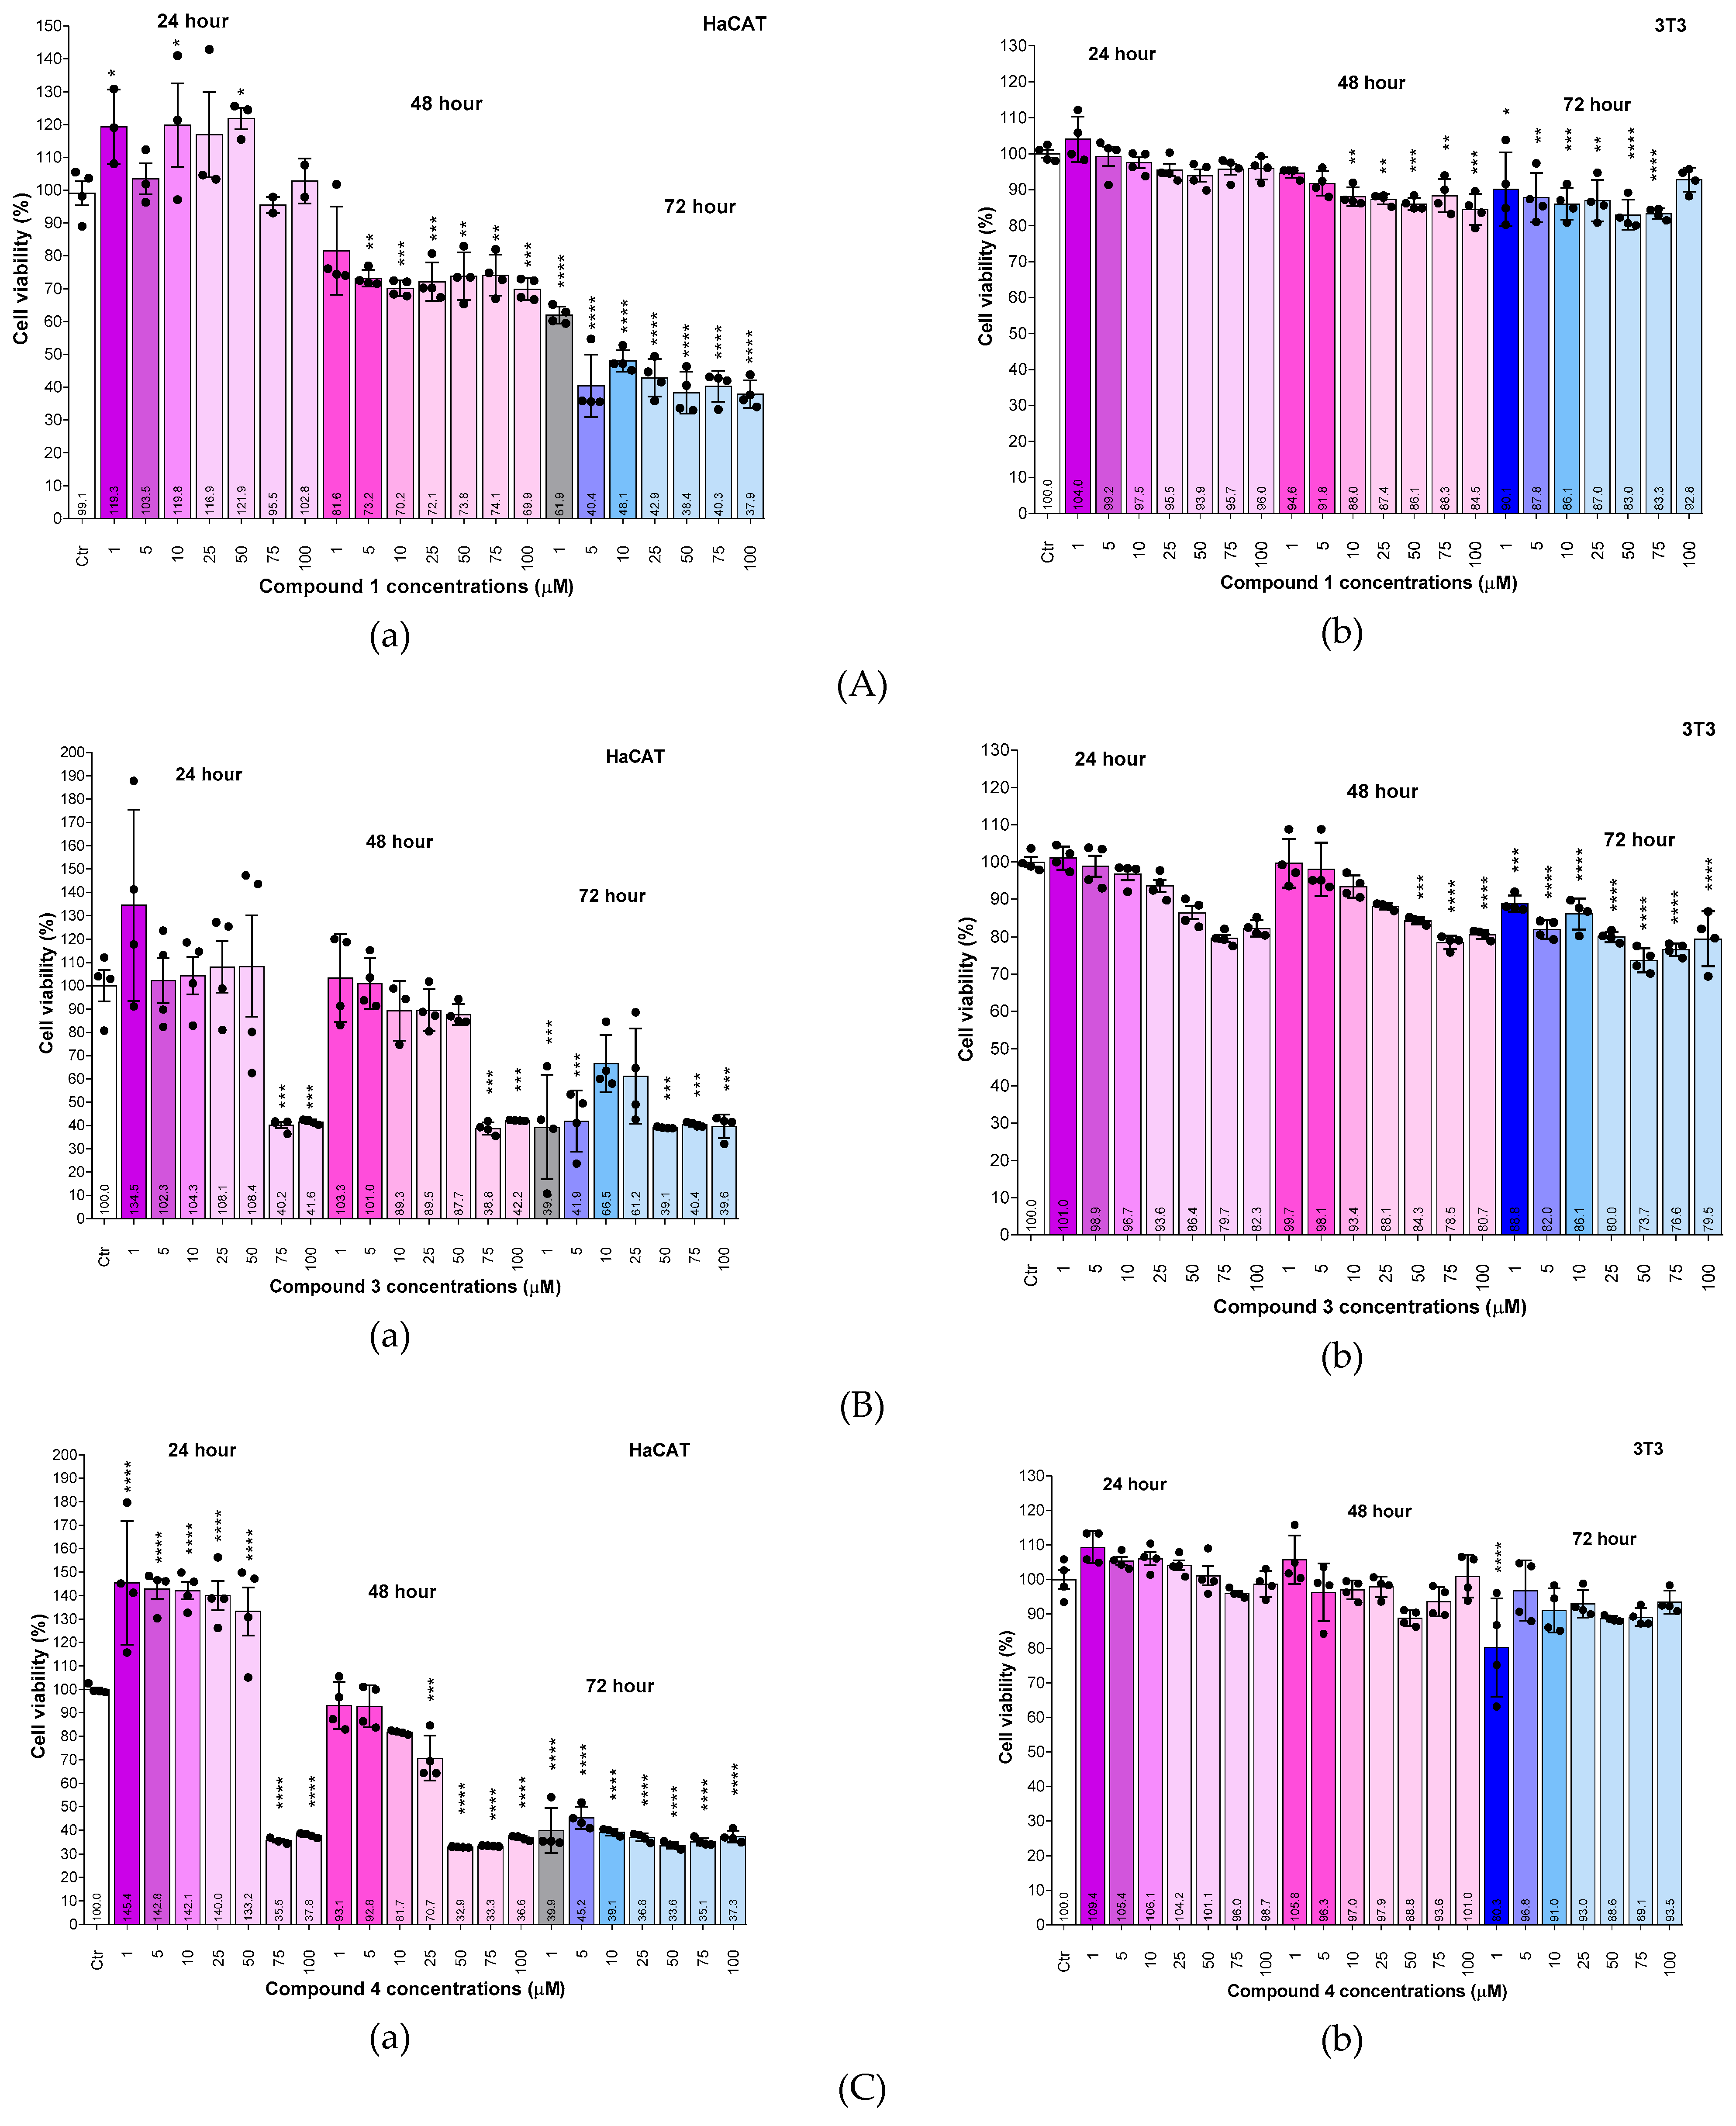
Figure 21.
(a) Bar graph comparing the average cell viability (%) of 3T3 fibroblasts and that of MeOV, MeTRAV, HTLA 230 and HTLA ER cells after exposure to 50 µM (a) and 100 µM (b) of samples 1, 3 and 4 for 24, 48 and 72 hours. Experimental data are expressed as the mean of four independent experiment ± S.D. made in triplicate. Numbers at bottom within the bars indicate cell viability (%). Legend for Figure 21b is the same of that for Figure 21a. Collectively, in Figure 21 we can observe three bars for every sample and nine bars for every cell line.
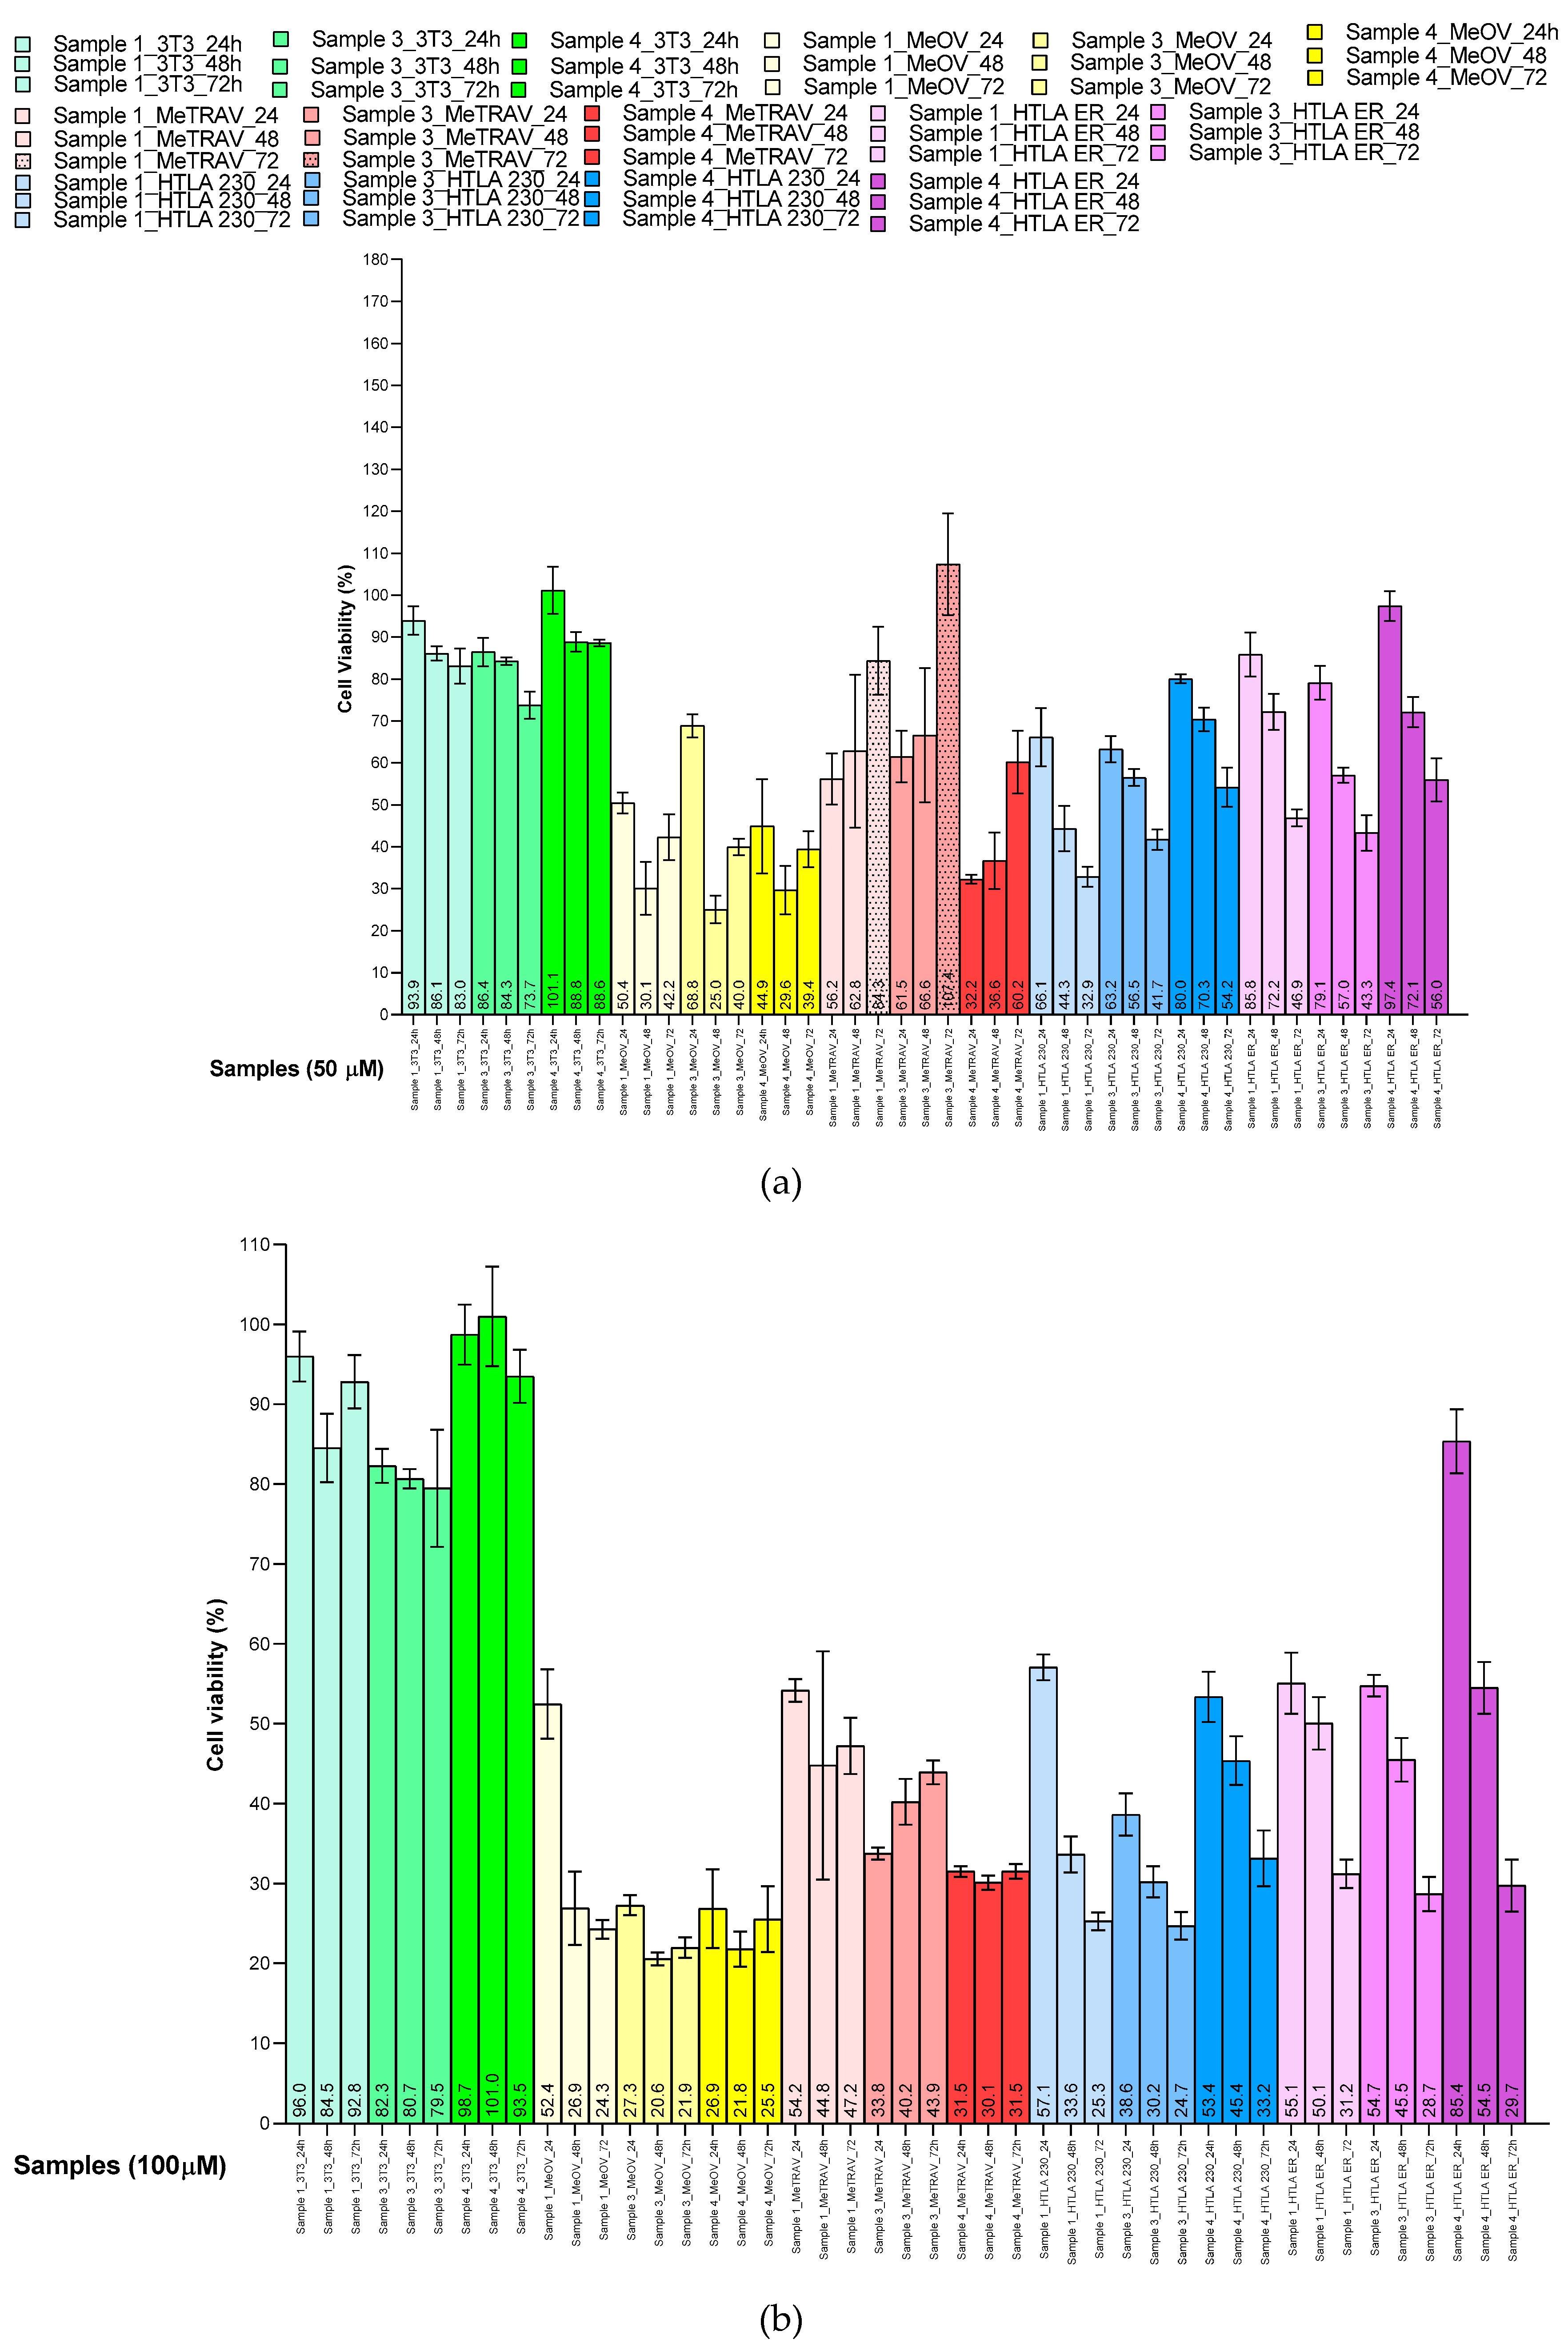
Figure 22.
IC50 values of compound 1 (white to yellow-orange bars), 3 (white to pink-red bars) and 4 (white to soft blue bars up to dark-blue ones) against RBCs (white bars), HaCaT, 3T3 non-tumorigenic cells, and all MCM and NB cell lines (coloured bars).
Figure 22.
IC50 values of compound 1 (white to yellow-orange bars), 3 (white to pink-red bars) and 4 (white to soft blue bars up to dark-blue ones) against RBCs (white bars), HaCaT, 3T3 non-tumorigenic cells, and all MCM and NB cell lines (coloured bars).
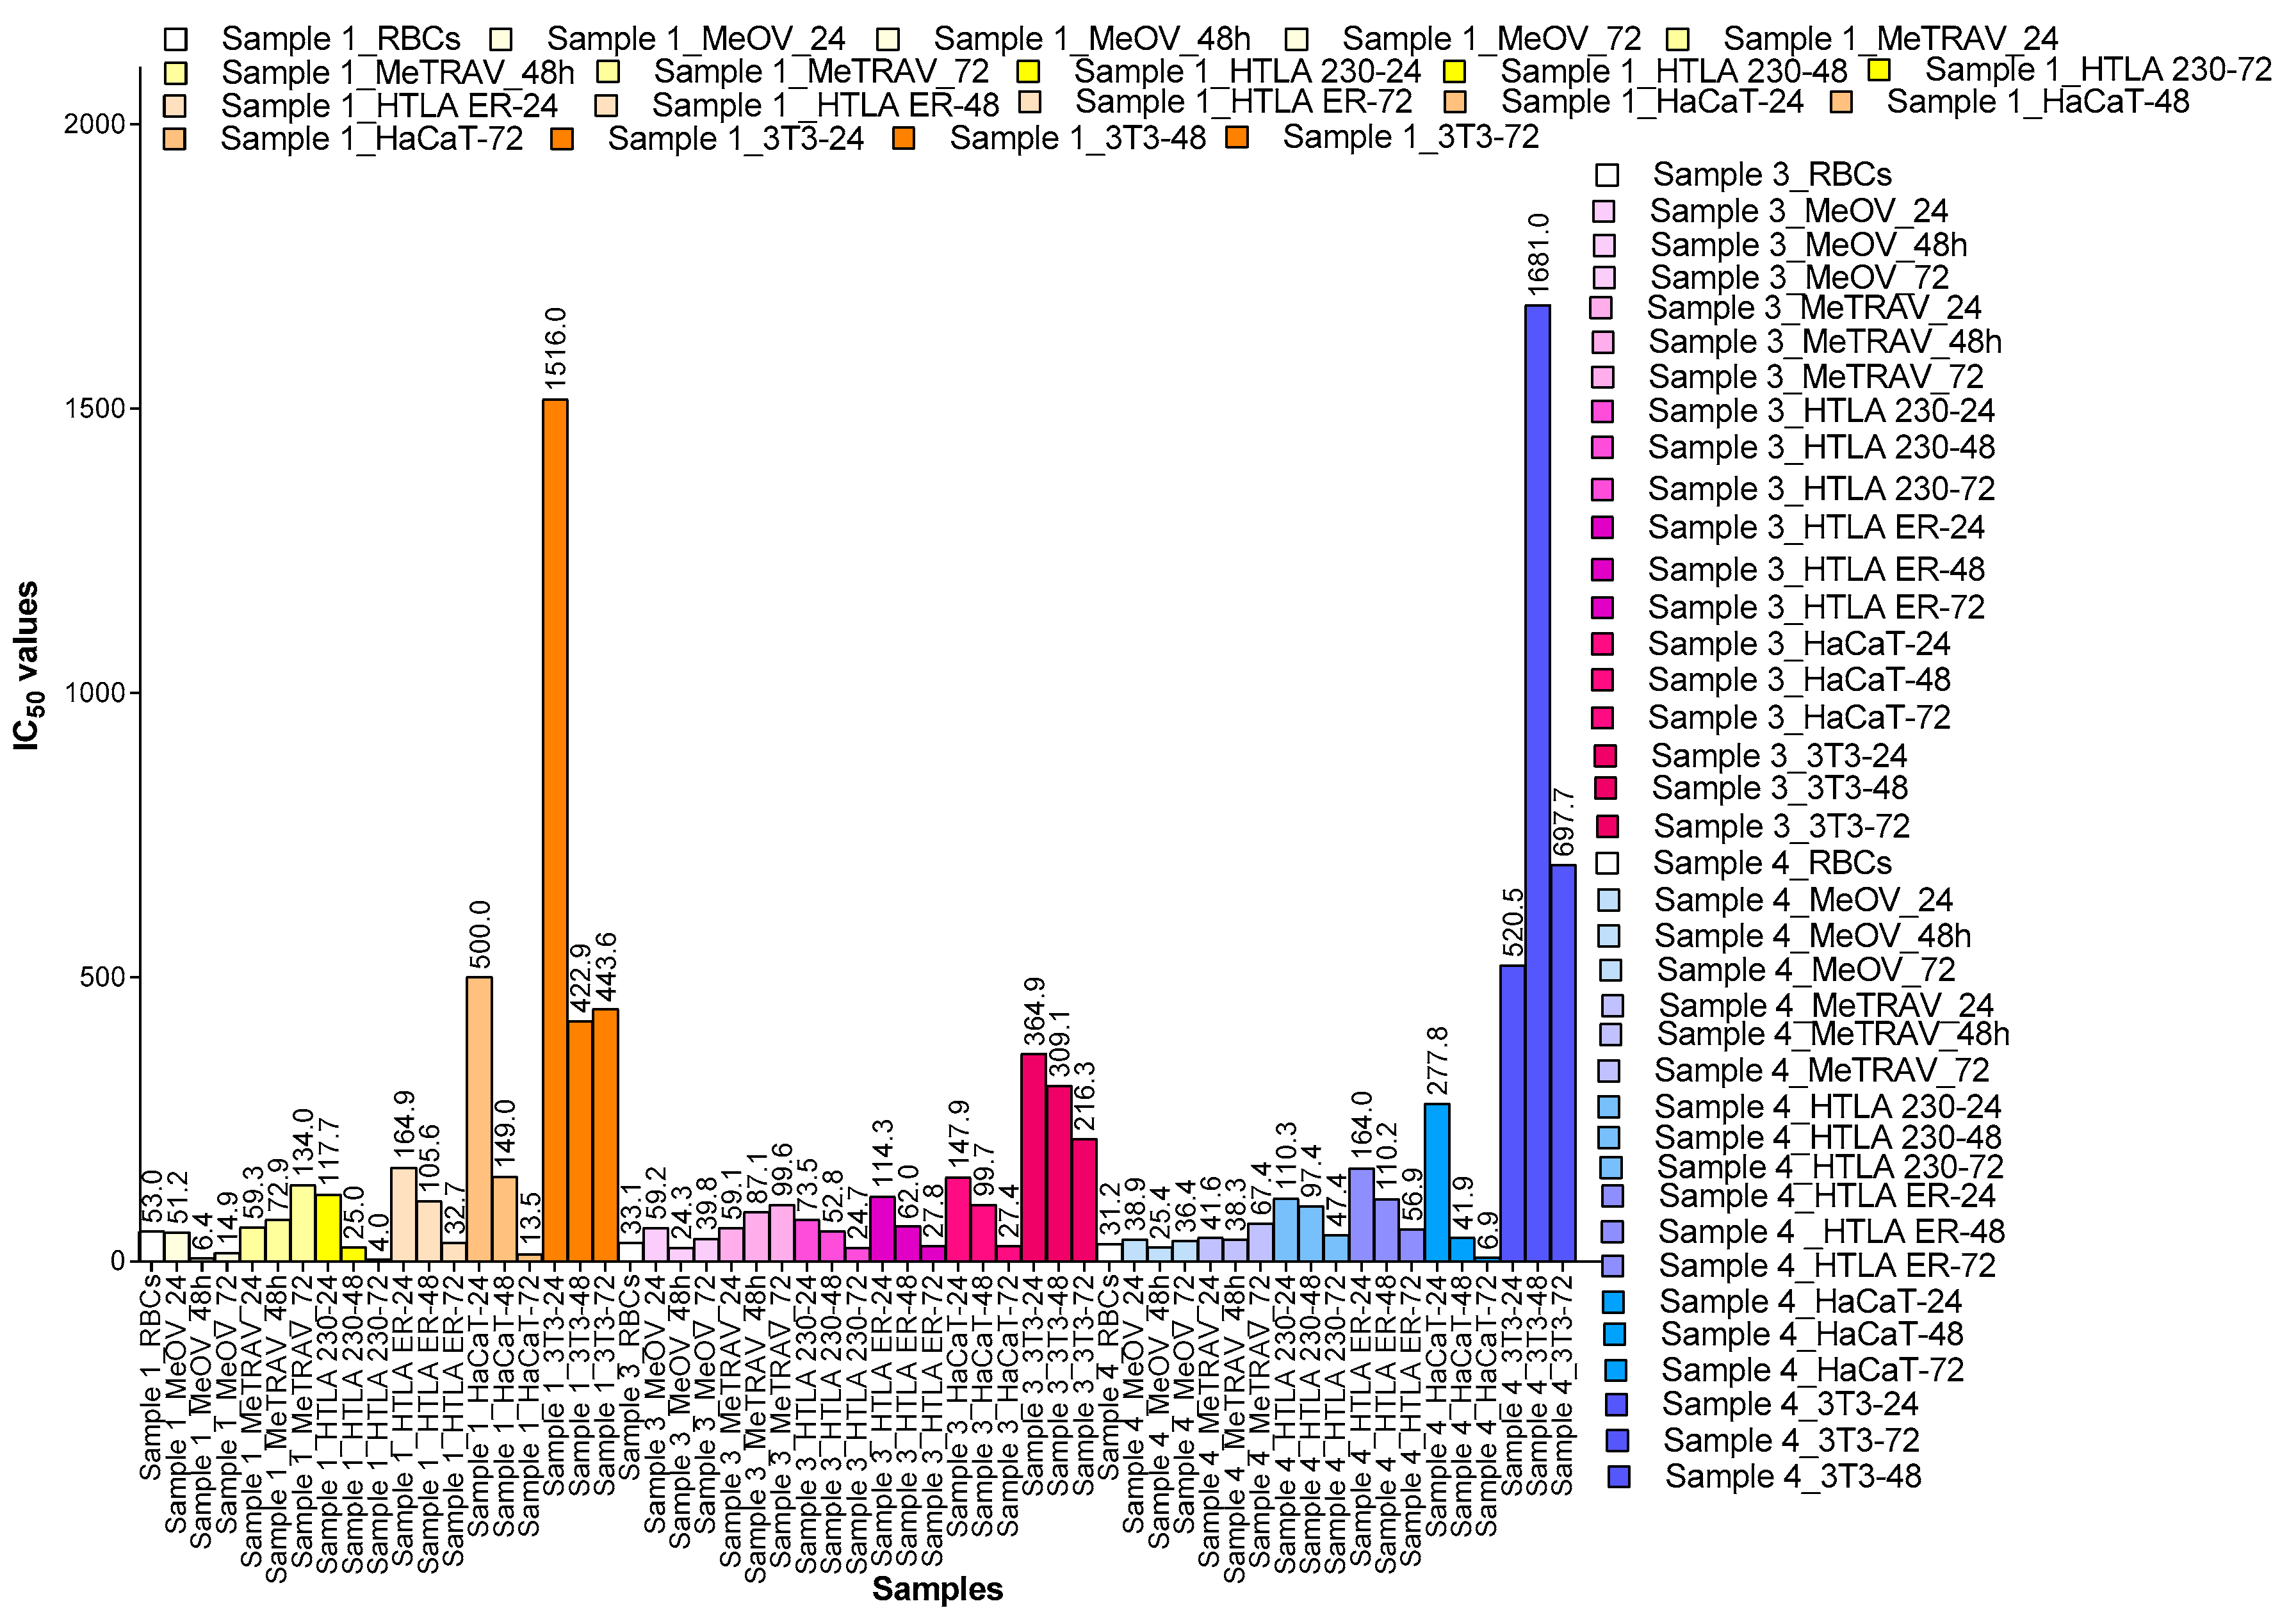
Figure 22.
SI values of compound 1 (a), 3 (b) and 4 (c) for all MCM and NB cells in relation to their toxicity towards RBCs (green bars), HaCaT (blue bars) and 3T3 cells (pink-red bars).
Figure 22.
SI values of compound 1 (a), 3 (b) and 4 (c) for all MCM and NB cells in relation to their toxicity towards RBCs (green bars), HaCaT (blue bars) and 3T3 cells (pink-red bars).
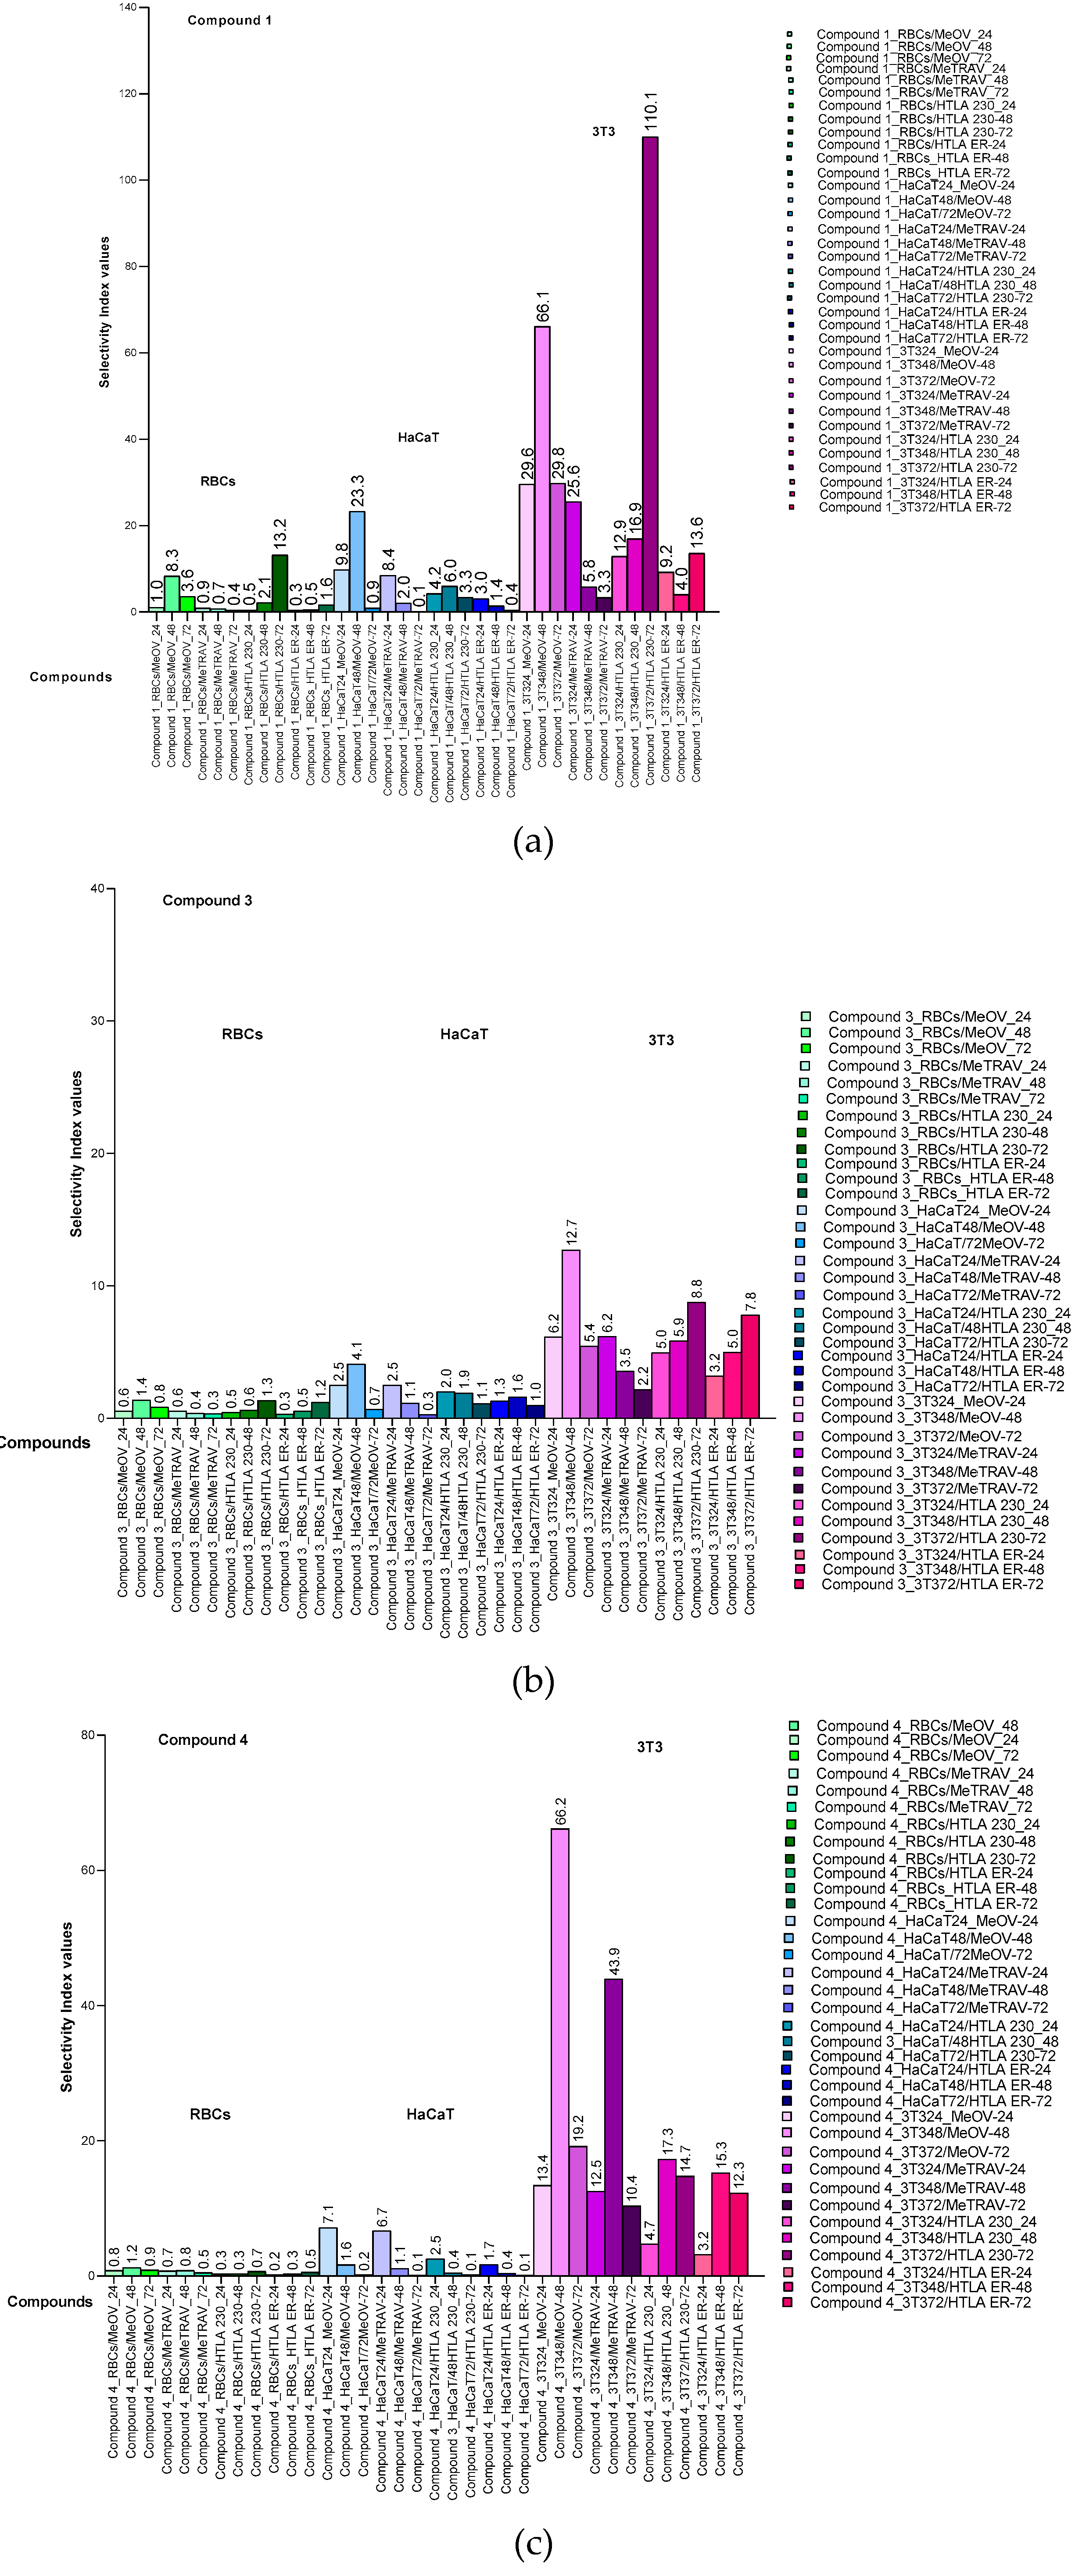

Table 1.
IC50 values of compounds 1, 3 and 4 (24-, 48- and 72-hours exposure) and PLX (72-hours exposure), against MeOV and MeTRAV PLX-R cells. The calculation was made using the cytotoxicity data.
Table 1.
IC50 values of compounds 1, 3 and 4 (24-, 48- and 72-hours exposure) and PLX (72-hours exposure), against MeOV and MeTRAV PLX-R cells. The calculation was made using the cytotoxicity data.
| Compound | Exposure time (hours) | IC50 MeOV PLX-R (µM) | IC50 MeTRAV PLX-R (µM) |
| 1 | 24 | 51.23 ± 42.33 * | 59.72 ± 27.23 * |
| 48 | 6.37 ± 3.02 | 72.93 ± 37.22 * | |
| 72 | 14.89 ± 5.25 | 134.0 ± 40.25 * | |
| 3 | 24 | 62.05 ± 14.00 * | 59.06 ± 11.03 * |
| 48 | 23.73 ± 3.22 | 87.11 ± 27.62 * | |
| 72 | 39.45 ± 6.71 | 99.64 ± V.W. * | |
| 4 | 24 | 38.86 ± 7.13 | 41.62 ± 6.24 |
| 48 | 25.40 ± 6.90 | 38.26 ± 7.00 | |
| 72 | 36.35 ± 8.13 | 67.40 ± 10.16 * | |
| Vemurafenib (PLX) | 72 | 16.86 ± 3.48 | 53.43 ± 20.91 * |
V.W. = very wide; * extrapolation provided by the nonlinear model mentioned in the main text. In red and bold the most interesting results.
Table 2.
Comparison of IC50 values of compounds 1, 3, 4 and those of etoposide (ETO) in HTLA 230 and MDR HTLA ER neuroblastoma.
Table 2.
Comparison of IC50 values of compounds 1, 3, 4 and those of etoposide (ETO) in HTLA 230 and MDR HTLA ER neuroblastoma.
| Compound | Exposure time (hours) | IC50 HTLA 230 (µM) | IC50 MDR HATLA ER (µM) |
| 1 | 24 | 117.70 ± 71.64 * | 164.90 ± 38.30 * |
| 48 | 25.02 ± 4.73 | 105.60 ± 14.58 * | |
| 72 | 4.03 ± 0.91 | 32.71 ± 8.79 | |
| 3 | 24 | 73.47 ± 7.89 * | 114.30 ± 12.50 * |
| 48 | 57.92 ± 8.95 * | 62.03 ± 15.24 * | |
| 72 | 24.67 ± 3.29 | 27.76 ± 3.56 | |
| 4 | 24 | 110.30 ± 9.95 * | 164.00 ± 56.45 * |
| 48 | 97.40 ± 12.72 * | 110.20 ± 12.20 * | |
| 72 | 47.36 ± 5.81 | 56.88 ± 3.09 * | |
| ETO | 24 | 145.60 ± 35.40 * | 531.20 ± 147.35 * |
* Extrapolation provided by the nonlinear model mentioned in the main text; in red and bold more interesting results; in black and bold results from administering ETO for 24 hours.
Table 3.
HC50 values of all sample vs. RBCs and their IC50 values vs. all cancer cells.
| Cells | Sample 1 | Sample 3 | Sample 4 |
| RBCs ° | 52.97±10.93 * | 33.12±6.91 | 31.15±4.13 |
| MeOV 24 h | 51.23 ± 42.33 * | 62.05 ± 14.00 * | 38.86 ± 7.13 |
| MeTRAV 24h | 59.72 ± 27.23 * | 59.06 ± 11.03 * | 41.62 ± 6.24 |
| HTLA 230 24h | 117.70±71.64 * | 73.47±7.98 * | 110.30±9.55 * |
| HTLA ER 24 h | 164.90±38.30 * | 114.30±12.50 * | 164.00±56.45 * |
| MeOV 48 h | 6.37 ± 3.02 | 23.73 ± 3.22 | 25.40 ± 6.90 |
| MeTRAV 48h | 72.93 ± 37.22 * | 87.11 ± 27.62 * | 38.26 ± 7.00 |
| HTLA 230 48h | 25.02±4.73 | 57.92±8.95 * | 97.40±12.72 * |
| HTLA ER 48h | 105.60±15.58 * | 62.03±15.24 * | 110.20±12.10 * |
| MeOV 72h | 14.89 ± 5.25 | 39.45 ± 6.71 | 36.35 ± 8.13 |
| MeTRAV 72h | 134.0 ± 40.25 * | 99.64 ± V.W. * | 67.40 ± 10.16 * |
| HTLA 230 72h | 4.03. ± 0.91 | 24.67±3.29 | 46.36±5.81 |
| HTLA ER 72h | 32.71±8.79 | 27.26±3.56 | 56.88±3.09 * |
° Time of experiment according to protocol detailed in the experimental Section. V.W. = very wide; * extrapolation.
Disclaimer/Publisher’s Note: The statements, opinions and data contained in all publications are solely those of the individual author(s) and contributor(s) and not of MDPI and/or the editor(s). MDPI and/or the editor(s) disclaim responsibility for any injury to people or property resulting from any ideas, methods, instructions or products referred to in the content. |
© 2026 by the authors. Licensee MDPI, Basel, Switzerland. This article is an open access article distributed under the terms and conditions of the Creative Commons Attribution (CC BY) license.
Copyright: This open access article is published under a Creative Commons CC BY 4.0 license, which permit the free download, distribution, and reuse, provided that the author and preprint are cited in any reuse.


