Submitted:
09 February 2026
Posted:
10 February 2026
You are already at the latest version
Abstract
Camellia oleifera Abel, recognized as a woody oil-producing tree species, possesses considerable economic significance. To improve the breeding efficiency of C. oleifera, it is crucial to elucidate the genetic foundation underlying the mechanisms regulating fruit traits. In this study, a total of 6,252,197 high-quality single nucleotide polymorphisms (SNPs) were identified from 109 germplasm accessions. Through genetic structure analysis, these accessions were categorized into two distinct populations. The average fixation index (Fst) was found to be 0.0153, indicating weak population differentiation. The genome-wide association analysis (GWAS) identified 157 significant loci. From these loci, 110 candidate genes were selected, which were associated with disease resistance, reproduction, development, and RNA biosynthesis. Twenty-three genes were involved in metabolic pathways, including genetic information processing protein families, metabolic protein families, terpenoids and polyketides. The identification of gene loci closely related to fruit traits not only provides genetic data for studying the molecular mechanisms of fruit traits but also offers new research avenues for molecular breeding of C. oleifera.
Keywords:
Camellia oleifera
; fruit traits
; genetic structure
; GWAS
; SNP
1. Introduction
Camellia oleifera Abel, native to China, is a species within the genus Camellia of the family Theaceae. It is primarily a shrub but can also grow into a medium-sized tree. The seeds of C. oleifera possess rich contents of edible oil, also known as tea oil, making it one of four major edible oil producing crops worldwide [1,2,3]. Tea oil is rich in monounsaturated and polyunsaturated fatty acids, with significant uses in regulating blood cholesterol. Moreover, the oil contains significant contents of bioactive substances such as vitamin E and flavonoids, making it highly nutritious [4,5,6]. With a growth cycle spanning over a hundred years, C. oleifera represents a highly successful perennial cash crop.
The plant shows abundant variations in fruit shape and color among different germplasms. The most prevalent fruit colors include red, yellow, and green, while the fruit shapes can be categorized as spherical, orange-like, peach-like, navel-like, olive-shaped, jujube-shaped, and chicken-heart-shaped [7]. The key fruit traits affecting the oil production include fruit weight, fruit height, fruit diameter, fruit peel thickness, fresh seed yield rate, dry seed yield rate, and dry kernel yield rate [8,9]. These fruit traits vary among varieties and are affected by environment variations [10,11,12,13]. The diversity of fruit traits serves as an important foundation for selective breeding. In-depth analysis of the genetic basis underlying the diversity of fruit traits in C. oleifera germplasm and the identification of gene loci regulating fruit traits play crucial roles in the development of new varieties and molecular-assisted breeding [14,15,16].
However, due to the long breeding cycle, complex ploidy, and large genome size of C. oleifera, research on the genes regulating its fruit traits is relatively slow [17,18,19]. Genome-wide association study (GWAS) is an effective and convenient method for studying traits in plants and animals. By performing association analysis between genotypic and phenotypic data, significant loci or candidate genes can be identified [20]. Jia et al. [21] sequenced 916 foxtail millet varieties and identified a total of 2.58 million single nucleotide polymorphisms (SNPs). They also constructed a haplotype map of the foxtail millet genome using 0.8 million high-quality SNPs. Furthermore, they conducted a genome-wide association study on 47 agronomic traits of the 916 varieties under five different environmental conditions, revealing a total of 512 loci associated with these traits. Wang et al. [22] conducted GWAS on traits related to chlorophyll content using 529 rice germplasm resources and identified 46 significantly associated loci. They selected three of these associated loci and constructed an F2 segregating population for validation. Wang et al. [23] also performed a GWAS using 219 soybean germplasm resources and detected a total of 12 quantitative trait loci (QTLs) related to net photosynthetic rate, photosynthetic rate, and stomatal conductance, which were distributed across 12 chromosomes. Zhang et al. [24] conducted GWAS on 11 agronomic traits of 312 sand pear germplasm resources from China, South Korea, and Japan, and identified 37 loci associated with 8 fruit quality traits and 5 loci associated with 3 fruit phenological traits. Among these, a candidate gene, PbrSTONE, was functionally validated to be involved in the regulation of stone cell formation [25]. These studies provide a framework for exploring the regulatory mechanisms of fruit traits in C. oleifera.
C. oleifera harbors rich genetic diversity in its germplasm resources [26]. This diversity provides a crucial gene pool for the genetic improvement of fruit traits in C. oleifera [27]. The development of high-throughput sequencing technology and the emergence of the C. oleifera genome offer an opportunity to develop SNP molecular markers covering the entire genome of C. oleifera [28]. However, compared with other fruit trees and crops, research on the regulatory mechanisms of fruit traits in C. oleifera remains limited. This study conducts a genome-wide association analysis on C. oleifera fruits for the first time and explores the genetic structure and diversity of C. oleifera populations. The objectives are to identify genetic loci related to the regulation of fruit traits and reveal potential molecular markers, providing a solid theoretical basis for the genetic improvement and molecular breeding of C. oleifera.
2. Materials and Methods
2.1. Plant Materials and Phenotypic Evaluation
The 109 C. oleifera germplasm accessions were planted in the experimental field of National C. oleifera Germplasm Resource Bank at Shaxian Shuinan State-owned Forestry Farm from Fujian Province (Supplementary File S1). These accessions originated from four provinces: Fujian (78 accessions), Jiangxi (17 accessions), Hunan (8 accessions), and Guangxi (6 accessions), with each accession assigned a unique identifier.
The weight of each C. oleifera fruit was measured using an electronic balance, and the length and diameter of the fruits were accurately measured using a vernier caliper. The peel thickness of each fruit was measured at the top, middle, and bottom with a vernier caliper, and the average value was calculated. The fruit shape index (FSI) was defined as the ratio of fruit length to fruit diameter. Microsoft Excel 2021 was used to calculate FSI and other statistical data.
After the C. oleifera fruits were peeled, the number of seeds in each fruit was recorded. The weight of the shelled seeds was measured, and the average value was calculated to determine the fresh seed yield rate. Subsequently, the shelled seeds were dried in an oven and then weighed again to calculate the dry seed yield rate. The dried seeds were then shelled, and the weight of the kernels was measured to calculate the dry kernel yield rate. Based on the FSI, different categories of C. oleifera fruit shapes were distinguished, identified, and recorded.
2.2. DNA Preparation and Sequencing
Genomic DNA was extracted from the leaves using a modified cetyltrimethylammonium bromide (CTAB) method [29]. After quantification by 1% agarose gel electrophoresis, the working DNA solutions were diluted to 100 ng/µL and stored at -20°C. Subsequently, we constructed sequencing libraries for the 109 DNA samples using the Hyper-seq method [30]. When the monoclonal detection results met the required standards, we performed 150 bp paired-end sequencing on each constructed sequencing library using the HiSeq 2500 platform.
2.3. SNP Calling and Annotation
The paired-end raw data from the simplified genome sequencing were filtered using the software fastp (version 0.20.0) [31], with the parameters set as: --adapter_sequence R1_adapter and --adapter_sequence_r2 R2_adapter, to obtain paired-end clean data for each sample. To facilitate rapid searching and positioning during subsequent variant detection, the index of the C. oleifera genome was constructed using three software tools: SAMtools [32], BWA [33], and Picard (http://broadinstitute.github.io/picard/). The data were aligned to the genome using the mem algorithm of BWA, and the results were then sorted using the sort function of SAMtools to obtain BAM files of various qualities. Subsequently, the alignment rate was calculated using SAMtools. PCR duplicates were removed from the BAM files using the MarkDuplicates tool of Picard, ultimately generating BAM files of various qualities containing the aligned results. Next, variant detection was performed on the BAM files of various qualities by chromosome using the HaplotypeCaller module of the Genome Analysis Toolkit (GATK) [34], generating corresponding gVCF files.
In the second step, the gVCF files of different germplasm resources were merged by chromosome using the CombineGVCFs module of GATK. Then, population variant detection was performed on the merged gVCF files using the GenotypeGVCFs module of GATK, obtaining VCF files for each chromosome. Finally, the VCF files for specific chromosomes were merged into a single genome-wide VCF file using the MergeVcfs tool of GATK.
In the third step, single nucleotide polymorphisms (SNPs) and insertions/deletions (INDELs) were extracted using the SelectVariants tool of GATK, and then filtered and flagged using the VariantFiltration tool of GATK (SNP filtering criteria: QD < 2.0 || MQ < 40.0 || FS > 60.0 || SOR > 3.0 || MQRankSum < -12.5 || ReadPosRankSum < -8.0; INDEL filtering criteria: QD < 2.0 || FS > 200.0 || SOR > 10.0 || MQRankSum < -12.5 || ReadPosRankSum < -8.0). Finally, the filtered SNPs and INDELs were extracted again using the SelectVariants tool of GATK, obtaining the final VCF files for SNPs and INDELs.
The identified SNPs were annotated using the ANNOVAR [35] software. First, a database was constructed using the FASTA file and GFF3 annotation file of the C. oleifera genome. Then, the obtained VCF files for SNPs were annotated.
2.4. Genetic structure Analysis
Prior to population structure analysis, the SNP data were filtered using the Plink [36] software based on criteria of missing rate (Geno 0.1), minor allele frequency (MAF 0.01), and linkage disequilibrium (LD) filtering (using the parameter --indep - pairwise 50 10 0.2). The filtered VCF files were then analyzed. The VCF files were sorted and converted into PHYLIP format using the SortGenotypeFilePlugin module of TASSEL (https://tassel.bitbucket.io/). Subsequently, a phylogenetic tree was constructed using the FastTree software [37] with the approximate maximum likelihood method and the generalized time - reversible (GTR) model. Principal component analysis (PCA) was performed on the experimental C. oleifera population materials based on the detected SNPs using the Plink software. Following this, the vectors for each principal component were calculated using R software [38], and the PCA scatter plot was plotted using R.
Additionally, the input file format was adjusted using Plink software to be compatible with the Admixture software [39]. The files were then uploaded into the Admixture software, and the number of subpopulations (k value) was set from 1 to 10. The most appropriate number of subpopulations was determined based on the cross-validation error (CV error) values generated during the computation, and a population genetic structure matrix was generated. This matrix consists of the genetic component coefficients for each individual in each subpopulation.
Finally, charts were created using the pophelper [40] and ggplot2 packages in R to visualize the results of the population genetic structure matrix. The nucleotide diversity index (π), population differentiation index (Fst), and Tajima's D values, which were calculated using the VCFtools software, were also visualized. Data were extracted from the computation result files, and the charts were plotted using the CMplot package in R.
2.5. GWAS Analysis
Prior to association analysis, SNP imputation was performed on the C. oleifera population using Beagle-5.5 [41]. The imputed data were subsequently filtered with Plink to retain markers with a minor allele frequency >0.05 and a missing rate <0.1, yielding a final set of high-quality SNPs for downstream analysis. Genome-wide association analysis for the 10 fruit traits was conducted across the 109 germplasm samples using the mixed linear model (MLM) in EMMAX, which involved kinship matrix calculation followed by association testing.
The genome-wide significance threshold was set at 3.56×10⁻⁸ (0.05/total number of SNPs), corresponding to -log₁₀(P)-value thresholds of 6.45 and 7.75. The results were visualized using the R package CMplot, generating both Q–Q and Manhattan plots in which the specified thresholds are indicated by blue and red lines, respectively.
2.6. Candidate Gene Screening
We defined the flanking region corresponding to significantly associated SNP markers as 100 kb (50 kb upstream and 50 kb downstream of the significantly associated SNP marker). Based on the annotation and functional annotation of SNP loci in C. oleifera, we considered the genes located within these loci as candidate genes. If a locus was simultaneously upstream and downstream of other genes, those upstream and downstream genes were also considered as candidate genes. If a locus was in an intergenic region, the nearest upstream and downstream genes were considered as candidate genes.
Candidate genes were annotated using GhostKOALA on the KEGG official website (https://www.kegg.jp/ghostkoala/) to obtain the relevant KO numbers. Then, a Python script was used for conversion to obtain pathway information at different levels. The Swiss-Prot database was downloaded from the NCBI official website (https://www.ncbi.nlm.nih.gov), and the protein sequences were compared to this database using BLAST (BLAST: Basic Local Alignment Search Tool) to obtain the corresponding GO numbers. Subsequently, further analysis was conducted using TBtools.
3. Results
3.1. SNP Variation Detection
After constructing libraries for each sample, approximately 126.7G of raw data were obtained through paired-end sequencing. Following filtering using the fastp software, approximately 122.7G of clean data were generated. Variants were called from the aligned sequence files of the 109 C. oleifera samples using GATK. After initial filtering, a total of 6,535,538 raw population SNPs were obtained, distributed across all 15 chromosomes. Chromosome 10 harbored the highest number of SNPs (549,986), accounting for 8.42% of the total, while chromosome 9 contained the fewest (304,057 SNPs, 4.65%). The SNP counts for the remaining chromosomes were as follows, in descending order: Chr01 (510,385; 7.81%), Chr12 (507,496; 7.77%), Chr07 (506,689; 7.75%), Chr03 (478,721; 7.32%), Chr02 (471,624; 7.22%), Chr05 (459,979; 7.04%), Chr11 (456,825; 6.99%), Chr13 (440,464; 6.74%), Chr04 (432,971; 6.62%), Chr14 (362,843; 5.55%), Chr06 (361,753; 5.54%), Chr15 (355,498; 5.44%), and Chr08 (336,247; 5.14%). Overall, the number of markers on each chromosome exceeded 300,000, indicating a relatively uniform distribution across the genome (Figure 1).
Further annotation was performed on the variant sites located within exon regions. The results showed that 152,181 SNPs were situated in exons. Among these, 90,876 SNPs led to non-synonymous mutations, 56,530 resulted in synonymous mutations, 4,562 were nonsense mutations, and 213 caused stop-loss mutations. These variants may have substantial effects on the traits of C. oleifera.
3.2. Genetic Structure
After filtering the missing rates, minor allele frequencies, and linkage disequilibrium (LD), 274,489 high-quality single nucleotide polymorphism (SNP) loci were retained. The population structures of the 109 C. oleifera germplasm accessions were analyzed using the ADMIXTURE software. The number of subpopulations (k) was set from 1 to 10, and the cross-validation (CV) error values were calculated for each k. The results showed that the CV error was the lowest when k=2, and it gradually increased as the value of k exceeded 2, indicating that dividing the germplasm resources into 2 groups at the genomic level was the most appropriate. The Q values for each germplasm accession were calculated for k values ranging from 2 to 10, and each accession was assigned to the subpopulation where its Q value was maximal (Figure 2A). The results indicated that when k=2, the 109 C. oleifera germplasm accessions exhibited distinct structural blocks, suggesting effective grouping. From statistical analysis, it was found that subpopulation Q1 (dark blue) contained 48 accessions, while subpopulation Q2 (light blue) contained 61 accessions. There was evidence of gene flow and mutual gene infiltration between the two subpopulations. Further statistical analysis showed that the germplasm accessions in Q1 largely coincided with those in subgroups G1, G2, and G3 of the phylogenetic tree. Similarly, Q2 corresponded to subgroups G4, G5, and G6. Therefore, the division of 109 germplasm resources into 2 groups yielded effective results.
Principal component analysis (PCA) was performed on the SNP data using Plink software. The first three principal components, PC1, PC2, and PC3, collectively explained 34.99% of the variance, with PC1 accounting for 12.69%, PC2 for 11.69%, and PC3 for 10.61% (Figure 2B). The results were visualized using R, employing the two subpopulations inferred by ADMIXTURE for grouping, The first three principal components, which were highly representative of the variation, were selected for plotting.
A phylogenetic tree for 109 C. oleifera germplasm resources were constructed using the approximate maximum likelihood method in FastTree software (Figure 2C). The results indicate that the 109 C. oleifera germplasm resources can be divided into six subgroups: G1 to G6. Specifically, subgroup G1 contains 12 germplasm accessions, G2 has 27, G3 has 17, G4 has 18, G5 has 11, and G6 has 24. In subgroup G1, 2 accessions are from Fujian, 4 are from Hunan, and 6 are from Jiangxi. In subgroup G2, 14 accessions are from Fujian, 5 belong to Guangxi, 3 are from Hunan, and 5 are from Jiangxi. Subgroup G3 includes 11 accessions from Fujian and 6 from Jiangxi. Subgroups G4 and G5 contain 18 and 11 accessions, respectively, all from Fujian. In subgroup G6, apart from 1 accession from Hunan and 1 from Jiangxi, the remaining 22 are from Fujian. Further analysis reveals that the germplasm from Fujian in subgroups G4, G5, and G6 includes 'Min 43', 'Min 46', 'Min 49', and 'Min 50', as well as their hybrid offspring 'Min Zayou'. These results suggest that the distinct geographical distribution characteristics of subgroups G4, G5, and G6 may be influenced by hybridization, leading to complex genetic backgrounds within these subgroups and subsequent population differentiation. Overall, there is no obvious geographical distribution pattern among the different subgroups of the 109 C. oleifera germplasm resources.
Further calculations were performed to determine the distribution of Fst for each SNP marker across the whole genome (Figure 3). The Fst values for most SNP markers were below 0.2, and the average Fst value for all SNP markers across the genome was 0.0153. This suggests that the degree of differentiation between the Q1 and Q2 subpopulations is relatively weak, indicating weak genetic differentiation.
To assess the genetic diversity of the two subpopulations within the C. oleifera germplasms, the nucleotide diversity index (π) was calculated for the Q1 and Q2 subpopulations using VCFtools software. The distribution of π values across the 15 chromosomes for both subpopulations is shown in Figure 4A,B. There was no significant difference in genetic diversity between the two subpopulations, and both exhibited higher nucleotide diversity at certain SNP loci on chromosomes 6 and 8, indicating that these genetic variations have been well-preserved.
In addition, the average nucleotide diversity index for the Q1 subpopulation was 4.45×10⁻⁴. The nucleotide diversity indices for both subpopulations were mostly below 0.01, depicting low genetic diversity. This may be due to long-term domestication of C. oleifera.
Finally, the Tajima's D values were calculated for the two subpopulations (Figure 4C,D). Tajima's D is an indicator of selection within populations and is used to identify sequences that deviate from the neutral theory model by assessing the balance between mutation and genetic drift. The mean Tajima's D value for the Q1 subpopulation across all SNP loci was 0.292, while it is 0.464 for the Q2 population. These positive Tajima's D values suggested that the presence of rare alleles at low frequencies in both subpopulations, and there was a relatively high frequency of intermediate alleles. This may be due to the influence of domestication on the C. oleifera germplasm, leading to similar environments and uniform selection pressures within the populations.
3.3. GWAS of Fruit Traits
A total of 2,812,326 SNP markers spanning the C. oleifera genome and 10 fruit traits (Supplementary File S2) from 109 germplasms were utilized for GWAS analysis. The analysis was performed using the EMMAX mixed linear model, with significance thresholds set at 6.45 and 7.75 for screening significant loci. All traits except for fruit height were found to be associated with significant loci. In total, 157 significant loci were identified (Figure 5).
Specifically, nine SNP loci were significantly associated with single fruit weight, among which the locus at Chr09:7869152 showed a highly significant association (-log₁₀(P) = 8.05). Two loci associated with fruit diameter were located at positions 43866733 and 43866738 on chromosome 5. For the fruit shape index, six significant loci were detected, with the most significant at Chr02:20212286 (-log₁₀(P) = 7.42). Forty loci were associated with peel thickness; 37 showed significant and three showed highly significant associations. The SNP at Chr13:111073692 was the most significantly associated (-log₁₀(P) = 10.01), followed by Chr10:33172723 (8.17) and Chr11:149010807 (7.76). Among the ten traits, the number of seeds per fruit had the highest number of associated loci (69 in total: 59 significant, 10 highly significant). The top three loci were Chr11:153463775 (-log₁₀(P) = 10.09), Chr15:29597100 (9.42), and Chr15:29597154 (9.01). Five loci were associated with fresh seed weight, with the most significant at position 169280653 on chromosome 10 (-log₁₀(P) = 6.91). Twenty-three loci were associated with the fresh seed yield rate, with only one (Chr11:87995439) being highly significant (-log₁₀(P) = 8.56). Only one locus (Chr07:160272823) was associated with the dry seed yield rate (-log₁₀(P) = 6.68). Finally, two loci (Chr02:124313904 and Chr02:124313920) were associated with the dry kernel yield rate, both with a -log₁₀(P) value of 6.72 (Supplementary File S3).
3.4. Candidate Genes
Annotations were performed on the 157 significant SNP loci to identify for candidate genes. After removing duplicate genes, 110 candidate genes (Supplementary File S3) were annotated using the KEGG database (Table 1). The KEGG annotations primarily included genetic information processing protein families, metabolic protein families, terpenoid and polyketide metabolism, among others.
The GO annotations of 46 genes (Table 2) suggested that 6 candidate genes belonged to the molecular function category, including other molecular functions such as disease resistance. Nine candidate genes were associated with the cellular component category, mainly involving functions such as organelle membranes, protein complexes, and the endoplasmic reticulum. Thirty-one candidate genes showed biological processes, primarily involving functions such as reproduction, development, and RNA biosynthesis.
4. Discussion
In recent years, SNP molecular markers have assumed a critical role in elucidating biological genetic variation, interspecies relationships, and genetic breeding, owing to their numerous advantages in comparison to traditional breeding methods. These advantages include their abundance, wide distribution, ease of automated detection, low mutation rate, and rapid screening [42,43]. Currently, Simple Sequence Repeat (SSR) [44], Inter Simple Sequence Repeat (ISSR) [45], and Sequence Related Amplified Polymorphism (SRAP) [46] molecular markers are commonly used to study the genetic diversity of C. oleifera. However, these markers have limitations, such as high time costs, low throughput, and relatively low accuracy, making it difficult to screen for highly polymorphic markers. Liu et al. [47] utilized SLAF-seq technology to sequence nine C. oleifera samples and successfully developed SNP markers. However, we did not use the C. oleifera genome as a reference for variant detection; consequently, marker development requires improvement and is insufficient for gene mapping of C. oleifera traits. Furthermore, the population size used in the study was relatively small, rendering the quality of the developed markers inadequate for comprehensive investigation of genetic diversity within C. oleifera populations.
With the rapid development of bioinformatics and continuous advancements in sequencing technology, the genome of C. oleifera has been successfully sequenced. Lin et al. [48] conducted transcriptome sequencing using the C. oleifera genome as a reference and detected 1,849,953 SNP molecular marker loci. Based on these SNP loci, they constructed high-quality molecular identities for 221 common C. oleifera resources. In this study, we performed ddRAD reduced-representation genome sequencing on 109 C. oleifera germplasms, using the C. oleifera genome as a reference and GATK4 for variant detection. A total of 6,252,197 population SNP loci and 722,237 population INDEL loci were identified. Compared to the study by Lin et al. [48], our study had a higher density of SNP molecular markers. Using ANNOVAR software for annotation analysis of the variant loci, we found that 145,679 SNPs and 12,756 INDELs were in exon regions. Variants in exon regions may lead to changes in the amino acids encoded by codons [49], and even mutations in start and stop codons, thereby altering the function of polypeptide chains and proteins and further affecting the traits of biological individuals. Therefore, variant loci located in exon regions have a significant impact on biological traits, and these variants may significantly influence the traits of C. oleifera.
Based on the combined results of Structure analysis, phylogenetic analysis, and principal component analysis, it is reasonable to divide the 109 C. oleifera germplasms into two groups: Q1 and Q2. The average Fst value across all SNP markers in the entire genome between these two groups is 0.0153, indicating a very weak level of differentiation between the two populations. Lin et al. [48] classified 221 C. oleifera materials into eight subgroups based on genetic structure, with Fst values ranging from 0 to 0.0085 among the subgroups. These findings further indicate a weak level of differentiation among the C. oleifera subgroups. Our results are consistent with their findings. Furthermore, Huang [50] used SSR molecular markers to analyze C. oleifera populations and found that the genetic differentiation coefficient of populations is lower than that of woody angiosperms. Therefore, the weak differentiation of C. oleifera populations may be attributed to the fact that it is a cross-pollinated plant that has undergone long-term domestication and extensive hybridization, leading to high gene flow among subgroups.
The average nucleotide diversity index for the Q1 subgroup is 4.45×10⁻⁴. These results are generally consistent with those of Lin et al. [48]. However, compared to Brazilian cassava plants (π=0.274) [51], the nucleotide diversity index of C. oleifera populations is very low, indicating a relatively low level of genetic diversity in germplasms. This may be due to long-term domestication of C. oleifera [52]. To obtain high-yielding and high-quality C. oleifera varieties, plants have been subjected to long-term domestication, targeted breeding, and continuous selection, resulting in improved agronomic traits. However, long-term domestication has favored alleles that establish population advantages, while relatively disadvantageous alleles have been eliminated. Over time, this has led to a decrease in genetic diversity within C. oleifera populations [48]. The Tajima's D values for both subgroups are greater than zero, indicating the presence of rare alleles at low frequencies and a relatively high number of intermediate-frequency alleles in both subgroups. This may be due to the similar growth environments of C. oleifera, leading to uniform selection pressure across the population.
The whole genome association analysis (GWAS) is based on linkage disequilibrium and involves correlation analysis between target traits and variation sites to identify significant variation sites, thereby uncovering candidate genes for the target traits. GWAS has made significant achievements in the mapping of complex traits and the improvement of crop varieties in both plants and animals, such as rice [53], apple [54], and walnut [55]. However, due to the gaps in the sequencing and annotation of the C. oleifera genome, there have been few studies using GWAS to analyze C. oleifera traits. We identified 157 genetic loci significantly associated with fruit traits in C. oleifera. Specifically, there were 9 significant loci for single fruit weight, 2 for fruit diameter, 6 for fruit shape index, 40 for peel thickness, 69 for seed number per fruit, 5 for fresh seed weight, 23 for fresh seed yield rate, 1 for dry seed yield rate, and 2 for dry kernel yield rate. Notably, no significant loci were found for fruit height. We further screened 110 candidate genes based on the significant SNP loci. Among these, 46 candidate genes showed GO annotations. Among them, 6 candidate genes belonged to molecular function, 9 to cellular component, and 31 to biological process, involving various gene functions. Remarkably, 16 out of the 31 candidate genes related to biological processes were involved in reproduction, indicating their important roles in the development of C. oleifera fruits. In the Kyoto Encyclopedia of Genes and Genomes (KEGG) annotation, 23 genes were successfully annotated, primarily associated with genetic information processing protein families, metabolic protein families, and terpenoid and polyketide metabolism. These significant SNP loci and candidate genes may be involved in multiple traits such as yield, fruit size, and peel thickness, providing important genetic information and molecular markers for the improvement of quality and yield of C. oleifera.
In our study, the annotation results of significant SNP sites indicate that most SNP markers are in intergenic regions. This may be attributed to the widespread distribution of intergenic regions in the C. oleifera genome [56]. Intergenic regions were once considered non-functional; however, the completion of sequencing for an increasing number of plant genomes, it is revealed that intergenic regions contain open chromatin. Moreover, it has been observed that larger plant genomes exhibit a higher proportion of open chromatin within their intergenic regions. Chromatin accessibility is involved in plant environmental responses, growth, and development [57,58]. The functions of intergenic regions in the C. oleifera genome require further research and exploration. Therefore, candidate genes located both within genes and in intergenic regions that harbor significant SNP sites have the potential to influence corresponding traits.
This study offers novel insights and empirical data to support research on the genetic evolution and genomic structure of C. oleifera. Moving forward, the integration of significant SNP loci and candidate genes will facilitate more comprehensive functional studies and gene editing experiments, thereby elucidating the molecular mechanisms underlying key traits of C. oleifera. This will provide more reliable and effective technical support for the genetic breeding and industrial development of C. oleifera.
5. Conclusions
This study performs a genetic diversity analysis of 109 C. oleifera germplasm accessions using fruit phenotypic traits and SNP molecular markers. GWAS identified significant SNP loci and candidate genes influencing fruit phenotypic traits. By integrating structure analysis, phylogenetic analysis, and PCA, we classified the 109 C. oleifera germplasm accessions into two distinct populations. The genetic differentiation between the two subgroups was weak, with nucleotide diversity indices (π) of 4.45×10⁻⁴ and 5.35×10⁻⁴, respectively, indicating low genetic diversity in C. oleifera germplasms. This may be attributed to long-term domestication of the species. The Tajima's D values for both subpopulations were greater than zero, suggesting the presence of numerous intermediate-frequency alleles. This may be attributed to the similar environments in which the C. oleifera germplasm grows, leading to uniform selective pressures within the population. GWAS was employed to pinpoint loci significantly associated with fruit traits in the germplasm resources. The proteins encoded by the identified candidate genes were primarily involved in various biological processes, including biosynthesis, regulation of stem system morphogenesis, reproduction, plant organ development, transport, and metabolic pathways. These proteins include plant hormone glycosyltransferases, peptidases and inhibitors, ubiquitin protein ligases, cytochrome P450s, and protein kinases. Notably, among the candidate genes related to 31 biological processes, 16 were specifically involved in reproduction. This highlights the crucial role these candidate genes play in the development of C. oleifera fruits. Our findings provide novel insights and data support for the study of genetic evolution and genomic structure in C. oleifera. Furthermore, they hold significant importance for the targeted breeding of elite varieties, paving the way for future improvements in C. oleifera cultivation.
Supplementary Materials
The following supporting information can be downloaded at the website of this paper posted on Preprints.org, File S1: The information of 109 Camellia oleifera germplasm accessions; File S2: Phenotypic data of the ten fruit traits for the 109 Camellia oleifera germplasm accessions; File S3: Summary of significant loci identified by GWAS for ten fruit traits in Camellia oleifera.
Author Contributions
Conceptualization, W.X., Z.L. and S.C.; methodology, W.X. and Y.Y.; formal analysis, W.X.; investigation, Y.Y., Y.X., Y.L., Y.H., W.L., M.Y., and H.H.; data curation, W.X.; writing—original draft, W.X.; writing—review and editing, Z.L., S.C., and H.H.; supervision, Z.L.; project administration, Z.L.; funding acquisition, S.C. All authors have read and agreed to the published version of the manuscript.
Data Availability Statement
All data and materials are available upon request from the corresponding author.
Conflicts of Interest
The authors declare no conflicts of interest.
References
- Yin, D.D.; Li, S.S.; Wu, Q.; Feng, C.Y.; Li, B.; Wang, Q.Y.; Wang, L.S.; Xu, W.Z. Advances in Research of Six Woody Oil Crops in China. Chin. Bull. Bot. 2018, 53, 110–125. [Google Scholar] [CrossRef]
- Zhang, P.P.; Chu, Z.Q.; Jiao, Q.; Zhou, B.Q.; Zhang, D.Q. Research Progress in Processing and Utilization of Woody Oil By-Products. China For. Prod. Lnd. 2022, 59, 63–68. [Google Scholar] [CrossRef]
- Quan, W.X.; Wang, A.P.; Gao, C.; Li, C.C. Applications of Chinese Camellia Oleifera and Its By-Products: A Review. Front. Chem. 2022, 10, 921246. [Google Scholar] [CrossRef]
- Liu, J.B.; Liao, Z.P.; Sun, T.Y.; Feng, N.; Long, Q.Z.; Zhong, H.Y.; Zhou, B. Fatty Acids, Triacylglycerol and Sn-2 Fatty Acids Distributions Variations in Seed Oil from Camellia Cultivars. J. Food Nutr. Sci. 2018, 6, 143–153. [Google Scholar] [CrossRef]
- Li, H.; Zhou, G.Y.; Zhang, H.Y.; Liu, J.A. Research Progress on the Health Function of Tea Oil. J. Plant Med. 2011, 5, 485–489. [Google Scholar] [CrossRef]
- Yu, J.; Yan, H.Q.; Wu, Y.G.; Wang, Y.; Xia, P.G. Quality Evaluation of the Oil of Camellia Spp. Foods 2022, 11, 2221. [Google Scholar] [CrossRef] [PubMed]
- Chen, T.; Liu, L.; Zhou, Y.L.; Zheng, Q.; Luo, S.Y.; Xiang, T.T.; Zhou, L.J.; Feng, S.L.; Yang, H.Y.; Ding, C.B. Characterization and Comprehensive Evaluation of Phenotypic Characters in Wild Camellia Oleifera Germplasm for Conservation and Breeding. Front. Plant Sci. 2023, 14, 1052890. [Google Scholar] [CrossRef]
- Wan, X.Q.; Sun, D.C.; Nie, Y.M.; Wang, Q.M.; Zhang, T.F.; Wang, R.; Li, F.F.; Zhao, X.D.; Gao, C. Analysis and Evaluation of Camellia Oleifera Abel. Germplasm Fruit Traits from the High-Altitude Areas of East Guizhou Province, China. Sci. Rep. 2024, 14, 18440. Available online: https://hub.uu2025.xyz/10.1038/s41598-024-69454-9. [CrossRef]
- Peng, S.F. Genome-Wide Association Studies of Important Economic Traits in Camellia oleifera Abel. Ph.D. Dissertation, Beijing Forestry University, Beijing, China, 2021. [Google Scholar] [CrossRef]
- Lv, H.H.; Wu, Y.F.; Li, Y.; Liang, T.; Zhou, L.X.; Chen, H. Variation and selection of excellent fruit traits in Camellia oleifera clones. J. For. Environ. 2021, 41, 519–526. [Google Scholar] [CrossRef]
- Chai, J.Y.; Wang, K.L.; Yao, X.H.; Teng, J.H.; Lin, P. Genetic Analysis of the Fruit and Oil Related Traits on Hybrid Offspring of Nested Mating of Camellia Oleifera. For. Res. 2023, 36, 1–10. [Google Scholar] [CrossRef]
- Zhou, W.C.; Wang, Z.W.; Dong, L.; Wen, Q.; Huang, W.Y.; Li, T.; Ye, J.S.; Xu, L.A. Analysis on the character diversity of fruit and seed of Camellia chekiangoleosa. J. Nanjing For. Univ. 2021, 45, 51–59. [Google Scholar] [CrossRef]
- Liu, L.X.; Yao, X.H.; Zeng, H.T.; Teng, J.H.; Xu, H.; Chen, J.J.; Chang, J. Effects of Flowering Biology and Pollination Methods on Fruit Development of Camellia oleifera. J. Southwest Univ. 2025, 47, 93–103. [Google Scholar] [CrossRef]
- Liang, T.; Li, X.S.; Li, Y.; Lv, H.H.; Zheng, G.H.; Chen, H. Variations in Fruit Traits in Cross-bred Camellia oleifera Clones. J. For. Environ. 2022, 42, 166–173. [Google Scholar] [CrossRef]
- Li, J.N.; Wu, M.Z.; Li, Y.; Ye, L.; Chen, S.P.; Chen, H. Comprehensive Analysis of the Phenotypic Variation among Seedling Populations of Camellia chekiangoleosa. J. For. Environ. 2024, 44, 274–282. [Google Scholar] [CrossRef]
- Ye, L.; Li, Y.; Liu, Y.X.; Zhou, L.X.; Li, J.N.; Liang, T.; Xie, W.W.; Xie, Y.Q.; Li, Z.Z.; Lv, H.H.; et al. Genetic Linkage Map Construction and QTL Mapping for Juvenile Leaf and Growth Traits in Camellia Oleifera. Agronomy 2024, 14, 3022. [Google Scholar] [CrossRef]
- Wang, Z.H.; Yong, C.W.; Chen, G.; Ding, Y.D.; Zhao, Z.G.; Lyu, A.Q.; Han, C.Y. Genetic Diversity Analysis of Different Cultivars of Camellia Oleifera Based on CDDP and ITS Molecular Markers. Chin. J. Oil Crop Sci. 2022, 44, 94–102. [Google Scholar] [CrossRef]
- Li, Y.M.; Yin, L.J.; He, X.Y.; Hu, C.L.; Wu, R.H.; Long, Q.; Yuan, D.Y.; Xiao, S.X. Ploidy and Fruit Trait Variation of Oil-Tea Camellia: Implication for Ploidy Breeding. J. Integr. Agric. 2024, 23, 2662–2673. [Google Scholar] [CrossRef]
- Ye, T.W.; Li, S.F.; Li, Y.M.; Xiao, S.X.; Yuan, D.Y. Impact of Polyploidization on Genome Evolution and Phenotypic Diversity in Oil-Tea Camellia. Ind. Crops Prod. 2024, 218, 118928. [Google Scholar] [CrossRef]
- Li, J.Q.; Liu, Y.C.; Wei, X.; Yang, Y.M.; Yang, Y.C.; Wang, S.; Gao, S.Q.; Lin, J.Q.; Xu, Y.G.; Sun, B.; et al. Research progress on genome-wide association analysis (GWAS) for fruit quality and resistance traits. Jiangsu Agric. Sci. 2024, 52, 10–19. [Google Scholar] [CrossRef]
- Jia, G.Q.; Huang, X.H.; Zhi, H.; Zhao, Y.; Zhao, Q.; Li, W.J.; Chai, Y.; Yang, L.F.; Liu, K.Y.; Lu, H.Y.; et al. A Haplotype Map of Genomic Variations and Genome-Wide Association Studies of Agronomic Traits in Foxtail Millet (Setaria Italica). Nat. Genet. 2013, 45, 957–961. [Google Scholar] [CrossRef]
- Wang, Q.X.; Xie, W.B.; Xing, H.K.; Yan, J.; Meng, X.Z.; Li, X.L.; Fu, X.K.; Xu, J.Y.; Lian, X.M.; Yu, S.B.; et al. Genetic Architecture of Natural Variation in Rice Chlorophyll Content Revealed by a Genome-Wide Association Study. Mol. Plant 2015, 8, 946–957. [Google Scholar] [CrossRef] [PubMed]
- Wang, L.; Yang, Y.M.; Zhang, S.Y.; Che, Z.J.; Yuan, W.J.; Yu, D.Y. GWAS Reveals Two Novel Loci for Photosynthesis-Related Traits in Soybean. Mol. Genet. Genomics 2020, 295, 705–716. [Google Scholar] [CrossRef]
- Zhang, M.Y.; Xue, C.; Hu, H.J.; Li, J.M.; Xue, Y.S.; Wang, R.Z.; Fan, J.; Zou, C.; Tao, S.T.; Qin, M.F.; et al. Genome-Wide Association Studies Provide Insights into the Genetic Determination of Fruit Traits of Pear. Nat. Commun. 2021, 12, 1144. [Google Scholar] [CrossRef]
- Zahid, G.; Aka Kaçar, Y.; Dönmez, D.; Kuden, A.; Giordani, T. Perspectives and Recent Progress of Genome-Wide Association Studies (GWAS) in Fruits. Mol. Biol. Rep. 2022, 49, 5341–5352. [Google Scholar] [CrossRef]
- Huang, X.M. Genetic Structure of Hexaploid Wild Camellia oleifera in Mount Jinggang and Lu based on Microsatellite Markers. Master’s Thesis, Nanchang University, Jiangxi, China, 2016. [Google Scholar]
- Zhu, Y.Y.; Yao, Y.; Xu, J.J.; Wang, G. Analysis on Phenotypic Diversity of Fruit and Seed Characters in Camellia meiocarpa. Guizhou Agric. Sci. 2016, 44, 125–129. [Google Scholar]
- Li, L.; Xu, F.; Zhang, G.F. Studies and Application of Gene Resources and Molecular Breeding of Aquatic Animals. J. Agric. Sci. Technol. 2011, 13, 102–110. [Google Scholar]
- Yan, M.M.; Wei, G.C.; Pan, X.H.; Ma, H.L.; Li, W.Z. A Method Suitable for Extracting Genomic DNA from Animal and Plant――Modified CTAB Method. Agric. Sci. Technol. 2008, 9, 39–41. [Google Scholar] [CrossRef]
- Zou, M.L.; Xia, Z.Q. Hyper-Seq: A Novel, Effective, and Flexible Marker-Assisted Selection and Genotyping Approach. The Innovation 2022, 3, 100254. [Google Scholar] [CrossRef]
- Chen, S.F.; Zhou, Y.Q.; Chen, Y.R.; Gu, J. Fastp: An Ultra-Fast All-in-One FASTQ Preprocessor. Bioinformatics 2018, 34, i884–i890. Available online: https://hub.uu2025.xyz/10.1093/bioinformatics/bty560. [CrossRef]
- Li, H.; Handsaker, B.; Wysoker, A.; Fennell, T.; Ruan, J.; Homer, N.; Marth, G.; Abecasis, G.; Durbin, R. 1000 Genome Project Data Processing Subgroup. The Sequence Alignment/Map Format and SAMtools. Bioinformatics 2009, 25, 2078–2079. Available online: https://hub.uu2025.xyz/10.1093/bioinformatics/btp352. [CrossRef] [PubMed]
- Li, H.; Durbin, R. Fast and Accurate Short Read Alignment with Burrows-Wheeler Transform. Bioinformatics 2009, 25, 1754–1760. Available online: https://hub.uu2025.xyz/10.1093/bioinformatics/btp324. [CrossRef]
- McKenna, A.; Hanna, M.; Banks, E.; Sivachenko, A.; Cibulskis, K.; Kernytsky, A.; Garimella, K.; Altshuler, D.; Gabriel, S.; Daly, M.; et al. The Genome Analysis Toolkit: A MapReduce Framework for Analyzing next-Generation DNA Sequencing Data. Genome Res. 2010, 20, 1297–1303. Available online: https://hub.uu2025.xyz/10.1101/gr.107524.110. [CrossRef]
- Wang, K.; Li, M.Y.; Hakonarson, H. ANNOVAR: Functional Annotation of Genetic Variants from High-Throughput Sequencing Data. Nucleic Acids Res. 2010, 38, e164–e164. Available online: https://hub.uu2025.xyz/10.1093/nar/gkq603. [CrossRef] [PubMed]
- Purcell, S.; Neale, B.; Todd-Brown, K.; Thomas, L.; Ferreira, M.A.R.; Bender, D.; Maller, J.; Sklar, P.; de Bakker, P.I.W.; Daly, M.J.; et al. PLINK: A Tool Set for Whole-Genome Association and Population-Based Linkage Analyses. Am. J. Hum. Genet. 2007, 81, 559–575. Available online: https://hub.uu2025.xyz/10.1086/519795. [CrossRef] [PubMed]
- Price, M.N.; Dehal, P.S.; Arkin, A.P. Fasttree: Computing Large Minimum Evolution Trees with Profiles Instead of a Distance Matrix. Mol. Biol. Evol. 2009, 26, 1641–1650. Available online: https://hub.uu2025.xyz/10.1093/molbev/msp077. [CrossRef]
- Broström, G. R: A Language and Environment for Statistical Computing; R Foundation for Statistical Computing: Vienna, Austria, 2013; Available online: http://www.R-project.org/ (accessed on 25 January 2026)ISBN 3-900051-07-0.
- Alexander, D.H.; Novembre, J.; Lange, K.L. Fast Model-Based Estimation of Ancestry in Unrelated Individuals. Genome Res. 2009, 19, 1655–1664. Available online: https://hub.uu2025.xyz/10.1101/gr.094052.109. [CrossRef]
- Francis, R.M. Pophelper: An R Package and Web App to Analyse and Visualize Population Structure. Mol. Ecol. Resour. 2017, 17, 27–32. Available online: https://hub.uu2025.xyz/10.1111/1755-0998.12509. [CrossRef]
- Browning, B.L.; Tian, X.; Zhou, Y.; Browning, S.R. Fast Two-Stage Phasing of Large-Scale Sequence Data. Am. J. Hum. Genet. 2021, 108, 1880–1890. [Google Scholar] [CrossRef]
- Guo, Z.F.; Yang, Q.N.; Huang, F.F.; Zheng, H.J.; Sang, Z.Q.; Xu, Y.F.; Zhang, C.; Wu, K.S.; Tao, J.J.; Prasanna, B.M.; et al. Development of High-Resolution Multiple-SNP Arrays for Genetic Analy-Ses and Molecular Breeding through Genotyping by Target Sequencing and Liquid Chip. Plant Commun. 2021, 2, 100230. Available online: https://hub.uu2025.xyz/10.1016/j.xplc.2021.100230. [CrossRef] [PubMed]
- Younessi-Hamzekhanlu, M.; Gailing, O. Genome-Wide SNP Markers Accelerate Perennial Forest Tree Breeding Rate for Disease Resistance through Marker-Assisted and Genome-Wide Selection. Int. J. Mol. Sci. 2022, 23, 12315. Available online: https://hub.uu2025.xyz/10.3390/ijms232012315. [CrossRef]
- Zhang, E.H.; Wang, X.Y.; Qin, Z.H.; Zhao, W.D.; Wei, C.J.; Wang, P.L. Genetic diversity analysis of Camellia oleifera in Guangxi using SSR markers. Guihaia 2016, 36, 806–811. [Google Scholar]
- Jiang, D.Z.; Fang, Y.Y.; Xiao, X.; Cheng, H.; Zhang, X.H.; Cheng, J.Y.; Li, L.L. Identifying Camellia oleifera Germplasm Accessions with Inter Simple Sequence Repeat Markers. Hubei Agric. Sci. 2018, 57, 119–125. [Google Scholar] [CrossRef]
- Chen, X.; Yun, Y.; Wu, Y.J.; Qi, H.S.; Yang, L.R.; Chen, J.L.; Zheng, D.J. Genetic Diversity Analysis of Camellia Oleifera Resources Based on SRAP Markers in Hainan Island. J. Trop. Subtrop. Bot. 2019, 27, 659–668. [Google Scholar] [CrossRef]
- Liu, K.; Wang, D.X.; Jiang, Z.P.; Mo, J.F.; Zeng, W.J.; Zhang, N.Y.; Liang, G.X. Development of SNP Markers of Camellia Oleifera Based on SLAF-Seq and Early Identification of Hybrids. Guangxi For. Sci. 2018, 47, 13–17. [Google Scholar] [CrossRef]
- Lin, P.; Wang, K.L.; Yao, X.H.; Ren, H.D. Development of DNA Molecular ID in Camellia Oleifera Germplasm Based on Transcriptome-Wide SNPs. Sci. Agric. Sin. 2023, 56, 217–235. [Google Scholar] [CrossRef]
- Zhang, J. Detection of Mutations of PAX9 and MSX1 Gene in Xinjiang Uyghur Patients with Non-syndrome Tooth Agenesis. Master’s Thesis, Xinjiang Medical University, Xinjiang, China, 2011. [Google Scholar]
- Huang, Y. Population Genetic Structure and Interspecific Introgressive Hybridization between Camellia meiocarpa and C. oleifera. Chin. J. Appl. Ecol. 2013, 24, 2345–2352. [Google Scholar] [CrossRef]
- Sun, Q. GWAS Analysis of Agronomic Traits of Cassava Germplasm in Brazil. Master’s Thesis, Guangxi University, Guangxi, China, 2020. [Google Scholar] [CrossRef]
- Zhu, Y.Z.; Liang, D.Y.; Song, Z.J.; Tan, Y.; Guo, X.L.; Wang, D.L. Genetic Diversity Analysis and Core Germplasm Collection Construction of Camellia Oleifera Based on Fruit Phenotype and SSR Data. Genes 2022, 13, 2351. [Google Scholar] [CrossRef] [PubMed]
- Li, G.L.; Zhang, H.L.; Li, J.J.; Zhang, Z.Y.; Li, Z.C. Genetic Control of Panicle Architecture in Rice. Crop J. 2021, 9, 590–597. [Google Scholar] [CrossRef]
- Kumar, S.; Molloy, C.; Hunt, M.; Deng, C.H.; Wiedow, C.; Andre, C.; Dare, A.; McGhie, T. GWAS Provides New Insights into the Genetic Mechanisms of Phytochemicals Production and Red Skin Colour in Apple. Hortic. Res. 2022, 9, uhac218. [Google Scholar] [CrossRef]
- Chen, P.P. Genome-wide Association Study of Common Walnut (Juglans regia L.) Fruit Traits. Ph.D. Dissertation, Northwest University, Shan’xi, China, 2022. [Google Scholar] [CrossRef]
- Xiao, Y. Preliminary Study on Population Genomics and Conservation Genomics of Oryza rufipogon. Master’s Thesis, South China Agricultural University, Guangzhou, China, 2020. [Google Scholar] [CrossRef]
- Li, Z.J.; Qin, Y. Chromatin Accessibility and the Gene Expression Regulation in Plants. Chin. Bull. Bot. 2021, 56, 664–675. [Google Scholar] [CrossRef]
- Dai, H. Comparative Analysis of the Association Between Major Agronomic Traits and SSR Molecular Markers in Camellia oleifera. Master’s Thesis, Guizhou Normal University, Guizhou, China, 2024. [Google Scholar] [CrossRef]
Figure 1.
Distribution of SNPs on chromosomes.
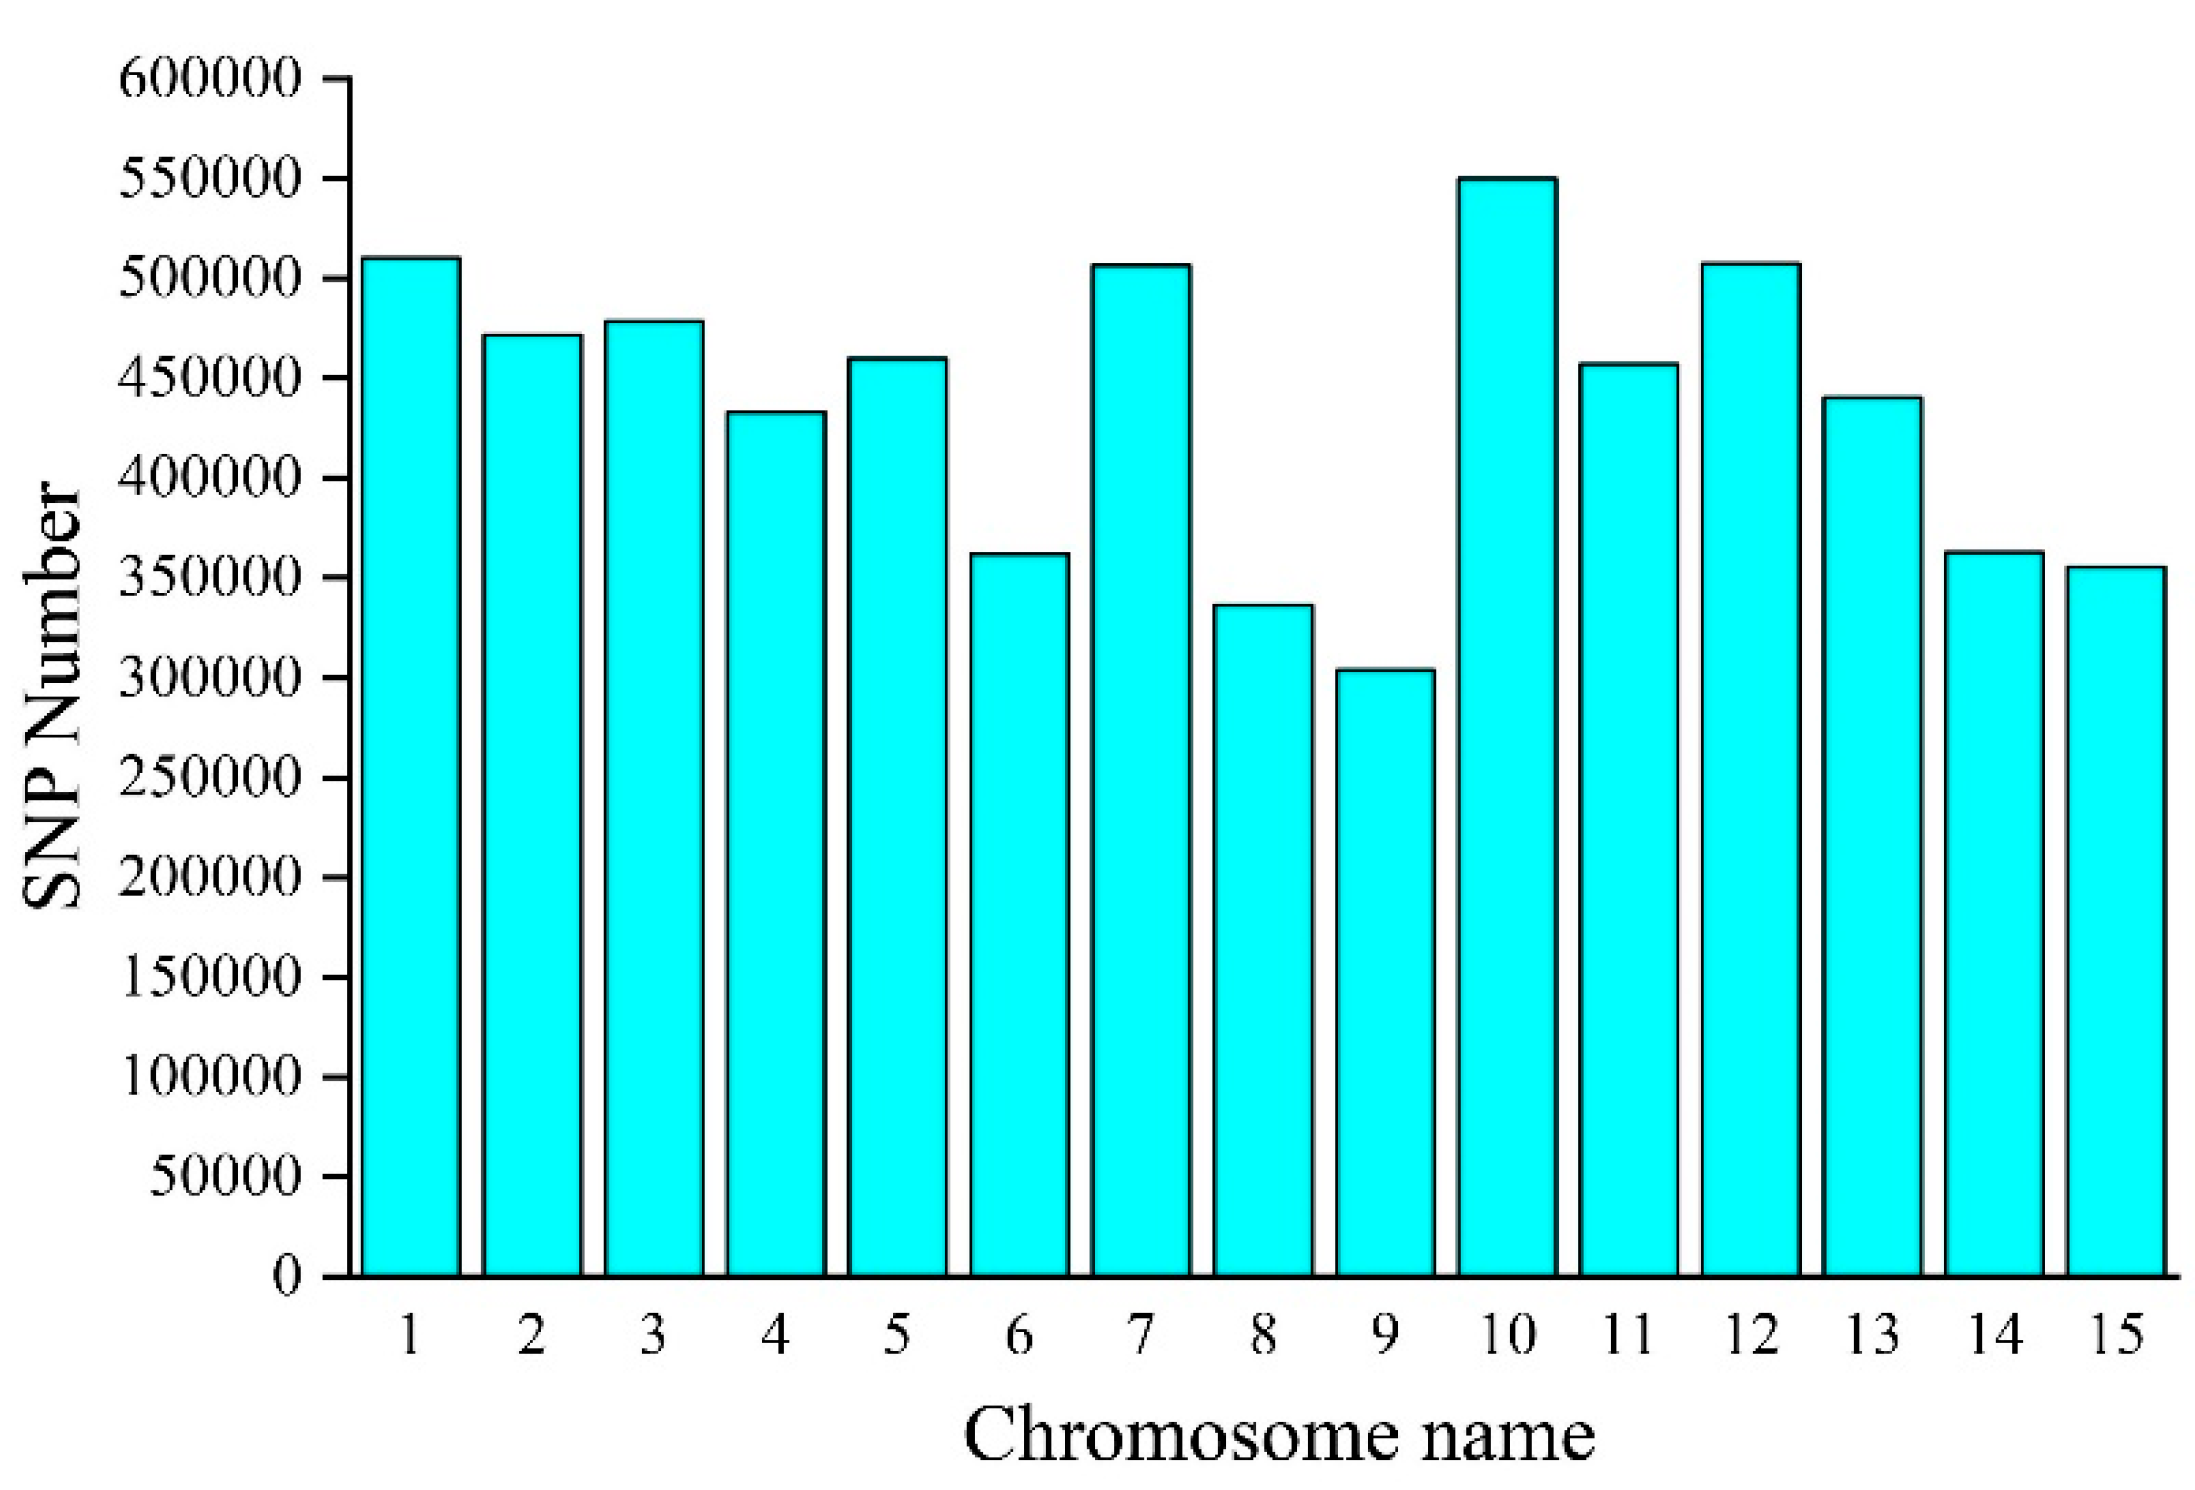
Figure 2.
Population genetic analysis of 109 C. oleifera germplasm resources. Notes: (A) Population structure analysis using a stacked bar plot (K=2-4); (B) Principal component analysis (PCA); (C) Phylogenetic tree (based on the approximate maximum likelihood method and the generalized time-reversible model).
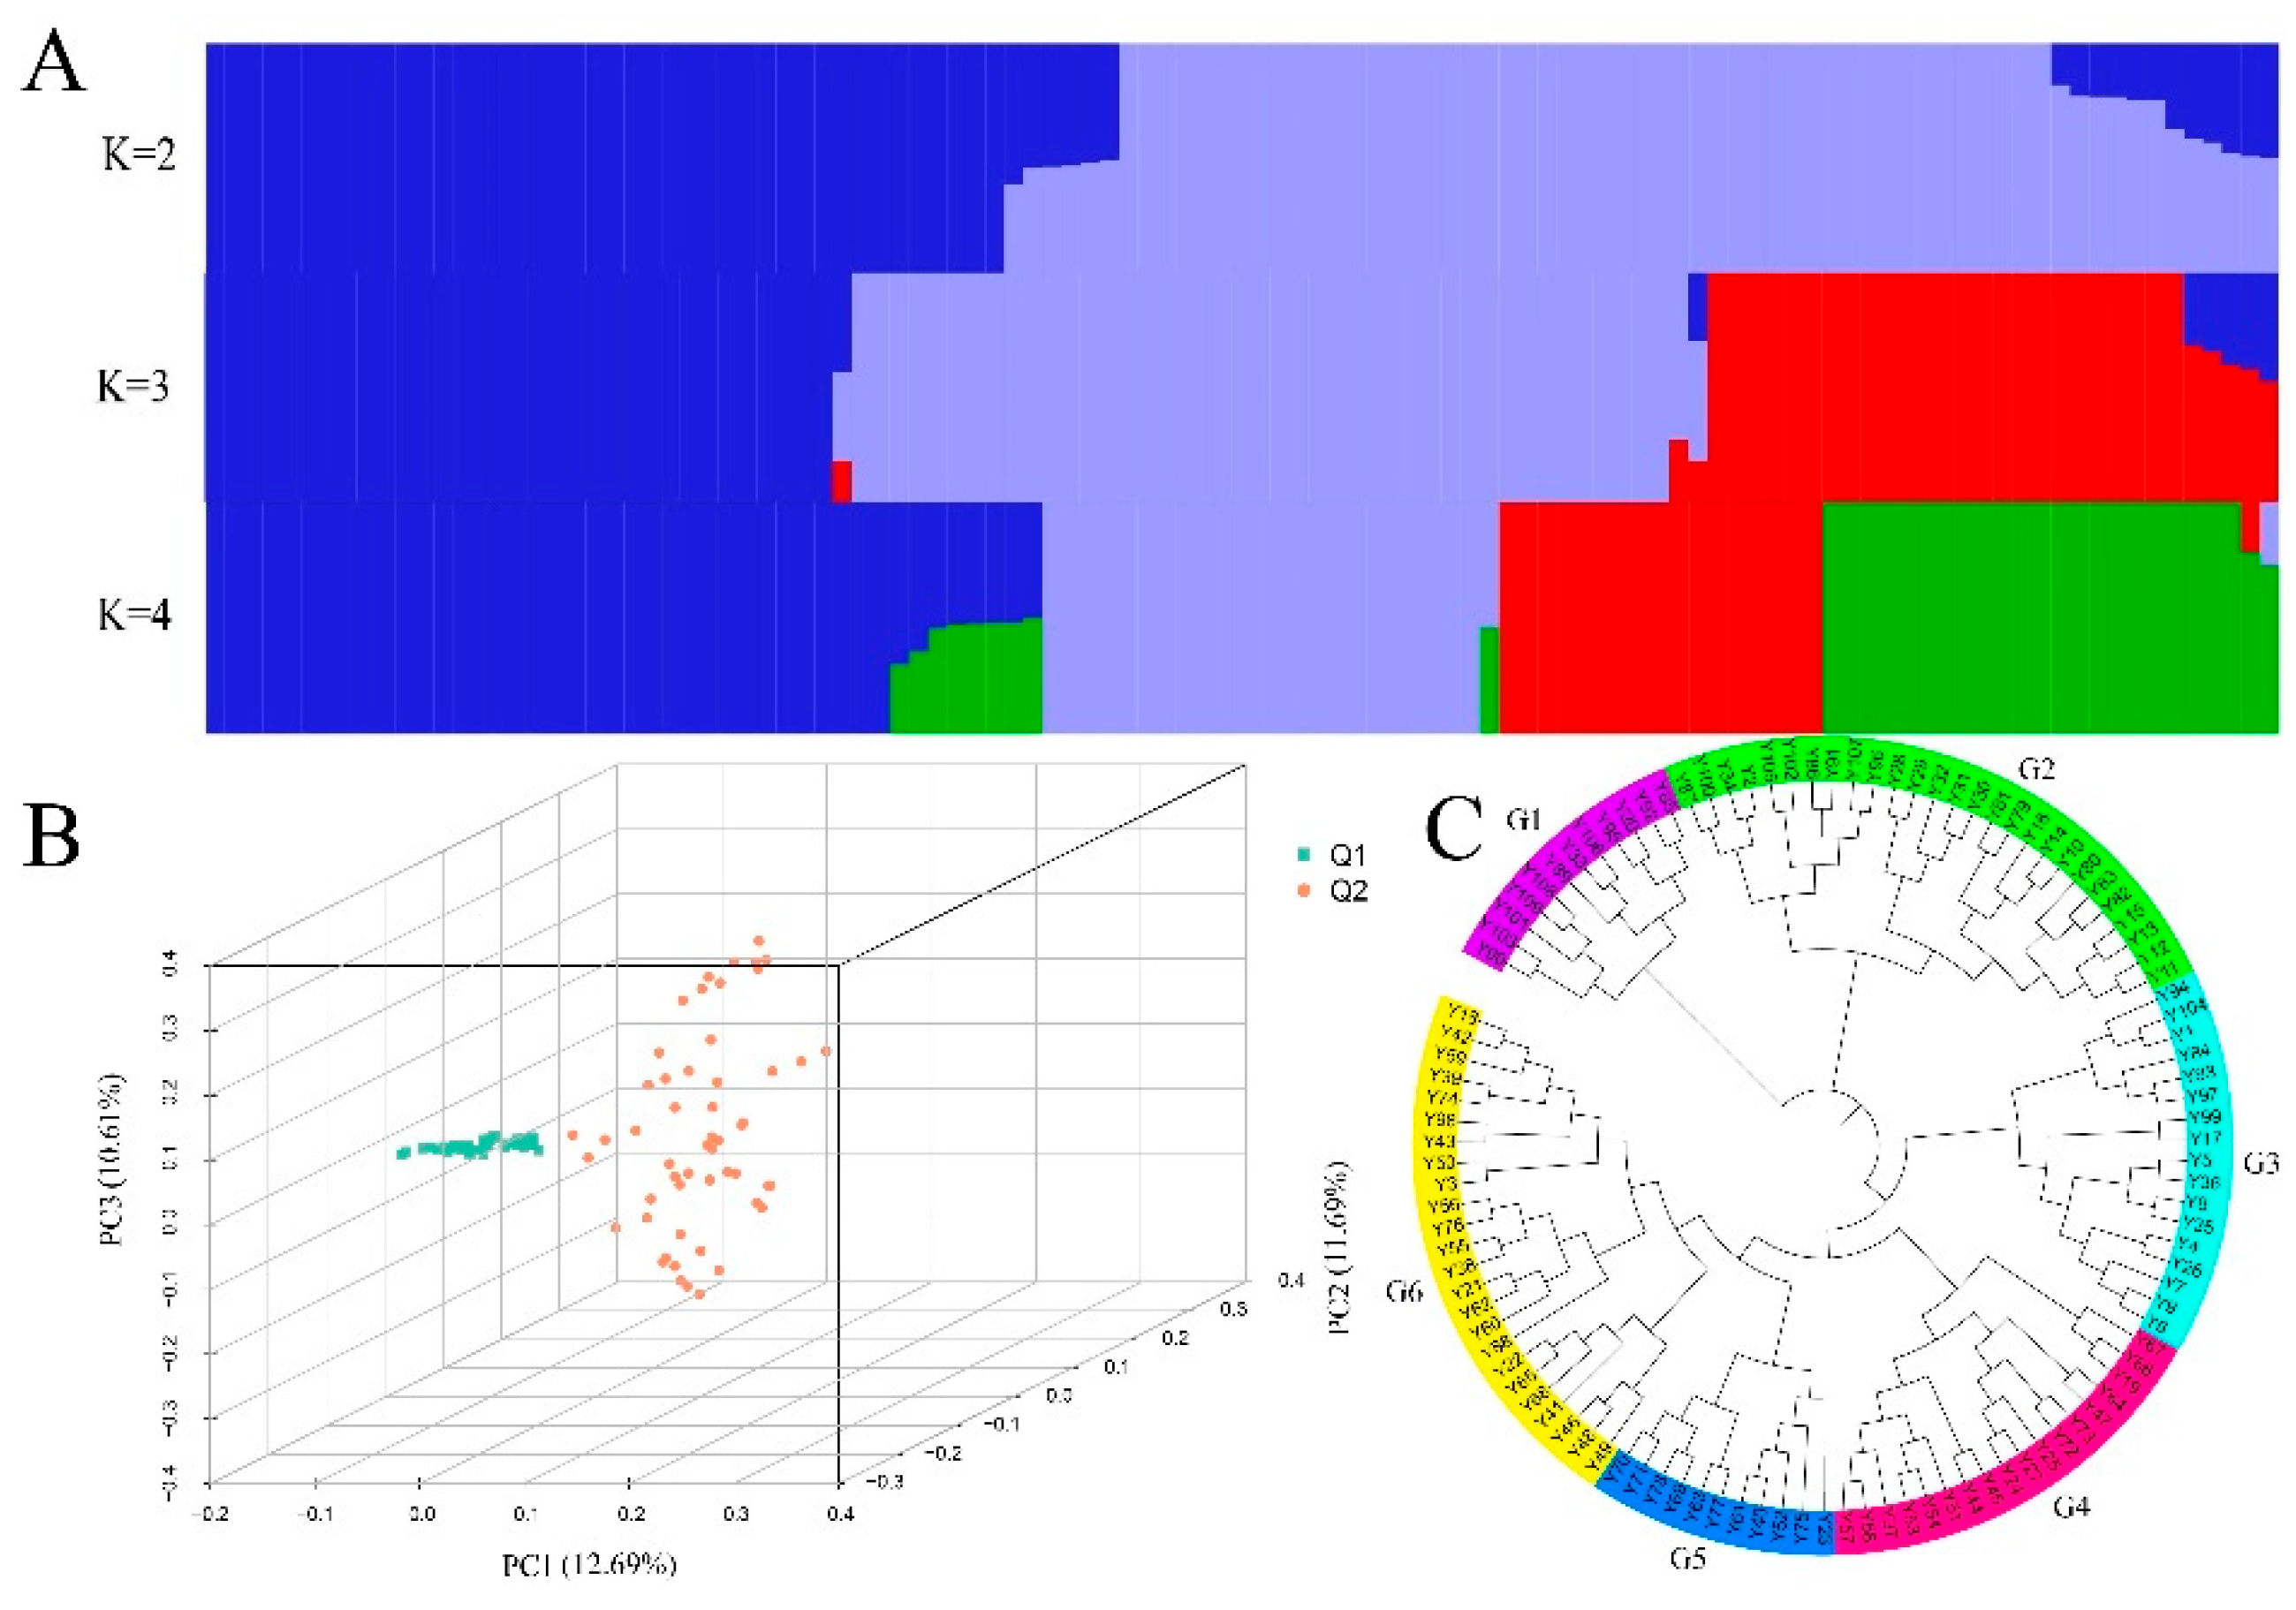
Figure 3.
Distribution of Fst values on chromosomes of 109 C. oleifera germplasm resources.
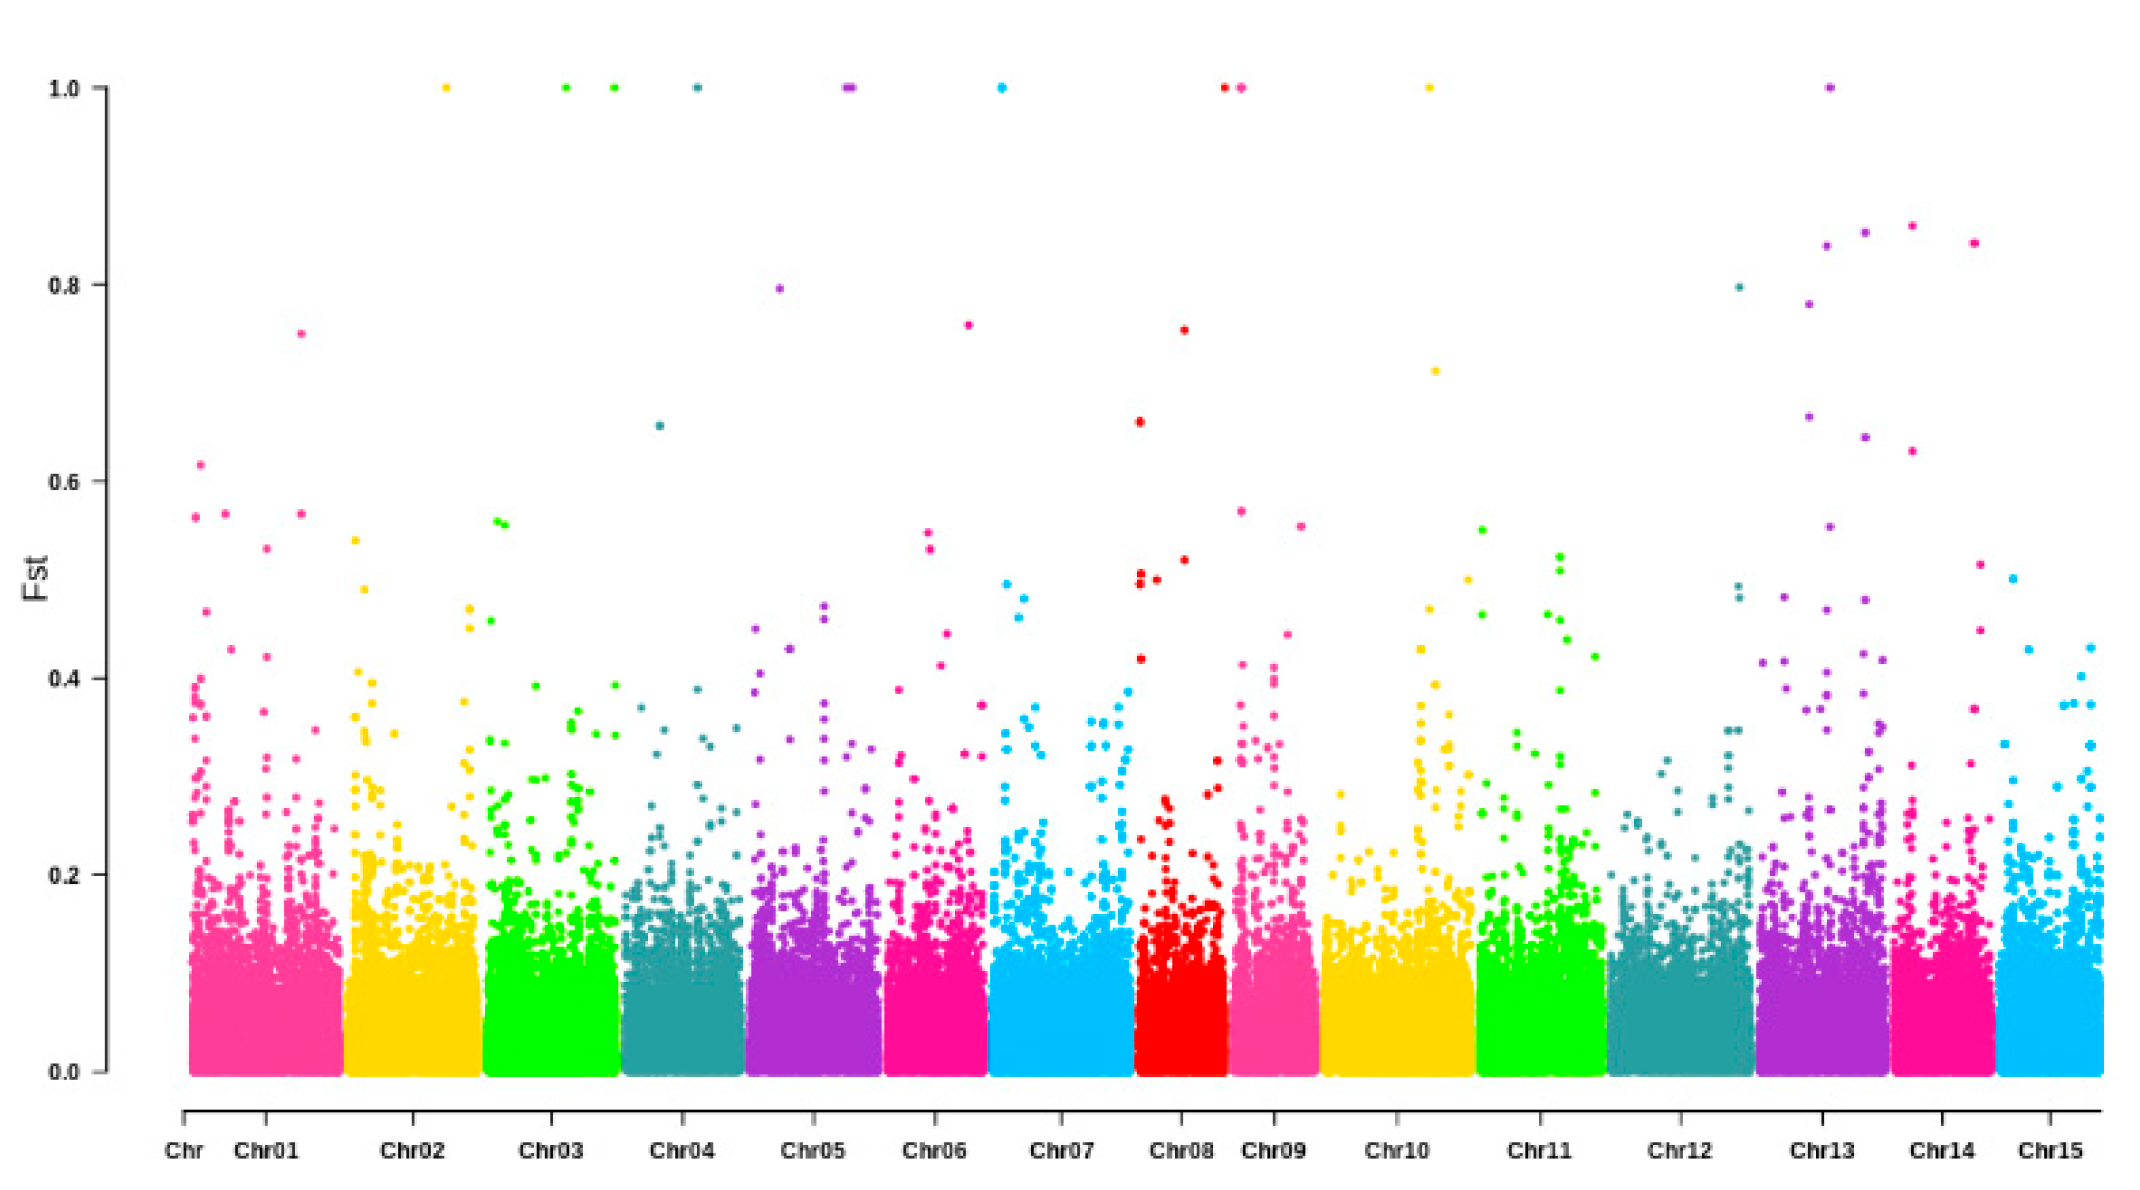
Figure 4.
The distribution of π and Tajima's D values of Q1 and Q2 populations on chromosomes.
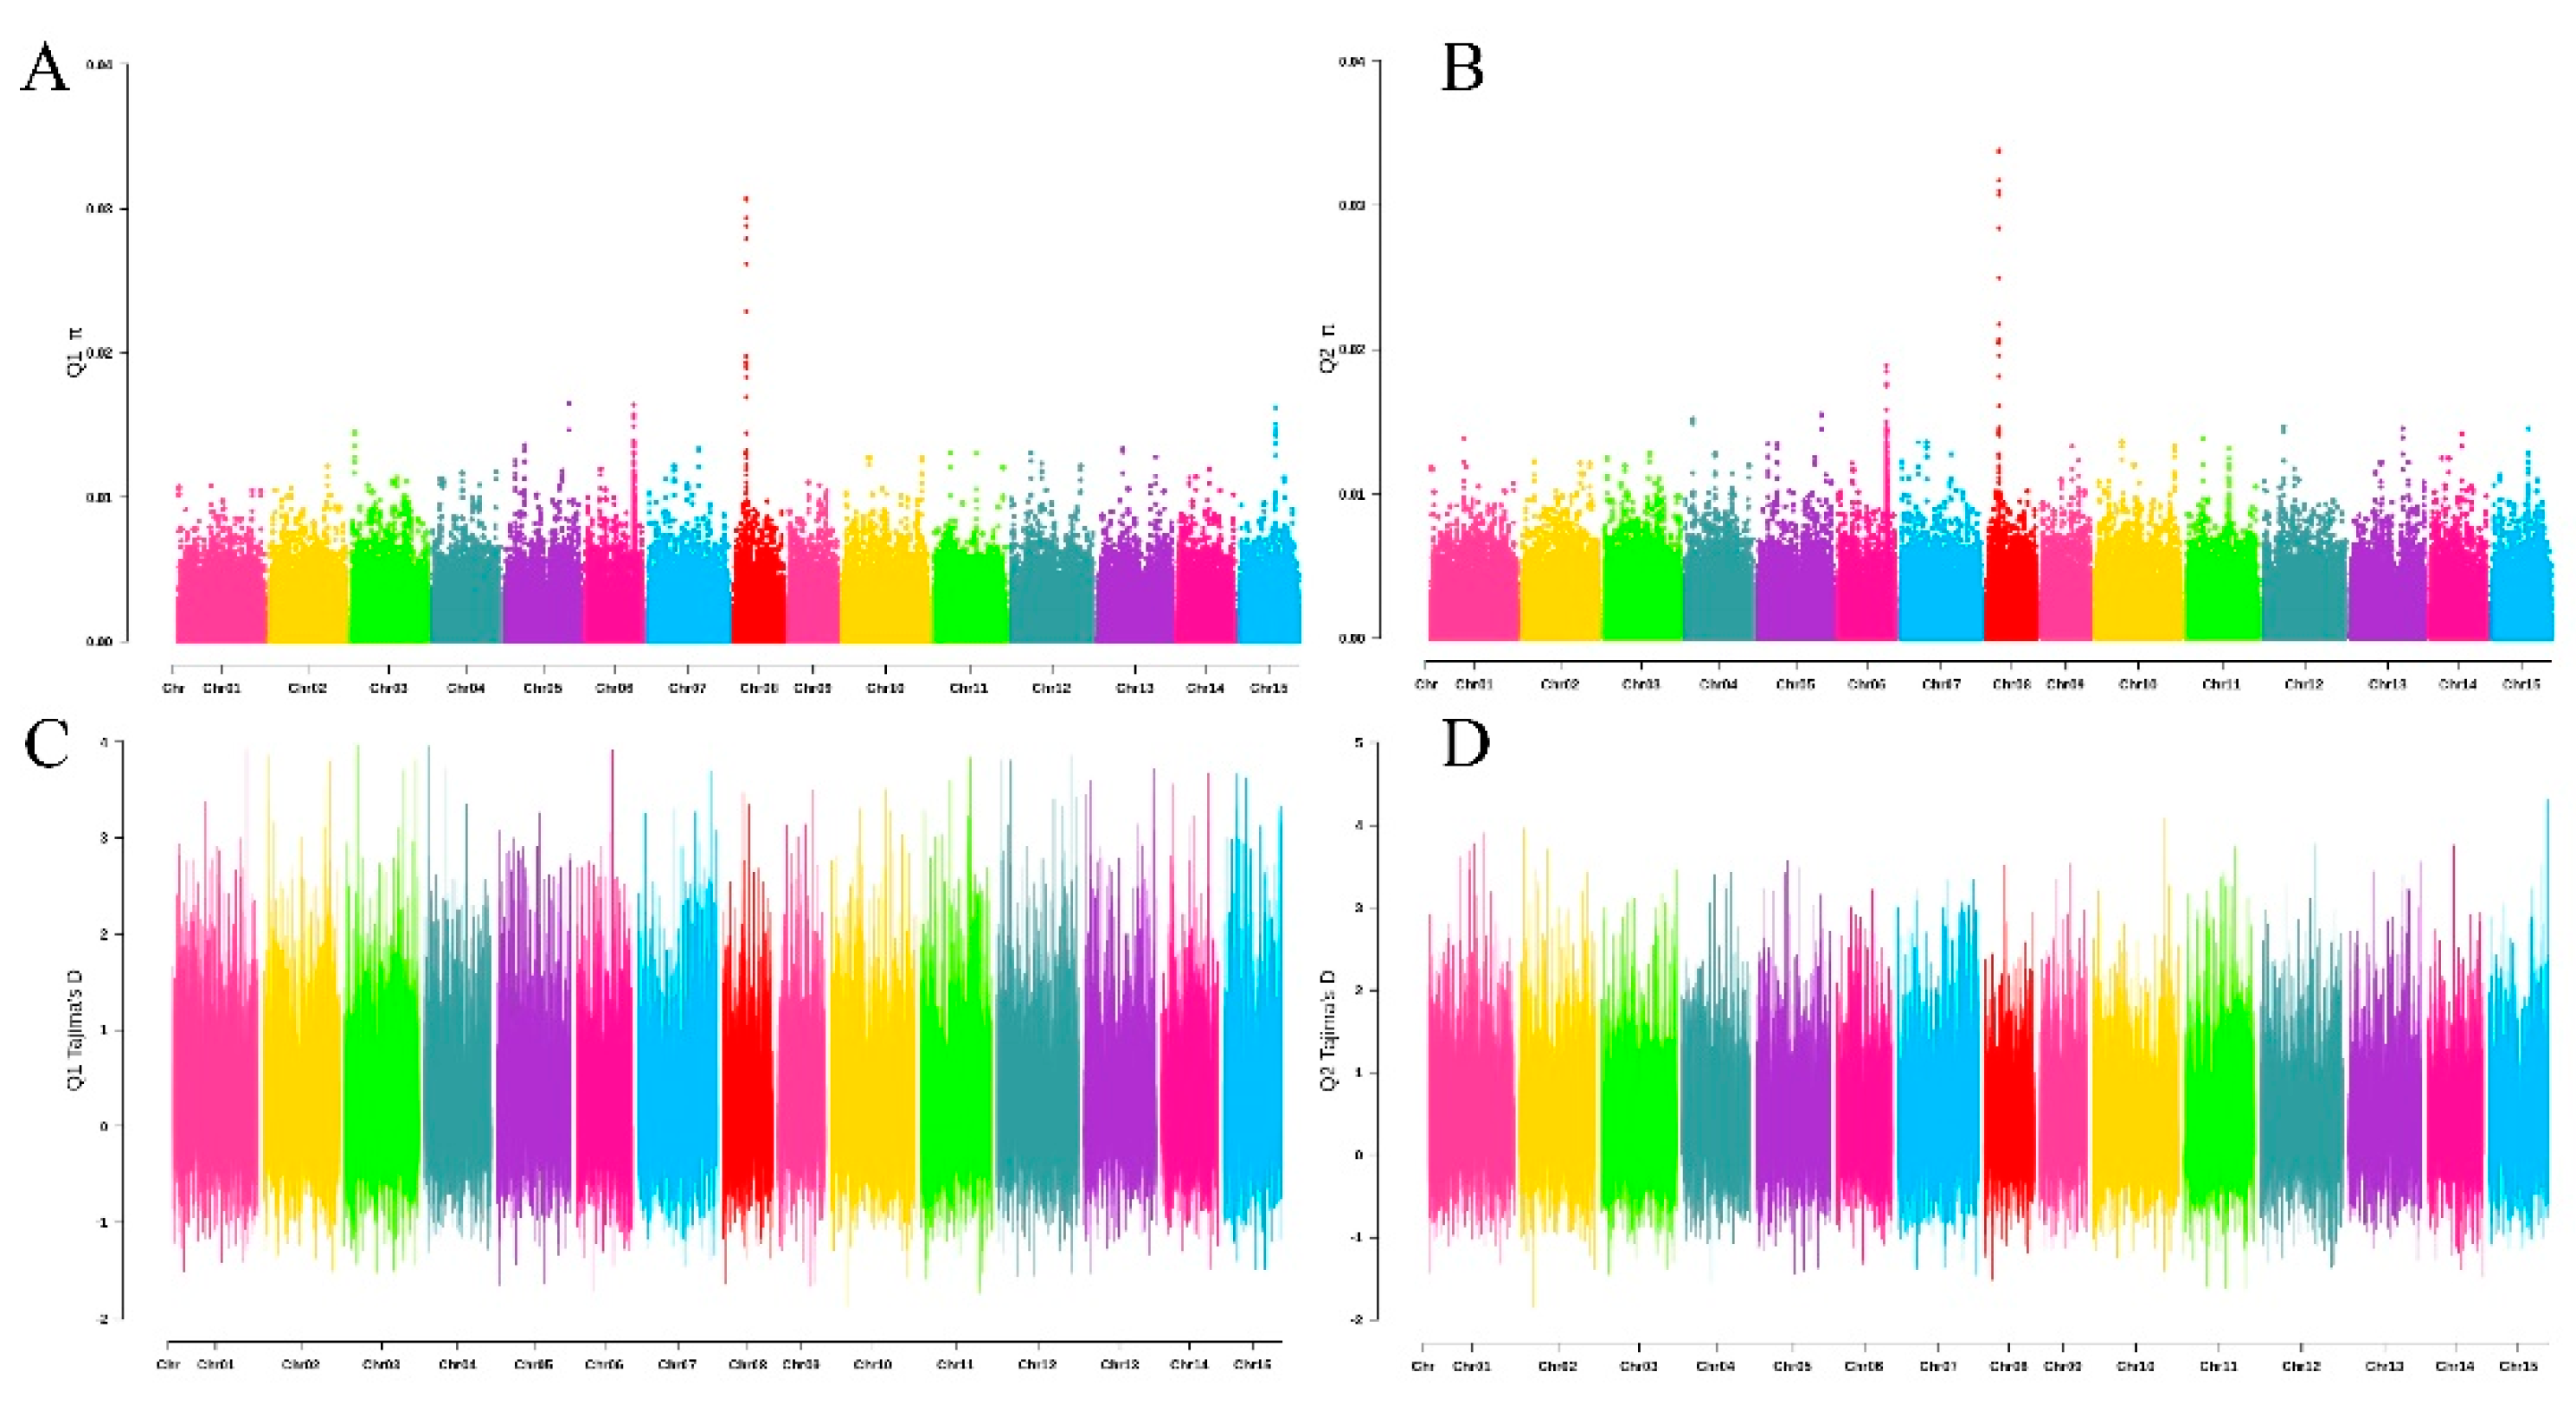
Figure 5.
Manhattan plots (left) and Q-Q plot (right) for GWAS of 10 fruit traits in 109 C. oleifera germplasm resources. Notes: (A) Single fruit weight; (B) Fruit height; (C) Fruit diameter; (D) Fruit shape index; (E) Peel thickness; (F) Number of seeds per fruit; (G) Fresh seed weight; (H) Fresh seed yield; (I) Dried seed yield; (J) Dry benevolence yield. Each point represents a SNP.
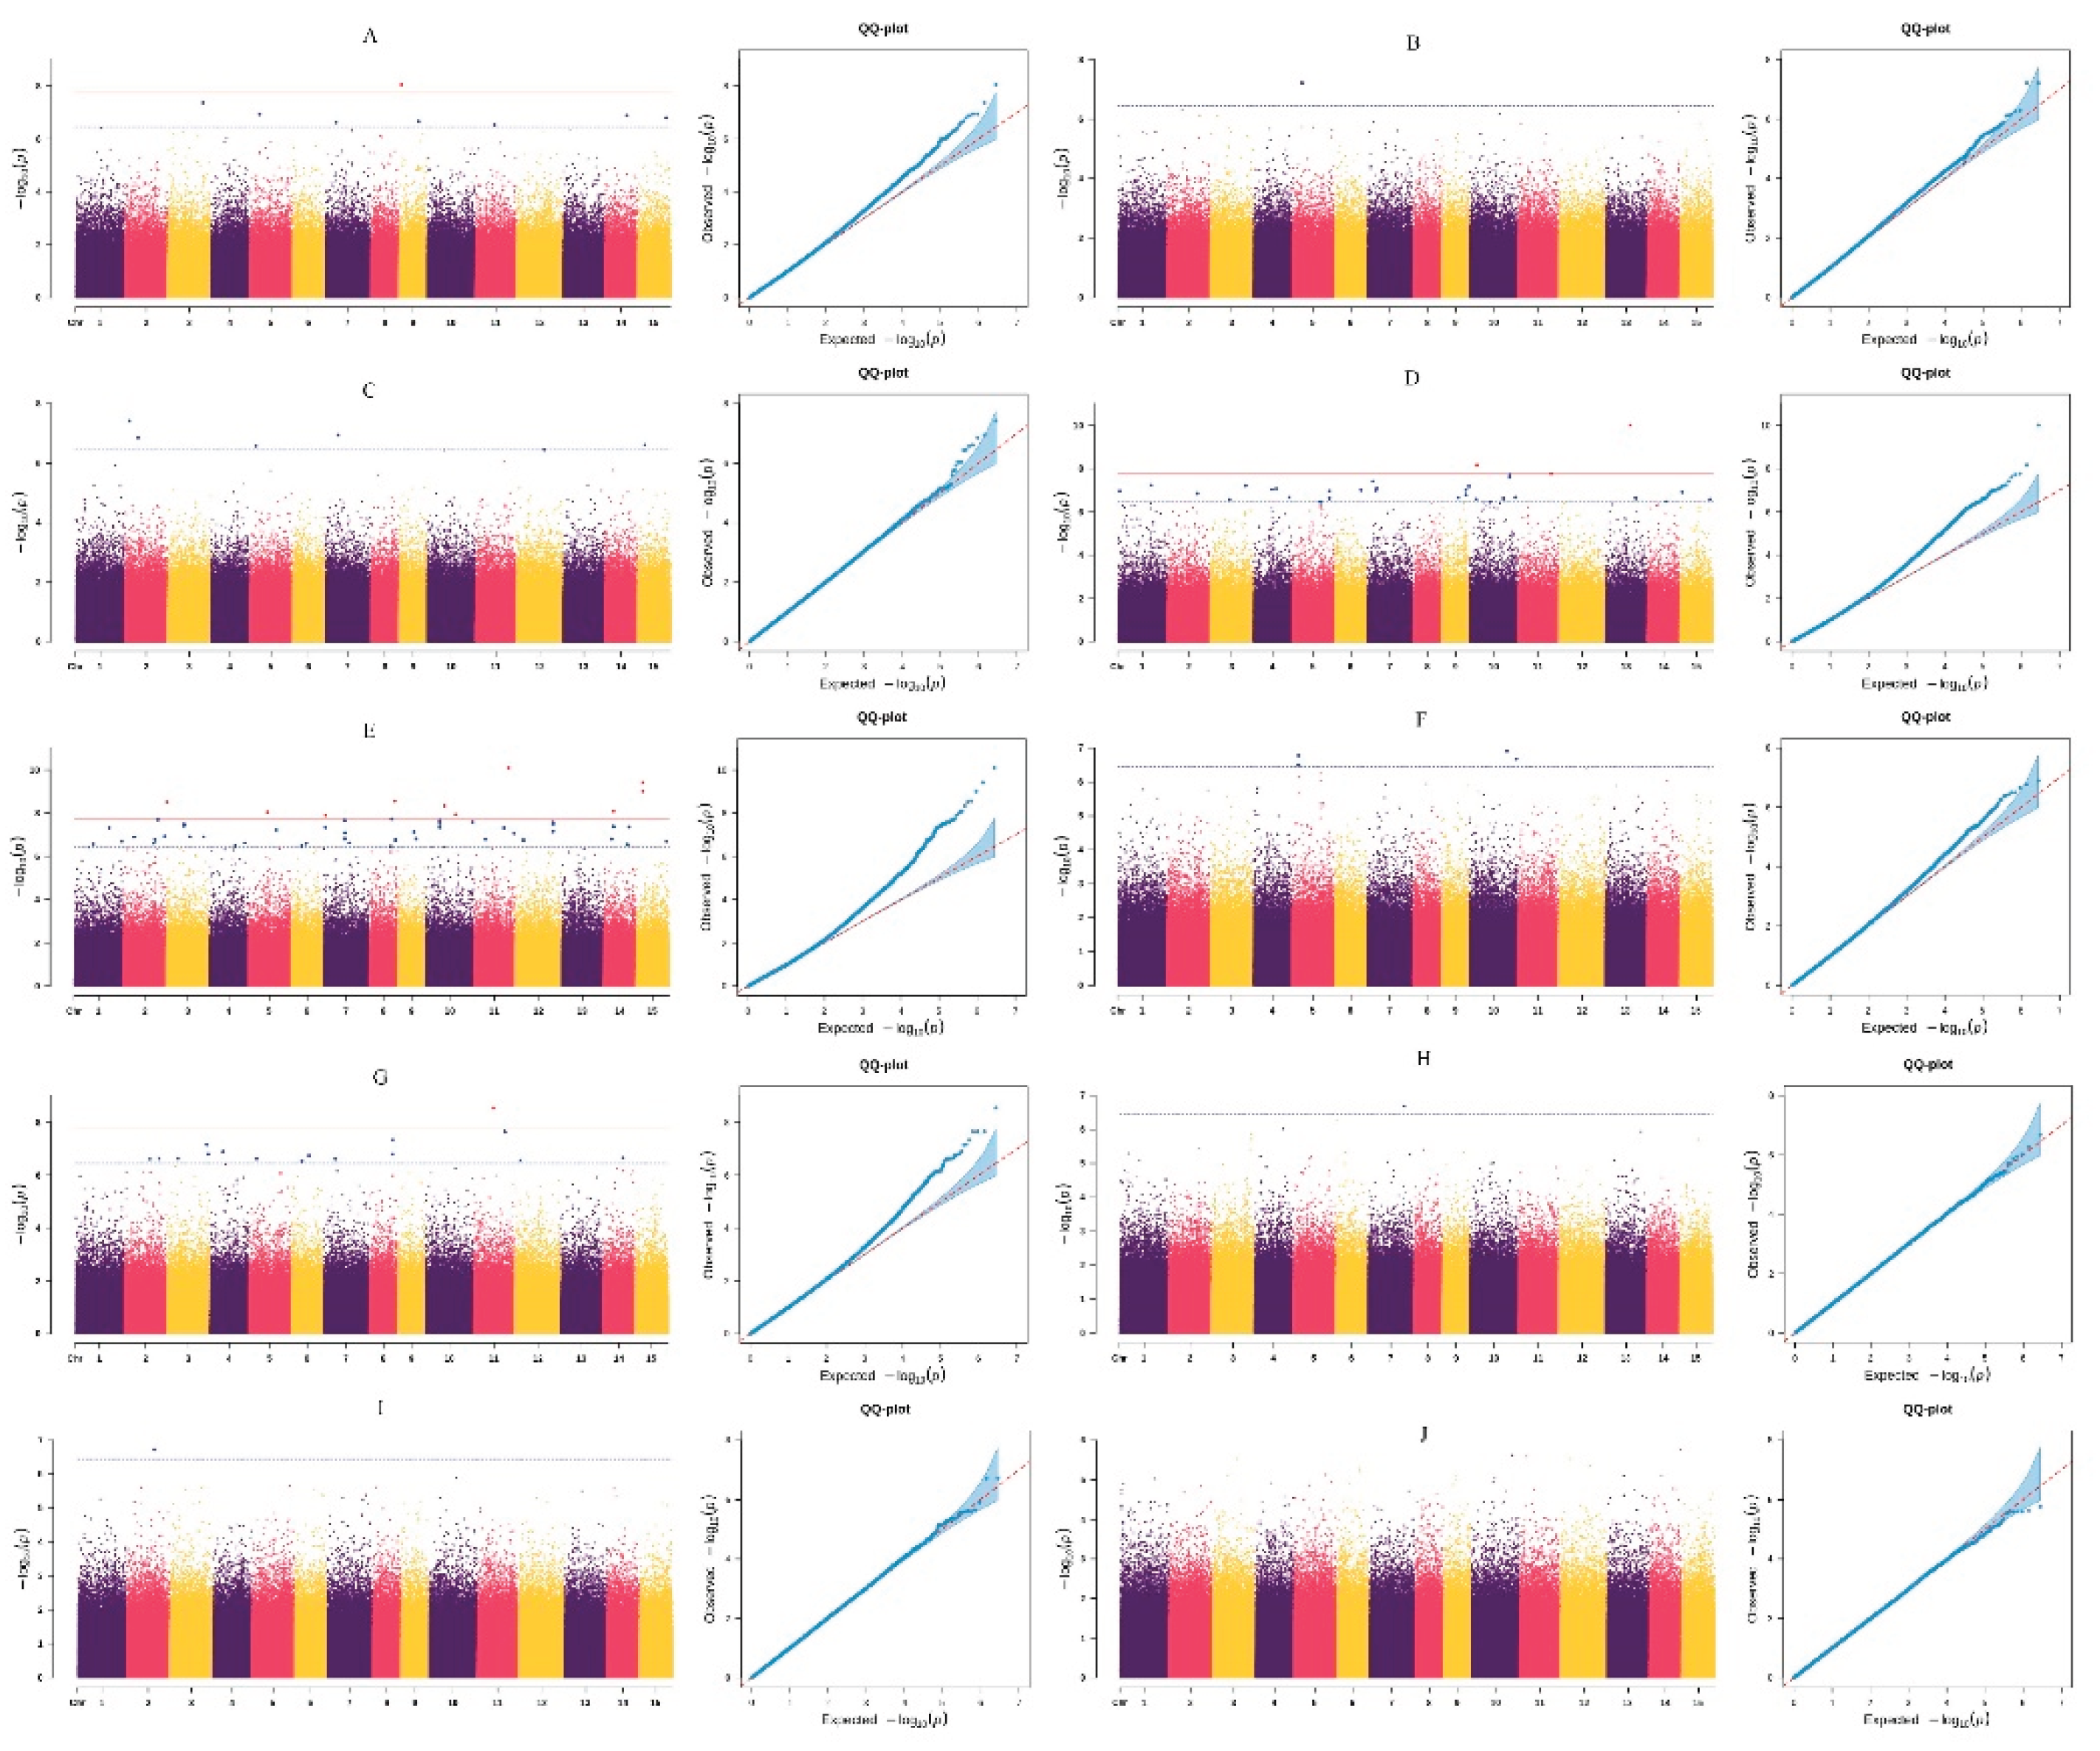

Table 1.
KEGG pathway enrichment for candidate genes.
| Trait | SNP | Gene ID | KEGG pathway |
|---|---|---|---|
| Fruit shape index | Chr02:20212286 | maker-Chr2-snap-gene-202.6-mRNA-1 | Messenger RNA biogenesis |
| Number of seeds per fruit | Chr01:84240256 | augustus_masked-Chr1-processed-gene-841.29-mRNA-1 | Transcription factors |
| Chr03:105301961 | augustus_masked-Chr3-processed-gene-1053.14-mRNA-1 | Ribosome | |
| Chr03:167365123 | maker-Chr3-snap-gene-1673.21-mRNA-1 | Ribosome biogenesis | |
| Chr08:96873006 | maker-Chr8-snap-gene-969.6-mRNA-1 | Protein kinases | |
| Chr08:114566238 | maker-Chr8-snap-gene-1146.2-mRNA-1 | Carotenoid biosynthesis | |
| Chr08:118268465 | genemark-Chr8-processed-gene-1182.39-mRNA-1 | Cytochrome P450 | |
| Chr10:63527409 | maker-Chr10-snap-gene-635.3-mRNA-1 | Ubiquitin system | |
| Chr10:134255167 | maker-Chr10-snap-gene-1342.19-mRNA-1 | Enzymes with EC numbers | |
| Chr11:153463775 | snap_masked-Chr11-processed-gene-1534.13-mRNA-1 | Chromosome and associated proteins | |
| Chr14:35355883 | augustus_masked-Chr14-processed-gene-353.13-mRNA-1 | Cytochrome P450 | |
| Chr14:114275276 | snap_masked-Chr14-processed-gene-1142.45-mRNA-1 | Transcription factors | |
| Peel thickness | Chr01:6227267 | maker-Chr1-snap-gene-62.12-mRNA-1 | Cysteine and methionine metabolism |
| Chr04:159617039 | maker-Chr4-snap-gene-1596.0-mRNA-2 | Membrane trafficking | |
| Chr05:167572639 | maker-Chr5-snap-gene-1676.3-mRNA-1 | Exosome | |
| Chr07:41713895 | maker-Chr7-snap-gene-417.23-mRNA-1 | Transcription factors | |
| Chr09:72920012 | maker-Chr9-snap-gene-729.27-mRNA-1 | Protein kinases | |
| Chr13:135481819 | augustus_masked-Chr13-processed-gene-1354.42-mRNA-1 | Membrane trafficking | |
| Fruit height | Chr07:49799009 | maker-Chr7-snap-gene-497.36-mRNA-2 | Peptidases and inhibitors |
| Chr09:85815245 | maker-Chr9-snap-gene-858.43-mRNA-1 | Ubiquitin system | |
| Chr14:97790223 | maker-Chr14-snap-gene-977.10-mRNA-1 | Glycosyltransferases | |
| Fresh seed yield | Chr02:158899204 | maker-Chr2-snap-gene-1588.1-mRNA-1 | Chaperones and folding catalysts |
| Chr08:106777293 | augustus_masked-Chr8-processed-gene-1068.0-mRNA-1 | Transcription factors |
Table 2.
GO functional annotation of candidate genes.
| Candidate gene | GO Category | Annotation |
|---|---|---|
| maker-Chr4-snap-gene-1582.40-mRNA-1 | molecular_function | function unknown |
| maker-Chr7-snap-gene-82.12-mRNA-1 | molecular_function | heterocyclic compound binding |
| maker-Chr12-snap-gene-379.34-mRNA-1 | molecular_function | nucleotide binding |
| maker-Chr14-snap-gene-1071.26-mRNA-1 | molecular_function | nucleotide binding |
| augustus_masked-Chr10-processed-gene-2066.42-mRNA-1 | molecular_function | heterocyclic compound binding |
| augustus_masked-Chr11-processed-gene-1405.6-mRNA-1 | molecular_function | function unknown |
| maker-Chr2-snap-gene-1558.2-mRNA-1 | cellular_component | bounding membrane of organelle |
| augustus_masked-Chr3-processed-gene-1053.14-mRNA-1 | cellular_component | protein-containing complex |
| maker-Chr3-snap-gene-1673.21-mRNA-1 | cellular_component | protein-containing complex |
| maker-Chr8-snap-gene-1008.6-mRNA-2 | cellular_component | bounding membrane of organelle |
| genemark-Chr8-processed-gene-1182.39-mRNA-1 | cellular_component | endoplasmic reticulum subcompartment |
| augustus_masked-Chr10-processed-gene-634.18-mRNA-1 | cellular_component | bounding membrane of organelle |
| maker-Chr10-snap-gene-635.3-mRNA-1 | cellular_component | ubiquitin ligase complex |
| maker-Chr10-snap-gene-1524.3-mRNA-1 | cellular_component | endoplasmic reticulum subcompartment |
| maker-Chr2-snap-gene-1588.1-mRNA-1 | cellular_component | bounding membrane of organelle |
| maker-Chr2-snap-gene-202.6-mRNA-1 | biological_process | reproduction |
| augustus_masked-Chr2-processed-gene-593.9-mRNA-1 | biological_process | RNA biosynthetic process |
| maker-Chr5-snap-gene-268.33-mRNA-1 | biological_process | RNA biosynthetic process |
| augustus_masked-Chr1-processed-gene-841.29-mRNA-1 | biological_process | reproduction |
| maker-Chr4-snap-gene-1150.47-mRNA-1 | biological_process | reproduction |
| maker-Chr5-snap-gene-1262.30-mRNA-1 | biological_process | reproduction |
| snap_masked-Chr6-processed-gene-475.2-mRNA-1 | biological_process | defense response to other organism |
| augustus_masked-Chr6-processed-gene-670.4-mRNA-1 | biological_process | reproduction |
| maker-Chr8-snap-gene-969.6-mRNA-1 | biological_process | cellular response to hormone stimulus |
| maker-Chr8-snap-gene-1146.2-mRNA-1 | biological_process | monocarboxylic acid metabolic process |
| maker-Chr10-snap-gene-1342.19-mRNA-1 | biological_process | transition metal ion transport |
| maker-Chr11-snap-gene-1345.57-mRNA-1 | biological_process | RNA biosynthetic process |
| augustus_masked-Chr12-processed-gene-1709.3-mRNA-1 | biological_process | reproduction |
| augustus_masked-Chr14-processed-gene-353.13-mRNA-1 | biological_process | monocarboxylic acid metabolic process |
| snap_masked-Chr14-processed-gene-1142.45-mRNA-1 | biological_process | reproduction |
| maker-Chr15-snap-gene-1364.34-mRNA-1 | biological_process | reproduction |
| maker-Chr1-snap-gene-62.12-mRNA-1 | biological_process | reproduction |
| maker-Chr4-snap-gene-1596.0-mRNA-2 | biological_process | autophagosome assembly |
| maker-Chr5-snap-gene-1275.2-mRNA-1 | biological_process | reproduction |
| maker-Chr5-snap-gene-1676.3-mRNA-1 | biological_process | transition metal ion transport |
| maker-Chr7-snap-gene-376.6-mRNA-1 | biological_process | regulation of shoot system morphogenesis |
| maker-Chr7-snap-gene-417.23-mRNA-1 | biological_process | reproduction |
| maker-Chr9-snap-gene-729.27-mRNA-1 | biological_process | reproduction |
| maker-Chr9-snap-gene-1211.11-mRNA-1 | biological_process | autophagosome assembly |
| augustus_masked-Chr13-processed-gene-1354.42-mRNA-1 | biological_process | regulation of localization |
| maker-Chr5-snap-gene-439.0-mRNA-1 | biological_process | reproduction |
| maker-Chr7-snap-gene-497.36-mRNA-2 | biological_process | monocarboxylic acid metabolic process |
| maker-Chr11-snap-gene-848.23-mRNA-1 | biological_process | reproduction |
| maker-Chr14-snap-gene-977.10-mRNA-1 | biological_process | reproduction |
| augustus_masked-Chr11-processed-gene-881.28-mRNA-1 | biological_process | plant organ development |
| maker-Chr5-snap-gene-439.0-mRNA-1 | biological_process | reproduction |
Disclaimer/Publisher’s Note: The statements, opinions and data contained in all publications are solely those of the individual author(s) and contributor(s) and not of MDPI and/or the editor(s). MDPI and/or the editor(s) disclaim responsibility for any injury to people or property resulting from any ideas, methods, instructions or products referred to in the content. |
© 2026 by the authors. Licensee MDPI, Basel, Switzerland. This article is an open access article distributed under the terms and conditions of the Creative Commons Attribution (CC BY) license (http://creativecommons.org/licenses/by/4.0/).
Copyright: This open access article is published under a Creative Commons CC BY 4.0 license, which permit the free download, distribution, and reuse, provided that the author and preprint are cited in any reuse.


