
Submitted:
09 February 2026
Posted:
10 February 2026
You are already at the latest version
Abstract
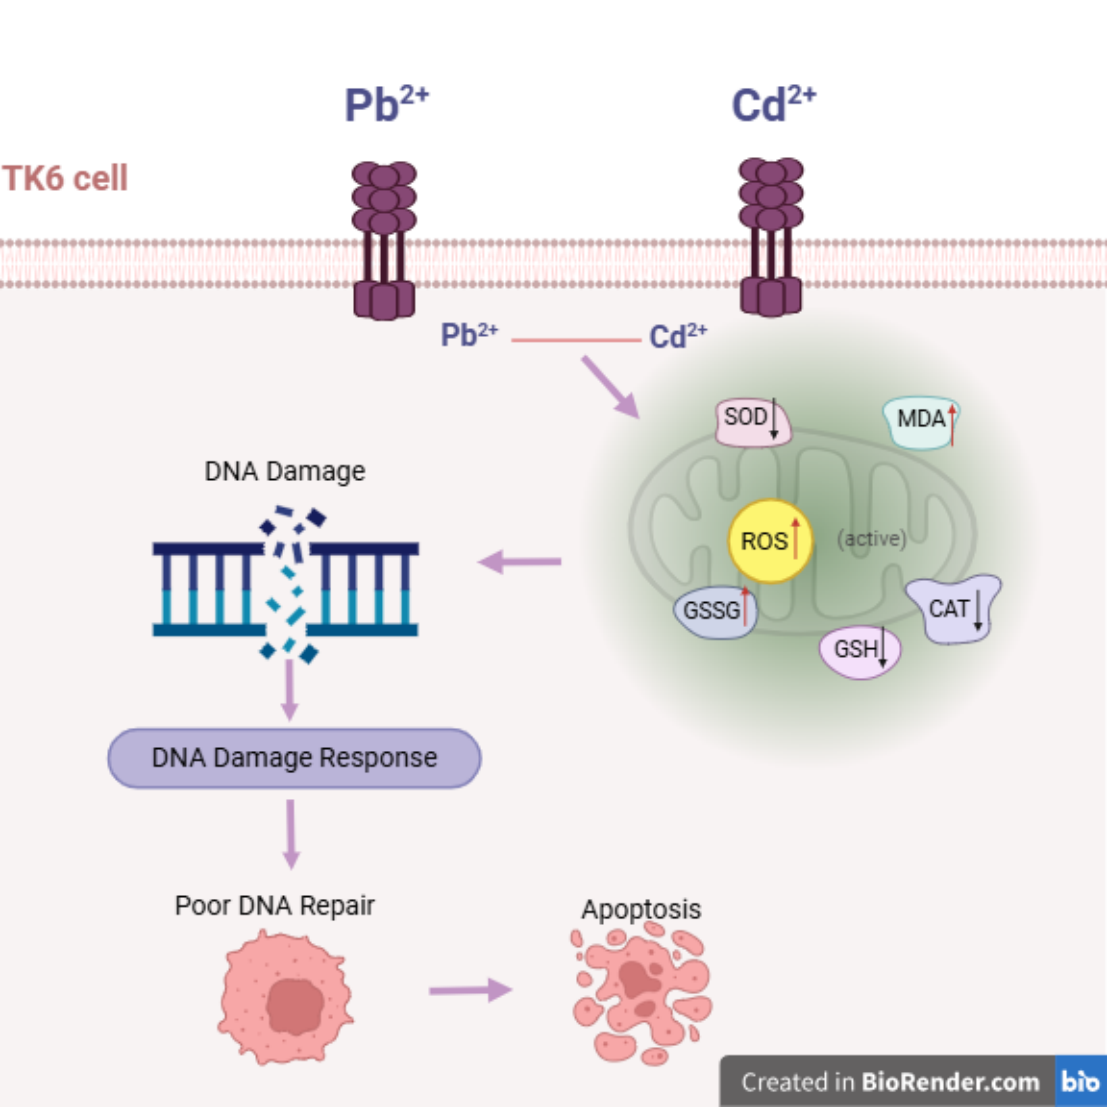
Lead (Pb) and cadmium (Cd) are common environmental pollutants. Our previous population study revealed a significant positive association between Pb and Cd exposure and the micronuclei frequency among lead smelting workers. However, the underlying mechanisms remain unclear. In this study, human lymphoblastoid TK6 cells were used to investigate the genotoxicity and its mechanisms induced by individual or combined exposure to Pb and Cd. Pb and Cd exposure, alone or in combination, triggered oxidative stress, as evidenced by reduced antioxidant enzyme activity (GSH, SOD and CAT) and increased content of ROS and GSSG. Both metals also induced pronounced DNA damage, as showed by elevated Tail DNA% in Comet assay and γ-H2AX fluorescence intensity. Inhibition of the DNA repair proteins, including BRCA1, CtIP, RAD52, and XRCC2, indicating impaired DNA repair capacity. Notably, Pb and Cd co-exposure produced an antagonistic effect, modulating oxidative stress indicators, cell-cycle arrest, DNA damage markers, DNA repair pathway proteins, and apoptosis-related proteins (Bax, Bcl-2, Bax/Bcl-2, Caspase-3). These findings demonstrate that Pb and Cd induce oxidative stress, DNA damage, and inhibition of DNA repair in TK6 cells. Our study provides new insights into the mechanisms of heavy metal–induced genotoxicity and identifies potential molecular targets for intervention.
Keywords:
lead exposure
; cadmium exposure
; oxidative stress
; DNA damage
; DNA repair
; apoptosis
1. Introduction
Lead (Pb) and cadmium (Cd) are among the most pervasive environmental pollutants due to their extensive use in mining, smelting, battery manufacturing, and electronic waste recycling. These metals accumulate persistently in soil, water, and the food chain, resulting in chronic human exposure and long-term health risks(Mitkovska, Dimitrov et al. 2020, Li, Yao et al. 2024). The International Agency for Research on Cancer (IARC) classifies Cd as a Group 1 human carcinogen and Pb as a Group 2A probable human carcinogen, highlighting their significant toxicity and public health relevance(Dai, Zhang et al. 2023, Parvez, Jahan et al. 2024).
Growing evidence indicates that both metals exert strong genotoxic effects. Pb has been shown to impair DNA synthesis, interfere with chromosomal segregation, and induce DNA strand breaks, thereby compromising genomic stability(Wang, Wang et al. 2023, Dey, Kamila et al. 2024). Cd similarly causes DNA single- and double-strand breaks, chromosomal aberrations, and alterations in gene expression(Zhu, Huang et al. 2021, Wang, Gan et al. 2024). Epidemiological and animal studies demonstrate elevated oxidative DNA damage and micronuclei formation in populations or animals exposed to Pb or Cd, underscoring their contribution to genomic stability and disease risk(Li, Liu et al. 2009).
Oxidative stress is considered a major driver of Pb- and Cd-mediated cytotoxicity. Both metals promote the generation of reactive oxygen species (ROS), disrupt the balance of the oxidation-antioxidant system, and deplete molecules such as superoxide dismutase (SOD) and glutathione (GSH). Excessive ROS leads to lipid peroxidation, protein oxidation, and oxidative DNA damage, including 8-oxo-dG formation(Liu, Yu et al. 2021). In addition, Cd has been shown to suppress antioxidant-related gene expression and enhance Pb-induced oxidative damage in a dose- and time-dependent manner(Singh, Mitra et al. 2021). These findings suggest that oxidative stress may play a central role in mediating the genotoxic effects of Pb and Cd exposure.
Apoptosis is another key outcome of heavy metal toxicity. Cd induces apoptosis in various cell types(Dong, Xiao et al. 2021, Hao, Ge et al. 2022, Sun, Lv et al. 2022, Sun, Zhang et al. 2023), and may exert transgenerational effects via epigenetic modifications of apoptosis-related genes and microRNAs(Yang, Han et al. 2020). Pb exposure also triggers apoptosis through ROS accumulation, mitochondrial dysfunction, and altered expression of Bax, Bcl-2, and Caspases(Shaik and Jamil 2009). Although some studies suggest that Pb and Cd co-exposure may exacerbate progress of apoptosis, there is a lack of systematic study on the regulatory mechanisms linking oxidative stress, DNA damage, DNA repair pathway and apoptosis under combined exposure to these two metals.
To address these gaps, we employed human lymphoblastoid TK6 cells to investigate the genotoxic mechanisms induced by Pb and Cd, individually or in combination. By assessing oxidative stress indicators, DNA damage markers, DNA repair and apoptosis pathway, this study aims to elucidate the molecular basis of heavy metal–induced cytotoxicity. These findings may provide new insights into the biological consequences of Pb and Cd co-exposure and identify potential molecular targets for prevention and intervention.
2. Materials and Methods
2.1. Cell culture and Treatment
TK6 cells, owing to their high differentiation potential and genomic stability, were purchased from Pricilla Corporation in China and cultured in RPMI 1640 Medium (Solarbio, Beijing, China, 31800) supplemented with 10% fetal bovine serum and 1% penicillin-streptomycin (100U/mL penicillin and 100μg/mL streptomycin) at 37°C and 5% CO2, with the culture medium replaced every two days. In this study, the TK6 cells were divided into five groups : the control group, Pb group (480 μM lead acetate), Cd group (33 μM cadmium chloride), mixed group (480 μM lead acetate + 33 μM cadmium chloride), and resveratrol group (mixed group + 10 μM resveratrol). All treatments were administered for 24 hours.
2.2. CCK-8 Assay
Cell viability was assessed using the CCK-8 assay (Beyotime, Shanghai, China; C0042). Briefly, 100 μL of a cell suspension (1.0×10⁵ cells/mL) was seeded into each well of a 96-well plate and incubated at 37℃ in a humidified atmosphere containing 5% CO2 for 12 h. A series of Pb and Cd concentrations were then applied to evaluate dose-dependent manners on cell survival, apoptosis and enzyme activities, with lead acetate [Pb(CH3COO)2] ranging from 0 to 1600 μM (0, 100, 200, 400, 800, 1600 μM) and cadmium chloride (CdCl2) from 0 to 160 μM (0, 10, 20, 40, 80, 160 μM). After 24 h of exposure, the culture medium was removed and replaced with fresh medium containing 10 μL of CCK-8 reagent per well, followed by incubation for an additional 2 h. The absorbance values at 450 nm were measured using a microplate reader, and cell viability was calculated accordingly.
2.3. Intracellular ROS Detection
Intracellular ROS levels were detected using the fluorescent probe DCFH-DA . TK6 cells (1.0×10⁶ cells/mL) were seeded into 6-well plates and exposed to different treatments at 37 °C for 24 h. Subsequently, the cells were washed with ice-cold PBS buffer and incubated at 37 °C in the dark for 40 min with DCFH-DA (10 μM), according to the instructions of the ROS detection kit (Beyotime, Shanghai, China; S0033S). The cells were then washed three times with PBS and then stained with DAPI for 5 min. Fluorescence intensity was measured under a fluorescence microscope with an excitation wavelength of 488 nm and an emission wavelength of 525 nm. Data Analysis was performed using ImageJ software.
2.4. Oxidative Stress Indicators
Oxidative damage was evaluated by measuring malondialdehyde (MDA), the content of oxidized and reduced glutathione (GSSG/GSH), and the activities of antioxidant enzymes superoxide dismutase (SOD) and catalase (CAT). TK6 cells from the different treatment groups were washed once with ice-precooled PBS and then lysed in ice-cold RIPA buffer for 30 min. The lysates were centrifuged at 12,000 rpm for 10 min to collect the supernatants, which were used to determine MDA (μmol/mg protein), GSSG and GSH content (μmol/mg protein), SOD (units/mg protein), and CAT activity (units/mg). Protein concentrations were determined using a BCA protein assay kit (Beyotime, Shanghai, China; P0011).
2.5.γ-. H2AX Levels
DNA damage was further assessed using a γ-H2AX detection kit (Beyotime, Shanghai, China; C2035S), which quantifies γ-H2AX levels, a well-established biomarker for DNA double-strand breaks. TK6 cells (1.0×10⁶ cells/mL) were seeded into 6-well plates and exposed to the indicated treatments at 37 °C for 24 h. After treatment, the cells were collected by centrifugation, fixed onto glass slides, and rinsed with PBS. The slides were then blocked with immunostaining blocking buffer at room temperature for 20 min. Subsequently, an appropriate amount of γ-H2AX rabbit monoclonal antibody was added dropwise to the slides, followed by incubation at 4 °C overnight. After three washed with wash buffer, a fluorescently conjugated secondary antibody was dropwise and incubated for 1 h at room temperature. Nuclei were stained with DAPI and visualized under a fluorescence microscope. γ-H2AX fluorescence intensity was analyzed using ImageJ software.
2.6. Comet Assay
DNA damage was further evaluated using a Comet assay kit (Beyotime, Shanghai, China; C2041M). First, a base gel layer was prepared by spreading 30 μL of 1% agarose gel (pre-warmed to 45°C) onto the slide and allow it to solidify at 4°C for 10 min. TK6 cells from the different treatment groups were collected, washed, and resuspended in PBS. A 10 μL aliquot of cell suspension (1.0×10⁶ cells/mL) was mixed with 75 μL of 0.7% low-melting point agarose in a 37 °C water bath, and 70 μL of the mixture was pipetted onto the first layer. The gel was allowed to solidify at 4 °C for 10 min. The slides were then immersed in fresh lysis buffer and incubated at 4°C for at least 2 h. After rinsing with PBS for 3 min, the slides were placed in electrophoresis buffer for 40 min to allow DNA unwinding. Electrophoresis was subsequently performed at 4°C for 20 min (25 V and 300 mA). The slides were then transferred in neutralization buffer and neutralized three times at 4°C, followed by staining with propidium iodide (PI) in the dark for 20 min. Comets were examined under a fluorescence microscope. For each slide, 100 cells were randomly selected, and Tail length and Tail DNA percentage (Tail DNA%) was analyzed using CASP software.
2.7. Flow Cytometry
For cell cycle analysis, TK6 cells (1.0×10⁶ cells/mL) were seeded into 6-well plates and incubated at 37 °C for 24 hours. After cells were collected by centrifugation, washed with PBS, fixed with 70% ethanol prechilled on ice, and incubated at 4 °C for at least 2 hours. After an additional PBS wash, the cells were stained with propidium iodide (PI) using a cell cycle analysis kit (Beyotime, Shanghai, China; C1052), according to the manufacturer’s instructions. Red fluorescence was acquired on a flow cytometer with excitation at 488 nm.
For apoptosis analysis, TK6 cells (1.0×10⁶ cells/mL) were seeded into 6-well plates and incubated at 37 °C for 24 hours. According to the protocol of the Annexin V-FITC Apoptosis Detection Kit (Beyotime, Shanghai, China; C1062L), the cells were harvested and gently resuspended in Annexin V binding buffer. The cell suspension was then stained with Annexin V-FITC and PI. Single-stained controls (Annexin V-FITC only or PI only) were prepared for compensation. Apoptosis was analyzed by flow cytometry (C6 plus), where Annexin V-FITC detected as green fluorescence and PI as red fluorescence.
2.8. Quantitative Real-Time PCR (RT-qPCR)
The mRNA expression levels of BRCA1, CtIP, RAD52, XRCC2, Bax, Bcl-2, and Caspase-3 in TK6 cells were measured by RT-qPCR. Total RNA was extracted using the Pure Cell Total RNA Isolation Kit V2 (Vazyme, Nanjing, China; RC112), and RNA purity was assessed by measuring absorbance values at 230, 260, and 280 nm using an ultramicro spectrophotometer, and required an A260/A280 ratio between 1.8 and 2.0, and an A260/A230 ratio greater than 2. First-strand cDNA was synthesized from HiScript IV RT SuperMix for qPCR (+gDNA wiper) (Vazyme, Nanjing, China; R423) according to the manufacturer’s instructions. RT-qPCR was performed in a 20 μL PCR reaction mixture using T ChamQ Universal SYBR qPCR Master Mix (Vazyme, Nanjing, China; Q711).
The thermal cycling conditions were as follows: initial denaturation at 95 °C for 5 s, followed by 40 cycles of 95 °C for 10 s and 60 °C for 30 s on a QuantStudio 5 Real-Time PCR system (Applied Biosystems), with a default melting-curve analysis at the end of amplification. The primer sequences (synthesized by Sangon Biotech, Shanghai, China) were listed in Table 1. GAPDH was used as an internal control. Relative mRNA expression levels were calculated using 2^-ΔΔCt method.
2.9. Western Blotting
TK6 cells were washed twice with PBS and lysed on ice for 30 minutes in RIPA buffer containing PMSF (Beyotime, Shanghai, China; P0013J). Protein concentrations were determined using a BCA Protein Assay Kit (Beyotime, Shanghai, China; P0011). Equal amounts of lysed protein were separated by SDS-polyacrylamide gel electrophoresis (SDS-PAGE) and transferred onto PVDF membranes. The membranes were blocked with rapid blocking solution (in Yazyme Bio) for 1 h at room temperature and then incubated overnight at 4 °C with rabbit polyclonal primary antibodies against BRCA1, CtIP, RAD52, XRCC2, Bax, Bcl-2, and Caspase-3 (Affinity; all at 1:1,000 dilution). After three 10 min washes with TBST, the membranes were incubated for 45 min at room temperature with HRP-conjugated secondary antibodies (Beyotime, 1:2,000). Protein bands were visualized using an enhanced chemiluminescence reagent (Biosharp ECL kit) and quantified by densitometry using ImageJ software.
2.10. Statistical Analysis
Statistical analyses were performed using SPSS 26.0. Data are expressed as mean ± standard deviation (SD). Between-group differences were analyzed by one-way analysis of variance (ANOVA), followed by Bonferroni post hoc tests for pairwise comparisons. Based on the F- and P-values of the interaction term from two-way ANOVA, the type of interaction between factor A and factor B was determined by comparing the combined effect (EA × EB) with the sum of the individual effects (EA + EB). The criteria were as follows Synergistic effect, F > 5, P < 0.05, and EA × EB > EA + EB; additive effect, F < 5, P > 0.05, and EA × EB > EA + EB; antagonistic effect, F > 5, P < 0.05, and EA × EB < EA + EB. In addition, to further visualize the interaction between Pb and Cd, interaction plots (profile plots) were generated as described previously (Lu, Yuan et al. 2015). Non-parallel lines (i.e., that diverge from each other) were interpreted as indicating synergistic interaction, whereas approximately parallel lines indicated an additive effect. All experiments were repeated at least in triplicate (n ≥ 3), and P-value < 0.05 were considered statistically significant.
3. Results
3.1. Pb and Cd Caused Cell Viability Decrease in TK6 Cells
TK6 cells were exposed to a series concentrations of Pb acetate and Cd chloride (Figure 1A-B). Compared with the control group, cell viability began to decrease at 100 μM Pb and 10 μM Cd, and the survival rate of TK6 cells decreased in a dose-dependent manner with increasing concentration of either metal (Figure 1). Based on the resulting dose-response cuvers, 0.5 × IC50 values for Pb and Cd (480 μM lead acetate and 33 μM cadmium chloride) were selected as the exposure concentration for subsequent experiments to investigate the effects of single or in combined exposure, consistent with the previous study (Liu, Wu et al. 2018). The cells were divided into the following groups: the control group, Pb group (480 μM lead acetate), Cd group (33 μM cadmium chloride), mixed group (480 μM lead acetate + 33 μM cadmium chloride), and resveratrol group (mixed group + 10 μM resveratrol).
3.2. Pb and Cd Induced Oxidative Stress in TK6 Cells
Immunofluorescence assay showed that co-exposure to Pb and Cd significantly increased intracellular ROS levels compared with the control group (P<0.05), whereas ROS accumulation was markedly reduced in the Pb-only, Cd-only and resveratrol intervention group relative to the mixed group (P<0.05; Figure 2A,B). Compared with the control group, Pb or Cd individual group exhibited significantly decreased intracellular GSH content and SOD and CAT activities, accompanied by significant increases in GSSG and MDA levels (P<0.05; Figure 2C–G). In contrast, relative to the mixed group, both single-metal group and the resveratrol group significantly restored GSH content and SOD activity and reduced GSSG levels (P<0.05; Figure 2C,D,G). Two-way ANOVA further revealed an antagonistic interaction between Pb and Cd on intracellular GSH content and SOD activity (F_GSH = 7.373, P = 0.026; F_SOD = 10.098, P = 0.008; Figure 2H,I).
3.3. Pb and Cd Aggravated DNA Damage in TK6 Cells
Immunofluorescence staining assay was used to assess the DNA damage marker γ-H2AX levels (Figure 3A,C). γ-H2AX fluorescence intensity was significantly higher in the Pb or Cd individual group than the control group (P<0.05), and was further increased in the Pb and Cd mixed group. In contrast, the resveratrol intervention group significantly reduced γ-H2AX fluorescence compared with the mixed group (P<0.05; Figure 3A,C). Similarly, Comet assay results showed minimal DNA damage in the control group, which exhibited compact comet heads without obvious tails (Tail length, 3.35±0.21 μm; Figure 3B,D). In Pb or Cd individual group, Tail Length (Pb: 31.66±2.00 μm; Cd: 32.24±2.14 μm) and Tail DNA% were markedly increased (Figure 3D,E), and these changes were further exacerbated in the Pb+Cd mixed exposure group (Tail Length: 35.88±1.76 μm; Tail DNA%: 22.47±1.01%; Figure 3D,E). Resveratrol treatment group markedly attenuated the DNA damage induced by Pb+Cd co-exposure group, as evidenced by significantly reduced γ-H2AX levels and Tail DNA% (P<0.05; Figure 3C,E). Furthermore, two-way ANOVA revealed an antagonistic interaction between Pb and Cd on γ-H2AX fluorescence intensity, Tail DNA% and Tail Length (F_γ-H2AX=35.819, P<0.001; F_tail DNA%=27.096, P<0.001; F_Tail length=51.246, P<0.001; Figure 3F-G).
3.4. Pb and Cd Caused Cell Cycle Arrest and Apoptosis in TK6 Cells
Compared with the control group, exposure to Pb or Cd alone, as well as in combined, significantly increased the proportion of S-phase cells and decreased the proportion of G2/M-phase cells (P<0.05; Figure 4A,C). Compared with the mixed group, the single-exposure group and the resveratrol group showed lower proportion of S-phase and G0/G1-phase cells and a higher proportion of G2/M-phase cells (P<0.05; Figure 4A,C). Apoptosis was quantified by flow cytometry in each group (Figure 4B,D). The Pb-only and Cd-only groups exhibited higher apoptosis rates than the control group, indicating that either Pb or Cd can induce apoptosis, whereas the resveratrol group (32.77 ± 3.03%) showed a reduced apoptosis rate compared with the mixed group (Figure 4B,D). Two-way ANOVA further showed that co-exposure to Pb and Cd exerted an antagonistic interaction on the proportion of S-phase and G2/M-phase (F_S=69.794, P<0.01; F_G2/M=85.763, P<0.01; Figure 4E).
3.5. Pb and Cd Inhibited DNA Repair Genes and Promoted Apoptosis-Related Gene Expression in TK6 Cells
Compared with the control group, mRNA expression levels of DNA repair genes including BRCA1 CtIP, RAD52, and XRCC2 was downregulated in the Pb or Cd alone group (P<0.05; Figure 5A-D). In contrast, relative to the Pb+Cd mixed exposure group, BRCA1, CtIP, and XRCC2 expression levels were significantly increased in both single-exposure and resveratrol group (P<0.05). RAD52 were upregulated in the Pb-only group and resveratrol group (P < 0.05) but remained decreased in the Cd group (P < 0.05; Figure 5A-D). These findings suggest that Pb and Cd exposure suppressed DNA repair gene expression, with resveratrol partially reversing these changes. As apoptosis-related genes, the expressions of Bax, Caspase-3, and the Bax/Bcl-2 ratio were significantly increased in the single-exposure groups, whereas Bcl-2 expression was decreased compared with the control group (P<0.05; Figure 5E-H). Compared with the Pb+Cd mixed group, Bax, Caspase-3, and the Bax/Bcl-2 ratio were reduced in both single-exposure and resveratrol group, while Bcl-2 expression was significant upregulated (P < 0.05; Figure 5E-H). Two-way ANOVA further revealed an antagonistic interaction between Pb and Cd on the mRNA expression of DNA repair pathway (BRCA1, CtIP, RAD52, XRCC2), and apoptosis-related genes (Bax, Bcl-2 and Caspase-3) (F_BRCA1=26.822, P<0.01; F_CtIP=14.840, P<0.01; F_RAD52=28.763, P<0.01; F_XRCC2=22.132, P<0.01; F_Bax=50.056, P<0.01; F_Bcl-2=55.622, P<0.01; F_Bax/Bcl-2=19.638, P<0.01, F_Caspase-3=25.939, P<0.01; Figure 5 I-J).
3.6. Pb and Cd Downregulted DNA Repair Proteins and Upregulated Apoptosis-related Proteins in TK6 Cells
For DNA repair proteins, Cd exposure reduced BRCA1, whereas Pb exposure increased it (P<0.05; Figure 6A,B). Compared with the Pb+Cd mixed group, BRCA1 protein level was elevated in the single-exposure or resveratrol group (Figure 6A-B). Cd diminished RAD52 expression, while Pb enhanced it; both single-metal reduced CtIP, whereas XRCC2 decreased in the Pb group but increased in the Cd group (Figure 6A,C-E). Relative to the mixed group, CtIP and RAD52 were decreased by Cd and resveratrol but increased by Pb; XRCC2 was elevated in the Cd group and resveratrol groups but decreased in the Pb group (Figure 6A,C-E). With respect to apoptosis-related proteins, single exposures to Pb or Cd increased Bax expression and the Bax/Bcl-2 ratio, mildly upregulated Bcl-2, and reduced Caspase-3. In contrast, both single-metal and resveratrol markedly reduced Bax, Bcl-2, Caspase-3, and the Bax/Bcl-2 ratio relative to the mixed group (Figure 6A,F–I). Two-way ANOVA revealed an antagonistic interactions on Bcl-2, BRCA1, and the Bax/Bcl-2 ratio (F_Bcl-2=5.739, P=0.043; F_BRCA1=6.768, P=0.032; F_Bax/Bcl-2=5.739, P=0.043; Figure 6J,K).
4. Discussion
Pb and Cd are widely present in lead-smelting operations, battery manufacturing, and electroplating. These heavy metals can enter the human body via ingestion, inhalation, or dermal contact and accumulate over time, leading to systemic toxicity. Previous studies have showed that exposure to Pb and Cd alone induces in vitro cytotoxicity in a clear dose-response manner (Su, Wang et al. 2023). Consistent with our findings, various toxicants-including hydroquinone and Pb have been reported to reduce TK6 cell viability in a dose-dependent manner. Although many investigations have focused on Pb or Cd individual exposure, Pb and Cd often co-occur in the environment, and their combined effects may be additive, synergistic, or antagonistic (Zhang, Yan et al. 2023).
Several studies have suggested that co-exposure to Pb and Cd can be more cytotoxic than single-metal exposure, frequently via synergistic interactions (Karri, Kumar et al. 2018, ThankGod Eze, Michelangeli et al. 2019, Zhou, Zhao et al. 2020). Building on this , we examined Pb or/and Cd toxicity in TK6 cells to clarify potential interaction patterns and underlying mechanisms. We observed cell-cycle arrest and apoptosis after Pb+Cd co-exposure, accompanied by oxidative stress and DNA damage, together with interference with DNA repair pathway. Notably, two-way ANOVA-based interaction analyses indicated endpoint-specific, non-additive behavior, with evidence of antagonism for several readouts, even though overall injury remained greater than in the control group.
Disruption of intracellular redox homeostasis by heavy metals can perturb nucleotide integrity and drive oxidative DNA damage and genomic alterations (Rath and Das 2023). Oxidative stress is characterized by excessive generation of ROS and impairment of antioxidant defenses (El-Agrody, Abol-Enein et al. 2024). Previous studies have reported positive associations between urinary Pb levels and oxidative-stress biomarkers, and both Pb and Cd can generate ROS (e.g., superoxide) and interact with antioxidant enzymes (Wei, Wu et al. 2020, García-Rodríguez, Hernández-Cortés et al. 2023, Mallamaci, Barbarossa et al. 2024). In our study, Pb and Cd co-exposure markedly elevated oxidative stress in TK6 cells, as evidenced by increased ROS and GSSG and decreased GSH, SOD, and CAT activities, together with higher MDA levels. These results are in line with in vivo experiments showing that co-exposed rats exhibit increased MDA and decreased SOD, CAT, and GPx (Yurekli, Esrefoglu et al. 2009). Collectively, the suppression of GSH and SOD supports an oxidative-stress mechanism arising from Pb–Cd interplay.
Multiple studies have demonstrated that Pb and Cd induced apoptosis, closely linked to DNA damage (Dong, Xiao et al. 2021, Sun, Lv et al. 2022, Sun, Zhang et al. 2023, Wang, Wang et al. 2023). Elevated γ-H2AX levels and Tail DNA% in Comet assay are sensitive markers of genotoxicity (Chen, Chen et al. 2024). A substantial body of literature has reported significant associations between Pb or Cd exposure and DNA damage (Mitkovska, Dimitrov et al. 2020, Sahu, Upadhyay et al. 2024, Wang, Gan et al. 2024), and time- and dose-dependent manners between Pb and Cd have been observed in both mammalian and plant models (Li, Liu et al. 2009, Lanier, Bernard et al. 2019). In agreement with these findings, we observed increased γ-H2AX levels, Tail Length, and Tail DNA% in the Pb+Cd combined group compared with single-exposure group. Interestingly, two-way ANOVA indicated antagonistic interactions for these DNA damage endpoints. Similar context-dependent interactions have been reported previously: adding Pb to low Cd concentrations increased DNA damage, whereas adding Pb to high Cd concentrations decreased it, consistent with competitive binding at the cell surface that modulates metal uptake and toxicity (Wu, Liu et al. 2012).
DNA damage activates checkpoint signaling that promotes cell-cycle arrest and, if damage persists, apoptosis to preserve genomic stability (Vandionant, Hendrix et al. 2023). Pb or Cd individual exposure can induce S- or G2-phase arrest (Gastaldo, Viau et al. 2007, Oliveira, Monteiro et al. 2014). In our study, Pb and Cd co-exposure induced apoptosis, with downstream changes in Bcl-2 family members, namely, decreased Bcl-2 mRNA and an increased Bax/Bcl-2 protein ratio. One plausible explanation is that Pb may compete with Cd for calcium channels or other transport pathways. This mechanistic hypothesis warrants targeted validation.
The DNA repair system is essential for counteracting metal-induced genomic instability (Nunes, Silva et al. 2023, Neven, Issayama et al. 2024). Key DNA repair pathways include homologous recombination (HR), non-homologous end joining (NHEJ), nucleotide excision repair (NER), and base excision repair (BER) (Morozumi, Shimizu et al. 2024). Pb has been reported to inhibit DNA-PK activity, thereby impairing NHEJ and secondarily engaging RAD51-dependent HR, whereas Cd can compromise NER by inhibiting critical enzymes (Gastaldo, Viau et al. 2007, Mustra, Warren et al. 2007). In our study, several DNA repair genes were downregulated in the combined group, notably BRCA1 and representative HR components, prompting us to focus on HR-mediated repair. We found that Pb and Cd co-exposure disrupted RAD52, XRCC2, and CtIP expressions, which would exacerbate the burden of DNA double-strand breaks. HR provides high-fidelity repair of DSBs and is often recruited under severe DNA damage (Pacheco-Barcia, Muñoz et al. 2022). We propose that Pb and Cd exposure induce oxidative stress and alter transcription factor activity, thereby reducing DNA repair gene expression and limiting repair capacity; however, this conjecture needs further verification.
This study has several limitations. First, we used human lymphoblastoid TK6 cells as an in vitro model; findings from a single cell type may not generalizable to other tissues or organisms. Further animal studies are needed to validate our results. Second, although we detected mRNA and protein changes in DNA repair and apoptosis pathway, more work is required to delineate upstream regulatory mechanisms, including epigenetic modulation and the roles of metal transporters and channels. Despite these limitations, our work systematically characterizes the effects of Pb and Cd co-exposure on oxidative stress, DNA damage, cell-cycle arrest, DNA repair gene expression, and apoptosis, providing mechanistic insight into combined metal toxicity and potential avenues for the prevention and treatment of heavy metal poisoning.
5. Conclusions
Lead and cadmium exposure provoked oxidative stress in TK6 cells, resulting in pronounced genotoxicity. This was accompanied by dysregulation of DNA repair gene expression, ultimately leading to S-phase arrest and apoptosis. Interaction analysis further indicated that Pb and Cd exert predominantly antagonistic effects on multi-endpoints, whereas resveratrol intervention attenuated heavy metal-induced toxicity.
Author Contributions
Xin Liu: Writing-original draft, Methodology, Investigation. Zhiyuan Han: Methodology, Investigation. Kuibin Han: Writing-review, Methodology. Yuhan Pang and Xiaoyue Zhao: Writing-review. Yuting Wang and Xiaoyan Wu: Methodology. Tuanwei Wang: Conceptualization, Funding acquisition, Writing-review & editing.
Funding
This study was supported by grants from the Natural Science Foundation of Shandong Province (ZR2022QH180), the 2022 Joint Research and Development Program Project of China National Center for Food Safety Risk Assessment (LH2022GG07), Weifang Science and Technology Development Plan Project (2022YX040), the Doctoral Research Start-up Fund of Shandong Second Medical University (2021BKQ011).
Data Availability Statement
Data will be made available on request.
Conflicts of Interest
The authors declare no known competing financial interests or personal relationships that could potentially influence the results or interpretations presented in this paper.
References
- Chen, W.; Chen, Z.; Jia, Y.; Guo, Y.; Zheng, L.; Yao, S.; Shao, Y.; Li, M.; Mao, R.; Jiang, Y. Circ_0008657 regulates lung DNA damage induced by hexavalent chromium through the miR-203a-3p/ATM axis. Environ. Int. 2024, 185, 108515. [Google Scholar] [CrossRef]
- Dai, H.; Zhang, H.; Wang, H.; Niu, J.; Luo, B.; Yan, J.; Li, X. The Effect of Smoking Habits on Blood Cadmium and Lead Levels in Residents Living Near a Mining and Smelting Area in Northwest China: a Cross-Sectional Study. Biol. Trace Element Res. 2022, 201, 1101–1111. [Google Scholar] [CrossRef] [PubMed]
- Dey, K.K.; Kamila, S.; Das, T.; Chattopadhyay, A. Lead induced genotoxicity and hepatotoxicity in zebrafish (Danio rerio) at environmentally relevant concentration: Nrf2-Keap1 regulated stress response and expression of biomarker genes. Environ. Toxicol. Pharmacol. 2024, 107, 104396. [Google Scholar] [CrossRef] [PubMed]
- Dong, F.; Xiao, P.; Li, X.; Chang, P.; Zhang, W.; Wang, L. Cadmium triggers oxidative stress and mitochondrial injury mediated apoptosis in human extravillous trophoblast HTR-8/SVneo cells. Reprod. Toxicol. 2021, 101, 18–27. [Google Scholar] [CrossRef] [PubMed]
- El-Agrody, E.; Abol-Enein, H.; Mortada, W.I.; Awadalla, A.; Tarabay, H.H.; Elkhawaga, O.-A. Does the Presence of Heavy Metals Influence the Gene Expression and Oxidative Stress in Bladder Cancer? Biol. Trace Element Res. 2023, 202, 3475–3482. [Google Scholar] [CrossRef]
- García-Rodríguez, M.D.C.; Hernández-Cortés, L.M.; Mendoza-Núñez, V.M.; Arenas-Huertero, F. Effects of green tea polyphenols against metal-induced genotoxic damage: underlying mechanistic pathways. J. Toxicol. Environ. Heal. Part B 2023, 26, 371–386. [Google Scholar] [CrossRef]
- Gastaldo, J.; Viau, M.; Bencokova, Z.; Joubert, A.; Charvet, A.-M.; Balosso, J.; Foray, N. Lead contamination results in late and slowly repairable DNA double-strand breaks and impacts upon the ATM-dependent signaling pathways. Toxicol. Lett. 2007, 173, 201–214. [Google Scholar] [CrossRef]
- Hao, R.; Ge, J.; Song, X.; Li, F.; Sun-Waterhouse, D.; Li, D. Cadmium induces ferroptosis and apoptosis by modulating miR-34a-5p/Sirt1axis in PC12 cells. Environ. Toxicol. 2021, 37, 41–51. [Google Scholar] [CrossRef]
- Karri, V.; Kumar, V.; Ramos, D.; Oliveira, E.; Schuhmacher, M. Comparative In Vitro Toxicity Evaluation of Heavy Metals (Lead, Cadmium, Arsenic, and Methylmercury) on HT-22 Hippocampal Cell Line. Biol. Trace Element Res. 2017, 184, 226–239. [Google Scholar] [CrossRef]
- Lanier, C.; Bernard, F.; Dumez, S.; Leclercq-Dransart, J.; Lemiere, S.; Vandenbulcke, F.; Nesslany, F.; Platel, A.; Devred, I.; Hayet, A.; et al. Combined toxic effects and DNA damage to two plant species exposed to binary metal mixtures (Cd/Pb). Ecotoxicol. Environ. Saf. 2019, 167, 278–287. [Google Scholar] [CrossRef]
- Li, H.; Yao, J.; Liu, J.; Min, N.; Sunahara, G.; Men, D.; Duran, R. Effects of soil metal(loid)s pollution on microbial activities and environmental risks in an abandoned chemical smelting site. J. Environ. Sci. 2023, 143, 60–70. [Google Scholar] [CrossRef]
- Li, M.; Liu, Z.; Xu, Y.; Cui, Y.; Li, D.; Kong, Z. Comparative effects of Cd and Pb on biochemical response and DNA damage in the earthworm Eisenia fetida (Annelida, Oligochaeta). Chemosphere 2009, 74, 621–625. [Google Scholar] [CrossRef]
- Liu, D.; Yu, J.; Xie, J.; Zhang, Z.; Tang, C.; Yu, T.; Chen, S.; Hong, Z.; Wang, C. PbAc Triggers Oxidation and Apoptosis via the PKA Pathway in NRK-52E Cells. Biol. Trace Element Res. 2020, 199, 2687–2694. [Google Scholar] [CrossRef]
- Liu, X.; Wu, J.; Shi, W.; Shi, W.; Liu, H.; Wu, X. Lead Induces Genotoxicity via Oxidative Stress and Promoter Methylation of DNA Repair Genes in Human Lymphoblastoid TK6 Cells. Med Sci. Monit. 2018, 24, 4295–4304. [Google Scholar] [CrossRef]
- Lu, C.-F.; Yuan, X.-Y.; Li, L.-Z.; Zhou, W.; Zhao, J.; Wang, Y.-M.; Peng, S.-Q. Combined exposure to nano-silica and lead induced potentiation of oxidative stress and DNA damage in human lung epithelial cells. Ecotoxicol. Environ. Saf. 2015, 122, 537–544. [Google Scholar] [CrossRef]
- Mallamaci, R.; Barbarossa, A.; Carocci, A.; Meleleo, D. Evaluation of the Potential Protective Effect of Ellagic Acid against Heavy Metal (Cadmium, Mercury, and Lead) Toxicity in SH-SY5Y Neuroblastoma Cells. Foods 2024, 13, 419. [Google Scholar] [CrossRef] [PubMed]
- Mitkovska, V.I.; Dimitrov, H.A.; Chassovnikarova, T.G. Chronic exposure to lead and cadmium pollution results in genomic instability in a model biomonitor species (Apodemus flavicollis Melchior, 1834). Ecotoxicol. Environ. Saf. 2020, 194, 110413. [Google Scholar] [CrossRef] [PubMed]
- Morozumi, R.; Shimizu, N.; Tamura, K.; Nakamura, M.; Suzuki, A.; Ishiniwa, H.; Ide, H.; Tsuda, M. Changes in repair pathways of radiation-induced DNA double-strand breaks at the midblastula transition in Xenopus embryo. J. Radiat. Res. 2024, 65, 315–322. [Google Scholar] [CrossRef]
- Mustra, D.J.; Warren, A.J.; Wilcox, D.E.; Hamilton, J.W. Preferential binding of human XPA to the mitomycin C-DNA interstrand crosslink and modulation by arsenic and cadmium. Chem. Interactions 2007, 168, 159–168. [Google Scholar] [CrossRef] [PubMed]
- Neven, J.; Issayama, L.K.; Dewachter, I.; Wilson, D.M. Genomic stress and impaired DNA repair in Alzheimer disease. DNA Repair 2024, 139, 103678. [Google Scholar] [CrossRef]
- Nunes, E.A.; da Silva, H.C.; Duarte, N.d.A.A.; de Lima, L.E.; Maraslis, F.T.; de Araújo, M.L.; Pedron, T.; Lange, C.N.; Freire, B.M.; Matias, A.C.; et al. Impact of DNA repair polymorphisms on DNA instability biomarkers induced by lead (Pb) in workers exposed to the metal. Chemosphere 2023, 334, 138897. [Google Scholar] [CrossRef]
- Oliveira, H.; Monteiro, C.; Pinho, F.; Pinho, S.; de Oliveira, J.M.P.F.; Santos, C. Cadmium-induced genotoxicity in human osteoblast-like cells. Mutat. Res. Toxicol. Environ. Mutagen. 2014, 775–776, 38–47. [Google Scholar] [CrossRef]
- Pacheco-Barcia, V.; Muñoz, A.; Castro, E.; Ballesteros, A.I.; Marquina, G.; González-Díaz, I.; Colomer, R.; Romero-Laorden, N. The Homologous Recombination Deficiency Scar in Advanced Cancer: Agnostic Targeting of Damaged DNA Repair. Cancers 2022, 14, 2950. [Google Scholar] [CrossRef]
- Parvez, S.M.; Jahan, F.; Abedin, J.; Rahman, M.; Hasan, S.S.; Islam, N.; Aich, N.; Moniruzzaman, M.; Islam, Z.; Fujimura, M.; et al. Blood lead, cadmium and hair mercury concentrations and association with soil, dust and occupational factors in e-waste recycling workers in Bangladesh. Int. J. Hyg. Environ. Heal. 2024, 257, 114340. [Google Scholar] [CrossRef]
- Rath, S.; Das, S. Oxidative stress-induced DNA damage and DNA repair mechanisms in mangrove bacteria exposed to climatic and heavy metal stressors. Environ. Pollut. 2023, 339, 122722. [Google Scholar] [CrossRef]
- Sahu, M.C.; Upadhyay, K.; Gupta, S.; Chanania, K.; Pati, S. DNA damage and ALAD polymorphism in high blood lead (Pb) levels of pregnant women attending a tertiary care teaching hospital. Eur. J. Obstet. Gynecol. Reprod. Biol. X 2024, 22, 100300. [Google Scholar] [CrossRef] [PubMed]
- Shaik, A.P.; Jamil, K. Individual susceptibility and genotoxicity in workers exposed to hazardous materials like lead. J. Hazard. Mater. 2009, 168, 918–924. [Google Scholar] [CrossRef]
- Singh, P.; Mitra, P.; Goyal, T.; Sharma, S.; Sharma, P. Blood lead and cadmium levels in occupationally exposed workers and their effect on markers of DNA damage and repair. Environ. Geochem. Heal. 2020, 43, 185–193. [Google Scholar] [CrossRef] [PubMed]
- Su, X.; Wang, R.; Wu, Y.; Yang, M.; Ba, Y.; Huang, H. Lead and cadmium co-exposure modified PC12 viability and ER stress: study from a 3 × 3 factorial design. Toxicol. Res. 2023, 12, 1135–1142. [Google Scholar] [CrossRef]
- Sun, Y.; Lv, Y.; Li, Y.; Li, J.; Liu, J.; Luo, L.; Zhang, C.; Zhang, W. Maternal genetic effect on apoptosis of ovarian granulosa cells induced by cadmium. Food Chem. Toxicol. 2022, 165, 113079. [Google Scholar] [CrossRef] [PubMed]
- Sun, Y.; Zhang, W.; Li, Y.; Zhu, J.; Liu, C.; Luo, L.; Liu, J.; Zhang, C. Multigenerational genetic effects of paternal cadmium exposure on ovarian granulosa cell apoptosis. Ecotoxicol. Environ. Saf. 2023, 262, 115123. [Google Scholar] [CrossRef]
- Eze, C.T.; Michelangeli, F.; Otitoloju, A.A. In vitro cyto-toxic assessment of heavy metals and their binary mixtures on mast cell-like, rat basophilic leukemia (RBL-2H3) cells. Chemosphere 2019, 223, 686–693. [Google Scholar] [CrossRef]
- Vandionant, S.; Hendrix, S.; Alfano, R.; Plusquin, M.; Cuypers, A. Comparing cadmium-induced effects on the regulation of the DNA damage response and cell cycle progression between entire rosettes and individual leaves of Arabidopsis thaliana. Plant Physiol. Biochem. 2023, 204, 108105. [Google Scholar] [CrossRef]
- Wang, H.; Gan, X.; Tang, Y. Mechanisms of Heavy Metal Cadmium (Cd)-Induced Malignancy. Biol. Trace Element Res. 2024, 203, 608–623. [Google Scholar] [CrossRef]
- Wang, H.; Wang, H.; Guan, J.; Guan, W.; Liu, Z. Lead induces mouse skin fibroblast apoptosis by disrupting intracellular homeostasis. Sci. Rep. 2023, 13, 1–13. [Google Scholar] [CrossRef] [PubMed]
- Wei, W.; Wu, X.; Bai, Y.; Li, G.; Feng, Y.; Meng, H.; Li, H.; Li, M.; Zhang, X.; He, M.; et al. Lead exposure and its interactions with oxidative stress polymorphisms on lung function impairment: Results from a longitudinal population-based study. Environ. Res. 2020, 187, 109645. [Google Scholar] [CrossRef] [PubMed]
- Wu, B.; Liu, Z.; Xu, Y.; Li, D.; Li, M. Combined toxicity of cadmium and lead on the earthworm Eisenia fetida (Annelida, Oligochaeta). Ecotoxicol. Environ. Saf. 2012, 81, 122–126. [Google Scholar] [CrossRef]
- Yang, X.; Han, Y.; Mu, Y.; Yang, P.; Gu, W.; Zhang, M. Multigenerational effects of cadmium on the lifespan and fertility of Drosophila melanogaster. Chemosphere 2020, 245, 125533. [Google Scholar] [CrossRef]
- Yurekli, M.; Esrefoglu, M.; Doğru, M.I.; Doğru, A.; Gul, M.; Whidden, M. Adrenomedullin reduces antioxidant defense system and enhances kidney tissue damage in cadmium and lead exposed rats. Environ. Toxicol. 2008, 24, 279–286. [Google Scholar] [CrossRef] [PubMed]
- Zhang, H.; Yan, J.; Nie, G.; Xie, D.; Luo, B.; Niu, J.; Wang, H.; Li, X. Effects of cadmium and lead co-exposure on glucocorticoid levels in rural residents of northwest China. Chemosphere 2023, 317, 137783. [Google Scholar] [CrossRef]
- Zhou, R.; Zhao, J.; Li, D.; Chen, Y.; Xiao, Y.; Fan, A.; Chen, X.-T.; Wang, H.-L. Combined exposure of lead and cadmium leads to the aggravated neurotoxicity through regulating the expression of histone deacetylase 2. Chemosphere 2020, 252, 126589. [Google Scholar] [CrossRef] [PubMed]
- Zhu, J.; Huang, Z.; Yang, F.; Zhu, M.; Cao, J.; Chen, J.; Lin, Y.; Guo, S.; Li, J.; Liu, Z. Cadmium disturbs epigenetic modification and induces DNA damage in mouse preimplantation embryos. Ecotoxicol. Environ. Saf. 2021, 219, 112306. [Google Scholar] [CrossRef] [PubMed]
Figure 1.
Cytotoxicity of Pb or Cd in TK6 cells. (A). Cell viability of TK6 cells exposed to series concentrations of Pb acetate for 24 hours. (B). Cell viability of TK6 cells exposed to series concentrations of Cd chloride for 24 hours. Data were expressed as the mean ± SD (n=3). *P < 0.05, **P < 0.01 for Pb or/and Cd groups vs the Control group.
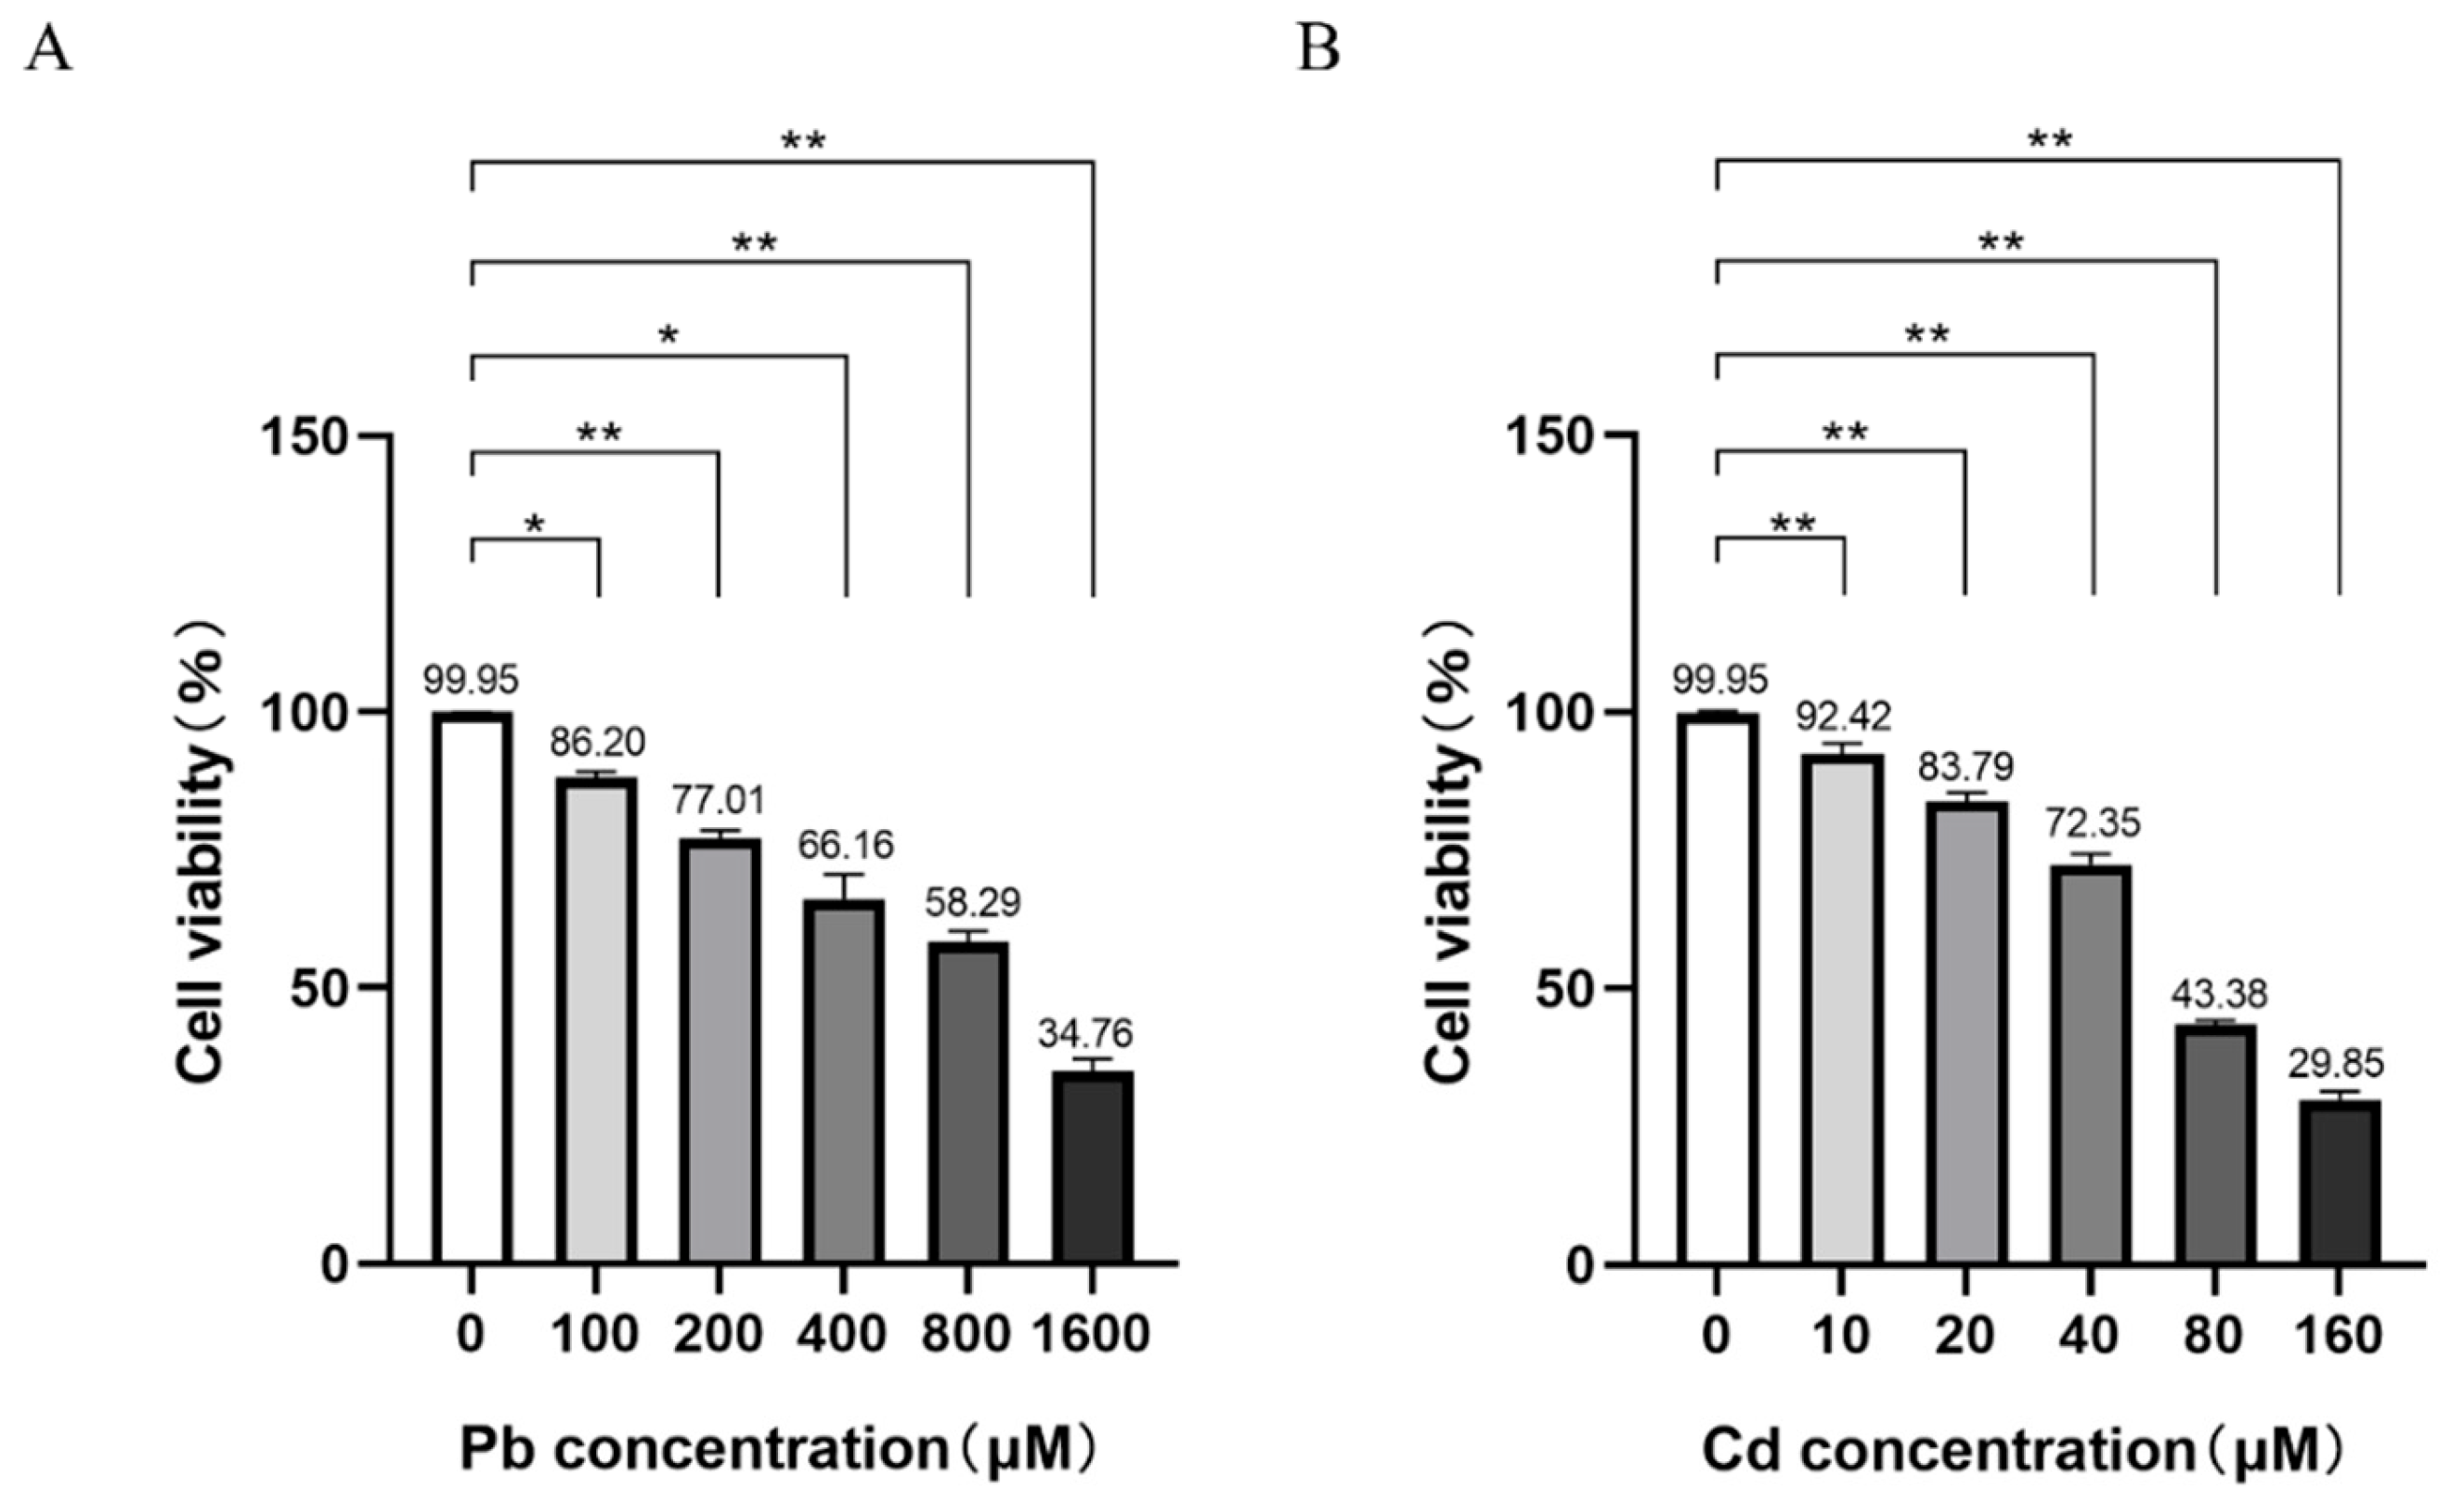
Figure 2.
Intracellular ROS levels and oxidative and antioxidative indicators induced by Pb and/or Cd in TK6 cells. (A). Representative immunofluorescence images of intracellular ROS in TK6 cells; (B). Quantitative analysis of ROS fluorescence intensity; (C), (D), (E), (F) and (G). Intracellular levels of reduced GSH, CAT, SOD,, and increase of GSSG, MDA respectively. (H) and (I) represent the interaction diagrams of GSH and SOD, respectively. Note: *P < 0.05, **P < 0.01 for Pb or/and Cd group compared with the Control group; while #P < 0.05, ##P < 0.01 for single exposure groups compared to mixed group; §P < 0.05, §§P < 0.01 for resveratrol group compared to mixed group.
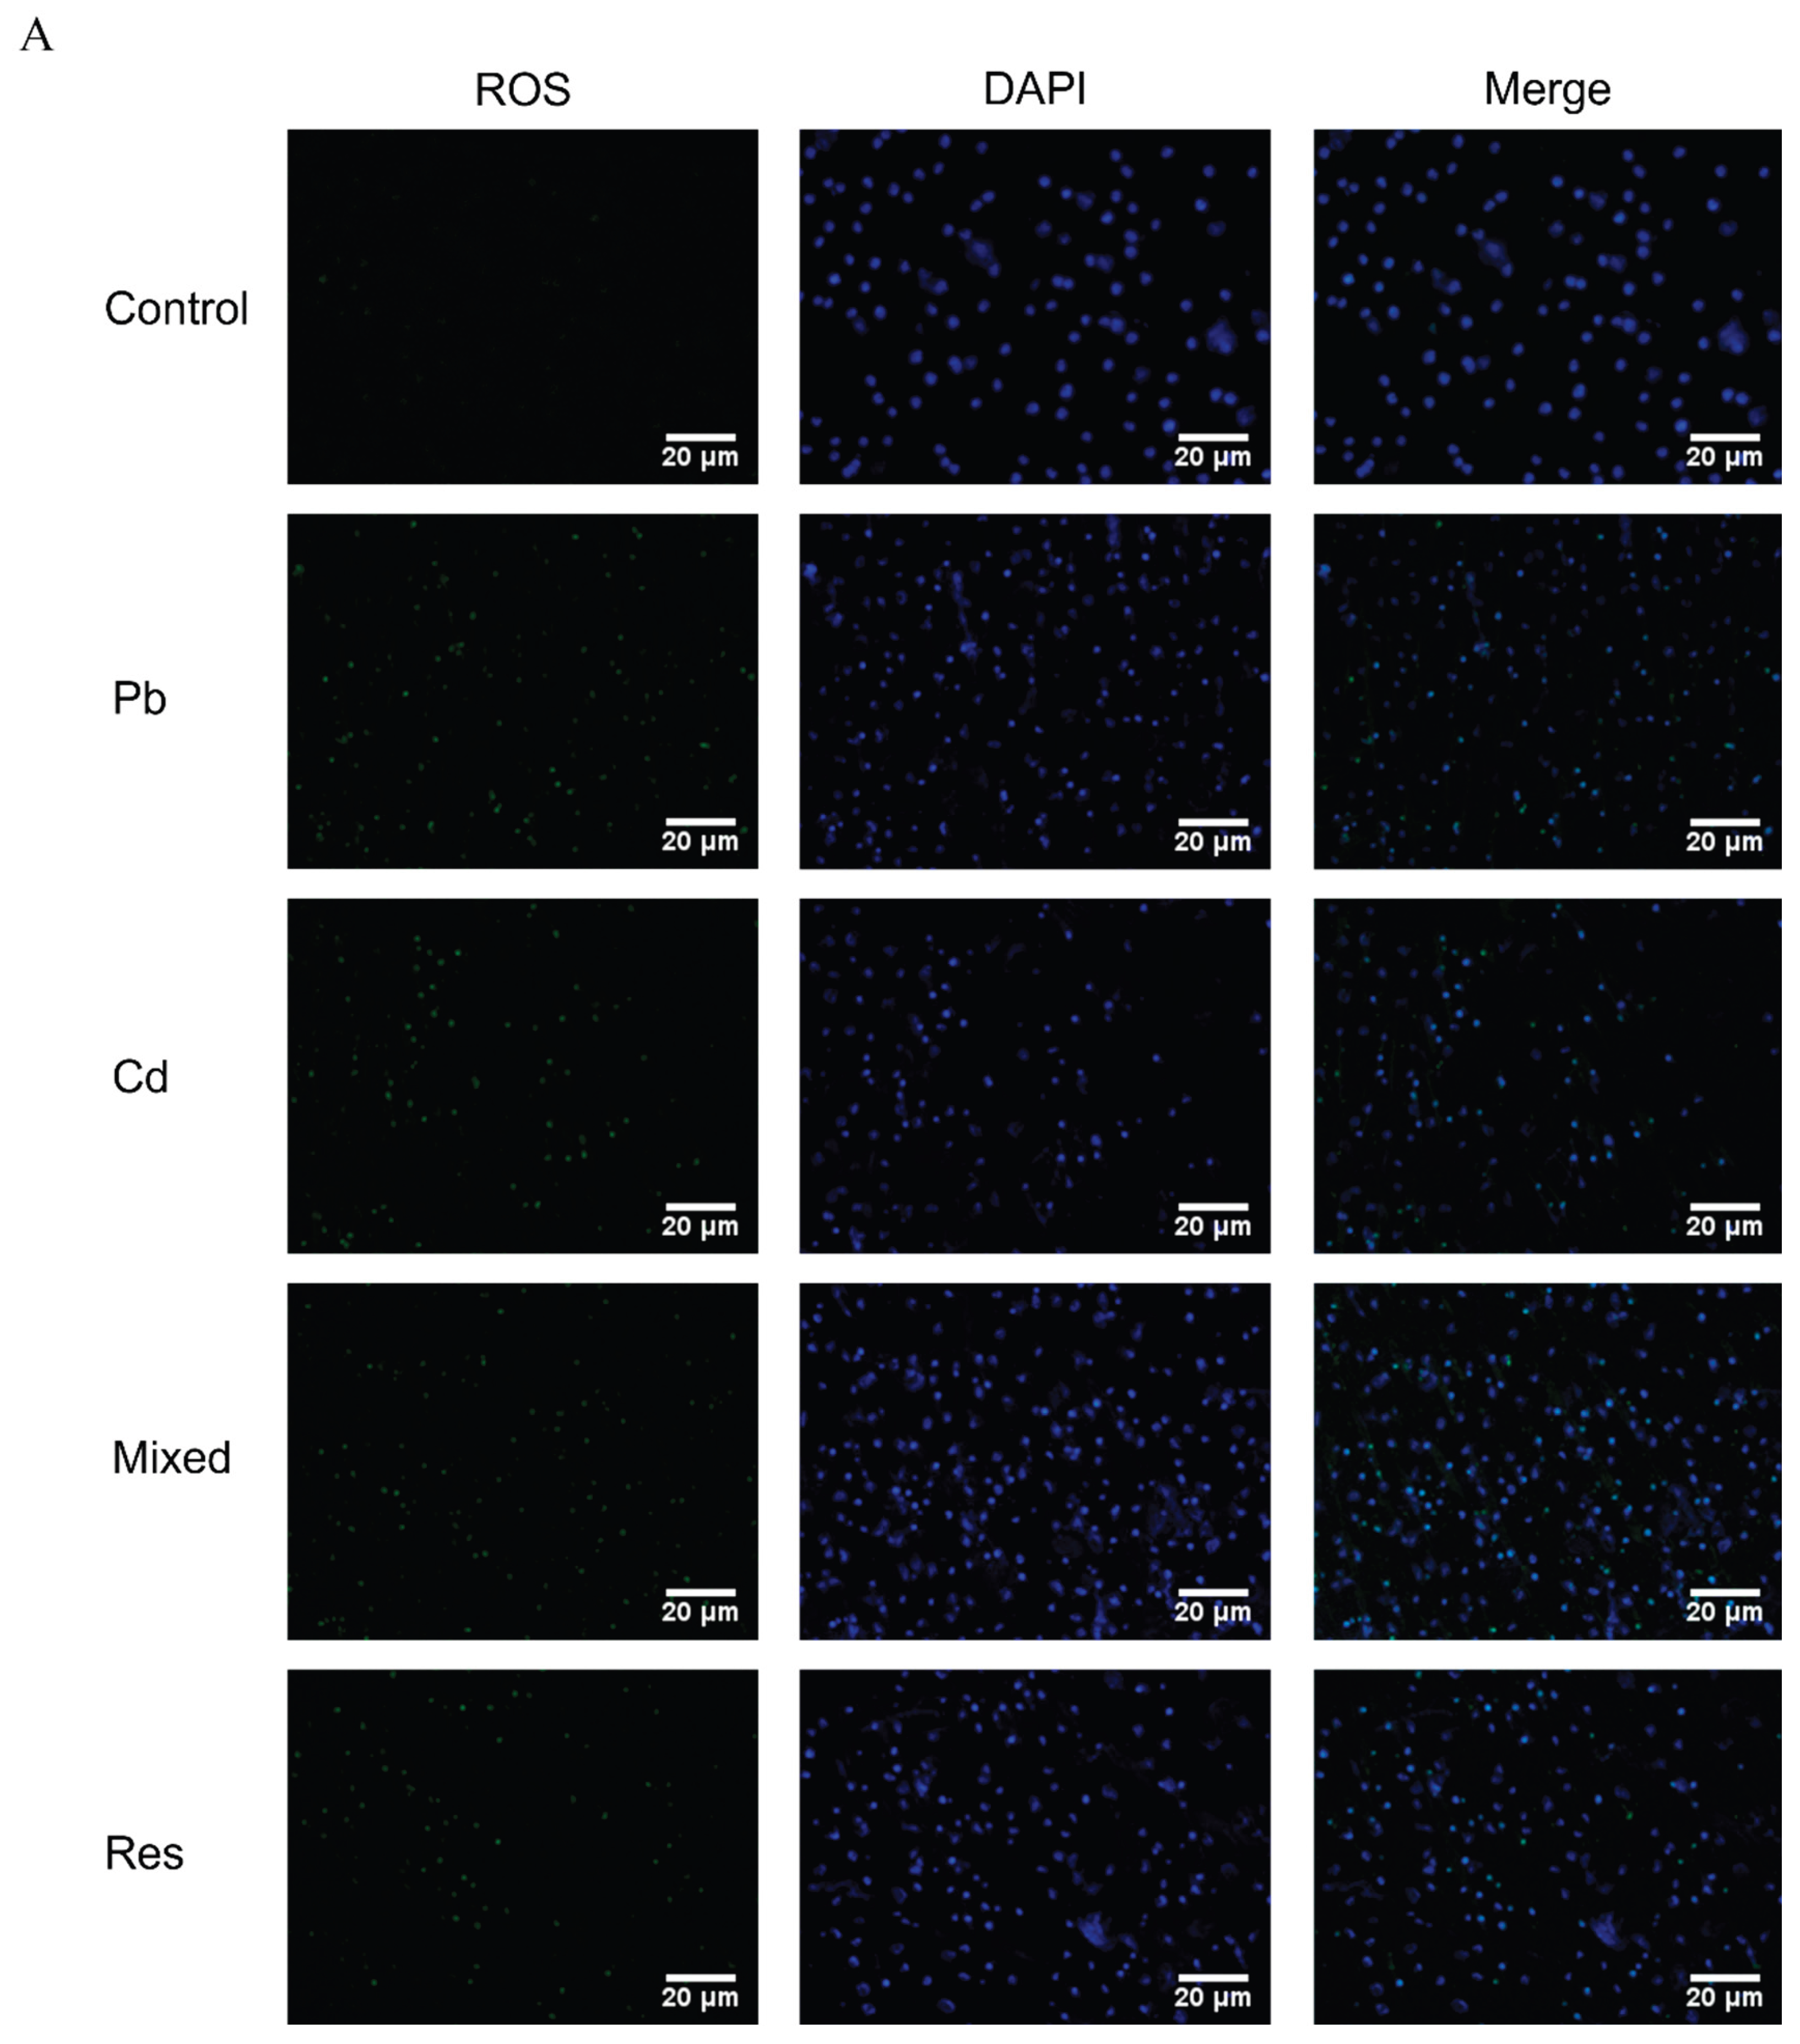
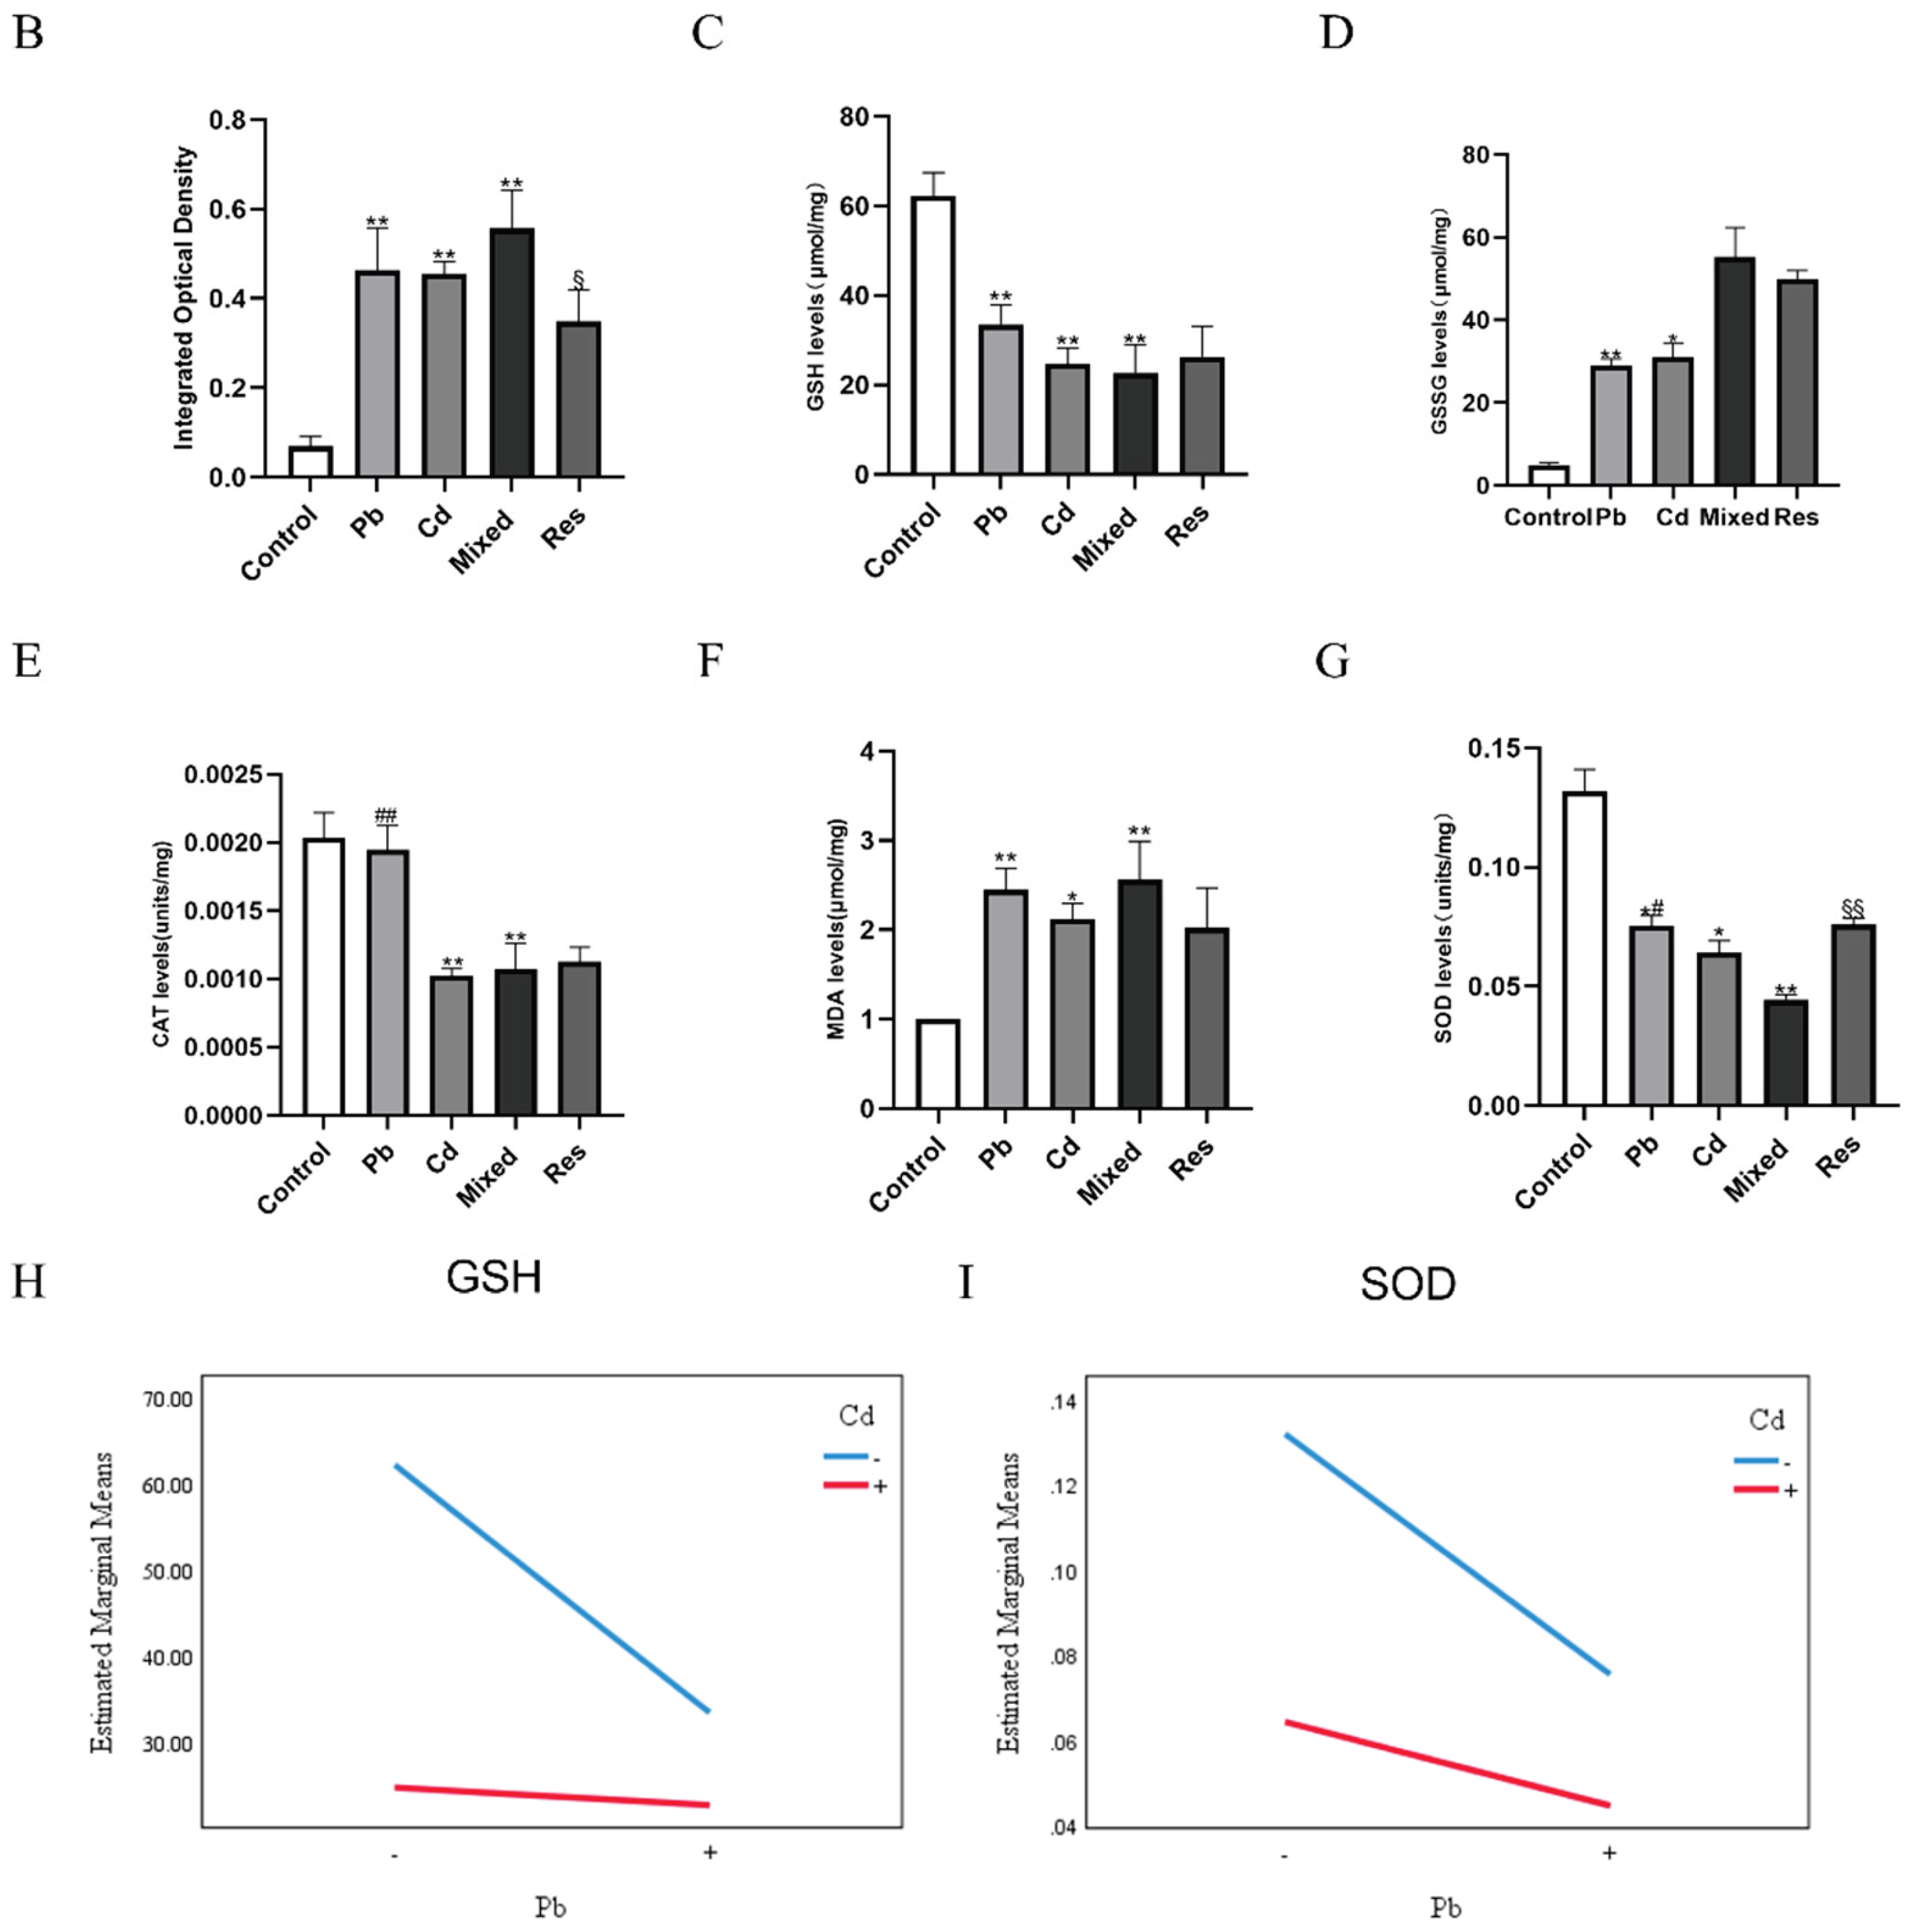
Figure 3.
DNA damage markers induced by Pb and/or Cd in TK6 cells. (A) (C) representative. immunofluorescence staining micrographs and quantification of γ-H2AX foci in TK6 cells. (B), (D), and (E) representative Comet assay images and quantitative analyses of tail DNA percentage (%) and Tail Length. (F) and (G) represent the interaction diagrams of γ-H2AX and Tail Length, respectively. Note: *P < 0.05, **P < 0.01 for Pb or/and Cd group compared with the Control group; while #P < 0.05, ##P < 0.01 for single exposure groups compared to mixed group; §P < 0.05, §§P < 0.01 for resveratrol group compared to mixed group.
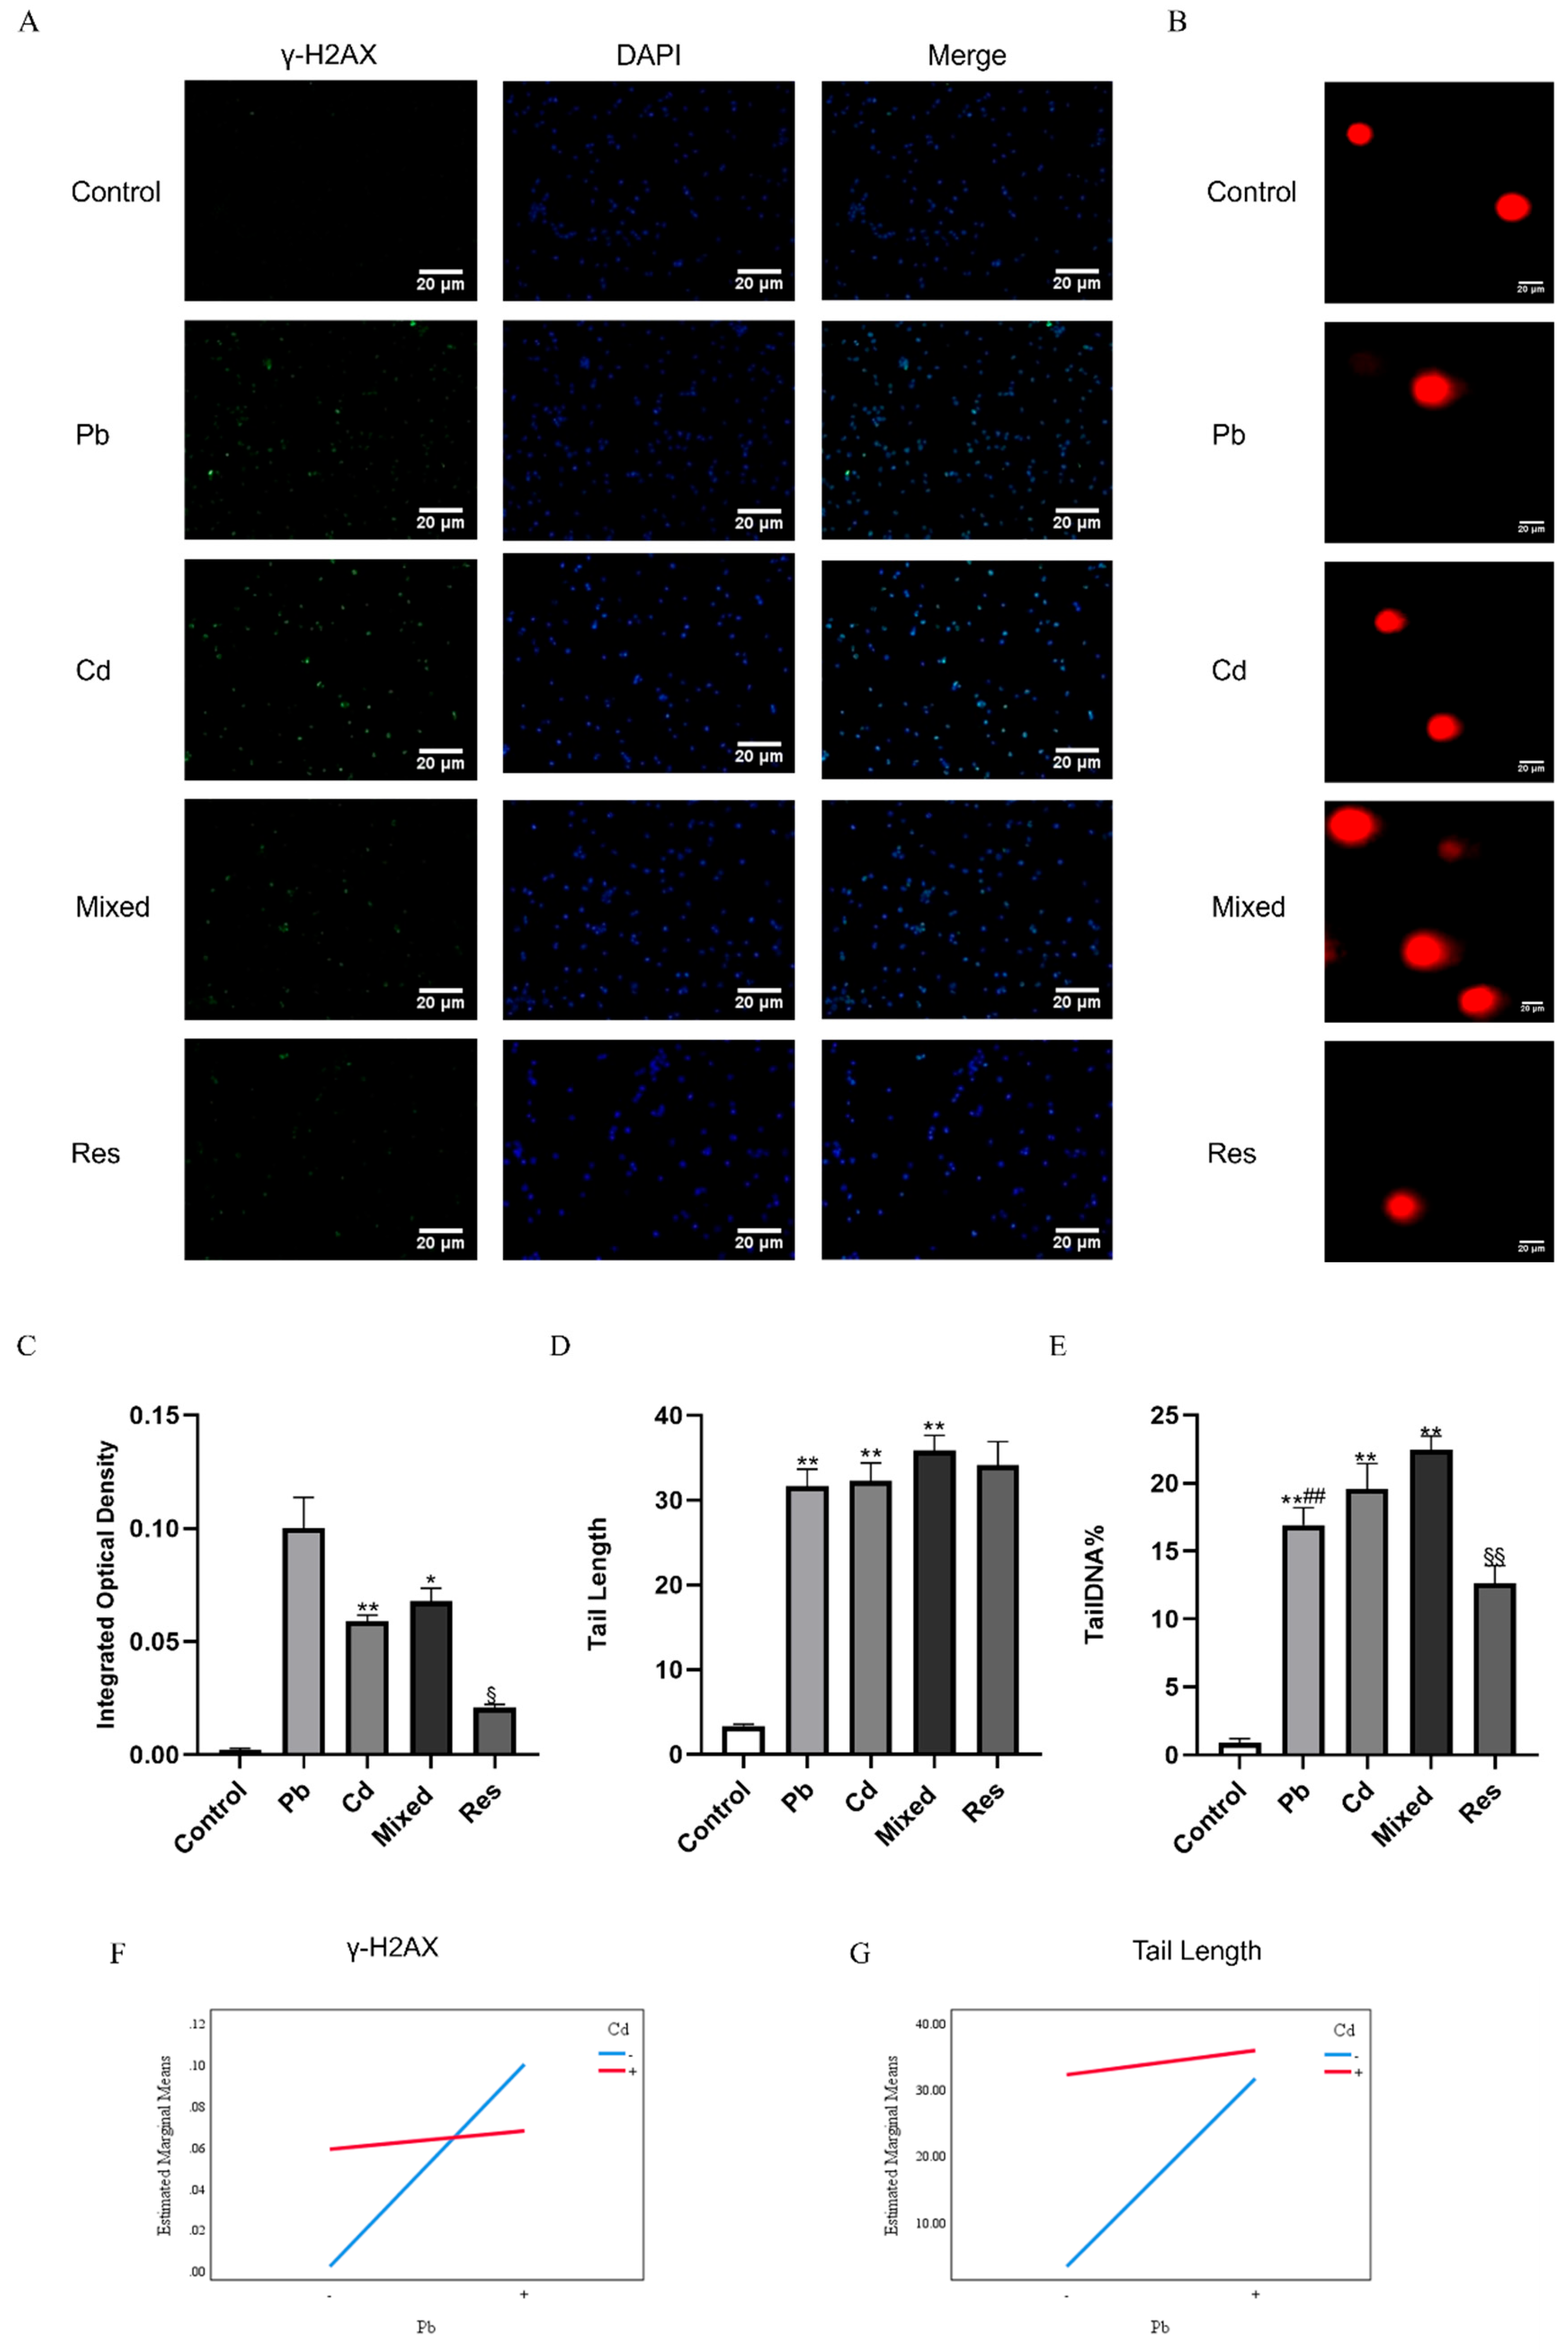
Figure 4.
Cell cycle arrest and apoptosis of TK6 cells induced by Pb and/or Cd. (A) (C) representative flow-cytometry histogram of cell cycle distribution and Quantification of S-phase. (B) and (D) representative flow-cytometry plots of apoptosis detected by Annexin V-FITC/PI assay and quantification of apoptotic rate. (E) represent the interaction diagrams of apoptosis. Note: *P < 0.05, **P < 0.01 for Pb or/and Cd group compared with the Control group; while #P < 0.05, ##P < 0.01 for single exposure groups compared to mixed group; §P < 0.05, §§P < 0.01 for resveratrol group compared to mixed group.
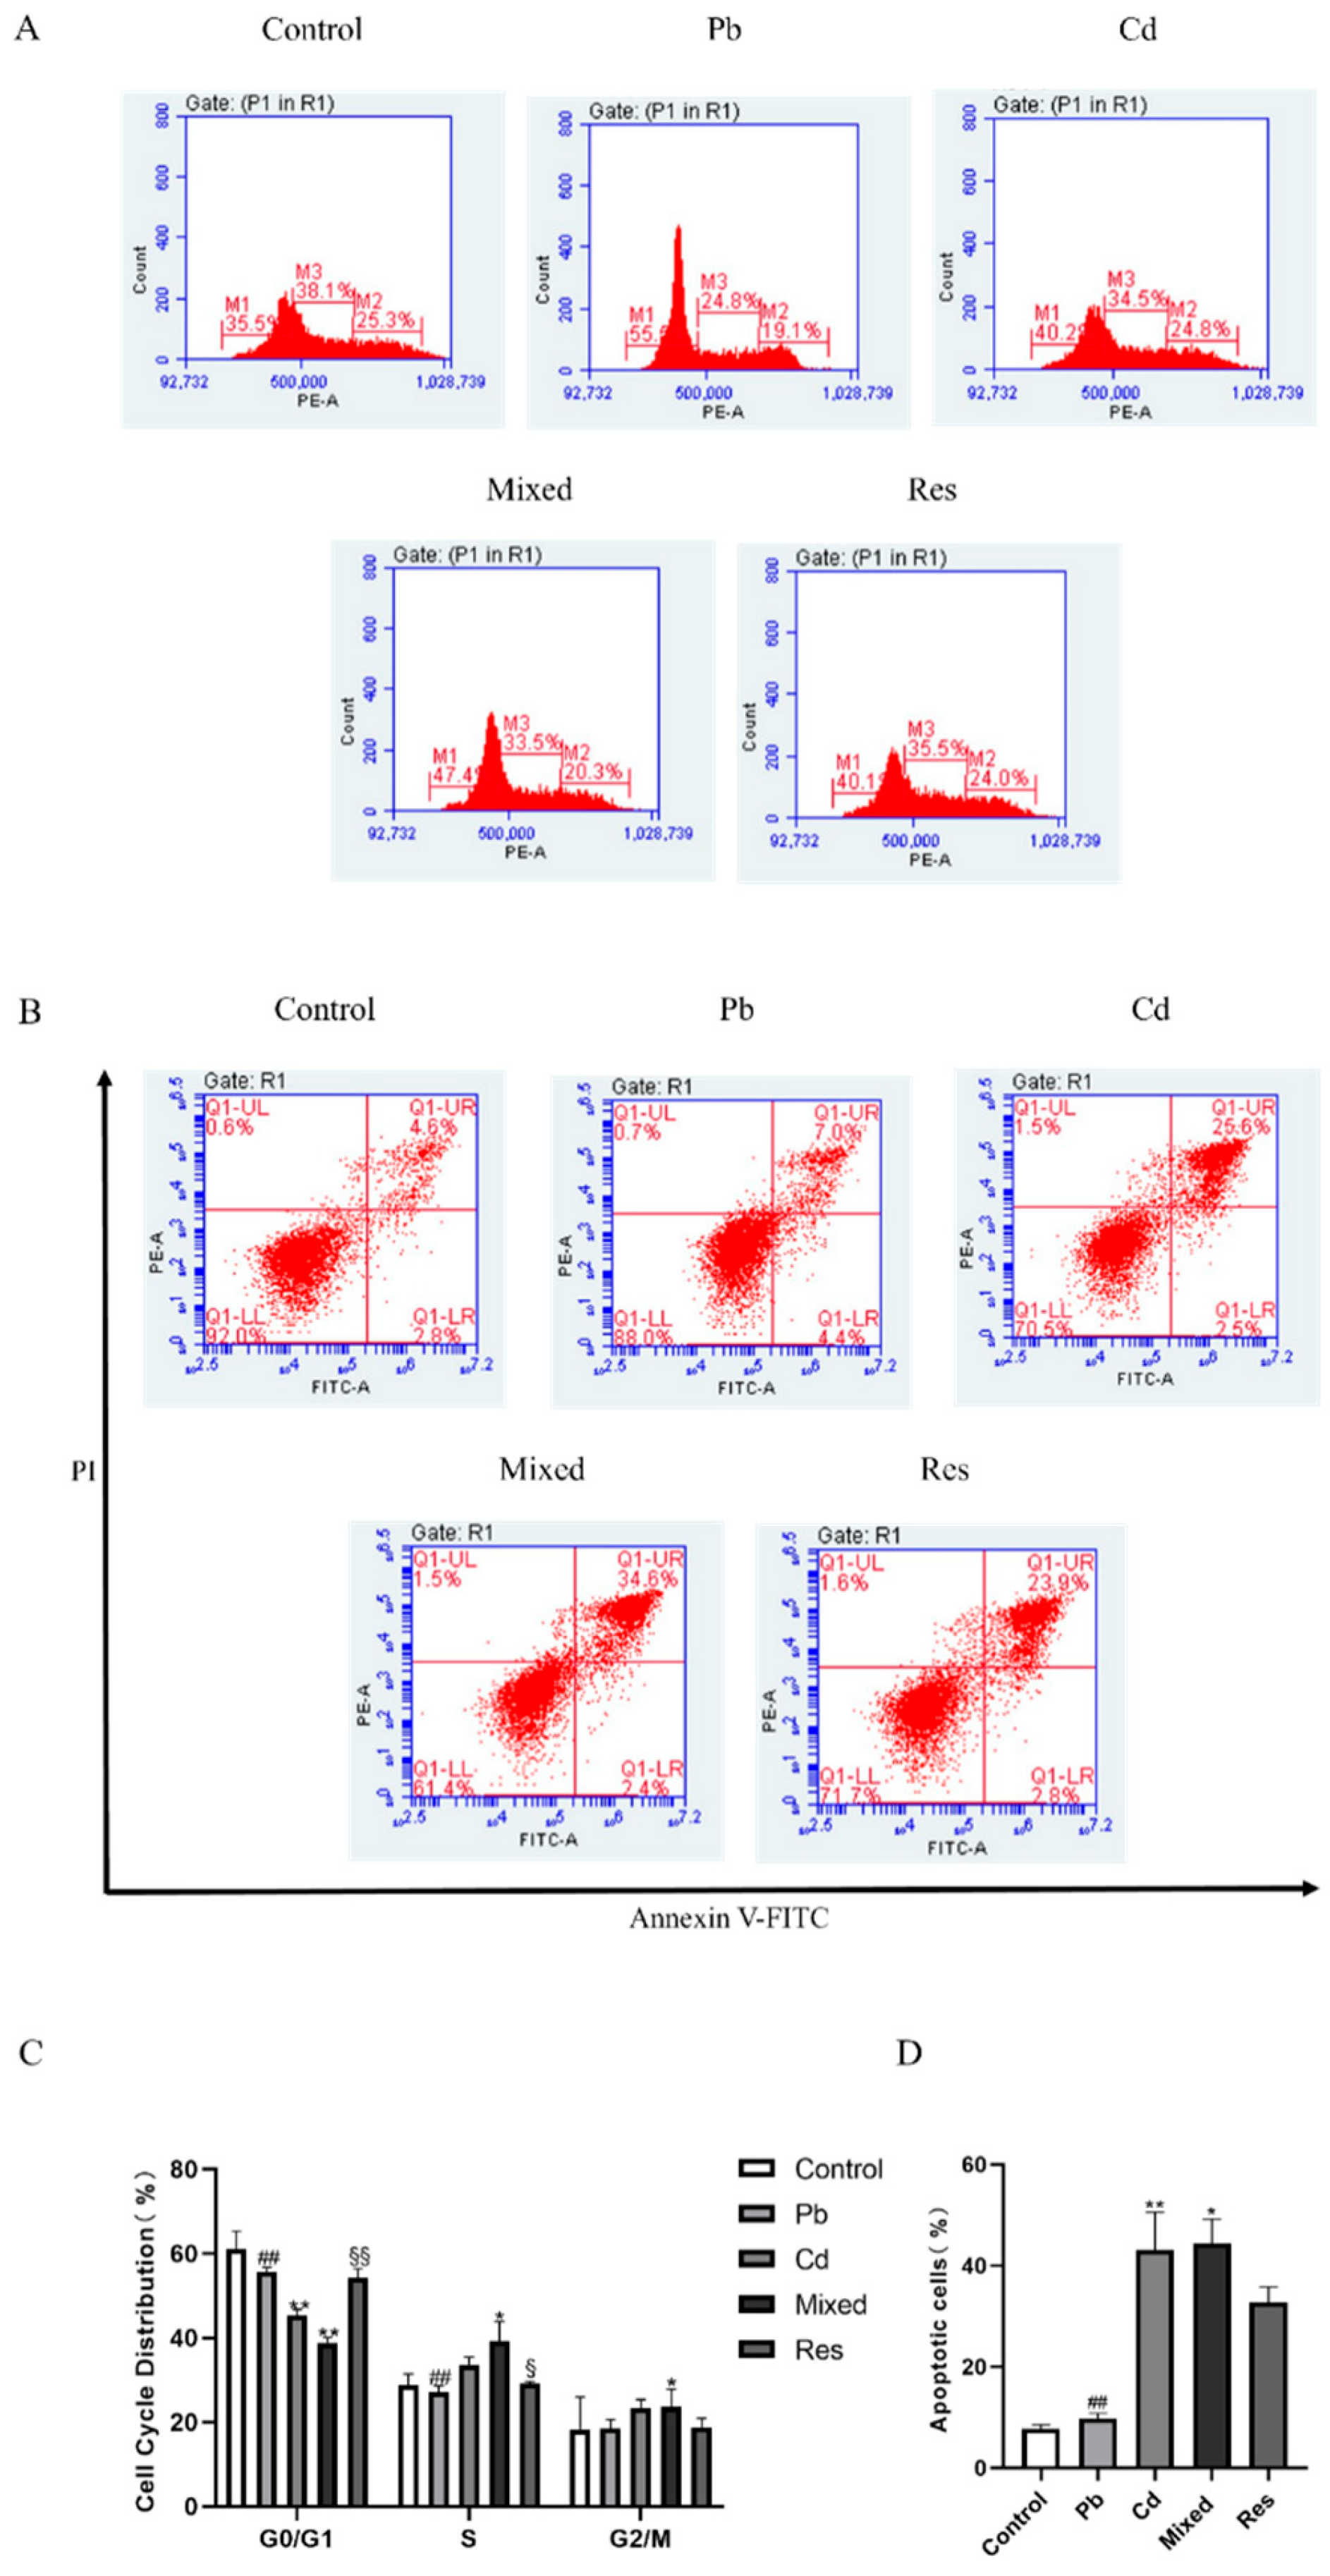
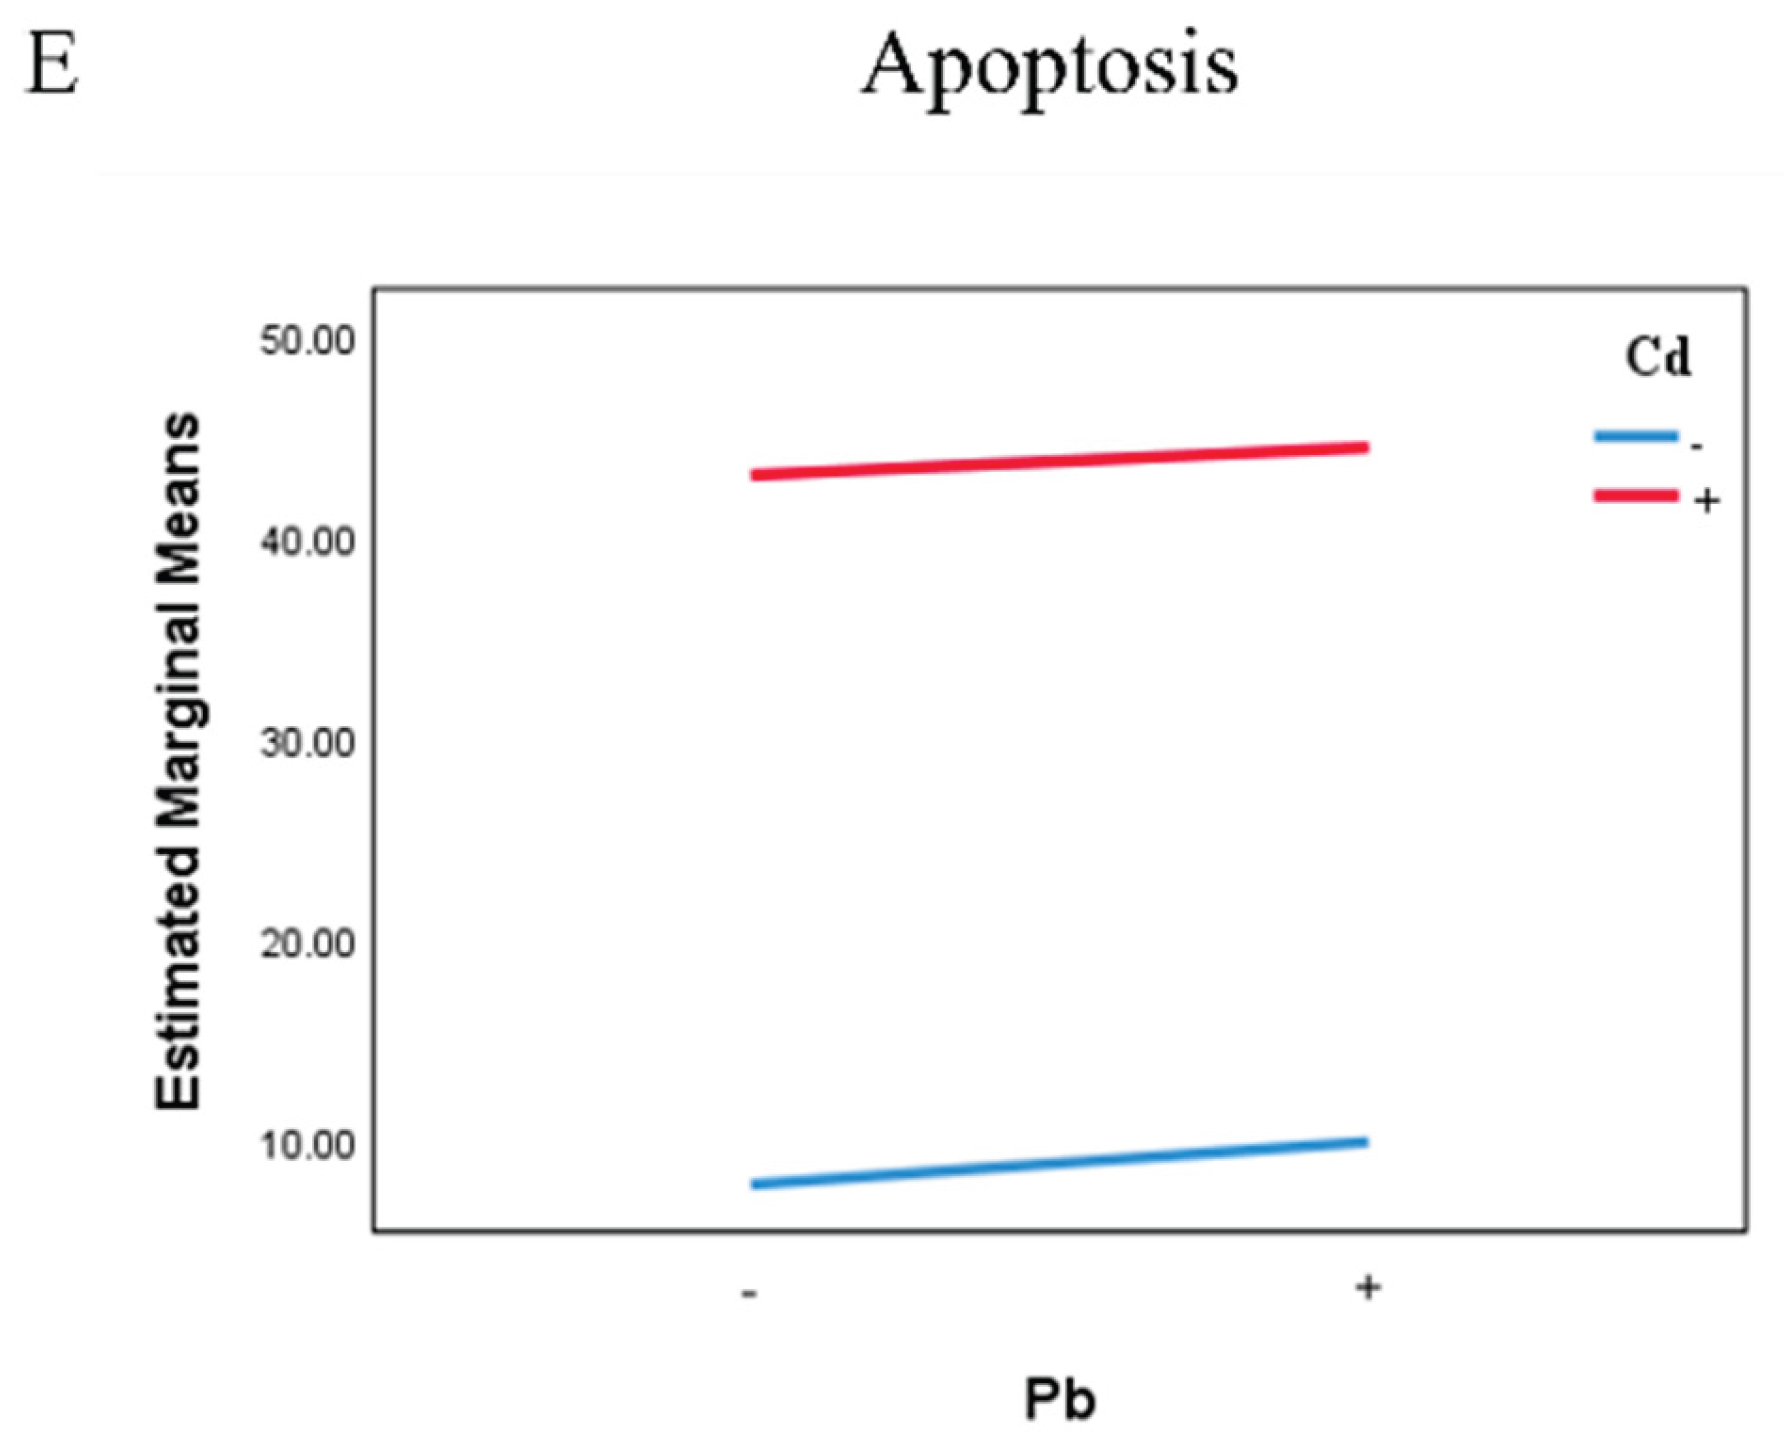
Figure 5.
Relative mRNA expressions of DNA repair genes and apoptosis pathway after exposure to Pb and/or Cd in TK6 cells. (A), (B), (C), (D) showed the relative mRNA expressions of BRCA1, CtIP, RAD52 and XRCC2; (E), (F), (G), (H) showed the relative mRNA expressions of Bax, Bcl-2, Bax/Bcl-2; Caspase-3. (I) and (J) represent the interaction diagrams of CtIP and RAD52, respectively. Note: *P < 0.05, **P < 0.01 for Pb or/and Cd group compared with the Control group; while #P < 0.05, ##P < 0.01 for single exposure groups compared to mixed group; §P < 0.05, §§P < 0.01 for resveratrol group compared to mixed group.
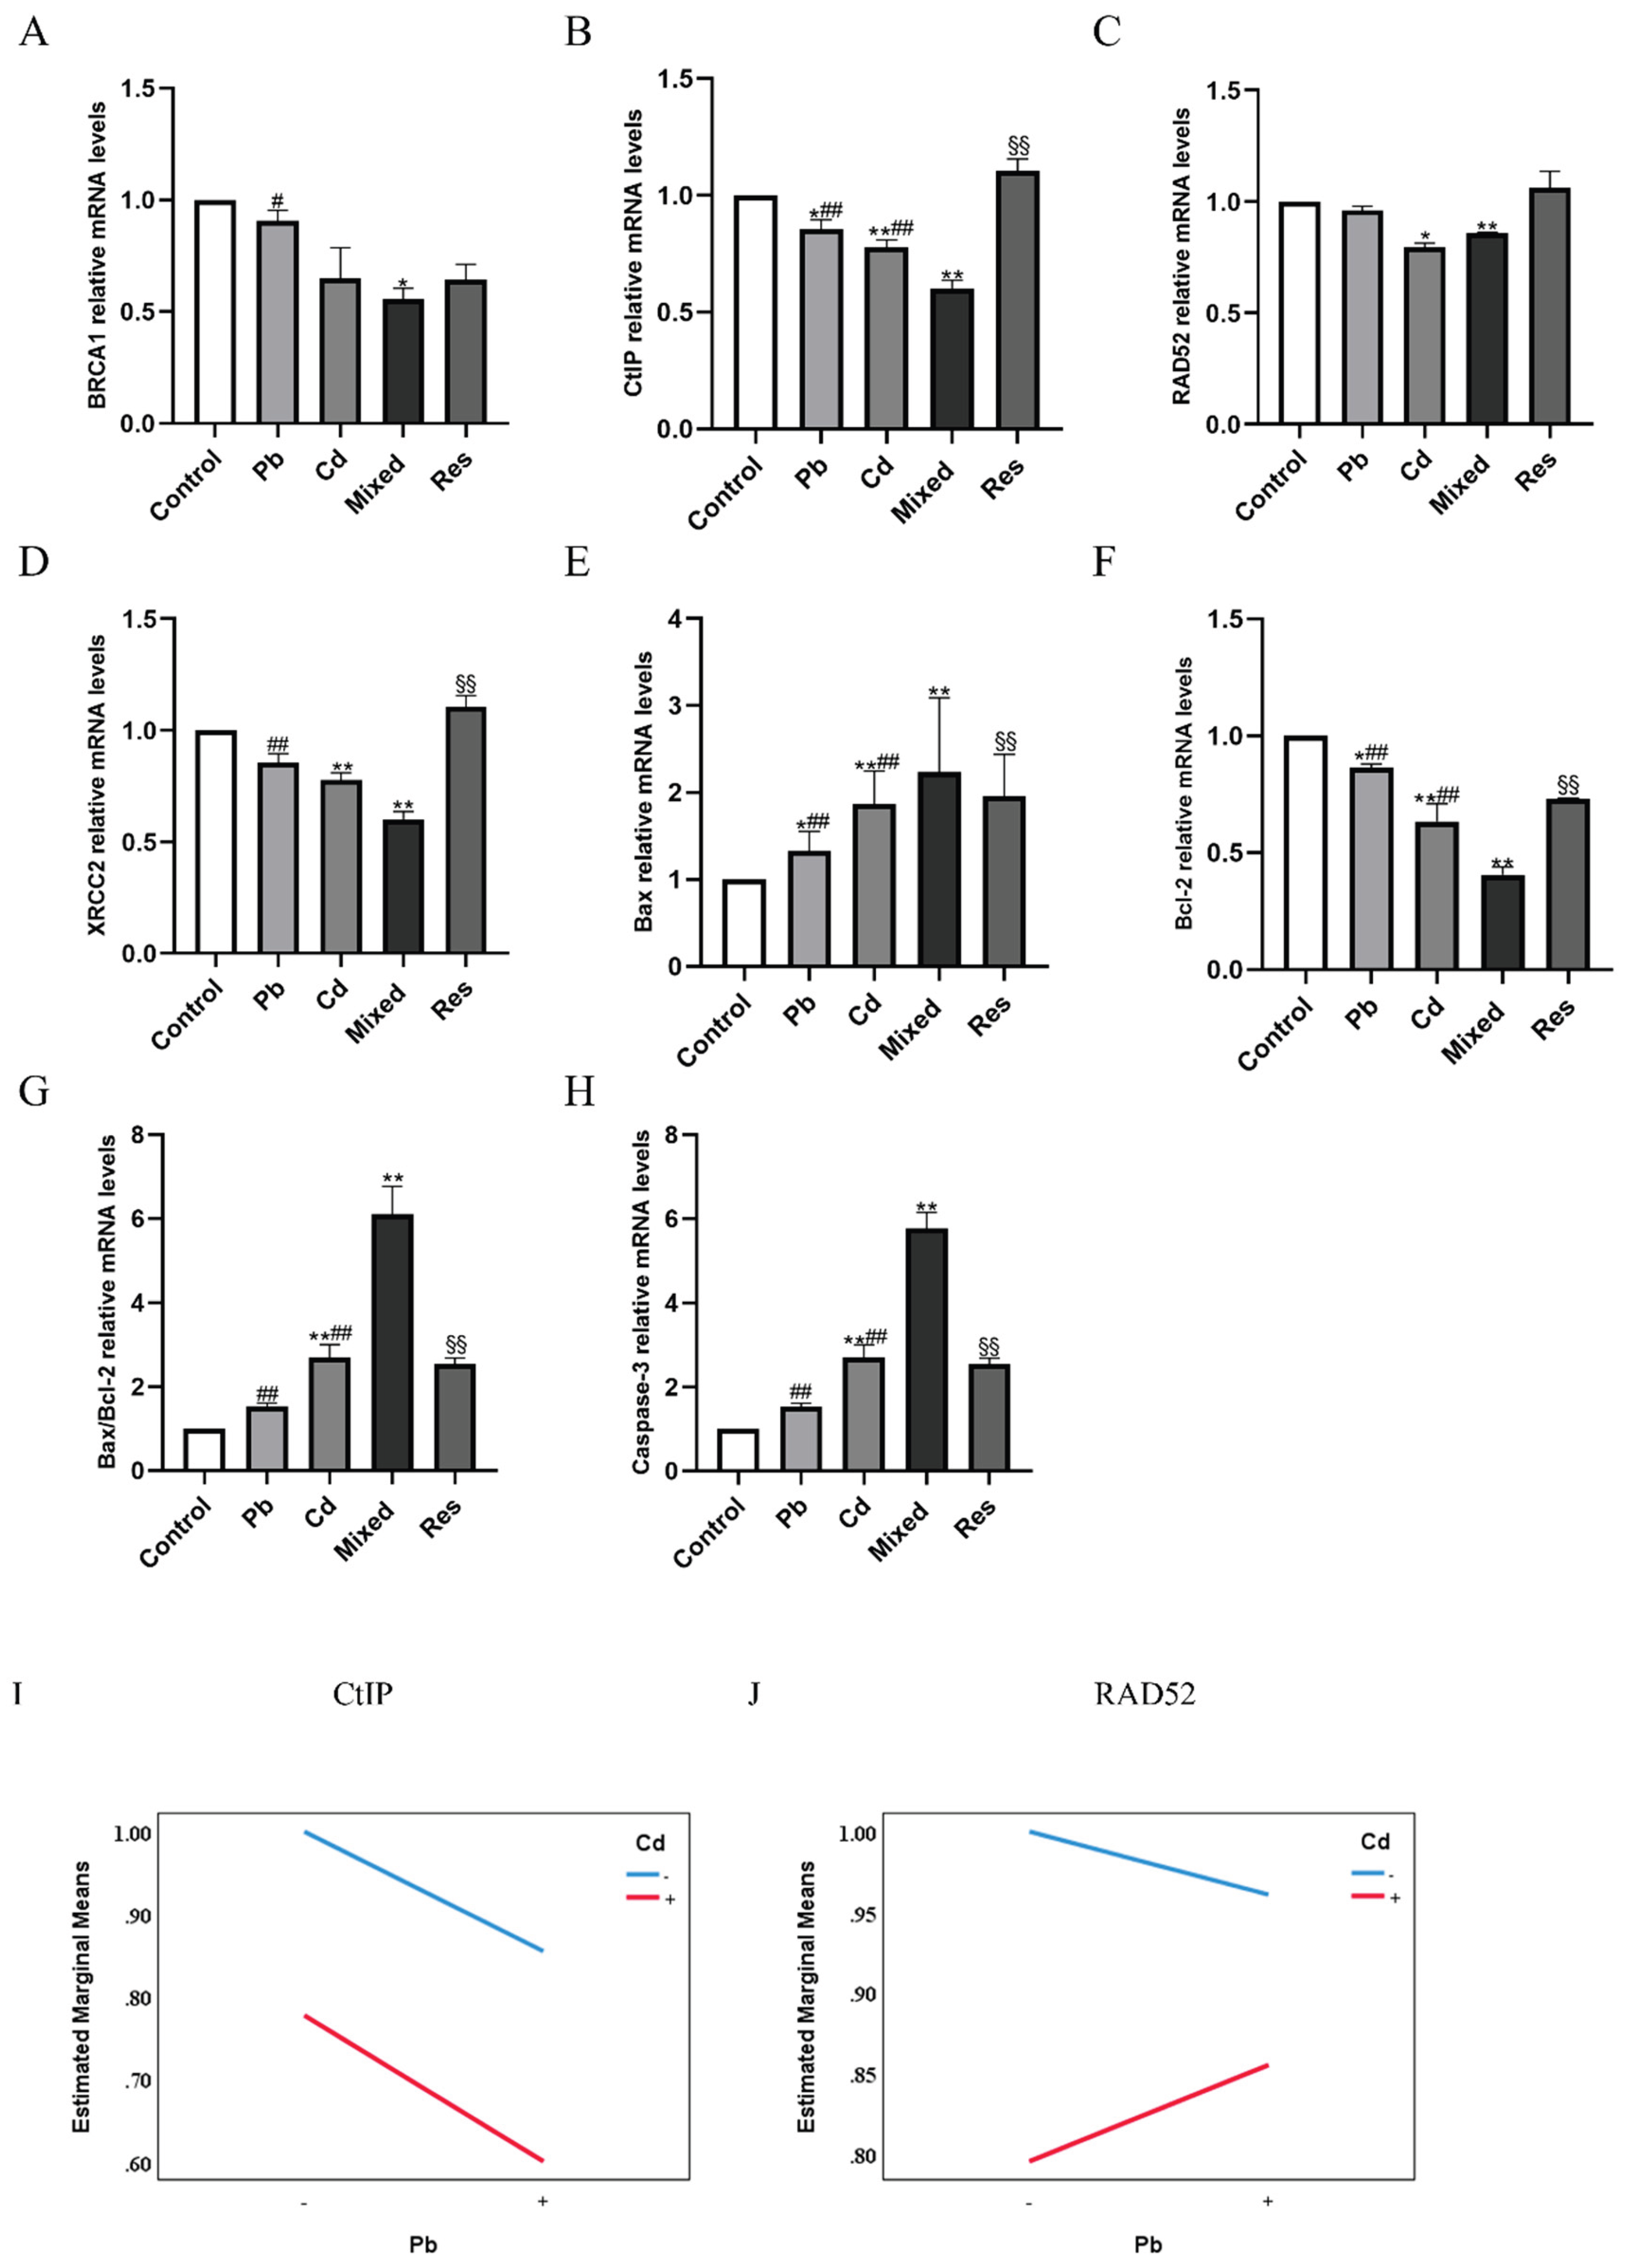
Figure 6.
Relative protein expressions of DNA repair genes and apoptosis pathway after exposure to Pb and/or Cd in TK6 cells. (A), (B), (C) (D) and (E) representative Western blotting images and quantitative protein levels of BRCA1, CtIP, RAD52 and XRCC2; (A), (F), (G) (H) (I)representative Western blotting images and quantitative protein levels of Bax, Bcl-2, Bax/Bcl-2 and Caspase-3. (J) and (K) represent the interaction diagrams of CtIP and XRCC2, respectively. Note: *P < 0.05, **P < 0.01 for Pb or/and Cd group compared with the Control group; while #P < 0.05, ##P < 0.01 for single exposure groups compared to mixed group; §P < 0.05, §§P < 0.01 for resveratrol group compared to mixed group.
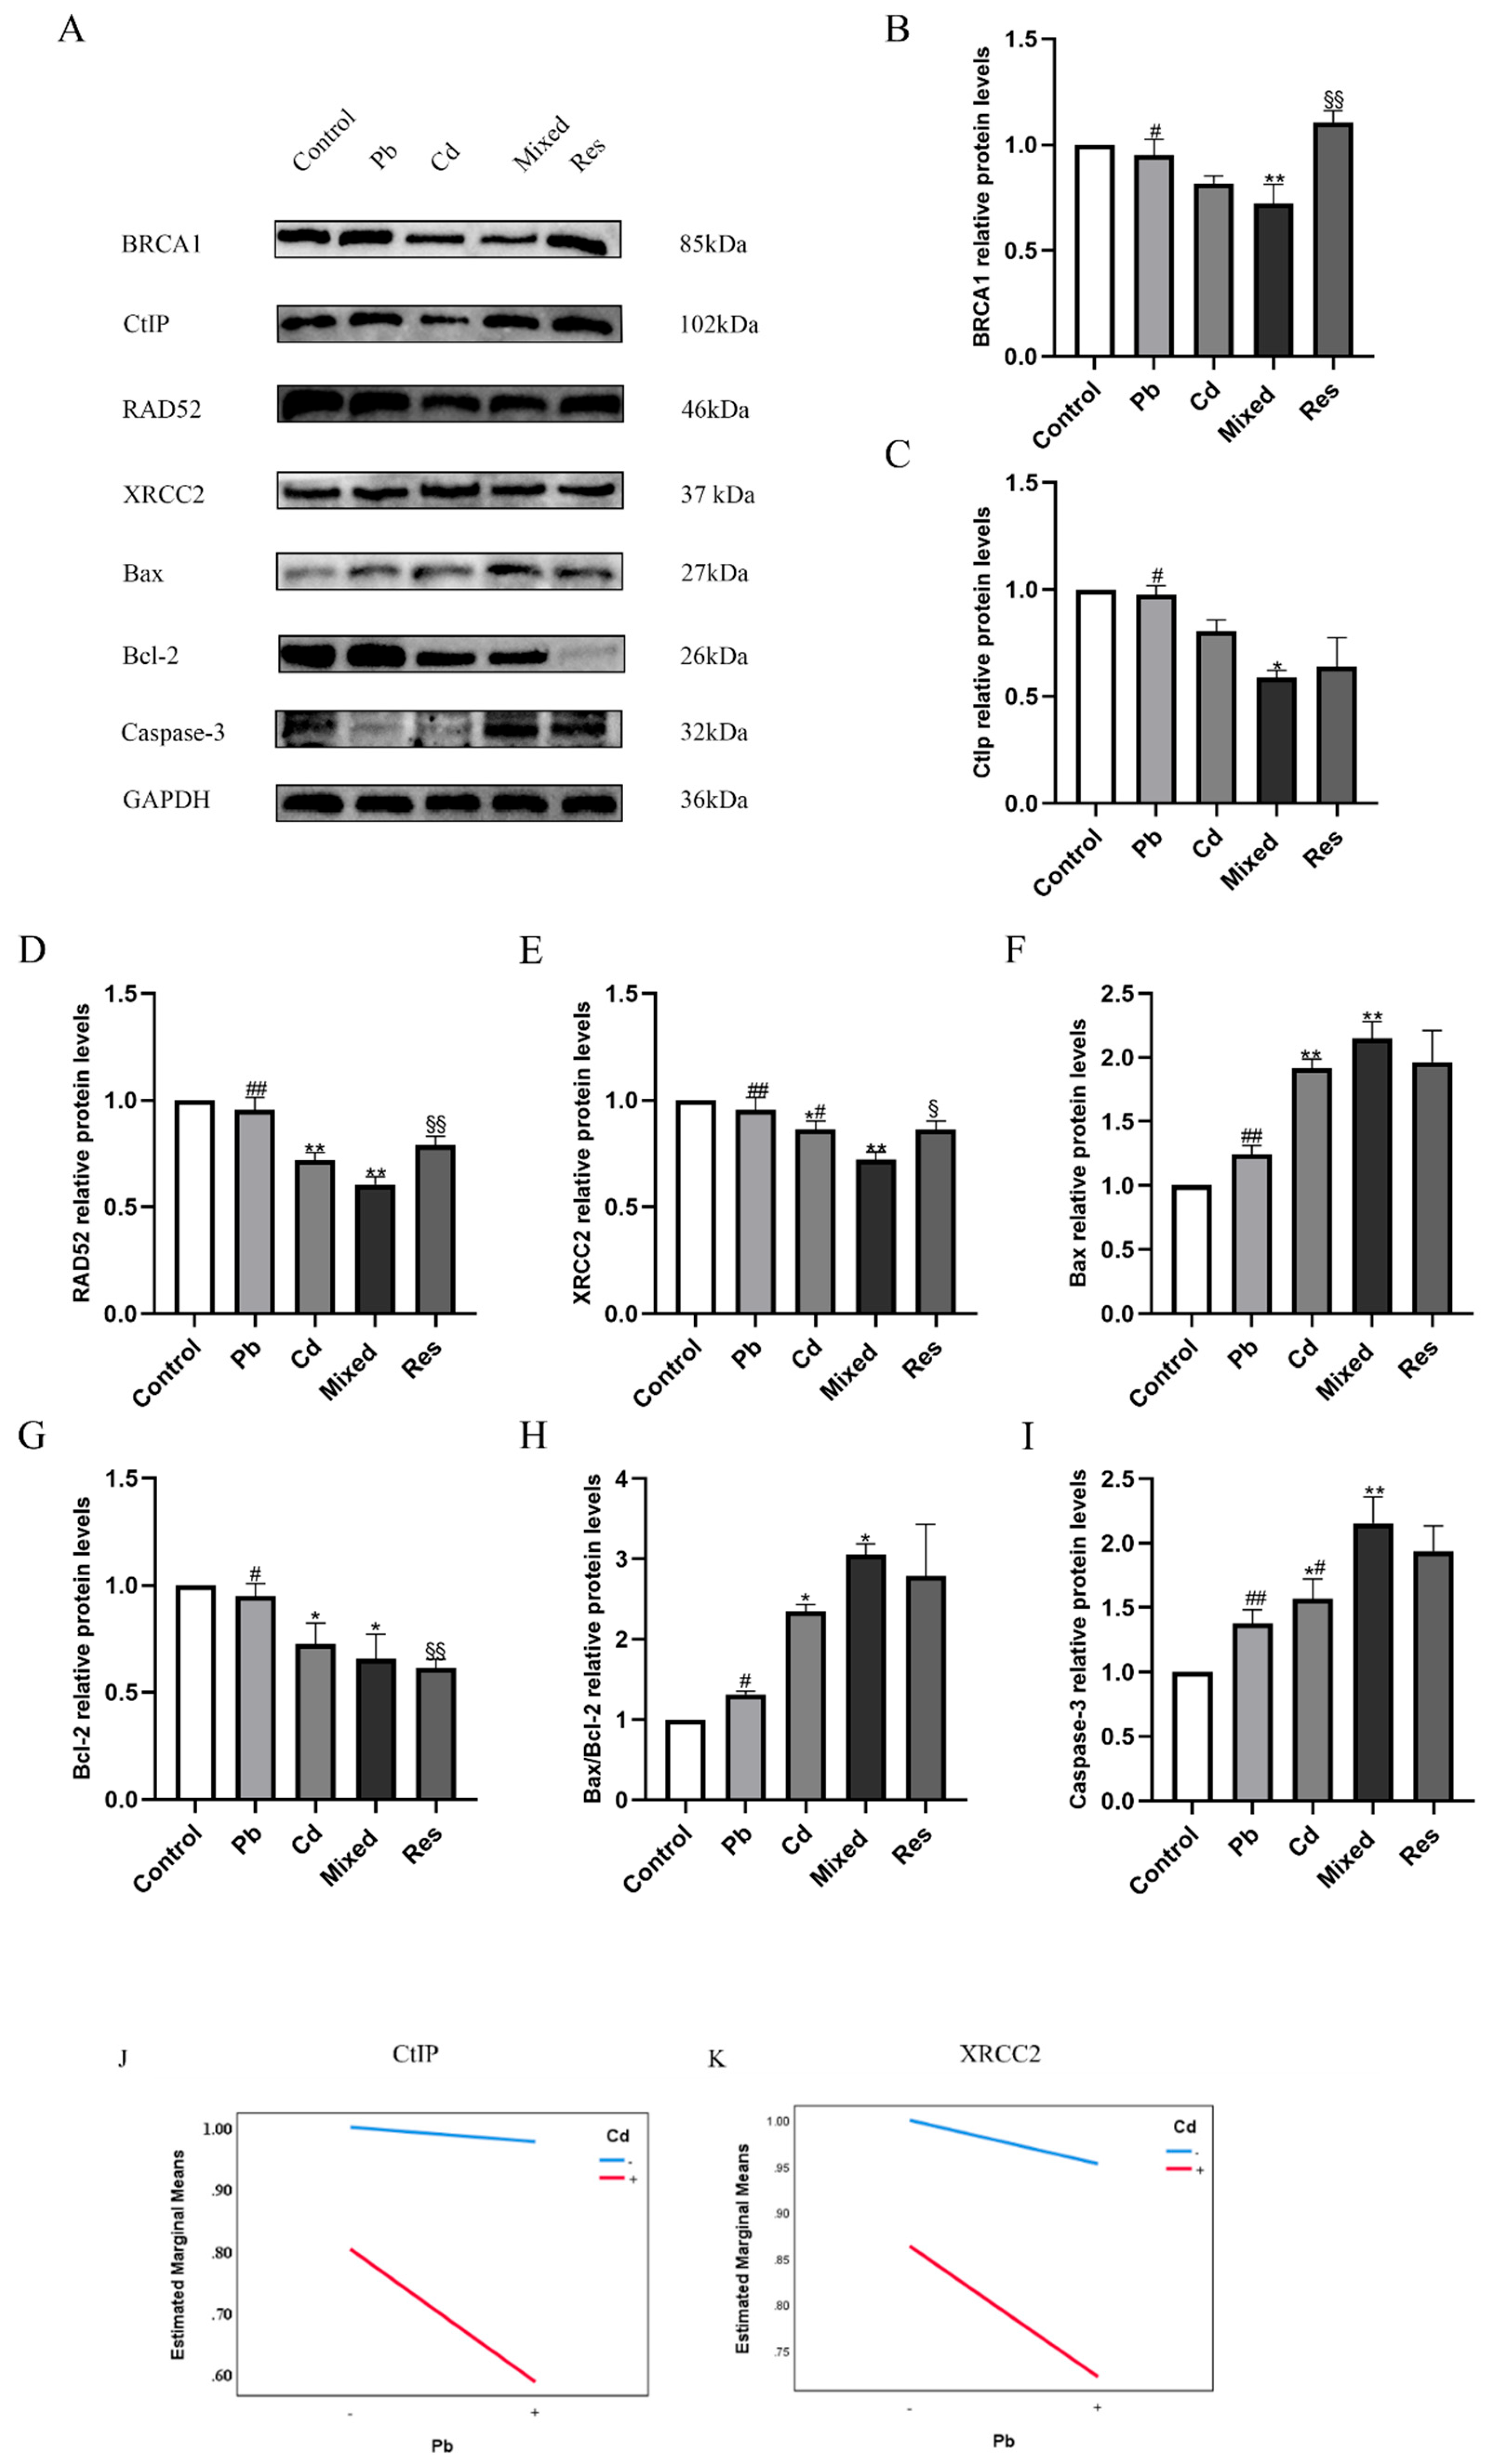

Table 1.
Primer sequences for quantitative real-time PCR.
| Sl. No. | Name of the gene | Accession Number |
Sequence (5’ to 3’) | Products (bp) |
|---|---|---|---|---|
| 1 | BRCA1 | NM_007297 | F: GAAACCGTGCCAAAAGACTTC | 88 |
| R: CCAAGGTTAGAGAGTTGGACAC | ||||
| 2 | CtIP | NM_002894 | F: CAGGAACGAATCTTAGATGCACA | 123 |
| R: GCCTGCTCTTAACCGATCTTCT | ||||
| 3 | RAD52 | NM_134424 | F: CCAGAAGGTGTGCTACATTGAG | 145 |
| R: ACAGACTCCCACGTAGAACTTG | ||||
| 4 | XRCC2 | NM_005431 | F: TGCTTTATCACCTAACAGCACG | 124 |
| R: TGCTCAAGAATTGTAACTAGCCG | ||||
| 5 | Bax | NM_138763 | F: CCCGAGAGGTCTTTTTCCGAG | 155 |
| R: CCAGCCCATGATGGTTCTGAT | ||||
| 6 | Bcl-2 | NM_000657 | F: GGTGGGGTCATGTGTGTGG | 89 |
| R: CGGTTCAGGTACTCAGTCATCC | ||||
| 7 | Caspase-3 | NM_004346 | F: CATGGAAGCGAATCAATGGACT | 139 |
| R: CTGTACCAGACCGAGATGTCA | ||||
| 8 | GAPDH | NM_001256799 | F: GGAGCGAGATCCCTCCAAAAT | 197 |
| R: GGCTGTTGTCATACTTCTCATGG |
Disclaimer/Publisher’s Note: The statements, opinions and data contained in all publications are solely those of the individual author(s) and contributor(s) and not of MDPI and/or the editor(s). MDPI and/or the editor(s) disclaim responsibility for any injury to people or property resulting from any ideas, methods, instructions or products referred to in the content. |
© 2026 by the authors. Licensee MDPI, Basel, Switzerland. This article is an open access article distributed under the terms and conditions of the Creative Commons Attribution (CC BY) license (http://creativecommons.org/licenses/by/4.0/).
Copyright: This open access article is published under a Creative Commons CC BY 4.0 license, which permit the free download, distribution, and reuse, provided that the author and preprint are cited in any reuse.


