
Submitted:
04 December 2024
Posted:
04 December 2024
You are already at the latest version
Abstract
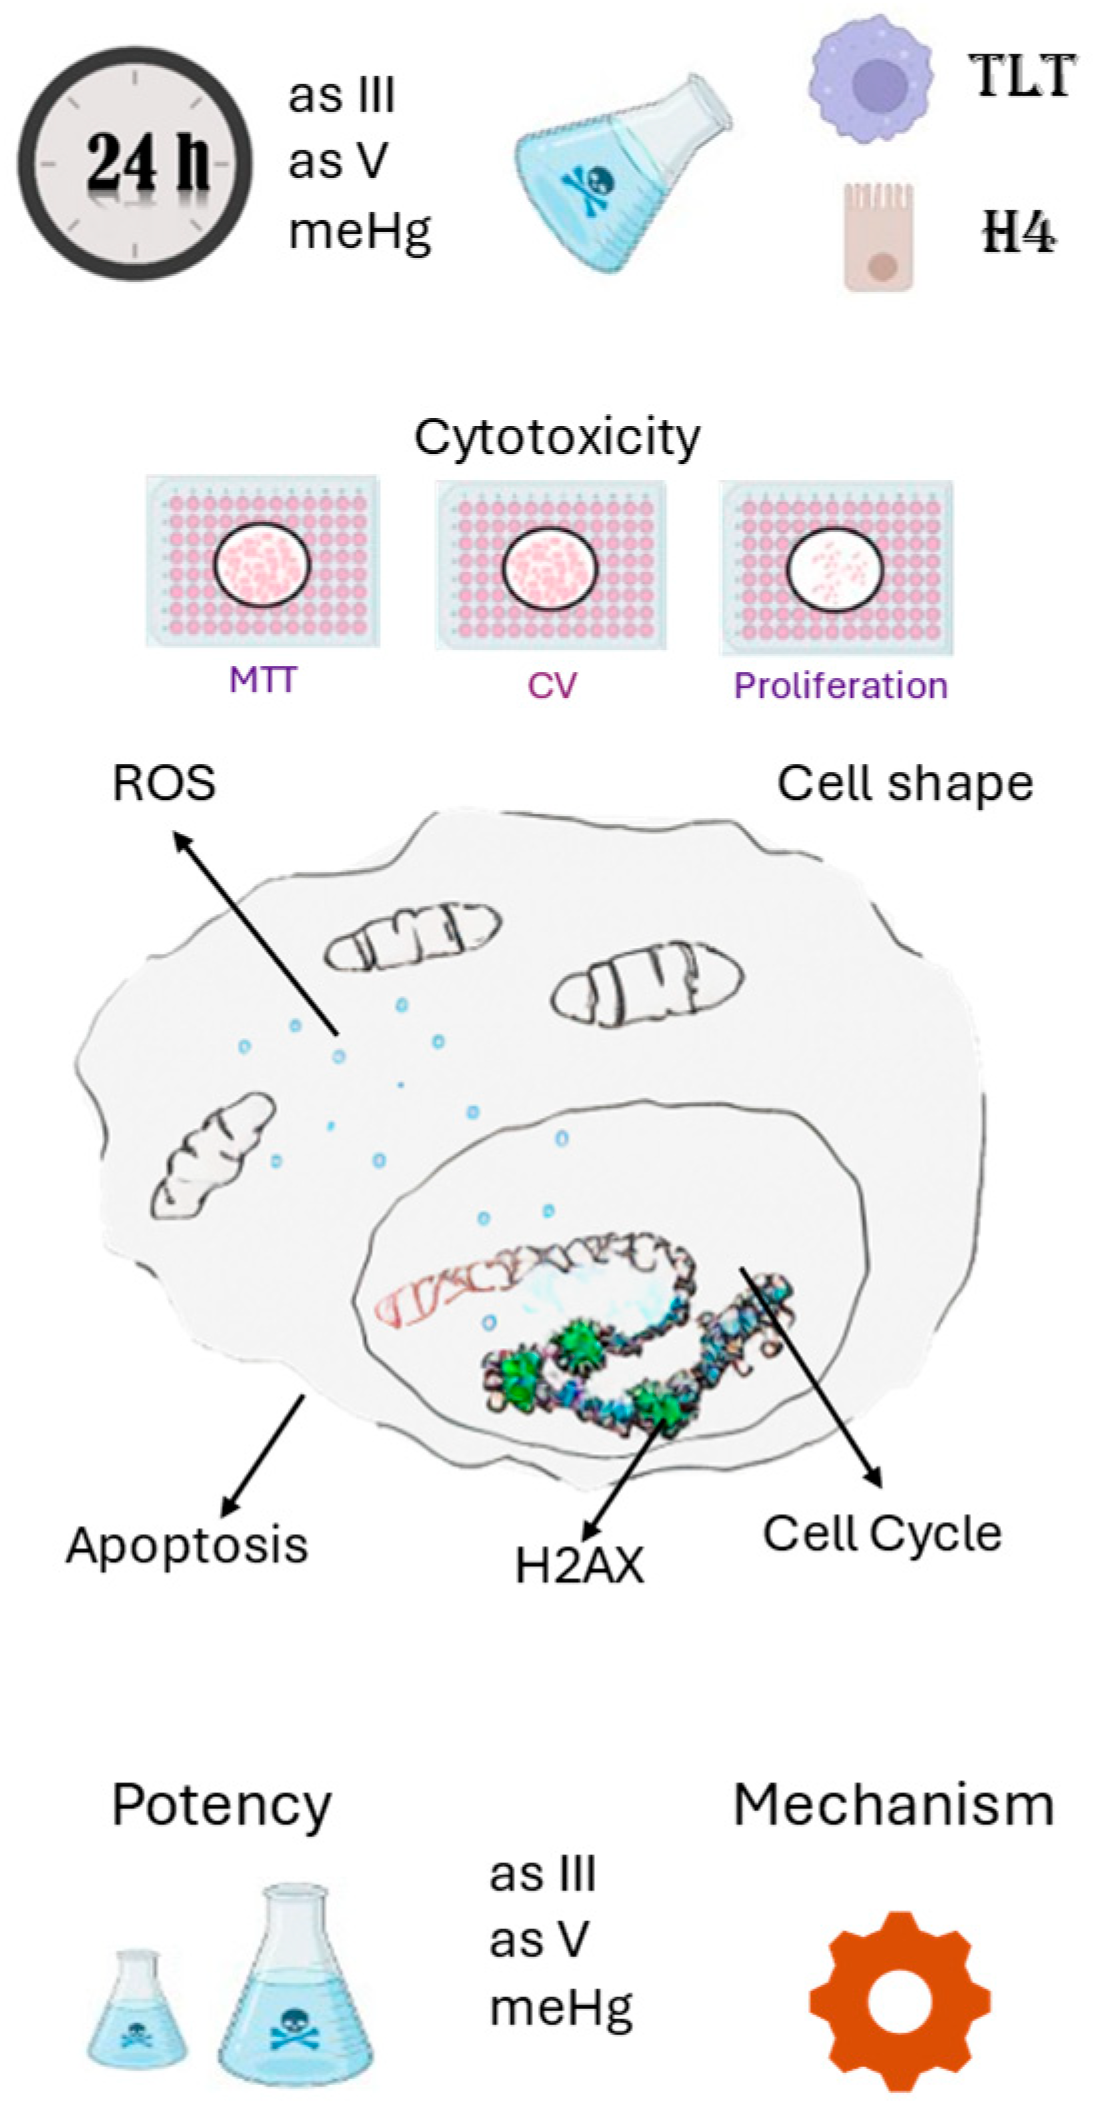
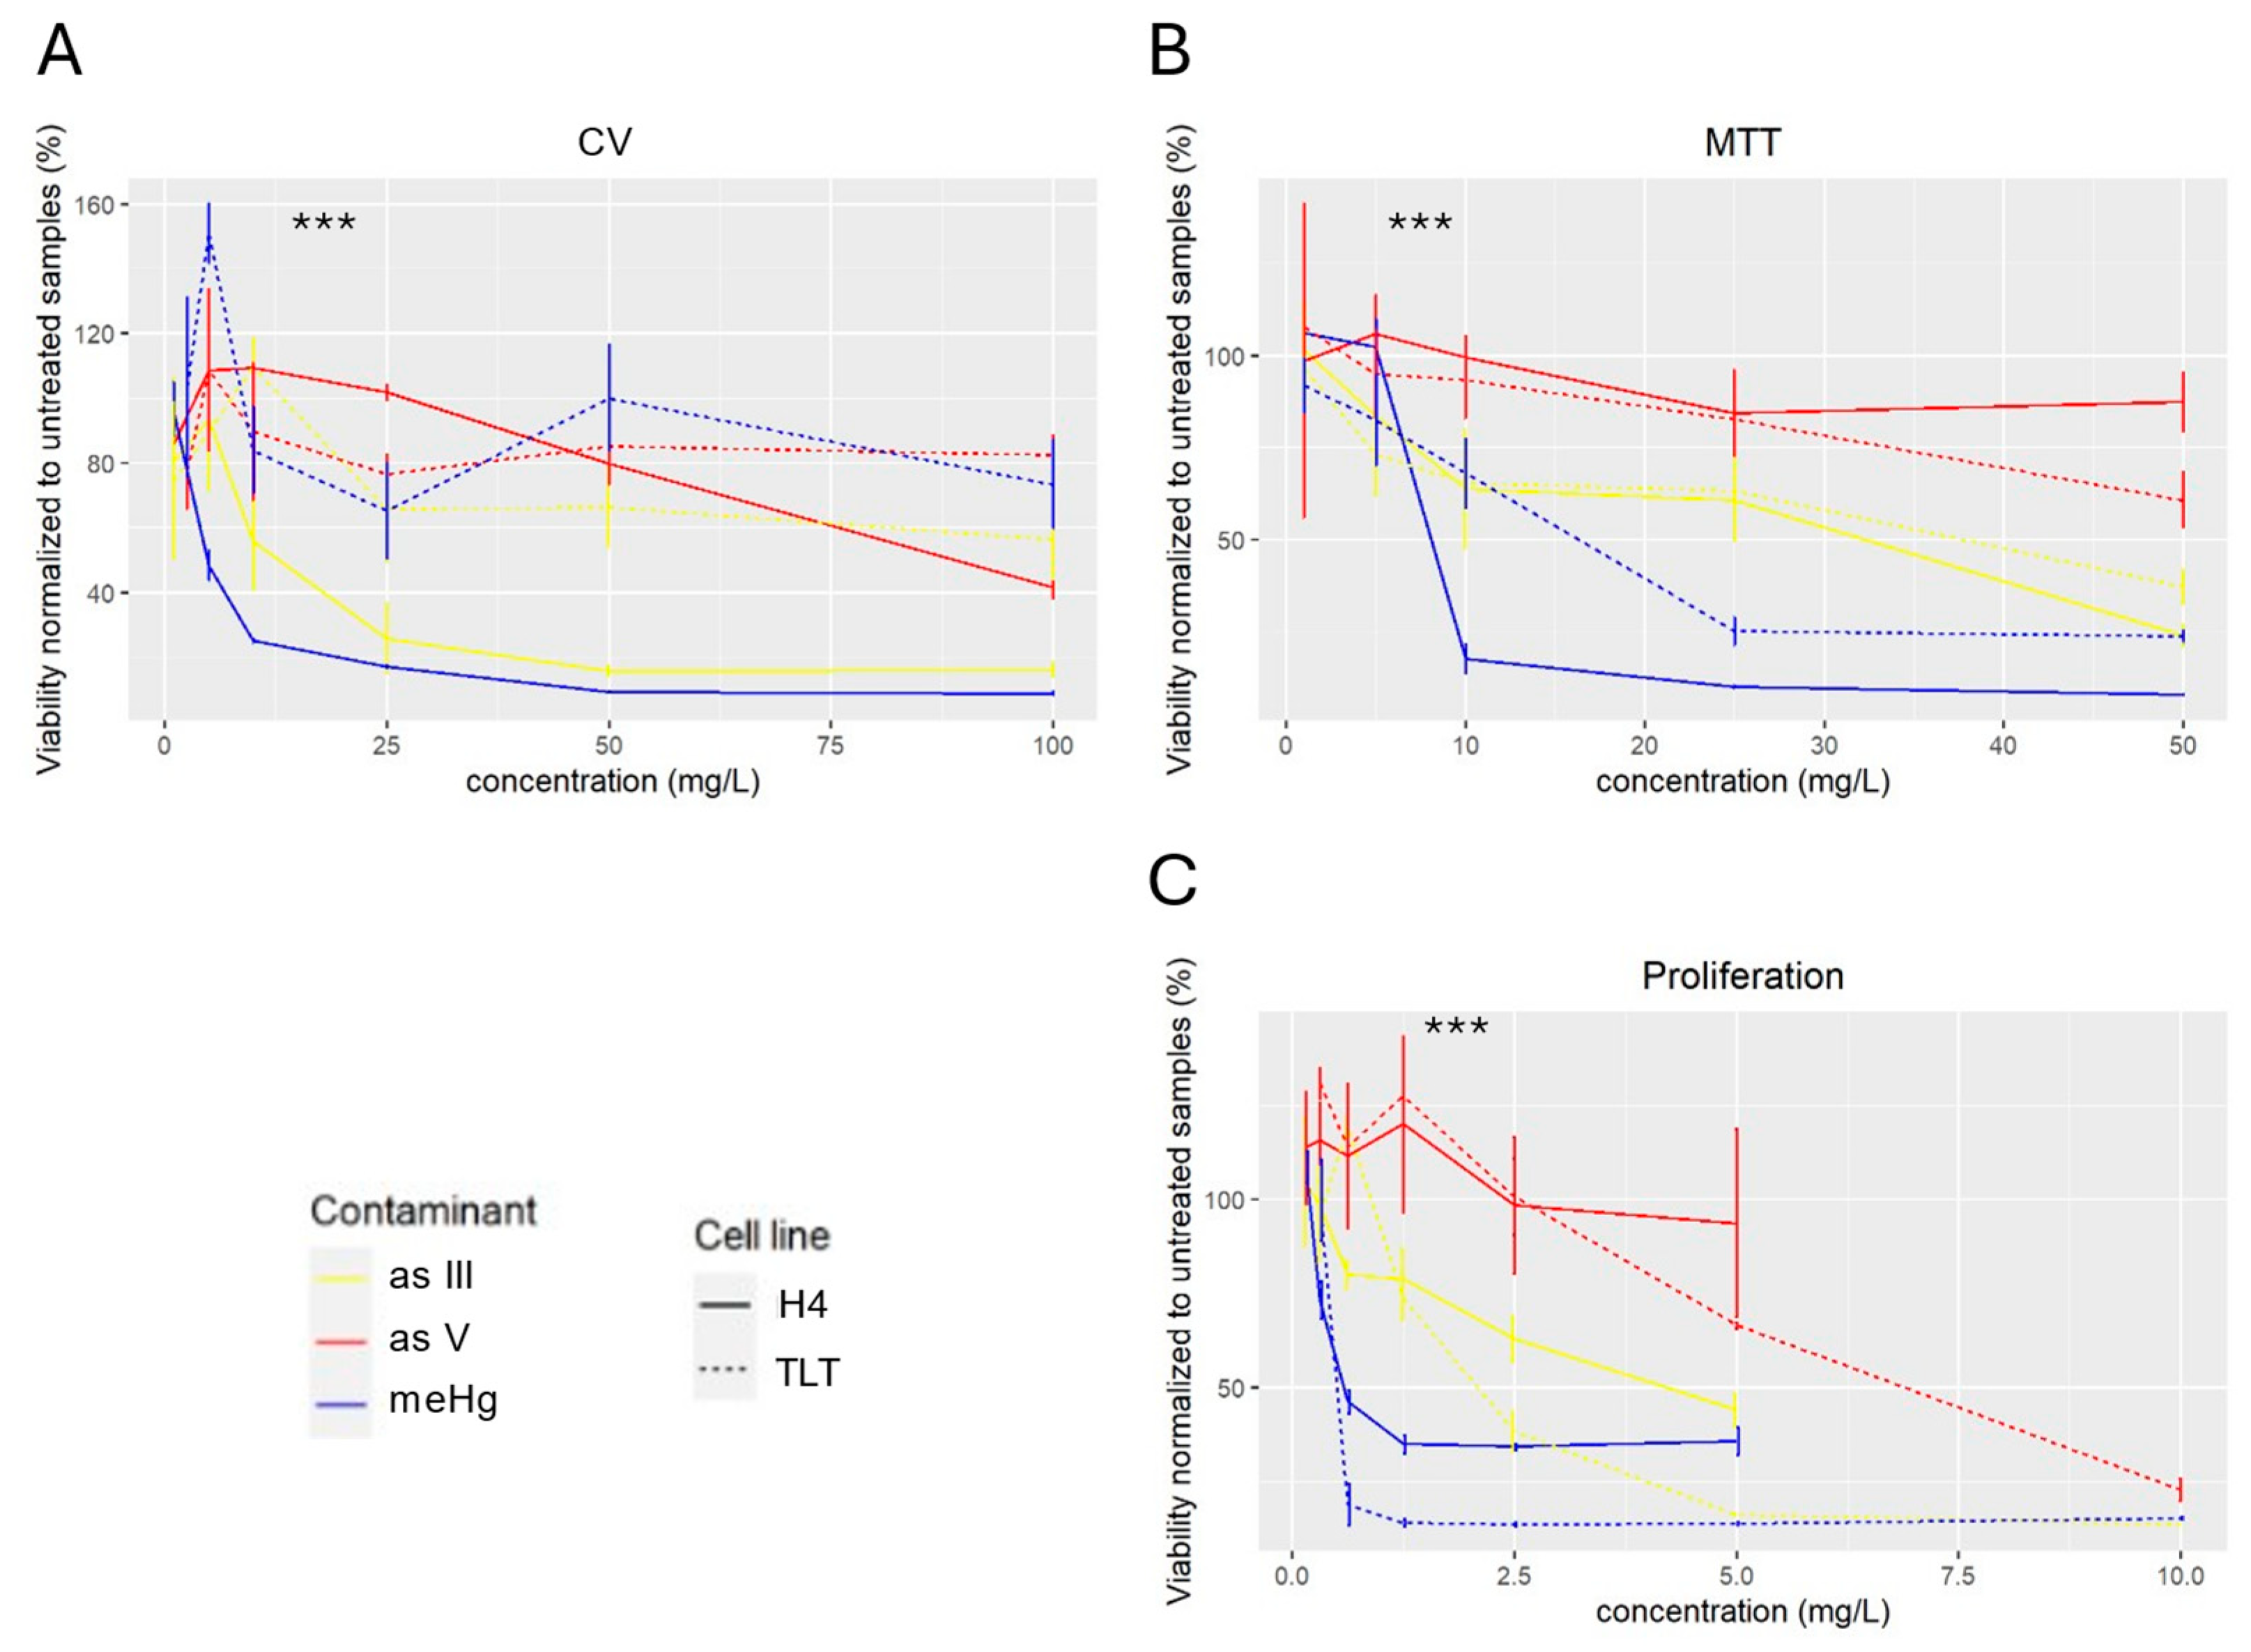
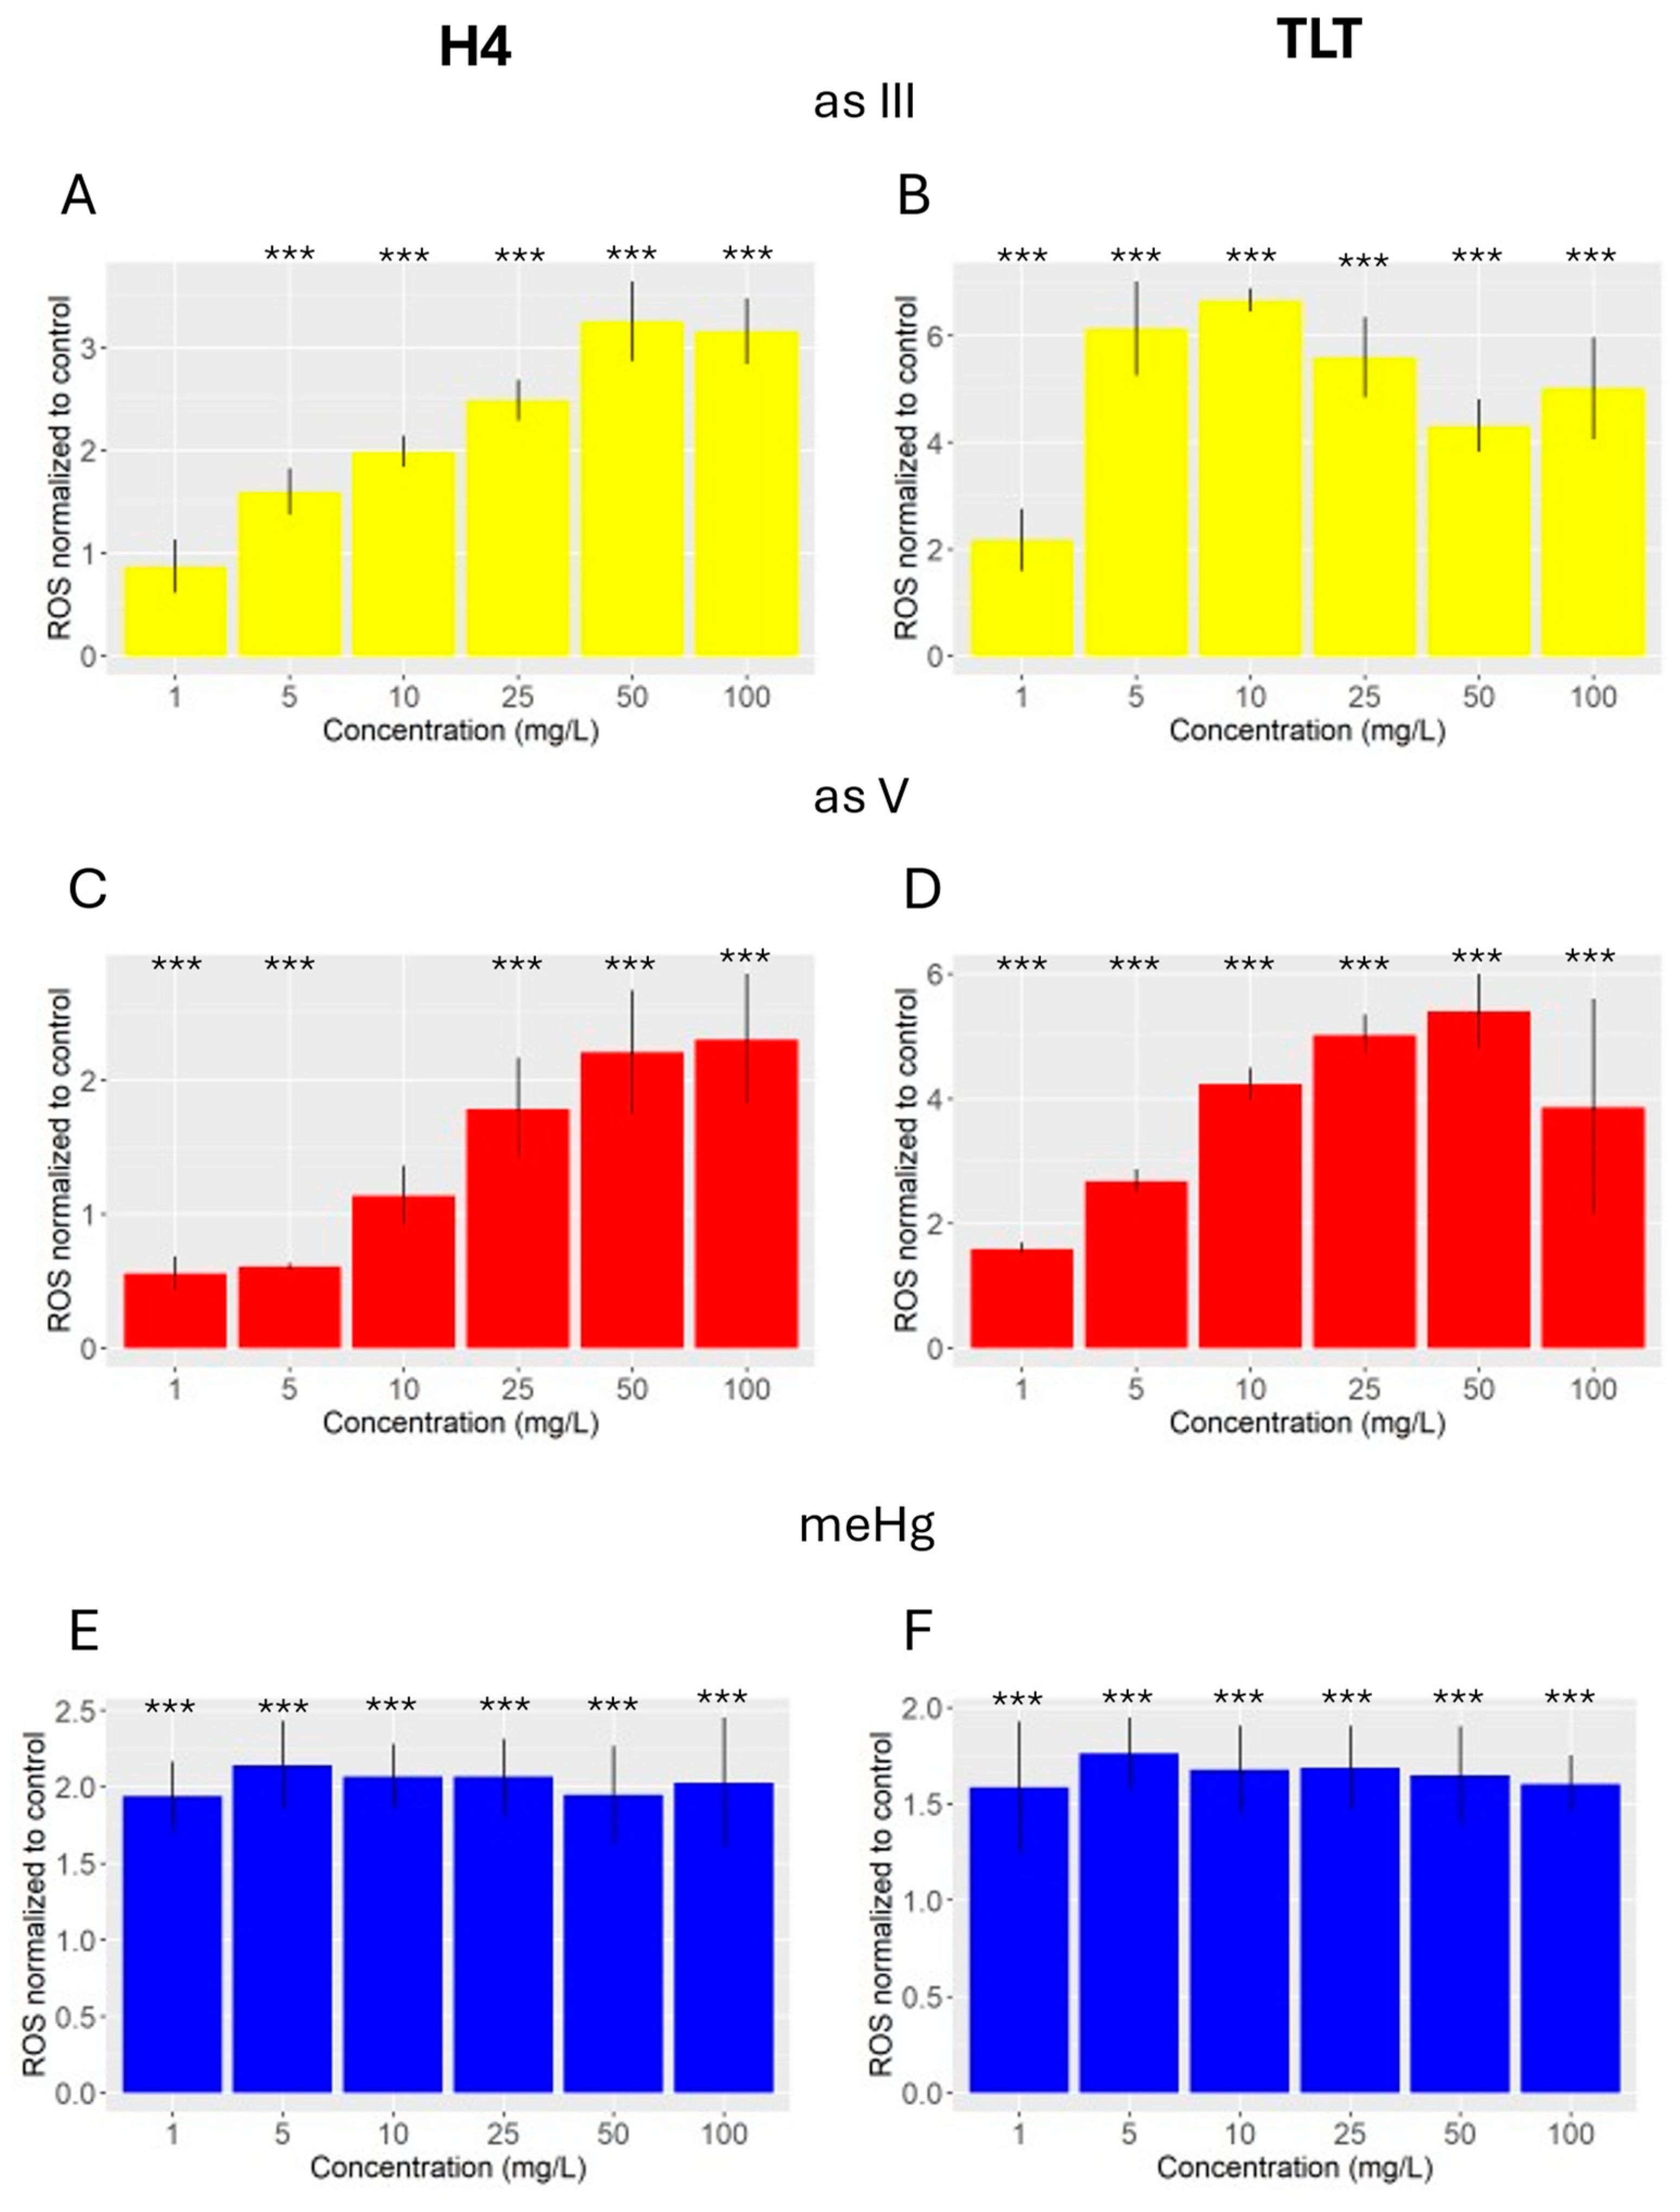
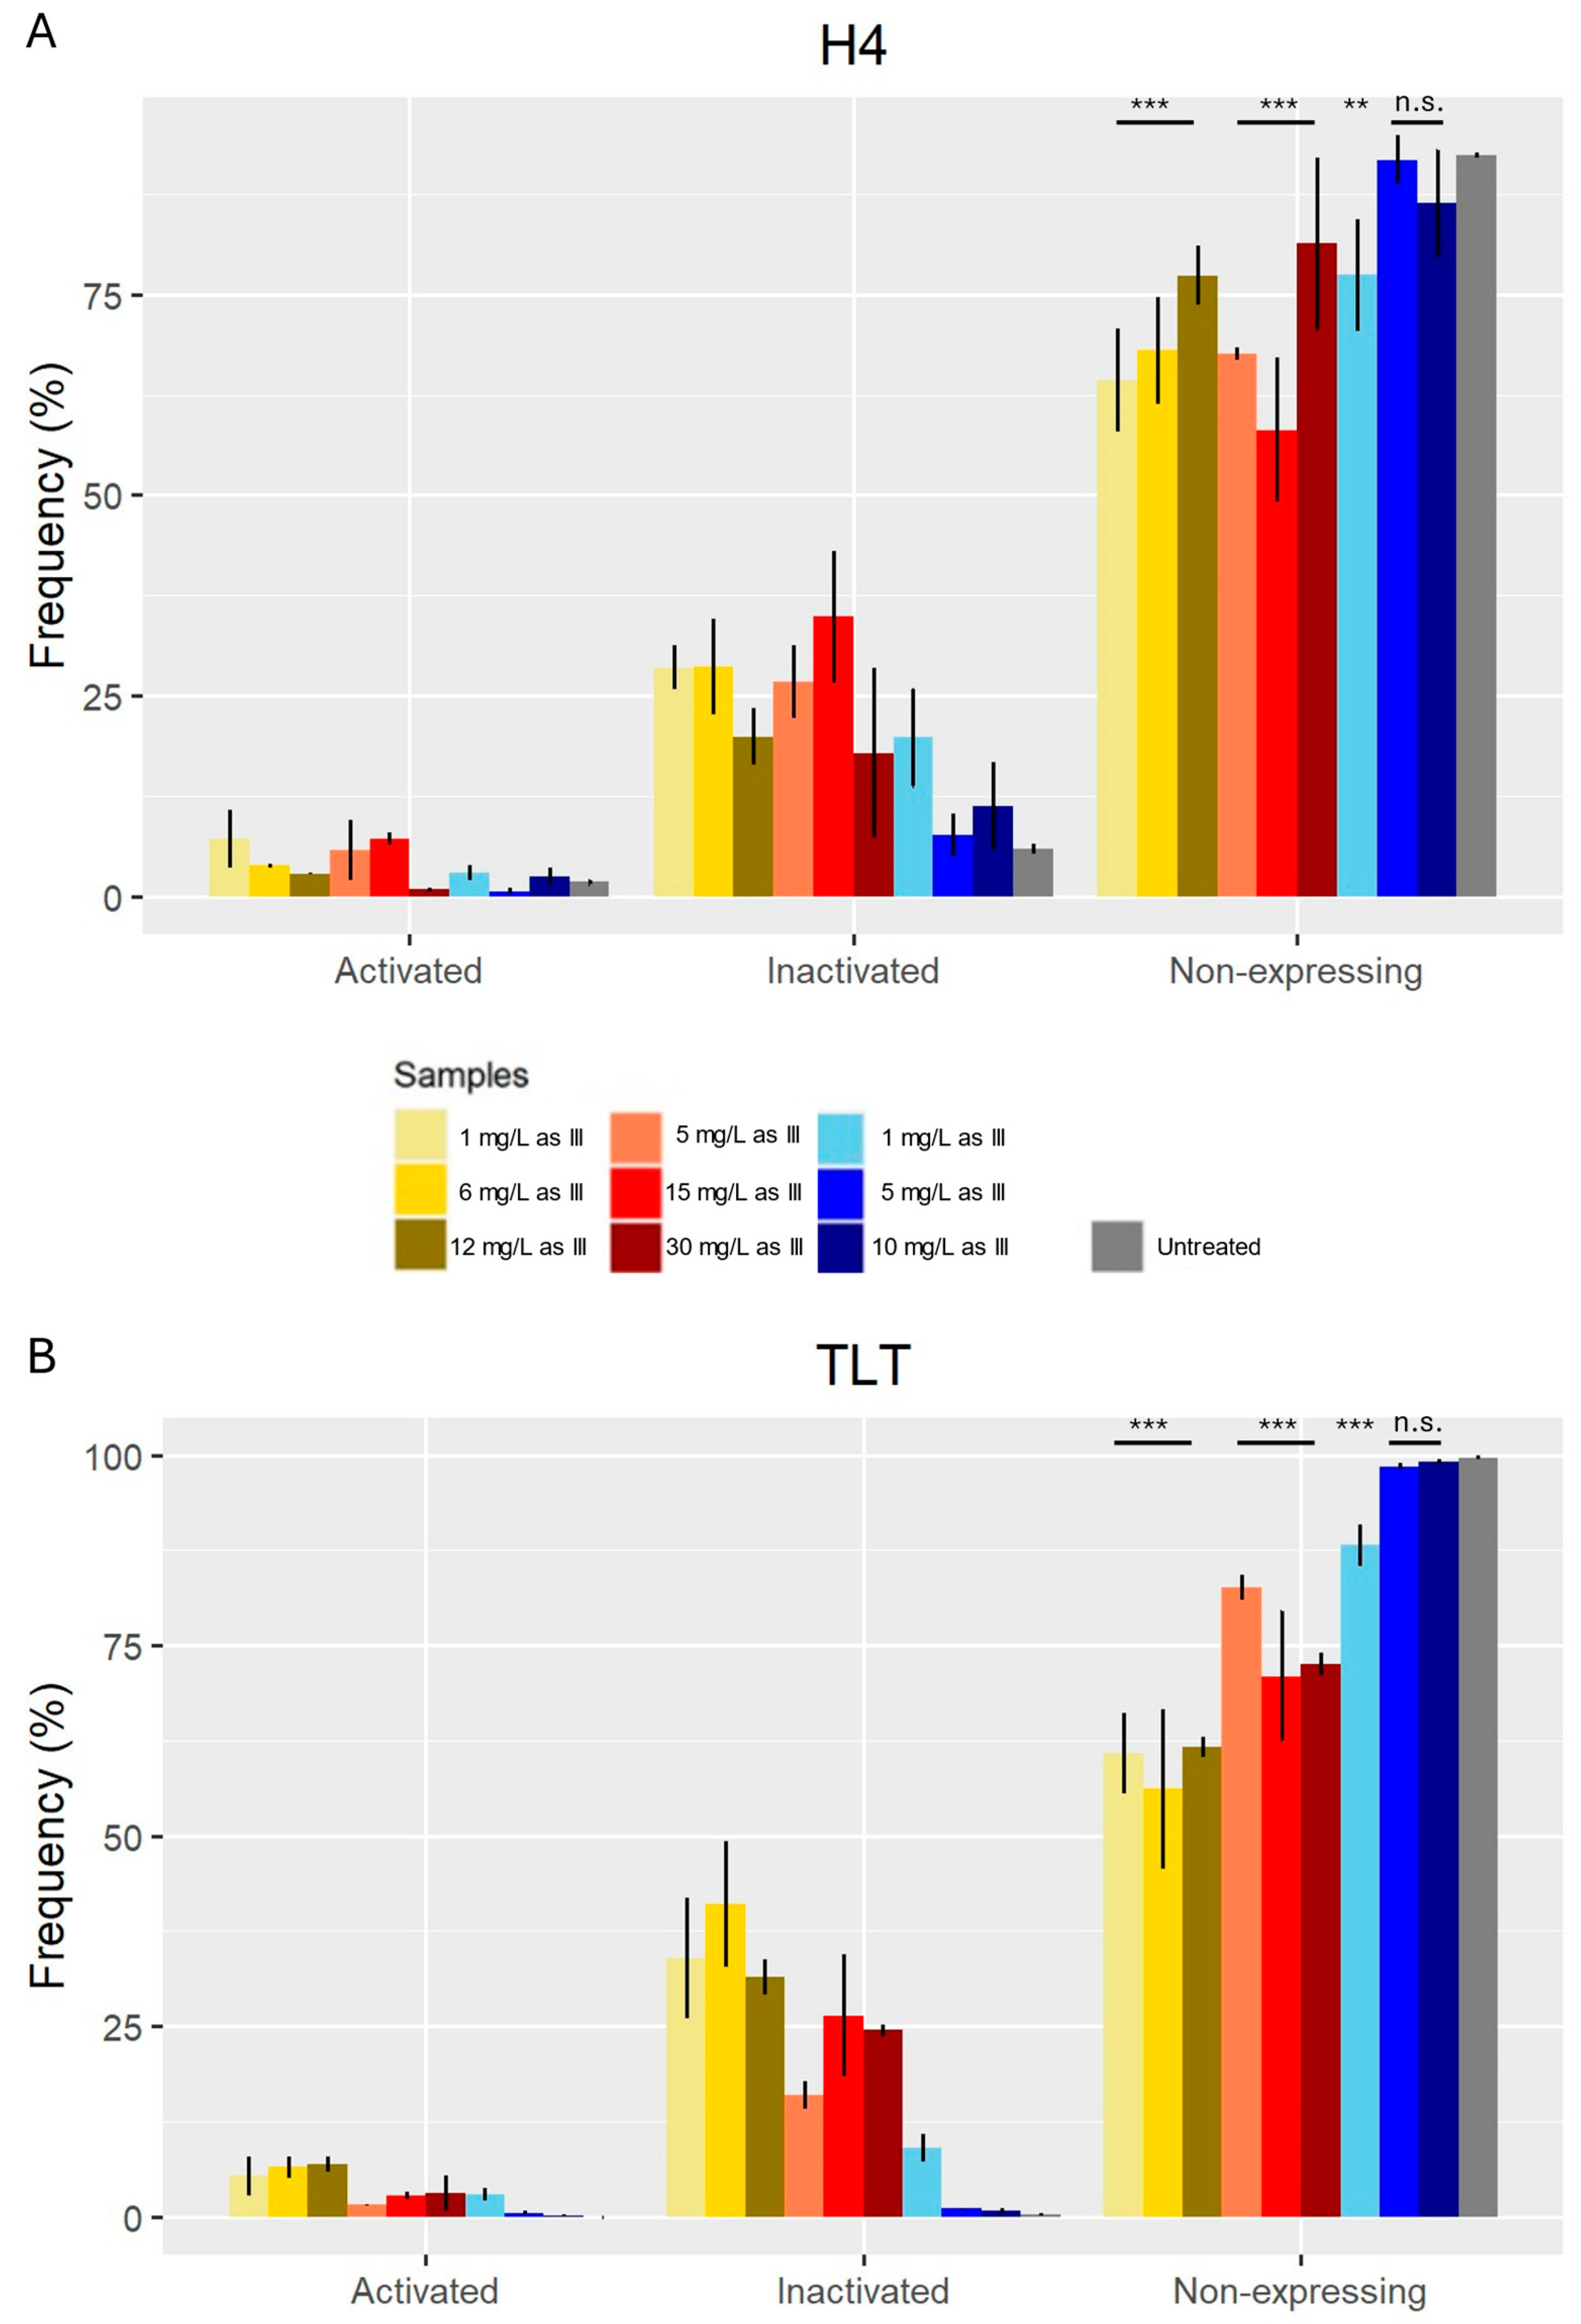
The negative health effects associated with exposure to heavy metals are of global concern, so their toxic mechanisms and potency should be identified to develop effective prevention. In this sense, we analysed the toxicity of arsenic (+3 and +5 valences) and meHg in intestinal epithelial cells (H4) and blood macrophages (TLT). We performed crystal violet, MTT, proliferation, ROS, H2ax, cell cycle arrest, apoptosis and cell shape assays with different concentrations of these elements to determine the potency and mechanism of their toxicity. The potency of the heavy metals differs in both cell types and among each element. In addition, all the selected heavy metals induced ROS formation and histone exposure, but each element had different pathways associated with their toxicity. For example, each element induced cell cycle arrest in different phases of H4 and TLT cells, and suggest that each element induce different cell death pathways in each cell type. Understanding the mechanisms of toxicity may help to implement effective strategies for the prevention or mitigation of the heavy metal toxicity.
Keywords:
1. Introduction
2. Materials and Methods
2.1. Cells
2.2. Cell Culture Medium
2.3. Chemicals
2.4. Method Overview
2.5. Cytotoxic Assays
2.6. Reactive Oxygen Species (ROS)
2.7. H2AX
2.8. Apoptosis/Cell Cycle/Cell Shape
2.9. Statistical Analysis
3. Results
3.1. Cytotoxic Assays
3.2. ROS
3.3. H2ax
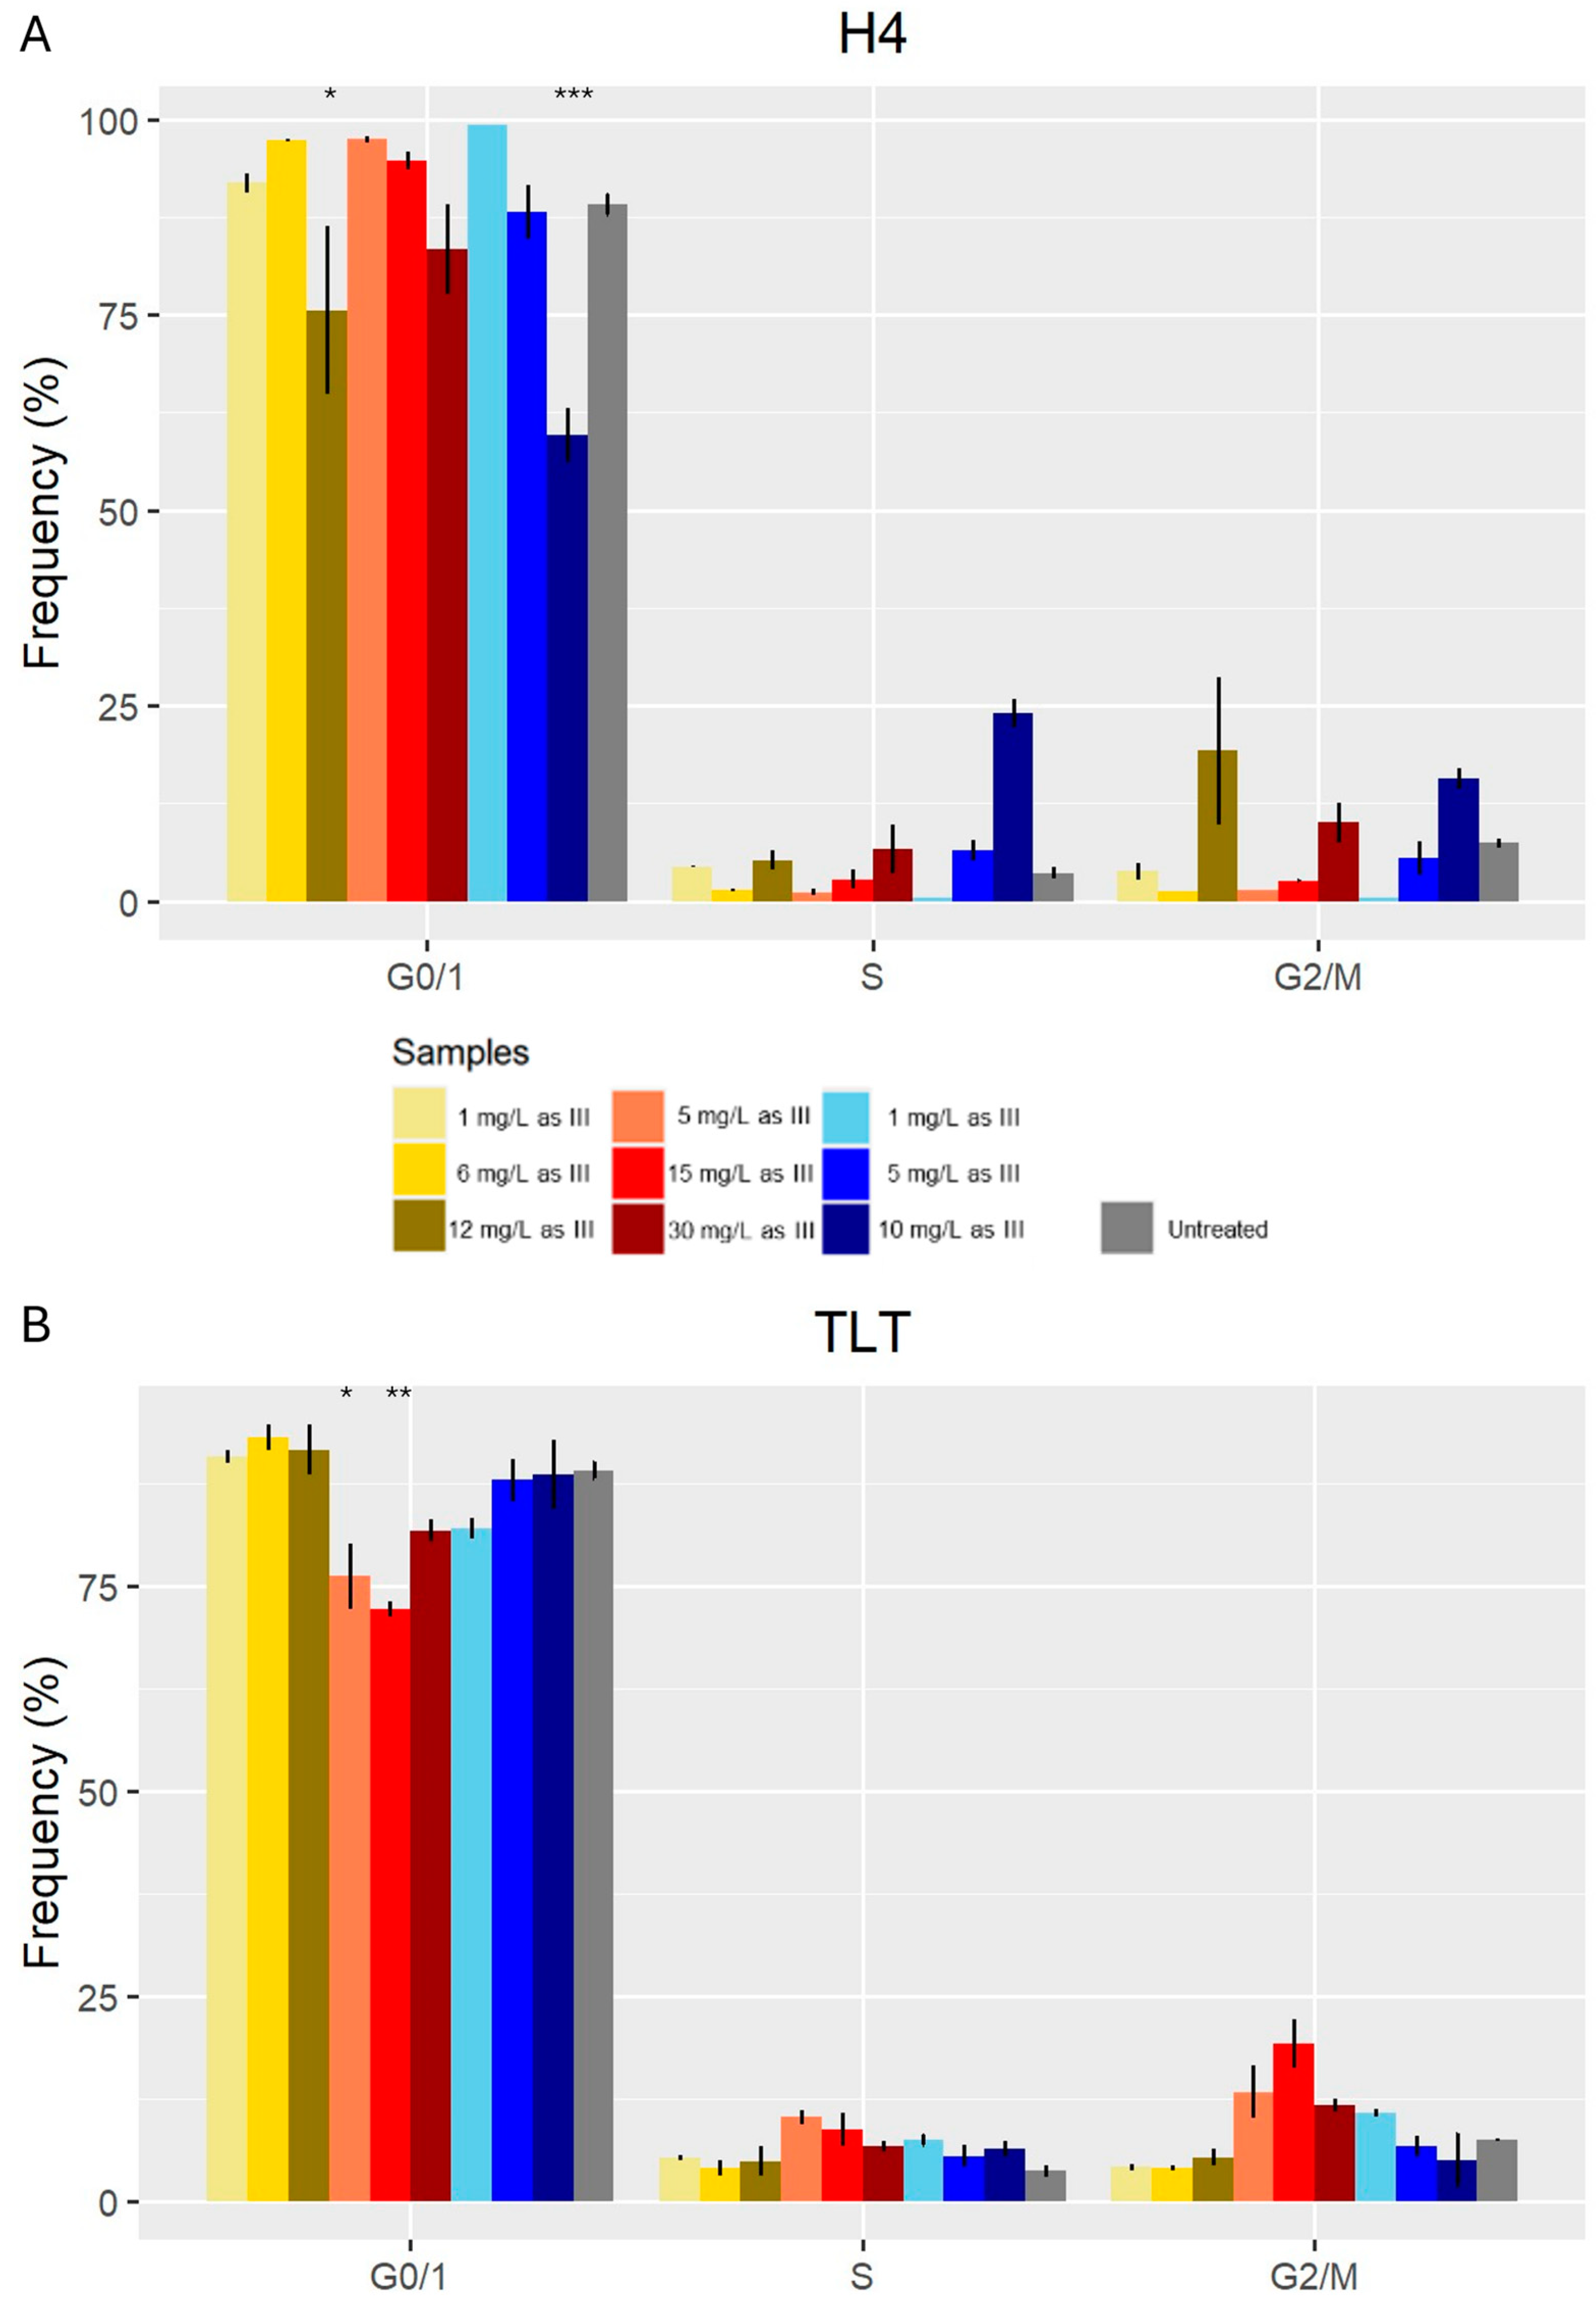
3.4. Cell Cycle
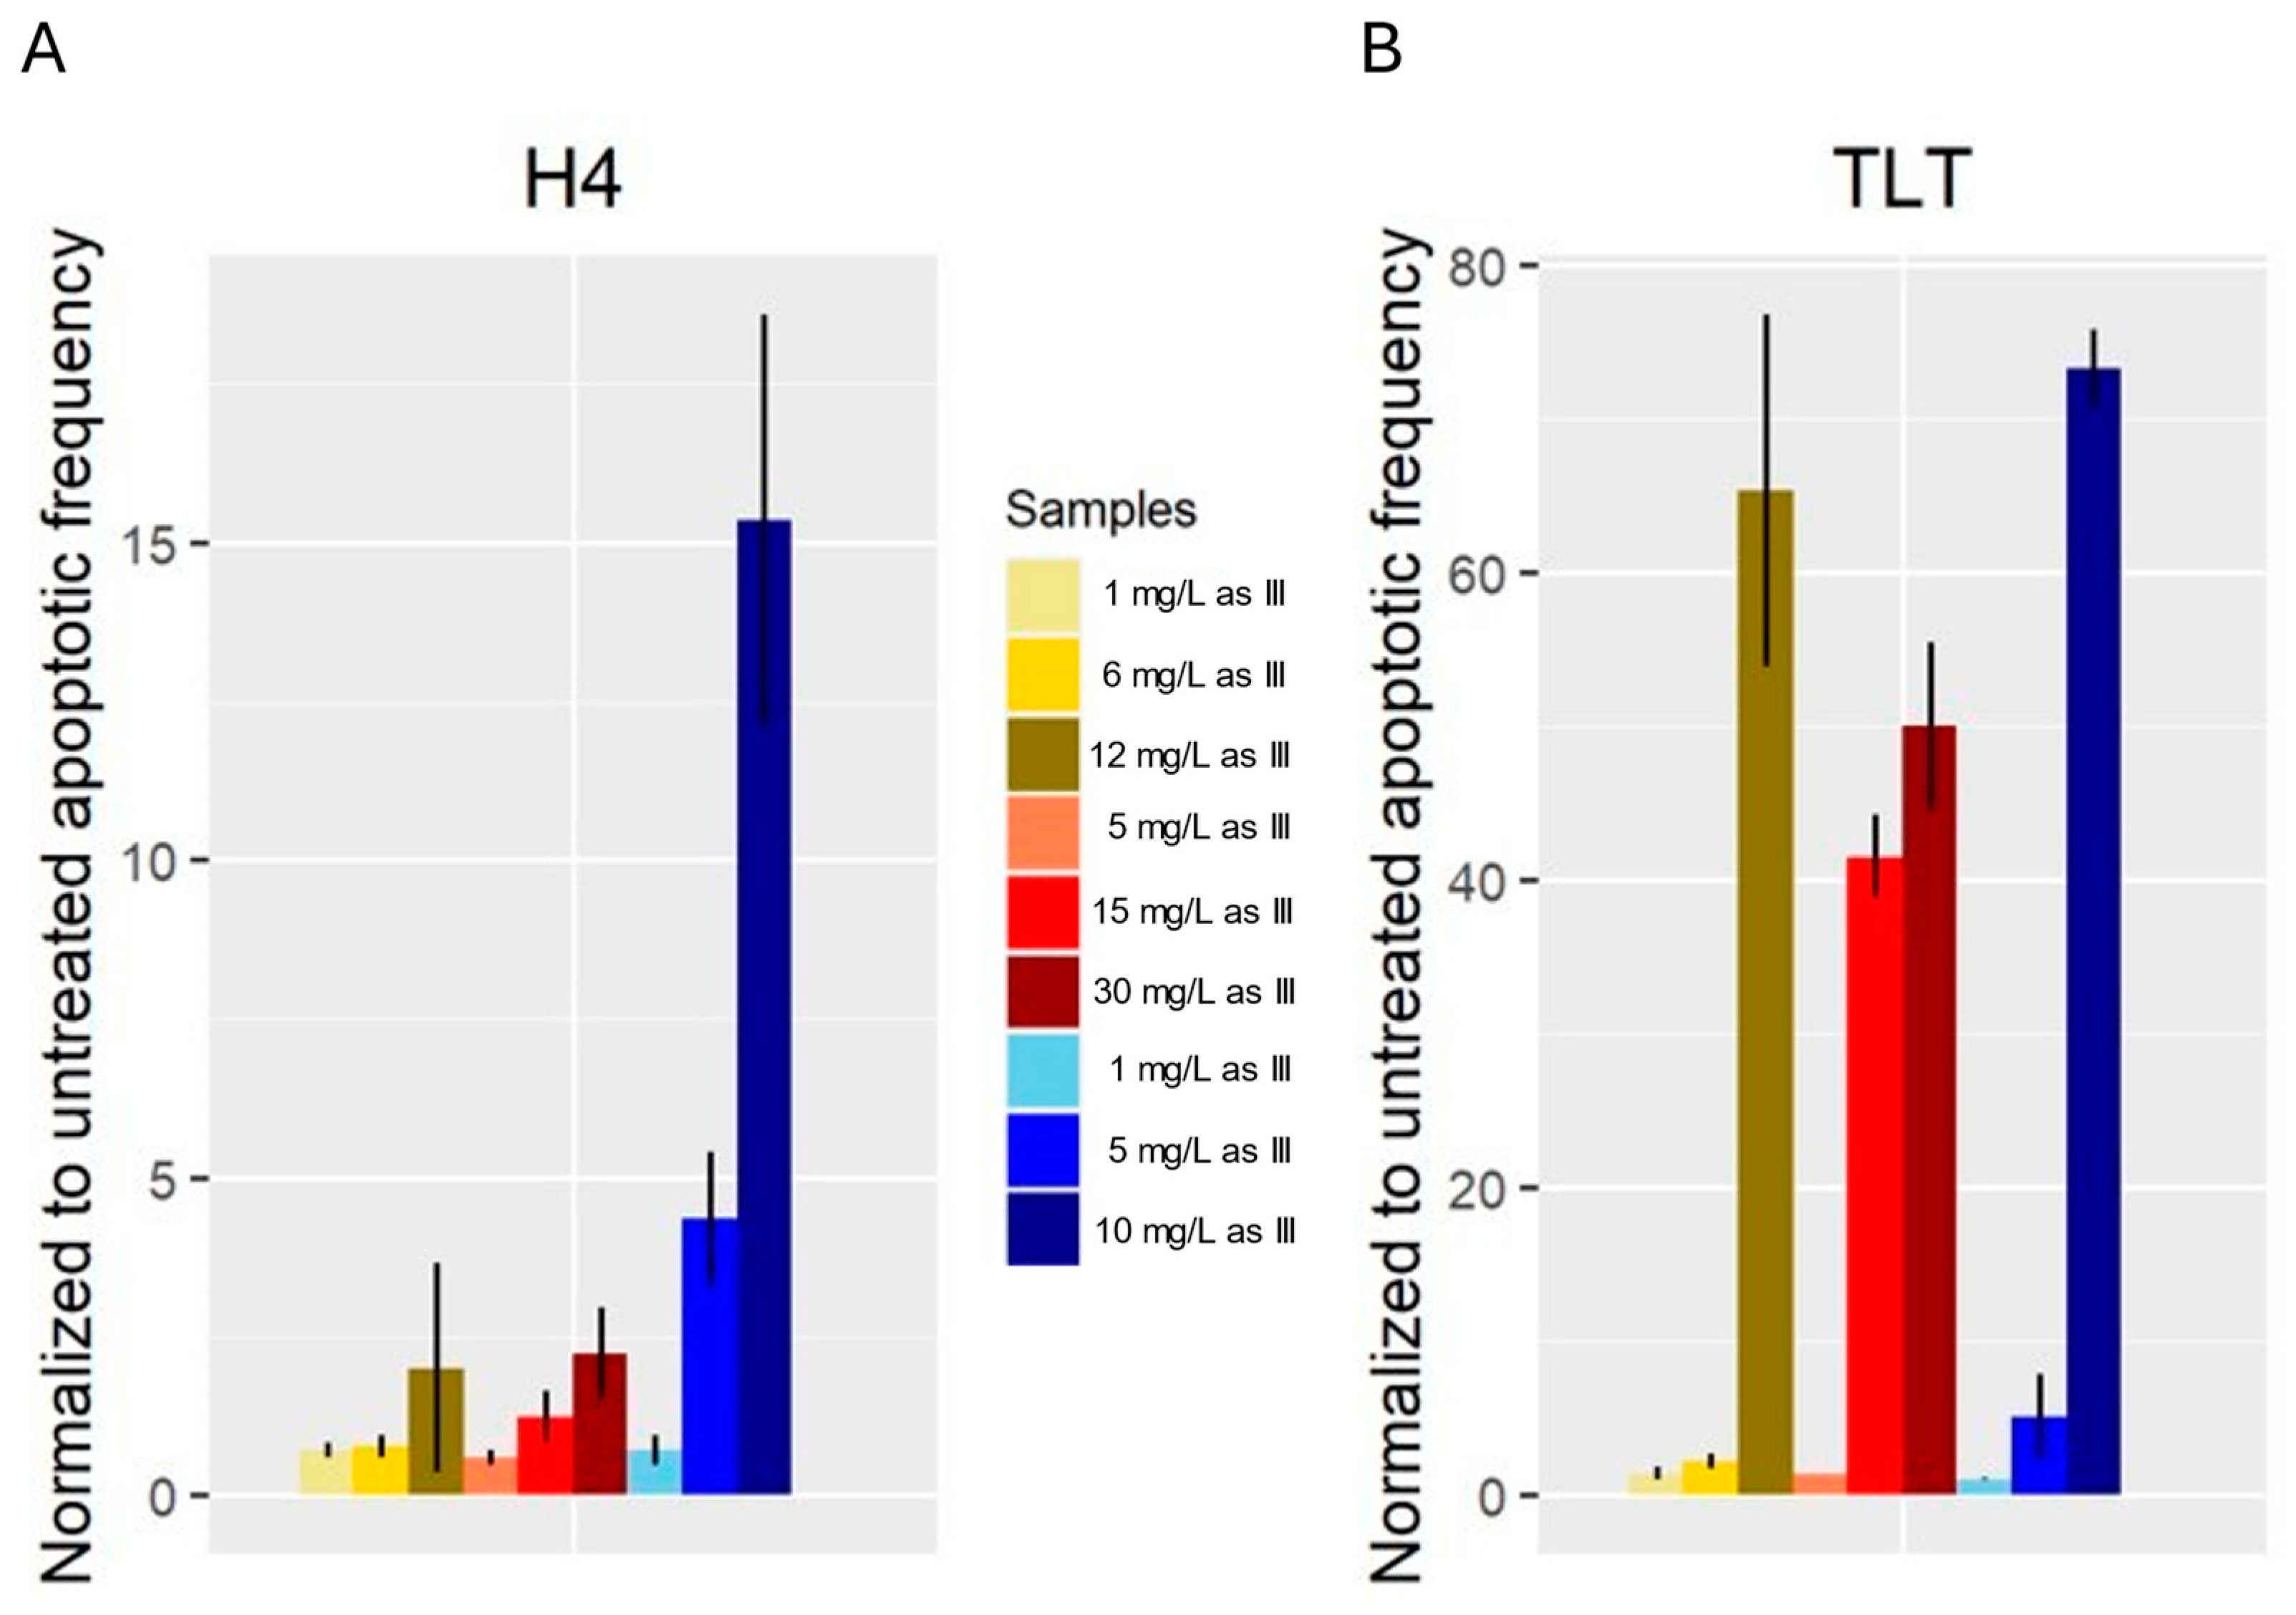
3.4. Apoptosis
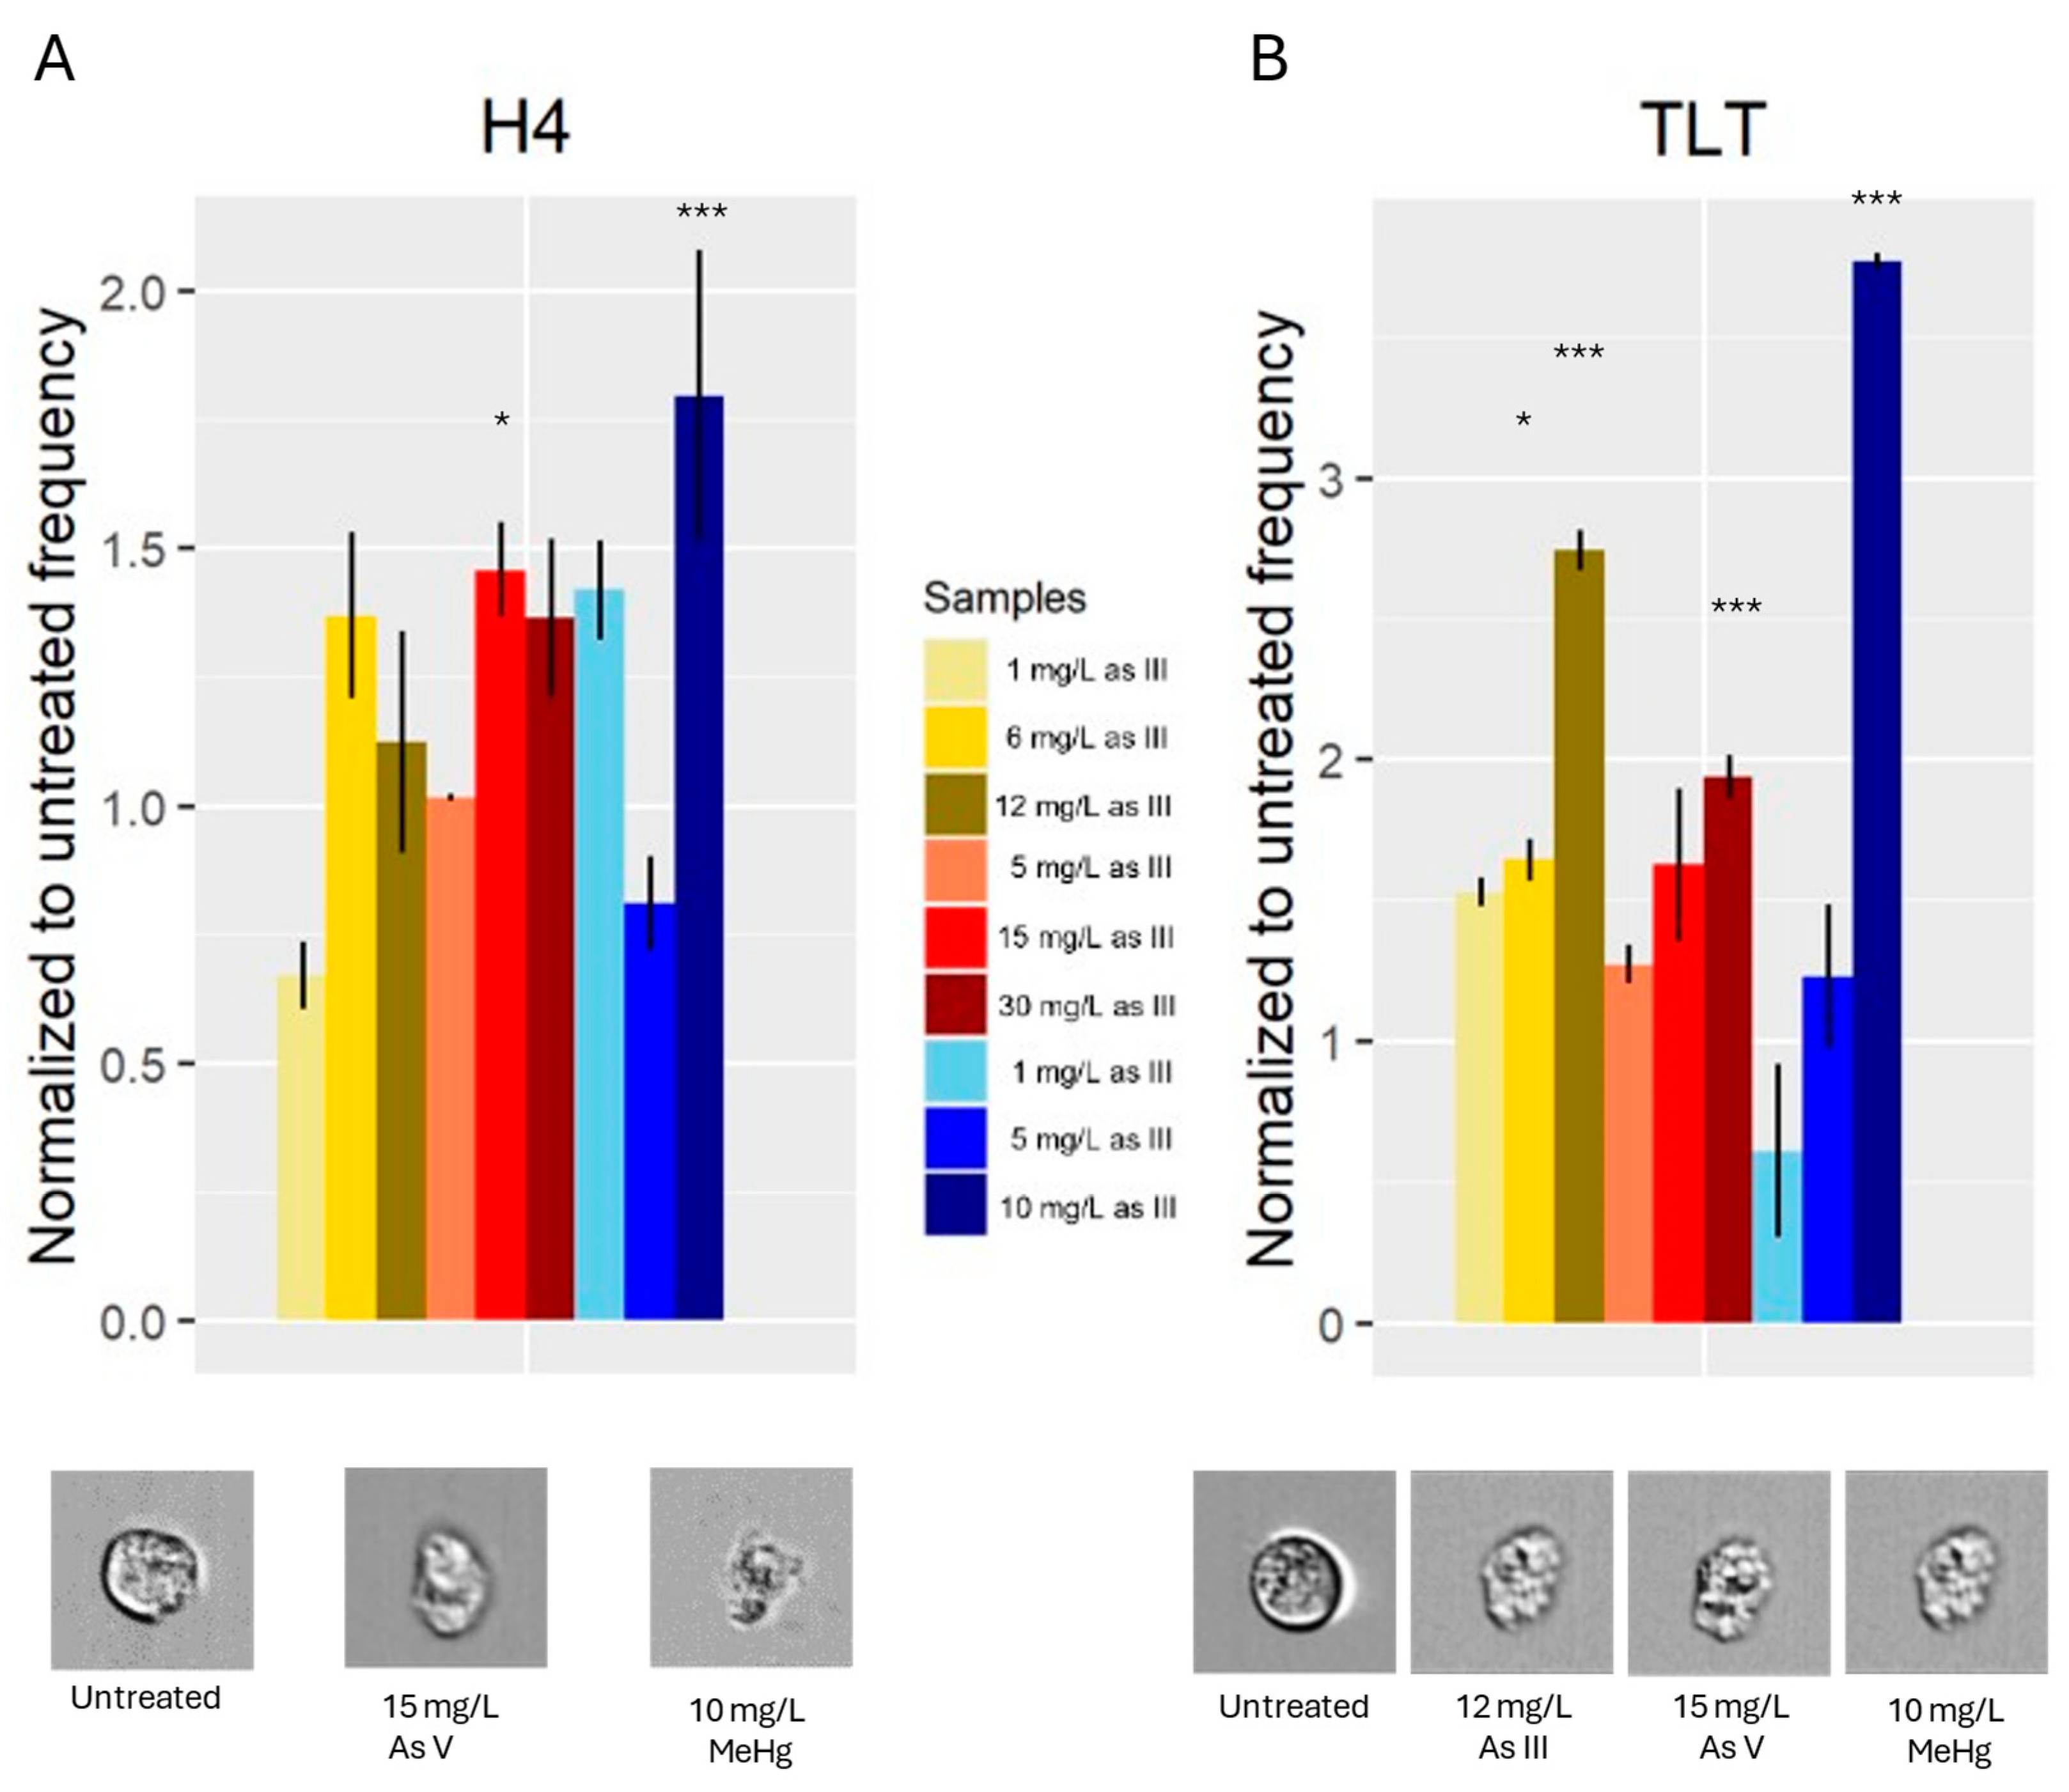
3.4. Cell Shape
4. Discussion
5. Conclusions
Author Contributions
Funding
Conflicts of Interest
References
- Alava, P.; Du Laing, G.; Tack, F.; De Ryck, T.; Van De Wiele, T. Westernized diets lower arsenic gastrointestinal bioaccessibility but increase microbial arsenic speciation changes in the colon. Chemosphere 2015, 119, 757–762. [Google Scholar] [CrossRef]
- Chávez-Capilla, T.; Beshai, M.; Maher, W.; Kelly, T.; Foster, S. Bioaccessibility and degradation of naturally occurring arsenic species from food in the human gastrointestinal tract. Food chemistry 2016, 212, 189–197. [Google Scholar] [CrossRef] [PubMed]
- Brandon, E.F.A.; Janssen, P.J.C.M.; de Wit-Bos, L. Arsenic: bioaccessibility from seaweed and rice, dietary exposure calculations and risk assessment. Food additives & contaminants. Part A, Chemistry, analysis, control, exposure & risk assessment 2014, 31, 1993–2003. [Google Scholar] [CrossRef]
- Tchounwou, P.B.; Yedjou, C.G.; Patlolla, A.K.; Sutton, D.J. Heavy metal toxicity and the environment. Exp Suppl 2012, 101, 133–164. [Google Scholar] [CrossRef]
- Styblo, M.; Del Razo, L.M.; Vega, L.; Germolec, D.R.; LeCluyse, E.L.; Hamilton, G.A.; Reed, W.; Wang, C.; Cullen, W.R.; Thomas, D.J. Comparative toxicity of trivalent and pentavalent inorganic and methylated arsenicals in rat and human cells. Archives of Toxicology 2000, 74, 289–299. [Google Scholar] [CrossRef]
- Tse, W.P.; Cheng, C.H.; Che, C.T.; Lin, Z.X. Arsenic trioxide, arsenic pentoxide, and arsenic iodide inhibit human keratinocyte proliferation through the induction of apoptosis. The Journal of pharmacology and experimental therapeutics 2008, 326, 388–394. [Google Scholar] [CrossRef] [PubMed]
- Fatoki, J.O.; Badmus, J.A. Arsenic as an environmental and human health antagonist: A review of its toxicity and disease initiation. Journal of Hazardous Materials Advances 2022, 5, 100052. [Google Scholar] [CrossRef]
- Li, Y.; Wan, R.; Liu, J.; Liu, W.; Ma, L.; Zhang, H. In silico mechanisms of arsenic trioxide-induced cardiotoxicity. Front. Physiol. 2022, 13. [Google Scholar] [CrossRef]
- Rao, C.V.; Pal, S.; Mohammed, A.; Farooqui, M.; Doescher, M.P.; Asch, A.S.; Yamada, H.Y. Biological effects and epidemiological consequences of arsenic exposure, and reagents that can ameliorate arsenic damage in vivo. Oncotarget 2017, 8, 57605–57621. [Google Scholar] [CrossRef]
- Madorran, E.; Stozer, A.; Bevc, S.; Maver, U. In vitro toxicity model: Upgrades to bridge the gap between preclinical and clinical research. Bosn J Basic Med Sci 2019. [Google Scholar] [CrossRef]
- Calatayud, M.; Devesa, V.; Vélez, D. Differential toxicity and gene expression in Caco-2 cells exposed to arsenic species. Toxicology letters 2013, 218, 70–80. [Google Scholar] [CrossRef] [PubMed]
- Karri, V.; Kumar, V.; Ramos, D.; Oliveira, E.; Schuhmacher, M. Comparative In Vitro Toxicity Evaluation of Heavy Metals (Lead, Cadmium, Arsenic, and Methylmercury) on HT-22 Hippocampal Cell Line. Biol Trace Elem Res 2018, 184, 226–239. [Google Scholar] [CrossRef]
- Crespo-López, M.E.; Lima de Sá, A.; Herculano, A.M.; Rodríguez Burbano, R.; Martins do Nascimento, J.L. Methylmercury genotoxicity: a novel effect in human cell lines of the central nervous system. Environ Int 2007, 33, 141–146. [Google Scholar] [CrossRef] [PubMed]
- Sanderson, I.R.; Ezzell, R.M.; Kedinger, M.; Erlanger, M.; Xu, Z.X.; Pringault, E.; Leon-Robine, S.; Louvard, D.; Walker, W.A. Human fetal enterocytes in vitro: modulation of the phenotype by extracellular matrix. Proceedings of the National Academy of Sciences of the United States of America 1996, 93, 7717–7722. [Google Scholar] [CrossRef] [PubMed]
- Madorran, E.; Kocbek Šaherl, L.; Rakuša, M.; Takač, I.; Munda, M. Finding a Direct Method for a Dynamic Process: The DD (Direct and Dynamic) Cell-Tox Method. International journal of molecular sciences 2024, 25, 5133. [Google Scholar] [CrossRef]
- van Meerloo, J.; Kaspers, G.J.; Cloos, J. Cell sensitivity assays: the MTT assay. Methods in molecular biology (Clifton, N.J.) 2011, 731, 237–245. [Google Scholar] [CrossRef]
- Peters, T.; Lindenmaier, H.; Haefeli, W.E.; Weiss, J. Interaction of the mitotic kinesin Eg5 inhibitor monastrol with P-glycoprotein. Naunyn-Schmiedeberg's Archives of Pharmacology 2006, 372, 291–299. [Google Scholar] [CrossRef] [PubMed]
- Kim, H.; Xue, X. Detection of Total Reactive Oxygen Species in Adherent Cells by 2',7'-Dichlorodihydrofluorescein Diacetate Staining. Journal of visualized experiments : JoVE 2020. [Google Scholar] [CrossRef]
- Wang, P.; Henning, S.M.; Heber, D. Limitations of MTT and MTS-based assays for measurement of antiproliferative activity of green tea polyphenols. PLoS One 2010, 5, e10202. [Google Scholar] [CrossRef] [PubMed]
- Valverde, M.; Sánchez-Brito, A. Sustained Activation of TNFα-Induced DNA Damage Response in Newly Differentiated Adipocytes. International journal of molecular sciences 2021, 22. [Google Scholar] [CrossRef] [PubMed]
- Zuba-Surma, E.K.; Kucia, M.; Abdel-Latif, A.; Dawn, B.; Hall, B.; Singh, R.; Lillard, J.W.; Ratajczak, M.Z. Morphological characterization of very small embryonic-like stem cells (VSELs) by ImageStream system analysis. Journal of Cellular and Molecular Medicine 2007, 12, 292–303. [Google Scholar] [CrossRef] [PubMed]
- Rieger, A.M.; Nelson, K.L.; Konowalchuk, J.D.; Barreda, D.R. Modified annexin V/propidium iodide apoptosis assay for accurate assessment of cell death. Journal of visualized experiments : JoVE 2011. [Google Scholar] [CrossRef]
- Rainieri, S.; Conlledo, N.; Langerholc, T.; Madorran, E.; Sala, M.; Barranco, A. Toxic effects of perfluorinated compounds at human cellular level and on a model vertebrate. Food and Chemical Toxicology 2017. [Google Scholar] [CrossRef] [PubMed]
- Zuba-Surma, E.K.; Ratajczak, M.Z. Chapter 8 - Analytical Capabilities of the ImageStream Cytometer. In Methods in Cell Biology; Darzynkiewicz, Z., Holden, E., Orfao, A., Telford, W., Wlodkowic, D., Eds.; Academic Press, 2011; Vol. 102, pp. 207–230. [Google Scholar]
- Peiser, L.; Gordon, S. The function of scavenger receptorsexpressed by macrophages and their rolein the regulation of inflammation. Microbes and Infection 2001, 3, 149–159. [Google Scholar] [CrossRef]
- Shi, Q.; Hu, B.; Yang, C.; Zhao, L.; Wu, J.; Qi, N. ATF3 Promotes Arsenic-Induced Apoptosis and Oppositely Regulates DR5 and Bcl-xL Expression in Human Bronchial Epithelial Cells. International journal of molecular sciences 2021, 22. [Google Scholar] [CrossRef]
- Xie, H.; Huang, S.; Martin, S.; Wise, J.P., Sr. Arsenic is cytotoxic and genotoxic to primary human lung cells. Mutat Res Genet Toxicol Environ Mutagen 2014, 760, 33–41. [Google Scholar] [CrossRef]
- Abdalla, F.H.; Bellé, L.P.; De Bona, K.S.; Bitencourt, P.E.; Pigatto, A.S.; Moretto, M.B. Allium sativum L. extract prevents methyl mercury-induced cytotoxicity in peripheral blood leukocytes (LS). Food Chem Toxicol 2010, 48, 417–421. [Google Scholar] [CrossRef]
- Kuivenhoven, M.; Mason, K. Arsenic Toxicity. StatPearls. Treasure Island (FL) ineligible companies. Disclosure: Kelly Mason declares no relevant financial relationships with ineligible companies. StatPearls Publishing.
- Copyright © 2024, StatPearls Publishing LLC.; 2024.
- Arike, L.; Seiman, A.; van der Post, S.; Rodriguez Piñeiro, A.M.; Ermund, A.; Schütte, A.; Bäckhed, F.; Johansson, M.E.V.; Hansson, G.C. Protein Turnover in Epithelial Cells and Mucus along the Gastrointestinal Tract Is Coordinated by the Spatial Location and Microbiota. Cell Rep 2020, 30, 1077–1087.e1073. [Google Scholar] [CrossRef]
- Manes, N.P.; Calzola, J.M.; Kaplan, P.R.; Fraser, I.D.C.; Germain, R.N.; Meier-Schellersheim, M.; Nita-Lazar, A. Absolute protein quantitation of the mouse macrophage Toll-like receptor and chemotaxis pathways. Scientific data 2022, 9, 491. [Google Scholar] [CrossRef] [PubMed]
- Novo, J.P.; Martins, B.; Raposo, R.S.; Pereira, F.C.; Oriá, R.B.; Malva, J.O.; Fontes-Ribeiro, C. Cellular and Molecular Mechanisms Mediating Methylmercury Neurotoxicity and Neuroinflammation. International journal of molecular sciences 2021, 22. [Google Scholar] [CrossRef] [PubMed]
- Chandel, N.S. Metabolism of Proliferating Cells. Cold Spring Harb Perspect Biol 2021, 13. [Google Scholar] [CrossRef] [PubMed]
- Madorran, E.; Kocbek Šaherl, L.; Rakuša, M.; Munda, M. In Vitro Human Liver Model for Toxicity Assessment with Clinical and Preclinical Instrumentation. Preprints 2024. [Google Scholar] [CrossRef] [PubMed]
- Reyes-Becerril, M.; Angulo, C.; Sanchez, V.; Cuesta, A.; Cruz, A. Methylmercury, cadmium and arsenic(III)-induced toxicity, oxidative stress and apoptosis in Pacific red snapper leukocytes. Aquatic Toxicology 2019, 213, 105223. [Google Scholar] [CrossRef] [PubMed]
- Sounderajan, S.; Udas, A.C.; Venkataramani, B. Characterization of arsenic (V) and arsenic (III) in water samples using ammonium molybdate and estimation by graphite furnace atomic absorption spectroscopy. Journal of Hazardous Materials 2007, 149, 238–242. [Google Scholar] [CrossRef]
- Hu, Y.; Li, J.; Lou, B.; Wu, R.; Wang, G.; Lu, C.; Wang, H.; Pi, J.; Xu, Y. The Role of Reactive Oxygen Species in Arsenic Toxicity. Biomolecules 2020, 10. [Google Scholar] [CrossRef] [PubMed]
- Penke, Y.K.; Yadav, A.K.; Malik, I.; Tyagi, A.; Ramkumar, J.; Kar, K.K. Insights of arsenic (III/V) adsorption and electrosorption mechanism onto multi synergistic (redox-photoelectrochemical-ROS) aluminum substituted copper ferrite impregnated rGO. Chemosphere 2021, 267, 129246. [Google Scholar] [CrossRef]
- Zheng, M.; Liu, Y.; Zhang, G.; Yang, Z.; Xu, W.; Chen, Q. The Applications and Mechanisms of Superoxide Dismutase in Medicine, Food, and Cosmetics. Antioxidants 2023, 12, 1675. [Google Scholar] [CrossRef] [PubMed]
- Podhorecka, M.; Skladanowski, A.; Bozko, P. H2AX Phosphorylation: Its Role in DNA Damage Response and Cancer Therapy. Journal of nucleic acids 2010, 2010. [Google Scholar] [CrossRef] [PubMed]
- Medda, N.; De, S.K.; Maiti, S. Different mechanisms of arsenic related signaling in cellular proliferation, apoptosis and neo-plastic transformation. Ecotoxicology and Environmental Safety 2021, 208, 111752. [Google Scholar] [CrossRef] [PubMed]
- Li, Y.; Qu, X.; Qu, J.; Zhang, Y.; Liu, J.; Teng, Y.; Hu, X.; Hou, K.; Liu, Y. Arsenic trioxide induces apoptosis and G2/M phase arrest by inducing Cbl to inhibit PI3K/Akt signaling and thereby regulate p53 activation. Cancer letters 2009, 284, 208–215. [Google Scholar] [CrossRef]
- Zhang, X.; Jia, S.; Yang, S.; Yang, Y.; Yang, T.; Yang, Y. Arsenic trioxide induces G2/M arrest in hepatocellular carcinoma cells by increasing the tumor suppressor PTEN expression. Journal of cellular biochemistry 2012, 113, 3528–3535. [Google Scholar] [CrossRef] [PubMed]
- Liao, Y.; Peng, S.; He, L.; Wang, Y.; Li, Y.; Ma, D.; Wang, Y.; Sun, L.; Zheng, H.; Yang, W. , et al. Methylmercury cytotoxicity and possible mechanisms in human trophoblastic HTR-8/SVneo cells. Ecotoxicology and Environmental Safety 2021, 207, 111520. [Google Scholar] [CrossRef]
- Mendoza, M.A.C.; Ponce, R.A.; Ou, Y.C.; Faustman, E.M. p21WAF1/CIP1 Inhibits Cell Cycle Progression but Not G2/M-Phase Transition Following Methylmercury Exposure. Toxicology and Applied Pharmacology 2002, 178, 117–125. [Google Scholar] [CrossRef]
- Lemarie, A.; Morzadec, C.; Mérino, D.; Micheau, O.; Fardel, O.; Vernhet, L. Arsenic trioxide induces apoptosis of human monocytes during macrophagic differentiation through nuclear factor-kappaB-related survival pathway down-regulation. The Journal of pharmacology and experimental therapeutics 2006, 316, 304–314. [Google Scholar] [CrossRef]
- Stevens, J.J.; Graham, B.; Dugo, E.; Berhaneselassie-Sumner, B.; Ndebele, K.; Tchounwou, P.B. Arsenic Trioxide Induces Apoptosis via Specific Signaling Pathways in HT-29 Colon Cancer Cells. Journal of cancer science & therapy 2017, 9, 298–306. [Google Scholar]
- Kuo, T.C. Methylmercury induces alveolar macrophages apoptosis. International journal of toxicology 2008, 27, 257–263. [Google Scholar] [CrossRef]
- Chiocchetti, G.M.; Vélez, D.; Devesa, V. Effect of chronic exposure to inorganic arsenic on intestinal cells. J Appl Toxicol 2019, 39, 899–907. [Google Scholar] [CrossRef] [PubMed]
- Kellett, M.P.; Jatko, J.T.; Darling, C.L.; Ventrello, S.W.; Bain, L.J. Arsenic exposure impairs intestinal stromal cells. Toxicology Letters 2022, 361, 54–63. [Google Scholar] [CrossRef]
- Chiocchetti, G.M.; Vélez, D.; Devesa, V. Inorganic arsenic causes intestinal barrier disruption. Metallomics : integrated biometal science 2019, 11, 1411–1418. [Google Scholar] [CrossRef] [PubMed]
- Caito, S.; Aschner, M. Neurotoxicity of metals. Handb Clin Neurol 2015, 131, 169–189. [Google Scholar] [CrossRef] [PubMed]
Disclaimer/Publisher’s Note: The statements, opinions and data contained in all publications are solely those of the individual author(s) and contributor(s) and not of MDPI and/or the editor(s). MDPI and/or the editor(s) disclaim responsibility for any injury to people or property resulting from any ideas, methods, instructions or products referred to in the content. |
© 2024 by the authors. Licensee MDPI, Basel, Switzerland. This article is an open access article distributed under the terms and conditions of the Creative Commons Attribution (CC BY) license (http://creativecommons.org/licenses/by/4.0/).


