
Submitted:
08 February 2026
Posted:
10 February 2026
You are already at the latest version
Abstract
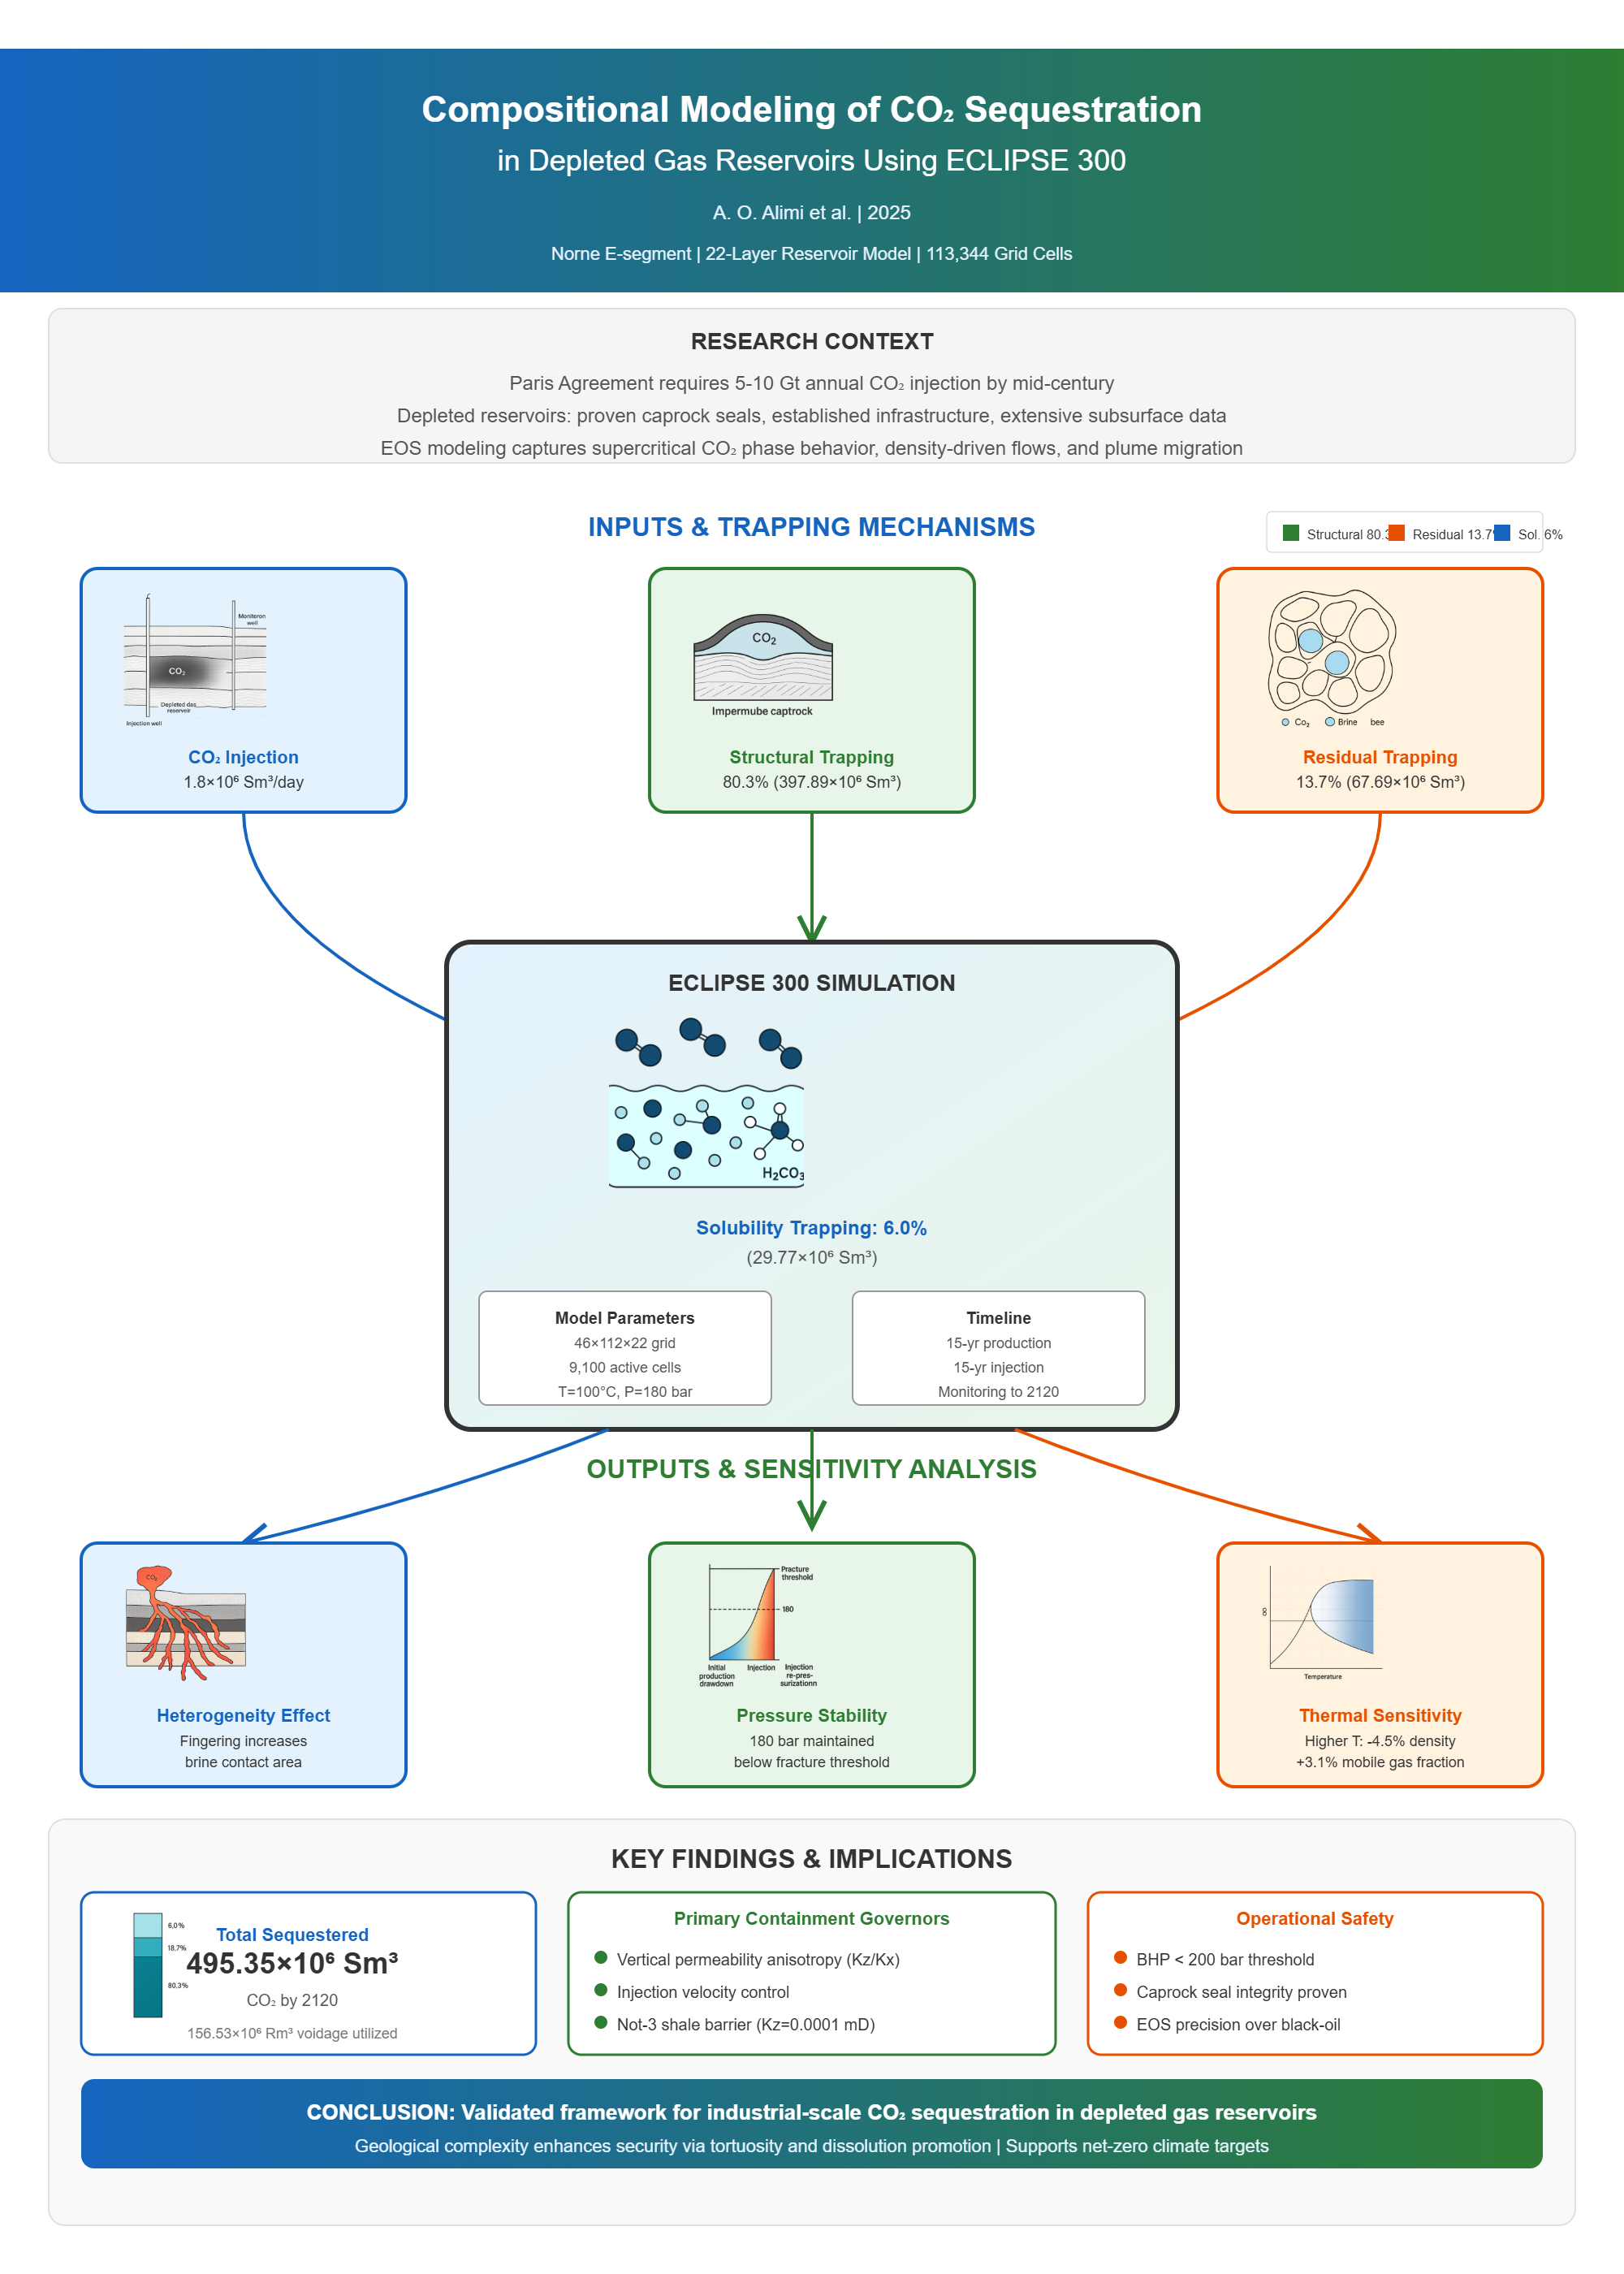
Utilizing depleted gas reservoirs for geological carbon sequestration offers a robust, technically viable pathway for large-scale greenhouse gas mitigation. This research utilizes ECLIPSE 300 to execute a rigorous compositional reservoir simulation, advancing a preliminary undergraduate investigation into a high-fidelity assessment of subsurface CO2 behavior. Central to this study is a sophisticated equation-of-state (EOS) model designed to track the long-term lifecycle of injected CO2, specifically focusing on plume migration patterns, pressure stabilization, and the multifaceted trapping mechanisms that ensure storage integrity. By systematically varying parameters such as permeability anisotropy, thermal regimes, and geological heterogeneity, the analysis identifies vertical permeability and injection velocity as the primary determinants of containment efficiency. The findings demonstrate that while depleted fields possess the capacity for significant CO2 volumes, the accuracy of storage projections depends heavily on compositional modeling rather than simplified black-oil approaches. These insights provide a refined framework for the technical screening and operational design of industrial-scale sequestration initiatives.
Keywords:
CO2 sequestration
; depleted gas reservoirs
; compositional modeling
; ECLIPSE300
; sensitivity analysis
; structural trapping
; CO2 storage
; reservoir heterogeneity
1. Introduction
1.1. Background and Climate Motivation
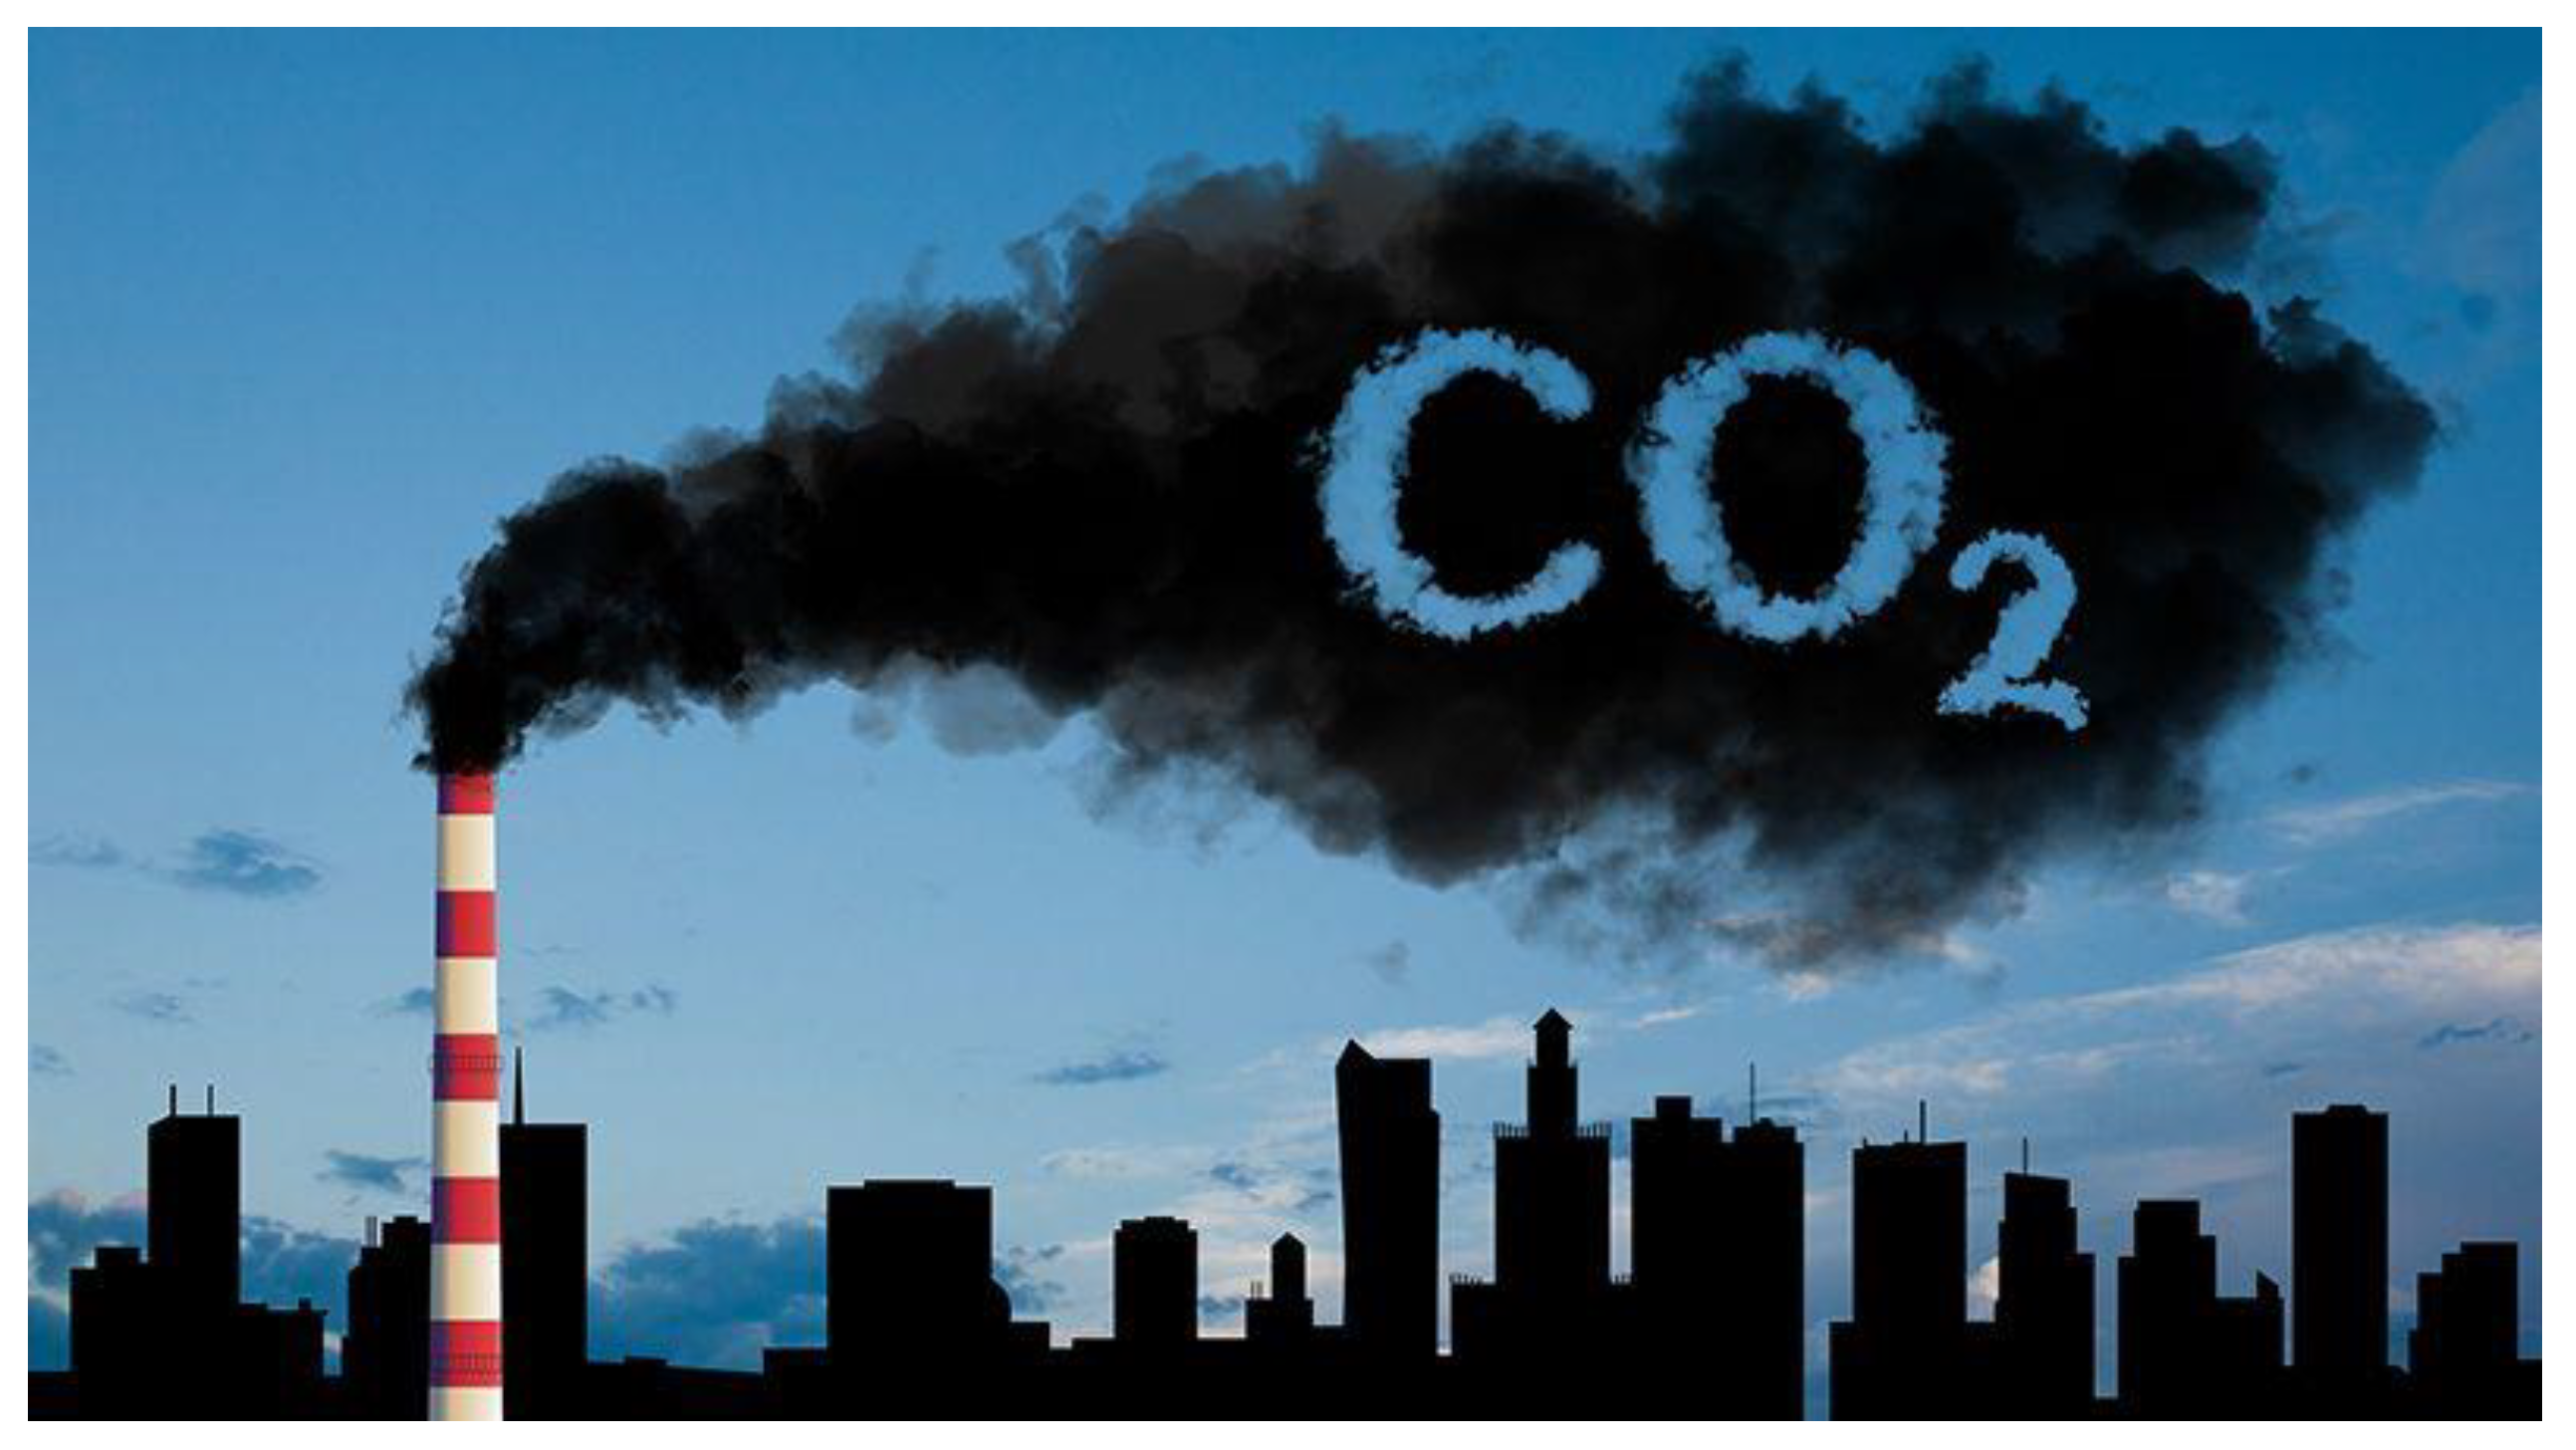
The mitigation of global climate change rests heavily on addressing the persistent release of anthropogenic carbon dioxide (CO2) stemming from fossil fuel combustion. While the expansion of renewable energy capacity has been significant, current projections indicate a continued, multi-decadal reliance on fossil fuels to sustain global electricity grids and heavy industrial operations (IEA, 2022). Consequently, achieving the net-zero targets necessary to maintain global temperature increases below the critical 2°C threshold requires a multifaceted approach (IPCC, 2023). Within this context, Carbon Capture and Storage (CCS) has transitioned from a theoretical necessity to a foundational pillar of global climate strategy, offering a viable means to decarbonize existing infrastructure while alternative energy systems mature.
Figure 1.
CO2 emission.
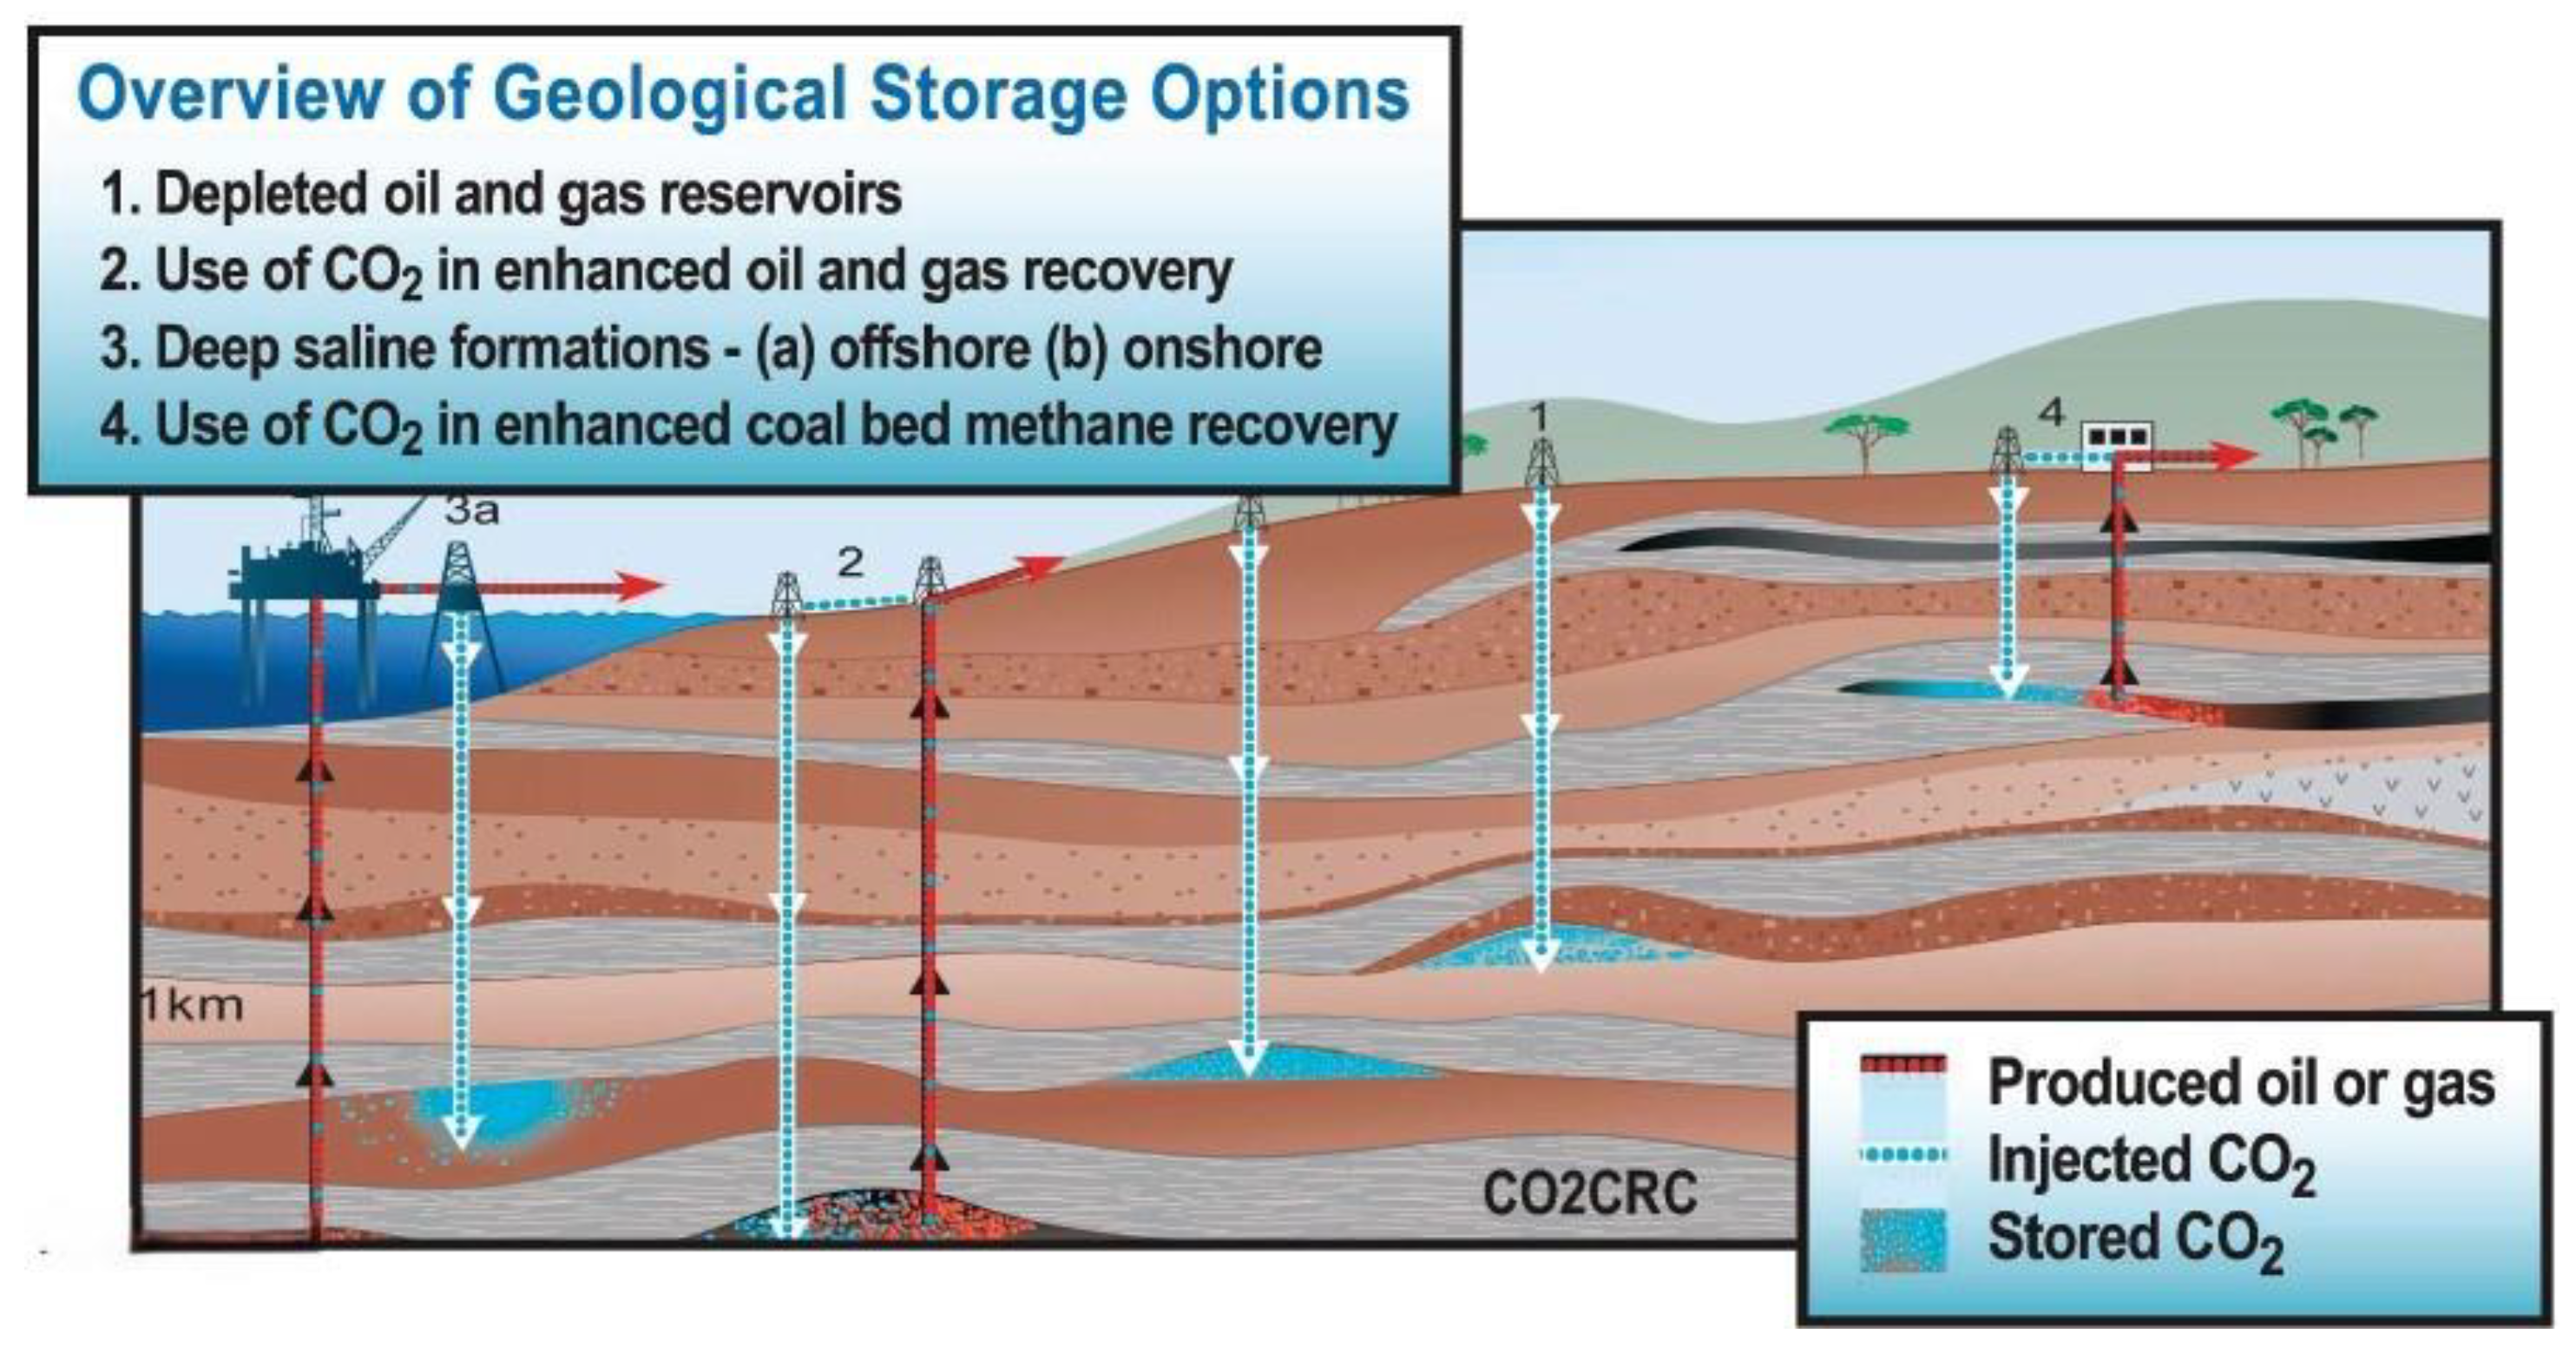
Attaining the objectives set forth by the Paris Agreement requires a rapid escalation in global sequestration capacity, with projections indicating a need for injection rates between 5 and 10 Gt of CO2 annually by mid-century (Jackson et al., 2022). While deep saline aquifers and unmineable coal seams represent significant potential, depleted hydrocarbon reservoirs stand out due to their proven containment integrity. These formations possess pre-existing trapping mechanisms that have successfully sequestered fluids over geological timescales, offering the added economic benefit of repurposing established borehole infrastructure and surface facilities (Hughes, 2008; IEAGHG, 2017).
However, the conversion of a gas field into a sequestration site introduces intricate fluid-rock dynamics that challenge traditional modeling approaches. The transition necessitates a rigorous understanding of the phase behavior of supercritical CO2, its displacement efficiency regarding residual methane, and the long-term kinetics of immobilization through residual and solubility trapping (Rwechungura et al., 2010; Li et al., 2006). Conventional black-oil or volumetric assessments frequently overlook critical compositional phenomena, most notably the dissolution of CO2 into formation brine. This process is vital for ensuring chemical security against buoyancy-driven migration over decadal and centennial horizons (Zhang et al., 2014). Consequently, for geological sequestration to function as a reliable pillar of CCS, the selected formations must demonstrate sustained capacity and injectivity while maintaining containment security for millennia (Benson & Cole, 2008).
Figure 2.
Geological Storage Options.
1.2. Depleted Gas Reservoirs for CO2 Storage
The designation of depleted gas reservoirs as high-confidence candidates for CO2 sequestration is primarily supported by their established containment history and the vast repository of existing subsurface data (Bachu, 2000). Unlike uncharacterized formations, these reservoirs offer a "proven" seal, having successfully trapped pressurized hydrocarbons over geological eras. Furthermore, the substantial pressure drawdown resulting from decades of natural gas extraction creates a significant void, providing both the expansive pore volume required for large-scale storage and the favorable pressure gradients necessary for high-rate CO2 injection (Oldenburg et al., 2004).
Figure 3.
Depleted Gas Reservoir.
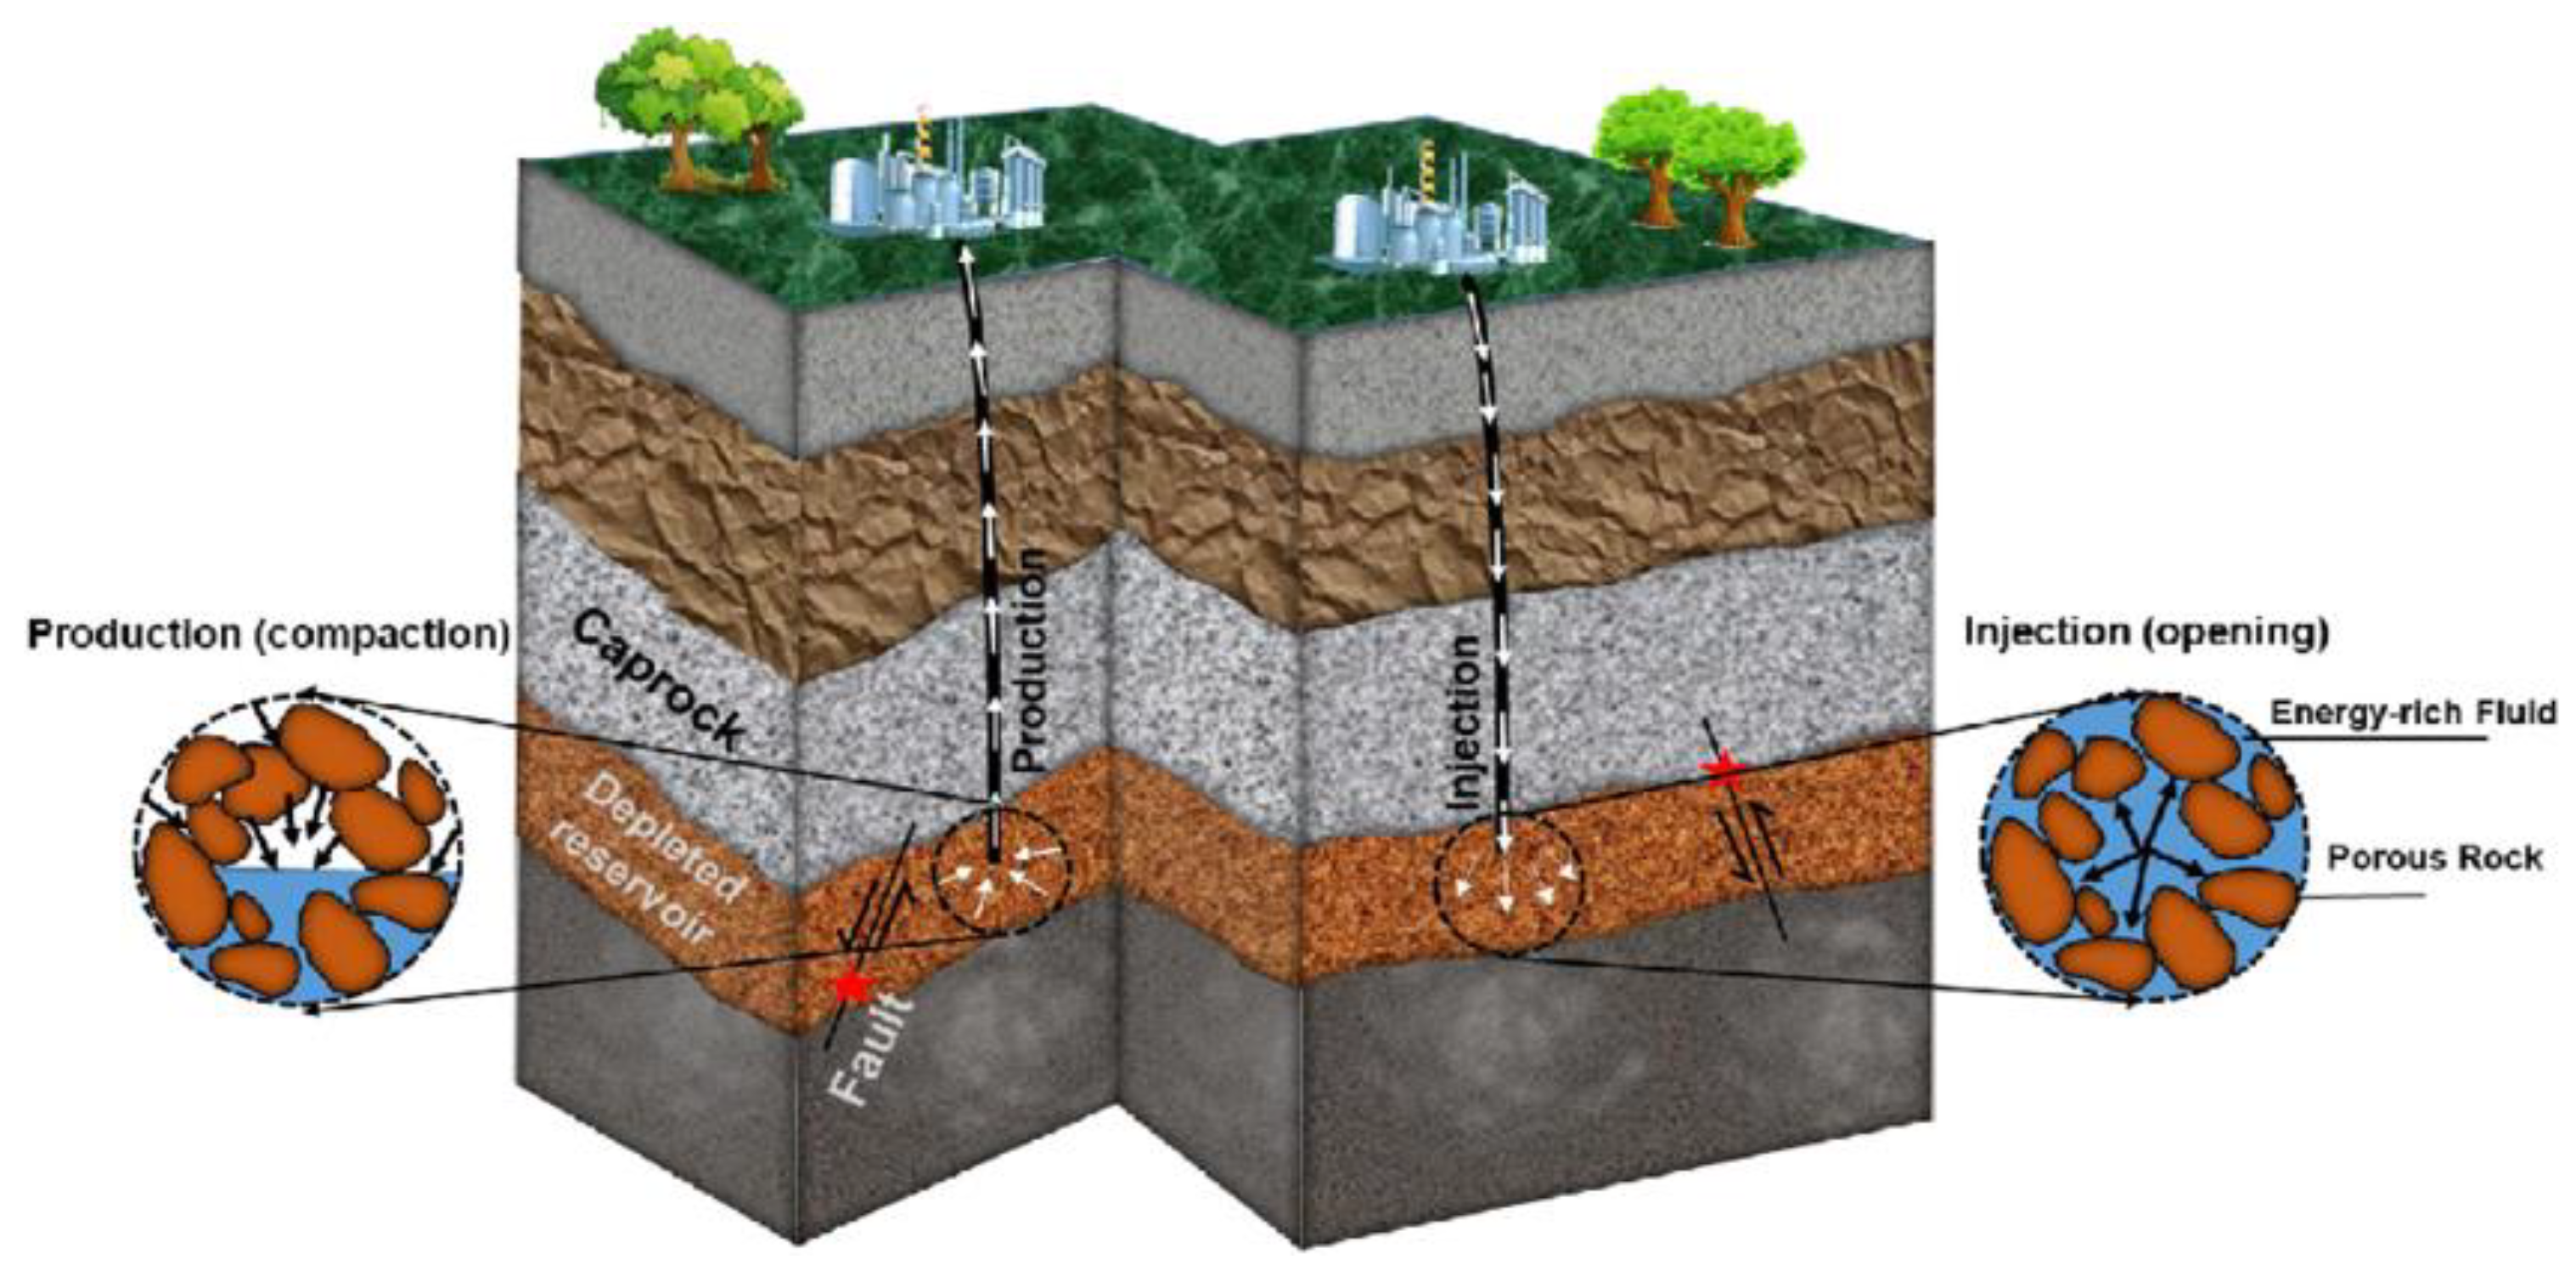
A primary differentiator between depleted gas fields and saline aquifers lies in the empirical validation of the former; the presence of accumulated hydrocarbons over millions of years serves as a direct testament to caprock integrity and structural closure. This historical performance effectively eliminates much of the exploratory risk associated with subsurface storage, as the sealing mechanisms have already been stress-tested by nature. Consequently, the reliance on these well-characterized traps allows for a more deterministic approach to storage modeling, significantly narrowing the window of geological uncertainty (Chiaramonte et al., 2011).
2. Methodology
2.1. Study Approach
The introduction of CO2 into methane-saturated environments triggers intricate multicomponent phase interactions and density-driven flow dynamics. As CO2 and CH4 mix, the resulting shifts in fluid density and viscosity exert a primary influence on plume migration patterns and the overall pressure evolution within the reservoir (Pruess & García, 2002). Standard black-oil approximations are fundamentally ill-equipped to capture these nuances, as they rely on simplified fluid correlations rather than discrete component interactions.
To address these complexities, this study employs compositional reservoir simulation underpinned by robust equations of state (EOS). This approach facilitates the explicit tracking of individual molecular components, ensuring that phase behavior is predicted with high fidelity under varying subsurface conditions (Coats, 1985). For this purpose, ECLIPSE 300, an industry-standard simulator recognized for its reliability in carbon sequestration modeling was utilized (Nghiem et al., 2009). The systematic execution of this research is outlined in the procedural workflow illustrated in Figure 3.
2.2. Reservoir Model and Static Properties
The initial phase of the modeling process involves the definition of static properties, which establish the fundamental structural architecture and geological configuration of the reservoir. Because these parameters remain constant throughout the simulation, they serve as a controlled baseline against which the dynamic responses of the system are measured. This rigid framework illustrated in table 1 and 2 is essential for isolating the effects of subsequent modifications, specifically allowing for a quantified comparison when E-segment property variations are introduced in later stages of the sensitivity analysis.

Table 1.
Molar Composition of Components.
| Component symbol | CO2 | H2O | C1 | C2 | C3 |
| Component Name | Carbon Dioxide | Water | Methane | Ethane | Propane |
| Composition | 0.0115 | 0.02 | 0.65 | 0.18 | 0.1385 |
Table 2.
Initialization parameter and fluid properties (base case).
| Symbol | Variable | Value | Units (Metric) |
| N | Total grid blocks | 113344 | |
| Active grid blocks | 9100 | ||
| Cr | Rock compressibility @ 150bar | 0.00005 | 1/bar |
| Temp | Reservoir temperature | 100 | oC |
| S | Salinity | 0.51 | 10-31kg-M/kg |
| ρo | Oil density at surface conditions | 600 | Kg/m3 |
| ρw | Brine density at surface conditions | 600 | Kg/m3 |
| ρg | Gas density at surface conditions | 1050 | Kg/m3 |
| Kh | Horizontal Permeability | 1 - 10000 | mD |
| Ø | Porosity | 15.54 - 32.275 | |
| GWC | Gas-Water Contact | 2750 | m |
| P,V | Pore Volume (initial) | 156.529731 | 106 Rm3 |
| Swc | Connate water saturation | 0.37 | |
| Sgr | Critical gas saturation | 0.01 | |
| Sgmax | Maximum Gas Saturation | 0.63 | |
| Qp | Gas production rate | 1.8 | 106 Sm3/d |
| Q | Gas injection rate | 1.8 | 106 Sm3/d |
| xCO2 | CO2 mole fraction in injection stream | 1 | |
| T_prod | Period of production | 15 | years |
| T_inj | Period of injection | 15 | years |
| Pinit | Initial pressure @ 2750m | 200 | bar |
| Pfrac | Fracture pressure | >250 | bar |
| Pbhp_limit | Bottom-hole pressure limit | <200 | bar |
| Start | Simulation start date | 16-Apr-25 | |
| End | Simulation end date | 1-Jan-2120 |
2.3. Original Norne Reservoir Model
The structural foundation of the study is derived from a high-resolution geological model, initially discretized into 113,344 grid cells, of which 44,431 are active. To optimize computational performance and maintain high-fidelity results, the active simulation volume was streamlined to 9,100 active grid cells for all execution runs (Table 2). The vertical architecture is defined by 22 distinct lithological zones, delineated through an integration of sequence boundaries and extensive data from wells (6608/10-2 and -3). This grid, refined via RMS software, incorporates contemporary structural and isochore mapping to ensure a high-fidelity representation of the subsurface.
Petro-physical characteristics within this framework reflect a highly heterogeneous environment; horizontal permeability ranges from 100 to 1000mD, while porosity values fluctuate between 0.2 and 0.33. Three-dimensional visualization of the model highlights these spatial variations, providing a clear view of the property distributions across the various layers. Specifically, the lateral distribution of horizontal permeability and the cell-by-cell porosity variations are illustrated in Figures 4 (a) and (b), respectively.
2.4. E-Segment Model Description
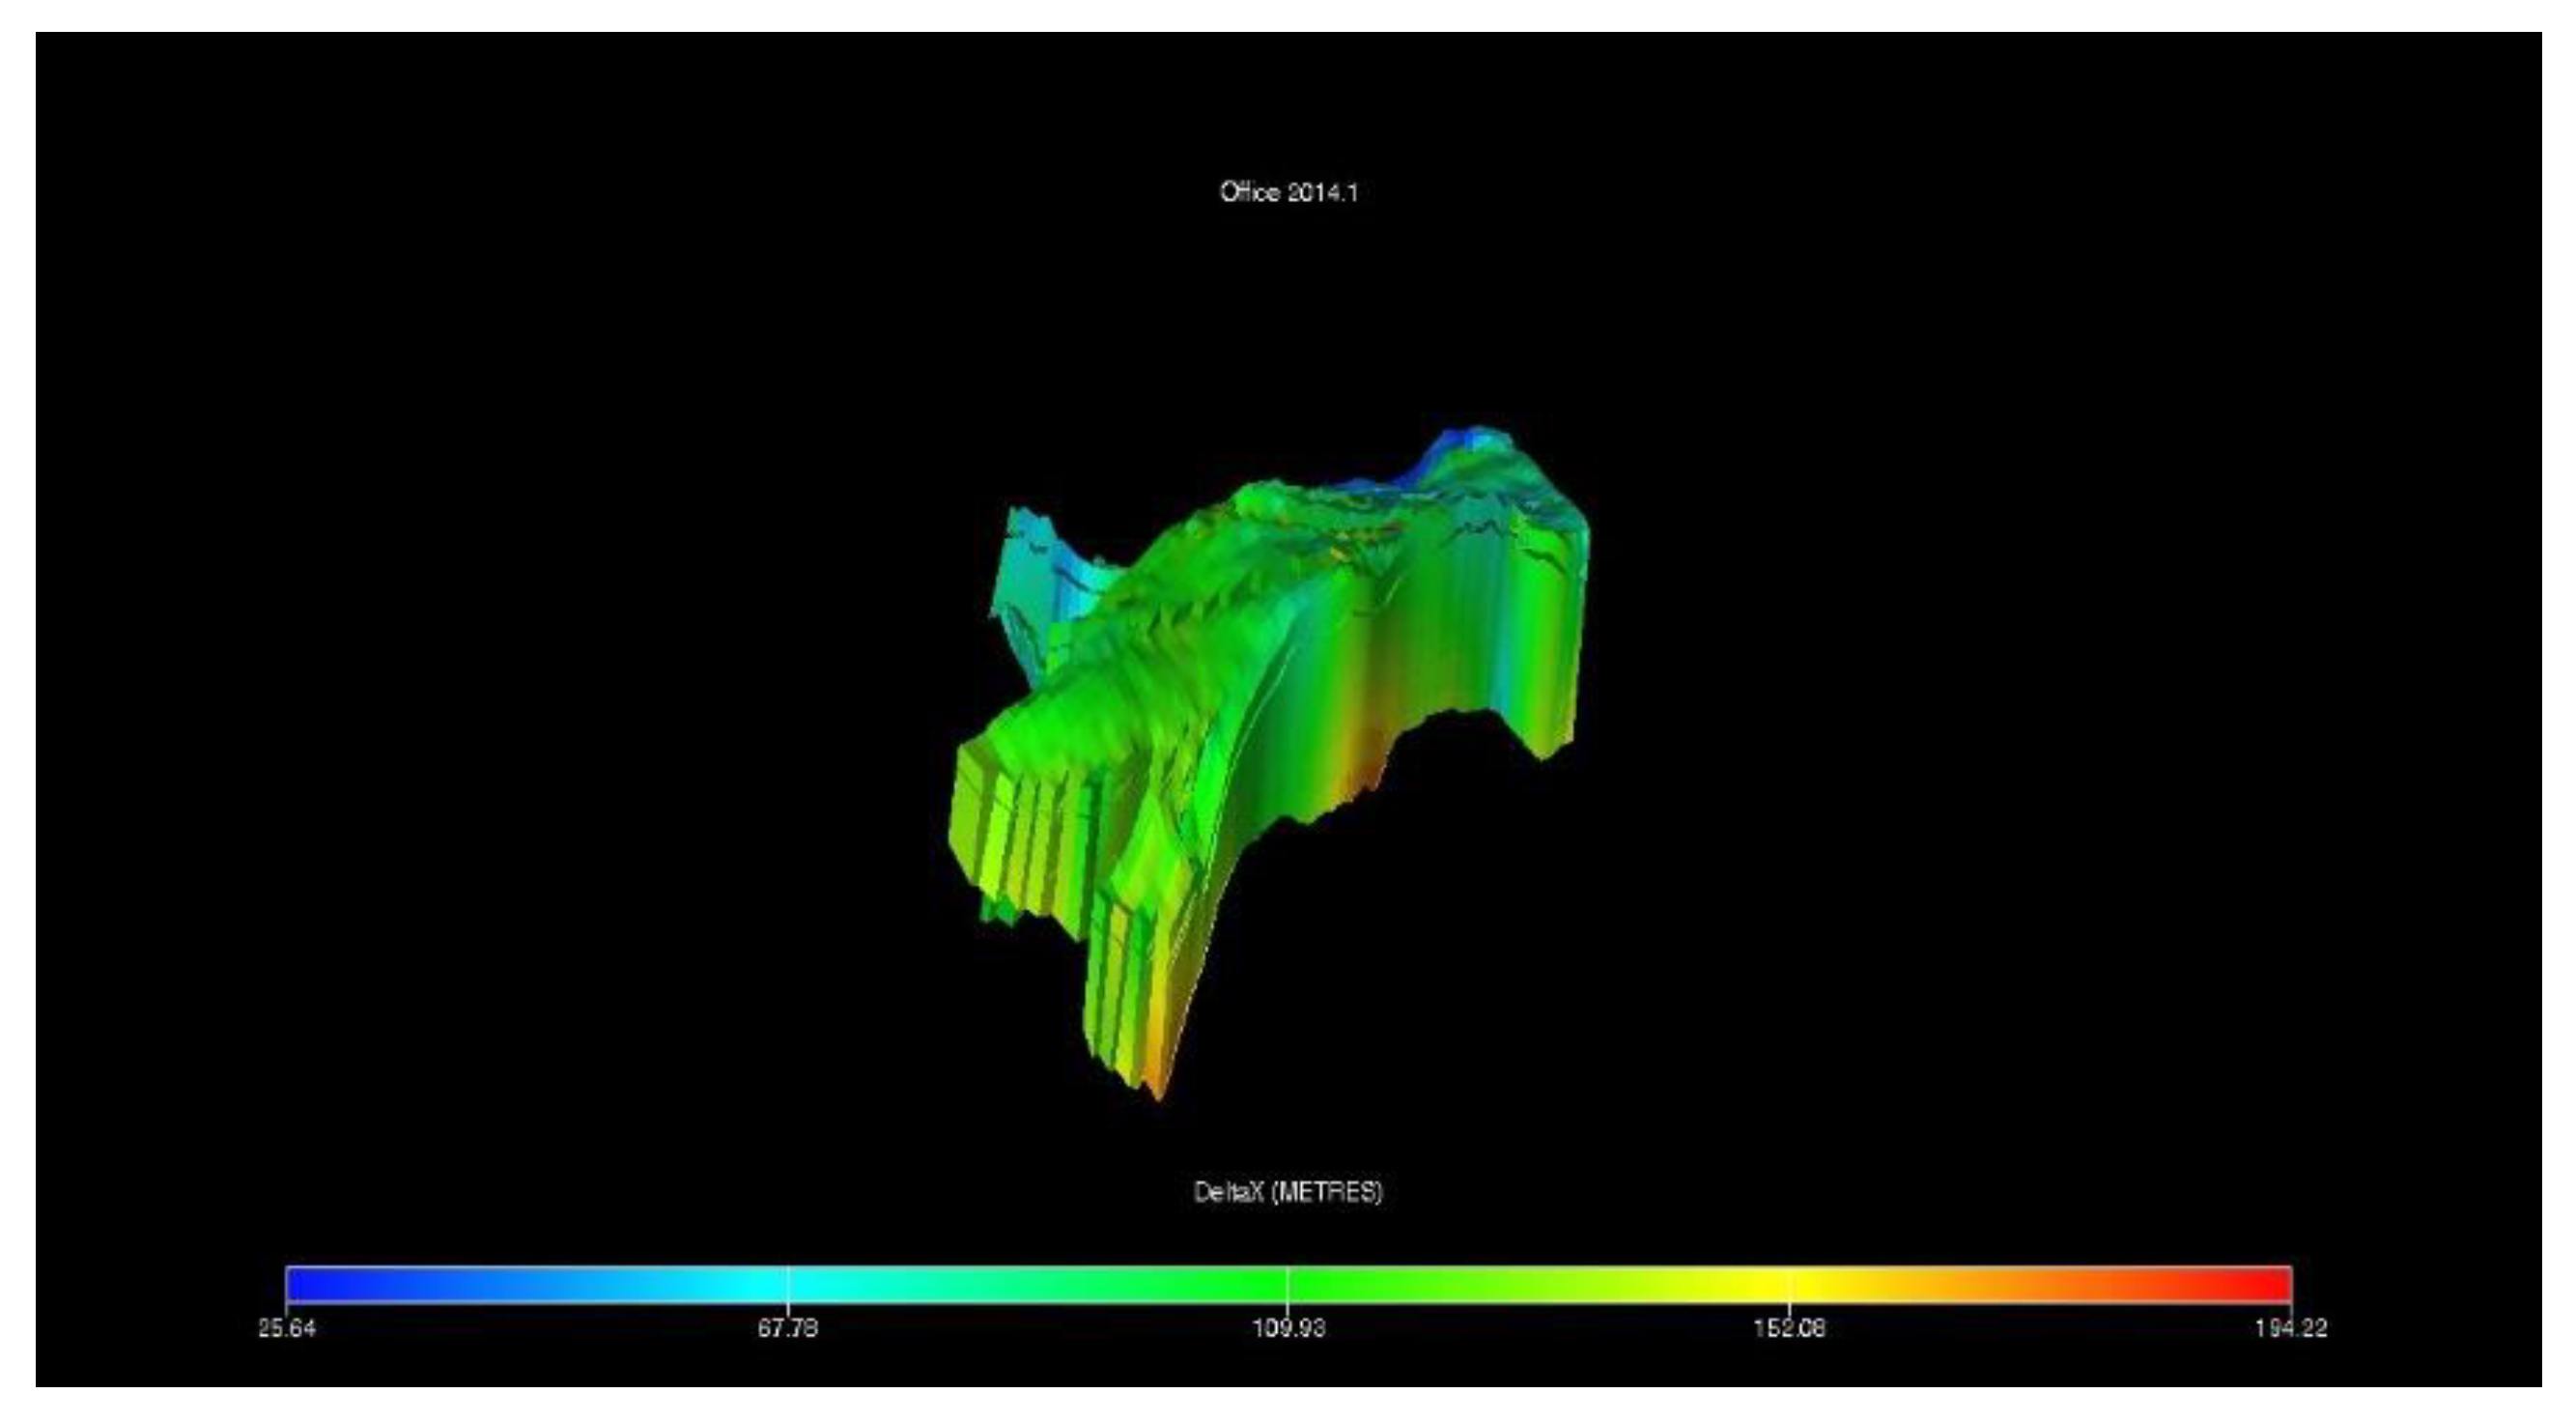
The simulation domain is defined by a 46 x 112 x 22 grid configuration, totaling 113,344 cells. To optimize computational performance, the active simulation volume was streamlined to 9,100 cells, resulting in an efficient average processing time of 18 minutes per run. Spatial discretization was tailored to the reservoir's complexity: grid dimensions in the x-direction vary between 83.9m and 194.2m, while y-direction spacing ranges from 65.7m to 155.6m. Vertical resolution is significantly more refined, with layer thicknesses ranging from 0.2m to 47.14m to capture subtle stratigraphic changes.
Consistent with the original structural framework, the E-segment maintains 22 layers, each characterized by unique petro-physical properties. A critical modification in this study involves Layer 4 (Not fm.); previously classified as an inactive impermeable barrier, it was reactivated with low-magnitude permeability to realistically simulate the caprock’s role in CO2 containment. This adjustment ensures that the model accounts for potential seal-rock interactions. As illustrated in the x-direction cell configuration (Figure 5), the grid utilizes variable horizontal spacing, wider in regions of low gradients and more concentrated near wellbores and heterogeneities in order to maintain numerical stability and spatial accuracy where flux gradients are highest.
2.5. Simulation Study
The reservoir exhibits a distinct north-to-south dip, with depths extending from 2,524m to 3,051m. A uniform thickness of 220m is maintained across the field, a structural attribute that significantly mitigates geomechanical risks and stress concentrations often associated with thinner or more irregular formations. With a mean porosity of 0.25 and a total pore volume of 156.53 x 10⁶Rm3, the formation presents a substantial capacity for both fluid recovery and subsequent sequestration.
The simulated operational lifecycle is divided into two 15-year phases: primary gas production followed by CO2 sequestration. Commencing at an initial reservoir pressure of 200bar, the production phase is governed by a strategic 50-bar drawdown limit. This 150bar abandonment pressure serves a dual purpose: ensuring economic viability while safeguarding the formation against irreversible compaction or subsidence. Following depletion, the sequestration phase begins, with CO2 injection designed to restore the reservoir to below its original 200bar state. This target pressure is deliberately capped to align with the formation’s fracture gradient, ensuring the long-term integrity of the seal and preventing CO2 leakage through induced fractures.
Figure 6.
Base case with two production wells converted to injection wells.
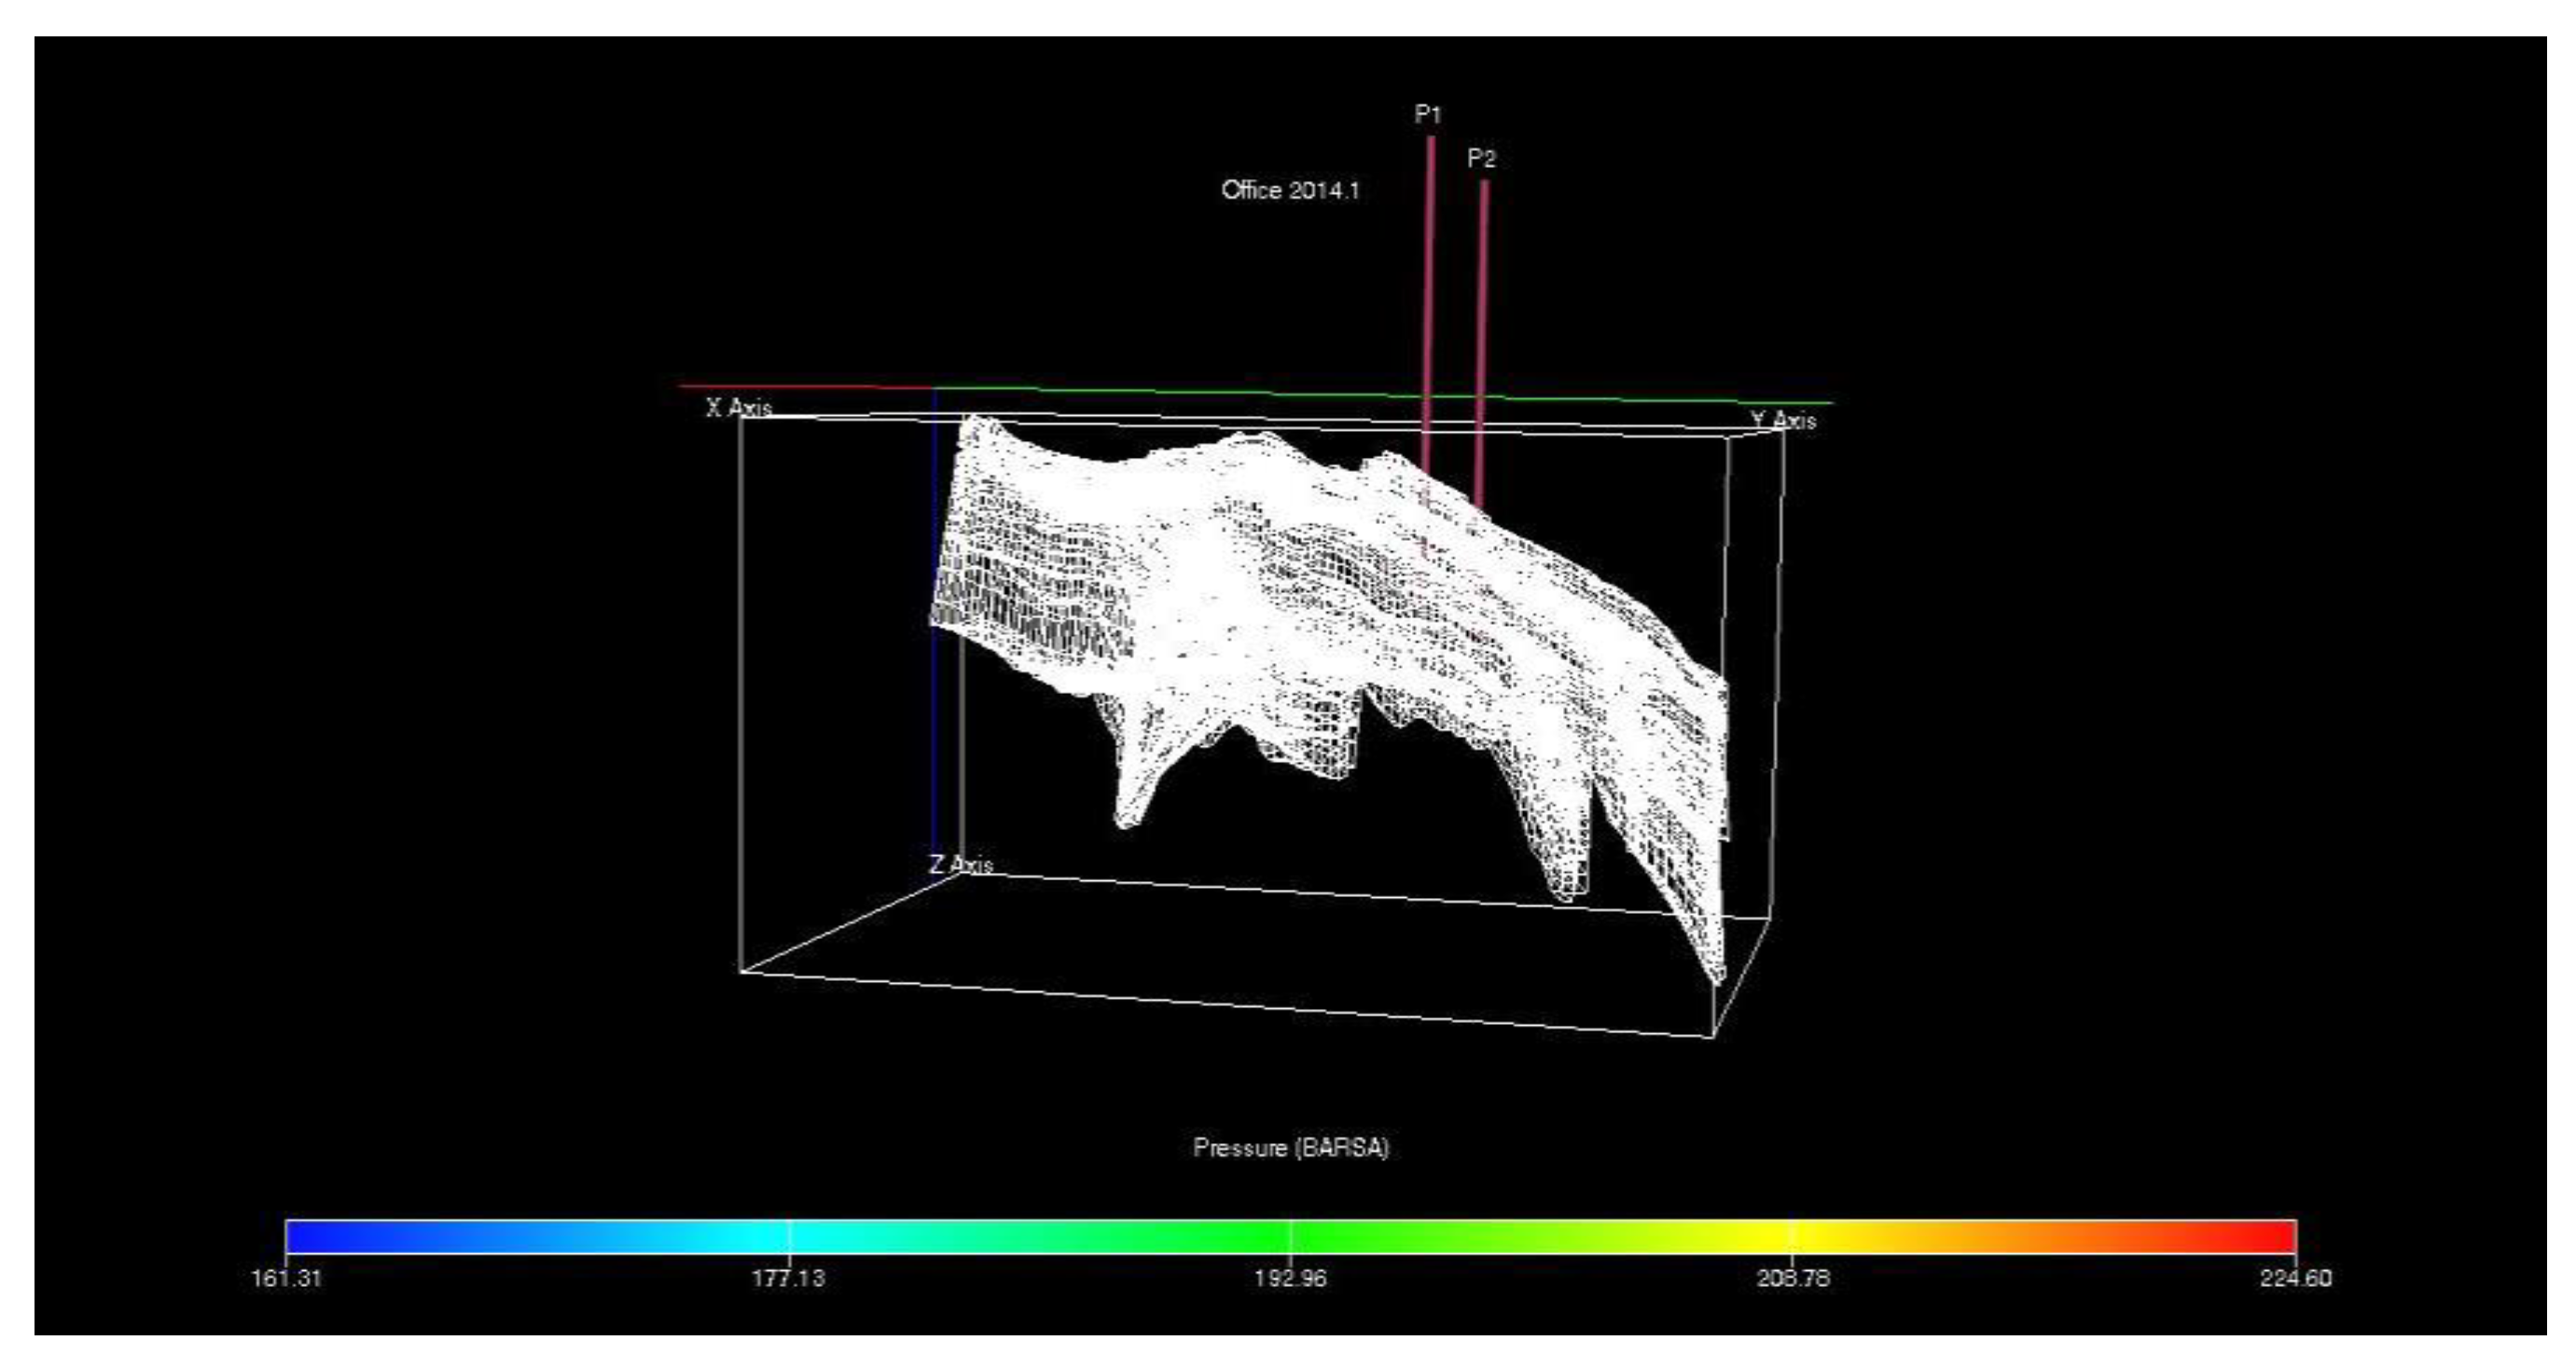
To optimize existing infrastructure, the operational model repurposes two production wells for CO2 injection. The selection of vertical wellbores over horizontal alternatives was driven by the reservoir's inherent permeability anisotropy; since lateral transmissibility significantly outstrips vertical flow, a vertical configuration more effectively leverages radial displacement within this specific stratigraphic context. The injection nodes are localized at grid coordinates (11, 63) and (8, 66), a placement strategically designed to isolate the wells from tectonic faults and reservoir boundaries. This spatial buffering is essential to mitigate localized pressure spikes that could otherwise jeopardize seal integrity.
The completion strategy further prioritizes containment security and the enhancement of trapping mechanisms. Perforations are confined to grid layers 7 through 18, deliberately maintaining a standoff from the immediate sub-caprock layers to reduce the risk of early-stage vertical leakage. Furthermore, the completion intervals are situated up-dip from a gas-water contact (GWC) at 2,750m. By injecting in this structural position, the CO2 is encouraged to migrate both laterally and downward, maximizing contact with the underlying formation brine. This specific flow path promotes dissolution trapping, converting the buoyant gas into a more stable aqueous phase and ensuring a robust, long-term sequestration profile.
3. Results and Discussion
3.1. Base Case Analysis and Storage Potential
The baseline simulation provides a definitive benchmark for the sequestration capacity of the Norne E-segment. Over the initial 15-year production cycle, reservoir pressure was drawn down from an initial 200 bar to approximately 150bar. This depletion phase successfully generated a calculated voidage of 156.53 x 10⁶Rm3, effectively preparing the subsurface architecture for carbon storage.
Following the shift to the sequestration phase, CO2 was introduced at a constant injection rate of 1.8 x 10⁶Sm3. Field pressure profiles indicate a systematic and controlled re-pressurization; while the methodology aimed for a full restoration to the original 200 bar, the reservoir reached approximately 180 bar at the conclusion of the 15-year injection period. Critically, this pressure ceiling remained comfortably below the 200 bar geo-mechanical fracture threshold, ensuring that the structural integrity of the seal was never compromised. A longitudinal monitoring phase extending to the year 2120 reveals that post-injection pressures reach a stable equilibrium. This long-term stabilization confirms the efficacy of the structural trap in providing permanent CO2 containment and validates the reservoir's suitability as a secure, long-term carbon sink.
Figure 7.
Field results for initial parameters.
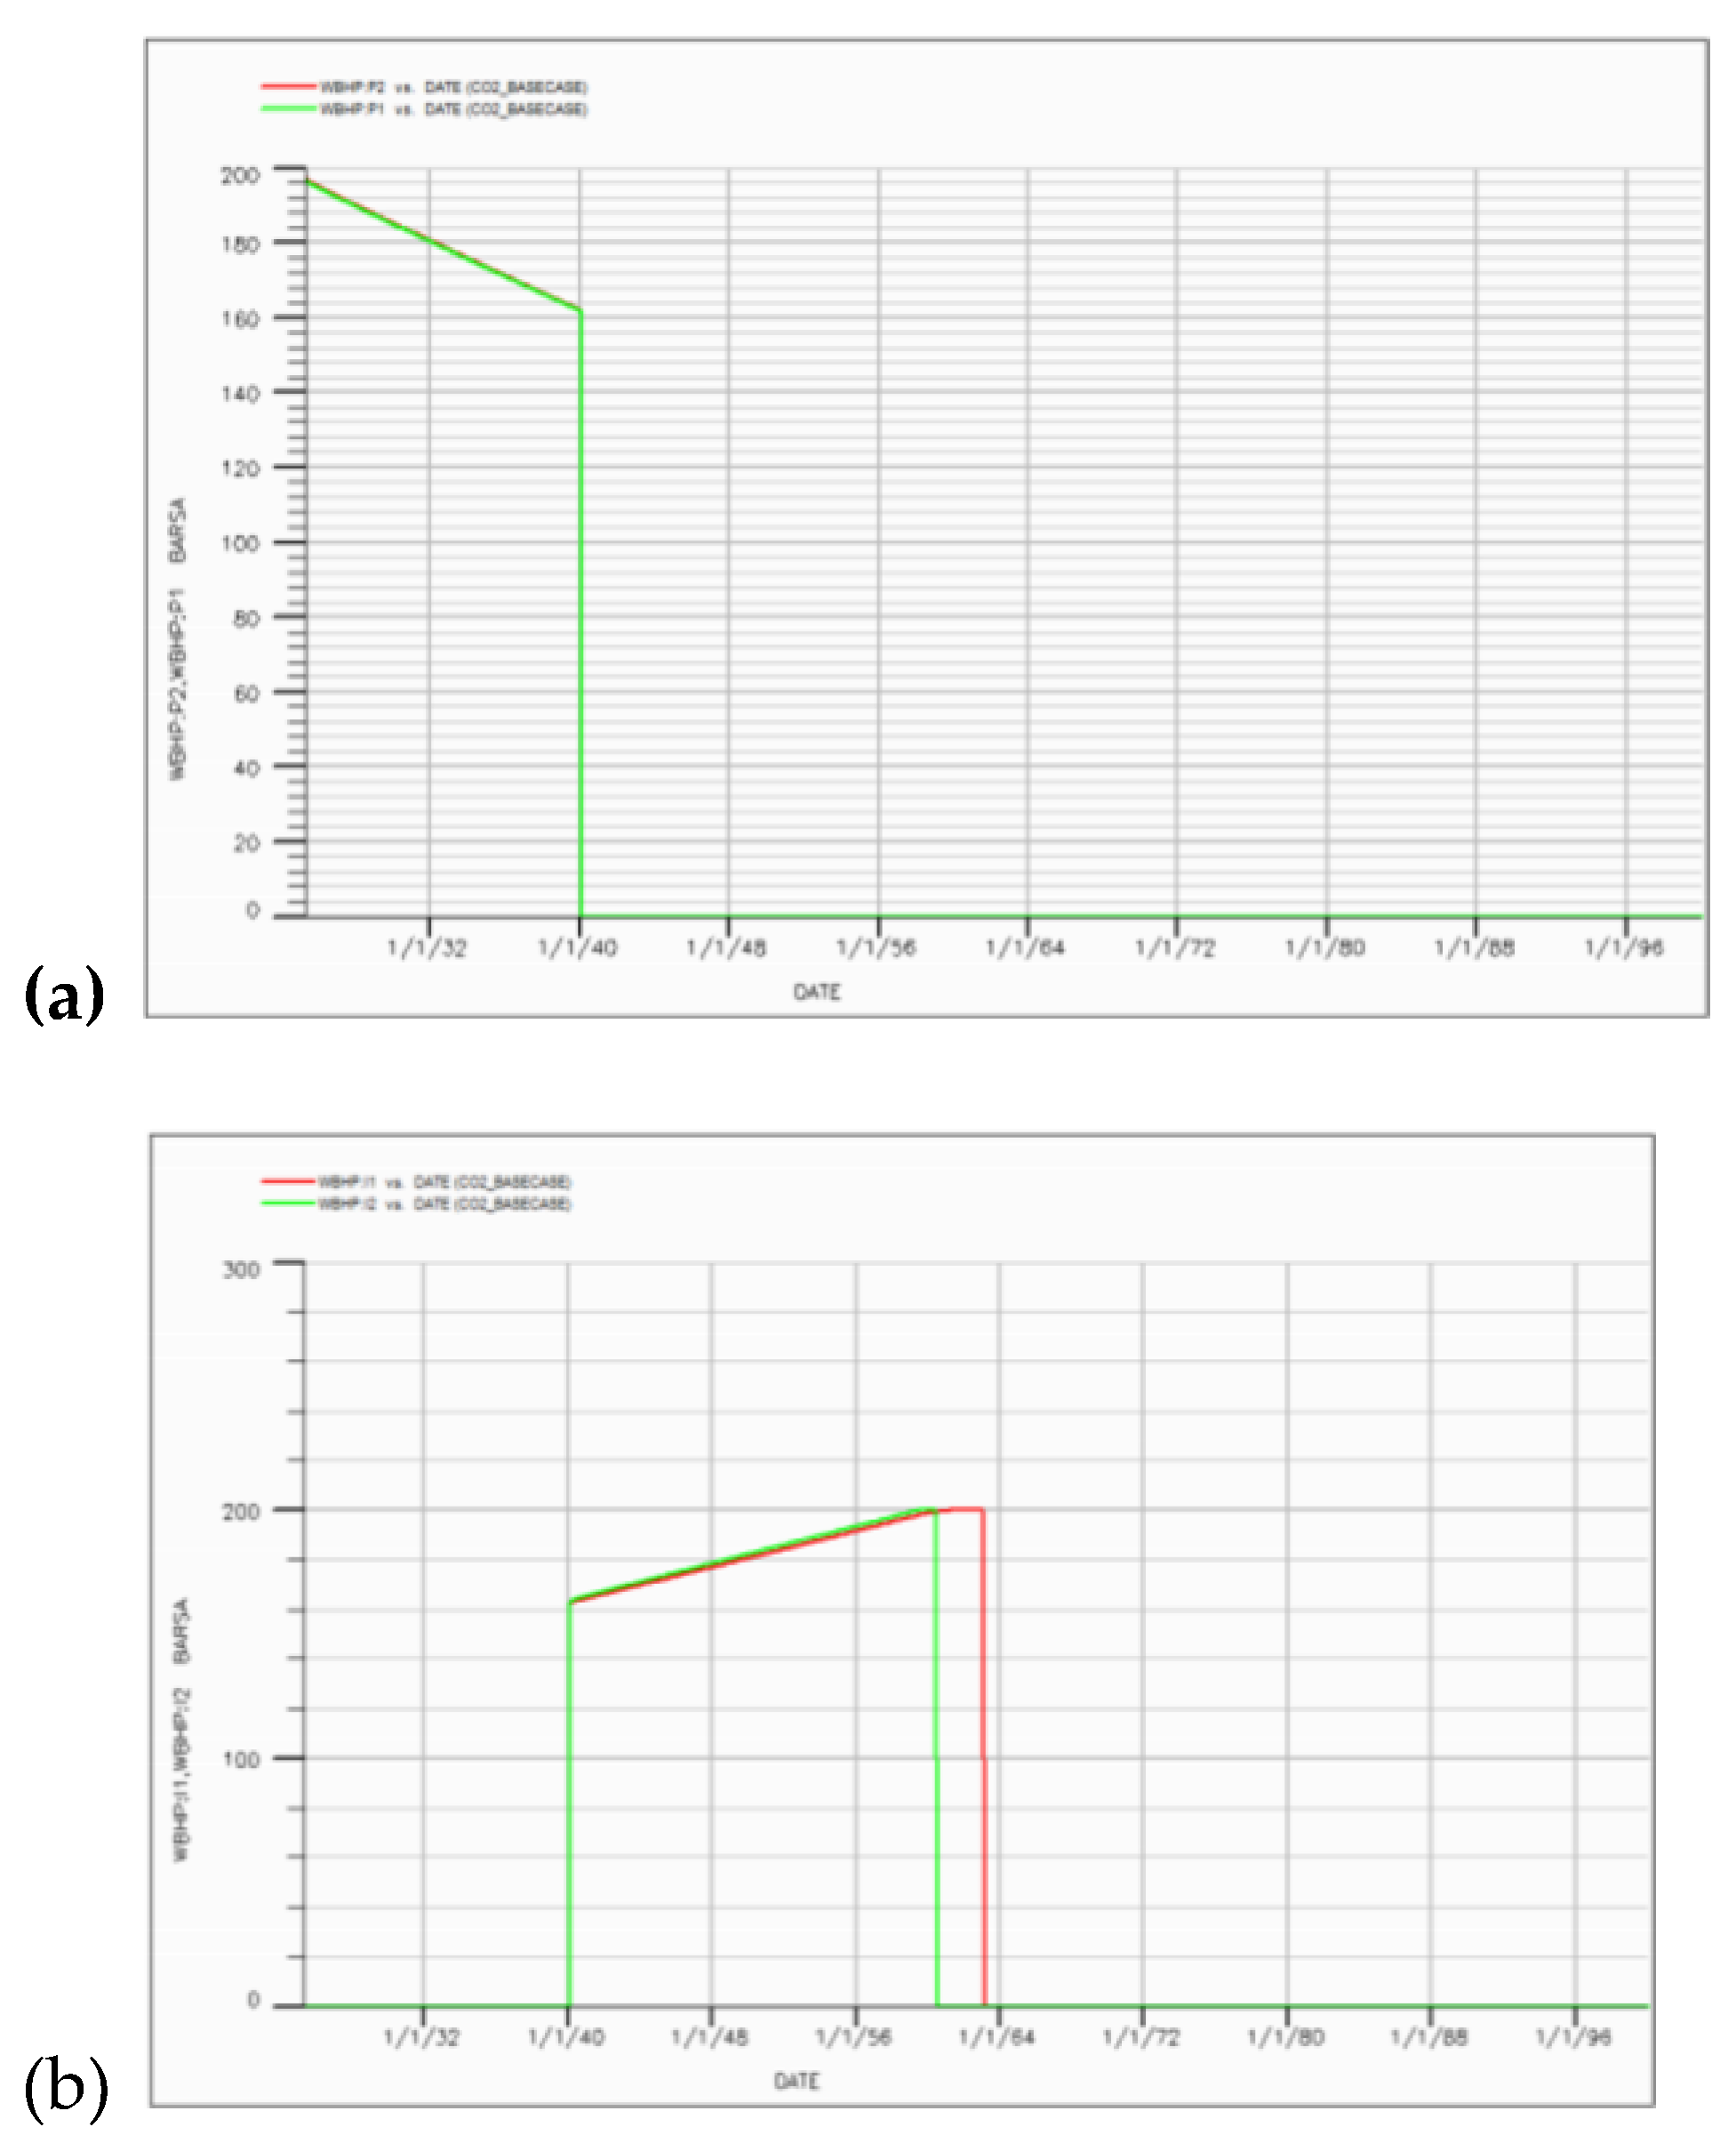
(a) Bottom hole pressure for production wells P1 and P2. (b) Bottom hole pressure for injection wells I1 and I2. (c) Reservoir field pressure. (d) CO2 component mobile in gas (Free/mobile gas trapping). (e) CO2 component dissolved in water (Dissolution trapping). (f) CO2 component trapped in gas (Residual Gas Trapping).
3.2. Impact of Reservoir Heterogeneity on Plume Stabilization
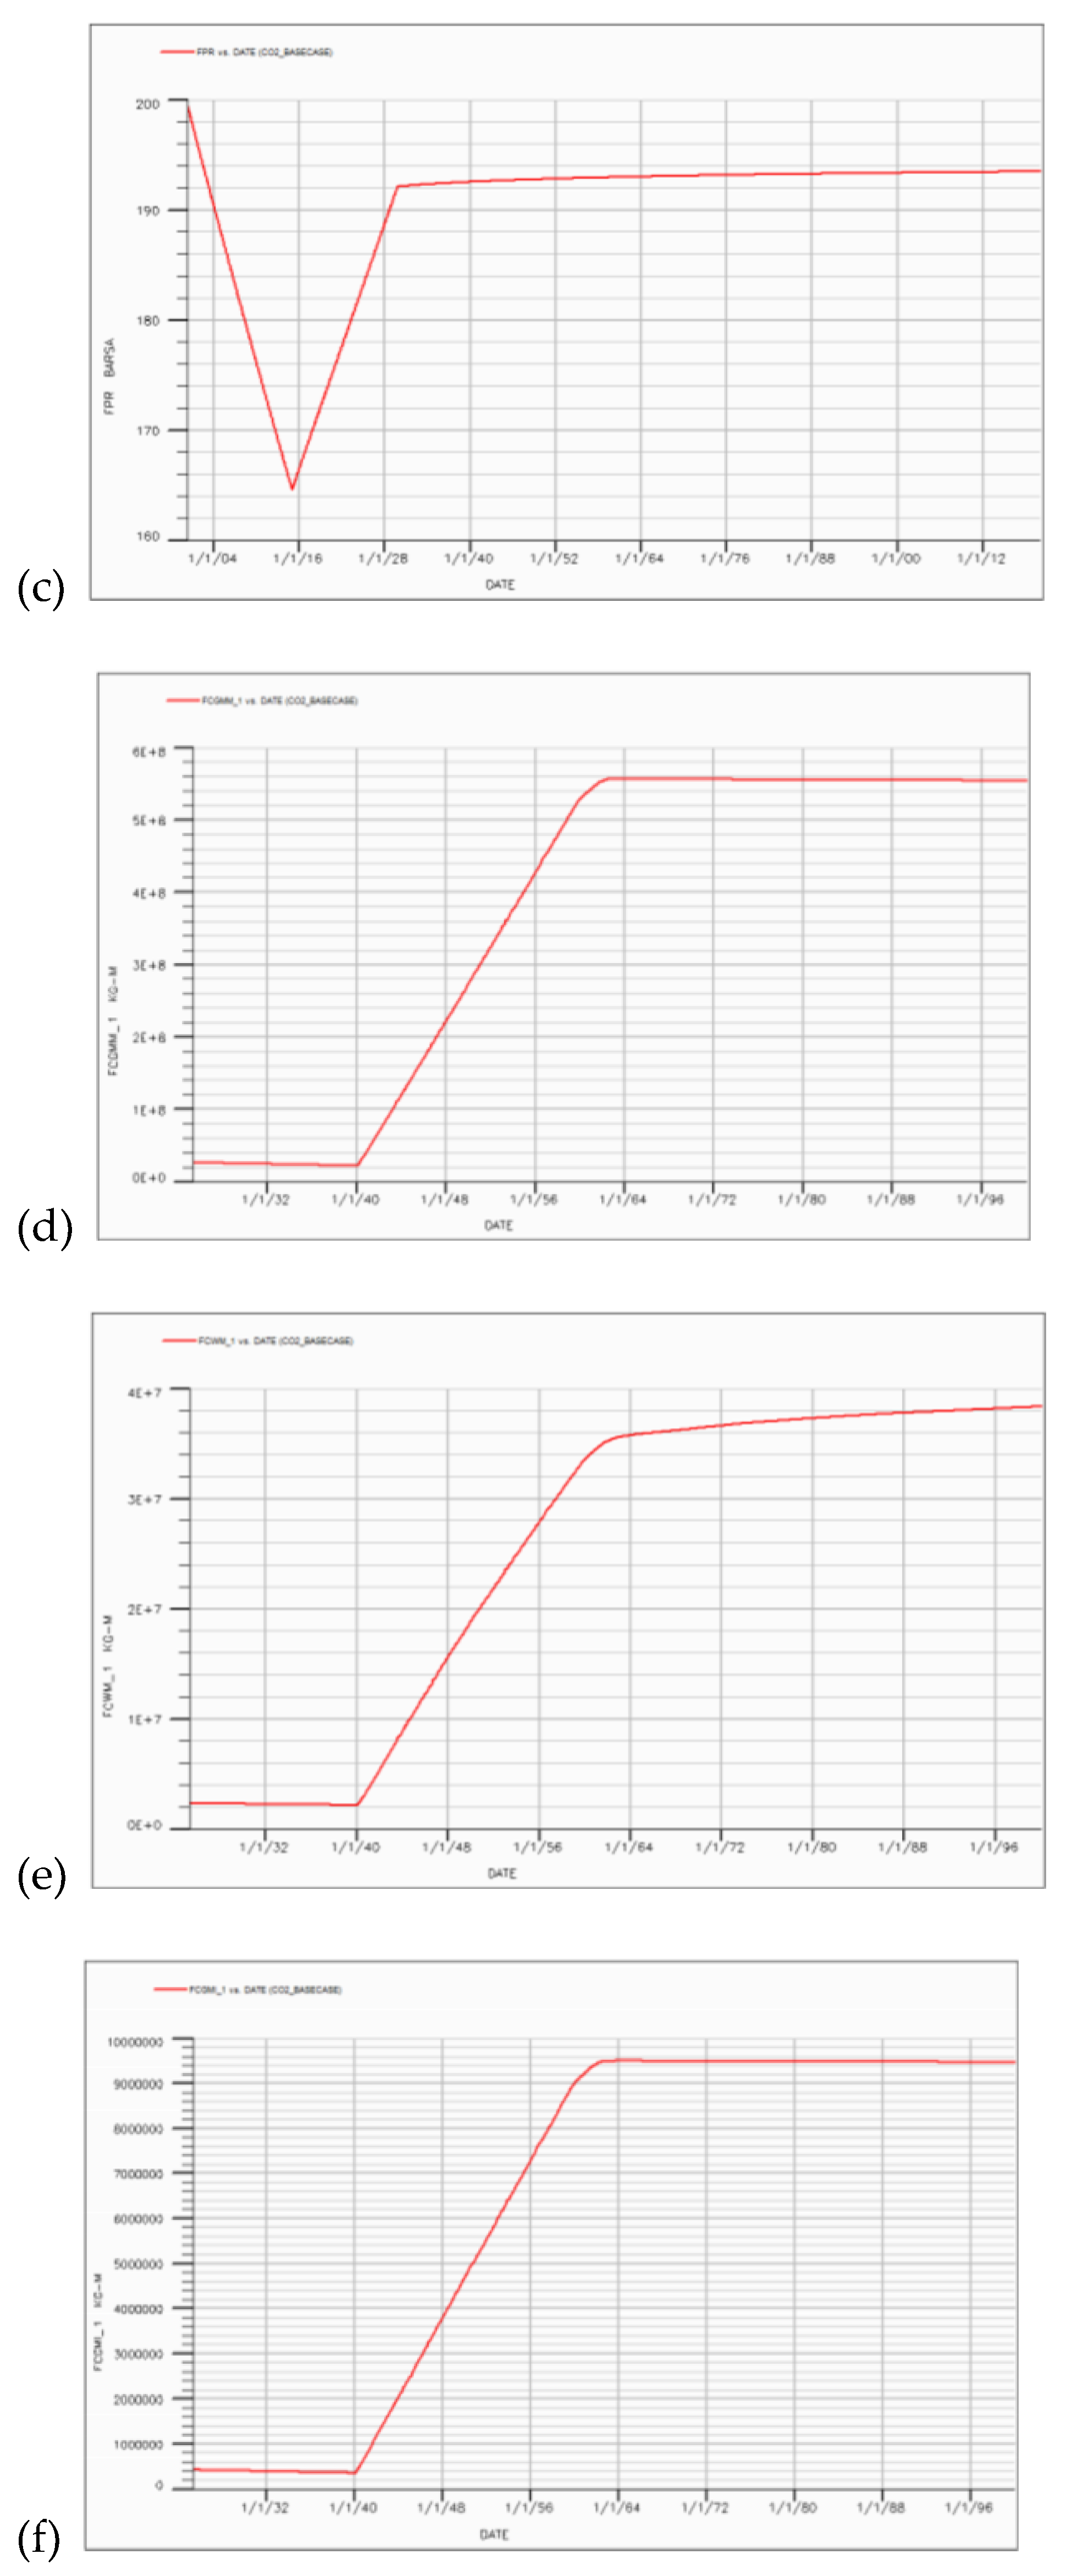
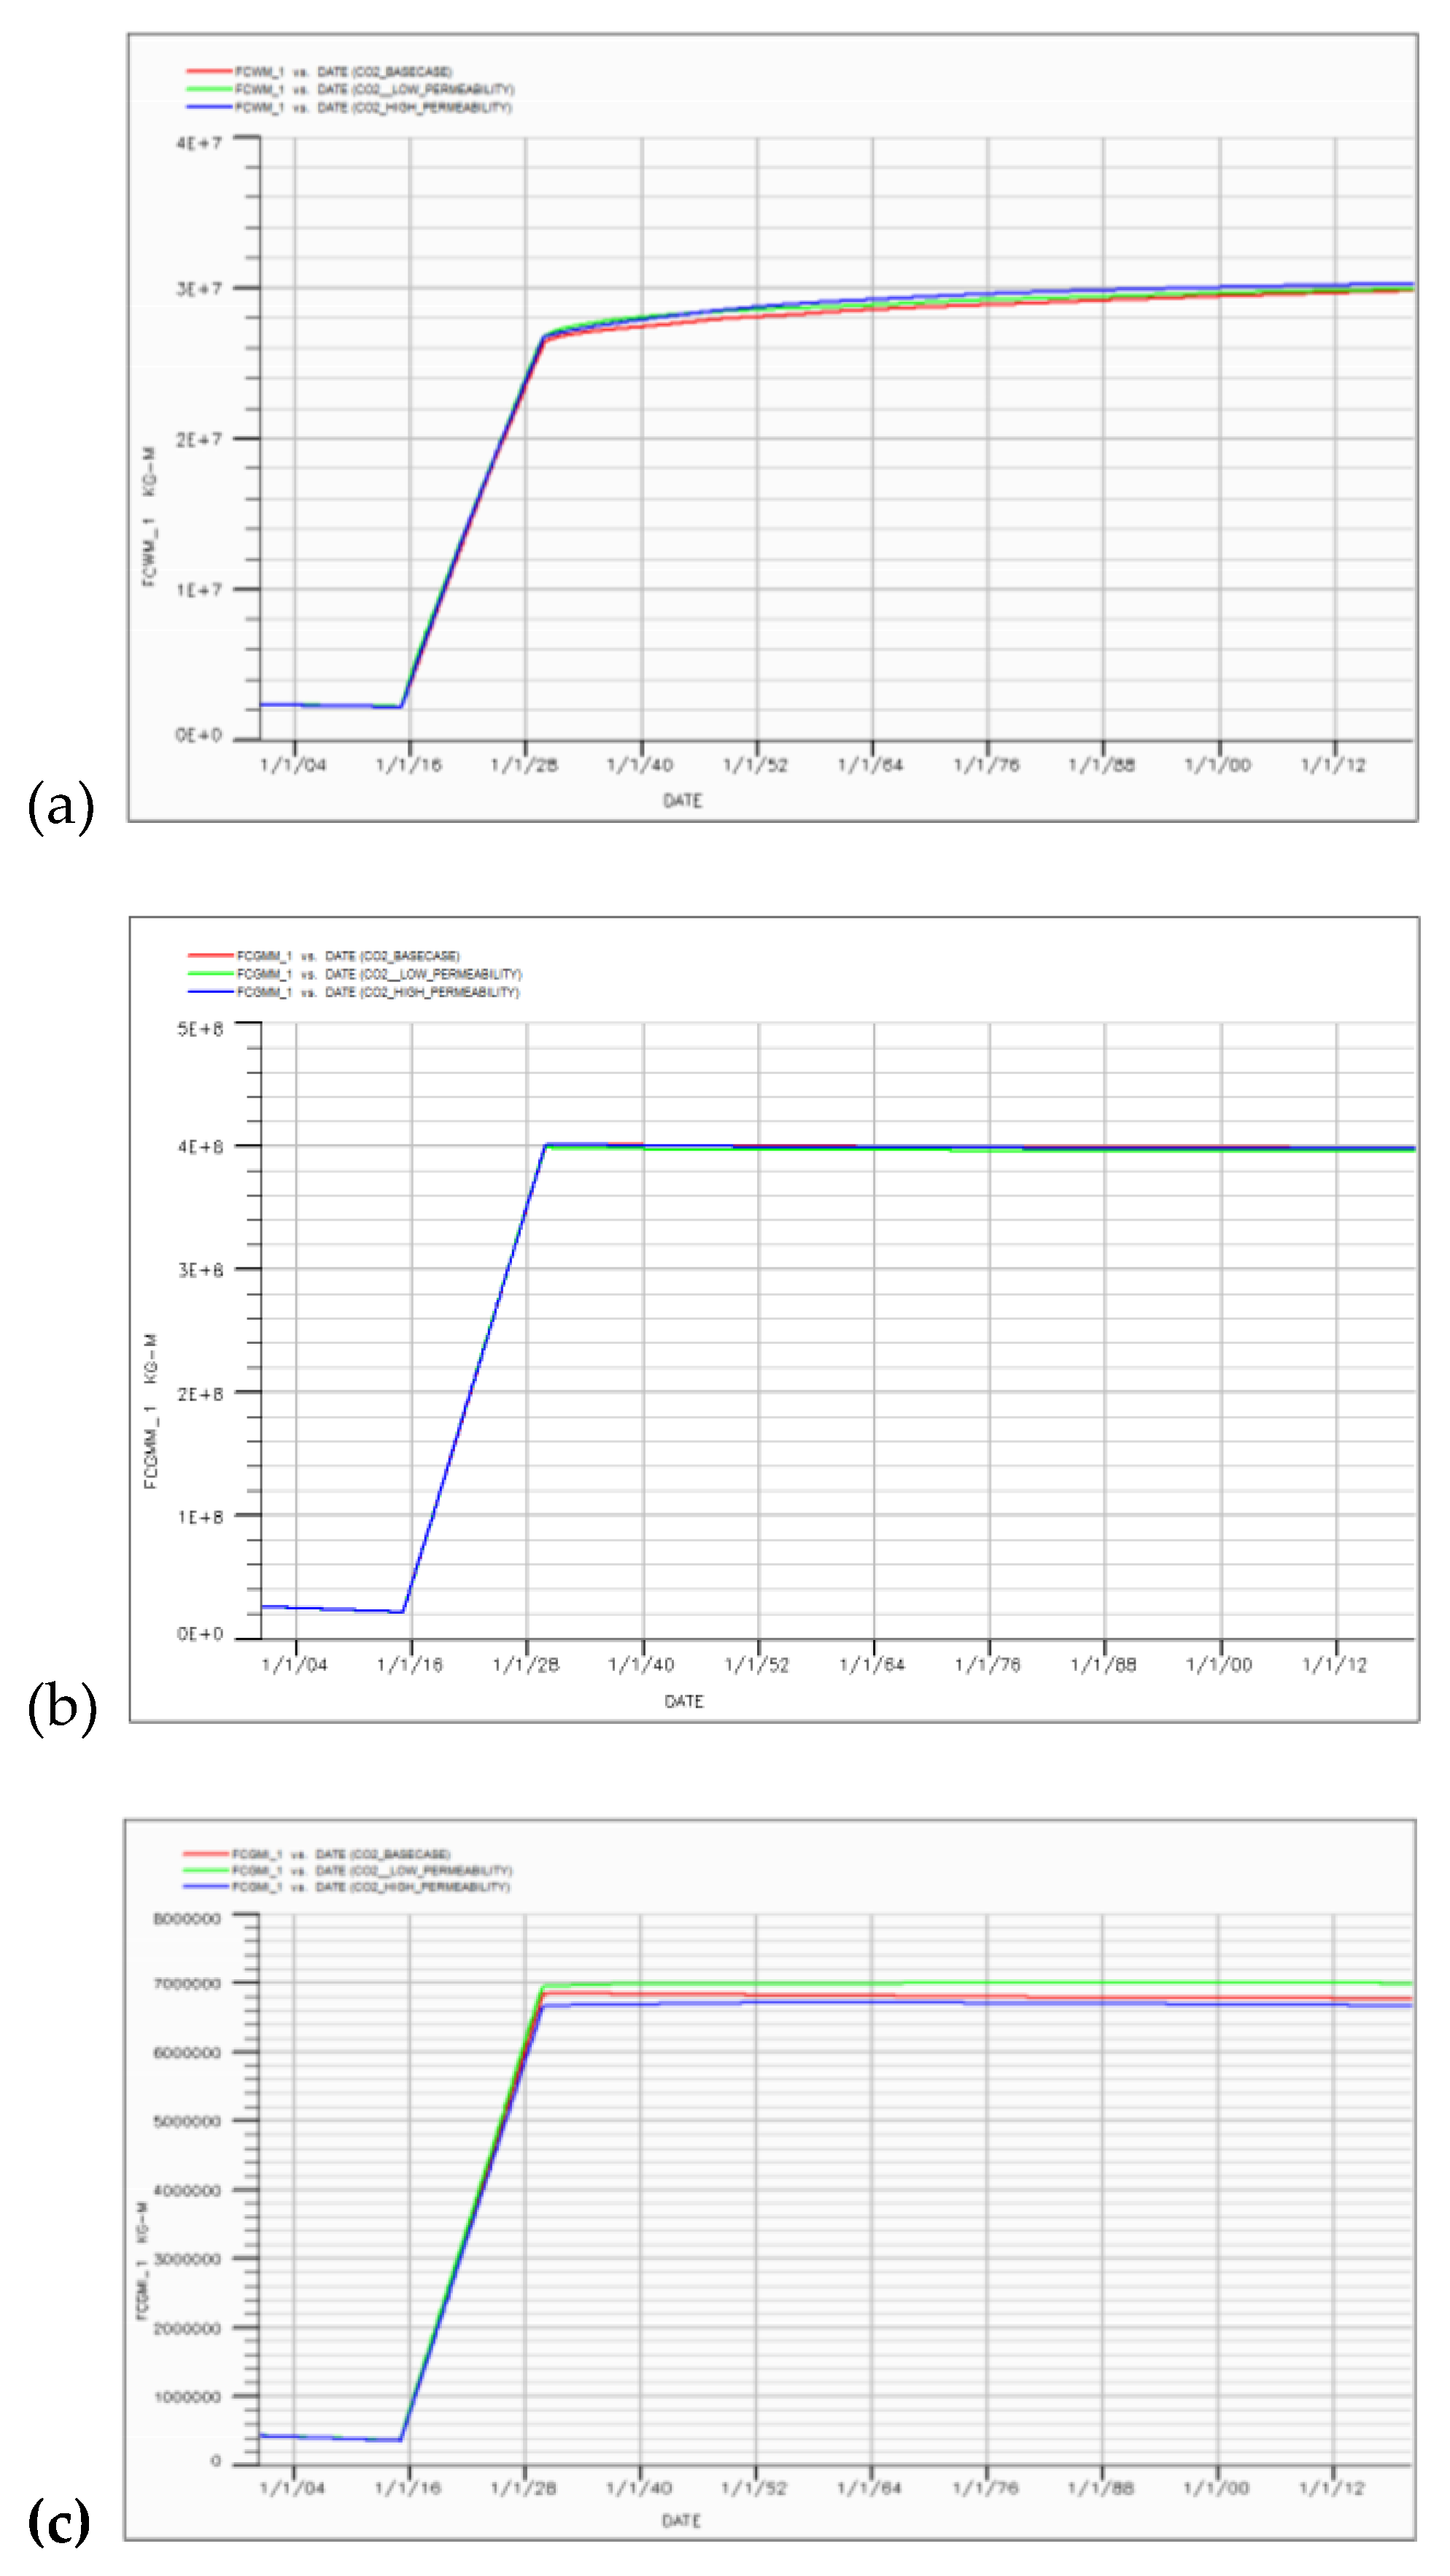
The internal architecture of the reservoir emerged as the primary determinant of the spatial evolution of the CO2 plume. Detailed analysis across the 22 stratigraphic layers indicates that horizontal dispersion is predominantly channeled through high-permeability conduits, whereas vertical flux is constrained by low-permeability baffles. Most notably, the Not-3 shale and Layer 4 characterized by an exceptionally low vertical permeability (Kz = 0.0001mD) functioned as robust internal flow barriers. These geological features effectively retarded the upward buoyant migration of the gas, ensuring a more lateral and controlled distribution.
Under heterogeneous conditions, CO2 saturation maps revealed a pronounced "fingering" phenomenon, with the gas preferentially navigating high-conductivity flow paths. This non-uniform migration increased the interfacial contact area between the supercritical CO2 and the formation brine. Consequently, a quantifiable elevation in solubility trapping was observed relative to idealized, homogeneous models. These findings suggest that the inherent geological complexity of the Norne E-segment serves as a natural mechanism to enhance storage security; by increasing the tortuosity of the flow path, the heterogeneity delays the arrival of the plume at the primary caprock and facilitates more permanent immobilization through dissolution.
Table 3.
Effect of Reservoir Heterogeneity on CO2 trapping mechanism.
| S/N | Case Name | FCWM (Sm3/day) | FCGMM (Sm3/day) | FCGMI (Sm3/day) |
| 1 | Base Case | 2.9772766 × 10⁷ | 3.9788608 × 10⁸ | 6.7686095 × 10⁷ |
| 2 | Low K | 2.9889598 × 10⁷ | 3.9521480 × 10⁸ | 6.990649 × 10⁷ |
| 3 | High K | 3.0244422 × 10⁷ | 3.9755274 × 10⁸ | 6.6665225 × 10⁷ |
Figure 8.
CO2 trapping mechanism and efficiency. (a) CO2 component dissolved in water. (b) CO2 component mobile in gas. (c) CO2 Component trapped in gas.
Figure 8.
CO2 trapping mechanism and efficiency. (a) CO2 component dissolved in water. (b) CO2 component mobile in gas. (c) CO2 Component trapped in gas.
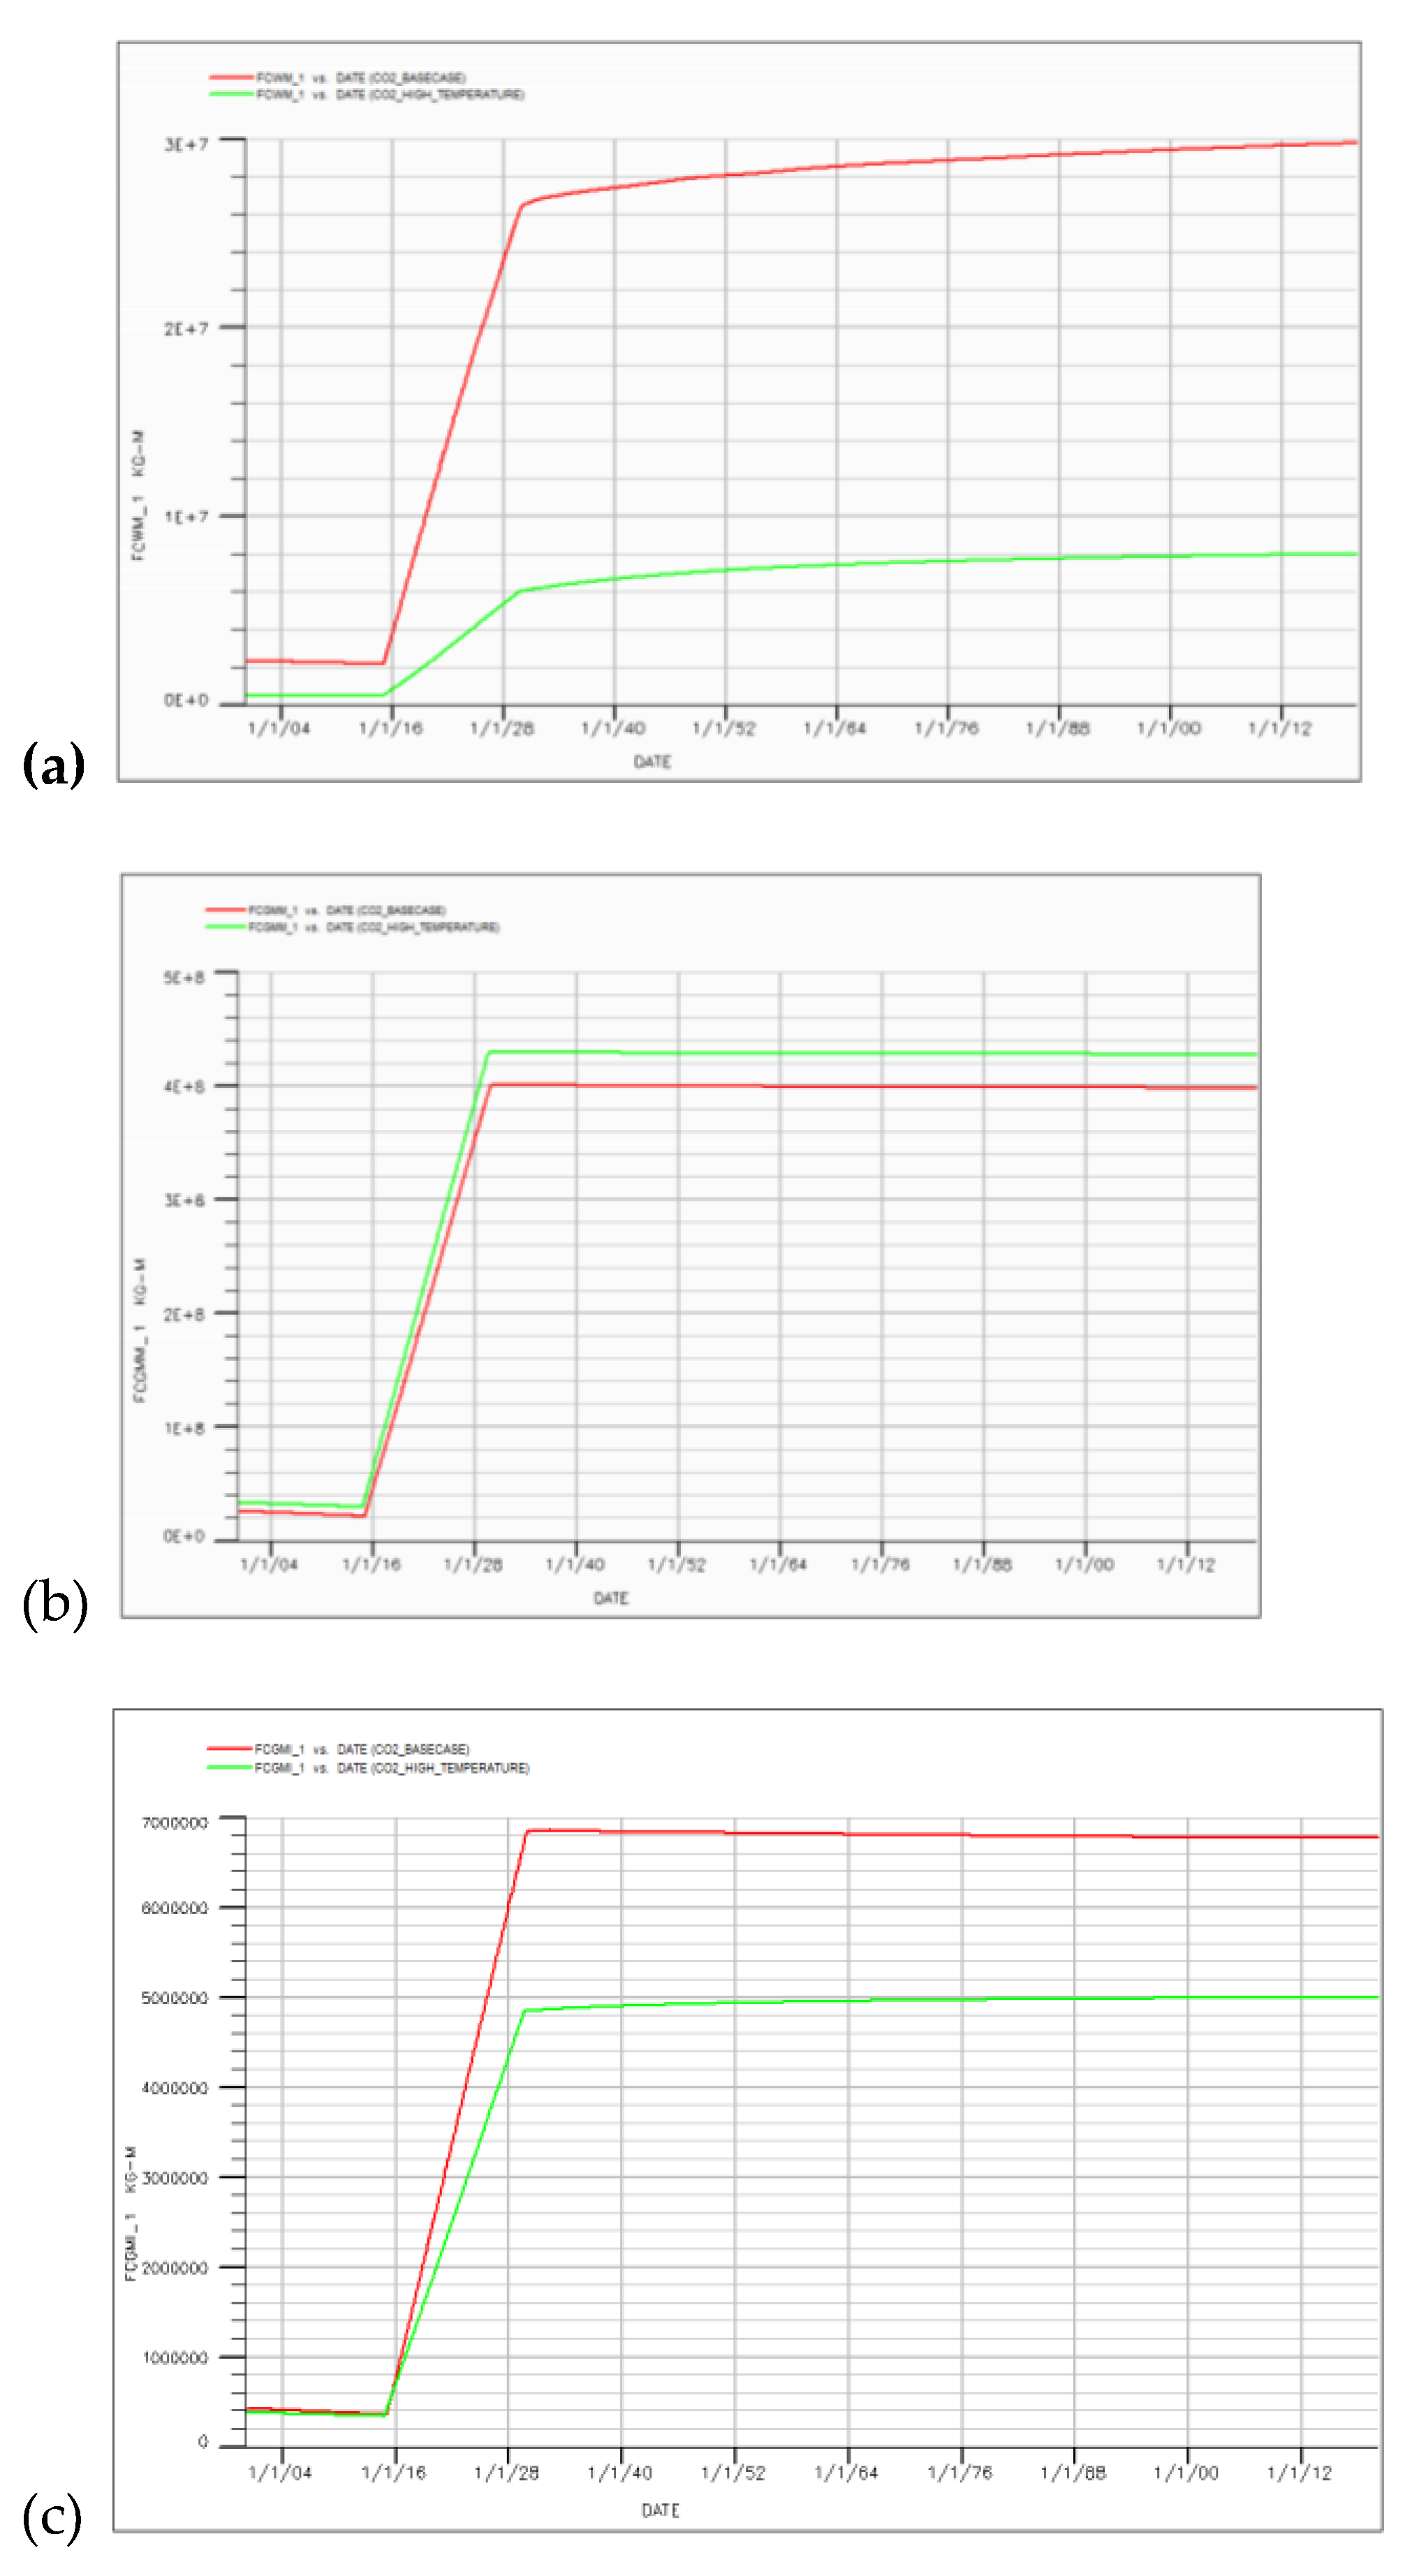
3.3. Thermal Sensitivity and Density Effects
The thermodynamic behavior of CO2 was examined by deviating from the baseline reservoir temperature of 100°C to assess the impact of varying geothermal gradients. The simulation results delineate a clear inverse correlation between temperature and sequestration mass. In scenarios representing higher geothermal gradients, the density of the supercritical CO2 experienced a significant reduction; this volumetric expansion resulted in a 4.5% decrease in the total mass of CO2 that could be accommodated within the available pore volume.
Thermal conditions also exerted a decisive influence on the chemical stability of the plume. Higher temperatures negatively impacted the kinetics of dissolution, as the solubility of CO2 in formation brine is fundamentally diminished as the system warms. This led to a notable shift in phase distribution, with approximately 83.4% of the CO2 remaining in the mobile gas phase which is an increase from the 80.3% initially observed in the base case before increasing temperature. These findings underscore the critical role of accurate thermal mapping during the site selection process, particularly for HPHT reservoirs, where elevated temperatures may inadvertently increase buoyancy-driven migration risks by maintaining a larger fraction of the CO2 in a mobile state.
Table 4.
Effect of Thermal Sensitivity and Density Effect on CO2 trapping mechanism.
| S/N | Case Name | FCWM (Sm3/day) | FCGMM (Sm3/day) | FCGMI (Sm3/day) |
| 1 | Base Case | 2.9772766 × 10⁷ | 3.9788608 × 10⁸ | 6.7686095 × 10⁷ |
| 2 | High Temp. | 7.9997645 × 10⁷ | 4.2737725 × 10⁸ | 4.998374 × 10⁶ |
Figure 9.
CO2 trapping mechanism and efficiency. (a) CO2 component dissolved in water. (b) CO2 component mobile in gas. (c) CO2 Component trapped in gas.
Figure 9.
CO2 trapping mechanism and efficiency. (a) CO2 component dissolved in water. (b) CO2 component mobile in gas. (c) CO2 Component trapped in gas.
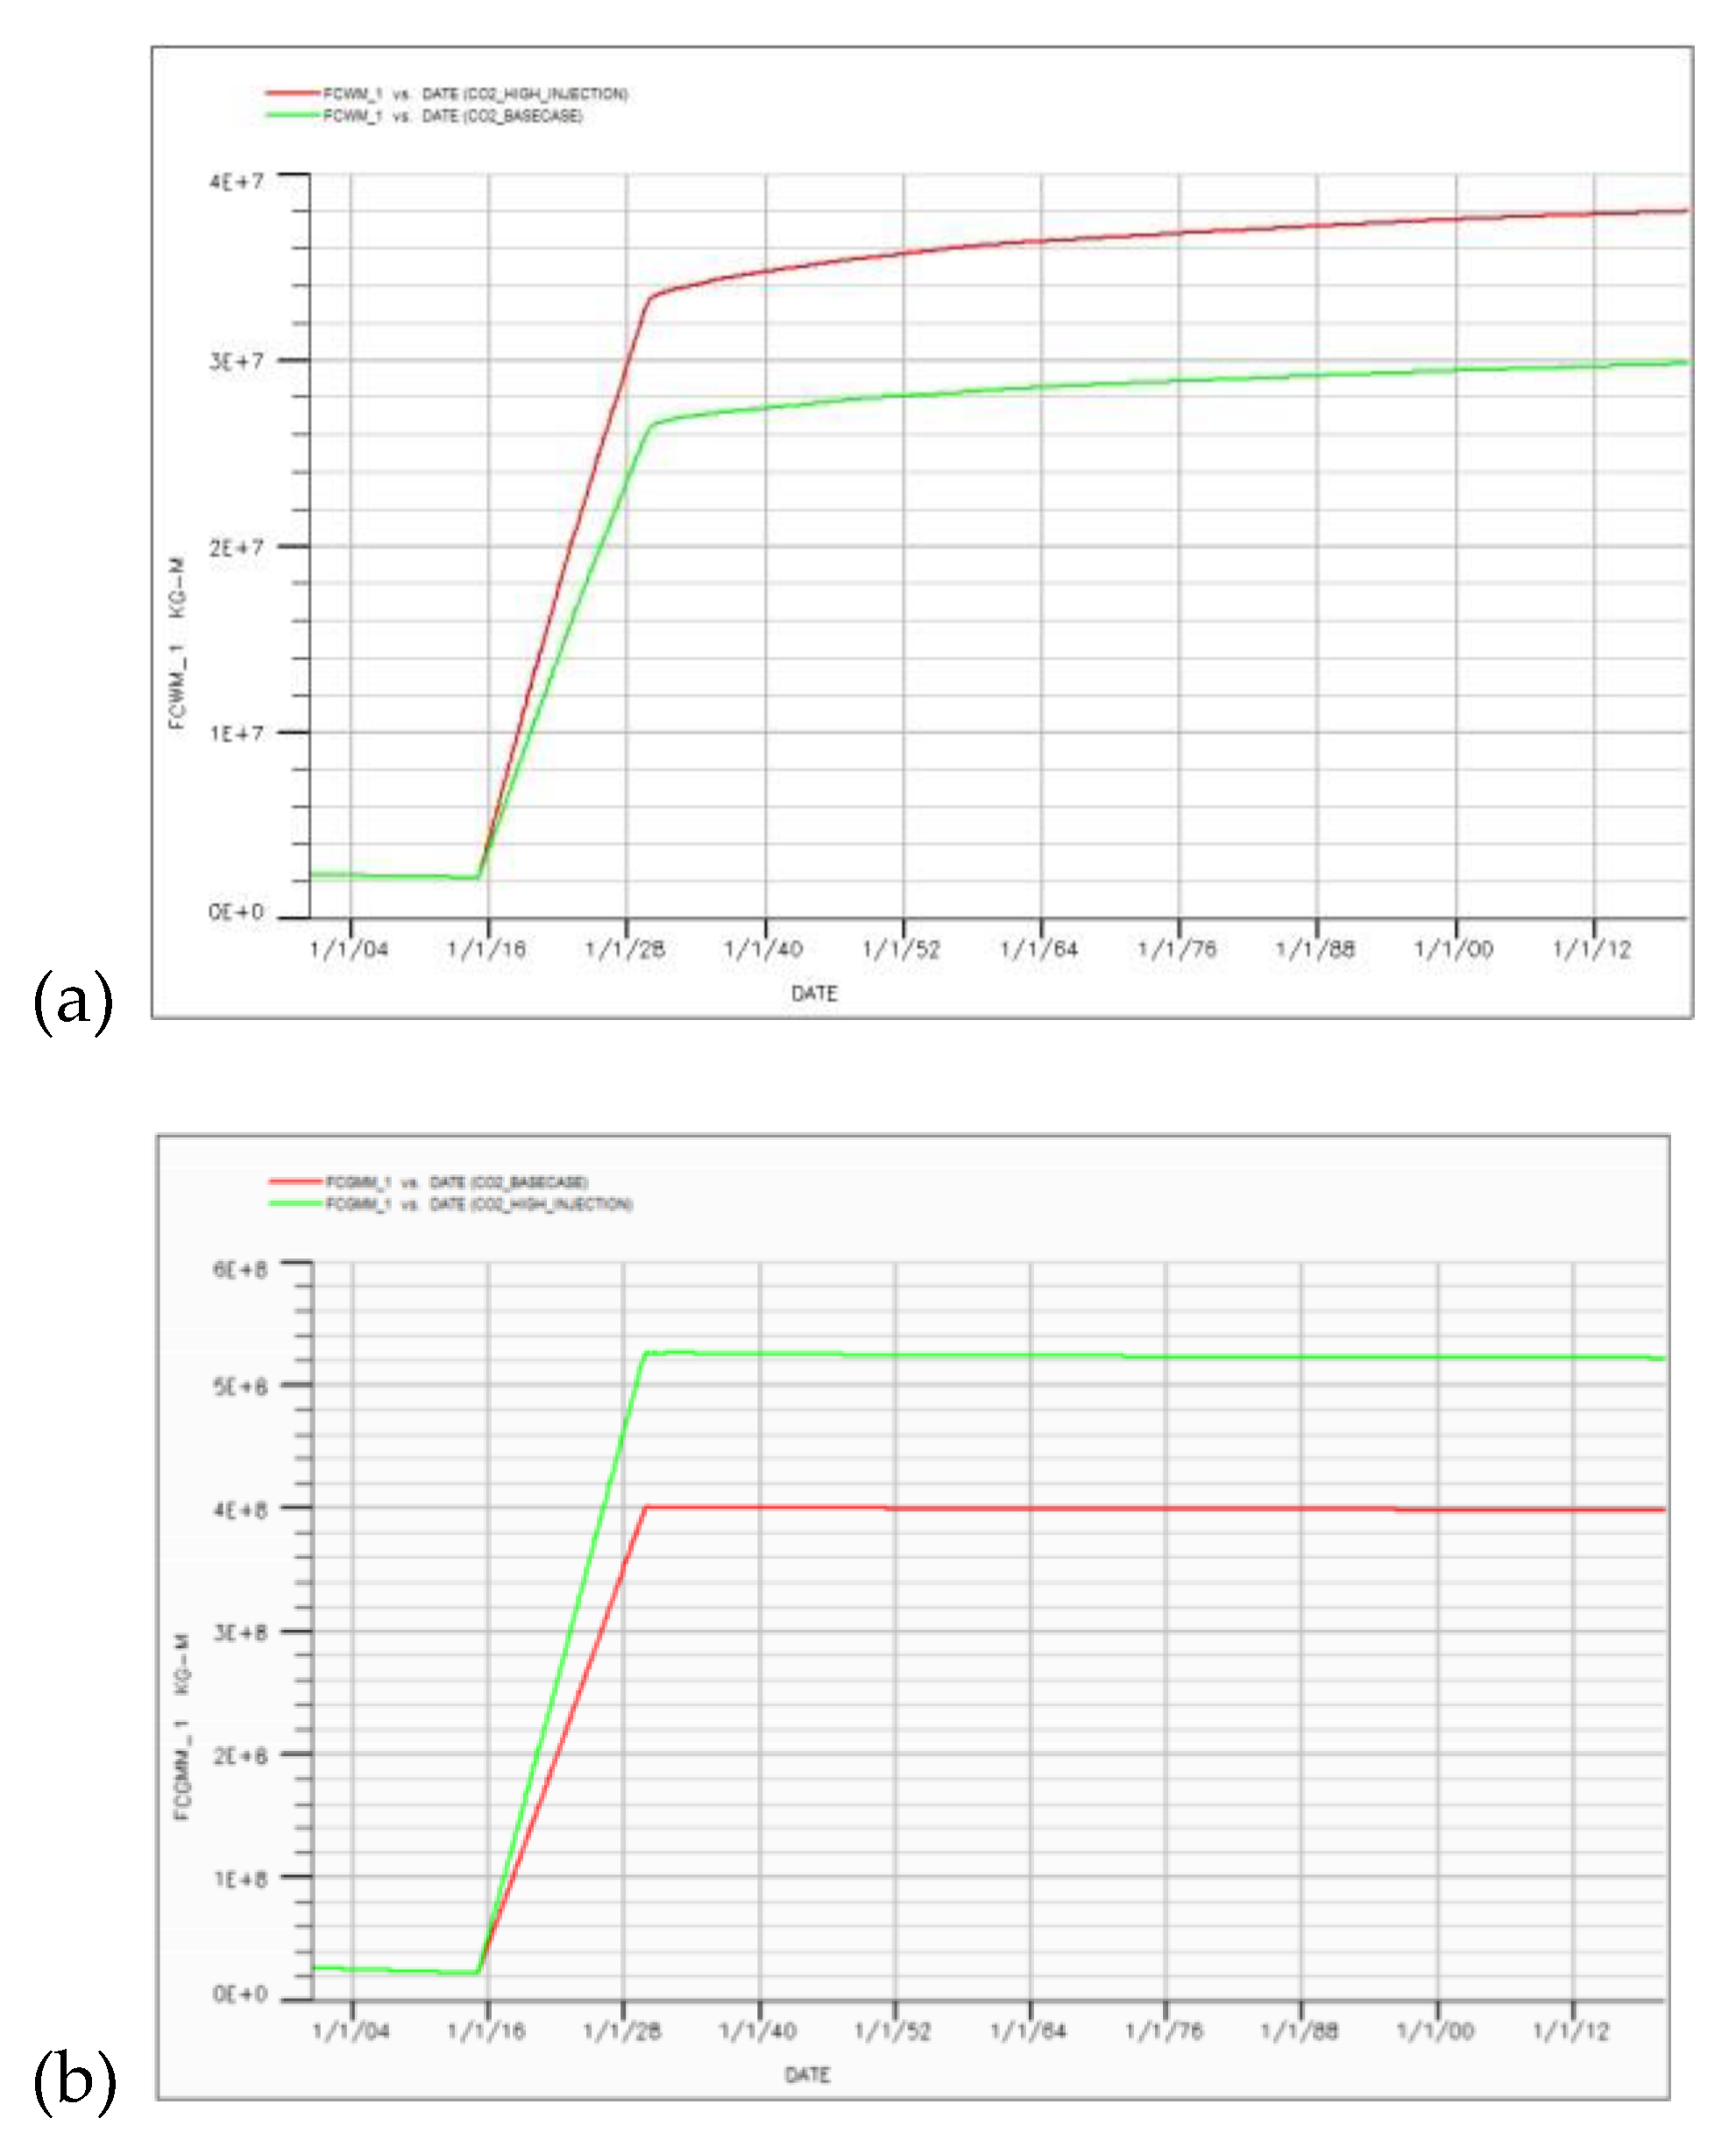
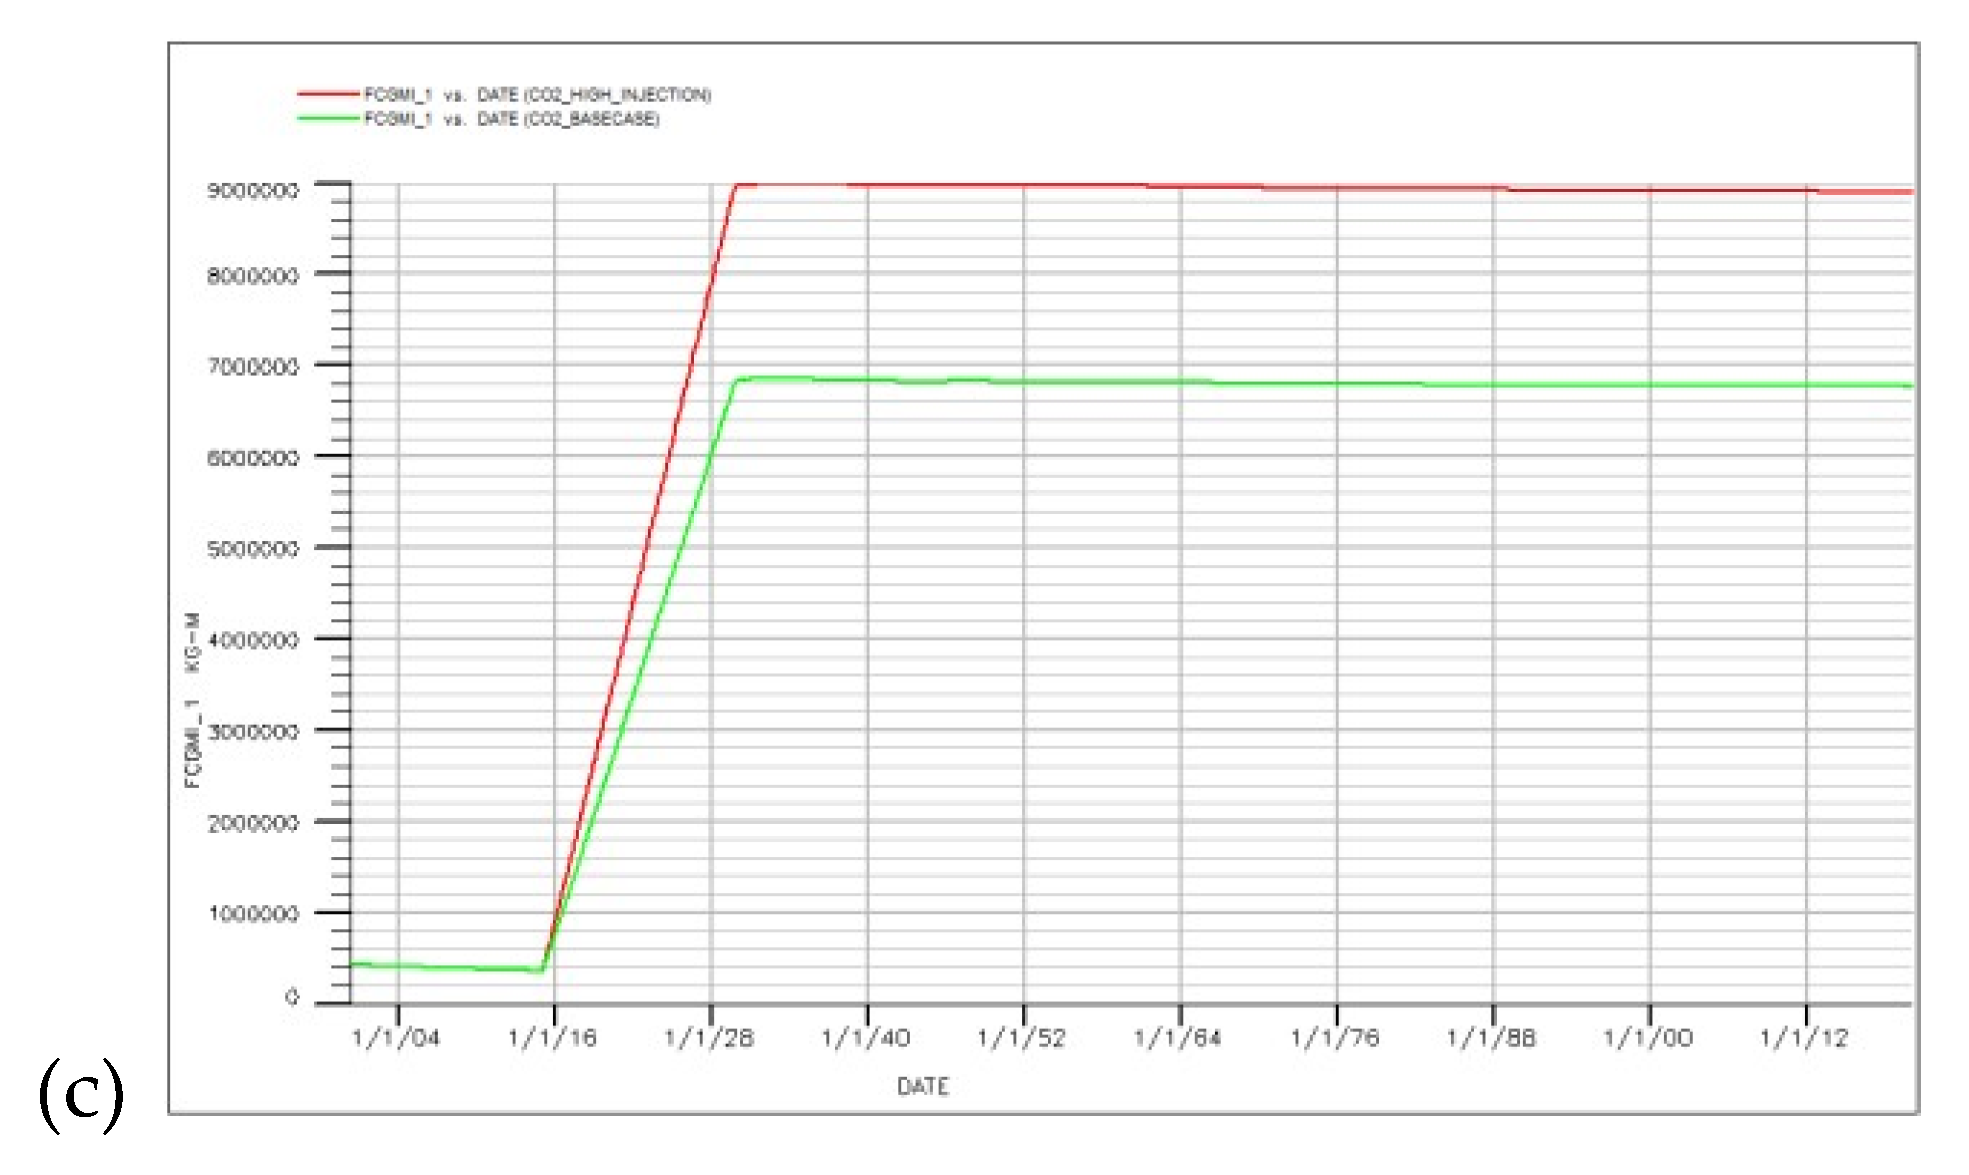
3.4. Operational Constraints: Injection Rate
A comparative analysis of high injection rates of 2,400,000Sm3 (table 5) delineated the geomechanical operating envelope of the Norne E-segment. Sensitivity plots from the simulation reveals that while the 1.8 million Sm3 base case facilitated a homogenous pressure distribution, the elevated 2.4 million Sm3 injection rates induce rapid fluctuations in Bottom Hole Pressure (BHP). At the upper bound of 2.4 million Sm3, localized pressure in the near-wellbore region approached the 200-bar critical threshold stipulated within a five-year window, leaving a narrow margin for error regarding formation fracture.
Conversely, the conservative injection rate adopted in the base case facilitated a more homogeneous pressure distribution throughout the E-segment architecture. This gradual pressure dissipation is instrumental in mitigating the risk of induced micro-fractures within the caprock, thereby preserving the long-term sealing efficiency of the formation. Long-term monitoring results further substantiate that controlled injection regimes foster a more predictable and stable pressure equilibrium following site decommissioning. These findings emphasize that optimizing storage capacity must be balanced against the hydraulic diffusivity of the reservoir to ensure the geomechanical security of the sequestration project over its entire lifecycle.
Table 5.
Effect of Injection Rate on CO2 trapping mechanism.
| S/N | Case Name | FCWM (Sm3/day) | FCGMM (Sm3/day) | FCGMI (Sm3/day) |
| 1 | Base Case | 2.9772766 × 10⁷ | 3.9788608 × 10⁸ | 6.7686095 × 10⁷ |
| 2 | High Injection | 3.7990696 × 10⁷ | 5.2182227 × 10⁸ | 8.898813 × 10⁶ |
Figure 10.
CO2 trapping mechanism and efficiency. (a) CO2 component dissolved in water. (b) CO2 component mobile in gas. (c) CO2 Component trapped in gas.
Figure 10.
CO2 trapping mechanism and efficiency. (a) CO2 component dissolved in water. (b) CO2 component mobile in gas. (c) CO2 Component trapped in gas.
3.5. Quantification of Trapping Mechanisms and Storage Efficiency
By the simulation’s conclusion in 2120, the 495.35 × 10⁶Sm3 of sequestered CO2 was systematically partitioned into three distinct trapping states. This distribution represents the evolution of the plume from a mobile, buoyant phase into more secure, immobilized fractions. Structural trapping remains the primary containment mechanism, with the structural closure of the Norne E-segment effectively isolating the majority of the free-phase gas. However, the simulation also tracked a progressive transition toward more permanent immobilization through residual and solubility trapping.
The results demonstrate that as the plume migrates laterally and interacts with the reservoir's complex architecture, a significant volume becomes trapped within the pore spaces (residual trapping) or dissolves into the formation brine (solubility trapping). This shift in the storage state significantly reduces the risk of vertical leakage, as the fraction of CO2 susceptible to buoyancy-driven migration decreases over the century-long monitoring period. This quantitative breakdown confirms that the combination of the E-segment’s structural integrity and its favorable fluid-rock interactions creates a highly secure environment for centennial-scale carbon storage.
The mass balance results are summarized in the table below:
Table 6.
Mass Balance of CO2 trapped.
| Trapping Mechanism | Volume Stored (106Sm3) | Percentage (%) |
| Structural Trapping (Mobile Gas) | 397.89 | 80.3% |
| Residual Trapping (Immobile Gas) | 67.69 | 13.7% |
| Solubility Trapping (Dissolved) | 29.77 | 6.0% |
| Total Sequestered | 495.35 | 100% |
3.6. Limitations and Future Work (Expanded)
Despite its comprehensive scope, this study has several limitations:
- Geochemical reactions between CO2, brine, and rock minerals were not modeled.
- Geomechanical effects, including fault reactivation and caprock deformation, were neglected.
- Uncertainty quantification was deterministic rather than probabilistic.
Future work should incorporate coupled compositional–geochemical–geomechanical modeling frameworks and apply Monte Carlo uncertainty analysis to assess risk envelopes. Integration with seismic monitoring simulations would further enhance predictive capability.
4. Conclusions
This research provides a rigorous assessment of pure CO2 sequestration within the Norne E-segment, utilizing ECLIPSE 300 to bridge the gap between theoretical modeling and operational reality. The results confirm that depleted gas reservoirs represent a premier category of carbon sinks, characterized by exceptional injectivity and predictable pressure dynamics. By repurposing these well-characterized formations, the transition from hydrocarbon extraction to carbon storage can be achieved with a high degree of geomechanical confidence and structural certainty.
The sensitivity analysis identifies vertical permeability anisotropy and injection velocity as the primary "governors" of subsurface plume behavior. These findings reveal that geological heterogeneities, often viewed as complexities, actually function as vital mechanisms for enhancing storage security by retarding buoyant rise and promoting solubility trapping. Ultimately, this study reinforces the technical mandate for EOS-based compositional simulation; simplified models lack the resolution required to capture the phase behaviors and density-driven flows that define storage integrity. These insights offer a refined framework for project developers and regulatory bodies, providing a validated methodology for the design, screening, and safe implementation of industrial-scale sequestration initiatives.
Nomenclature
| PC: Capillary Pressure <: less than >: greater than A: reaction surface area c: capillary, critical C: specific heat capacity CH4: Methane CO2: Carbon Dioxide Gas D: diffusivity eq: equilibrium f: function fms: formations Gt: Giga tons hgrid: grid spacing in the computational domain hres: Reservoir Thickness H2O: Water Kr: relative permeability K; Permeability m: meters mD: milli Darcy P: Pressure Pres: Reservoir Pressure Pwf: Wellbore Flowing Pressure r: Pore Radius R: universal gas constant s: saturation Sgr: Residual Gas Saturation Sm3: Standard cubic meter Sw: Water saturation Swc: Connate Water Saturation T: temperature t: time x, y, z: Cartesian coordinates X: mole fraction ρ: density ϕ: porosity CCS: Carbon Capture and Storage CCUS: Carbon capture, Utilization and Storage EOR: Enhanced Oil Recovery EGR: Enhanced Gas Recovery GWC: Gas Water Contact IEA: International Energy Agency IPCC: International Panel on Climate Change O&G: Oil and Gas PVT: Pressure Volume Temperature Cr: Rock compressibility FCWM: CO2 component dissolved in water FCGMM: CO2 component mobile in gas FCGMI: CO2 Component trapped in gas |
References
- Bachu, S. Sequestration of CO2 in geological media: Criteria and approach for site selection in response to climate change. Energy Conversion and Management 2000, 41(9), 953–970. [Google Scholar] [CrossRef]
- Benson, S. M.; Cole, D. R. CO2 sequestration in deep sedimentary formations. Elements 2008, 4(5), 325–331. [Google Scholar] [CrossRef]
- Coats, K. H. An equation of state compositional model. Society of Petroleum Engineers Journal 1985, 25(3), 363–376. [Google Scholar] [CrossRef]
- Hughes, D. S. Carbon storage in depleted gas fields: Key challenges. Energy Procedia 2008, 1(1), 2273–2280. [Google Scholar] [CrossRef]
- IEAGHG. Case Studies of CO2 Storage in Depleted Oil and Gas Fields (Report 2017-01). 2017.
- Jackson, C.; Krevor, S.; Breen, A. L. An estimate of the amount of geological CO2 storage over the period of 1996–2020. Environmental Science & Technology Letters 2022, 9(7), 604–610. [Google Scholar] [CrossRef]
- Li, S.; Ma, Y.; Zhang, W. A modeling study of CO2 storage in depleted gas reservoirs. Journal of Petroleum Science and Engineering 2006, 53(3-4), 213–222. [Google Scholar]
- Nghiem, L.; et al. Modeling CO2 storage in depleted gas reservoirs. SPE Reservoir Evaluation & Engineering 2009, 12(2), 213–222. [Google Scholar]
- Rutqvist, J. The geomechanics of CO2 storage. International Journal of Geomechanics 2012, 12(5), 1–14. [Google Scholar]
- Rwechungura, R. W.; Haukås, J.; Linge, A. Simulation-based evaluation of CO2 storage in the Norne Field, Norwegian Sea. International Journal of Greenhouse Gas Control 2010, 4(4), 589–598. [Google Scholar]
- Zhang, K.; Ma, D.; Li, S.; Chen, X. Solubility of CO2 in brine and reservoir oil for depleted reservoirs in China. Journal of Applied Solution Chemistry and Modeling 2014, 3(4), 194–201. [Google Scholar] [CrossRef]
Figure 3.
Process Flow Diagram.

Figure 4.
(a) Lateral Distribution of Horizontal Permeability (b) Porosity Variations.
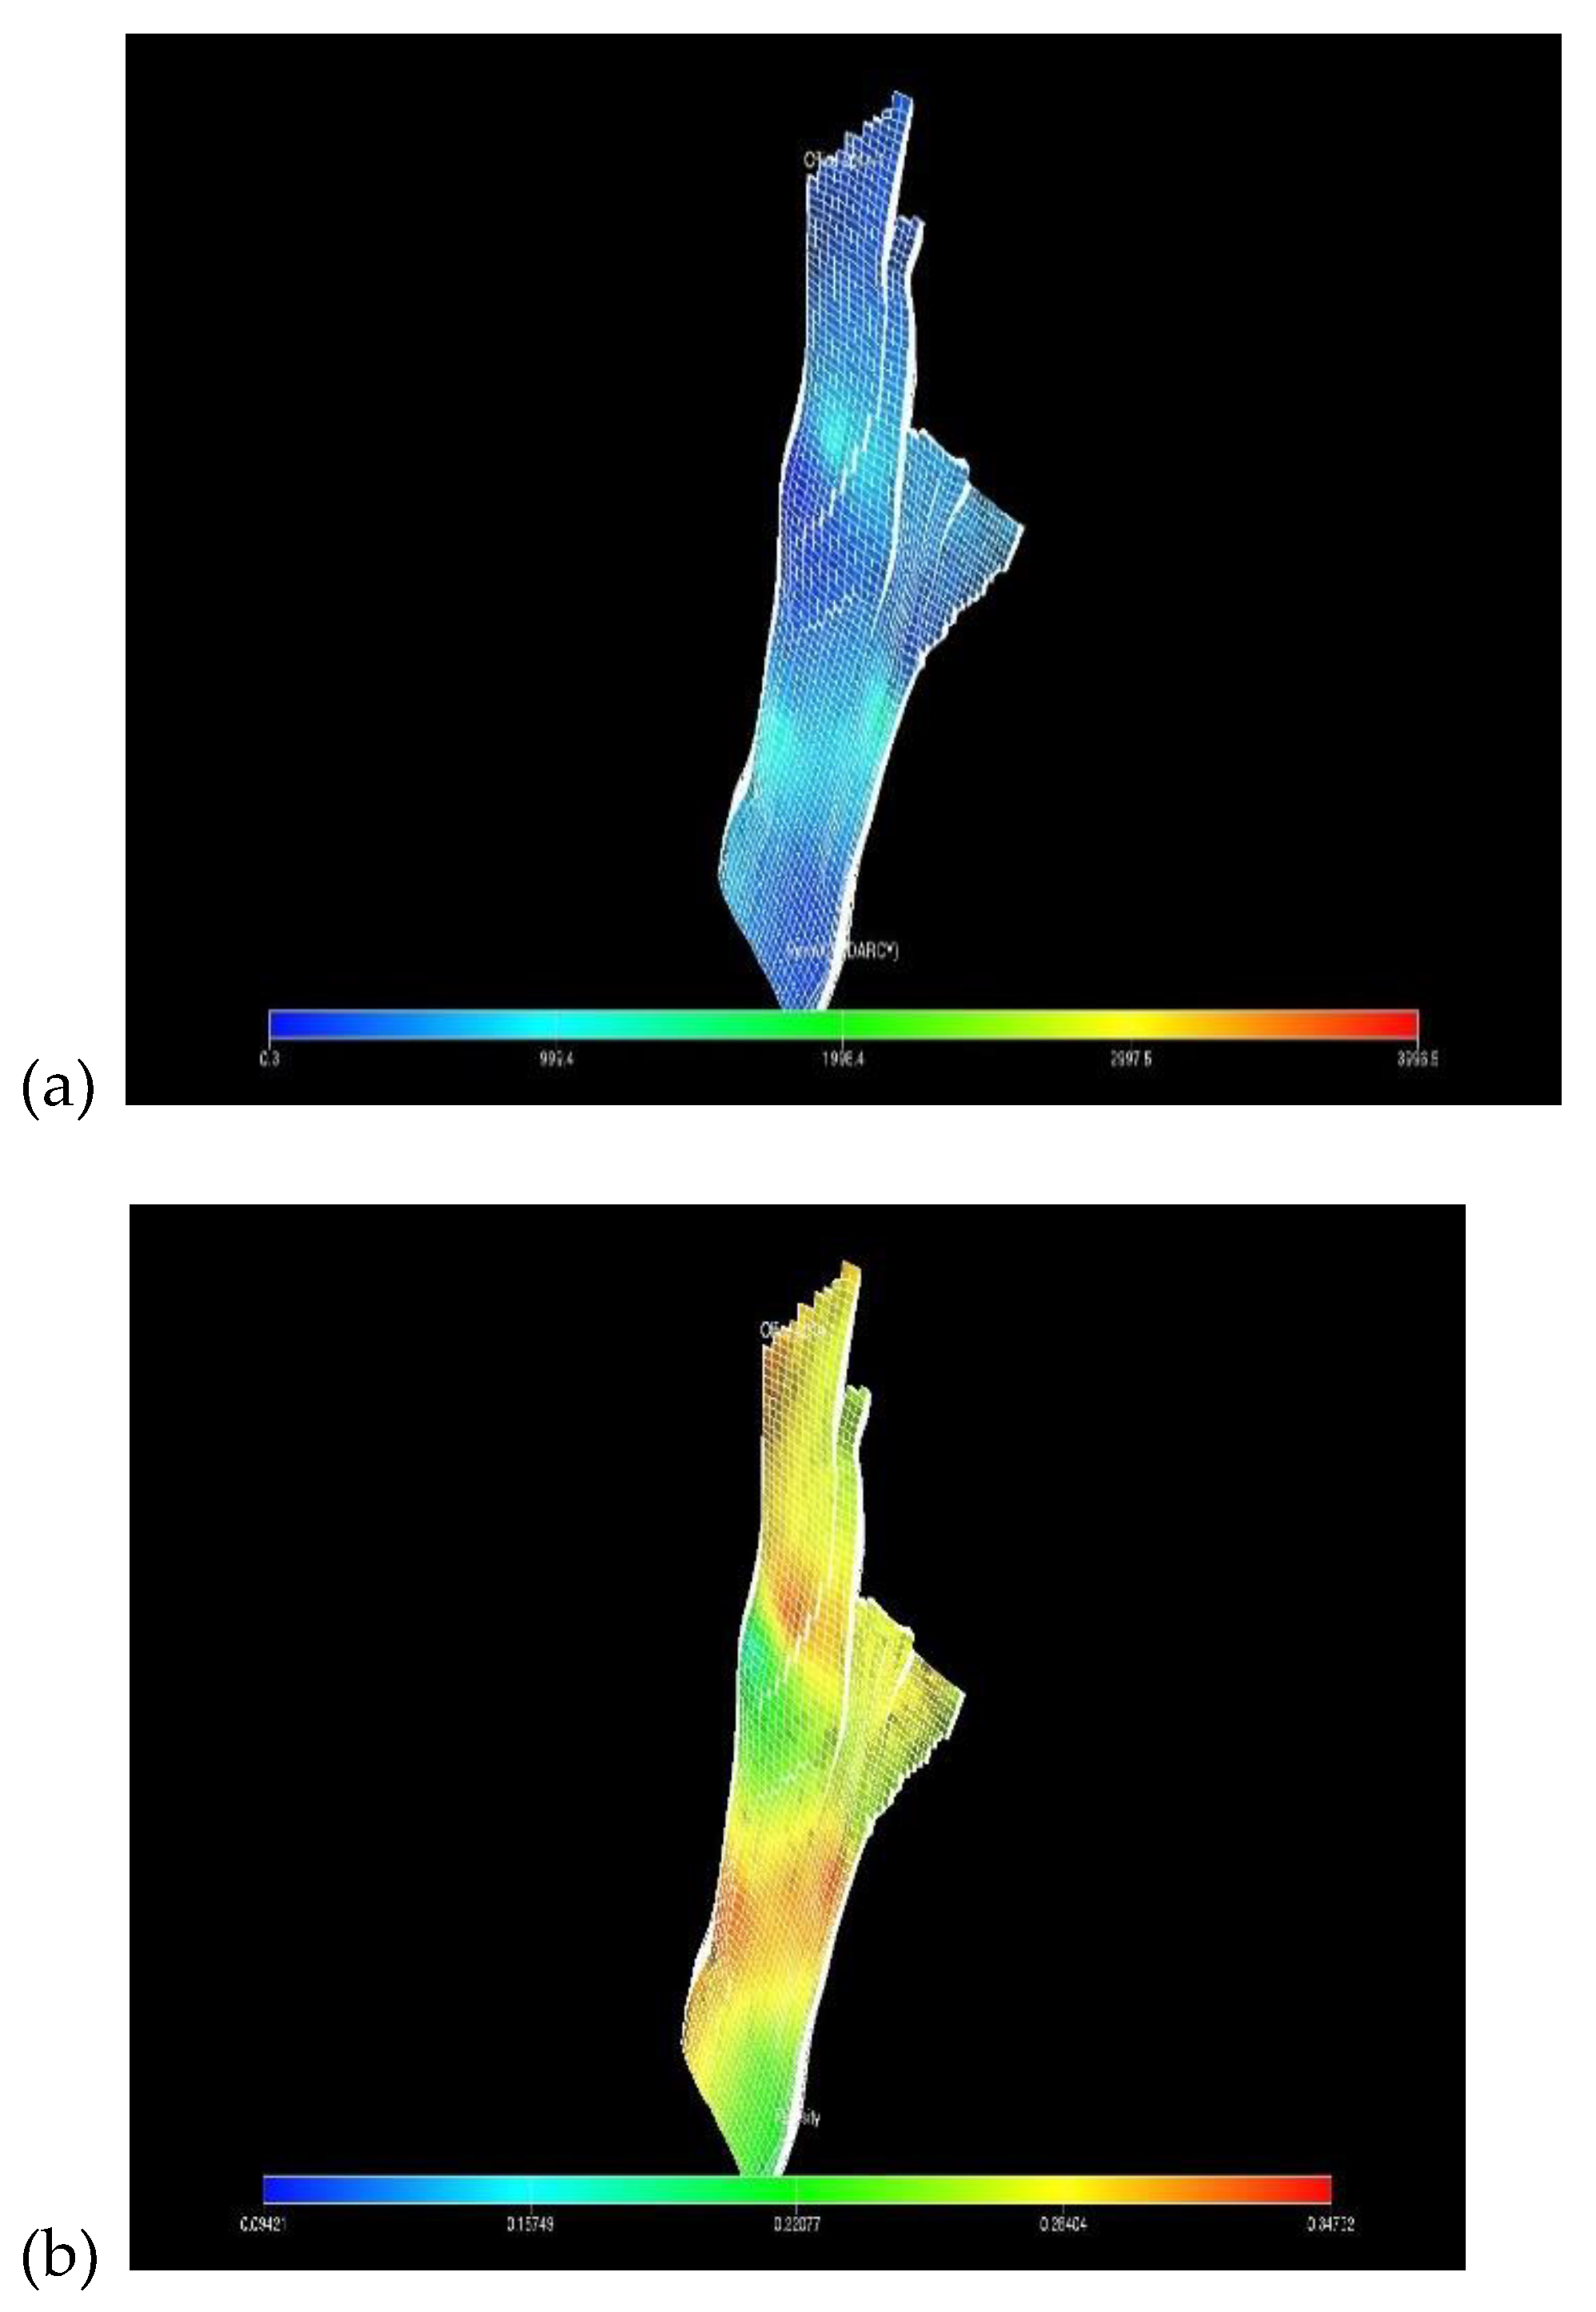
Figure 5.
x-direction cell configuration.
Disclaimer/Publisher’s Note: The statements, opinions and data contained in all publications are solely those of the individual author(s) and contributor(s) and not of MDPI and/or the editor(s). MDPI and/or the editor(s) disclaim responsibility for any injury to people or property resulting from any ideas, methods, instructions or products referred to in the content. |
© 2026 by the authors. Licensee MDPI, Basel, Switzerland. This article is an open access article distributed under the terms and conditions of the Creative Commons Attribution (CC BY) license (http://creativecommons.org/licenses/by/4.0/).
Copyright: This open access article is published under a Creative Commons CC BY 4.0 license, which permit the free download, distribution, and reuse, provided that the author and preprint are cited in any reuse.


