Submitted:
06 February 2026
Posted:
09 February 2026
You are already at the latest version
Abstract
The zebrafish (Danio rerio) is a widely used model for studying retinal regeneration. In adults, light-induced retinal damage (LIRD) serves as an environmental phototoxic stressor that induces photoreceptor degeneration and regenerative responses, whereas larval models remain comparatively underexplored. In this study, we validate a larval LIRD paradigm as a versatile system for studying acute phototoxic injury and early regeneration-associated transcriptomic responses. Using high-throughput RNA sequencing, we profiled retinal transcriptional changes 48 hours post-LIRD and complemented these findings with targeted pharmacological modulation of redox signaling. Larval LIRD induced robust activation of canonical apoptotic and regeneration-associated pathways, recapitulating key features of adult LIRD models while engaging previously underexplored gene-regulatory networks. Among these, pathways related to oxidative stress responses, antioxidant enzymes, and oxygen metabolism were prominently regulated. Functional attenuation of oxidative stress using N-acetylcysteine reduced phototoxic injury-induced apoptosis and proliferation, while inflammatory markers remained largely unaffected. Conversely, subtoxic intra-retinal hydrogen peroxide exposure was sufficient to induce proliferative markers without eliciting apoptosis response. At the signaling level, modulation of oxidative stress influenced components of growth-associated signaling pathways activated during early injury response. Together, these findings support a role for oxidative stress as a key component of early injury-associated signaling in larval retinal regeneration. This study validates larval LIRD as a versatile experimental model and provides a transcriptomic resource for investigating redox-associated mechanisms underlying retinal injury and repair.
Keywords:
zebrafish (Danio rerio)
; light-induced retinal damage (LIRD)
; phototoxicity
; LIRD
; retinal regeneration
; Müller glia
; oxidative stress
; N-acetylcysteine (NAC)
; antioxidants
; transcriptomics
1. Introduction
The zebrafish (Danio rerio) retina exhibits a regenerative capacity absent in mammals, making it a powerful system for investigating the mechanisms underlying successful neuronal repair [1,2]. Following injury, Müller glia (MG), the principal glial cells of the retina, re-enter the cell cycle, dedifferentiate into a progenitor-like state, and generate multipotent progenitors capable of differentiating into all major retinal neuron types [3,4,5]. Among the commonly used injury paradigms is light-induced retinal damage (LIRD), in which photoreceptors rapidly degenerate due to excess of photo-oxidative stress [6,7,8,9,10,11,12,13,14,15,16,17]. Building on this and other retinal injury paradigms, numerous studies have identified molecular programs that drive MG reprogramming and neuronal regeneration, highlighting coordinated interactions among inflammatory signaling, chromatin remodeling, and transcriptional regulation [18,19,20,21,22,23,24,25,26,27,28,29,30,31,32,33]. Cross-species single-cell and bulk transcriptomic comparisons have further delineated conserved and divergent aspects of MG activation across zebrafish, chick, and mouse retinae, particularly in adult injury models [34,35,36,37,38]. However, the earliest molecular events occurring within 48-72 hours after injury remain undercharacterized, despite their crucial role in establishing a pro-regenerative transcriptional landscape.
Larval zebrafish provide unique advantages for dissecting such early responses. Their optical transparency, rapid development, small size, and compatibility with high-throughput imaging, sequencing and drug screening enable systematic interrogation of acute molecular dynamics in vivo. While LIRD has been extensively used in adult zebrafish to study photoreceptor injury and MG activation [8,13,26,30,39], a comprehensive characterization of transcriptional changes in larvae is lacking. This gap limits the adoption of larval LIRD as a scalable discovery platform for regenerative biology.
In this study, we profile retinal responses 48 hours post-LIRD (HPL) in pigmented zebrafish larvae using a multimodal experimental approach. We define the acute transcriptional landscape associated with phototoxic injury and confirm early re-engagement of established regeneration-associated effectors, including ascl1a, stat3, and sox2, within this time window. In addition to these canonical responses, our analyses highlight several less-characterized injury-associated signaling modules, including proteolytic and extracellular matrix remodeling pathways, hemoglobin-related metabolic and oxygen-handling programs, phototransduction network rearrangement, and altered Rev-erb nuclear receptor signaling.
Pharmacological attenuation of oxidative stress and controlled hydrogen peroxide exposure further support the view that modulation of reactive oxygen species is a prominent feature of the early retinal injury response, potentially contributing to the regulation of apoptotic and proliferative processes. While these observations do not establish direct causal relationships, they underscore the relevance of redox-associated signaling during the initial phases following phototoxic damage.
Together, these findings support larval LIRD as a rapid, scalable, and experimentally tractable model for studying acute retinal injury responses. The experimental approaches and transcriptomic resources presented here provide a foundation for future functional investigations into both canonical and non-canonical programs involved in the initiation of retinal regeneration, as well as their potential interactions with redox-sensitive pathways. More broadly, this larval model offers a versatile in vivo platform for exploring ROS-associated injury-repair dynamics in the regenerating vertebrate retina.
2. Materials and Methods
2.1. Zebrafish Husbandry, LIRD Paradigm, and N-Acetylcysteine Treatment
All zebrafish procedures were conducted in accordance with the institutional guidelines of the University of Trento and approved by the Italian Ministry of Health (authorization no. 707/2025-PR). Wild-type TU zebrafish were maintained under standard laboratory conditions at 28 °C on a 14:10 h light/dark cycle. Embryos were collected in Petri dishes and incubated in the dark at 28 °C in 1× E3 medium.
For the light-induced retinal damage (LIRD) paradigm, groups of 50 embryos at 4 dpf were transferred to a beaker containing 1× E3 medium without methylene blue. The beaker was covered with aluminum foil to enhance light reflection and exposed to intense bright light (50,000 lux) for 3.5 h. Illumination was delivered simultaneously from above and below using a stereomicroscope system (SteREO Discovery.V8, Carl Zeiss) equipped with a dual-arm fiber-optic halogen light source (Leica KL 1500 LCD; Osram 64634 HLX lamp). Temperature was continuously monitored and maintained at 28 °C throughout the exposure. Following LIRD, embryos were returned to dark conditions for recovery. At 48 h post-LIRD, embryos were anesthetized with tricaine (MS222, 160mg/L) and retinae were dissected under a stereomicroscope for downstream analyses.
N-acetylcysteine (NAC) was freshly prepared in 1× E3 medium for each experiment. Immediately after LIRD, groups of 50 embryos were transferred to Petri dishes containing E3 supplemented with 100 µM NAC and allowed to recover under dark conditions. After 48 h, retinae were collected and processed for Western blot or RT-qPCR analyses.
2.2. H2O2 Intra-Retinal Injection
Larvae at 4 dpf were anesthetized with MS222 and positioned dorsally, with one side laying on the edge of a glass slide. Using a glass capillary (Harvard Apparatus; 30-0019) connected to a microinjector (FemtoJet 4X, Eppendorf), 3 nL of a 100 µM H2O2 solution was injected into each retina. Phosphate-buffered saline (PBS) was used as a vehicle control.
After injection, larvae were allowed to recover under dark conditions at 28 °C in a petri dish and E3 embryo medium. At 48 h post-injection, retinae were collected and processed for Western blot or RT-qPCR analyses.
2.3. Western Blot
Pools of 50 retinae were collected, washed in cold PBS, and lysed in Laemmli lysis buffer. Protein extracts were resolved on 8–16% Mini-PROTEAN TGX precast gels (Bio-Rad) and transferred onto nitrocellulose membranes (Bio-Rad, 1620264). Membranes were blocked for 1 h at room temperature (RT) in either 5% non-fat milk or 5% BSA with gentle shaking, followed by overnight incubation with primary antibodies at 4 °C.
After three washes in TBST, membranes were incubated with HRP-conjugated secondary antibodies for 1 h at RT. Signal detection was performed using SuperSignal West Femto chemiluminescent substrate (Thermo Scientific, 34075) and acquired on a Bio-Rad ChemiDoc XRS imaging system. Densitometric analyses were performed using Image Lab software (version 4.1, Bio-Rad Laboratories).
A complete list of primary and secondary antibodies used for Western blotting, including working concentrations, is provided in Supplementary Table S1.
2.4. RNA Isolation, Quality Control, and RT-qPCR
Total RNA was extracted using TRIzol reagent (Invitrogen, 15596026) according to the manufacturer’s instructions. RNA pellets were resuspended in RNase-free water and quantified using the Qubit RNA HS Assay Kit (Thermo Fisher Scientific, Q32852). RNA integrity was assessed using an Agilent 2100 Bioanalyzer with RNA 6000 Nano Chips. Only samples with an RNA Integrity Number (RIN) ≥ 7 and OD260/280 ratios between 1.9 and 2.1 were used for downstream analyses.
Reverse transcription was performed using the RevertAid First Strand cDNA Synthesis Kit (Thermo Fisher Scientific, K1622) with random hexamer primers. Quantitative real-time PCR (RT-qPCR) was carried out on a CFX96 Real-Time PCR Detection System (Bio-Rad Laboratories, 3600037) using iTaq Universal SYBR Green Supermix (Bio-Rad, 1725121) in 10 µL reaction volumes, following the manufacturer’s instructions.
Data were analyzed using CFX Manager software (version 1.6, Bio-Rad) and expressed as relative gene expression levels using the 2−ΔΔCt method, normalized to control samples. The housekeeping gene ube2a was used for normalization. All reactions were performed in technical triplicates. Primer sequences are listed in Supplementary Table S2.
2.5. Library Preparation and RNA Sequencing
Poly(A)+ mRNA was isolated from total RNA using oligo-dT magnetic beads. Strand-specific sequencing libraries were prepared using the Watchmaker RNA Library Prep Kit (Twist Bioscience; 7BK0001-096) according to the manufacturer’s instructions, including first- and second-strand cDNA synthesis, end repair, adapter ligation, and incorporation of unique dual indices for sample multiplexing.
Final libraries were assessed for concentration, quality, and insert size distribution (target range: 300–400 bp) using a Fragment Analyzer system. Equimolar pools of indexed libraries were sequenced on an Illumina NovaSeq 6000 platform (S4 flow cell, paired-end 2 × 150 bp), yielding an average depth of approximately 80 million reads per sample.
2.6. Primary Bioinformatic Analysis: Read Processing and Alignment.
Initial quality control of raw FASTQ files was performed using FastQC v0.12.1. Adapter sequences and low-quality bases were removed using Trimmomatic v0.39 (ILLUMINACLIP:2:30:10, SLIDINGWINDOW:4:20, MINLEN:36). High-quality reads were aligned to the Danio rerio reference genome (GRCz11, Ensembl release 108) using STAR aligner v2.7.10a with default parameters and two-pass mapping enabled to improve splice junction detection.
2.7. Gene Quantification and Differential Expression Analysis
Aligned reads were quantified using two complementary approaches: (i) featureCounts (Subread v2.0.3) with exon-level summarization and strand-specific counting; (ii) CLC Genomics Workbench (Qiagen, v25.0.0), which was used to assess overall mapping efficiency, transcript-level abundance expressed as transcripts per million (TPM), fusion events, and transcript diversity through its RNA-Seq Analysis Module.
Raw count matrices generated by featureCounts were imported into R (v4.3.1) for differential expression analysis using DESeq2 (v1.48.0). Genes with an absolute log2 fold change > 0.585 and a Benjamini–Hochberg–adjusted p-value (false discovery rate, FDR) < 0.05 were considered significantly differentially expressed (DEGs).
Model performance and data quality were assessed by inspecting dispersion estimates, MA plots, and principal component analysis (PCA). PCA was used as an exploratory quality control step to evaluate sample-to-sample variability based on global gene expression profiles (log2 TPM). Samples behaving as multivariate outliers and failing to cluster with their biological replicates were excluded from downstream analyses. Only samples passing quality control were retained for PCA visualization and differential expression analysis.
2.8. Functional Annotation and Pathway Enrichment Analysis
Functional enrichment analyses of DEGs were performed using multiple independent tools to ensure robustness and cross-validation of enriched terms, including: g:Profiler (g:GOSt; default multiple-testing correction), Enrichr (KEGG, Reactome, WikiPathways), DAVID Bioinformatics Resources 2023 (v6.8), and ReactomePA (R package for curated Reactome pathway enrichment).
Gene Ontology (GO) categories, including Biological Process (BP), Molecular Function (MF), and Cellular Component (CC), were analyzed. Pathways with a corrected p-value < 0.05 identified by at least two independent tools were retained for interpretation. Canonical regeneration-associated pathways (e.g., Jak/Stat, Notch, Wnt) were evaluated in the context of established zebrafish retinal regeneration literature, whereas less-characterized pathways were cross-referenced with PubMed and ZFIN to assess prior biological annotation.
2.9. Transcript-Level Analysis and Isoform Dynamics
Transcript abundance and alternative splicing were assessed using StringTie2 (v2.2.1) with reference-guided transcript assembly. In parallel, CLC Genomics Workbench was used to visualize exon usage, transcript structure, and potential fusion events across conditions.
Differential transcript usage (DTU) was evaluated using the DEXSeq framework, enabling the identification of isoform-level regulation in regeneration-associated genes, including sox2, ascl1a, and stat3.
2.10. Data Visualization and Statistical Analysis
Data visualization was performed in R using the following packages: ggplot2 (v3.4.2), ComplexHeatmap (v2.14.0), EnhancedVolcano (v1.18.0), clusterProfiler (v4.8.1), and GOplot (v1.0.2). Heatmaps and volcano plots were standardized across contrasts. Pathway interaction networks were generated using Cytoscape (v3.10.0) with the ClueGO plugin. Sequencing quality control metrics, mapping statistics, and DEG counts are reported in Supplementary Tables S1–S3.
All raw and processed RNA-seq data have been deposited in the NCBI Gene Expression Omnibus (GEO) under accession number GSE313277.
For non-transcriptomic analyses shown in Figure 1, statistical analyses were performed using GraphPad Prism 8.0 (GraphPad Software, La Jolla, CA, USA). Data normality was assessed using the Shapiro–Wilk test. Parametric data were analyzed using Student’s t-test, whereas non-parametric data were analyzed using the Mann–Whitney test, as specified in the corresponding figure legends. Data are presented as mean ± s.d., and statistical significance was defined as P ≤ 0.05.
3. Results
3.1. Light-Induced Retinal Damage Elicits Early Degeneration- and Regeneration-Associated Responses in Zebrafish Larvae
To begin to investigate early retinal responses to environmental phototoxic stress in zebrafish larvae, we applied a light-induced retinal damage (LIRD) paradigm in which 4 dpf pigmented larvae were exposed to high-intensity white light (50,000 lux, 3.5 h; see Materials and Methods). Retinae were collected 48 h post-lesion (HPL), and molecular signatures associated with early degenerative and regeneration-associated responses were assessed using Western Blot (WB) analysis and transcriptomic profiling (Figure 1A).
WB analysis revealed a ~2.5-fold increase in cleaved caspase-3 levels in LIRD-treated retinae compared to controls (Figure 1B), indicating activation of caspase-dependent apoptotic pathways, consistent with previous reports in phototoxic retinal injury models [25]. To evaluate early glial reactivity and proliferation-associated responses, we next examined the expression of glial fibrillary acidic protein (GFAP) and proliferating cell nuclear antigen (PCNA), two markers commonly used to assess Müller glia (MG) activation and cell cycle entry in zebrafish retinal injury paradigms [40]. Both GFAP and PCNA protein levels were significantly increased following LIRD, with GFAP showing ~2.4-fold increase and PCNA ~1.5-fold increase relative to controls (Figure 1C,D).
Together, these data indicate that larval LIRD induces robust apoptotic signaling alongside early activation of glial reactivity and proliferation-associated programs. These features are consistent with hallmark responses observed in established zebrafish retinal injury models and support the suitability of the larval LIRD paradigm for probing early degeneration- and regeneration-associated molecular responses at larval stages.
To assess injury-associated transcriptional changes, bulk RNA-sequencing was performed on control and LIRD retinae collected 48 HPL. This analysis revealed a robust and reproducible differential transcriptomic response to phototoxic injury (Figure 2A–F). Consistent with previously described molecular features of retinal injury and MG reprogramming [19,23,29,39,41,42], differential expression analysis identified upregulation of canonical regeneration-associated genes, including ascl1a, stat3, and sox2 (Figure 2A,B,E).
Functional enrichment analyses based on Gene Ontology (GO) and KEGG pathway annotations highlighted significant regulation of signaling pathways previously implicated in MG activation and progenitor proliferation, including Notch, Wnt, JAK/STAT, and Hedgehog signaling (Figure 2C1,C2) [25,43,44]. In addition to gene-level changes, transcript-level quantification revealed isoform-specific regulation of selected regeneration-associated transcripts, including ascl1a-201, stat3-202, and sox2-201 (Figure 2D). These observations suggest that phototoxic injury is accompanied by nuanced transcriptional regulation that may not be fully captured by gene-level analyses alone.
Together, these data indicate that induced acute phototoxicity in zebrafish larvae rapidly engages established regeneration-associated transcriptional programs within 48 h post-lesions, supporting the relevance and reproducibility of the larval LIRD model. Moreover, they highlight the potential value of transcript-level analyses resolving features that may reflect cell-type-specific or temporally dynamic injury responses.
3.2. Underexplored Biological Processes Emerge During Early LIRD Response
In addition to canonical regeneration-associated pathways, functional enrichment analyses identified several biological processes that are less frequently discussed in the context of zebrafish retinal injury and regeneration. These include proteolysis, phototransduction remodeling, hormone-mediated signaling, oxygen transport, and response to oxidative stress (Figure 3A-E). RT-qPCR validation of selected differentially expressed genes (cpa1, hbae3, nos2a) confirmed the directionality of RNA-seq-derived expression trends (Figure 3F).
Proteolysis emerged as one of the most prominently enriched biological categories. Genes associated with proteolytic systems and post-translational regulation showed both up- and downregulation, suggesting a coordinated reorganization of proteostatic pathways following phototoxic injury (Figure 3A). Such changes are consistent with processes involved in damaged protein turnover and tissue remodeling during acute stress responses, although their specific functional roles in the injured larval retina remain to be determined.
Phototransduction remodeling-related processes were also significantly enriched (Figure 3B). Within this category, downregulation of guca1aa may reflect transient modulation of phototransduction recovery mechanisms, whereas upregulation of cone opsins (opn1mw1 and opn1mw2) could indicate adaptive or compensatory transcriptional responses following photoreceptor stress. Hormone-mediated signaling pathways were similarly enriched, driven primarily by coordinated downregulation of Rev-erb nuclear receptors (nr1d4a, nr1d4b, nr1d1; Figure 3C), suggesting a potential interaction between circadian, metabolic, or nuclear receptor-dependent regulatory programs and the injury response.
Unexpectedly, genes encoding hemoglobin subunits (hbbe1.3, hbae3, hbbe1.2, and hbae1.3) were among the most strongly upregulated transcripts within the oxygen transport category (Figure 3D). While hemoglobins are classically associated with erythroid cells, increasing evidence supports non-canonical roles for hemoglobin expression in redox buffering and nitric oxide signaling in non-hematopoietic tissues [45,46,47]. Consistent with this observation, the response to oxidative stress (GO:0006979) was significantly enriched, with increased expression of several antioxidant and redox-regulatory genes, including prdx1, sod1, sod2, gprx4a, gprx4b (Figure 3E).
Taken together, these data indicate that acute LIRD engages a broad transcriptional stress-response program that extends beyond classical regeneration-associated pathways. This response is characterized by alterations in proteostasis, photoreceptor-associated signaling, nuclear receptor activity, and redox-related pathways, supporting the relevance of oxidative stress-associated processes during the early phases of retinal injury.
3.3. Oxidative Stress Influences Regeneration-Associated Responses
Oxidative stress, reactive oxygen species (ROS) production, and apoptosis have been linked to regenerative responses across multiple systems, including the zebrafish retina [48,49,50,51,52,53]. However, whether ROS function as direct signaling molecules that promote activation of repair-associated genes, or instead act primarily as components of broader inflammatory or stress-associated responses, remains incompletely understood. The robust transcriptional regulation of oxidative stress- and antioxidant-associated gene networks observed following larval LIRD, including detoxification enzymes and hemoglobin-related genes, prompted us to functionally probe the contribution of oxidative stress to early regeneration-associated responses following phototoxic injury.
To this end, larvae were allowed to recover for 48 h after LIRD in the presence of the antioxidant N-acetylcysteine (NAC) (Figure 4A; see Materials and Methods). RT–qPCR analysis confirmed that expression of the oxidative stress-responsive gene sod1 was strongly induced following LIRD and that this induction was significantly attenuated by NAC treatment (Figure 4B), consistent with effective modulation of oxidative stress under these conditions. Similarly, expression of the pro-apoptotic gene bax was elevated after LIRD and significantly reduced in NAC-treated larvae (Figure 4C), indicating suppression of apoptosis-associated signaling. In contrast, expression of the inflammatory marker il1β remained elevated following LIRD and was not reduced by NAC treatment (Figure 4D), suggesting that inflammatory activation is largely maintained independently of antioxidant-mediated modulation of oxidative stress in this paradigm.
We next examined markers associated with early regeneration-related responses. LIRD induced a significant increase in gfap expression, which was attenuated by NAC treatment (Figure 4E). In parallel, expression of the proliferation-associated marker pcna was significantly reduced in NAC-treated larvae compared with LIRD alone (Figure 4F). Together, these data suggest that oxidative stress contributes to the induction or maintenance of early glial activation and proliferation-associated transcriptional responses following phototoxic injury.
To validate the transcriptional effects of antioxidant treatment at the protein level, we performed WB analyses on larval retinae collected 48 h after LIRD in the presence or absence of N-acetylcysteine (NAC) (Figure 5). Consistent with the induction of apoptosis-associated pathways following phototoxic injury, LIRD resulted in a marked increase in cleaved caspase-3 protein levels, which was significantly attenuated by NAC treatment (Figure 5A). In parallel, the LIRD-induced elevation of proliferating cell nuclear antigen (PCNA) was reduced in NAC-treated larvae, indicating that proliferation-associated responses were suppressed under antioxidant conditions (Figure 5B).
Key growth- and regeneration-associated signaling components, including the Hippo and Mitogen-Activated Protein Kinase (MAPK) pathways, were enriched in our transcriptomic analysis (data not shown) and have been previously implicated in retinal injury and regeneration [54,55,56]. We therefore examined whether mitigation of oxidative stress influences these pathways. LIRD exposure was associated with increased levels of phosphorylated ERK (pERK) and reduced levels of phosphorylated YAP (pYAP), consistent with modulation of MAPK- and Hippo-associated signaling. Both responses were significantly attenuated by NAC treatment (Figure 5C,D). Together, these data indicate that antioxidant treatment modulates apoptosis- and growth-associated signaling responses induced by LIRD, consistent with a functional contribution of oxidative stress to injury-associated signaling programs in the larval zebrafish retina.
3.4. Subtoxic H2O2 Exposure Promotes Proliferation in the Absence of Overt Apoptosis
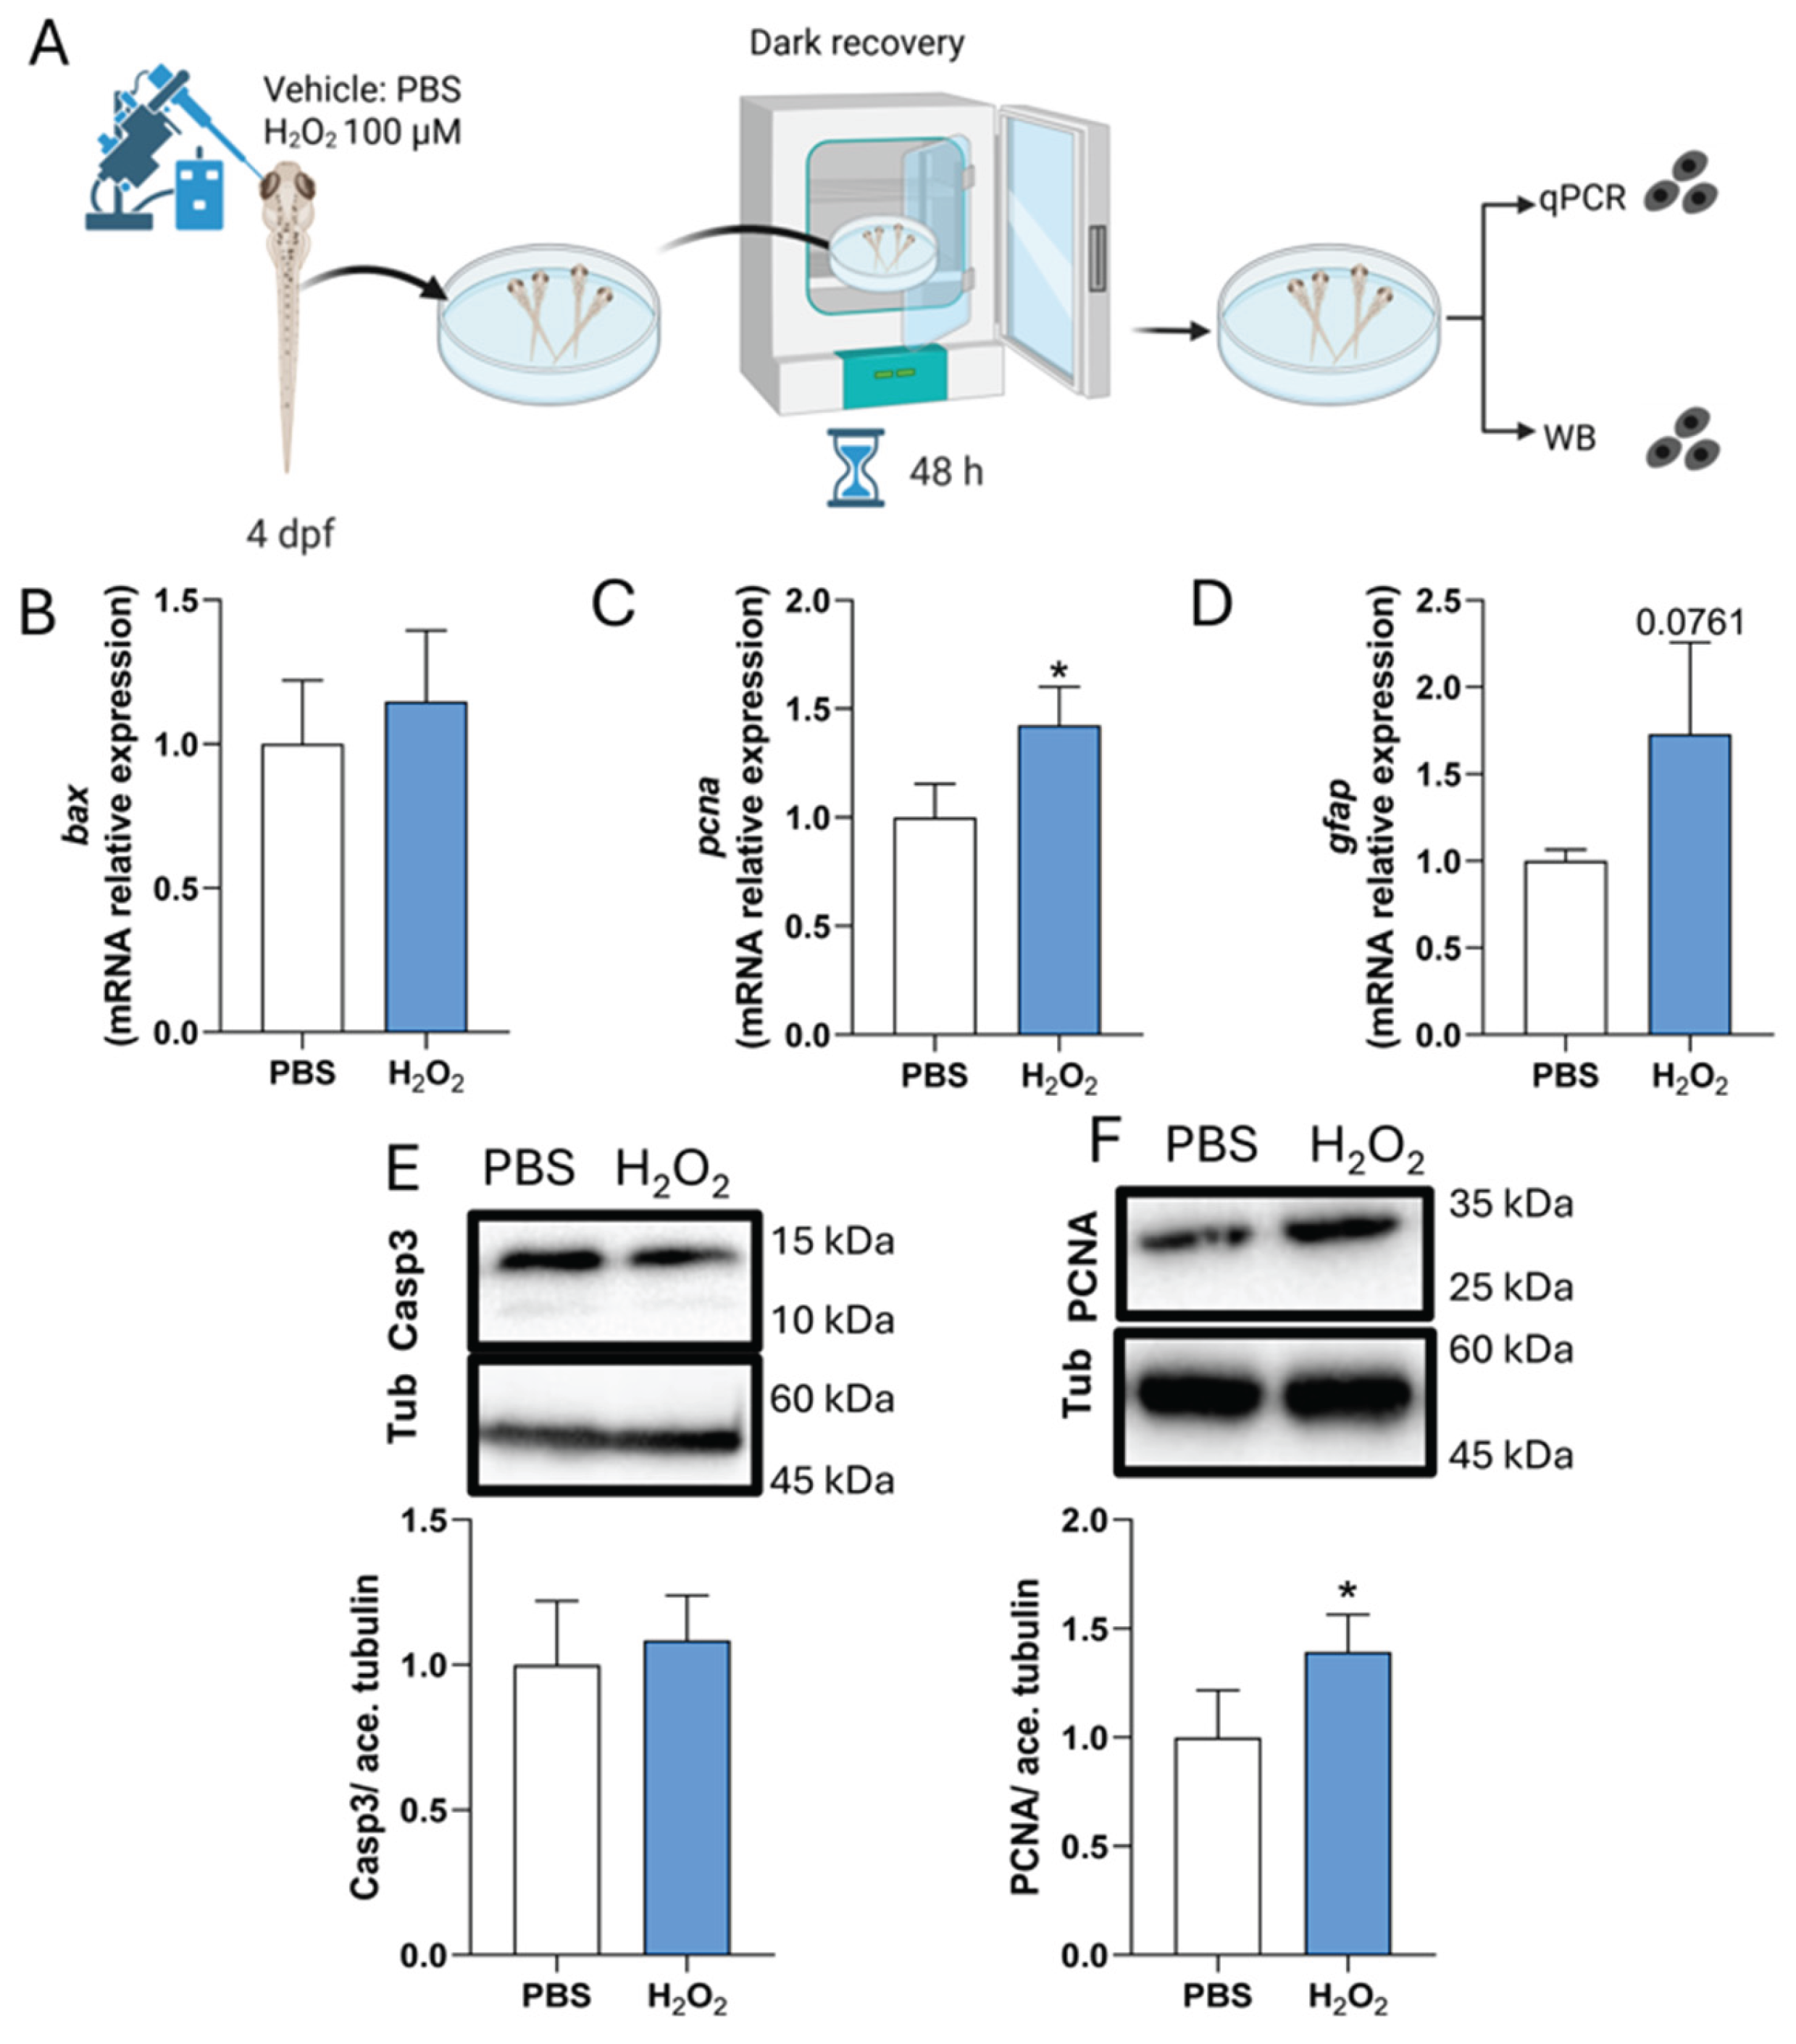
Given the reduction in proliferation-associated responses observed upon antioxidant treatment following LIRD, we next asked whether a moderate increase in ROS levels is sufficient to influence proliferation-associated markers in the absence of phototoxic injury. To address this, subtoxic intra-retinal injections of vehicle (PBS) or hydrogen peroxide (H2O2) were performed in 4 dpf larvae, which were then allowed to recover under standard conditions for 48 hours (Figure 6A; see Materials and Methods).
RT–qPCR analysis showed that expression of the pro-apoptotic gene bax was not significantly altered following H2O2 injection compared with PBS controls, indicating the absence of a detectable apoptotic transcriptional response under these conditions (Figure 6B). In contrast, pcna expression was significantly increased, while gfap showed a modest but non-significant upward trend (Figure 6C,D), consistent with the engagement of proliferation-associated programs without robust glial activation. Protein-level analyses corroborated these findings. Western blot analysis confirmed that H2O2 exposure did not induce caspase-3 cleavage, supporting the absence of overt apoptosis, whereas PCNA protein levels were significantly increased relative to controls (Figure 6E,F).
Together, these results indicate that subtoxic elevation of ROS is sufficient to enhance proliferation-associated markers in the larval zebrafish retina, in the absence of phototoxic injury or detectable apoptosis.
4. Discussion
Several paradigms have been used to study the remarkable regenerative capacity of the zebrafish retina, including physical lesions, chemical ablation, and light-induced retinal damage (LIRD) [13,26,29,30,32,39,57,58,59]. While LIRD is well-characterized in adults, few studies have examined larval stages [25,44].
Here, we established and validated a pigmented larval LIRD model that recapitulates key features of early degeneration and regeneration. Within 48 hours post-lesion, apoptotic pathways (bax, cleaved caspase-3) were activated alongside markers of MG reactivity and proliferation (GFAP, PCNA), consistent with adult LIRD paradigms [16,40]. Transcriptomic profiling revealed induction of canonical regeneration-associated genes, including ascl1a, stat3, and sox2, reflecting early MG dedifferentiation and progenitor activation [23,27,60]. These observations validate larval LIRD as a tractable model to investigate early molecular events in retinal regeneration.
Beyond canonical pathways, transcriptional analysis highlighted underexplored processes. Proteolysis and extracellular matrix (ECM) remodeling genes (cpa1, psmb8a) were differentially regulated, suggesting dynamic proteostasis and ECM adjustments that may support MG reprogramming and cell migration. Sensory-transduction genes showed bidirectional regulation, including suppression of phototransduction-reset genes and upregulation of cone opsins, potentially reflecting early circuit remodeling or compensatory adaptation. Downregulation of Rev-erb nuclear receptors (nr1d1, nr1d4a, nr1d4b) may indicate metabolic and circadian adjustments facilitating MG plasticity. Functional studies will be needed to distinguish whether these transcriptomic changes are permissive for regeneration or secondary to injury.
A central finding of this study is the contribution of oxidative stress to early retinal responses. LIRD induced upregulation of antioxidant enzymes and non-canonical hemoglobin subunits (hbbe1.3, hbae3, hbbe1.2, hbae1.3), implicated in redox buffering and nitric oxide signaling [45,46,47]. These transcriptional changes support the idea that ROS are a prominent component of the early injury milieu and may contribute to local redox homeostasis during regenerative responses.
Functionally, scavenging ROS with N-acetylcysteine (NAC) attenuated apoptotic signaling, as evidenced by reduced caspase-3 cleavage and bax expression, and concomitantly suppressed MG proliferation, as measured by PCNA and gfap expression, without significantly affecting the inflammatory marker il1β. Conversely, subtoxic intra-retinal delivery of H2O2 enhanced proliferation in the absence of detectable apoptosis, indicating that ROS provides permissive or instructive cues for MG activation. Notably, the conditions tested of H2O2 exposure resulted in a modest reduction of phosphorylated YAP (p = 0.08), whereas phosphorylated ERK levels remained unchanged (see Supplementary Figure 1). These observations suggest that proliferation induced by subtoxic ROS may occur independently of robust ERK/MAPK or Hippo/YAP pathway activation or alternatively reflect the transient nature of a single H2O2 exposure. During LIRD, ROS are likely produced continuously and engage multiple signaling pathways. Therefore, future experiments with repeated or sustained ROS elevation might be required to clarify their contribution to proliferative responses. Collectively, these data position ROS as a modulatory axis within the early retinal injury milieu, consistent with observations in other regenerative contexts, such as zebrafish fin regeneration [48,61]. However, these findings do not establish ROS as singular drivers of regeneration, nor they resolve whether they act upstream, downstream, or in parallel with inflammatory pathways.
Several technical limitations also warrant consideration. Bulk RNA-seq cannot resolve cell-type–specific or spatially restricted transcriptional responses, and isoform-level dynamics remain correlative rather than mechanistic. Many non-canonical pathways highlighted here, including ECM remodeling, proteolysis, hormone-mediated signaling, phototransduction adjustments, and oxygen transport, require functional validation to determine causal roles in regeneration. Additionally, the larval LIRD paradigm represents an acute, high-intensity phototoxic insult and may not fully capture chronic or disease-relevant retinal degeneration, potentially limiting direct translational extrapolation.
In summary, our study establishes larval LIRD as a tractable model for probing early retinal injury responses and highlights oxidative stress as a central modulatory axis. The transcript-level resource generated here also provides a solid foundation for future cell-type-specific and mechanistic studies aimed at disentangling how redox signaling interacts with canonical and non-canonical pathways to drive retinal repair, with potential implications for therapeutic strategies targeting oxidative stress in retinal degeneration.
Supplementary Materials
The following supporting information can be downloaded at the website of this paper posted on Preprints.org, Figure S1: Effects of H2O2 on Hippo and ERK pathway activity; Table S1: Antibodies; Table S2: Primers.
Author Contributions
Conceptualization, I.B-C, L.D. and L.P.; methodology, I.B-C, L.D. and L.P.; software, I.B-C, L.D. and L.P.; validation, I.B-C, L.D. and D.Z.; formal analysis, I.B-C, L.D.; investigation, I.B-C, L.D. and D.Z.; resources, L.P., M.F., R.D. and R.M.; data curation, I.B-C, L.D. and D.Z.; writing-original draft preparation, I.B-C, L.D. and L.P.; writing-review and editing,I.B-C, L.D., L.P., S.S., D.Z., C.R., V.F., M.F., M.C., R.D., R.M. and L.P.; visualization, I.B-C, L.D., S.S., and L.P.; supervision, L.P.; project administration, L.P.; funding acquisition, L.D., M.C., D.Z., M.F., R.D., R.M. and L.P. All authors have read and agreed to the published version of the manuscript.”.
Funding
This work was supported by internal funding from the University of Trento to L.P., and by the Italian Ministry of Health to L.P., R.M. and R.D. (PRIN: Progetti di Ricerca di Rilevante Interesse Nazionale—Bando 2022 Prot. 2022PWMW5A).
Institutional Review Board Statement
All zebrafish procedures were performed in accordance with institutional guidelines of the University of Trento. The animal study protocol was approved by the and were approved by the Italian Ministry of Health (protocol Autorizzazione n. 707/2025-PR (Risp. a prot. 3FAF3.78).
Data Availability Statement
All relevant data supporting the findings of this study, including quantitative analyses and representative images, are provided in the main text and Supplementary Information, or will be made available upon request. All raw and processed transcriptomic data supporting the conclusions of this work have been submitted to the NCBI Gene Expression Omnibus (GEO) and are available under the GEO accession number GSE313277.
Acknowledgments
The authors would like to thank S. Robbiati, I. Mazzeo, S. Longhi, and M. Cont from the Model Organism Facility; R. Bertorelli and V. De Sanctis from the Next Generation Sequencing Facility; G. Scarduelli and M. Roccuzzo from the Advanced Imaging Facility. Department CIBIO Core Facilities are supported by the European Regional Development Fund (ERDF) 2014–2020 and 2021–2027. The authors have reviewed and edited the output and take full responsibility for the content of this publication.”.
Conflicts of Interest
The authors declare no competing or financial interests.
Abbreviations
The following abbreviations are used in this manuscript:
| LIRD | light-induced retinal damage |
| PCNA | proliferating cell nuclear antigen |
| NAC | N-acetylcysteine |
| MG | Müller glia |
| ROS | Reactive oxygen species |
| HPL | Hours-post-light-induced retinal damage |
| dpf | Days post-fertilization |
| WB | Western Blot |
| DEG | Differentially expressed genes |
| NO | Nitric oxide |
| GFAP | Glial Fibrillary Acidic Protein |
| TPM | Transcripts per million |
| PCA | Principal component analysis |
| BP | Biological process |
| MF | Molecular function |
| CC | Cellular component |
References
- Balzamino, B.O.; Severino, M.; Cafiero, C.; Coassin, M.; Di Zazzo, A.; Micera, A. The Zebrafish as a Model for Ocular Translational Research: From Retinal Repair to Regeneration. Cells 2025, 14, 1405. [Google Scholar] [CrossRef]
- Sharma, P.; Ramachandran, R. Retina Regeneration: Lessons from Vertebrates. Oxford Open Neuroscience 2022, 1, kvac012. [Google Scholar] [CrossRef]
- Gao, H.; A, L.; Huang, X.; Chen, X.; Xu, H. Müller Glia-Mediated Retinal Regeneration. Mol Neurobiol 2021, 58, 2342–2361. [Google Scholar] [CrossRef]
- Jui, J.; Goldman, D. Müller Glial Cell–Dependent Regeneration of the Retina in Zebrafish and Mice. Annual Review of Genetics 2024, 58, 67–90. [Google Scholar] [CrossRef]
- Lenkowski, J.R.; Raymond, P.A. Müller Glia: Stem Cells for Generation and Regeneration of Retinal Neurons in Teleost Fish. Progress in Retinal and Eye Research 2014, 40, 94–123. [Google Scholar] [CrossRef]
- Bernardos, R.L.; Barthel, L.K.; Meyers, J.R.; Raymond, P.A. Late-Stage Neuronal Progenitors in the Retina Are Radial Muller Glia That Function as Retinal Stem Cells. Journal of Neuroscience 2007, 27, 7028–7040. [Google Scholar] [CrossRef] [PubMed]
- Boyd, P.; Campbell, L.J.; Hyde, D.R. Clcf1/Crlf1a-Mediated Signaling Is Neuroprotective and Required for Müller Glia Proliferation in the Light-Damaged Zebrafish Retina. Front. Cell Dev. Biol. 2023, 11, 1142586. [Google Scholar] [CrossRef] [PubMed]
- Kassen, S.C.; Ramanan, V.; Montgomery, J.E.; T. Burket, C.; Liu, C.-G.; Vihtelic, T.S.; Hyde, D.R. Time Course Analysis of Gene Expression during Light-Induced Photoreceptor Cell Death and Regeneration in Albino Zebrafish. Devel Neurobio 2007, 67, 1009–1031. [Google Scholar] [CrossRef] [PubMed]
- Konar, G.J.; Vallone, K.T.; Nguyen, T.D.; Patton, J.G. Analysis of the Senescence Secretome during Zebrafish Retina Regeneration. Front. Aging 2025, 6, 1569422. [Google Scholar] [CrossRef]
- Lourenço, R.; Brandão, A.S.; Borbinha, J.; Gorgulho, R.; Jacinto, A. Yap Regulates Müller Glia Reprogramming in Damaged Zebrafish Retinas. Front. Cell Dev. Biol. 2021, 9, 667796. [Google Scholar] [CrossRef]
- Lu, C.; Hyde, D.R. Cytokines IL-1β and IL-10 Are Required for Müller Glia Proliferation Following Light Damage in the Adult Zebrafish Retina. Front. Cell Dev. Biol. 2024, 12, 1406330. [Google Scholar] [CrossRef]
- Ranski, A.H.; Kramer, A.C.; Morgan, G.W.; Perez, J.L.; Thummel, R. Characterization of Retinal Regeneration in Adult Zebrafish Following Multiple Rounds of Phototoxic Lesion. PeerJ 2018, 6, e5646. [Google Scholar] [CrossRef]
- Thomas, J.L.; Thummel, R. A Novel Light Damage Paradigm for Use in Retinal Regeneration Studies in Adult Zebrafish. JoVE 2013, 51017. [Google Scholar] [CrossRef]
- Thomas, J.L.; Nelson, C.M.; Luo, X.; Hyde, D.R.; Thummel, R. Characterization of Multiple Light Damage Paradigms Reveals Regional Differences in Photoreceptor Loss. Exp Eye Res 2012, 97, 105–116. [Google Scholar] [CrossRef] [PubMed]
- Vihtelic, T.S.; Soverly, J.E.; Kassen, S.C.; Hyde, D.R. Retinal Regional Differences in Photoreceptor Cell Death and Regeneration in Light-Lesioned Albino Zebrafish. Experimental Eye Research 2006, 82, 558–575. [Google Scholar] [CrossRef]
- Vihtelic, T.S.; Hyde, D.R. Light-Induced Rod and Cone Cell Death and Regeneration in the Adultalbino Zebrafish (Danio Rerio) Retina. J. Neurobiol. 2000, 44, 289–307. [Google Scholar] [CrossRef] [PubMed]
- Weber, A.; Hochmann, S.; Cimalla, P.; Gärtner, M.; Kuscha, V.; Hans, S.; Geffarth, M.; Kaslin, J.; Koch, E.; Brand, M. Characterization of Light Lesion Paradigms and Optical Coherence Tomography as Tools to Study Adult Retina Regeneration in Zebrafish. PLoS ONE 2013, 8, e80483. [Google Scholar] [CrossRef]
- Bludau, O.; Weber, A.; Bosak, V.; Kuscha, V.; Dietrich, K.; Hans, S.; Brand, M. Inflammation Is a Critical Factor for Successful Regeneration of the Adult Zebrafish Retina in Response to Diffuse Light Lesion. Front. Cell Dev. Biol. 2024, 12, 1332347. [Google Scholar] [CrossRef]
- Celotto, L.; Rost, F.; Machate, A.; Bläsche, J.; Dahl, A.; Weber, A.; Hans, S.; Brand, M. Single Cell RNA Sequencing Unravels the Transcriptional Network Underlying Zebrafish Retina Regeneration. eLife 2023, 12. [Google Scholar] [CrossRef]
- García-García, D.; Vidal-Gil, L.; Parain, K.; Lun, J.; Audic, Y.; Chesneau, A.; Siron, L.; Van Westendorp, D.; Lourdel, S.; Sánchez-Sáez, X.; et al. Neuroinflammation as a Cause of Differential Müller Cell Regenerative Responses to Retinal Injury. Sci. Adv. 2024, 10, eadp7916. [Google Scholar] [CrossRef]
- Goldman, D. Müller Glial Cell Reprogramming and Retina Regeneration. Nat Rev Neurosci 2014, 15, 431–442. [Google Scholar] [CrossRef]
- Goldman, J.A.; Poss, K.D. Gene Regulatory Programmes of Tissue Regeneration. Nat Rev Genet 2020, 21, 511–525. [Google Scholar] [CrossRef] [PubMed]
- Gorsuch, R.A.; Lahne, M.; Yarka, C.E.; Petravick, M.E.; Li, J.; Hyde, D.R. Sox2 Regulates Müller Glia Reprogramming and Proliferation in the Regenerating Zebrafish Retina via Lin28 and Ascl1a. Experimental Eye Research 2017, 161, 174–192. [Google Scholar] [CrossRef] [PubMed]
- Hoang, T.; Wang, J.; Boyd, P.; Wang, F.; Santiago, C.; Jiang, L.; Yoo, S.; Lahne, M.; Todd, L.J.; Jia, M.; et al. Gene Regulatory Networks Controlling Vertebrate Retinal Regeneration. Science 2020, 370, eabb8598. [Google Scholar] [CrossRef]
- Kawase, R.; Nishimura, Y.; Ashikawa, Y.; Sasagawa, S.; Murakami, S.; Yuge, M.; Okabe, S.; Kawaguchi, K.; Yamamoto, H.; Moriyuki, K.; et al. EP300 Protects from Light-Induced Retinopathy in Zebrafish. Front. Pharmacol. 2016, 7. [Google Scholar] [CrossRef]
- Lahne, M.; Brecker, M.; Jones, S.E.; Hyde, D.R. The Regenerating Adult Zebrafish Retina Recapitulates Developmental Fate Specification Programs. Front. Cell Dev. Biol. 2021, 8. [Google Scholar] [CrossRef]
- Lyu, P.; Iribarne, M.; Serjanov, D.; Zhai, Y.; Hoang, T.; Campbell, L.J.; Boyd, P.; Palazzo, I.; Nagashima, M.; Silva, N.J.; et al. Common and Divergent Gene Regulatory Networks Control Injury-Induced and Developmental Neurogenesis in Zebrafish Retina. Nat Commun 2023, 14, 8477. [Google Scholar] [CrossRef]
- Nagashima, M.; Hitchcock, P.F. Inflammation Regulates the Multi-Step Process of Retinal Regeneration in Zebrafish. Cells 2021, 10, 783. [Google Scholar] [CrossRef]
- Ramachandran, R.; Fausett, B.V.; Goldman, D. Ascl1a Regulates Müller Glia Dedifferentiation and Retinal Regeneration through a Lin-28-Dependent, Let-7 microRNA Signalling Pathway. Nat Cell Biol 2010, 12, 1101–1107. [Google Scholar] [CrossRef] [PubMed]
- Song, P.; Parsana, D.; Singh, R.; Pollock, L.M.; Anand-Apte, B.; Perkins, B.D. Photoreceptor Regeneration Occurs Normally in Microglia-Deficient Irf8 Mutant Zebrafish Following Acute Retinal Damage. Sci Rep 2024, 14, 20146. [Google Scholar] [CrossRef] [PubMed]
- VandenBosch, L.S.; Wohl, S.G.; Wilken, M.S.; Hooper, M.; Finkbeiner, C.; Cox, K.; Chipman, L.; Reh, T.A. Developmental Changes in the Accessible Chromatin, Transcriptome and Ascl1-Binding Correlate with the Loss in Müller Glial Regenerative Potential. Sci Rep 2020, 10, 13615. [Google Scholar] [CrossRef] [PubMed]
- White, D.T.; Sengupta, S.; Saxena, M.T.; Xu, Q.; Hanes, J.; Ding, D.; Ji, H.; Mumm, J.S. Immunomodulation-Accelerated Neuronal Regeneration Following Selective Rod Photoreceptor Cell Ablation in the Zebrafish Retina. PNAS 2017, 114, E3719–E3728. [Google Scholar] [CrossRef]
- Xiao, X.; Liao, Z.; Zou, J. Genetic and Epigenetic Regulators of Retinal Müller Glial Cell Reprogramming. Advances in Ophthalmology Practice and Research 2023, 3, 126–133. [Google Scholar] [CrossRef]
- Alesci, A.; Pergolizzi, S.; Lo Cascio, P.; Fumia, A.; Lauriano, E.R. Neuronal Regeneration: Vertebrates Comparative Overview and New Perspectives for Neurodegenerative Diseases. Acta Zoologica 2022, 103, 129–140. [Google Scholar] [CrossRef]
- Hamon, A.; Roger, J.E.; Yang, X.-J.; Perron, M. Müller Glial Cell-Dependent Regeneration of the Neural Retina: An Overview across Vertebrate Model Systems. Dev Dyn 2016, 245, 727–738. [Google Scholar] [CrossRef] [PubMed]
- Kramer, A.C.; Gurdziel, K.; Thummel, R. A Comparative Analysis of Gene and Protein Expression Throughout a Full 28-Day Retinal Regeneration Time-Course in Adult Zebrafish. Front. Cell Dev. Biol. 2021, 9, 741514. [Google Scholar] [CrossRef]
- Thummel, R.; Kassen, S.C.; Enright, J.M.; Nelson, C.M.; Montgomery, J.E.; Hyde, D.R. Characterization of Müller Glia and Neuronal Progenitors during Adult Zebrafish Retinal Regeneration. Experimental Eye Research 2008, 87, 433–444. [Google Scholar] [CrossRef]
- Todd, L.; Reh, T.A. Comparative Biology of Vertebrate Retinal Regeneration: Restoration of Vision through Cellular Reprogramming. Cold Spring Harb Perspect Biol 2022, 14, a040816. [Google Scholar] [CrossRef] [PubMed]
- Hoang, T.; Wang, J.; Boyd, P.; Wang, F.; Santiago, C.; Jiang, L.; Yoo, S.; Lahne, M.; Todd, L.J.; Jia, M.; et al. Gene Regulatory Networks Controlling Vertebrate Retinal Regeneration. Science 2020, 370, eabb8598. [Google Scholar] [CrossRef]
- Thomas, J.L.; Ranski, A.H.; Morgan, G.W.; Thummel, R. Reactive Gliosis in the Adult Zebrafish Retina. Experimental Eye Research 2016, 143, 98–109. [Google Scholar] [CrossRef]
- Nelson, C.M.; Gorsuch, R.A.; Bailey, T.J.; Ackerman, K.M.; Kassen, S.C.; Hyde, D.R. Stat3 Defines Three Populations of Müller Glia and Is Required for Initiating Maximal Müller Glia Proliferation in the Regenerating Zebrafish Retina. J of Comparative Neurology 2012, 520, 4294–4311. [Google Scholar] [CrossRef]
- Tresenrider, A.; Hooper, M.; Todd, L.; Kierney, F.; Blasdel, N.; Trapnell, C.; Reh, T.A. A Multiplexed, Single-Cell Sequencing Screen Identifies Compounds That Increase Neurogenic Reprogramming of Murine Muller Glia. eLife 2024, 12. [Google Scholar] [CrossRef]
- Conner, C.; Ackerman, K.M.; Lahne, M.; Hobgood, J.S.; Hyde, D.R. Repressing Notch Signaling and Expressing TNF Are Sufficient to Mimic Retinal Regeneration by Inducing Muller Glial Proliferation to Generate Committed Progenitor Cells. Journal of Neuroscience 2014, 34, 14403–14419. [Google Scholar] [CrossRef]
- Meyers, J.R.; Hu, L.; Moses, A.; Kaboli, K.; Papandrea, A.; Raymond, P.A. β-Catenin/Wnt Signaling Controls Progenitor Fate in the Developing and Regenerating Zebrafish Retina. Neural Dev 2012, 7, 30. [Google Scholar] [CrossRef]
- Haines, B.; Mao, X.; Xie, L.; Spusta, S.; Zeng, X.; Jin, K.; Greenberg, D.A. Neuroglobin Expression in Neurogenesis. Neuroscience Letters 2013, 549, 3–6. [Google Scholar] [CrossRef] [PubMed]
- Tian, Z.; Li, Y.; Jin, F.; Xu, Z.; Gu, Y.; Guo, M.; Shao, Q.; Liu, Y.; Luo, H.; Wang, Y.; et al. Brain-Derived Exosomal Hemoglobin Transfer Contributes to Neuronal Mitochondrial Homeostasis under Hypoxia 2025.
- Walser, M.; Svensson, J.; Karlsson, L.; Motalleb, R.; Åberg, M.; Kuhn, H.G.; Isgaard, J.; Åberg, N.D. Growth Hormone and Neuronal Hemoglobin in the Brain—Roles in Neuroprotection and Neurodegenerative Diseases. Front. Endocrinol. 2021, 11, 606089. [Google Scholar] [CrossRef]
- Gauron, C.; Rampon, C.; Bouzaffour, M.; Ipendey, E.; Teillon, J.; Volovitch, M.; Vriz, S. Sustained Production of ROS Triggers Compensatory Proliferation and Is Required for Regeneration to Proceed. Sci Rep 2013, 3, 2084. [Google Scholar] [CrossRef]
- Abrahan, C.E.; Insua, M.F.; Politi, L.E.; German, O.L.; Rotstein, N.P. Oxidative Stress Promotes Proliferation and Dedifferentiation of Retina Glial Cells in Vitro. J. Neurosci. Res. 2009, 87, 964–977. [Google Scholar] [CrossRef]
- Sifuentes, C.J.; Kim, J.-W.; Swaroop, A.; Raymond, P.A. Rapid, Dynamic Activation of Müller Glial Stem Cell Responses in Zebrafish. Invest. Ophthalmol. Vis. Sci. 2016, 57, 5148. [Google Scholar] [CrossRef] [PubMed]
- Romero, M.M.G.; McCathie, G.; Jankun, P.; Roehl, H.H. Damage-Induced Reactive Oxygen Species Enable Zebrafish Tail Regeneration by Repositioning of Hedgehog Expressing Cells. Nat Commun 2018, 9, 4010. [Google Scholar] [CrossRef]
- Anand, S.K.; Sahu, M.R.; Mondal, A.C. Induction of Oxidative Stress and Apoptosis in the Injured Brain: Potential Relevance to Brain Regeneration in Zebrafish. Mol Biol Rep 2021, 48, 5099–5108. [Google Scholar] [CrossRef]
- Albadri, S.; Naso, F.; Thauvin, M.; Gauron, C.; Parolin, C.; Duroure, K.; Vougny, J.; Fiori, J.; Boga, C.; Vriz, S.; et al. Redox Signaling via Lipid Peroxidation Regulates Retinal Progenitor Cell Differentiation. Developmental Cell 2019, 50, 73–89.e6. [Google Scholar] [CrossRef] [PubMed]
- Torres, M.; Forman, H.J. Redox Signaling and the MAP Kinase Pathways. BioFactors 2008, 17, 287–296. [Google Scholar] [CrossRef]
- Lourenço, R.; Brandão, A.S.; Borbinha, J.; Gorgulho, R.; Jacinto, A. Yap Regulates Müller Glia Reprogramming in Damaged Zebrafish Retinas. Front. Cell Dev. Biol. 2021, 9, 667796. [Google Scholar] [CrossRef]
- Wan, J.; Zhao, X.-F.; Vojtek, A.; Goldman, D. Retinal Injury, Growth Factors, and Cytokines Converge on β-Catenin and pStat3 Signaling to Stimulate Retina Regeneration. Cell Reports 2014, 9, 285–297. [Google Scholar] [CrossRef] [PubMed]
- Powell, C.; Cornblath, E.; Elsaeidi, F.; Wan, J.; Goldman, D. Zebrafish Müller Glia-Derived Progenitors Are Multipotent, Exhibit Proliferative Biases and Regenerate Excess Neurons. Sci Rep 2016, 6, 24851. [Google Scholar] [CrossRef]
- Iribarne, M.; Hyde, D.R. Different Inflammation Responses Modulate Müller Glia Proliferation in the Acute or Chronically Damaged Zebrafish Retina. Front. Cell Dev. Biol. 2022, 10, 892271. [Google Scholar] [CrossRef]
- Luo, Z.-W. Establishment of an Adult Zebrafish Model of Retinal Neurodegeneration Induced by NMDA. Int J Ophthalmol 2019, 12, 1250–1261. [Google Scholar] [CrossRef]
- Fausett, B.V.; Gumerson, J.D.; Goldman, D. The Proneural Basic Helix-Loop-Helix Gene Ascl1a Is Required for Retina Regeneration. J. Neurosci. 2008, 28, 1109–1117. [Google Scholar] [CrossRef]
- Thauvin, M.; Matias De Sousa, R.; Alves, M.; Volovitch, M.; Vriz, S.; Rampon, C. An Early Shh–H2O2 Reciprocal Regulatory Interaction Controls the Regenerative Program during Zebrafish Fin Regeneration. Journal of Cell Science 2022, 135, jcs259664. [Google Scholar] [CrossRef] [PubMed]
Figure 1.
Larval LIRD induces apoptotic and regeneration-associated molecular responses. (A) Schematic overview of the larval LIRD paradigm. Pigmented zebrafish larvae at 4 dpf were exposed to high-intensity white light (50,000 lux) for 3.5 h, followed by a 48-h recovery period. For each biological replicate, pools of 50 larval retinae were collected and processed for Western blot (WB) or bulk RNA sequencing analyses. (B) Representative Western blot (top) showing cleaved caspase-3 (Casp3), with acetylated tubulin (Tub) used as a loading control. Densitometric quantification (bottom) shows Casp3 levels normalized to control averages (N = 5 biological replicates). (C) Representative Western blot (top) showing glial fibrillary acidic protein (GFAP), with actin used as a loading control. Densitometric quantification (bottom) normalized to control averages (N = 4 biological replicates). (D) Representative Western blot (top) showing proliferating cell nuclear antigen (PCNA), with acetylated tubulin (Tub) used as a loading control. Densitometric quantification (bottom) normalized to control averages (N = 5 biological replicates). Data are presented as mean ± SEM. Statistical significance was assessed using an unpaired two-tailed Student’s t-test. *P ≤ 0.05, **P ≤ 0.01.
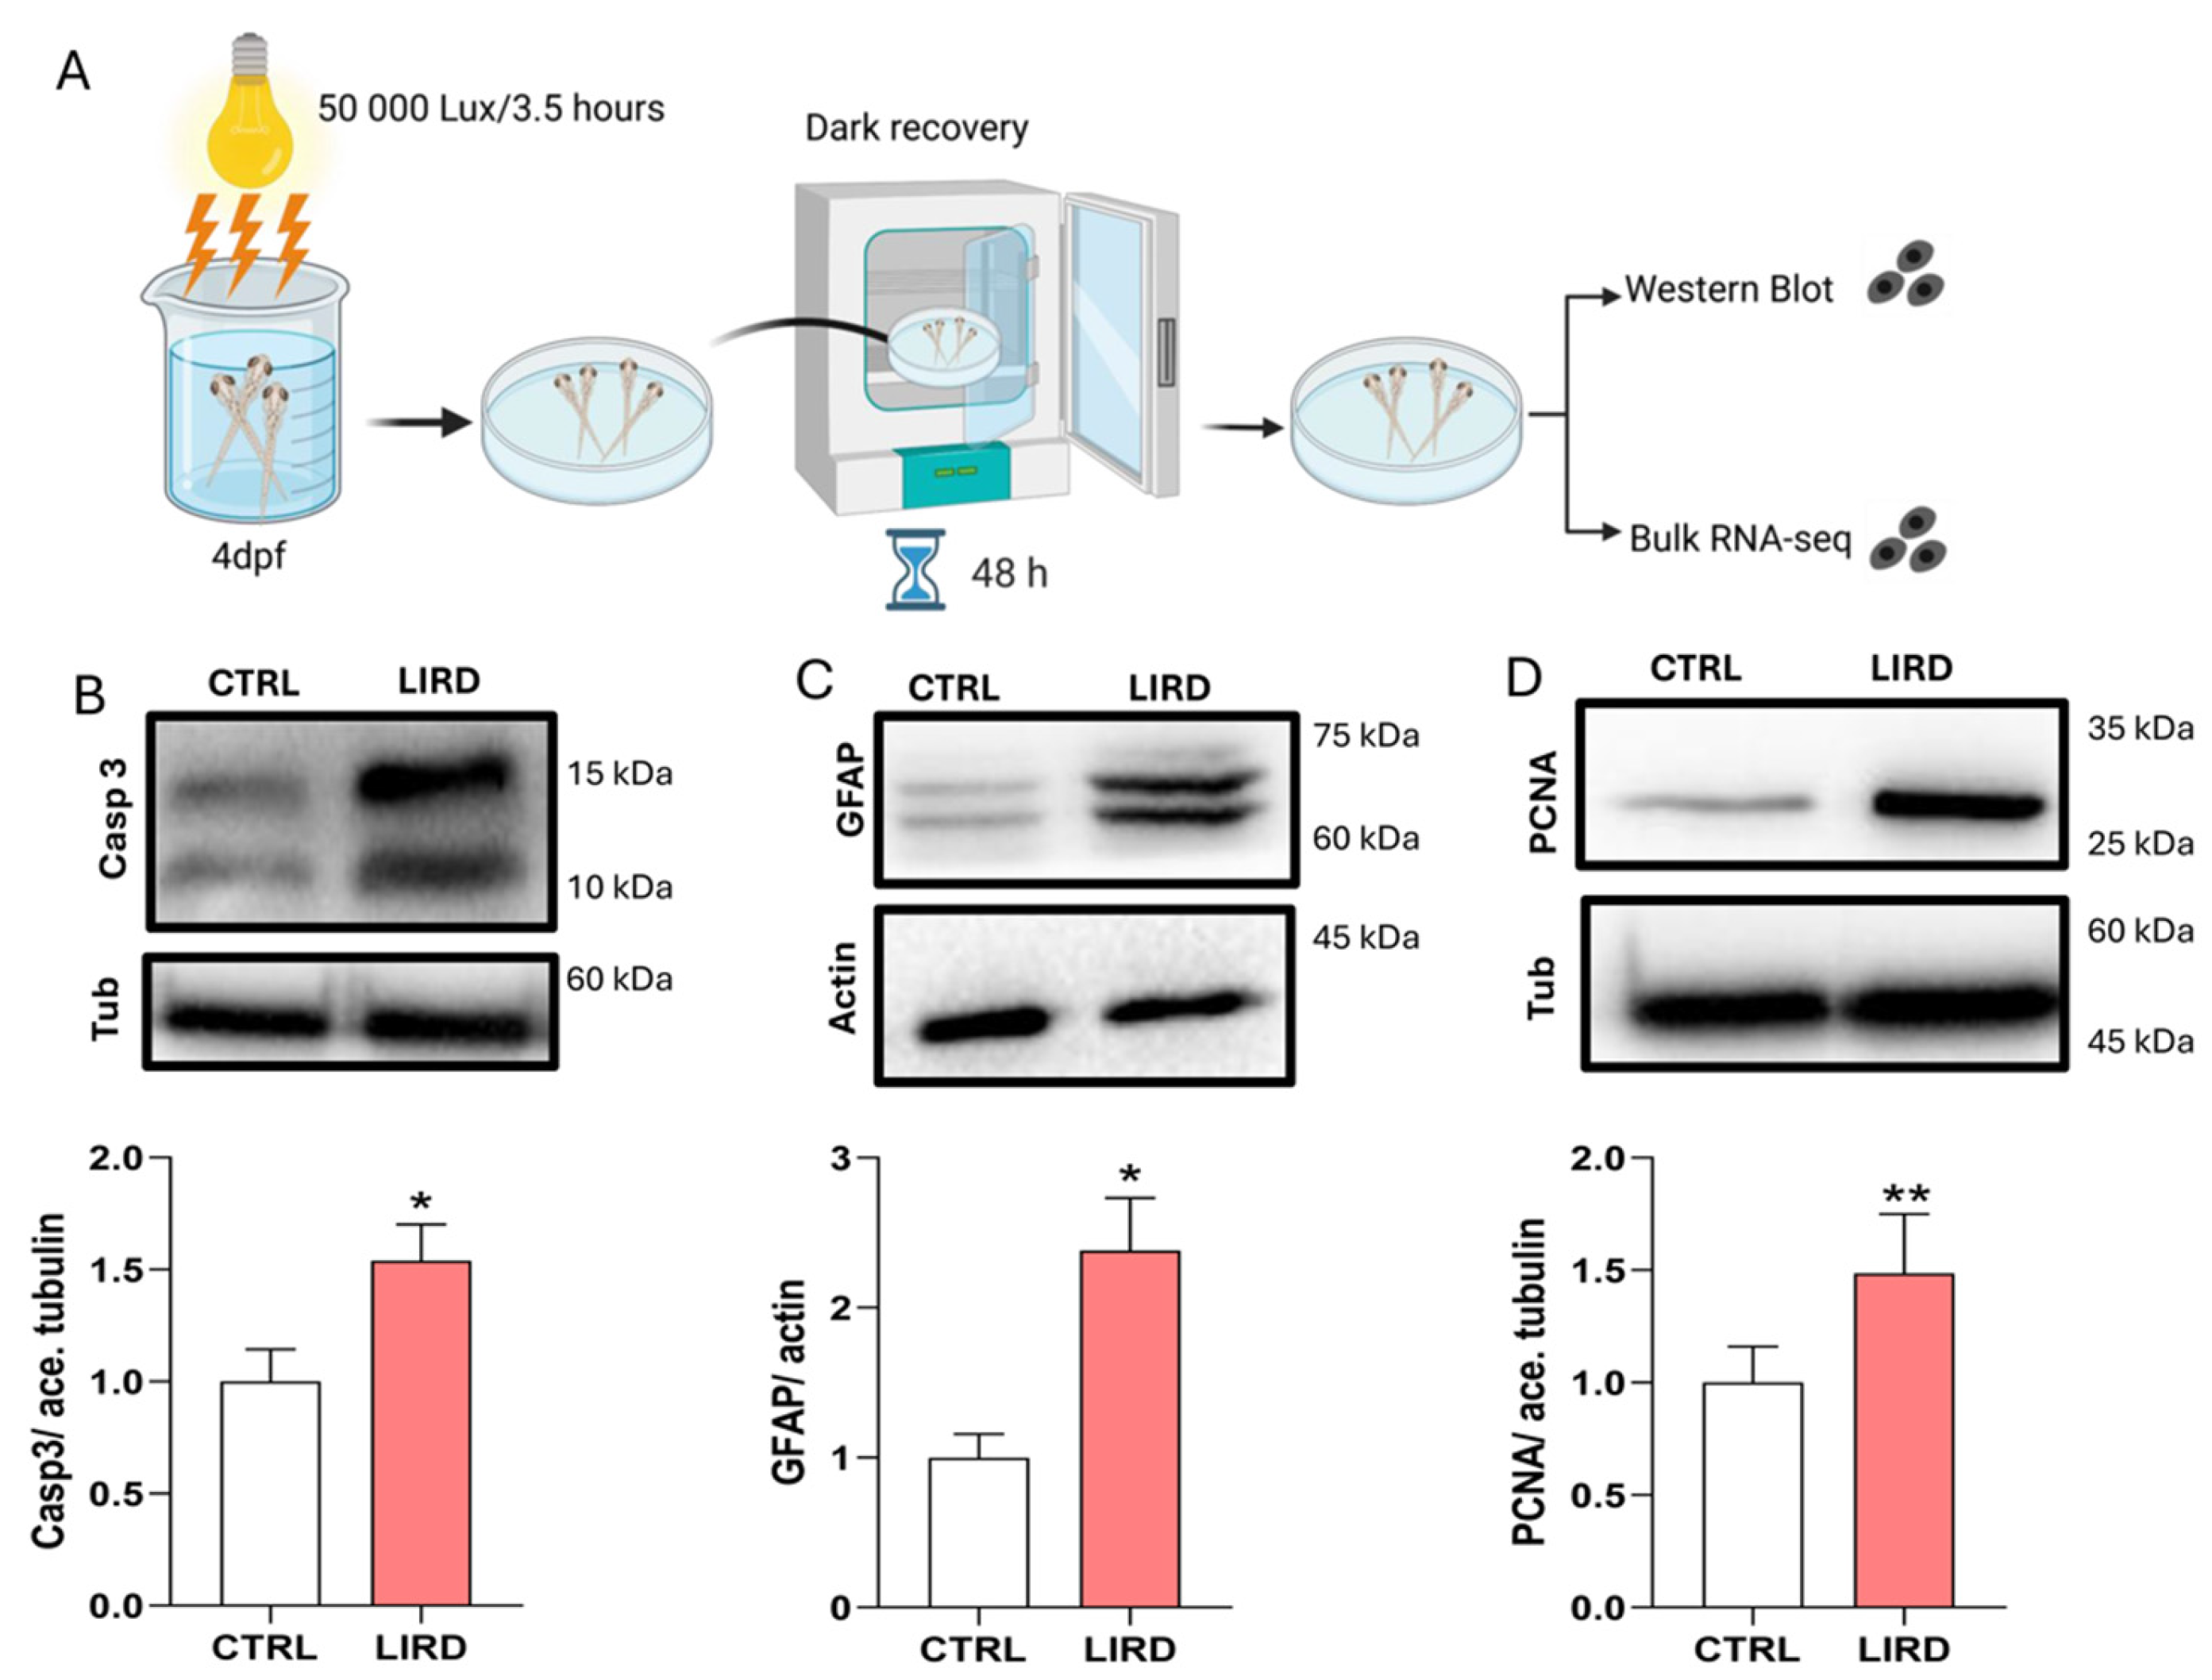
Figure 2.
Transcriptomic responses to LIRD in zebrafish larvae. (A) Volcano plot showing the distribution of differentially expressed genes (DEGs) between control (CTRL) and LIRD retinae at 48 HPL. Genes are colored according to statistical significance and fold change. Selected regeneration-associated (ascl1a, stat3, sox2) and stress-related (nos2a, cpa1, hbae3) genes are highlighted. (B) Bar plot summarizing the number of significantly upregulated (green) and downregulated (orange) DEGs identified between CTRL and LIRD conditions. (C1–C2) Bubble plots showing functional enrichment analyses of significantly regulated genes, including (C1) Gene Ontology (GO) Biological Process terms and (C2) KEGG signaling pathways. Dot size represents the number of genes per category, and color indicates adjusted p-values. (D) Transcript expression levels (log2(TPM + 1)) of selected isoforms (ascl1a-201, sox2-201, stat3-202), illustrating isoform-specific regulation following LIRD. (E) Heatmap showing expression patterns of the top 50 DEGs ranked by absolute fold change (z-scored log2 TPM). Red and blue indicate relative upregulation and downregulation, respectively, highlighting a distinct transcriptional signature in LIRD samples. (F) Principal component analysis (PCA) based on global gene expression (log2 TPM), showing clear separation between CTRL and LIRD groups. Each data point represents an independent biological replicate (N = 9 CTRL and 8 LIRD libraries, each library derived from a pool of 50 larval retinae).
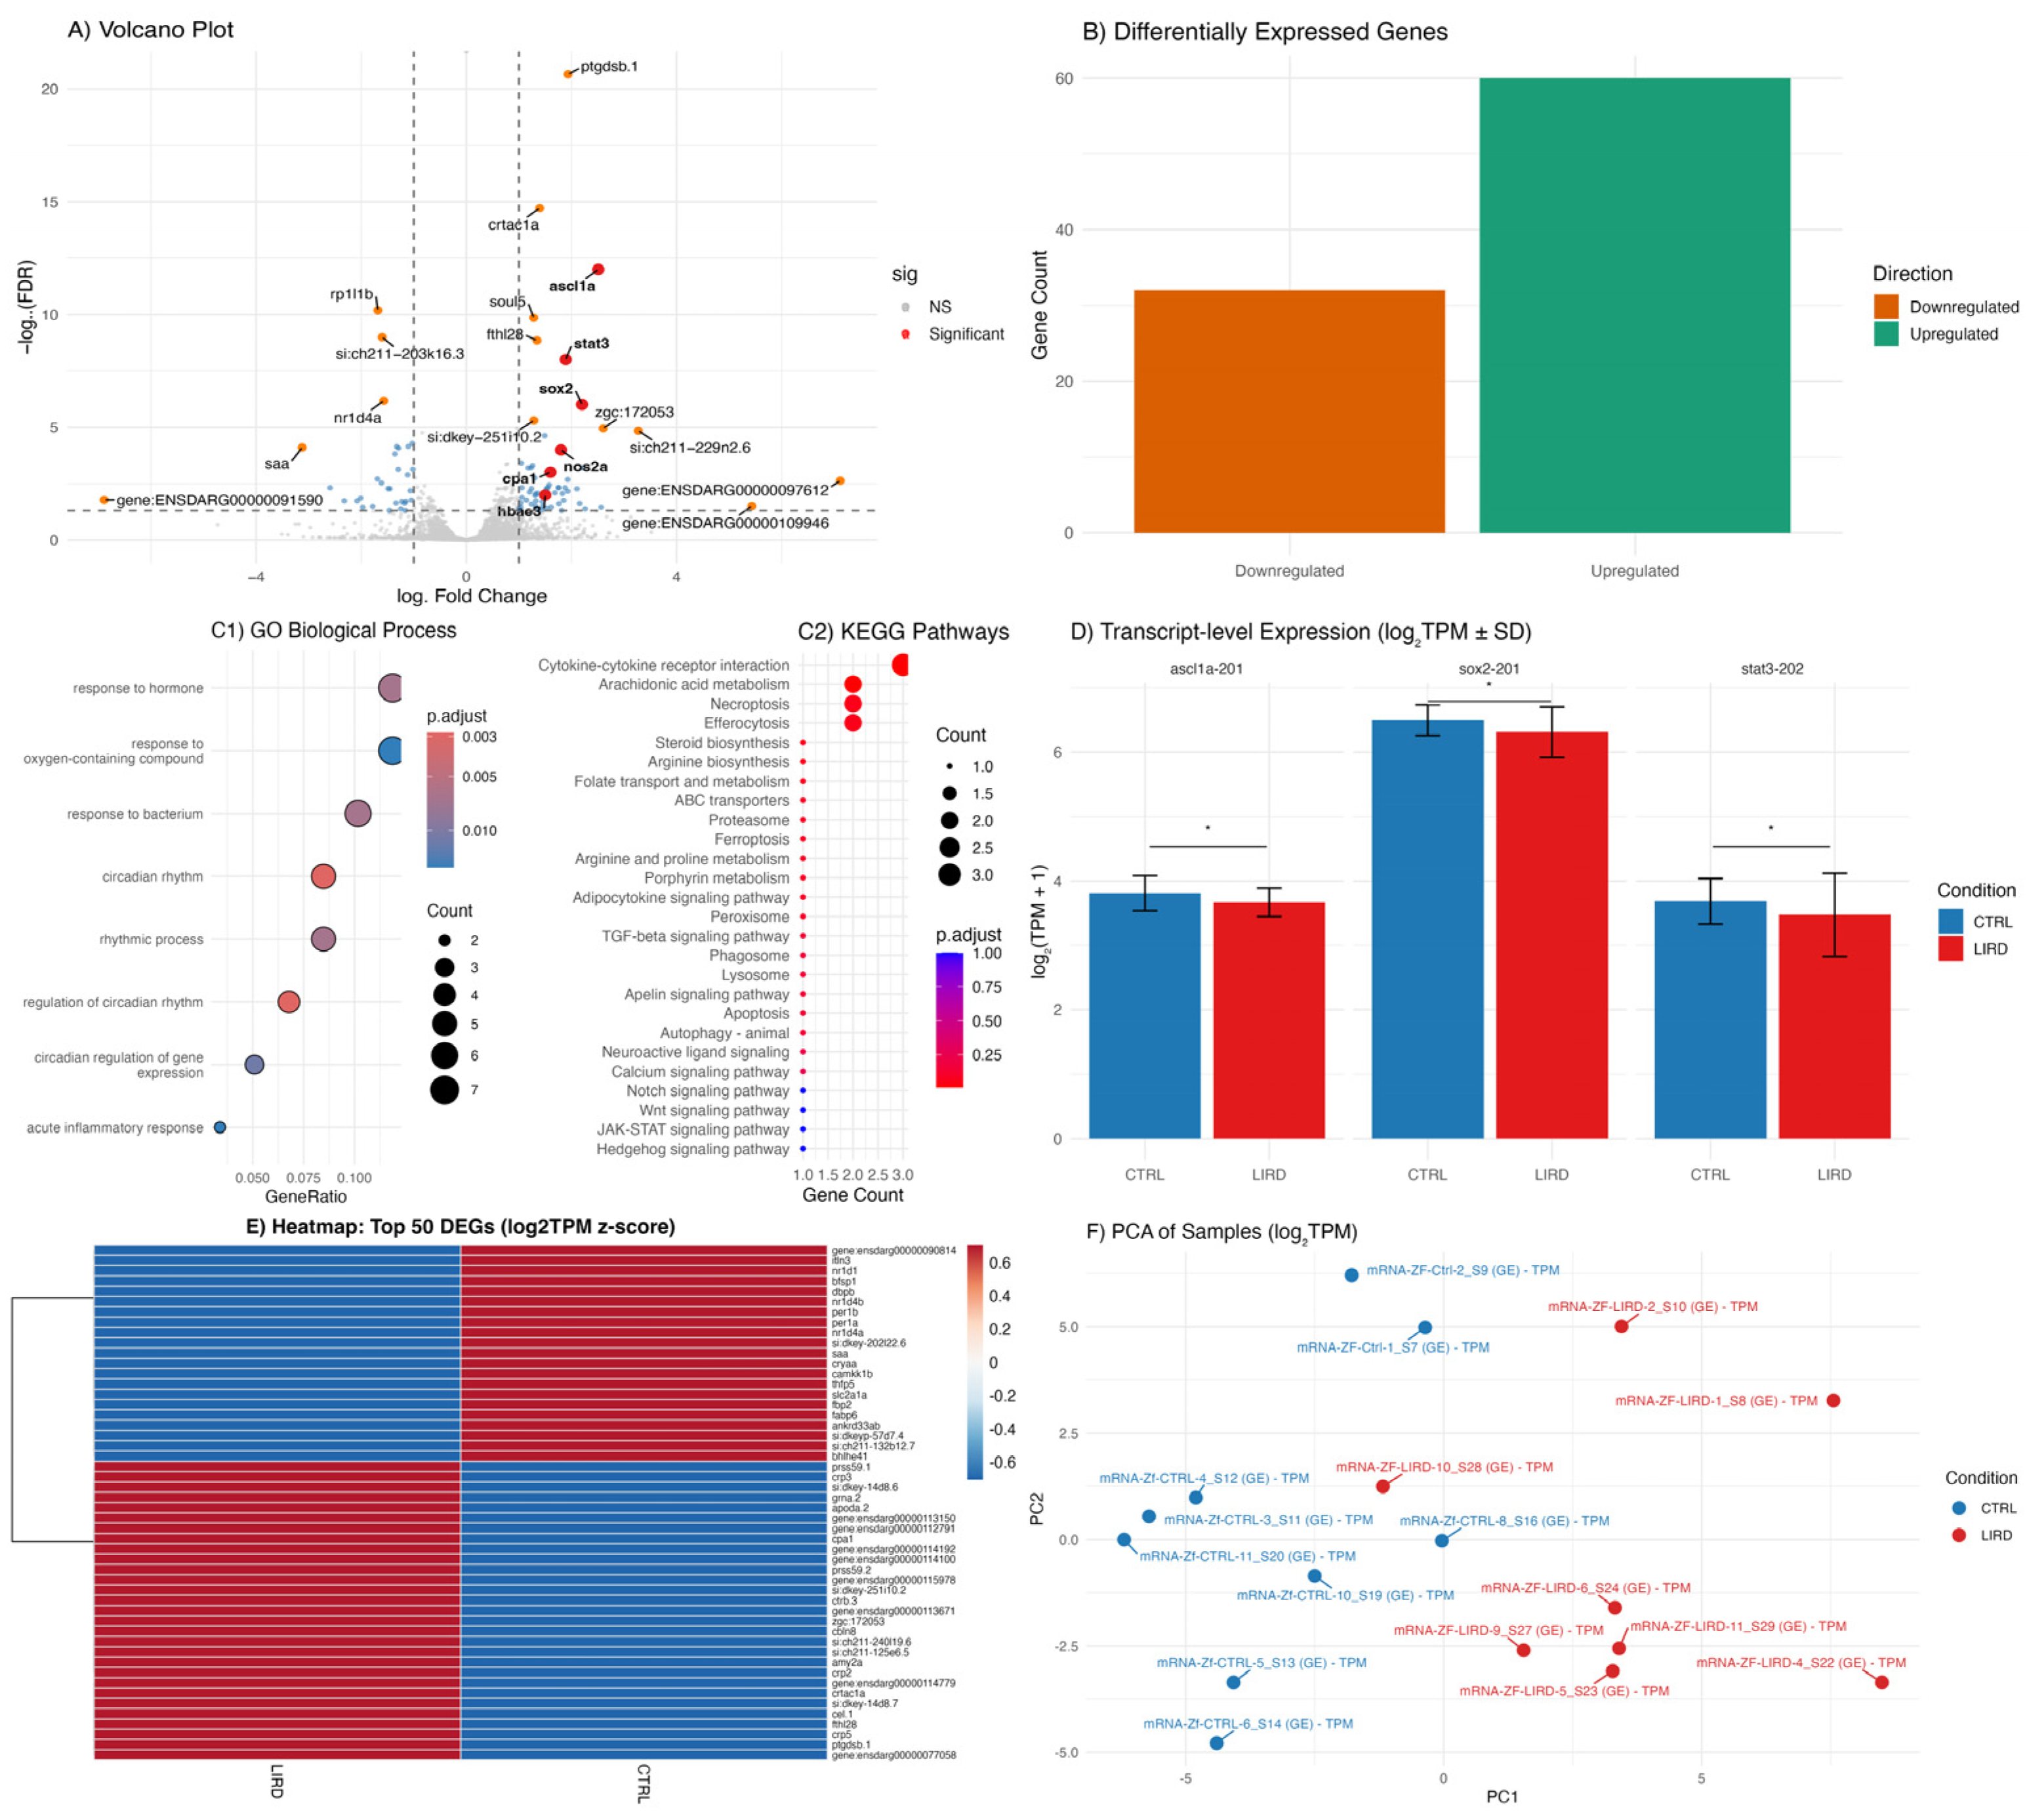
Figure 3.
Underexplored biological processes engaged during the early larval LIRD response. (A–E) Functional enrichment analyses of differentially expressed genes (DEGs) highlight biological processes that are less commonly described in zebrafish retinal injury paradigms. (A) Proteolysis-related biological processes. (B) Phototransduction-associated processes. (C) Hormone-mediated signaling pathways, highlighted by coordinated downregulation of Rev-erb nuclear receptors (nr1d1, nr1d4a, nr1d4b). (D) Oxygen transport-associated genes, including hemoglobin subunits (hbbe1.3, hbae3, hbbe1.2, hbae1.3). (E) Response to oxidative stress. (F) RT–qPCR validation of selected DEGs (cpa1, hbae3, nos2a), confirming the directionality of expression changes observed by RNA sequencing. Data are presented as mean ± SEM. Each data point represents an independent biological replicate (N = 9 CTRL and 8 LIRD libraries, each library derived from a pool of 50 larval retinae).
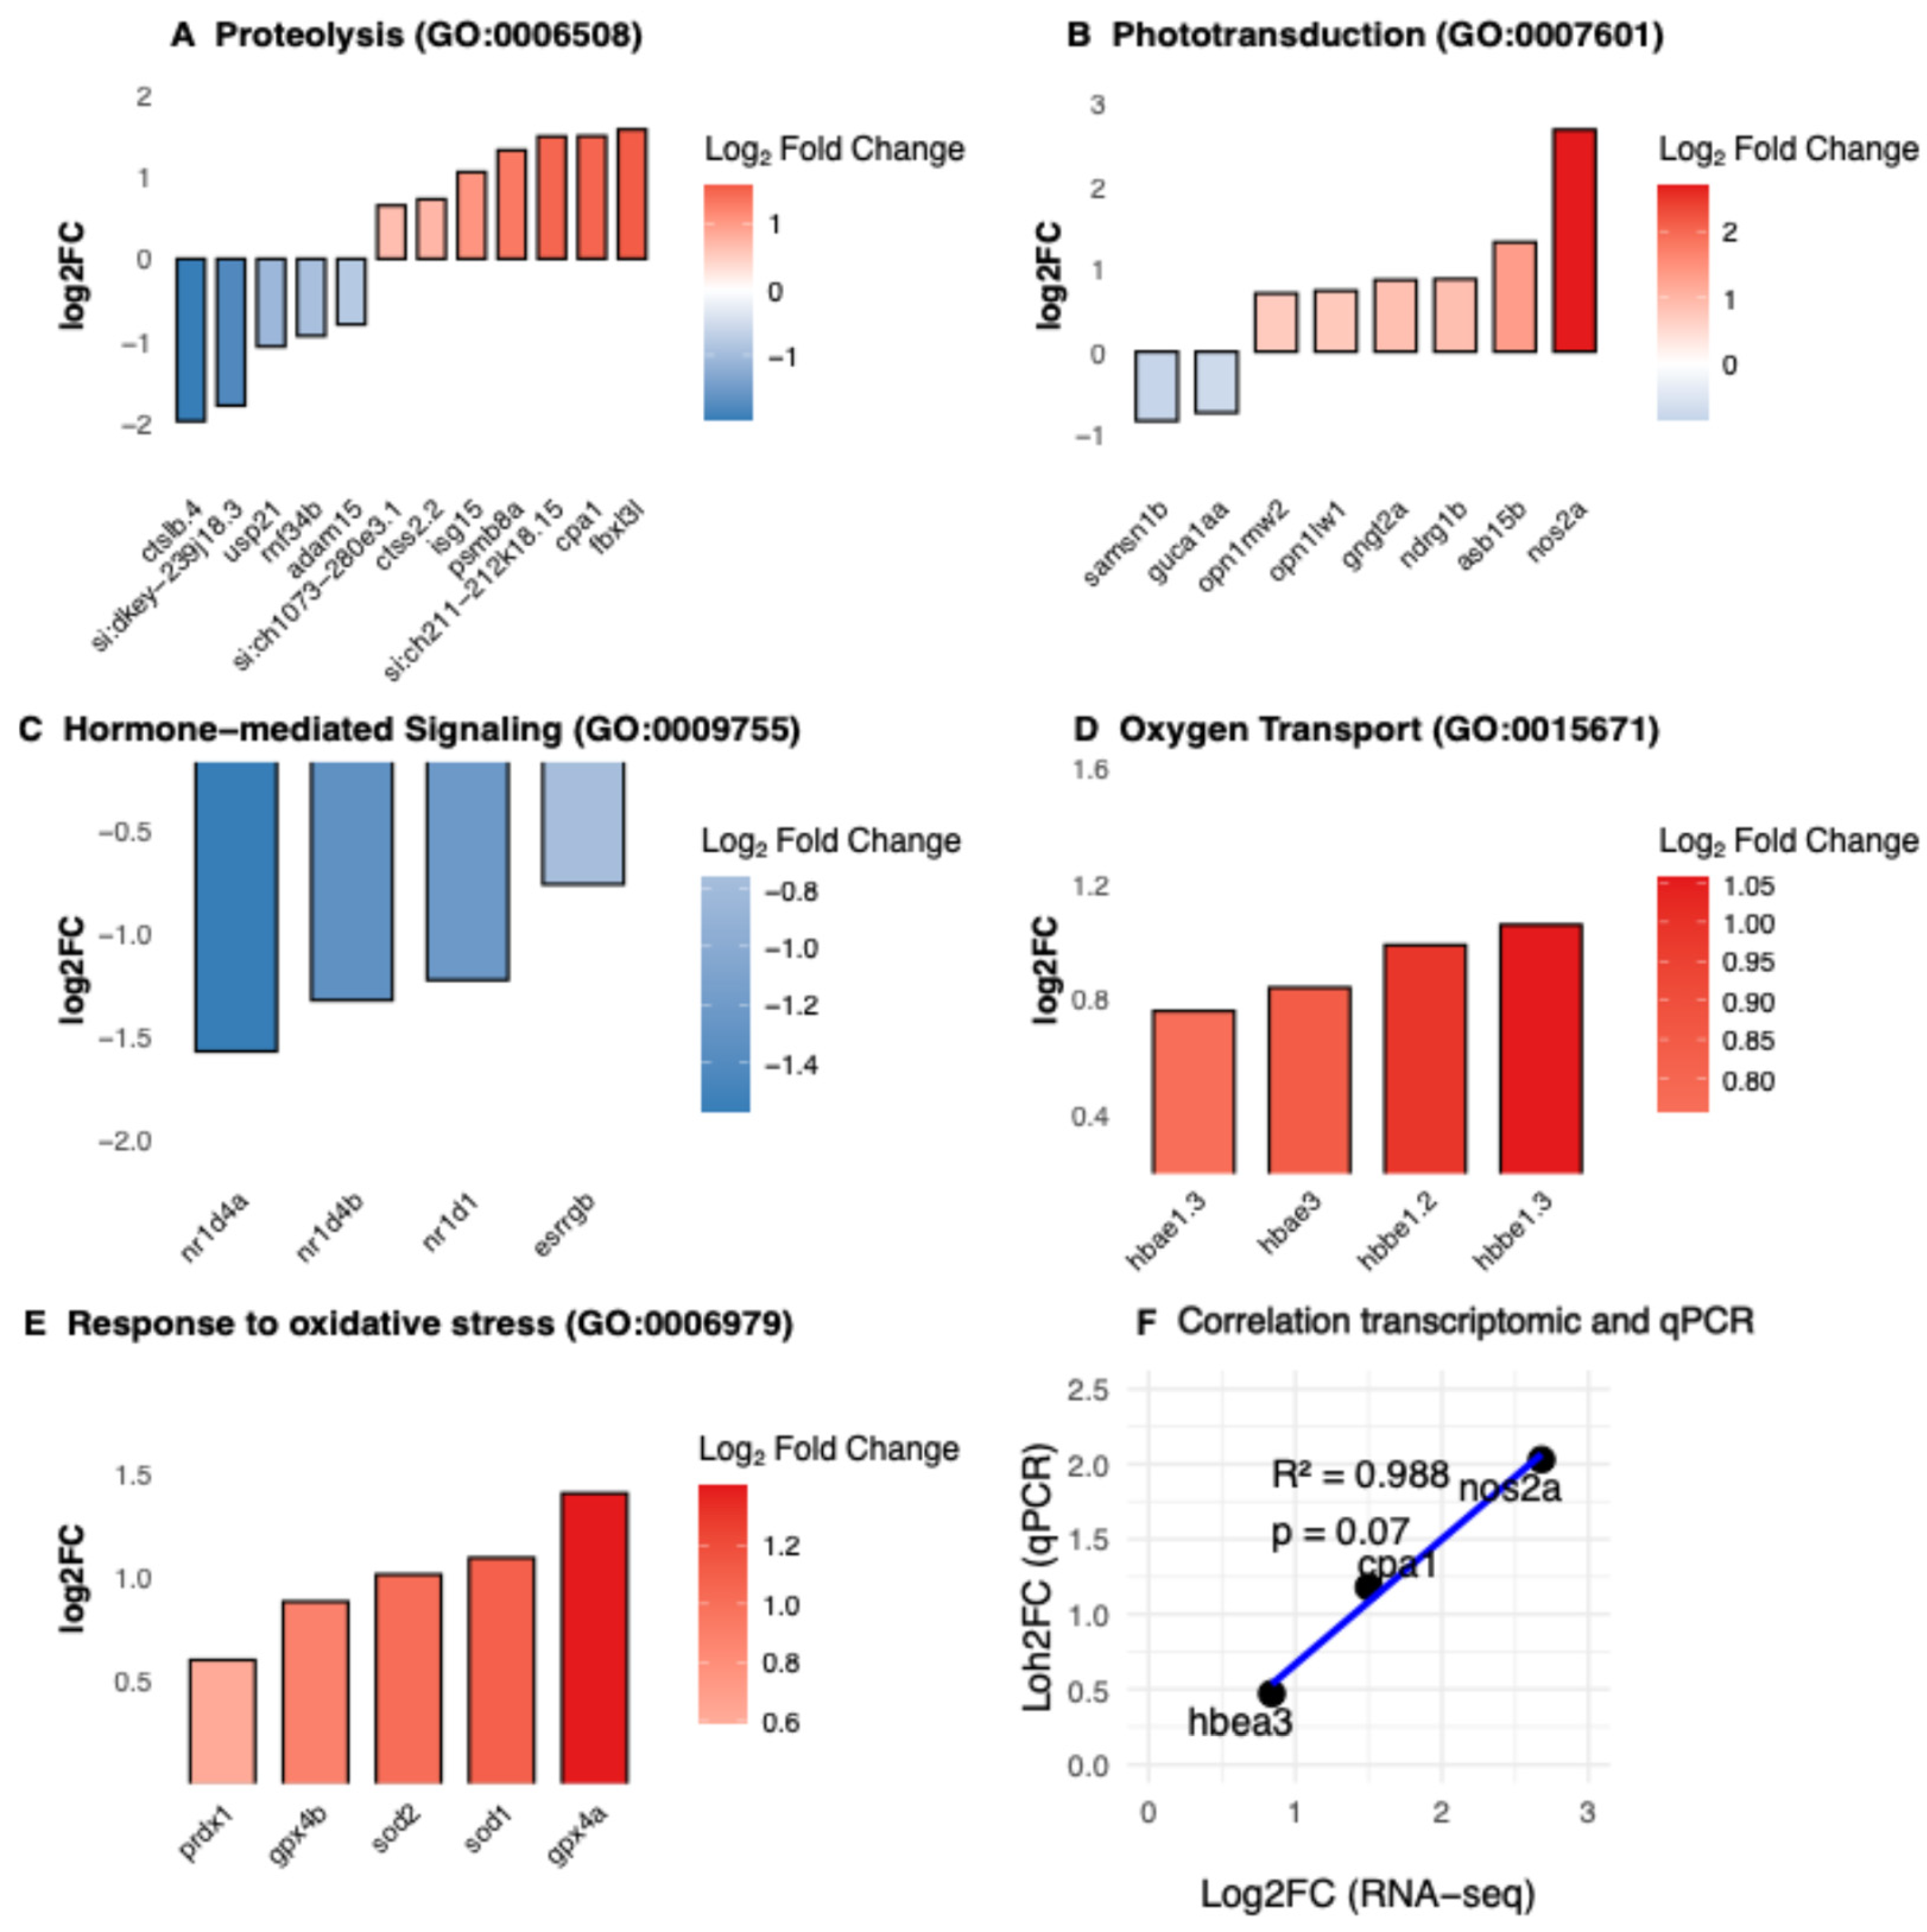
Figure 4.
Antioxidant treatment modulates oxidative stress, apoptosis, and early regeneration-associated responses following LIRD. (A) Schematic overview of the LIRD paradigm and NAC treatment. Immediately following LIRD, larvae were transferred to E3 medium containing 100 μM N-acetylcysteine (NAC) and allowed to recover for 48 h under standard conditions. Pools of 50 larval retinae were collected for each biological replicate for RT–qPCR or Western blot (WB) analyses. (B–F) RT–qPCR analysis of oxidative stress, apoptosis, inflammation, and regeneration-associated markers. Expression levels of sod1 (B), bax (C), il1β (D), gfap (E), and pcna (F) were normalized to the housekeeping gene ube2a and expressed as fold change relative to control. N = 4 biological replicates per condition. Data are presented as mean ± SD. Statistical significance was assessed using two-way ANOVA with Sidak’s multiple-comparisons test. *P ≤ 0.05, **P ≤ 0.01, #P ≤ 0.05, as indicated.
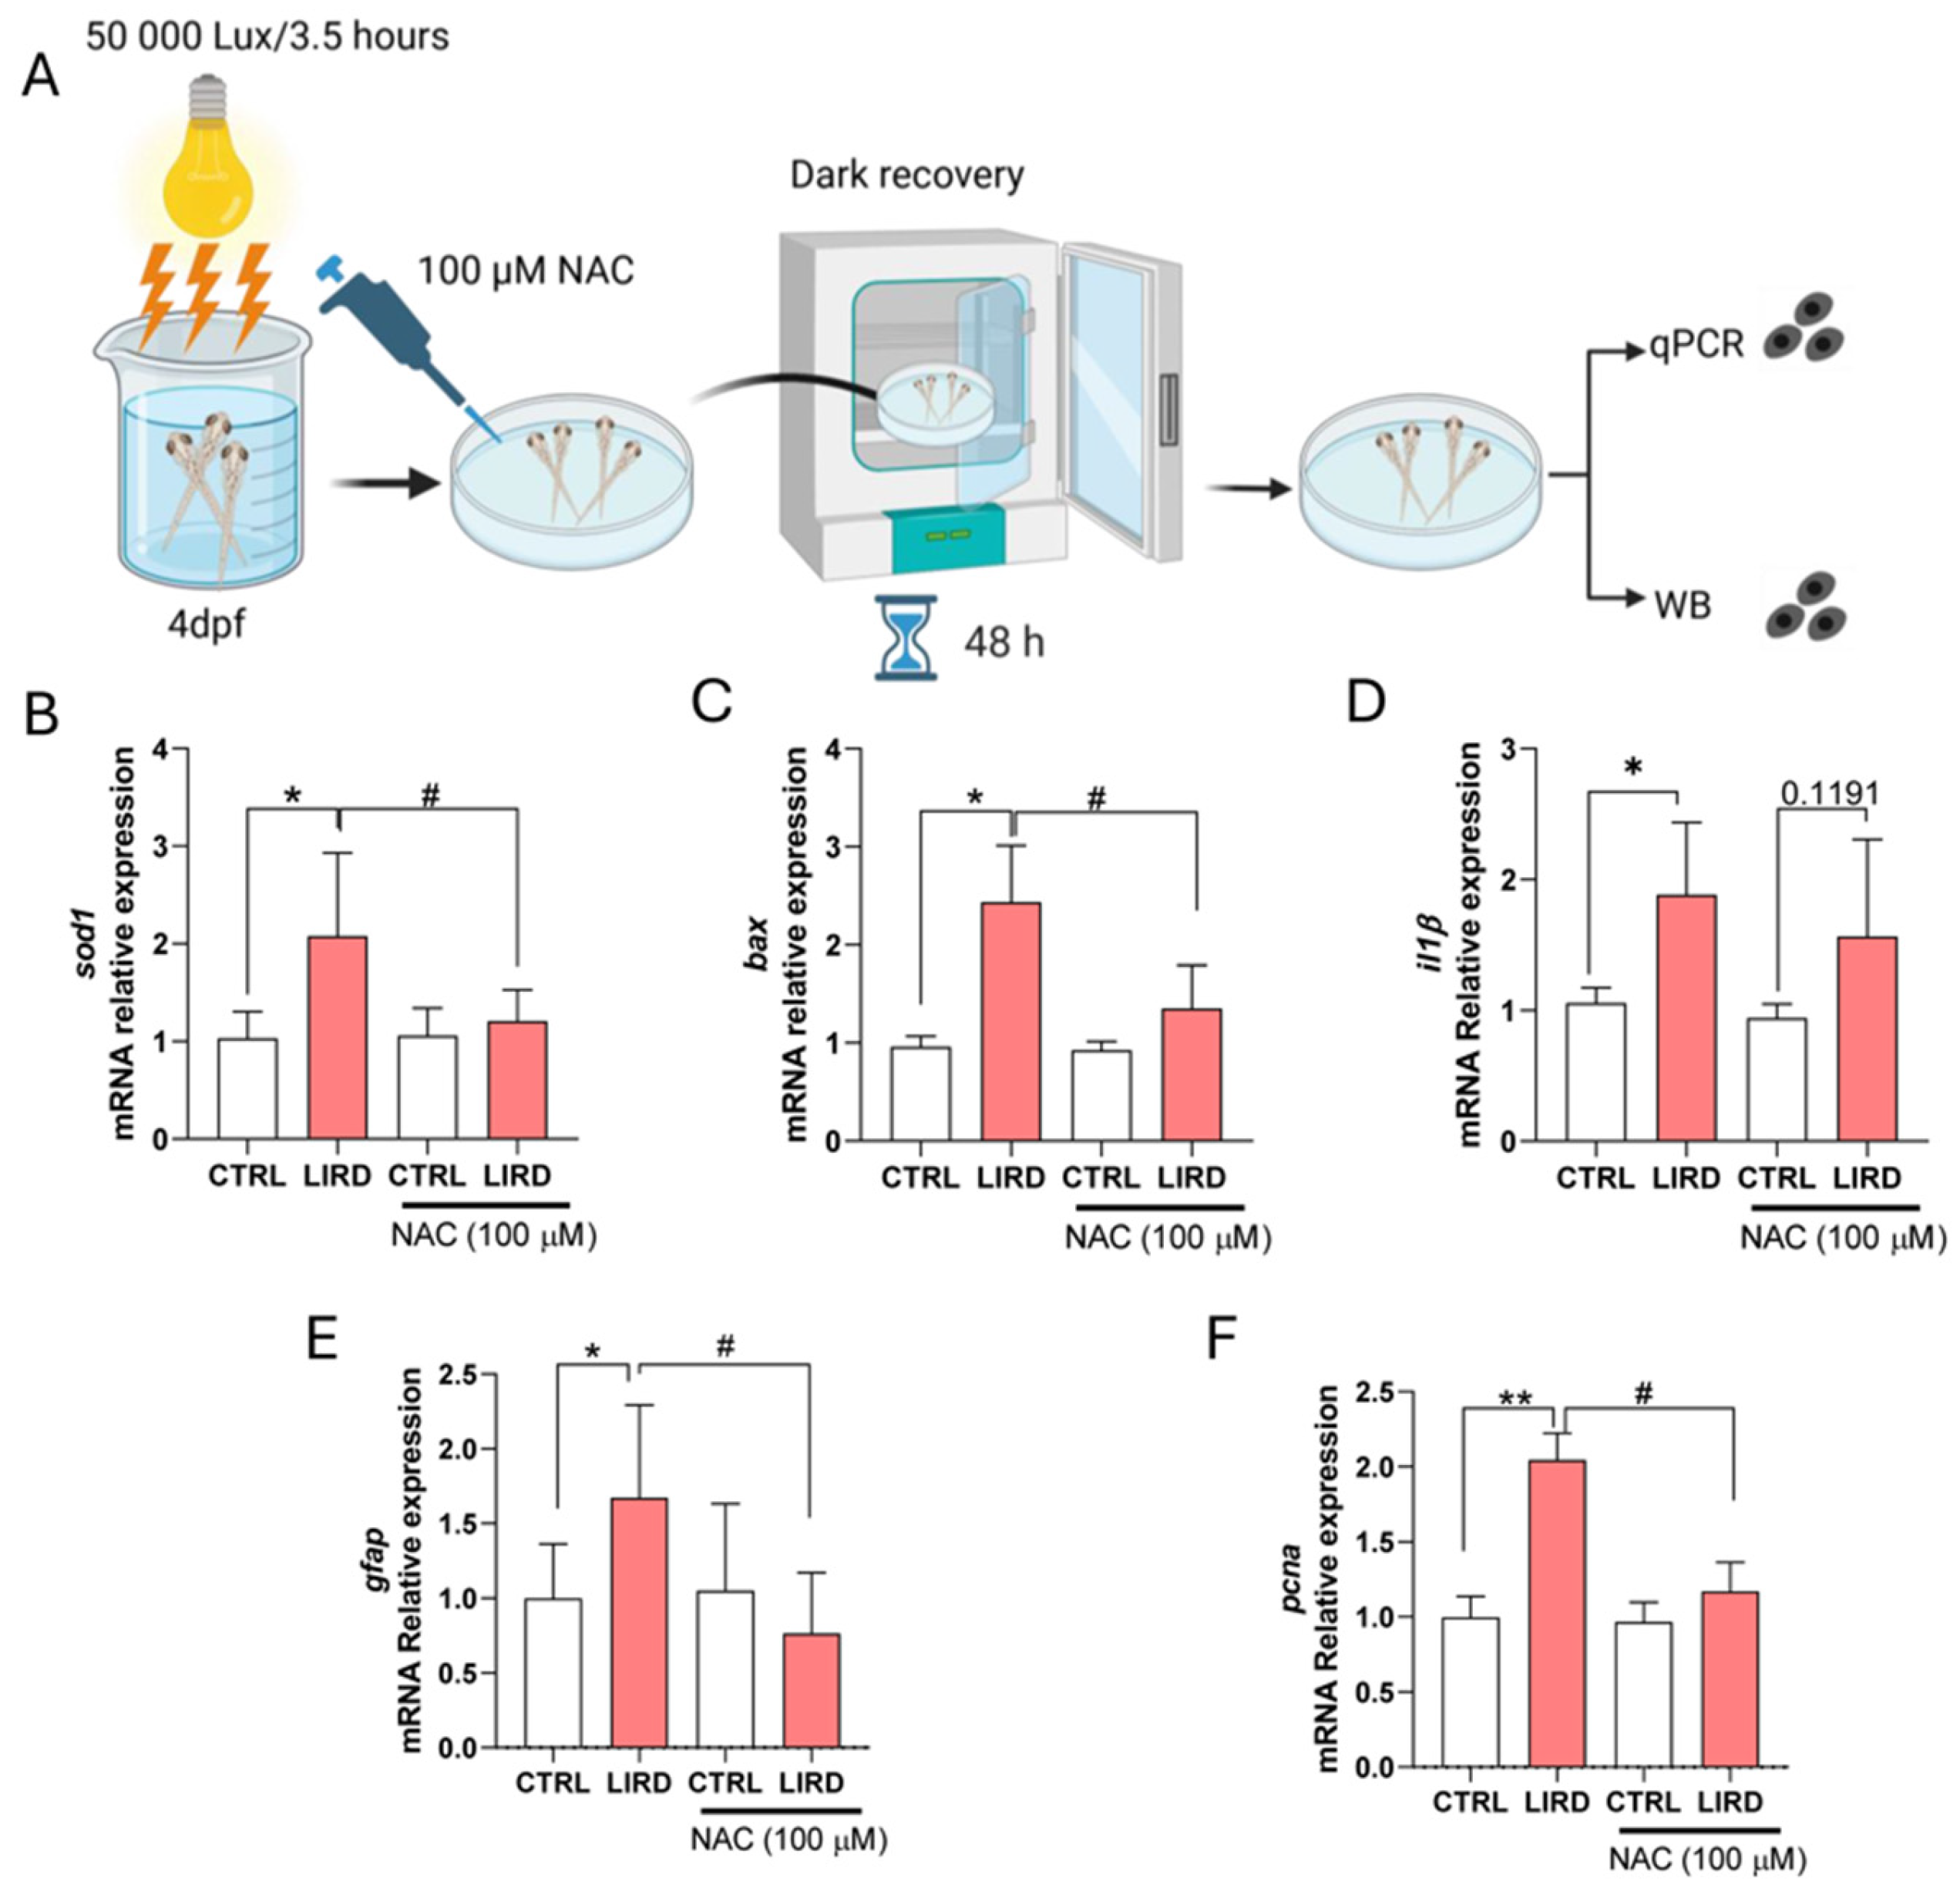
Figure 5.
Antioxidant treatment modulates apoptosis- and growth-associated signaling following LIRD. (A–D) Western blot (WB) analyses assessing oxidative stress-associated responses following LIRD in the presence or absence of NAC. (A) Representative Western blot (top) showing cleaved caspase-3 (Casp3), with acetylated tubulin (Tub) used as a loading control. Densitometric quantification (bottom) is normalized to control levels (N = 4 biological replicates per condition, each derived from a pool of 50 larval retinae). (B) Representative Western blot (top) showing proliferating cell nuclear antigen (PCNA), with acetylated tubulin used as a loading control. Densitometric quantification (bottom) normalized to control levels (N = 4 biological replicates per condition). (C) Representative Western blot (top) showing phosphorylated ERK (pERK), with acetylated tubulin used as a loading control. Densitometric quantification (bottom) normalized to control levels (N = 4 biological replicates per condition). (D) Representative Western blot (top) showing phosphorylated YAP (pYAP), with acetylated tubulin used as a loading control. Densitometric quantification (bottom) normalized to control levels (N = 4 biological replicates per condition). Data are presented as mean ± SD. Statistical significance was assessed using two-way ANOVA with Sidak’s multiple-comparisons test. *P ≤ 0.05, **P ≤ 0.01, #P ≤ 0.05, as indicated.
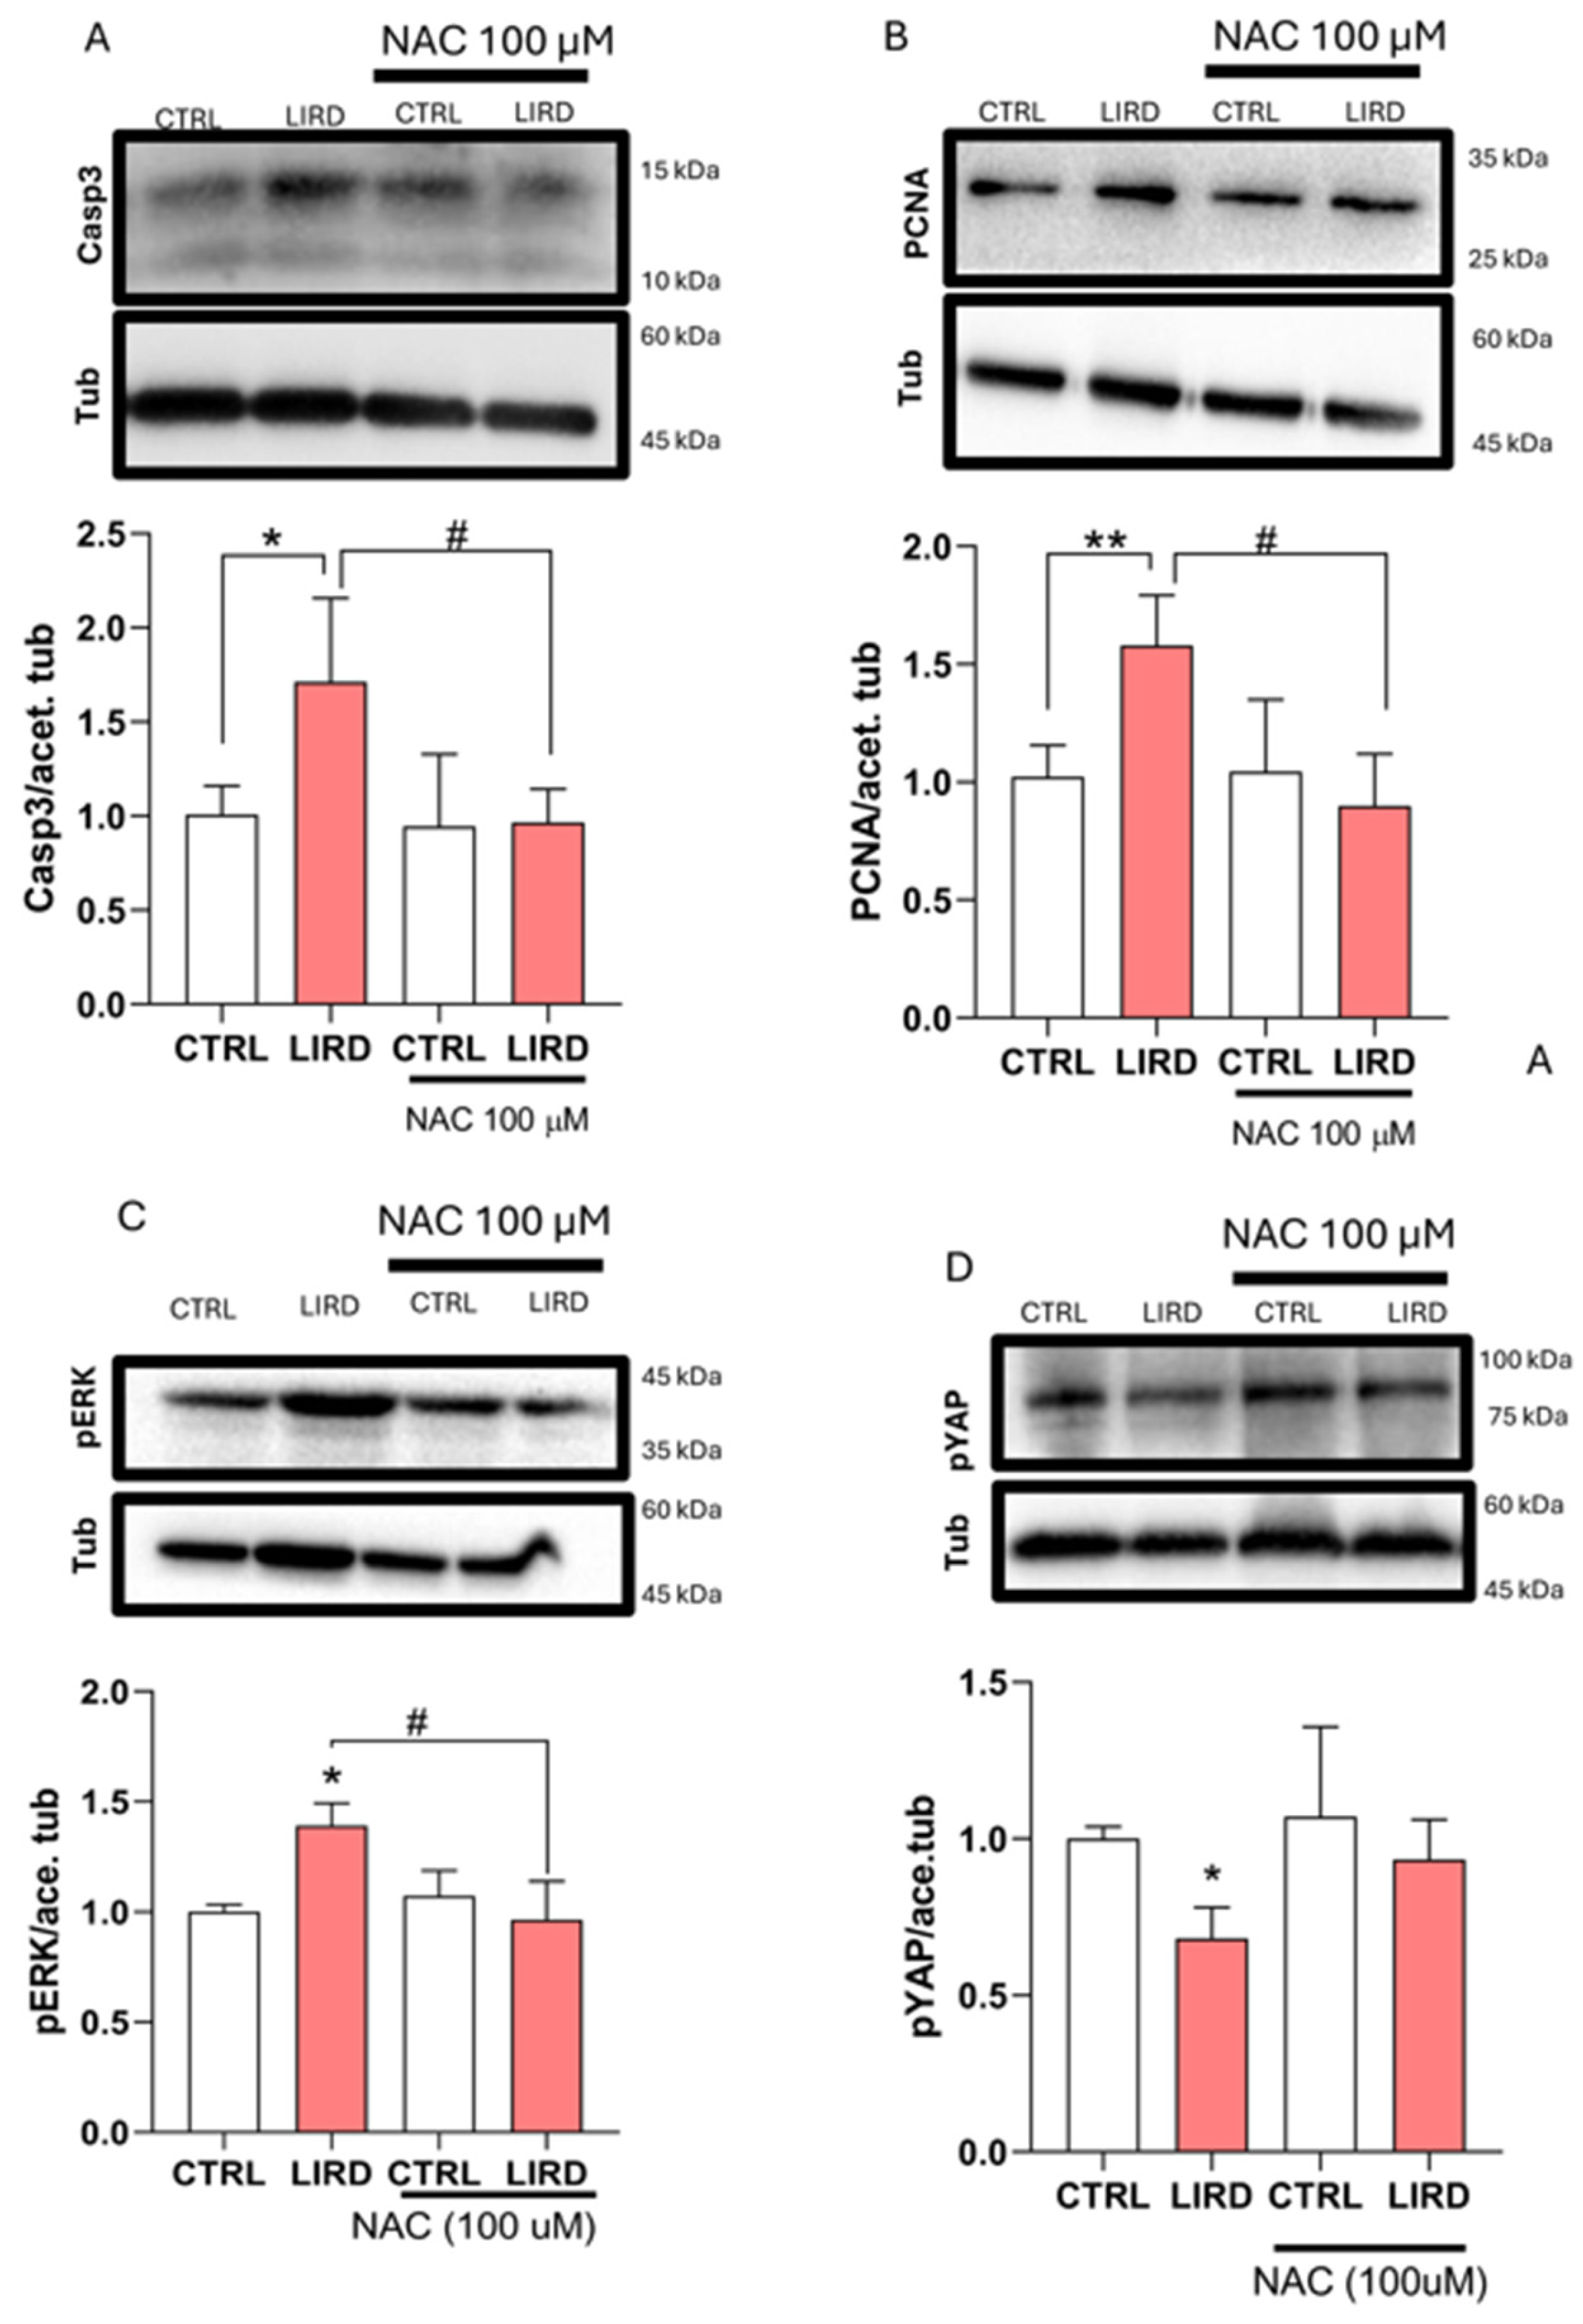
Figure 6.
Subtoxic H2O2 exposure promotes proliferation without overt apoptosis in zebrafish larvae. (A) Schematic of intra-retinal injection of vehicle (PBS) or hydrogen peroxide (H2O2; 100 μM) in 4 dpf zebrafish larvae, followed by 48 h recovery under standard conditions. Pools of 50 larval retinae were collected for RT–qPCR or Western blot (WB) analysis. (B–D) RT–qPCR analysis of bax (B), pcna (C), and gfap (D), normalized to the housekeeping gene ube2a and expressed relative to PBS controls. (E) Top: Representative WB showing cleaved caspase-3 with acetylated tubulin as a loading control. Bottom: Densitometric quantification normalized to control. (F) Top: Representative WB showing PCNA with acetylated tubulin as a loading control. Bottom: Densitometric quantification normalized to control. N = 4 biological replicates per condition, each consisting of pooled larval retinae. Data are shown as mean ± SD. Statistical significance was assessed by unpaired t-test; *P ≤ 0.05.
Disclaimer/Publisher’s Note: The statements, opinions and data contained in all publications are solely those of the individual author(s) and contributor(s) and not of MDPI and/or the editor(s). MDPI and/or the editor(s) disclaim responsibility for any injury to people or property resulting from any ideas, methods, instructions or products referred to in the content. |
© 2026 by the authors. Licensee MDPI, Basel, Switzerland. This article is an open access article distributed under the terms and conditions of the Creative Commons Attribution (CC BY) license (http://creativecommons.org/licenses/by/4.0/).
Copyright: This open access article is published under a Creative Commons CC BY 4.0 license, which permit the free download, distribution, and reuse, provided that the author and preprint are cited in any reuse.


