Submitted:
06 February 2026
Posted:
09 February 2026
You are already at the latest version
Abstract
Stone fruit trees are important fruit crops in Jordan and decline and dieback diseases have recently caused problems in many Jordanian orchards. This study aimed to estimate dieback and decline incidence and severity in selected orchards, to isolate and identify the causal agents associated with decline and dieback symptoms, and to test the efficacy of some fungicides against isolated pathogens. Field surveys were carried out, and representative samples of diseased trees were collected to isolate and identify the causal organisms. Molecular analyses of DNA sequences of the Internal Transcribed Spacer (ITS) regions of fungal ribosomal DNA (r-DNA) and partial sequence of the translation elongation factor (TEF1-α) gene were used to confirm the morphological identifications of the fungal isolates. Mean disease incidence was 72% across all the orchards evaluated, ranging from 43 to 100% in individual orchards. Disease severity ranged from 1.1–2.4 (mean =1.6) on a 0-4 scale. The most prevalent pathogens identified were Fusarium oxysporum, Fusarium proliferatum, Neoscytalidium dimidiatum and Neoscytalidium hyalinum, Valsa sordida, and Cladosporium oxysporum. All fungicides tested exhibited high efficacy in inhibiting radial mycelial growth of the tested fungal isolates. The mean EC50 values for Azoxystrobin, Pydiflumetofen, Difenoconazoleand Tebuconazole were 0.9, 0.07, 0.001, and 0.0003 mg a.i/ml, respectively. The EC50 values of the tested fungicides confirmed the high sensitivity of all tested fungal isolates to these fungicides. Overall, these findings suggest that the tested fungicides could serve as useful tools for managing stone fruit dieback and decline.
Keywords:
peach
; apricot
; fungal trunk diseases
; botryosphaeria dieback
; azoxystrobin
; difenoconazole
; tebuconazole
; pydiflumetofen
1. Introduction
Stone fruit trees, including Peach (Prunus persica L. Batsch), Apricot (Prunus armeniaca (L.) Dumort.), Plum (Prunus domestica L.), Almond (Prunus dulcis (Miller) Webb), and Cherries (Prunus avium L.), are highly significant fruit trees worldwide [1]. These trees are renowned for their exceptional taste and are considered among the most desirable fruit crops within the category of temperate fruit crops [1]. The global production of stone fruits exceeded 47 million tons in 2017 [2]. In the 2024-2025 growing season, the global production of peaches, nectarines, and cherries was estimated at 28.473 million tons [3].
Stone fruit trees in Jordan are considered major economic crops. The total area cultivated with stone fruit trees is estimated at 4792 ha, from which 3460 ha (163,108 trees) are in Al Mafraq, representing about 72% of the total area planted to stone fruit trees in Jordan [4]. In Jordan, stone fruit trees suffer from many abiotic and biotic stresses. Abiotic stresses include soil and water salinity, drought, early spring frosts, low winter temperatures, hail, and occasional heat stress during summer. Biotic stresses include many insect-plant pests and plant diseases.
In recent years, farmers in Jordan started to face a new challenge in the production of stone fruit trees, represented by the appearance of dieback symptoms, twig blights, and decline. Mixed infections might cause these symptoms and include interactions between biotic and abiotic stresses. However, many of the symptoms observed worldwide are caused by fungal plant pathogens known as fungal trunk diseases (FTDs) [5].
Decline and dieback result in a range of symptoms such as shoot and leaves discoloration and distortion, poor growth, cankers, root mortality, wood staining and necrosis, decline, and dieback of the whole plant [5]. In addition, rapid collapses in twigs and branches in mid-summer with leaf chlorosis that suddenly wilt and die, as well as sunken lesions on the bark of twigs and branches and production of black stroma on some infected shoots or dead wood, have also been reported [6,7]. Prunus species may exhibit a characteristic symptom known as “gummosis,” which is observed as oozing gummy substances on the trunk of the infected area (Bush, 2018). Internal symptoms include brown to black vascular streaks that can be visible in cross-sections as circular spots or other shapes of xylem tissue discolorations, with a frequent observation of wedge-shaped necrosis. Infected trees may die within a few weeks after the first symptoms appear, and in later stages, twigs, branches, and shoots wilt and die [6,7].
Decline and dieback affecting fruit crops are primarily caused by various fungi that invade the host wood through different types of wounds, subsequently colonizing the vascular tissues [8]. These wood pathogens induce symptoms such as cankers, gummosis, wood rotting, blight, and dieback [7]. In severe cases, the dieback of shoots, branches, and main trunks can result in the death of the affected trees [9]. Numerous fungal pathogens associated with decline and fungal trunk diseases (FTDs) have been identified as species within the families Botryosphaeriaceae, Calosphaeriaceae, Diaporthaceae, Diatrypaceae, Nectriaceae, Phaeomoniellaceae, Pleosporaceae, Togniniaceae, and Valsaceae [10,11,12,13,14].
Infection with fungal trunk pathogens is facilitated by wet weather conditions, which can result in spores being dispersed through rain or via insects and humans. The timing of infection is typically in late autumn or early winter and/or late winter or early spring, with the fungi generally penetrating through pruning wounds [6,15]. Pathogens responsible for fungal infections can be spread through asymptomatic plant material, seedlings, and fruits, and the avoidance of country and regional quarantine measures can exacerbate the issue [5].
Control methods for FTD currently focus on removing infected wood, avoiding wounding during or immediately after rains, and using wound protection paints [16]. In the nursery propagation process, control measures can reduce the risk of producing infected grafted plants [17]. A recent study [5] suggests that chemical fungicides are the main strategy for controlling FTD in both nursery propagation material and mature plants in orchards, and pruning wound protection is critical for reducing disease incidence. However, there are few products currently registered for effective control of FTD worldwide, and future research should focus on expanding the range of chemical and alternative options for this purpose [5].
In Jordan, the decline and dieback of stone fruit trees have emerged as a major threat, affecting numerous stone fruit orchards across the country. Unfortunately, the causes of these diseases remain unknown, as there has been a lack of research on their etiology. Identifying the specific fungal pathogens responsible for decline and dieback in Jordan is crucial to implement effective management strategies. Thus, this research aims to investigate the prevalence of decline and dieback in the major stone fruit-growing region of Jordan, characterize the fungal pathogens at the molecular level, assess their pathogenicity, track the progression of the diseases in inoculated seedlings from the points of inoculation both upwards and downwards, and evaluate the effectiveness of selected fungicides in inhibiting mycelium growth in vitro for selected fungal isolates identified in this study.
2. Results
2.1. Field Surveys, Sample Collection, and Estimation of Decline and Dieback Incidence and Severity
Infected trees in surveyed orchards exhibited decline and dieback disease symptoms, including severe chlorosis in the leaves with smaller sizes than normal ones, branch dieback, necrotic spots on leaves, leaf defoliation, branch and twig decline, cankers, and gummosis (Figure 1). Internal symptoms were also observed and recorded, which included brown to dark brown discoloration of the vascular system in branches and trunks (Figure 2).
The mean disease incidence of dieback and decline was 72% across the ten orchards surveyed (Table 2). The incidence of the disease ranged from 43% to 100% in the surveyed orchards (Table 2), with the highest disease incidence (100%) recorded in the peach orchard at Koum Al Ruf followed by a nectarine orchard at the Sabha location (89% disease incidence), and another nectarine orchard at Al Zaatari location (80% disease incidence). The remaining locations and orchards had lower disease incidence with values less than 80% (Table 2).
The severity scores of the dieback and decline diseases varied from 1.12 to 2.41 across all orchards located in different regions, with a mean value of 1.55 (Table 2). The peach cultivar at Umm El Jimal demonstrated the highest severity score of 2.41, while the lowest severity score, 1.12, was observed in the nectarine cultivar at Sabha (Table 2).
2.2. Morphological Identification of the Isolated Fungal Isolates
Fifty fungal isolates were obtained from the collected diseased plant samples. The identification of the isolates was carried out by comparing their morphological characteristics with those described in the literature. Isolates with dark green to black, fast-growing mycelium and pigmented conidia were classified as a species of Botryosphaeriaceae and specifically classified as Neoscytalidium spp., according to a taxonomic key of Phillips et al. [18]. Neoscytalidium spp. isolates growth on PDA plates started as a white or hyaline colony, transitioned to an olive-green to greyish color, and finally turned dark gray to black after 10–12 days. Colonies produced mycelia that disarticulated into 0- to 2-septate, cylindrical to oblong, hyaline to dark brown arthroconidia occurring singly or in arthric chains. Pycnidia, produced after 4 weeks of incubation at 25 °C were dark brown to black, irregular in shape to ovoid, and occurred mostly in aggregates.
The other group of isolates with white mycelium and fast growth on PDA were classified as Fusarium spp. Colony morphology on PDA varies widely. Mycelia may be floccose, sparse, or abundant and range in color from white to pale violet. Fusarium isolates produced both microconidia and macroconidia in culture. The macroconidia are slender and usually 3- to 5-septate. Microconidia form in chains and, less commonly, in false heads from monophialides or polyphialides. Some isolates produced chlamydospores after 2 weeks of incubation, found in clusters or short chains, terminal or intercalary in aerial, submerged, or surface hyphae. Other isolates did not produce any chlamydospores. Ten isolates could not be identified by morphology and were identified by molecular method
2.3. Molecular Identification of Fungal Isolates
The amplification of the Internal Transcribed Spacer (ITS) regions of fungal ribosomal DNA (r-DNA) resulted in approximately 600–700 bp product (depending on the genus and species). Amplicons were approximately 680 bp for the EF-1 α.
The BLAST search in NCBI demonstrated the TEF-1α gene fragment from F. oxysporum species complex, and F. proliferatum exhibited 99% homology with the associated sequences deposited in the GenBank database.
Of the 50 isolates identified by molecular methods (ITS region and TEF-1α gene), twenty-five isolates were identified as Fusarium spp. (Fusarium oxysporum, 7 isolates, and Fusarium proliferatum, 18 isolates), Fifteen isolates were identified as Neoscytalidium spp. (14 isolates N. dimidiatum and one isolate of N. hyalinum), One isolate of Cladosporium oxysporum, one isolate of Valsa sordida, and eight isolates were identified as Clonostachys rosea, a non-pathogenic fungus (considered as saprophytes, endophytes, or biological control fungal species).

Table 1.
Disease severity scores used to rate the severity of infections by FTDs in surveyed orchards.
Table 1.
Disease severity scores used to rate the severity of infections by FTDs in surveyed orchards.
| Severity score | Description of Symptoms and Overall Tree Health Status |
|---|---|
| 0 | No symptoms |
| 1 | Slight Chlorosis |
| 2 | Severe chlorosis, accompanied by less than 25% of branches with dieback and cankers |
| 3 | More than 25% but less than 50% of tree branches show dieback symptoms, and show gummosis and cankers |
| 4 | More than 50% to 100% of the branches are dead with dieback, gummosis, and cankers. |
Table 2.
Mean disease Incidence (DI) and Mean Disease severity of dieback and decline diseases in different locations and orchards surveyed in Al-Mafraq.
Table 2.
Mean disease Incidence (DI) and Mean Disease severity of dieback and decline diseases in different locations and orchards surveyed in Al-Mafraq.
| Orchard Number | Orchard Location | Orchard Age (year) | Prunus species | Total No. of Trees in the Orchard | No. of Trees Observed | No. of Trees with Symptoms | Disease Incidence (DI %) | Mean * Disease Severity (score) |
|---|---|---|---|---|---|---|---|---|
| 1. | Sabha | 8 | Prunus persica var. nucipersica | 1107 | 246 | 220 | 89 | 1.68 |
| 2. | Thagratul Gubb | 17 | Prunus persica var. nucipersica | 1144 | 156 | 117 | 75 | 1.29 |
| 3. | Al Ba`ij | 9 | Prunus persica | 2500 | 150 | 65 | 43 | 1.15 |
| 4. | Umm El Jimal | 15 | Prunus persica var. platycarpa | 900 | 108 | 74 | 69 | 2.41 |
| 5. | Umm El Jimal | 15 | Prunus armeniaca | 360 | 72 | 49 | 68 | 1.69 |
| 6. | Koum Al Ruf | 10 | Prunus persica | 2100 | 315 | 315 | 100 | 1.50 |
| 7. | Zaatari | 14 | Prunus persica var. nucipersica | 1215 | 180 | 144 | 80 | 1.61 |
| 8. | Koum Al Ahmar | 15 | Prunus persica | 1775 | 200 | 142 | 71 | 1.55 |
| 9. | Rasem Al- Hussan | 15 | Prunus persica var. nucipersica | 1500 | 180 | 139 | 77 | 1.52 |
| 10. | Sabha | 15 | Prunus persica var. nucipersica | 920 | 120 | 58 | 48 | 1.12 |
| Total | 13521 | 1727 | 1323 | |||||
| Overall Mean | 72 | 1.55 | ||||||
* The disease severity score is graded on a scale of 0-4. A score of 0 indicates the absence of any symptoms, while a score of 1 represents slight chlorosis. A score of 2 indicates severe chlorosis, accompanied by less than 25% of branches being dead. For a score of 3, more than 25% but less than 50% of branches are dead and show gummosis and cankers. Finally, a score of 4 indicates that more than 50% to 100% of the branches are dead with gummosis and cankers.
2.4. Pathogenicity of Fungal Isolates
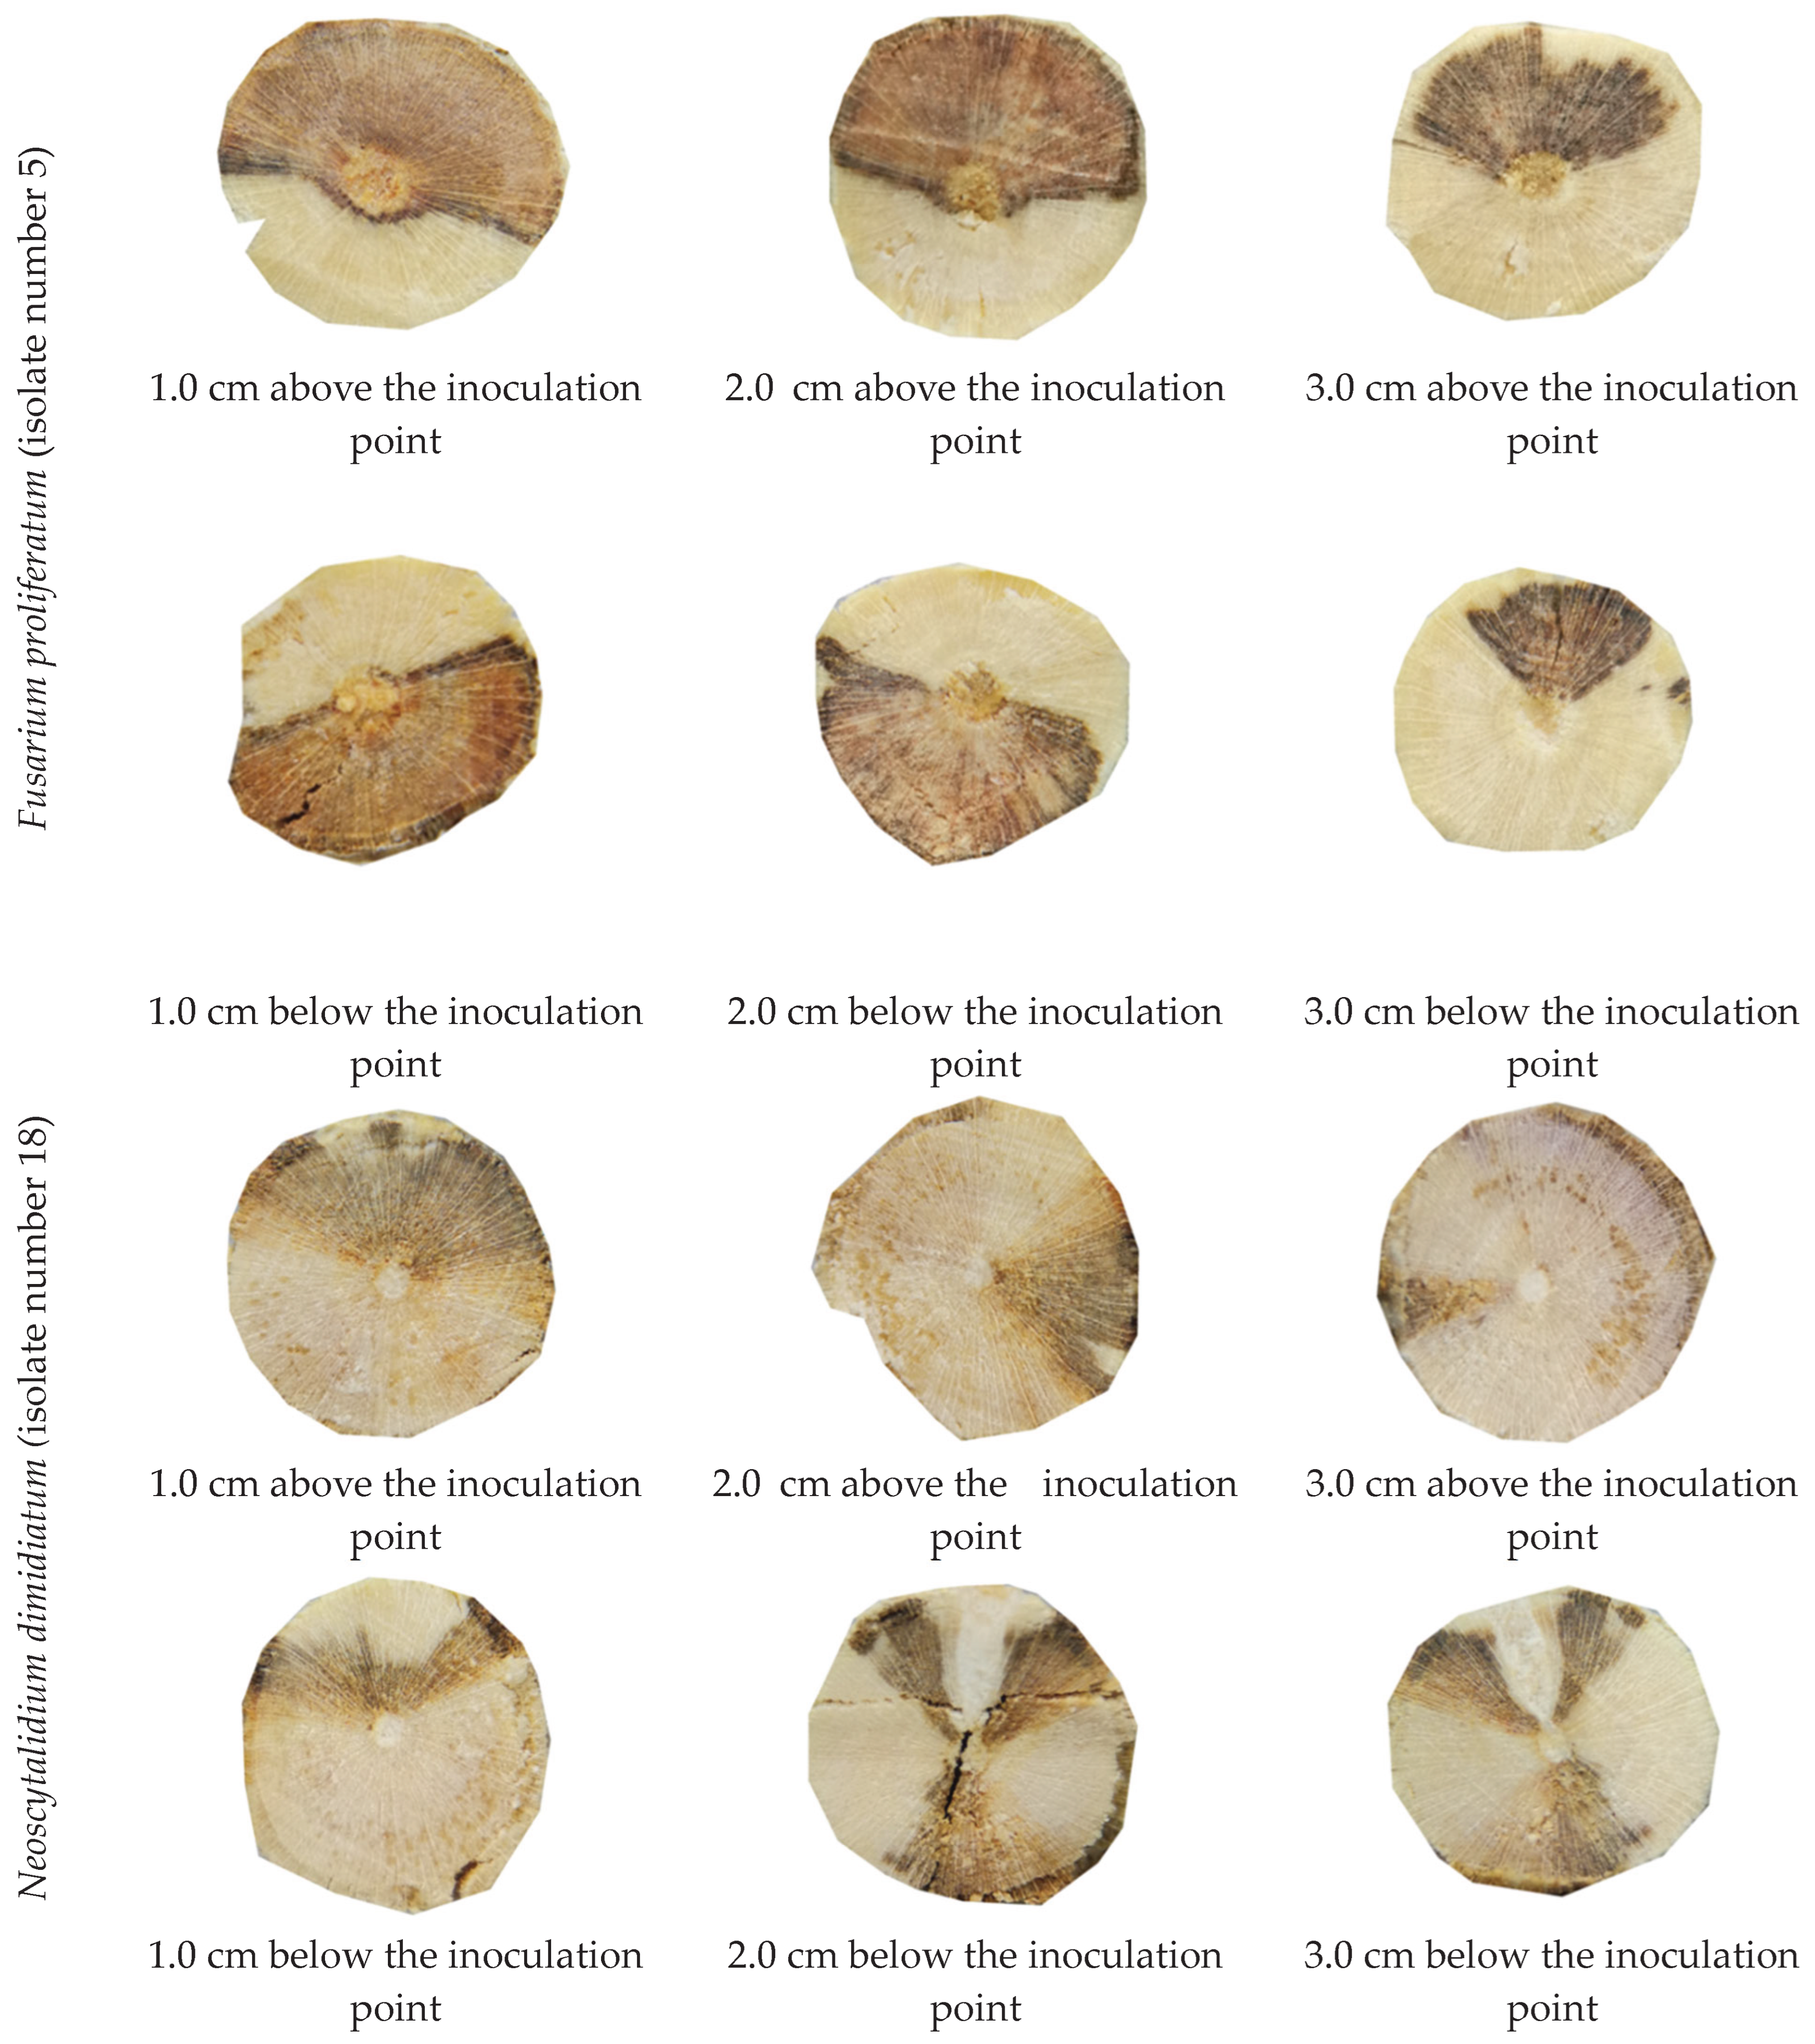
The pathogenicity tests conducted on selected fungal isolates (N=31; Table 3) demonstrated that all inoculated isolates resulted in brown to dark wood discoloration upward and downward from the point of inoculation within 3-4 months after inoculation. The symptoms observed on the inoculated seedlings included chlorosis, necrotic leaf spots, death of lateral branches, and the presence of gummy exudates on some seedlings (Figure 4). The wood discoloration resulting from the inoculation with different fungal isolates was observed in stem cross sections made above and below the inoculation point (Figure 4).
2.4.1. Estimation of the Fungal Pathogens Progression Within Inoculated Seedlings
Table 3 shows the mean disease severity resulting from the inoculation of prunus spp seedlings with various fungal isolates. Our study revealed that all the inoculated isolates induced brown to dark wood discoloration both upward and downward from the inoculation point after an incubation period of 3-4 months after inoculation, as depicted by some isolates in Figure 4. Compared to sections cut 2-3 cm above and below the inoculation point, sections taken 1 cm above and below the inoculation site showed higher disease severity, irrespective of the isolate used (Table 3). Isolates 1, 7, and 27, all belonging to Fusarium proliferatum, exhibited the highest disease severity values in cross sections made at 1 cm above the inoculation point, with values of 75%, 65.6%, and 66%, respectively. Neoscytalidium dimidiatum, represented by isolate no. 18, showed a disease severity value of 61.5%. Isolate 10 (Cladosporium oxysporum) had a mean disease severity value of 27.5. Isolate 15 (Valsa sordida) had the lowest disease severity value of 21% recorded at 1 cm above and below the inoculation point (Table 3).
Figure 3.
Symptoms displayed on inoculated apricot seedlings showing chlorosis, cankers, leaf spots, and defoliation of inoculated seedlings.
Figure 3.
Symptoms displayed on inoculated apricot seedlings showing chlorosis, cankers, leaf spots, and defoliation of inoculated seedlings.
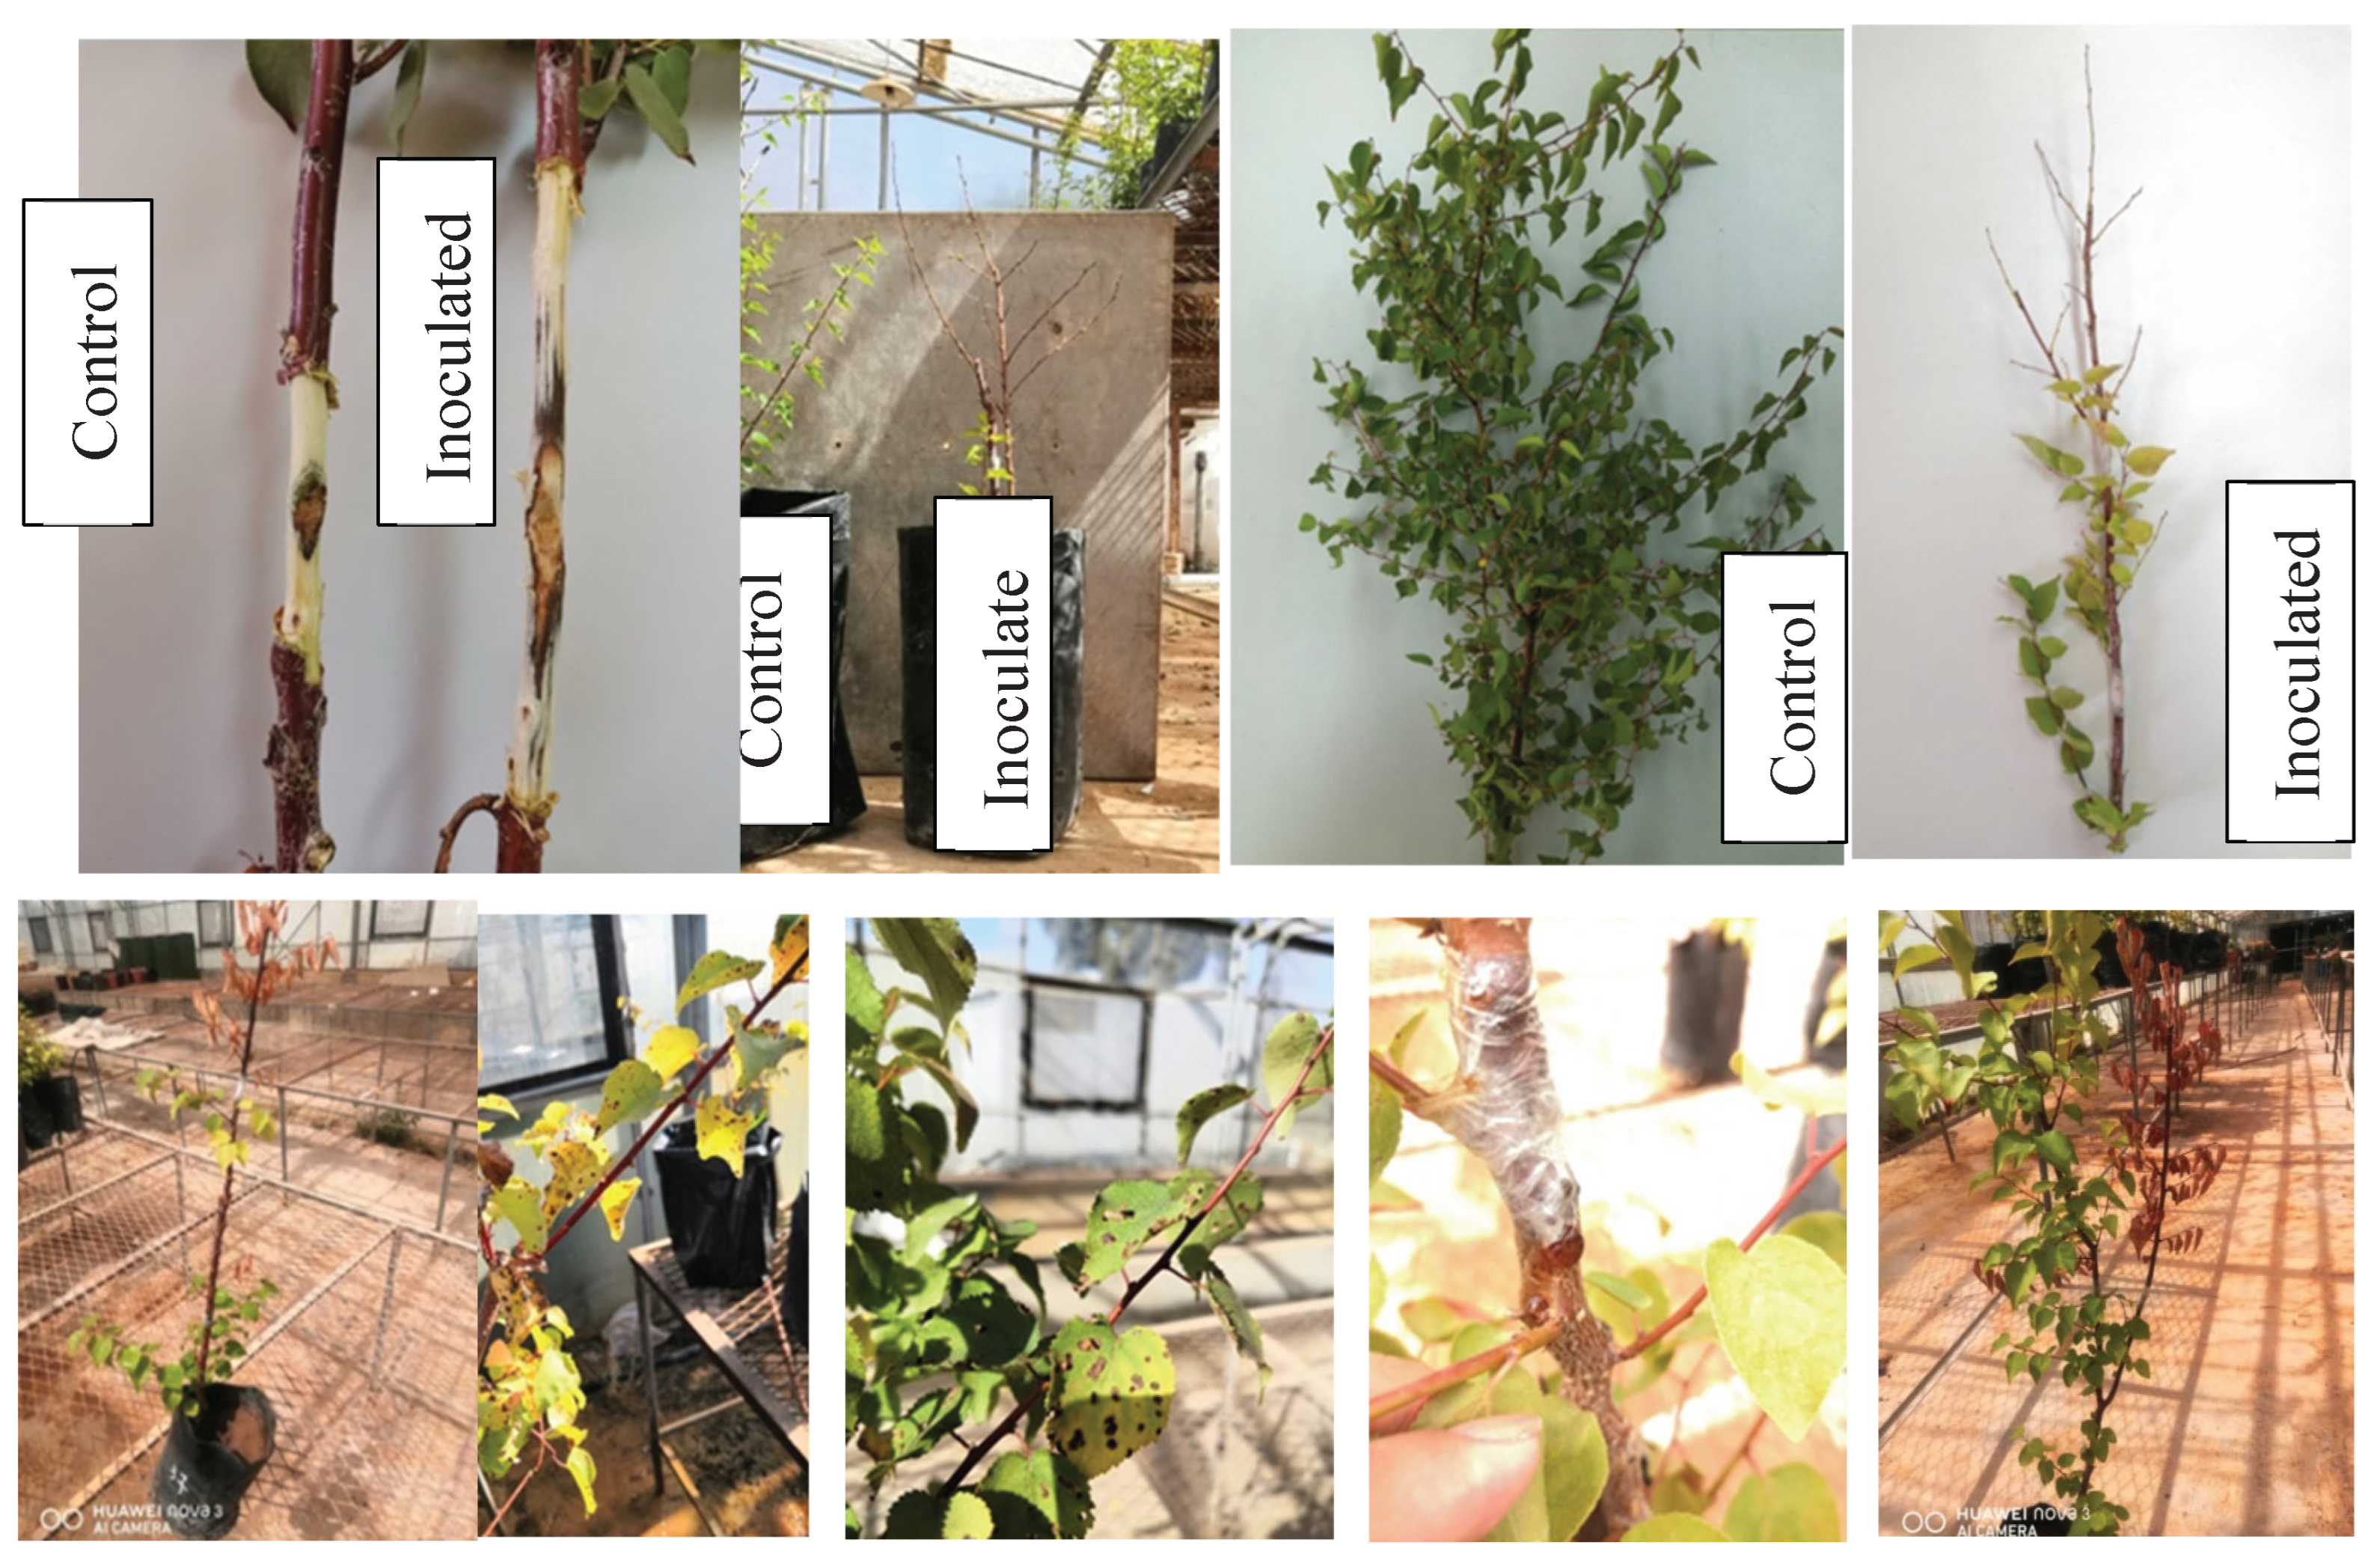
Figure 4.
Discoloration in apricot woody stem tissues inoculated with isolate No. 5 of Fusarium proliferatum and isolate No. 18 of Neoscytalidium dimidiatum. Cross sections were cut 1-3 cm above and below the inoculation point.
Figure 4.
Discoloration in apricot woody stem tissues inoculated with isolate No. 5 of Fusarium proliferatum and isolate No. 18 of Neoscytalidium dimidiatum. Cross sections were cut 1-3 cm above and below the inoculation point.
2.5. In Vitro Sensitivity of Selected Fungal Isolates Causing Stone Fruit Trees Decline to Fungicides
2.5.1. Sensitivity of Fungal Isolates to Azoxystrobin
All fungal isolates tested showed significant inhibition of mycelial growth at different concentrations of Azoxystrobin. At a concentration as low as 1.0 mg of active ingredient per ml of media, the growth of all isolates was inhibited by more than 60%. One isolate of Fusarium oxysporum (isolate 23) was inhibited by 80.5% (Table 4). Although there were significant differences in the mean percent inhibition of mycelium growth at different fungicide concentrations, these differences were mostly not significant at the concentration of 10.0 mg mL−1; at this concentration, most isolates were inhibited by 80% or more (Table 4). The EC50 values for Azoxystrobin ranged from 0.020 mg mL−1 to 0.583 mg mL−1. There was no significant difference among the EC50 values of Azoxystrobin calculated for each fungal isolate tested (Table 4).
2.5.2. Sensitivity of Fungal Isolates to Pydiflumetofen
All tested fungal isolates showed high sensitivity to Pydiflumetofen fungicide, which exhibited remarkable efficacy at low concentrations, inhibiting the mycelial growth of most isolates by 43-75% at a concentration as low as 0.1 mg mL−1 (Table 5). Some isolates, such as isolate 23 (Fusarium oxysporum) and isolate 4 (Fusarium oxysporum), were particularly sensitive, with their mycelial growth inhibited by 62.8% and 50.3%, respectively, at a fungicide concentration of 0.01 mg a.i mL−1. In contrast, this concentration inhibited other isolates by less than 50%. Table 5 shows a significant difference in the mean percent inhibition at a 0.1 mg mL−1 concentration of Pydiflumetofen. The calculated EC50 values for Pydiflumetofen ranged from 0.015 mg.mL−1 to 0.126 mg.mL−1, indicating variable sensitivities among the fungal isolates to this fungicide (Table 5). Isolate 33 (Neoscytalidium hyalinum) was the least sensitive to Pydiflumetofen with a calculated EC50 value of 0.126 mg.mL−1.
2.5.3. Sensitivity of Fungal Isolates to Difenoconazole
The fungicide Difenoconazole demonstrated significant efficacy against all fungal isolates tested, as they exhibited high sensitivity to the product. Even at a very low concentration of 0.001 mg a.i/mL (Table 6), the fungicide was highly effective, inhibiting mycelial growth by over 50% in most isolates. Neoscytalidium spp. isolates (isolates 33 and 38) were particularly sensitive, displaying an average inhibition rate of over 80% at this concentration (Table 6). The low EC50 values calculated for Difenoconazole further confirm the high sensitivity of the isolates, ranging from 0.00023 mg.mL−1 to 0.00156 mg.mL−1. Overall, among all tested isolates, the Neoscytalidium spp. isolates exhibited the greatest sensitivity to Difenoconazole (Table 6).
2.5.4. Sensitivity of Fungal Isolates to Tebuconazole
Tebuconazole fungicide exhibited a high level of sensitivity against all the tested fungal isolates. The mycelial growth of all the isolates was significantly inhibited at a very low concentration of this fungicide, with as little as 0.0001 mg a.i/mL proving sufficient to inhibit Neoscytalidium spp isolates by 90% or more (as shown in Table 7; Figure 5). However, significant differences in sensitivity to the fungicide were observed among different isolates at different concentrations of the fungicide (as shown in Table 7). The EC50 values of Tebuconazole ranged from 0.000018 mg.mL−1 to 0.00026 mg.mL−1, confirming the high sensitivity of all isolates tested to this fungicide.
3. Discussion
This research represents the first comprehensive study to investigate the diversity and identity of fungal pathogens associated with the decline and dieback diseases of stone fruit trees in Jordan. The current study investigated the incidence and severity of stone fruit tree dieback and decline, as well as the identification of fungal pathogens associated with the disease in Al Mafraq region, which is considered the main production area of stone fruits in Jordan. The Al Mafraq region produces more than 75% of all stone fruits in Jordan [4].
The results of this study showed that dieback and decline symptoms were prevalent in the surveyed orchards, with the most common symptoms including severe chlorosis, branch dieback, necrotic spots on leaves, leaf defoliation, branch and twig decline, cankers, and gummosis. The high disease incidence and severity of the dieback and decline of stone fruit trees observed in the current study may be attributed to several factors, including the use of infected planting materials, poor orchard management practices, and environmental factors such as drought stress. Further research is needed to investigate the interactions between the identified pathogens and environmental factors in the development of the disease.
The fungal isolates obtained from plant samples collected from the orchards exhibiting dieback and decline symptoms were identified as Botryosphaeriaceae species (Neoscytalidium dimidiatum and Neoscytalidium hyalinum), Fusarium spp., (Fusarium proliferatum and Fusarium oxysporum), Cladosporium oxysporum, and Valsa sordida based on their morphological and culture characteristics. Molecular identification of fungal isolates using the ITS region of ribosomal DNA and partial sequence of the translation elongation factor (TEF1-α) gene confirmed the primary identification and identified the fungal isolates to the species level. These results are consistent with previous studies that have identified Botryosphaeriaceae species and Fusarium spp., as major causal agents of stone fruit tree dieback and decline [19,20,21,22].
Neoscytalidium dimidiatum has a wide geographical and host range. The symptoms include branch wilt, dieback, canker, leaf blight, gummosis, and tree death. It has been reported on stone fruit trees causing gummosis and decline [6,23], on citrus causing shoot blight, canker, and gummosis [24,25], on mango causing dieback [26], and on walnut [27]. Additionally, N. dimidiatum has been reported to cause cankers and wilt on a wide range of plant species, such as pistachio and pomegranate [28], Ficus religiosa and Psidium guajava [29]. Recently, Holland et al. [22] reported the fungus Neoscytalidium dimidiatum as one of the most prevalent fungal species causing canker diseases of almond in California. Similarly, Correia et al. [30] reported the fungal pathogen Neoscytalidium hyalinum as the causal agent of grapevine dieback in Brazil. Neoscytalidium hyalinum was reported to cause internal wood lesions, dieback, canker, and decline on willow and poplar trees [31], on Calligonum amoenum [32], on date palm [33], and melon fruit rot [34]. To our knowledge, this is the first report on the occurrence of N. hyalinum on peach causing dieback symptoms on stone fruit trees.
Most of the fungal isolates identified in this study as causal organisms of stone fruit tree decline and dieback belong to the genus Fusarium, with two species identified, Fusarium proliferatum and F. oxysporum. Fusarium proliferatum has been recently reported by Mannai et al. [35] as the major cause of peach decline in Tunisian nurseries. These species were also isolated from peach orchards in different countries [36,37,38].
The fungal species Cladosporium oxysporum was isolated from one field in this study. This fungal species was recently reported to cause leaf blight on one species of stone fruits (Prunus nepalensis) in India [39].
The results presented in this study indicate that the fungal isolates obtained from infected trees are pathogenic to peach and apricot seedlings. The inoculated isolates resulted in brown to dark wood discoloration both upward and downward from the point of inoculation within 90-120 days of inoculation. The symptoms observed on the inoculated seedlings included chlorosis, necrotic leaf spots, death of lateral branches, and the presence of gummy exudates on some seedlings. These symptoms are typical of fungal infections, and their presence confirms the pathogenicity of the isolates. The pathogenicity tests also demonstrated that there is variation in the severity of the disease induced by different fungal isolates. Fusarium proliferatum isolates, which constituted more than one-third of the identified pathogens, had the highest mean disease severity across all isolates. These results suggest that Fusarium proliferatum may be a significant pathogen of stone fruit trees’ decline and dieback. Overall, these results have significant implications for the management of fungal diseases in stone fruit tree orchards. The identification of Fusarium proliferatum as a significant pathogen suggests that control measures should be focused on this species.
The results of the study on the in vitro sensitivity of selected fungal isolates causing stone fruit decline to fungicides are significant in identifying potential treatment options for managing this disease. The findings indicate that Azoxystrobin, a Quinone outside inhibitor (QoI), has significant inhibitory effects on the mycelial growth of all fungal isolates tested. Most isolates showed more than 60% inhibition of growth at 1.0 mg of active ingredient per ml of media, which demonstrates the efficacy of Azoxystrobin in controlling the growth of these fungal pathogens. These results agree with Gullino et al., study [40], which demonstrated that Azoxystrobin was highly effective in providing control for Fusarium wilts of carnation, cyclamen, and Paris daisy when applied at transplant at 1–2 g/m2 as soil drenching. In contrast, other studies [41] demonstrated that Azoxystrobin was less effective compared to other fungicides such as a combination of tebuconazole 50% and trifloxystrobin 25% in inhibiting Fusarium oxysporum due to fungicide resistance to QoI fungicides among F. oxysporum isolates [41].
The results of this study also indicate that Pydiflumetofen, a succinate dehydrogenase inhibitor (SDHI) that disrupts mitochondrial respiration, was highly effective in inhibiting the mycelial growth of most of the tested fungal isolates at low concentrations. Results also revealed that the sensitivity to Pydiflumetofen varied among different fungal isolates, with some isolates being particularly sensitive to the fungicide, while others were less sensitive. The high efficacy of Pydiflumetofen at low concentrations observed in this study is encouraging, as it suggests that this fungicide may be a promising option for the control of fungal pathogens causing stone fruit dieback and decline. These results agree with recent studies [41,42] that indicated a strong inhibitory activity of Pydiflumetofen against Fusarium spp., including F. oxysporum, Fusarium Fujikuroi [41] and F. proliferatum [43].
Similarly, the fungicide Difenoconazole, a sterol demethylation inhibitor (DMI/sterol biosynthesis), demonstrated significant efficacy against all fungal isolates tested, with even very low concentrations of 0.001 mg a.i/mL being highly effective in inhibiting mycelial growth. Difenoconazole has been reported to have strong inhibitory effects on Fusarium species pathogens. For example, against Fusarium fujikuroi and F. proliferatum isolates, Difenoconazole achieved 100% growth inhibition in vitro, outperforming some other compounds [44]. Similarly, a mixture of Trifloxystrobin and Tebuconazole achieved 100% growth inhibition of Fusarium spp. [44]. In the same study [44], Azoxystrobin was generally less effective achieving 62 to 100 percent inhibition at different doses of the fungicide. Sterol demethylation inhibitor (DMI) fungicides, including Tebuconazole and Difenoconazole, continue to exhibit substantial activity against multiple Fusarium species, although sensitivity varies among species, regions, and cropping systems [45] Similar sensitivity patterns were reported by other studies for Fusarium species [46,47]. Results of this study agree with previous studies [42,44] which demonstrated that Difenoconazole, Pydiflumetofen, and Tebuconazole are superior to Azoxystrobin in inhibiting Fusarium spp., in vitro.
Neoscytalidium dimidiatum is an aggressive woody-plant pathogen with increasing importance in tropical and subtropical regions of the world [23,48]. In this study, fungicide sensitivity assays with these pathogens indicate generally high susceptibility to sterol demethylation inhibitor (DMI) fungicides (Tebuconazole and Difenoconazole), as well as high sensitivity levels to the other two fungicides tested (Pydiflumetofen and Azoxystrobin). These results agree with a recent study [49] that investigated the sensitivity of Neoscytalidium dimidiatum to DMI fungicides. Karakuş et al., [49] demonstrated strong inhibition of mycelial growth by Tebuconazole, reporting near-complete growth suppression at recommended concentrations, placing Tebuconazole among the most effective fungicides against N. dimidiatum [49].
Similarly, Difenoconazole, either applied alone or in premixed formulations with azoxystrobin, also exhibits high antifungal activity, indicating that sterol demethylation inhibitors (DMIs) are highly effective against this species [49]. Results of this study agree with Karakuş et al., study [49], where both Difenoconazole and Tebuconazole were highly effective in inhibiting mycelial growth of both isolates of Neoscytalidium spp. tested.
Information on the fungicide sensitivity of Neoscytalidium hyalinum is comparatively scarce, largely due to its historical treatment as a variant of N. dimidiatum. Available antifungal susceptibility studies indicate that N. hyalinum isolates tend to be more sensitive to DMI fungicides than pigmented Neoscytalidium species, suggesting intrinsic differences in membrane sterol metabolism and fungicide uptake [50,51].
Cladosporium oxysporum, a dematiaceous fungus associated with leaf and postharvest diseases, generally exhibited high sensitivities to DMI fungicides in this study. Studies on Cladosporium spp., closely related to C. oxysporum, indicate that Tebuconazole and Difenoconazole effectively inhibit mycelial growth at low to moderate concentrations, although sensitivity can vary considerably among isolates [52]. Our results suggest that DMIs, fungicides, Pydiflumetofen, and Azoxystrobin are all effective in inhibiting Cladosporium oxysporum and might be useful components of chemical control strategies for C. oxysporum, particularly in integrated programs.
Overall, the results of this study indicate that all four fungicides tested are effective in inhibiting the growth of the fungal isolates causing stone fruit dieback and decline. However, the sensitivity of the isolates varied among the fungicides tested, indicating the need for a tailored approach to fungicide selection based on the specific fungal isolate causing the disease.
It is worth noting that the sensitivity of fungal isolates to different fungicides may change over time due to the development of resistance. Therefore, it is important to use fungicides judiciously and rotate them with other fungicides with different modes of action to prevent the development of resistance in fungal populations. Overall, the results of this study suggest that tested fungicides may be a useful tool for the management of stone fruit dieback and decline caused by sensitive fungal isolates, but further research is needed to determine their efficacy under field conditions and to monitor for the development of resistance.
4. Materials and Methods
4.1. Field Surveys, Sample Collection, and Estimation of Decline and Dieback Incidence and Severity
In June and July of 2019, field surveys were conducted in ten stone fruit orchards located in different areas within Al Mafraq Governorate. A total of 13,521 trees were observed in ten surveyed orchards. Out of these, 1,697 (around 12.5%) trees were inspected for the presence of dieback and decline symptoms (Table 1).
Disease incidence was estimated for each orchard by visually observing tree decline symptoms, using the following formula:
Disease incidence of stone fruit tree decline (%) = (number of trees showing decline symptoms / total number of trees assessed) * 100.
Disease severity, on the other hand, represents the extent of plant tissue that is visually diseased relative to the total amount of plant tissue, and is estimated by using a representative number of trees in each row, which considers all possible symptoms. The trees that exhibited decline and dieback symptoms were assigned a rating score ranging from 0 to 4 (Table 2).
4.2. Fungal Isolations
Samples were collected from trees showing dieback and decline symptoms with internally discolored tissues of infected branches. Each sample was cut into 5-10 pieces (5 × 5 mm) containing both healthy and infected tissues after removing the outer bark. All the wood pieces were sterilized using 70% ethanol solution for 2 min, soaked in sterile distilled water, then transferred to 1.0% sodium hypochlorite solution and soaked for 2 min, then washed twice with sterile distilled water and dried on sterile filter paper [53]. The sterilized wood tissues were transferred onto malt extract agar (MEA) or potato dextrose agar (PDA) plates supplemented with Amoxicillin trihydrate (200 mg/L) to suppress bacterial growth and incubated at 25 °C in the dark for 5-14 days [54].
4.3. Morphological Identification of Fungi
Identification of fungal isolates was based on their morphological characteristics, including mycelium color and spore morphology (shape, color, and size). General and specific mycological identification keys were utilized to identify each fungal isolate to the genus or genus and species levels [8,18,20,55,56].
4.5. Molecular Identification of Fungal Isolates
Fungal isolates were cultured on MEA for 2 weeks for DNA extraction. The DNeasy Plant Mini Kit (CAS NO. 69104; Qiagen group) was used to extract DNA from the mycelium of different fungal isolates, following the manufacturer’s instructions. The DNA concentration in each sample was estimated using NanoDrop 2000 (Thermo Scientific) from a 2 μL DNA sample. DNA from fungal isolates was used to amplify the Internal Transcribed Spacers (ITS region) by the primers ITS1 and ITS4 [57]. PCR reactions were each carried out in a total final volume of 25 µL, using FIREPOL® Master mix ready to load 5x (Solis BioDyne), containing 3 ng of DNA template and 1µM of each of forward and reverse primers. The PCR was conducted using a T100 Thermal cycler (Biorad) at the following parameters: 95 °C for 3 min, then 34 cycles each of 95 °C for 30 sec, 60 °C for 1 min, and 72 °C for 1 min, followed by 72 °C for 5 min and 4 °C.
Fungal isolates were also analyzed by partial sequencing of the translation elongation factor TEF1-α gene. The partial sequence of the TEF1-α gene was obtained using EF-3 (GTAAGGAGGASAAGACTCACC) and EF-22 (AGGAACCCTTACCGAGCTC) as sequencing primers [58]. PCR reactions were each carried out in a total final volume of 25 µL, using FIREPOL® Master mix ready to load 5x (Solis BioDyne), containing 3 ng of DNA template and 1µM of each of forward and reverse primers. PCR reactions were performed in a T100 Thermal cycler (Biorad), using the following program: 1 cycle of 90 s at 94 °C; 40 cycles of 30 s at 94 °C, 90 s at 55 °C, and 3 min at 68 °C; followed by 1 cycle of 5 min at 68 °C and a 4 °C soak [58].
All PCR products were sized via electrophoresis in 1.5% agarose gels run in 1x TAE buffer, stained with ethidium bromide, and then photographed over a UV transilluminator. The amplified products were purified with the QIAquick PCR Purification kit (QIAGEN, Germany).
The identification of each fungal isolate was confirmed by sequencing the PCR products by Macrogen, Inc. (Seoul, Korea). Sequences from both the ITS region and TEF1-α gene were uploaded to SnapGene v5.0 software and the GenBank database (http://www.ncbi.nlm.nih.gov). The sequence homology searches were carried out using the Basic Local Alignment Search Tool (BLAST: http://blast.ncbi.nlm.nih.gov/Blast.cgi) and the European Bioinformatics Institute database (https://www.ebi.ac.uk/) to compare these sequences with published sequences of previously identified fungi in the databases.
4.6. Pathogenicity Tests of Isolated Fungi
One-year-old Prunus armeniaca (apricot) and Prunus persica (Peach) seedlings were inoculated by making a wound in the stem with a carving knife, followed by inoculating the wound with a 5.0 mm colonized PDA agar plug from 14-day-old fungal colonies. Wounds were sealed using parafilm. Three seedlings from apricot and peach were used per isolate (6 total), and control treatments (a sterile 5.0 mm PDA plug) were included to ensure that any observed symptoms were due to the fungal pathogens and no other factors. To maintain humidity, the seedlings were covered with plastic bags and placed in a growth chamber with light-emitting diodes (LED) lighting at 25 °C and 90% relative humidity for 2-3 weeks. After this period, the seedlings were transferred to a greenhouse bench and observed for any symptoms of disease. The final assessment of pathogenicity was performed 3-4 months after inoculation, whereby the presence of disease symptoms on the plant foliage and stems was recorded. Additionally, the seedling bark was removed to observe any wood tissue discoloration and necrosis [55,59,60,61].
Assessments of Disease Development in Inoculated Seedlings
Each of the inoculated seedlings was cut into six sections, with three sections taken above and below the inoculation point at 1.0 cm intervals, and each section was photographed using a dissecting microscope. Digital images of the wood sections were analyzed using the ImageJ program, provided by the National Institutes of Health (NIH) [62]. The image analysis software measured different levels of section darkening, which were converted to disease severity values on a scale from 0 to 100% relative to the total area of each section. The color of the wood tissue was assessed by measuring the reflective light intensity of each section. The change in light intensity was then used to calculate disease severity relative to the light intensity of healthy sections [63,64]. The resulting values were reported in pixels and included the total area of each section, total darkened area, and mean darkened area. These values were used to calculate disease severity in the inoculated seedlings using the following formula:
Disease severity relative to area of healthy section = (Total area of section darkened tissue/Total area of section) × 100.
4.7. In Vitro Inhibition of Mycelia Growth of Fungal Pathogens Using Fungicides
Four commercial fungicides (Score® 25% EC [Difenoconazole 25% W/V], Tebuchem® 10 EC [Tebuconazole10%], Quadris® 250 SC [Azoxystrobin 25% W/V], and Miravis® 200 SC [20% Pydiflumetofen] were used in vitro to assess their efficacy in inhibiting the radial mycelial growth of seven pathogenic fungal isolates belonging to the following fungal species (Fusarium oxysporum, Fusarium proliferatum, Neoscytalidium dimidiatum, Neoscytalidium hyalinum, and Cladosporium oxysporum).
Two stock solutions for each fungicide were prepared by dissolving them in sterile distilled water. Final fungicide concentrations of 0.000001 to 10 μg a.i.mL−1 were prepared by dilution of the stock solutions and were added to potato dextrose agar (PDA) medium after autoclaving. Control plates without fungicide were also prepared. Three replicate plates for each concentration of fungicide and three control plates for each isolate were incubated in the dark at 25 °C for 3-12 days (depending on the fungal isolate), which were arranged in a completely randomized experimental design (CRD). After the incubation period, the colony diameter was measured using a caliper, and the percentage of radial mycelium growth inhibition was calculated for each fungicide concentration. The experiment was repeated twice for each fungicide.
The relative growth reduction (inhibition) for each fungicide concentration was calculated as follows:
Percentage of radial mycelium growth inhibition = {1-(diameter of a colony on fungicide amended plate/diameter of a colony on control plate)} *100.
The EC50 (half maximal effective concentration) values for each isolate and fungicide combination were estimated by plotting the normalized percent inhibition against the logarithmic scale of the fungicide concentration, producing a typical dose-response curve.
The EC50 values were determined using the GraphPad Prism 5.0 software (GraphPad Software, Boston, MA 02110) with the non-linear regression fit and the dose-response stimulation module. The mean percent inhibition of mycelial growth at each fungicide concentration and the estimated EC50 values were analyzed using the general linear model procedure (Proc GLM) and mean separation using Tukey’s honestly least significant difference test with a confidence interval of 95%. The F test was performed to test for homogeneity of variance among the experiments, and data from all trials were pooled if the variances were homogeneous.
Supplementary Materials
The following supporting information can be downloaded at the website of this paper posted on Preprints.org.
Author Contributions
Conceptualization, F.M. Abu El Samen. and Al Hussein Y.M.; methodology, Al Hussein Y.M.; software, Al Hussein Y.M; validation, F.M. Abu El Samen.; formal analysis, F.M. Abu El Samen. and Al Hussein Y.M; investigation, Al Hussein Y.M.; resources, F.M. Abu El Samen; data curation, F.M. Abu El Samen. and Al Hussein Y.M.; writing—original draft preparation, F.M. Abu El Samen; writing—review and editing, F.M. Abu El Samen and Al Hussein Y.M.; visualization, F.M. Abu El Samen.; supervision, F.M. Abu El Samen.; project administration, F.M. Abu El Samen.; funding acquisition, F.M. Abu El Samen. All authors have read and agreed to the published version of the manuscript.
Funding
This research was funded by Deanship of Scientific Research, Jordan University of Science and Technology, grant number 37-2022.
Data Availability Statement
The data that support the findings of this study are available on request from the corresponding author, [F. M. Abu El Samen].
Acknowledgments
We acknowledge the help provided by Ag. Eng. Yousef Botros Al-Kawalit, Ag. Eng. Botros Al-Kawalit, and Ag. Eng. Ayman Abu Keshek for their help and support in conducting disease surveys and collection of diseased plant samples from stone fruit trees orchards in Al Mafraq.
Conflicts of Interest
The authors declare no conflicts of interest. The funders had no role in the design of the study; in the collection, analyses, or interpretation of data; in the writing of the manuscript; or in the decision to publish the results.
Abbreviations
The following abbreviations are used in this manuscript:
| FTD | Fungal Trunk Diseases |
| PCR | Polymerase Chain Reaction |
| PDA | Potato Dextrose Agar medium |
| MEA | malt extract agar |
| DS | Disease Severity |
| MDS | Mean disease severity |
| DI | Disease Incidence |
| EC50 | Half maximal effective concentration |
| ITS | Internal Transcribed Spacer region |
| TEF1-α | Translation Elongation Factor gene |
| QoI | Quinone Outside Inhibitor |
| SDHI | Succinate Dehydrogenase Inhibitor |
| DMI | Demethylation Inhibitor |
References
- Das, B. Prunus Diversity-Early and Present Development: A Review. Int. J. Biodivers. Conserv. 2011, 3, 721–734. [Google Scholar] [CrossRef]
- Fadón, E.; Herrera, S.; Guerrero, B.I.; Engracia Guerra, M.; Rodrigo, J. Chilling and Heat Requirements of Temperate Stone Fruit Trees (Prunus sp.). Agronomy 2020, 10, 409. [Google Scholar] [CrossRef]
- United States Department of Agriculture Foreign Agricultural Service Fresh Peaches and Cherries: World Markets and Trade. 2025.
- Jordan Agricultural Statistics. 2025.
- Guarnaccia, V.; Kraus, C.; Markakis, E.; Alves, A.; Armengol, J.; Eichmeier, A.; Compant, S.; Gramaje, D. Fungal Trunk Diseases of Fruit Trees in Europe: Pathogens, Spread and Future Directions. Phytopathol. Mediterr. 2022, 61, 563–599. [Google Scholar] [CrossRef]
- Ezra, D.; Hershcovich, M.; Shtienberg, D. Insights into the Etiology of Gummosis Syndrome of Deciduous Fruit Trees in Israel and Its Impact on Tree Productivity. Plant Dis. 2017, 101, 1354–1361. [Google Scholar] [CrossRef]
- Gramaje, D.; Agustí-Brisach, C.; Pérez-Sierra, A.; Moralejo, E.; Olmo, D.; Mostert, L.; Damm, U.; Armengol, J. Fungal Trunk Pathogens Associated with Wood Decay of Almond Trees on Mallorca (Spain). Persoonia Mol. Phylogeny Evol. Fungi 2012, 28, 1–13. [Google Scholar] [CrossRef]
- Crous, P.W.; Wingfield, M.J. Fungi Infecting Woody Plants: Emerging Frontiers. Persoonia Mol. Phylogeny Evol. Fungi 2018, 40, i–iii. [Google Scholar] [CrossRef] [PubMed]
- Slippers, B.; Wingfield, M.J. Botryosphaeriaceae as Endophytes and Latent Pathogens of Woody Plants: Diversity, Ecology and Impact. Fungal Biol. Rev. 2007, 21, 90–106. [Google Scholar] [CrossRef]
- Guarnaccia, V.; Groenewald, J.Z.; Woodhall, J.; Armengol, J.; Cinelli, T.; Eichmeier, A.; Ezra, D.; Fontaine, F.; Gramaje, D.; Gutierrez-Aguirregabiria, A.; et al. Diaporthe Diversity and Pathogenicity Revealed from a Broad Survey of Grapevine Diseases in Europe. Persoonia Mol. Phylogeny Evol. Fungi 2018, 40, 135–153. [Google Scholar] [CrossRef]
- Úrbez-Torres, J.R.; Peduto, F.; Vossen, P.M.; Krueger, W.H.; Gubler, W.D. Olive Twig and Branch Dieback: Etiology, Incidence, and Distribution in California. Plant Dis. 2013, 97, 231–244. [Google Scholar] [CrossRef]
- Kaliterna, J.; Milicevic, T.; Ivic, D.; Bencic, D.; Mesic, A. First Report of Diplodia Seriata as Causal Agent of Olive Dieback in Croatia. Plant Dis. 2012, 96, 290. [Google Scholar] [CrossRef] [PubMed]
- Moral, J.; Muñoz-Díez, C.; González, N.; Trapero, A.; Michailides, T.J. Characterization and Pathogenicity of Botryosphaeriaceae Species Collected from Olive and Other Hosts in Spain and California. Phytopathology 2010, 100, 1340–1351. [Google Scholar] [CrossRef]
- RUMBOS, I.C. Cytospora Oleina Causing Canker and Dieback of Olive in Greece. Plant Pathol. 1988, 37, 441–444. [Google Scholar] [CrossRef]
- Ram, V.; Bhardwaj, L.N. Stone Fruit Diseases and Their Management, 2004.
- Mundy, D.C.; Manning, M.A. Ecology and Management of Grapevine Trunk Diseases in New Zealand: A Review. New Zealand Plant Prot. 2010, 63, 160–166. [Google Scholar] [CrossRef]
- Bush, E.A. Botryosphaeria Canker and Dieback of Trees and Shrubs in the Landscape, 2023.
- Phillips, A.J.L.; Alves, A.; Abdollahzadeh, J.; Slippers, B.; Wingfield, M.J.; Groenewald, J.Z.; Crous, P.W. The Botryosphaeriaceae: Genera and Species Known from Culture. Stud. Mycol. 2013, 76, 51–167. [Google Scholar] [CrossRef] [PubMed]
- Pusey, P.L. Role of Botryosphaeria Species in Peach Tree Gummosis on the Basis of Differential Isolation from Outer and Inner Bark. Plant Dis. 1993, 77, 170–174. [Google Scholar] [CrossRef]
- Slippers, B.; Smit, W.A.; Crous, P.W.; Coutinho, T.A.; Wingfield, B.D.; Wingfield, M.J. Taxonomy, Phylogeny and Identification of Botryosphaeriaceae Associated with Pome and Stone Fruit Trees in South Africa and Other Regions of the World. Plant Pathol. 2007, 56, 128–139. [Google Scholar] [CrossRef]
- Nouri, M.T.; Lawrence, D.P.; Yaghmour, M.A.; Michailides, T.J.; Trouillas, F.P. Neoscytalidium Dimidiatum Causing Canker, Shoot Blight and Fruit Rot of Almond in California. Plant Dis. 2018, 102, 1638–1647. [Google Scholar] [CrossRef]
- Holland, L.A.; Trouillas, F.P.; Nouri, M.T.; Lawrence, D.P.; Crespo, M.; Doll, D.A.; Duncan, R.A.; Holtz, B.A.; Culumber, C.M.; Yaghmour, M.A.; et al. Fungal Pathogens Associated with Canker Diseases of Almond in California. Plant Dis. 2021, 105, 346–360. [Google Scholar] [CrossRef]
- Peja, R.; Duka, I.M.; Balendres, M.A. Neoscytalidium Dimidiatum, a Plant Killer: A Review. Stud. Fungi 2025, 10, e011. [Google Scholar] [CrossRef]
- Polizzi, G.; Aiello, D.; Vitale, A.; Giuffrida, F.; Groenewald, J.Z.; Crous, P.W. First Report of Shoot Blight, Canker, and Gummosis Caused by Neoscytalidium Dimidiatum on Citrus in Italy. Plant Dis. 2009, 93, 1215. [Google Scholar] [CrossRef]
- Alananbeh, K.M.; Al-Qasim, M.; Gharaibeh, A.; Al-Hiary, H.A. First Report of Shoot Blight Caused by Neoscytalidium Dimidiatum on Citrus in Jordan. Plant Dis. 2020, 104, 571. [Google Scholar] [CrossRef]
- Sakalidis, M.L.; Ray, J.D.; Lanoiselet, V.; Hardy, G.E.S.J.; Burgess, T.I. Pathogenic Botryosphaeriaceae Associated with Mangifera Indica in the Kimberley Region of Western Australia. Eur. J. Plant Pathol. 2011, 130, 379–391. [Google Scholar] [CrossRef]
- Chen, S.F.; Fichtner, E.; Morgan, D.P.; Michailides, T.J. First Report of Lasiodiplodia Citricola and Neoscytalidium Dimidiatum Causing Death of Graft Union of English Walnut in California. Plant Dis. 2013, 97, 993. [Google Scholar] [CrossRef]
- Aminaee, M.M.; Ershad, J. Occurrence of Nattrassia Mangiferae in Kerman Province, Iran. In Proceedings of the 11th Plant Protection Congress of Iran, Rasht, Iran, 28 August–2 September 1993; p. pp. 218. [Google Scholar]
- Mirzâee, M.R.; Mohammadi, M.; Rahimian, H. Nattrassia Mangiferae, the Cause of Die-Back and Trunk Cankers of Ficus Religiosa and Branch Wilt of Psidium Guajava in Iran. J. Phytopathol. 2002, 150, 244–247. [Google Scholar] [CrossRef]
- Correia, K.C.; Silva, M.A.; Netto, M.S.B.; Vieira, W.A.S.; Câmara, M.P.S.; Michereff, S.J. First Report of Grapevine Dieback Caused by Neoscytalidium Hyalinum in Brazil. Plant Dis. 2016, 100, 213. [Google Scholar] [CrossRef]
- Hashemi, H.; Mohammadi, H. Identification and Characterization of Fungi Associated with Internal Wood Lesions and Decline Disease of Willow and Poplar Trees in Iran. For. Pathol. 2016, 46, 341–352. [Google Scholar] [CrossRef]
- Nazmadini, S.; Mohammadi, H.; Chakusary, M.K. First Report of Phaeoacremonium Venezuelense and Neoscytalidium Hyalinum from Calligonum Amoenum in Iran. In Proceedings of the 23 Iranian Plant Protection Congress, Gorgan, Iran, 27–30 August 2018. [Google Scholar]
- Rahiminiya, Z.; Banihashemi, Z.; Mirtalebi, M. Two New Species of Neoscytalidium the Causal Agents of Nattrassia Canker from Iran. In Proceedings of the 23 Iranian Plant Protection Congress, Gorgan, Iran, 27–30 August 2018; p. pp. 116. [Google Scholar]
- Mirtalebi, M.; Sabahi, F.; Banihashemi, Z. Fruit Rot Caused by Neoscytalidium Hyalinum on Melon in Iran. Australas. Plant Dis. Notes 2019, 14, 8. [Google Scholar] [CrossRef]
- Mannai, S.; Horrigue-Raouani, N.; M’Hamdi, N. Effect of Six Fungicides against Fusarium Oxysporum and F. Solani Associated with Peach Seedlings Decline in Tunisian Nurseries. Annu. Res. Rev. Biol. 2018, 26, 1–11. [Google Scholar] [CrossRef]
- Wensley, R.N. The peach replant problem in ontario: IV. fungi associated with replant failure and their importance in fumigated and nonfumigated soils. Can. J. Bot. 1956, 34, 967–981. [Google Scholar] [CrossRef]
- Mannai, S.; Benfradj, N.; Horrigue-Raouani, N.; Boughalleb-M’Hamdi, N. Prevalence of Fusarium Species Associated with Peach Decline in Tunisian Nurseries. Microbiol. Res. J. Int. 2018, 23, 1–16. [Google Scholar] [CrossRef]
- Marek, S.M.; Yaghmour, M.A.; Bostock, R.M. Fusarium spp., Cylindrocarpon spp., and Environmental Stress in the Etiology of a Canker Disease of Cold-Stored Fruit and Nut Tree Seedlings in California. Plant Dis. 2013, 97, 259–270. [Google Scholar] [CrossRef]
- Baiswar, P.; Chandra, S.; Bag, T.K.; Patel, R.K.; Ngachan, S.V.; Deka, B.C. Cladosporium Oxysporum on Prunus Nepalensis in India. Australas. Plant Dis. Notes 2011, 6, 3–6. [Google Scholar] [CrossRef]
- Gullino, M.L.; Minuto, A.; Gilardi, G.; Garibaldi, A. Efficacy of Azoxystrobin and Other Strobilurins against Fusarium Wilts of Carnation, Cyclamen and Paris Daisy. Crop Prot. 2002, 21, 57–61. [Google Scholar] [CrossRef]
- Bai, Y.; Gu, C.Y.; Pan, R.; Abid, M.; Zang, H.Y.; Yang, X.; Tan, G.J.; Chen, Y. Activity of a Novel Succinate Dehydrogenase Inhibitor Fungicide Pydiflumetofen against Fusarium Fujikuroi Causing Rice Bakanae Disease. Plant Dis. 2021, 105, 3208–3217. [Google Scholar] [CrossRef]
- Cai, S.; Chen, X.; Cao, S.; Fang, X.; Lin, L.; Zhang, X.; Chen, H.; Li, W.; Deng, Q.; Sun, H. Inhibitory Activities of SDHI Fungicides Against Fusarium Oxysporum f. sp. Lycopersici and the Biological Role of FoSDHC1. Plant Dis. 2026, 110, 197–205. [Google Scholar] [CrossRef]
- Li, M.; Chen, L.; Wang, Q.; He, L.; Duan, Y.; Mao, X.; Zhou, L. Species Identification and Fungicide Sensitivity of Fusarium Spp. Causing Peanut Root Rot in Henan, China. J. Fungi 2025, 11, 433. [Google Scholar] [CrossRef] [PubMed]
- Janaka Datta Reddy, K.; Dhanya, M.K.; Ayisha, R.; Sajeena, A.; Radhakrishnan, N. In Vitro Evaluation of Fungicides and Chemicals against Fusarium Fujikuroi Associated with Stem Rot Disease of Dragon Fruit in Kerala. Microbe 2025, 9, 100604. [Google Scholar] [CrossRef]
- Zhou, F.; Zhou, X.; Jiao, Y.; Han, A.; Zhou, H.; Chen, Z.; Li, W.; Liu, R. Baseline Tebuconazole Sensitivity and Potential Resistant Risk in Fusarium graminearum. BMC Plant Biol. 2024, 24, 789. [Google Scholar] [CrossRef]
- Matelionienė, N.; Žvirdauskienė, R.; Kadžienė, G.; Zavtrikovienė, E.; Supronienė, S. In Vitro Sensitivity Test of Fusarium Species from Weeds and Non-Gramineous Plants to Triazole Fungicides. Pathogens 2024, 13, 160. [Google Scholar] [CrossRef] [PubMed]
- Wang, C.; Hao, D.; Jiao, W.; Li, J.; Yuan, J.; Ma, Y.; Wang, X.; Xu, A.; Wang, M.; Wang, Y. Identification and Fungicide Sensitivity of Fusarium Spp. Associated with Root Rot of Scutellaria Baicalensis in Shanxi Province, China. Phytopathology 2024, 114, 1533–1541. [Google Scholar] [CrossRef]
- Derviş, S.; Özer, G. Plant-Associated Neoscytalidium Dimidiatum—Taxonomy, Host Range, Epidemiology, Virulence, and Management Strategies: A Comprehensive Review. J. Fungi 2023, 9, 1048. [Google Scholar] [CrossRef]
- Karakuş, Y.; Yiğit, T.; Oksal, E.; Yıldız, M. Evaluation of Some Chemical and Biological Fungicides for Controlling Stem Canker on Apricot Trees Caused by Neoscytalidium Dimidiatum. Eur. J. Plant Pathol. 2025, 172, 91–104. [Google Scholar] [CrossRef]
- Tonani, L.; Morosini, N.S.; Dantas de Menezes, H.; Nadaletto Bonifácio da Silva, M.E.; Wainwright, M.; Leite Braga, G.Ú.; Regina von Zeska Kress, M. In Vitro Susceptibilities of Neoscytalidium spp. Sequence Types to Antifungal Agents and Antimicrobial Photodynamic Treatment with Phenothiazinium Photosensitizers. Fungal Biol. 2018, 122, 436–448. [Google Scholar] [CrossRef]
- Heidari, S.; Gheisari, M.; Abastabar, M.; Pourabdollah, M.; Mirenayat, M.S.; Basharzad, N.; Seifi, S.; Tavakoli, M.; Jafarzadeh, J.; Ansari, S.; et al. Genotyping and In Vitro Antifungal Susceptibility Profile of Neoscytalidium Species Isolates from Respiratory Tract. Mycopathologia 2021, 186, 833–845. [Google Scholar] [CrossRef]
- Machuca, L.M.; Acuña, O.M.F.; Alfaro, E.; Spagnolo, L.C.; Obregón, V.G.; Ibáñez, J.M.; Murguía, M.C. In Vitro Susceptibility Test of Cladosporium Cladosporioides Isolates from Argentinian Tomato Crops against Commercial Fungicides. J. Hortic. Sci. 2023, 18, 432–438. [Google Scholar] [CrossRef]
- Van Niekerk, J.M.; Crous, P.W.; Groenewald, J.Z.; Fourie, P.H.; Halleen, F. DNA Phylogeny, Morphology and Pathogenicity of Botryosphaeria Species on Grapevines. Mycologia 2004, 96, 781–798. [Google Scholar] [CrossRef] [PubMed]
- Ören, E.; Palacıoğlu, G.; Koca, G.; Ozan, G.N.; Bayraktar, H. First Report of Neoscytalidium Dimidiatum Causing Branch Dieback and Canker on Apple in Turkey. J. Plant Pathol. 2022, 104, 429. [Google Scholar] [CrossRef]
- Damm, U.; Crous, P.W.; Fourie, P.H. Botryosphaeriaceae as Potential Pathogens of Prunus Species in South Africa, with Descriptions of Diplodia Africana and Lasiodiplodia plurivora sp. Nov. Mycologia 2007, 99, 664–680. [Google Scholar] [CrossRef]
- Leslie, J.F.; Summerell, B.; Bullock, S. The Fusarium Laboratory Manual-Blackwell Pub Professional; Blackwell Publishing: Oxford, UK, 2006; ISBN 13:978-0-8138-1919-8. [Google Scholar]
- White, T.J.; Bruns, T.; Lee, S.; Taylor, J. Amplification and direct sequencing of fungal ribosomal rna genes for phylogenetics. In PCR Protocols; Elsevier: Amsterdam, The Netherlands, 1990; pp. 315–322. [Google Scholar]
- O’Donnell, K.; Gueidan, C.; Sink, S.; Johnston, P.R.; Crous, P.W.; Glenn, A.; Riley, R.; Zitomer, N.C.; Colyer, P.; Waalwijk, C.; et al. A Two-Locus DNA Sequence Database for Typing Plant and Human Pathogens within the Fusarium Oxysporum Species Complex. Fungal Genet. Biol. 2009, 46, 936–948. [Google Scholar] [CrossRef]
- van Niekerk, J.M.; Crous, P.W.; Groenewald, J.Z.; Fourie, P.H.; Halleen, F. DNA Phylogeny, Morphology and Pathogenicity of Botryosphaeria Species on Grapevines. Mycologia 2004, 96, 781–798. [Google Scholar] [CrossRef]
- Damm, U.; Mostert, L.; Crous, P.W.; Fourie, P.H. Novel Phaeoacremonium Species Associated with Necrotic Wood of Prunus Trees. Persoonia—Mol. Phylogeny Evol. Fungi 2008, 20, 87–102. [Google Scholar] [CrossRef]
- Úrbez-Torres, J.R.; Leavitt, G.M.; Guerrero, J.C.; Guevara, J.; Gubler, W.D. Identification and Pathogenicity of Lasiodiplodia Theobromae and Diplodia Seriata, the Causal Agents of Bot Canker Disease of Grapevines in Mexico. Plant Dis. 2008, 92, 519–529. [Google Scholar] [CrossRef] [PubMed]
- Schneider, C.A.; Rasband, W.S.; Eliceiri, K.W. NIH Image to ImageJ: 25 Years of Image Analysis. Nat. Methods 2012, 9, 671–675. [Google Scholar] [CrossRef] [PubMed]
- Niemira, B.A.; Kirk, W.W.; Stein, J.M. Screening for Late Blight Susceptibility in Potato Tubers by Digital Analysis of Cut Tuber Surfaces. Plant Dis. 1999, 83, 469–473. [Google Scholar] [CrossRef] [PubMed]
- Abu El Samen, F.M.; Nasrallah, M.; Alfaqih, M.A.; Alananbeh, K.M. Prevalence and Pathogenicity of Fungi Associated with Grapevine Trunk Diseases in Jordan. Phytopathol. Mediterr. 2023, 62, 255–268. [Google Scholar] [CrossRef]
Figure 1.
Foliar dieback symptoms, gummosis, and cankers on branches and trunks of stone fruit trees.
Figure 1.
Foliar dieback symptoms, gummosis, and cankers on branches and trunks of stone fruit trees.
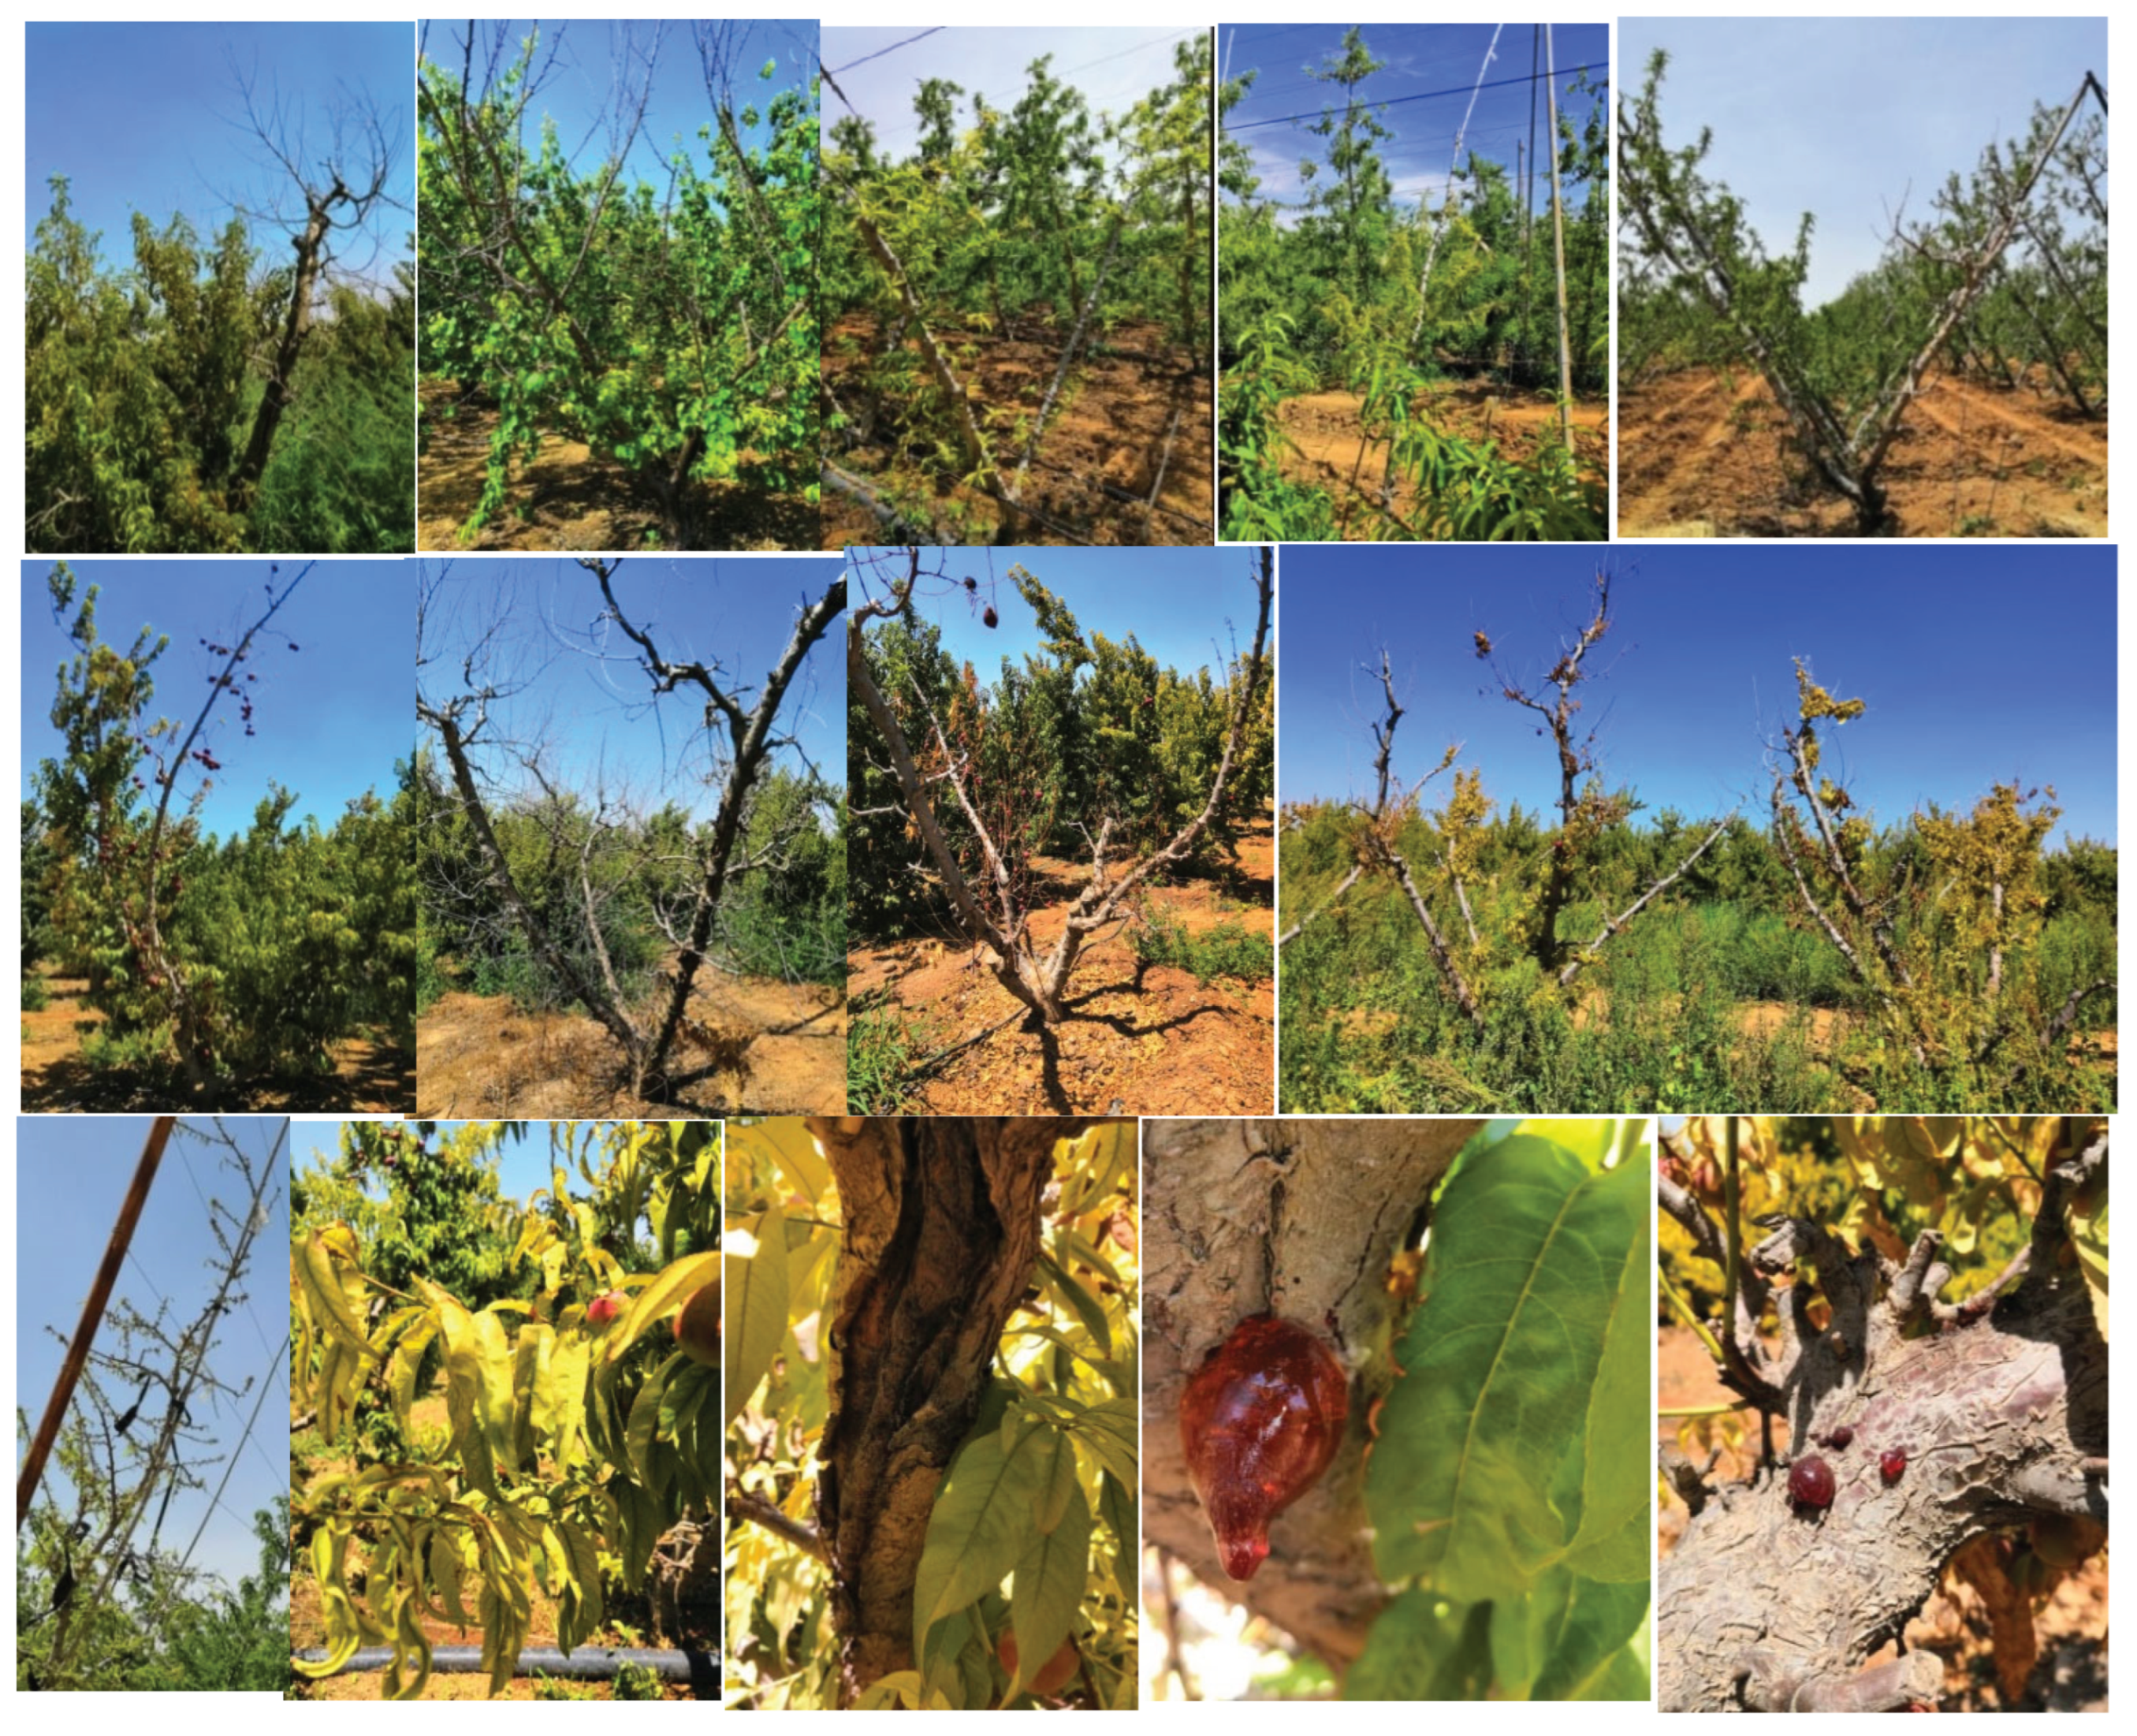
Figure 2.
Symptoms of internal vascular discoloration of branches from different orchards in Al-Mafraq.
Figure 2.
Symptoms of internal vascular discoloration of branches from different orchards in Al-Mafraq.
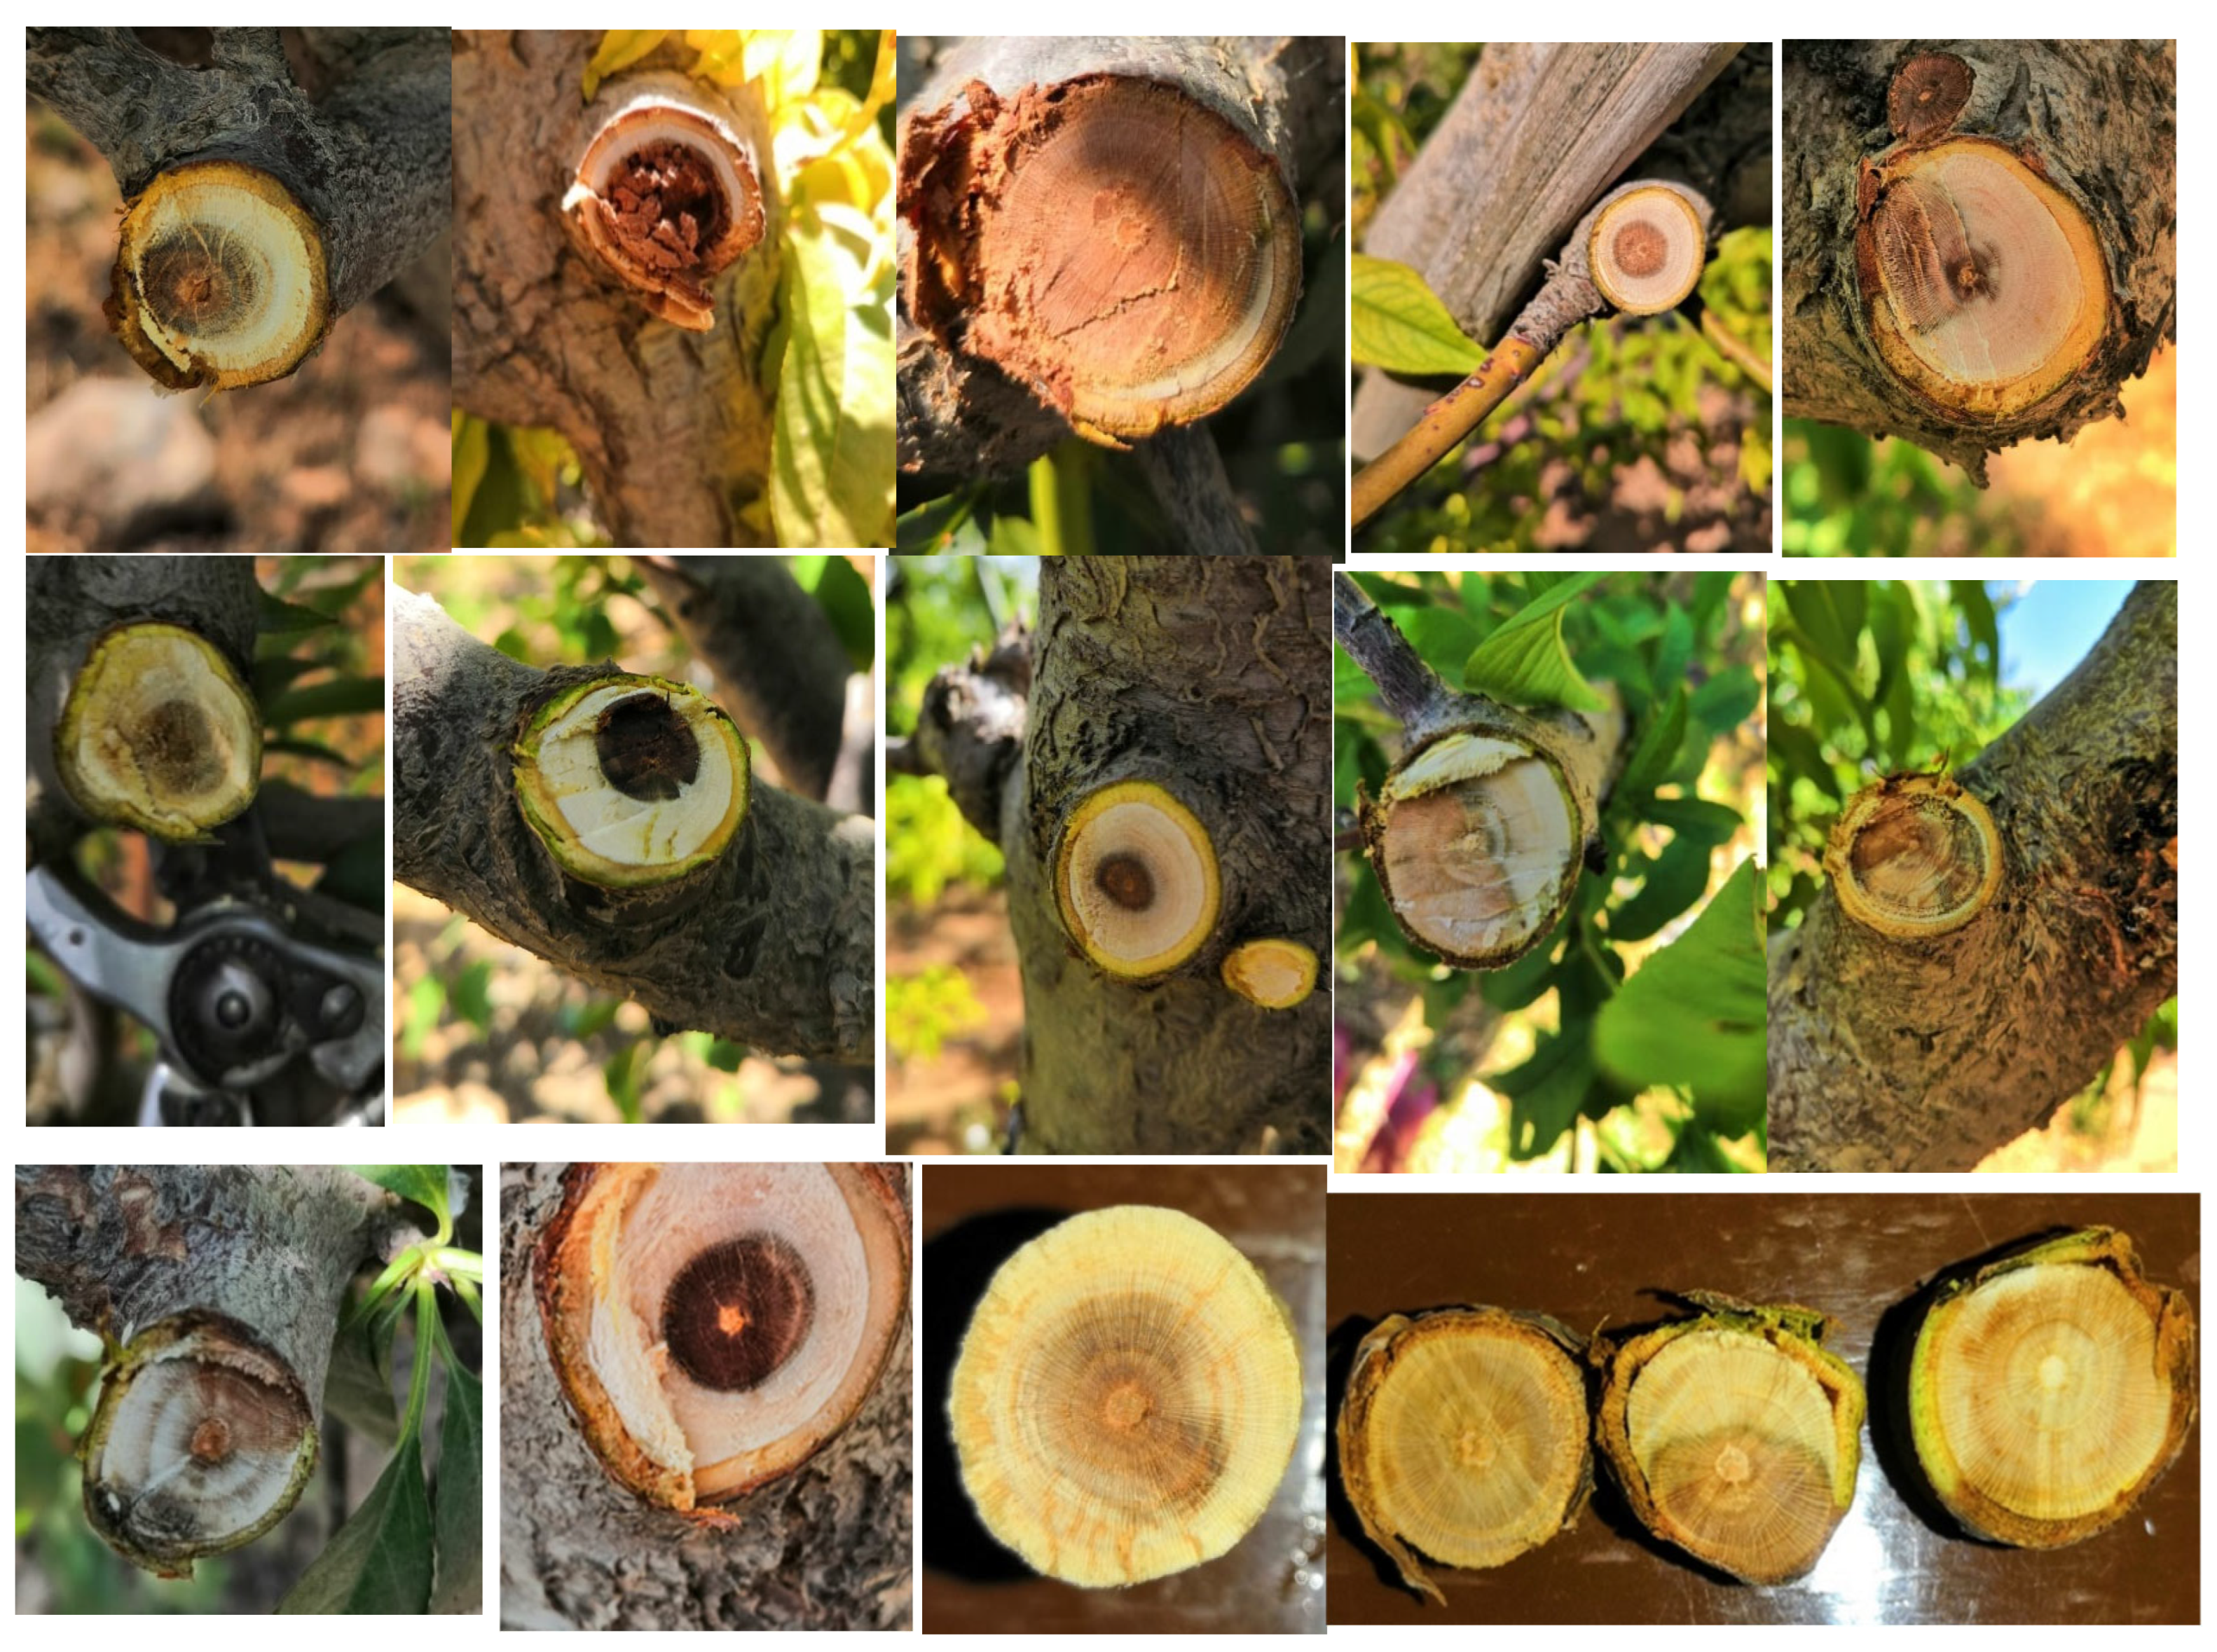
Figure 5.
The effect of Difenoconazole [Score® 25% EC] fungicide on Neoscytalidium dimidiatum (Isolate No. 38) mycelium growth at different concentrations (0-0.01 mg/mL).
Figure 5.
The effect of Difenoconazole [Score® 25% EC] fungicide on Neoscytalidium dimidiatum (Isolate No. 38) mycelium growth at different concentrations (0-0.01 mg/mL).
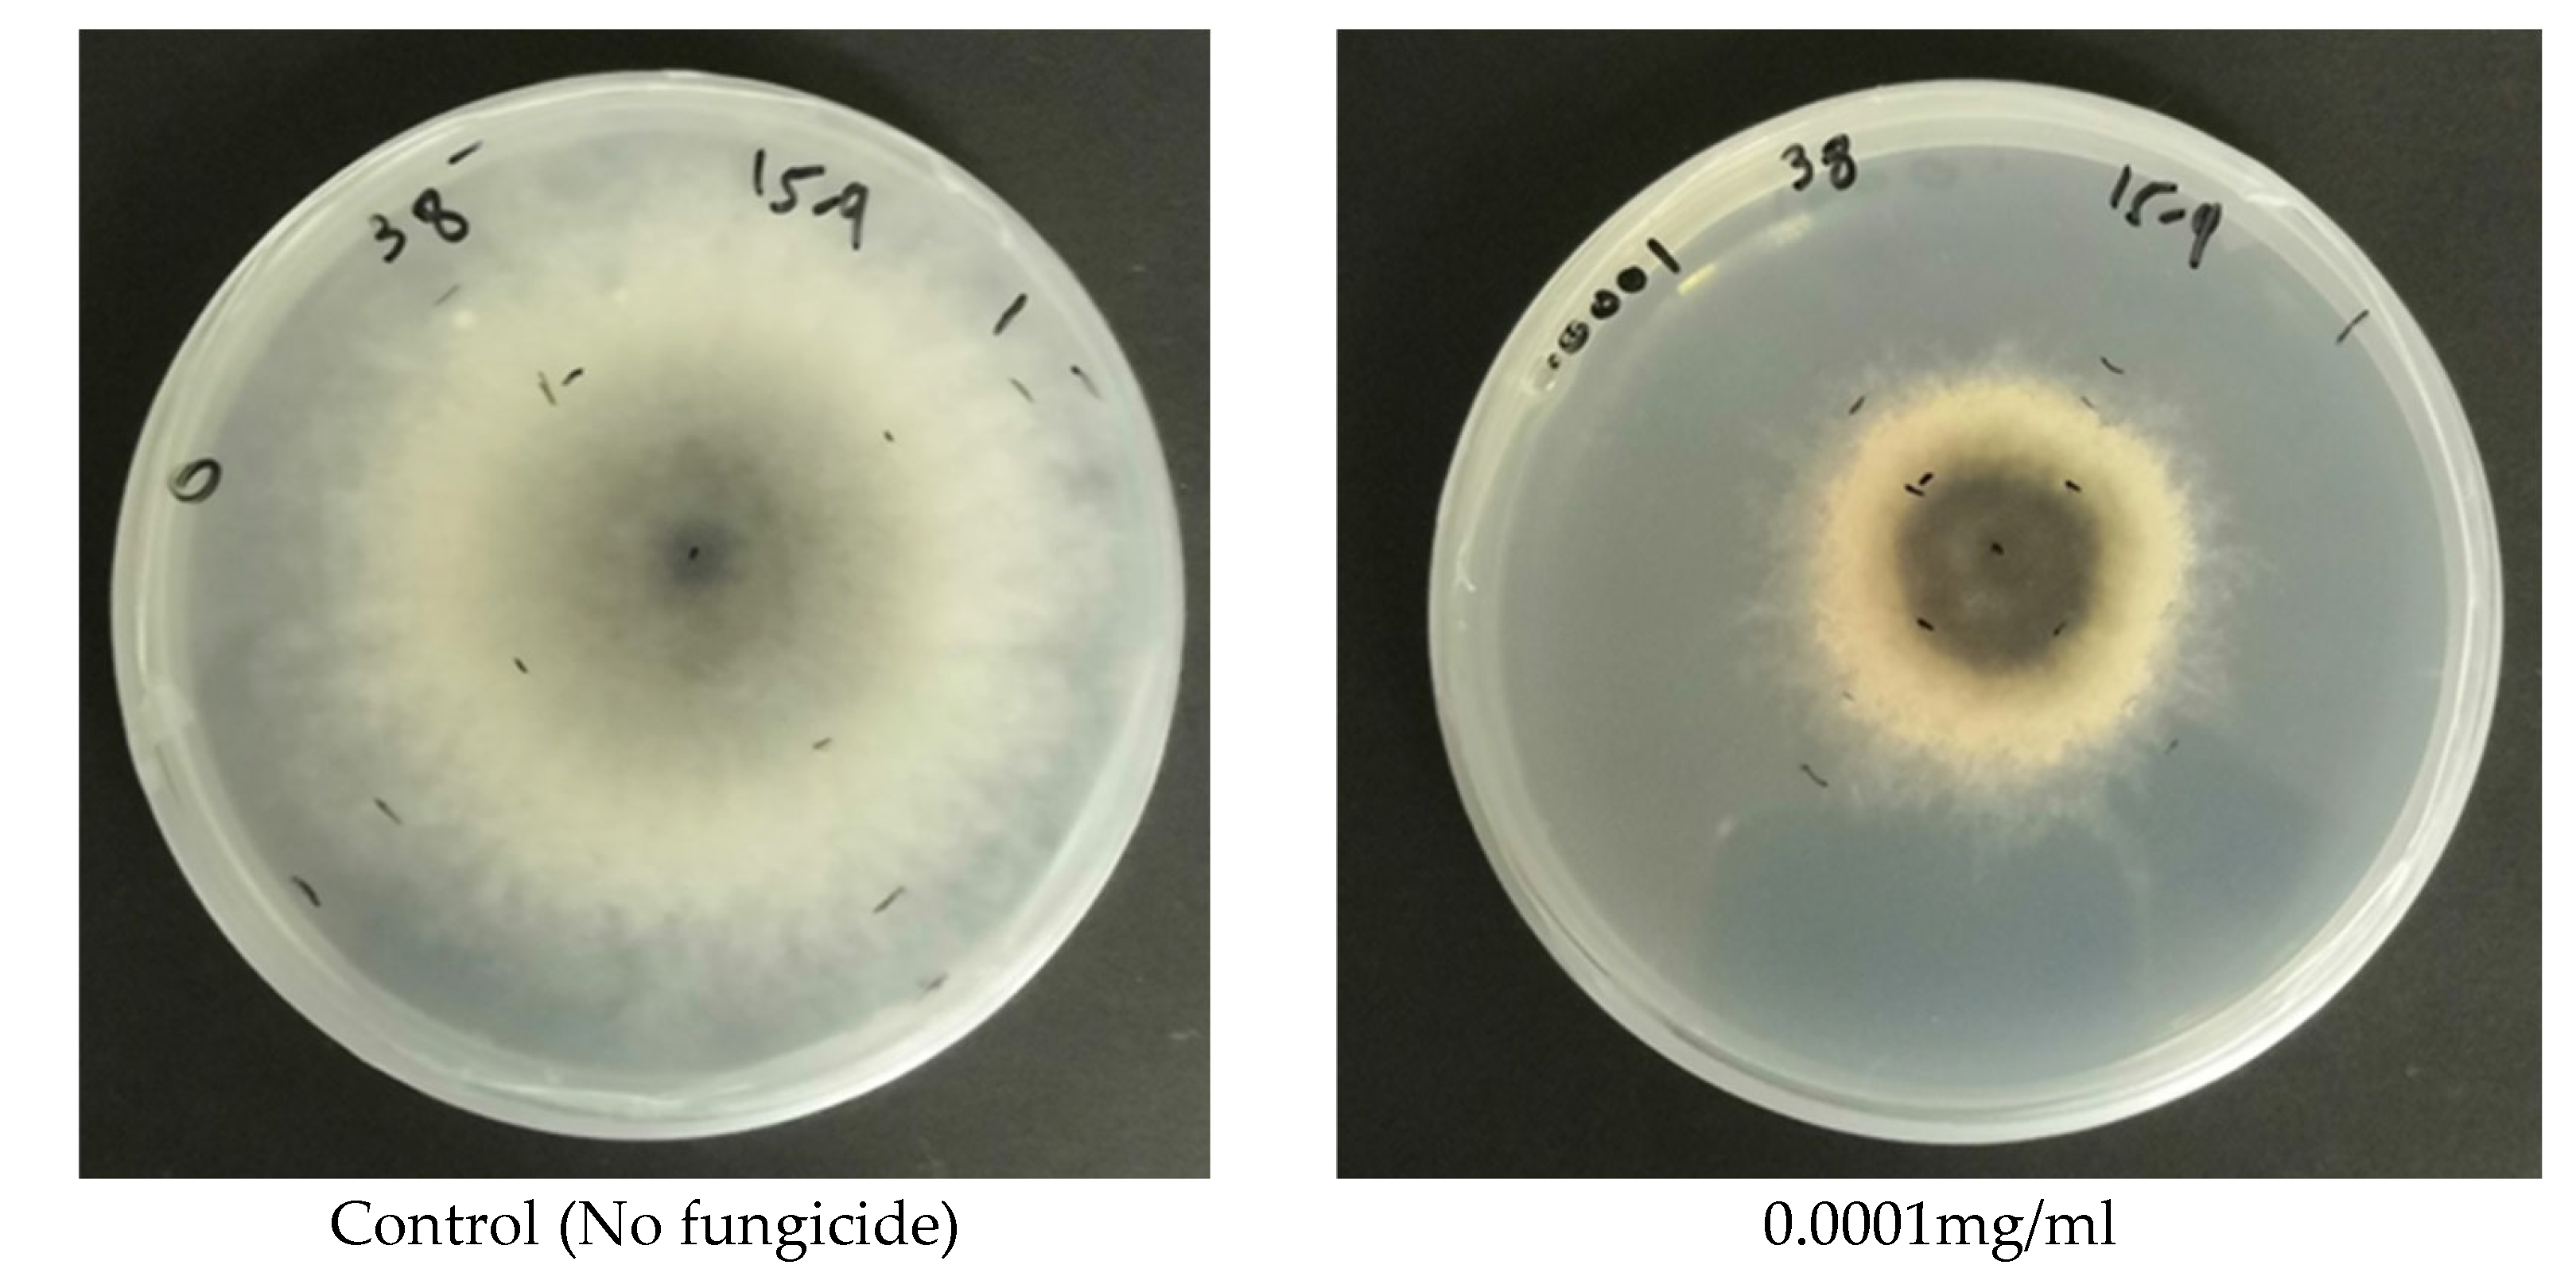
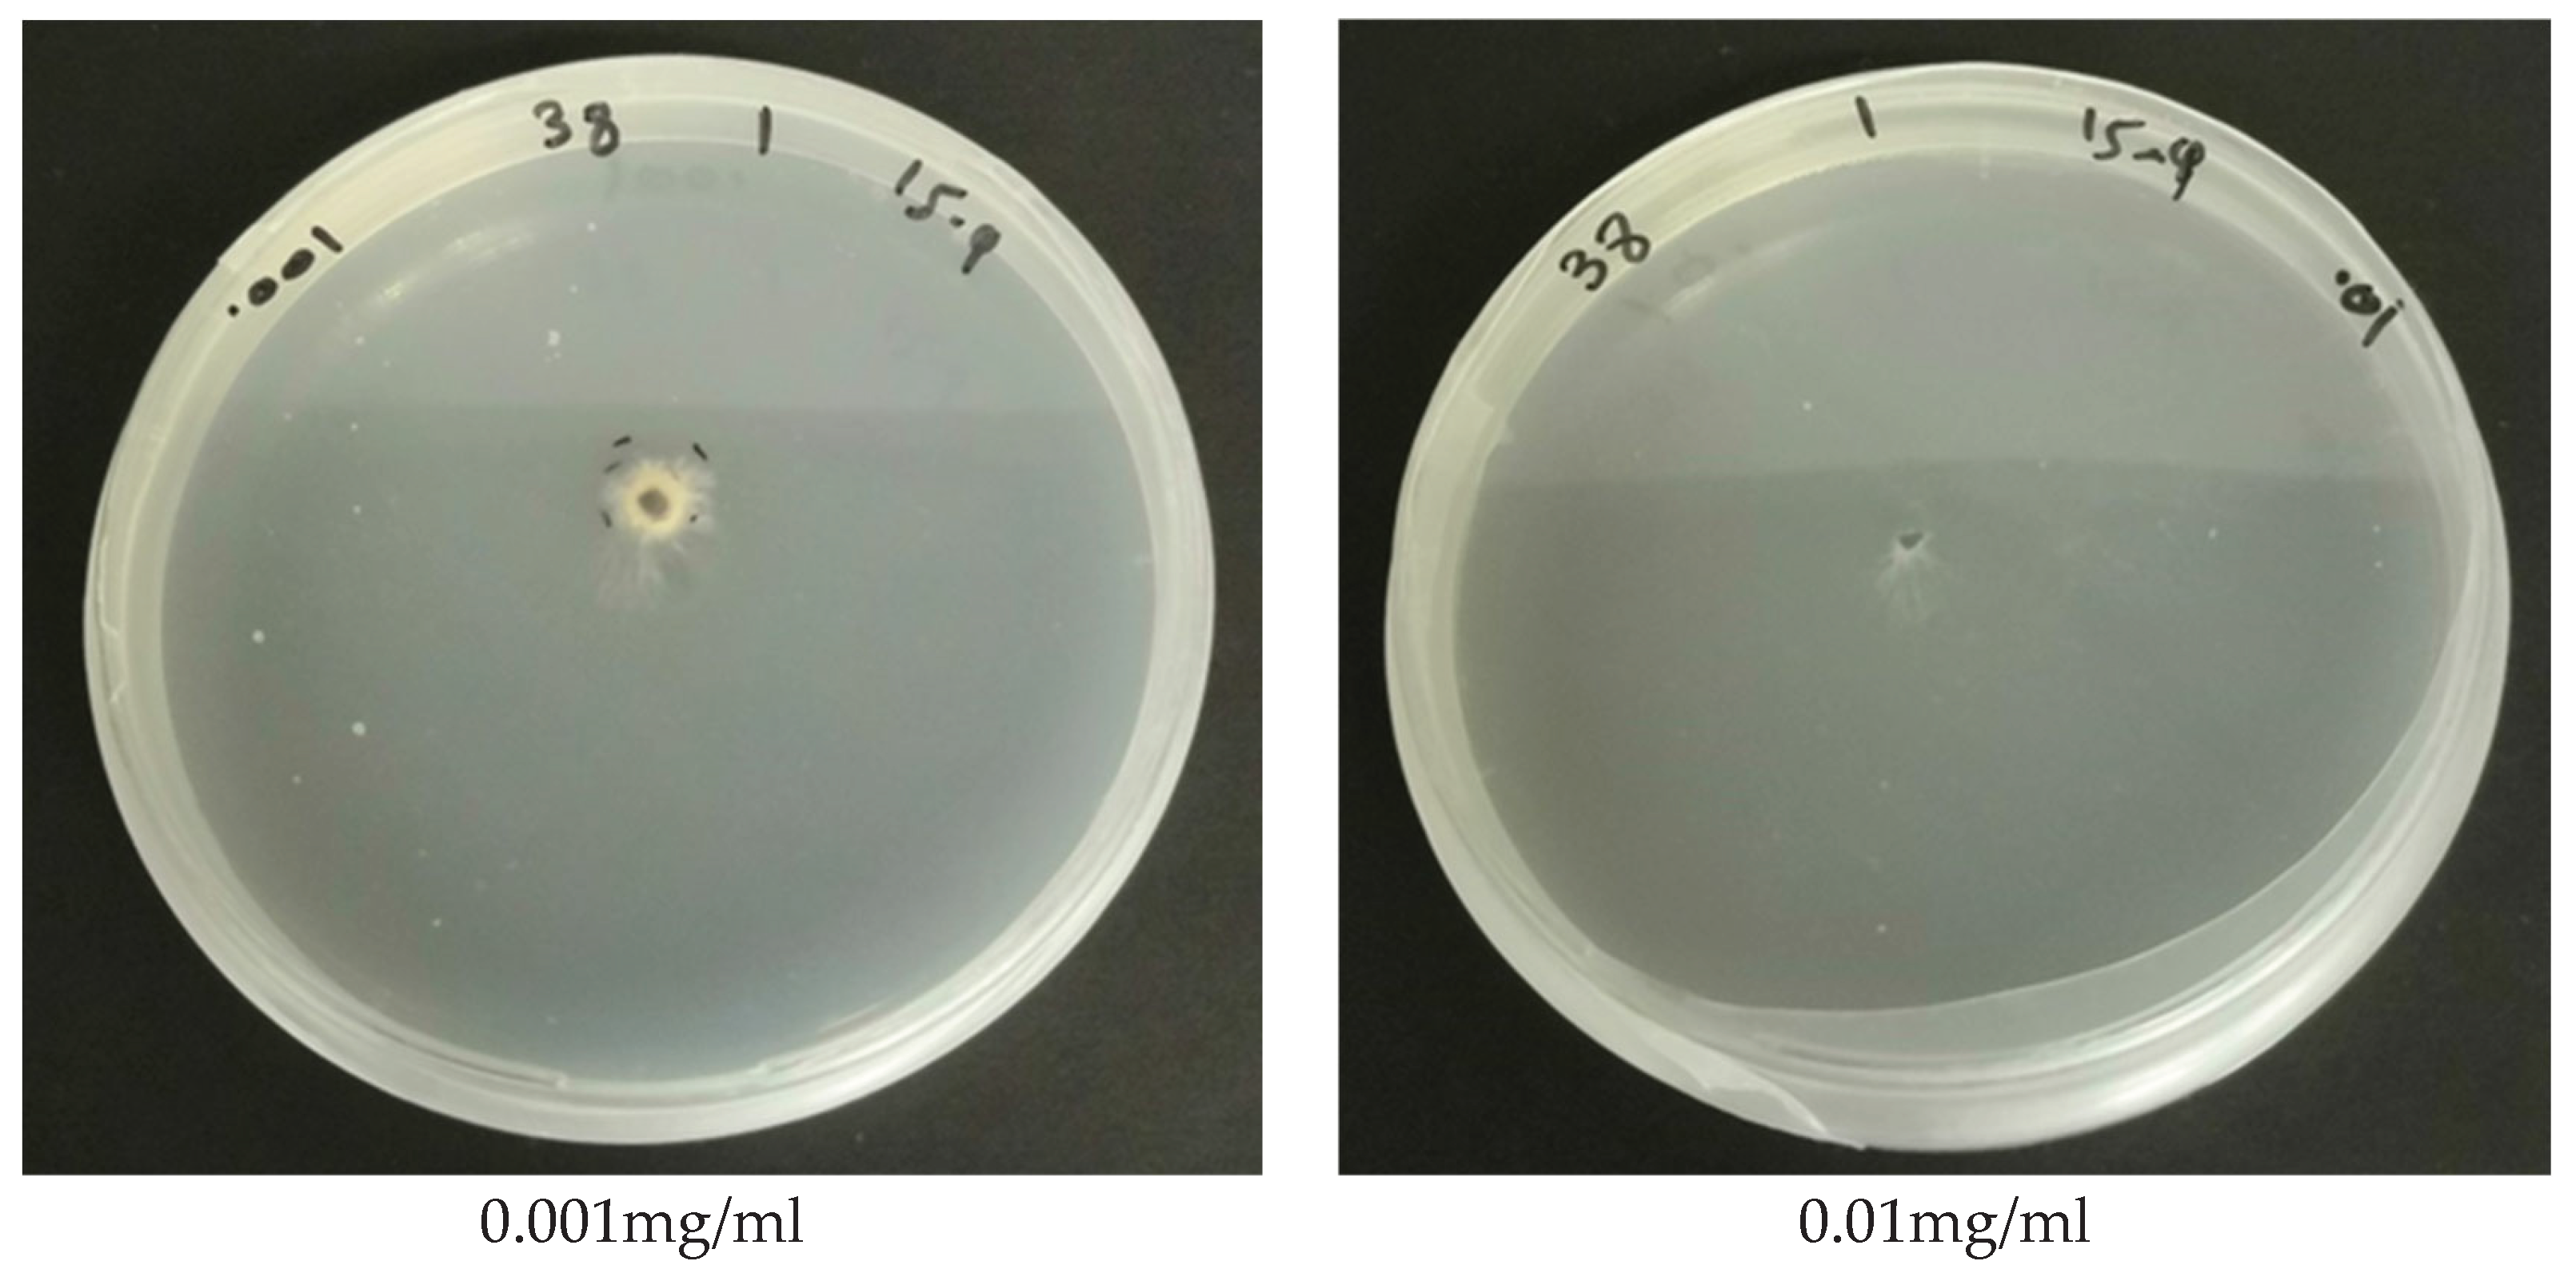
Table 3.
Mean disease severity (MDS) of dieback and decline of stone fruits estimated by digital image analysis of cross sections from inoculated Apricot seedlings. Sections were cut from three locations above and below the inoculation point (1-3 cm).
Table 3.
Mean disease severity (MDS) of dieback and decline of stone fruits estimated by digital image analysis of cross sections from inoculated Apricot seedlings. Sections were cut from three locations above and below the inoculation point (1-3 cm).
| Isolate Number | Pathogen | DS* (%) Above Inoculation Point | DS (%) below the Inoculation Point | Mean Disease Severity % | ||||
|---|---|---|---|---|---|---|---|---|
| 1cm | 2cm | 3cm | 1cm | 2cm | 3cm | |||
| 13 | Fusarium proliferatum | 38.15 | 20.86 | 12.88 | 42.37 | 25.46 | 18.79 | 26.42 |
| 14 | Fusarium proliferatum | 38.1 | 26.46 | 16.03 | 31.21 | 26.51 | 8.65 | 24.49 |
| 28 | Fusarium proliferatum | 23.21 | 14.39 | 1.88 | 21.72 | 12.81 | 0.27 | 12.38 |
| 17 | Fusarium proliferatum | 47.48 | 33.53 | 20.32 | 64.81 | 35.42 | 19.4 | 36.83 |
| 21 | Fusarium proliferatum | 27.82 | 16.92 | 10.21 | 35.85 | 25.53 | 18.52 | 22.48 |
| 19 | Fusarium proliferatum | 42.61 | 32.21 | 12.85 | 38.85 | 28.22 | 16.29 | 28.5 |
| 31 | Fusarium proliferatum | 35.6 | 17.03 | 1.29 | 32.52 | 19.55 | 0 | 17.67 |
| 26 | Fusarium proliferatum | 42.08 | 30.52 | 24.27 | 42.23 | 30.26 | 21.3 | 31.78 |
| 34 | Fusarium proliferatum | 23.15 | 14.0 | 8.3 | 23.72 | 11.75 | 0.5 | 13.57 |
| 5 | Fusarium proliferatum | 45.88 | 36.09 | 22.27 | 30.57 | 21.42 | 11.92 | 28.03 |
| 6 | Fusarium proliferatum | 32.3 | 20.72 | 13.07 | 34.35 | 22.15 | 14.26 | 22.81 |
| 36 | Fusarium proliferatum | 25.04 | 19.14 | 0.39 | 35.11 | 23.09 | 6.43 | 18.2 |
| 3 | Fusarium proliferatum | 26.74 | 15.13 | 2.71 | 36.7 | 25.09 | 12.89 | 19.88 |
| 27 | Fusarium proliferatum | 66.01 | 31.02 | 9.67 | 59.68 | 32.43 | 1.72 | 33.42 |
| 7 | Fusarium proliferatum | 65.62 | 49.38 | 22.31 | 58.71 | 45.15 | 19.13 | 43.38 |
| 32 | Fusarium proliferatum | 41.15 | 23.17 | 5.56 | 32.35 | 20.6 | 15.82 | 23.11 |
| 16 | Fusarium proliferatum | 34.46 | 19.07 | 5.42 | 41.16 | 33.32 | 20.13 | 25.59 |
| 1 | Fusarium proliferatum | 75.11 | 61.39 | 28.5 | 67.46 | 57.25 | 6.43 | 49.36 |
| 9 | Fusarium oxysporum | 35.2 | 26.74 | 18.98 | 47.44 | 37.12 | 25.9 | 31.9 |
| 23 | Fusarium oxysporum | 34.11 | 26.64 | 13.79 | 33.59 | 23.37 | 16.61 | 24.68 |
| 22 | Fusarium oxysporum | 36.55 | 26.34 | 19.19 | 47.4 | 30.93 | 20.9 | 30.22 |
| 20 | Fusarium oxysporum | 31.08 | 19.19 | 12.35 | 32.14 | 24.81 | 15.57 | 22.52 |
| 4 | Fusarium oxysporum | 52.23 | 31.27 | 19.19 | 62.94 | 38.77 | 28.54 | 38.82 |
| 2 | Fusarium oxysporum | 57.57 | 31.95 | 25.93 | 40.51 | 32.3 | 1.67 | 31.66 |
| 29 | Fusarium oxysporum | 36.51 | 15.31 | 2.89 | 37.72 | 22.71 | 11.3 | 21.07 |
| 10 | Cladosporium oxysporum | 36.67 | 27.49 | 19.58 | 35.37 | 26.79 | 19.12 | 27.5 |
| 15 | Valsa sordida | 21.46 | 11.19 | 0.96 | 21.91 | 11.29 | 0 | 11.13 |
| 33 | Neoscytalidium hyalinum | 28.6 | 16.29 | 10.21 | 29.22 | 20.63 | 14.31 | 19.88 |
| 11 | Neoscytalidium dimidiatum | 37.34 | 21.37 | 2.33 | 30.16 | 20.02 | 6.04 | 19.55 |
| 38 | Neoscytalidium dimidiatum | 32.91 | 20.17 | 15.85 | 33.42 | 21.83 | 16.47 | 23.44 |
| 18 | Neoscytalidium dimidiatum | 61.54 | 48.49 | 22.64 | 48.07 | 23.66 | 16.3 | 36.78 |
Table 4.
The in vitro mean percent inhibition of the radial mycelium growth of different fungal isolates causing stone fruit trees dieback at different concentrations (mg active ingredient per ml media) of the fungicide Azoxystrobin [Quadris® 250 SC] and the calculated EC50 value for each fungal isolate tested.
| Isolate Number | Fungal Pathogen | Mean Inhibition of the Radial Growth (%) a | Mean EC50 c | ||||||||
|---|---|---|---|---|---|---|---|---|---|---|---|
| 0.01 mg/mL | 0.1 mg/mL | 1.0 mg/mL | 10.0 mg/mL | ||||||||
| 13 | Fusarium proliferatum | 24.88 | AB b | 60.67 | B | 66.71 | B | 76.16 | B |
0.024 |
A |
| 23 | Fusarium oxysporum | 34.85 | A | 73.01 | A | 80.50 | A | 87.12 | AB | 0.020 | A |
| 38 | Neoscytalidium dimidiatum | 29.50 | A | 53.47 | C | 67.35 | B | 84.03 | AB | 0.130 | A |
| 33 | Neoscytalidium hyalinum | 29.61 | A | 43.64 | D | 66.42 | B | 84.30 | AB | 0.503 | A |
| 10 | Cladosporium oxysporum | 16.02 | B | 37.60 | E | 61.08 | B | 83.98 | AB | 0.331 | A |
| 1 | Fusarium proliferatum | 14.90 | B | 38.89 | DE | 60.60 | B | 84.27 | AB | 0.275 | A |
| 4 | Fusarium oxysporum | 14.48 | B | 37.47 | E | 60.06 | B | 89.32 | A | 0.583 | A |
| HSD | 12.46 | 5.39 | 11.23 | 12.83 | 0.88 | ||||||
a: The Mean percent inhibition of the radial mycelium growth of the fungal isolates was estimated from two experimental runs, each has three replicates. b: Means (in each column) followed by the same letters are not significantly different according to Tukey’s honest least significant difference test (p < 0.05). c: The effective concentration of the fungicide that inhibits mycelium growth of an isolate by 50%. EC50 values were calculated from two experimental runs; values followed by the same letters are not significantly different according to Tukey’s honest least significant difference test (p < 0.05).
Table 5.
The in vitro mean percent inhibition of the radial mycelium growth of different fungal isolates causing stone fruit trees dieback at different concentrations (mg active ingredient per ml media) of the fungicide Pydiflumetofen [Miravis® 200 SC] and the calculated EC50 value for each fungal isolate tested.
| Isolate Number | FUNGI | Mean Inhibition of the Radial Growth (%) a | Mean EC50 c | ||||||||
|---|---|---|---|---|---|---|---|---|---|---|---|
| 0.001 mg/mL | 0.01 mg/mL | 0.1 mg/mL | 1.0 mg/mL | ||||||||
| 13 | Fusarium proliferatum | 22.98 | BC b | 39.01 | AB | 66.89 | B | 77.97 | B | 0.021 | B |
| 23 | Fusarium oxysporum | 48.29 | A | 62.83 | A | 74.76 | A | 83.76 | A | 0.016 | B |
| 38 | Neoscytalidium dimidiatum | 21.90 | BC | 34.72 | B | 50.60 | C | 67.20 | C | 0.048 | B |
| 33 | Neoscytalidium hyalinum | 17.23 | C | 31.22 | B | 43.49 | D | 69.16 | C | 0.126 | A |
| 10 | Cladosporium oxysporum | 32.12 | B | 49.21 | AB | 73.38 | A | 79.55 | B | 0.017 | B |
| 1 | Fusarium proliferatum (1) | 29.85 | BC | 46.47 | AB | 71.24 | A | 77.75 | B | 0.016 | B |
| 4 | Fusarium oxysporum (4) | 32.61 | B | 50.34 | AB | 74.68 | A | 80.32 | AB | 0.015 | B |
| HSD | 13.096 | 24.747 | 4.161 | 4.170 | 0.06561 | ||||||
a: The Mean percent inhibition of the radial mycelium growth of the fungal isolates was estimated from two experimental runs, each has three replicates. b: Means (in each column) followed by the same letters are not significantly different according to Tukey’s honest least significant difference test (p < 0.05). c: The effective concentration of the fungicide that inhibits mycelium growth of an isolate by 50%. EC50 values were calculated from two experimental runs; values followed by same letters are not significantly different according to Tuckey’s honest least significant difference test (p < 0.05).
Table 6.
The in vitro mean percent inhibition of the radial mycelium growth of different fungal isolates causing stone fruit trees dieback at different concentrations (mg active ingredient per ml media) of the fungicide Difenoconazole [Score® 25% EC] and the calculated EC50 value for each fungal isolate tested.
| Isolate Number | FUNGI | Mean Inhibition of the Radial Growth (%) a | Mean EC50 c | ||||||||
|---|---|---|---|---|---|---|---|---|---|---|---|
| 0.0001 mg/mL | 0.001 mg/mL | 0.01 mg/mL | 0.1 mg/mL | ||||||||
| 13 | Fusarium proliferatum | 22.31 | A | 59.45 | CD | 78.23 | C | 84.52 | C | 0.00060 | ABCD |
| 23 | Fusarium oxysporum | 24.10 | A | 69.58 | BC | 86.72 | B | 92.96 | B | 0.00037 | BCD |
| 38 | Neoscytalidium dimidiatum | 41.50 | A | 84.29 | A | 97.03 | A | 100.00 | A | 0.00023 | D |
| 33 | Neoscytalidium hyalinum | 31.46 | A | 81.95 | AB | 100.00 | A | 100.00 | A | 0.00027 | CD |
| 10 | Cladosporium oxysporum | 29.75 | A | 56.82 | CD | 100.00 | A | 100.00 | A | 0.00127 | ABC |
| 1 | Fusarium proliferatum (1) | 28.89 | A | 55.11 | D | 96.48 | A | 100.00 | A | 0.00137 | AB |
| 4 | Fusarium oxysporum (4) | 30.90 | A | 53.78 | D | 100.00 | A | 100.00 | A | 0.00156 | A |
| HSD | 21.430 | 12.787 | 5.367 | 1.883 | 0.00102 | ||||||
a: The Mean percent inhibition of the radial mycelium growth of the fungal isolates was estimated from two experimental runs, each has three replicates. b: Means (in each column) followed by the same letters are not significantly different according to Tukey’s honest least significant difference test (p < 0.05). c: The effective concentration of the fungicide that inhibits mycelium growth of an isolate by 50%. EC50 values were calculated from two experimental runs; values followed by the same letters are not significantly different according to Tukey’s honest least significant difference test (p < 0.05).
Table 7.
The in vitro mean percent inhibition of the radial mycelium growth of different fungal isolates causing stone fruit trees dieback at different concentrations (mg active ingredient per ml media) of the fungicide Tebuconazole [Tebuchem® 10 EC], and the calculated EC50 value for each fungal isolate tested.
| Isolate Number | FUNGI | Mean Inhibition of the Radial Growth (%) a | Mean EC50 c | ||||||||
|---|---|---|---|---|---|---|---|---|---|---|---|
| 0.000001 mg/mL | 0.00001 mg/mL | 0.0001 mg/mL | 0.001 mg/mL | ||||||||
| 13 | Fusarium proliferatum | 12.23 | C | 38.43 | A | 71.13 | B | 99.19 | A | 0.000034 | A |
| 23 | Fusarium oxysporum | 19.82 | B | 49.01 | A | 82.68 | A | 100 | A | 0.000022 | A |
| 38 | Neoscytalidium dimidiatum | 25.22 | A | 53.28 | A | 91.18 | A | 100 | A | 0.000018 | A |
| 33 | Neoscytalidium hyalinum | 27.23 | AB | 41.25 | A | 90.29 | A | 100 | A | 0.000028 | A |
| 10 | Cladosporium oxysporum | 8.71 | C | 14.67 | B | 31.92 | C | 51.1 | B | 0.000152 | A |
| 1 | Fusarium proliferatum (1) | 7.86 | C | 13.15 | B | 23 | C | 48.14 | B | 0.00026 | A |
| 4 | Fusarium oxysporum (4) | 7.93 | C | 12.24 | B | 23.99 | C | 48.2 | B | 0.000243 | A |
| HSD | 5.901 | 21.790 | 9.698 | 6.008 | 0.00032 | ||||||
a: The Mean percent inhibition of the radial mycelium growth of the fungal isolates was estimated from two experimental runs, each has three replicates. b: Means (in each column) followed by the same letters are not significantly different according to Tukey’s honest least significant difference test (p < 0.05). c: The effective concentration of the fungicide that inhibits mycelium growth of an isolate by 50%. EC50 values were calculated from two experimental runs; values followed by the same letters are not significantly different according to Tukey’s honest least significant difference test (p < 0.05).
Disclaimer/Publisher’s Note: The statements, opinions and data contained in all publications are solely those of the individual author(s) and contributor(s) and not of MDPI and/or the editor(s). MDPI and/or the editor(s) disclaim responsibility for any injury to people or property resulting from any ideas, methods, instructions or products referred to in the content. |
© 2026 by the authors. Licensee MDPI, Basel, Switzerland. This article is an open access article distributed under the terms and conditions of the Creative Commons Attribution (CC BY) license (http://creativecommons.org/licenses/by/4.0/).
Copyright: This open access article is published under a Creative Commons CC BY 4.0 license, which permit the free download, distribution, and reuse, provided that the author and preprint are cited in any reuse.


