Submitted:
06 February 2026
Posted:
09 February 2026
You are already at the latest version
Abstract
Three-dimensional printing (3DP) has attracted growing attention in the construction industry due to labor shortages and the need for greater efficiency. However, there have been only a few previous studies focused on mixture design strategies that address the thixotropy of fiber-reinforced mortars for 3DP. In addition, the relationships among thixotropy, printability, and interlayer stability have not been sufficiently verified. This study aims to establish a quantitative method for evaluating the thixotropic properties of mortars used in construction 3DP, specifically on their practical applicability at construction sites. Vane shear and 15-stroke flow tests are conducted on mortars incorporating polyvinyl alcohol (PVA) fibers to assess their thixotropic behavior under static and dynamic conditions. Fiber-reinforced mortar mixtures are prepared, and their compressive and flexural strength developments over time are examined. The results indicate that the vane shear test is a sensitive and effective method for detecting changes in mortar rheology, particularly in response to variations in fiber content and admixture dosage. The inclusion of PVA fibers increased the maximum shear stress owing to fiber aggregation, resulting in atypical thixotropic behavior compared to that of fiber-free mortars. While the 15-stroke flow test provided supplementary information on flowability, the vane shear test exhibited a stronger correlation with mechanical properties and printed build quality. These findings suggest that vane shear testing offers a practical and reliable means of evaluating and managing the thixotropic properties of mortars for 3DP, thereby enhancing quality control in additive construction.
Keywords:
construction 3D printing
; thixotropy
; PVA fibers
; maximum shear stress
; 15-stroke flow
; interlayer stability
1. Introduction
In recent years, the construction industry has faced challenges related to labor shortages and efficiency owing to the shortage and aging of skilled workers [1,2]. Among the potential solutions, three-dimensional printing (3D printing, or 3DP) technology has attracted increasing attention because of its potential to enhance productivity and reduce environmental impact [3,4,5].
Various applications of 3DP have been reported worldwide, including the construction of exterior support walls for damage repair, low-cost housing, base facilities, and Three-dimensional concrete printing bridges. These cases demonstrate the continuous technological advancements and diversification of 3DP for various structural applications [6,7,8,9,10,11].
In Japan, however, the use of 3DP in architecture is limited, with most applications focusing on small-scale buildings such as warehouses [12]. This restriction is mainly owing to the Building Standards Act, which strictly regulates the strength, materials, and construction methods of structural components. Consequently, the use of 3DP mortars in load-bearing elements requires ministerial certification.
In civil engineering, precast blocks manufactured using 3DP for coastal structures have shown abrasion resistance comparable to that of high-strength concrete [13]. Moreover, demonstration prototypes for bridge-pier applications revealed that the measured as-built geometries closely matched the design specifications [14]. These findings indicate that practical applications are expanding from small- to large-scale structures.
In 2018, the Japan Concrete Institute established the “Research Committee on the Construction of Concrete Structures Using 3DP” to promote domestic technological development and standardization. Related committees were subsequently launched within the Architectural Institute of Japan and the Japan Society of Civil Engineers, encouraging active discussion on this subject [1,15]. Nevertheless, research and practical implementation in Japan lag behind those in other countries.
Construction using 3DP (Figure 1) offers several advantages, including greater design flexibility, shorter construction periods, and reduced labor and formwork material costs, because it enables direct fabrication of structures without formwork [1,3].
Meanwhile, in the material extrusion method—the predominant 3DP technique—[1,3,7,16,17,18] the mortar must flow smoothly through the nozzle without clogging while hardening rapidly to provide sufficient strength to support subsequent layers [17,19]. Therefore, the material must simultaneously ensure extrudability, stable nozzle discharge, and interlayer stability, while maintaining its shape after deposition. In other words, it must possess thixotropic properties [18,20,21].
Thixotropy is a time-dependent rheological behavior in which the apparent viscosity decreases over time at a constant shear rate and gradually recovers once the shear stress is removed [21,22,23,24,25,26,27]. Under static conditions, cement particles tend to flocculate owing to intermolecular forces and chemical bonding, resulting in increased viscosity. During pumping or mixing, this flocculation is disrupted, thereby decreasing the viscosity [22,23].
The materials used in 3DP exhibit thixotropic behavior owing to their specialized mix compositions, which differ substantially from those of conventional concrete. This distinction makes it difficult to apply traditional quality control methods [3]. Therefore, establishing a practical and straightforward method for evaluating the thixotropy of 3DP mortars after mixing, particularly under onsite construction conditions, is necessary.
Maeda et al. [18] reported that thixotropic characteristics could be identified from flow curves obtained using a rotational viscometer, demonstrating the importance of quantifying the shear properties of materials. However, rotational viscometers are expensive and difficult to manage at construction sites.
To address this issue, the authors [28] developed a low-cost testing apparatus to evaluate the extrudability and interlayer stability of 3DP mortars. Although the system provided valuable insights, it presented several challenges: the testing procedure was cumbersome because of the large number of components, and quantifying thixotropy was time-consuming.
Based on these findings, highly sensitive testing methods are required to evaluate the rheological properties of mortars under field conditions. For practical onsite use, such methods must also be simple, rapid, and operable without an external power supply.
To this end, the present study focused on a simplified approach to measuring thixotropy using a vane shear test. The vane shear test, which is well-suited for field applications, enables straightforward measurement of a sample’s maximum shear stress by inserting a vane blade into the material and recording the resistance during rotation [29]. Matsui et al. [30] and Murata et al. [31] evaluated mortar properties under static conditions after mixing and continuous stirring using both the mortar flow test (Japanese Industrial Standards, JIS R 5201 [32]) and the vane shear test. In the mortar flow test, a container known as a flow cone is filled with mortar, lifted, and allowed to spread owing to gravity and impact, after which the resulting flow diameter is measured. This method is widely used for indirectly assessing mortar shear properties [13].
The quality of 3DP mortar is generally governed by an appropriate combination of high cement content and large amounts of admixtures [25,26,27]. In addition, as illustrated in Figure 2, the incorporation of fibers as reinforcement improves interlayer adhesion and shape retention during deposition [33]. Fiber length affects hardening characteristics and bridging performance [34], enhancing tensile behavior and toughness. However, excessive fiber addition can lead to poor dispersion owing to agglomeration and may cause nozzle clogging [7,33,35]. Therefore, fiber-reinforced mortar mixtures must be optimized by balancing performance and workability.
Nonetheless, many existing 3DP mortar mixtures are either premixed or lack detailed formulation data necessary to verify their reproducibility. Moreover, the effects of fiber addition on thixotropy remain insufficiently understood, and quantitative indicators and methods available for evaluating such effects are limited, making experimental verification challenging. To date, few studies have focused on mixture design strategies that address the thixotropy of fiber-reinforced mortars for 3DP, and the relationships among thixotropy, printability, and interlayer stability have not been sufficiently verified.
Accordingly, this study aimed to establish a method to quantitatively evaluate the thixotropy of 3DP mortars under construction-site conditions. First, mortars incorporating polyvinyl alcohol (PVA) fibers were prepared. Subsequently, vane shear and 15-stroke flow tests were conducted under static and continuously stirred conditions after mixing, and the results were compared to examine the thixotropy evaluation method.
The effects of fiber content were further assessed by examining time-dependent variations in compressive and flexural strengths. Finally, a layer-stacking experiment was performed using an actual 3D printer. By examining the correlation between laboratory test results and the as-built geometries after printing, the detailed mix conditions and physical properties of thixotropic 3DP mortars were clarified in this study.
The findings of this study contribute to improved mixture design and construction management for 3DP mortar by quantitatively evaluating the influence of fiber addition on thixotropy and elucidating its correlation with interlayer stability.
The remainder of this paper is organized as follows. Section 2 describes the 3DP mortar preparation, thixotropy evaluation methods, and mechanical characterization tests. Section 3 compares the results obtained from the vane shear and 15-stroke flow tests, discusses high-sensitivity approaches for capturing thixotropy variations, and further examines the mechanical properties of mortar. Section 4 summarizes the findings and outlines future research.
2. Experiment Overview
2.1. Materials and Specimen Preparation
Table 1 lists the materials used in this study. Blast furnace slag cement Type B (BB) and silica fume (SF) were employed as binders (B), while finely ground calcium carbonate (Ca) was added to adjust the mortar’s flowability. The use of SF, which has a smaller particle size than cement, is expected to improve workability by filling the voids between cement particles and densifying the matrix [36]. Silica sand (S) with particle sizes ranging from 0.212 mm to 1.18 mm was used as the fine aggregate. A naphthalene-based retarding and superplasticizer (SP) served as the chemical admixture. The water-reducing mechanism of naphthalene-based admixtures relies solely on electrostatic repulsion generated by sulfonic acid groups. Consequently, their adsorption is less affected by alkali components leached from cement compared to that of polycarboxylate-based admixtures, which are highly sensitive to such factors. This results in superior material versatility. Moreover, even with the growing use of alternative powders such as calcium carbonate and blast furnace slag to reduce cement content, naphthalene-based admixtures remain stable and effective [37].
PVA fibers (F) with a length of 6 mm and diameter of 40 μm were used as reinforcement. PVA contains numerous hydroxyl groups along its polymer chain, which act as hydrophilic sites and promote strong chemical bonding with the cement paste [38,39,40,41,42]. In addition, alkali resistance allows PVA fibers to remain stable in mortar, limiting microcracking and inhibiting long-term toughness degradation through crack-bridging [41,42].
Table 2 lists the mix proportions of the 3DP mortars. The cement content was set high to impart sufficient viscosity and ensure dimensional stability after layering during extrusion–based 3D printing. The fine sand–to–powder ratio (S/P) was defined as the ratio of fine aggregate to combined BB, SF, and Ca content. The superplasticizer dosages were set at 0.9% and 1.1% by mass of mixing water and were internally adjusted within the total water content. This allowed comparison of the effects on thixotropy owing to improved flowability and delayed initial setting. PVA fiber dosages were set at 0%, 0.3%, and 0.6% by volume of mortar and were externally added to examine the influence of fiber addition on toughness and potential fiber agglomeration.
Additionally, the mortars marked with asterisks (*) in Table 2 were used in the layering experiments. In these experiments, two mix types were prepared and subjected to layering tests to clarify the influence of fiber addition on interlayer stability and mechanical performance: one mixture contained 0.3% PVA fibers, whereas the other, used for comparison, was an unsuitable mix lacking sufficient interlayer stability.
Mortar preparation was carried out using a 10 L vibrating mixer (OM-10E, Tiger Chiyoda Materials Co., Ltd, Yokohama, Japan). BB, SF, Ca, and S were first dry-mixed at 400 rpm for 1 min. Water containing 0.9% or 1.1% superplasticizer was then added, and mixing continued for 5 min. PVA fibers were subsequently added, followed by an additional 1 min of mixing to ensure homogeneous dispersion of all materials.
For strength testing, the mortar was cast into cylindrical molds (50 mm in diameter × 100 mm in height) and prismatic molds (40 mm × 40 mm × 160 mm). The specimens were compacted using a table vibrator (TS-450×600, Mikasa Sangyo Co., Ltd., Tokyo, Japan), sealed, and cured in a constant-temperature chamber at 20 °C for 1, 3, 7, 28, and 56 d.
2.2. Test Methods
- (1)
- Vane shear test
Figure 3 illustrates the vane shear test procedure, and Table 3 lists the specifications of each vane blade. In this test, freshly mixed mortar was placed in a 500 mL container, and the selected vane blade was inserted. The blade was rotated at a constant rate of 10°/s, and the maximum resistance torque Mmax (cN·m) was measured. The maximum shear stress τv (kN/m²) was then calculated using a simplified form of Cadling’s equation [30,43], as expressed in Equation (1):
where D is the vane blade diameter (mm), and H is the vane blade height (mm). To prevent interference from the failure zone generated by the vane blade during testing, separate mortar samples were prepared for each measurement immediately after mixing.
τv = Mmax / π(D²H/2 + D³/6)
- (2)
- 15-stroke flow test
Figure 4 shows the procedure for the 15-stroke flow test, conducted in accordance with JIS R 5201 [32]. The flow cone used had an upper diameter of 70.0 ± 0.5 mm, a lower diameter of 100.0 ±0.5 mm, and a height of 60.0 ± 0.5 mm. After filling the cone with mortar and lifting it vertically, the flow table was dropped 15 times, and the spread diameter was measured to evaluate resistance to shear deformation. For all mortar mixes, the initial flow value (at zero drops) was 100 mm. Therefore, a smaller spread after 15 strokes indicated higher shear resistance.
The vane shear and 15-stroke flow tests were 0, 5, 10, 15, 20, 25, and 30 min after mixing under the following two conditions:
Static condition: After mixing (0 min), the mortar was left undisturbed until each test time. This condition simulates 3D printing in which the material is extruded and deposited without external disturbance.
Stirred condition: After mixing (0 min), the mortar was continuously stirred at 40 rpm until each test time. This condition simulates re-stirring for delayed setting when a significant time elapses before extrusion.
Compressive strength test
The compressive strength test was conducted in accordance with JIS R 1108 [44] at curing ages of 1, 3 (early strength), 7 (medium-term strength), 28 (standard strength), and 56 (long-term strength) d to comprehensively evaluate strength development over time.
- (4)
- Flexural strength test
The flexural strength test followed JIS R 5201 [32], using the same testing ages as in the compressive strength test: 1 and 3 (early strength), 7 (medium-term strength), 28 (standard strength), and 56 (long-term strength) d. These tests evaluated the effects of varying superplasticizer dosages and fiber contents on flexural strength.
Specimens for both compressive and flexural strength tests were prepared in two series: one from the laboratory experiments and another from the layering experiments.
All tests were repeated three times under each condition, and the average of their results was reported as the final result.
- (5)
- Printing experiment
Figure 5 shows an overview of the laminated structure fabricated in this study and the locations where specimens were collected. Layering tests were conducted using a material extrusion-type 3D printer (Delta WASP 3MT CONCRETE, WASP Ltd.), as shown in Figure 1. During layering, the mortar discharge rate, layer interface width, column interface width, and nozzle travel speed (layer path speed) were set at 1.88 L/min, 10 mm, 20 mm, and 100 mm/s, respectively.
Interlayer stability refers to the ability to firmly stack layers without deformation or collapse [45]. Its evaluation was based on the maximum shear stress (described later), and feasibility was determined from differences in these values.
For mechanical testing, specimens were extracted from the printed elements as shown in Figure 5. Compressive strength specimens were prepared in accordance with JSCE-F 711-2025. Core samples were taken in two orientations: (a) vertical and (b) lateral. Three cores (45 mm in diameter and 150 mm in length) were extracted per orientation. Each core was ground to a height of 100 mm, and compressive strength tests were conducted after 3, 7, 14, and 28 d of curing. To avoid the influence of surface irregularities formed during printing, cores were taken from interior regions of the printed elements, excluding the ends, at positions with uniform width and height.
Flexural strength specimens were obtained by cutting the printed elements used in the layering tests in both vertical and horizontal directions relative to the interlayer interfaces, and were subsequently shaped into specimens measuring 40 mm × 40 mm × 160 mm.
Together, these tests enabled a multifaceted evaluation of the overall mechanical performance of laminated structures, accounting for the effects fiber orientation, anisotropy arising from the layering process, and interlaminar adhesion.
3. Results and Discussion
3.1. Vane Shear Test
Figure 6 shows the time variation in the maximum shear stress of the mortar under static and stirred conditions. In this test, the static condition represents the case in which the mortar is directly extruded and layered by 3DP immediately after mixing. In contrast, the stirred condition simulates a scenario where additional mixing is applied to delay setting when extrusion is postponed.
For all mixtures, the maximum shear stress increased as the setting progressed after mixing. Although the initial maximum shear stress varied with fiber content and superplasticizer dosage, the rate of stress increase during setting showed no significant difference among the mixtures. Regarding the thixotropic behavior required for 3D-printed mortars, continuous shear applied to cement particles during stirring mechanically disrupts early hydration products. This temporarily suppresses hydration, resulting in an apparent delay in setting and improved fluidity [46]. Therefore, a substantial change in maximum shear stress is not observed.
However, in this study, the stirred condition exhibited a higher maximum shear stress than the static condition. This result is attributed to the high hydrophilicity of the PVA fibers, which absorb water and reinforce the internal structure of the mortar through bridging, thereby increasing viscosity [33]. Even after stirring, the fibers likely remain partially entangled, acting as internal resistive elements that suppress shear-induced failure and limit flowability. This effect tends to be more pronounced with longer fiber lengths or higher fiber dosages [33,34,35].
When a lower shear stress limit of 2 kN/m² was adopted as a management guideline to ensure self-supporting capability after layering, all mixtures exceeded this threshold under static conditions, with even higher values under stirred conditions. This behavior is associated with the high initial viscosity of the mixtures, which promotes rapid structural reconstruction during mixing.
Accordingly, shear resistance exceeding this lower limit can be regarded as a favorable characteristic for maintaining shape after deposition.
These results confirm that the addition of PVA fibers suppresses shear failure and promotes structural reconstruction even after collapse. Therefore, the mortar exhibits behavior that differs from typical thixotropy, which is characterized solely by recovery of flowability after shear.
3.2. 15-Stroke Flow Test
Figure 7 shows the time variation of the 15-stroke flow values of the mortars under static and stirred conditions. As the setting progressed after mixing, the 15-stroke flow value decreased, with a more pronounced reduction observed under stirred conditions, indicating greater difficulty in maintaining fluidity.
This reduction is assumed to result from the temporary redispersion of fibers during stirring, followed by stronger interactions between fibers and between fibers and the cement paste as the setting progressed. These interactions led to localized aggregation or layer separation before the next measurement. In addition, the presence of fibers hindered the continuous flow of the mortar, producing a more cohesive and sticky flow behavior that suppressed the apparent flow value. This phenomenon can also be visually confirmed by the appearance of the mortar during the 15-stroke flow test, as shown in Figure 8.
Increasing the superplasticizer dosage improved fluidity across all mixtures. However, in fiber-reinforced mortars, a decline in fluidity retention was observed as the setting progressed.
Thus, maintaining fluidity becomes increasingly difficult over time, and the 15-stroke flow test alone may be insufficient for accurately evaluating time-dependent changes in flowability.
3.3. Relationship Between Maximum Shear Stress and 15-Stroke Flow
Figure 9 shows the relationship between the maximum shear stress ratio and the 15-stroke flow ratio to evaluate their correlation. Because the 15-stroke flow test alone has limitations in capturing time-dependent changes in fluidity, the results of the vane shear test were compared with those of this conventional method to clarify their relative positioning.
The shear stress ratio (Rshare stress) represents the ratio of the maximum shear stress at each elapsed time to its initial value immediately after mixing, as shown in Figure 7. Similarly, the 15-stroke flow ratio (R15 flow) represents the ratio of the flow value at each elapsed time to the initial flow value, as shown in Figure 8.
For the mixture containing 0.9% superplasticizer (SP9), a strong correlation (R² = 0.86) was observed between the maximum shear stress ratio and the 15-stroke flow ratio in the fiber-free mortar. This indicates that changes in internal structure and decreases in flowability progressed almost proportionally. By contrast, for fiber contents of 0.3% and 0.6%, the coefficients of determination (R²) were 0.74 and 0.66, respectively, showing moderate correlations. Notably, the regression slope was steepest at the 0.6% fiber content, suggesting that changes in maximum shear stress were most pronounced relative to changes in the 15-stroke flow. This behavior is attributed to fiber aggregation and network formation within the mortar, which caused localized stress concentrations as the fiber content increased.
When the superplasticizer dosage was increased to 1.1% (SP11), the fiber-free mortar exhibited a weak correlation (R² = 0.30) between the maximum shear stress ratio and the 15-stroke flow ratio, indicating minimal to no relationship between them. This can be explained by the enhanced dispersion of binder particles resulting from the higher superplasticizer content, which diminishes the sensitivity of both shear stress and flow behavior. However, when fibers were added, the correlation reappeared—particularly at 0.6% fiber content, R² = 0.66, indicating that fiber aggregation and bridging promoted the development of a more integrated internal structure, simultaneously increasing shear stress and reducing flowability.
These results indicate that evaluating thixotropic behavior using the vane shear and 15-stroke flow tests is difficult for highly flowable mortars containing large amounts of superplasticizers with no fibers. Conversely, for mortars exhibiting the thixotropic characteristics required for 3DP applications, the vane shear test is effective. This effectiveness can be attributed to the substantial changes in maximum shear stress associated with variations in the 15-stroke flow value. Specifically, when the 15-stroke flow ratio changed by 0.1, the maximum shear stress ratio varied by approximately 1, representing a tenfold increase. This pronounced response highlights the sensitivity of the vane shear test in capturing internal structural changes caused by fiber bridging and aggregation, indicating that it is a practical and robust method for evaluating 3DP mortar performance.
3.4. Compressive Strength Test
Figure 10 shows the compressive strengths of the 3D-printed mortars for each mix proportion. For mixtures with a 0.9% superplasticizer dosage (SP9), the highest compressive strength was obtained at a fiber content of 0.3%. A similar trend was observed for the mixtures containing 1.1% superplasticizer (SP11). The increase in strength owing to fiber addition can be attributed to the restraining effect of the fibers on lateral expansion under loading, which suppresses the initiation and propagation of microcracks [40,41,47,48].
However, when the fiber content increased to 0.6%, the compressive strength decreased slightly compared to that at 0.3%. This reduction is likely due to the greater proportion of low-strength fibers in the mortar, which decreased overall density and caused localized strength losses from fiber agglomeration [47].
Thus, while an appropriate fiber dosage enhances compressive strength, excessive fiber addition may lower mortar density and lead to poor fiber dispersion, thereby reducing strength. Furthermore, excessive use of superplasticizers can cause over-dispersion and bleeding [49], which may weaken the interfacial bonding between fibers and cement paste and suppress strength development.
3.5. Flexural Strength Test
Figure 11 presents the flexural strengths of the 3D-printed mortars with different mix proportions. For all mixtures, no significant improvement in flexural strength was observed with the addition of fibers or superplasticizers.
Generally, the inclusion of PVA fibers is known to suppress microcrack propagation, thereby enhancing the flexural strength and toughness of cementitious composites [33,34,35,41,42]. However, in the present study, this reinforcing effect was not clearly observed. At 56 d, the mortar without fibers exhibited higher strength, and no consistent trend with respect to fiber content was evident at other curing ages.
This suggests that the relatively low PVA fiber content, in relation to fiber geometry and the mix conditions adopted in this study, was insufficient to fully develop the reinforcing effect. Therefore, evaluating fiber contribution based solely on peak flexural strength is difficult. To examine fiber effects in greater detail, load and mid-span deflection during flexural testing were measured using a dynamic strain measurement system (DC-004P, Tokyo Measuring Instruments Laboratory Co., Ltd., Shinagawa-ku, Japan).
Figure 12 shows the relationship between load and mid-span deflection during the flexural test. To isolate the effect of fiber content, mixtures 32-F3SP9 and 32-F6SP9 were compared at curing ages of 1 and 7 d, representing early-age and stabilized strength development, respectively.
At both curing ages, the specimen with 0.6% fiber content exhibited smaller deflection at failure than the specimen with 0.3%, indicating a slight improvement in toughness with increasing fiber content and curing time.
In all specimens, the load dropped immediately after reaching the maximum value due to cracking, followed by a slight rebound. At 1 day of age, specimens with 0.6% fiber content tended to show a smaller load drop than those with 0.3% fiber content, suggesting that fibers provided limited resistance to bending stress during early strength development. However, within the fiber content range of 0.6% or less used in this study, fibers did not significantly improve flexural strength.
Therefore, the primary role of PVA fibers in this system is to impart thixotropic properties to the fresh mortar, facilitating the formation, retention, and reconstruction of internal structure and thereby enhancing the shape stability of layered elements. During early hardening, the fibers also appear to suppress post-cracking stress reduction and contribute to the initial stability of the layered structure.
3.6. Validity and Applicability of the Vane Shear Test in 3DP Layering Considering Fiber Orientation and Anisotropy
3.6.1. Relationship Between Maximum Shear Stress and Interlayer Stability
The results of the layering tests for the mixtures marked with an asterisk (*) in Table 2 are presented in Figure 13.
Mixture 32-F3SP9 exhibited a maximum shear stress of 2.39 kN/m², exceeding the control guideline value of 2 kN/m². Consequently, this mortar demonstrated excellent interlayer stability and was able to self-support without material discontinuity or bulging during deposition. In contrast, mixture 33-F3SP9 exhibited a maximum shear stress of 0.91 kN/m², which fell below the threshold. This mixture was too soft to self-support and was therefore unsuitable for stable layering.
These results demonstrate that the vane shear test is an effective method for managing thixotropic behavior. Specimens for compressive and flexural strength tests were extracted from the layered structure of mixture 32-F3SP9 after printing.
3.6.2. Compressive Strength of Printed Elements
Figure 14 shows the compressive strengths of cores extracted in the vertical and horizontal directions from the layered specimen. Core extraction was performed at a curing age of 3 days. For comparison, the strengths of molded specimens made from the same mortar, cast without layering and cured on site, are also presented. At all ages, the molded specimens exhibited the highest compressive strength. At 28 days, the strength reduction was approximately 22% for vertical cores and approximately 36% for horizontal cores. This difference is attributed to the relative orientation between the loading direction and the layer interfaces [50]. Vertical cores are structurally advantageous because the load is applied parallel to the layer stacking direction, reducing the likelihood of crack initiation across interfaces. In contrast, horizontal cores are more susceptible to delamination because the load crosses the interfaces, leading to reduced compressive strength. These results therefore reflect anisotropy caused by the layered structure.
3.6.3. Flexural Strength of Printed Elements
Figure 15 shows the flexural strengths of prismatic specimens taken from the laminated structure in the printing direction and perpendicular to the printing direction. For comparison, prismatic specimens cast in molds using the same mortar were also tested. In the printing direction, the specimens exhibited flexural strength comparable to that of the molded specimens at 28 days.
Previous studies have shown that 3D-printed materials exhibit anisotropic mechanical properties depending on printing parameters and loading orientation [51], and that fiber orientation does not always result in increased peak flexural strength. In the present study, interlayer discontinuities and microdamage introduced during specimen extraction may have limited strength enhancement.
In contrast, in the direction perpendicular to printing, cracking occurred predominantly along the layer interfaces, resulting in lower failure loads than in the printing direction. Comparison with the molded specimens indicates that these differences in flexural strength are primarily attributable to material anisotropy caused by the interlayer interfaces.
These results suggest that mix design for 3DP mortars must account for strength reduction associated with layer interfaces and anisotropic behavior in printed elements.
4. Conclusions
This study established a method for quantitatively evaluating the thixotropic properties of 3DP mortars under practical construction conditions. To verify the applicability of parameters obtained from laboratory tests, layer-by-layer printing experiments were conducted using an actual 3DP system. The main findings are summarized as follows:
- Vane shear test: The bridging effect of PVA fibers increased the viscosity under stirred conditions, resulting in higher shear stress compared to the static condition. In fiber-reinforced mortars, excessive stirring may reduce flowability.
- 15-stroke flow test: A pronounced decrease in flow was observed under stirred conditions, attributed to fiber re-agglomeration and a transition to a more adhesive flow behavior. Therefore, this test may be unsuitable for evaluating the flowability of fiber-reinforced mortars.
- Correlation analysis: The relationship between the maximum shear stress ratio and the 15-stroke flow ratio confirmed that internal structural changes induced by fiber addition affect flowability. The vane shear test can sensitively detect these changes, making it an effective method for evaluating the thixotropic properties of 3DP mortars.
- Compressive strength: The highest compressive strength was achieved at a fiber content of 0.3%, while excessive fiber addition led to strength reduction due to decreased density and fiber agglomeration. Additionally, an excessive dosage of the superplasticizer weakened interfacial bonding, hindering strength development.
- Flexural strength: Although fiber addition did not lead to a clear improvement in strength or toughness, the resulting load–displacement response showed less deflection at failure for a fiber content of 0.6% than for a content of 0.3%, as well as a lower early-age load reduction at a curing age of 1 day.
- Interlayer stability: During layering tests using an actual 3DP system, mortars with a maximum shear stress below 2 kN/m² were unable to self-support and difficult to layer. This demonstrates that the vane shear test is effective for predicting interlayer stability.
- Compressive strength of printed elements: The compressive strength of cores extracted from the laminated structure decreased both vertically and horizontally due to the influence of layer interfaces, with a more pronounced reduction in the horizontal direction.
- Flexural strength of printed elements: The flexural strength the laminated structure in the printing direction was comparable to that of molded specimens, and the contribution of fiber orientation was not evident at peak strength. In contrast, strength in the direction perpendicular to printing decreased markedly, demonstrating clear interlaminar anisotropy.
The findings of this study provide quantitative indicators for assessing the effects of fiber addition and superplasticizer dosage on mixture and construction management for 3DP mortars. In particular, the vane shear test offers a practical and effective approach for onsite quality control, as it sensitively detects changes in internal structure and thixotropic behavior induced by fibers. Because fiber content and admixture dosage substantially affect both printability and mechanical performance, these parameters should be treated as key factors in mixture proportioning and field operations.
However, this study presents several limitations. Only a single fiber type was examined, and the effects of fiber length, geometry, and dispersibility on thixotropic behavior and mechanical performance were not fully investigated. Moreover, the discussion on fiber orientation effects was limited to inferences based on mechanical behavior, as the internal orientation state was not directly evaluated. In addition, interlayer adhesion during printing and the long-term durability of printed materials require further investigation.
Future research should quantitatively examine optimized fiber types, dimensions, and dispersion methods, as well as the relationship between fiber orientation and mechanical properties, to better understand their combined effects on thixotropy and structural performance. Such efforts will support the development of robust design methodologies for 3DP mortars and expand their applicability in construction practice.
Author Contributions
Conceptualization, S.U. and K.Y.; methodology, S.U., K.S. (Kanako Shima), K.S. (Kazuya Sakamoto), and K.Y.; validation, S.U. and K.Y.; investigation, S.U., Y.O., K.S. (Kanako Shima), K.S. (Kazuya Sakamoto), and K.Y.; resources, K.S. (Kanako Shima) and K.S. (Kazuya Sakamoto); data curation, S.U. and K.Y.; writing—original draft preparation, S.U. and K.Y.; writing—review and editing, Y.O., K.S. (Kanako Shima), and K.S. (Kazuya Sakamoto); visualization, S.U. and K.Y.; supervision, K.S. (Kazuya Sakamoto) and K.Y.; project administration, K.Y.; funding acquisition, K.S. (Kazuya Sakamoto) and K.Y. All authors have read and agreed to the published version of the manuscript.
Funding
This research received no external funding.
Data Availability Statement
The datasets generated and/or analyzed during the current study are available upon reasonable request from the corresponding author.
Acknowledgments
We would like to express our gratitude to Mr. Mikio Nakasu, Dr. Katpady Dhruva Narayana, Mr. Noriaki Moriyama, Mr. Keisuke Nakashima, and Mr. Hiromichi Kameoka, from Infratec Co., Ltd., for their valuable assistance with the 3DP layering experiments.
Conflicts of Interest
Kanako Shima and Kazuya Sakamoto are employed by Infratec Co., Ltd. The remaining authors declare no commercial or financial relationships that could be construed as a potential conflict of interest.
Abbreviations
The following abbreviations are used in this manuscript:
| 3DP | Three-dimensional printing |
| PVA | Polyvinyl alcohol |
| W | Water |
| BB | Blast furnace slag cement type B |
| SF | Silica fume |
| B | Binder |
| Ca | Calcium carbonate |
| S | Sand |
| SP | Superplasticizer |
| F | Fiber |
| W/B | Water-to-binder ratio (Binder=BB+SF) |
| S/P | Sand-to-powder ratio (Powder=BB+SF+Ca) |
References
- Ishida, T.; Kinomura, K.; Ishizaka, Y.; Ogawa, Y.; Saito, K.; Kunieda, M. Study on the construction of concrete structures by 3DP. Concr. Ann. J. 2021, 43, 17–26. (in Japanese). [Google Scholar]
- Nagamine, Y.; Takahashi, T.; Nishimura, T.; Yoshimura, M.; Ishizaka, Y.; Kitamura, Y. Fundamental study on adhesion performance between 3D printed embedded formwork and internal concrete (Part 1). 2025, Proceedings of the 80th Annual Meeting of the JSCE V-300, 1–2. (in Japanese). [Google Scholar]
- Kanemono, N.; Takeichi, Y.; Higashi, D.; Abe, S. Material properties of 3DP concrete with rapid initial hardening. In Proceedings of the 80th Annual Meeting of the JSCE V-421, Kumamoto, Japan, 8-12 September 2025; pp. 1–2. (in Japanese). [Google Scholar]
- Japan Society of Civil Engineers. Recommendations for Concrete Structure with 3D Printed Permanent Cementitious Materials based Formwork. Concrete Library 2025, 168, 1–110. (in Japanese). [Google Scholar]
- Takagi, S.; Hisada, Y.; Ishimura, M.; Kunimasa, H.; Kamata, T.; Kitahashi, N.; Iwamoto, T. On-site construction and applicability evaluation of drainage structures using construction 3D printers. In Proceedings of the 80th Annual Meeting of the JSCE V-423, Kumamoto, Japan, 8-12 September 2025; pp. 1–2. (in Japanese). [Google Scholar]
- Gosselin, C.; Duballet, R.; Roux, P.; Gaudillière, N.; Dirrenberger, J.; Morel, Ph. Large-scale 3DP of ultra-high-performance concrete – a new processing route for architects and builders. Mater. Des. 2016, 100, 102–109. [Google Scholar] [CrossRef]
- Ahmed, G.H.; Askandar, N.H.; Jumaa, G.B. A review of large-scale 3DCP: Material characteristics, mixture, printing process, and reinforcement strategies. Structures 2022, 43, 508–532. [Google Scholar] [CrossRef]
- Lim, S.; Buswell, R.A.; Le, T.T.; Austin, S.A.; Gibb, A.G.F.; Thorpe, T. Developments in construction-scale additive manufacturing processes. Autom. Constr. 2012, 21, 262–268. [Google Scholar] [CrossRef]
- Takva, Ç.; Top, S.M.; Gökgöz, B.I.; Gebel, Ş.; İlerisoy, Z.Y.; İlcan, H.; Şahmaran, M. Applicability of 3D concrete printing technology in building construction with different architectural design decisions in housing. J. Build. Eng. 2024, 98, 111257. [Google Scholar] [CrossRef]
- de Souza, E.A.; Borges, P.H.R.; Stengel, T.; Nematollahi, B.; Bos, F.P. 3D printed sustainable low-cost materials for construction of affordable social housing in Brazil: Potential, challenges, and research needs. J. Build. Eng. 2024, 87, 108985. [Google Scholar] [CrossRef]
- Hamidreza, S.G.; Corker, J.; Fan, M. Additive manufacturing technology and its implementation in construction as an eco-innovative solution. Autom. Constr. 2018, 93, 1–11. [Google Scholar] [CrossRef]
- Ministry of Land, Infrastructure, Transport, and Tourism (MLIT) 3D Printer Study Committee: On the regulatory framework for buildings using construction 3D printers 2024, 1–34.
- Kitamura, Y.; Ishizaka, Y.; Fujimura, H.; Hamaji, K. Application of precast blocks produced by construction 3DP to large-scale civil engineering structures. Concr. Ann. J. 2024, 46, 2017–2022. (in Japanese). [Google Scholar]
- Kinomura, K.; Zhang, W.; Kawabata, K.; Kawamura, K. Performance evaluation of demo bridge piers with 3D printed shells under cyclic loading tests. Concr. Ann. J. 2022, 44, 1528–1533. (in Japanese). [Google Scholar]
- Kobayashi, N.; Asakawa, T.; Saijo, K.; Nishiwaki, T. Fundamental study on interlayer reinforcement methods suitable for concrete 3D printers with automatic reinforcement systems. Concr. Ann. J. 2023, 45, 1606–1611. (in Japanese). [Google Scholar]
- Hara, K.; Ogura, D.; Yamamoto, S.; Abe, H. Flexural performance evaluation of beam members with longitudinal reinforcement fabricated by material extrusion 3DP technology. Concr. Ann. J. 2023, 45, 1618–1623. (in Japanese). [Google Scholar]
- Abe, H.; Ogura, D.; Yamamoto, S.; Kikuchi, R. Effect of 3DP layer stacking and joint conditions on the adhesion properties of layered structures. Concr. Ann. J. 2023, 45, 1624–1629. (in Japanese). [Google Scholar]
- Maeda, S.; Teranishi, K.; Hasegawa, S.; Kimuta, C. Imparting and evaluating thixotropy in mortar for construction 3DP. Concr. Ann. J. 2023, 45, 1630–1635. (in Japanese). [Google Scholar]
- Buswell, R.A.; Leal de Silva, W.R.; Jones, S.Z.; Dirrenberger, J. 3D printing using concrete extrusion: A roadmap for research. Cem. Concr. Res. 2018, 112, 37–49. [Google Scholar] [CrossRef]
- Maeda, S.; Teranishi, K. Fundamental study on mixture of mortar for construction 3DP. Concr. Ann. J. 2024, 46, 2059–2064. (in Japanese). [Google Scholar]
- Ahmad Fuad, M.A.; Ghazali, A.; Mohd Isa, M.H.; Awang, H. Utilising waste material in a 3DCP mixture: A review on rheological and compressive strength. Eng. Sci. Technol. 2024, 59, 101846. [Google Scholar] [CrossRef]
- Omran, A.F.; Khayat, K.H. Choice of thixotropic to evaluate formwork pressure characteristics of self-consolidating concrete. Cem. Concr. Res. 2014, 63, 89–97. [Google Scholar] [CrossRef]
- Roussel, N. A thixotropy model for fresh fluid concretes: Theory, validation and applications. Cem. Concr. Res. 2006, 36, 1797–1806. [Google Scholar] [CrossRef]
- Roussel, N. Rheological requirements for printable concretes. Cem. Concr. Res. 2018, 112, 76–85. [Google Scholar] [CrossRef]
- Barbosa, M.S.; dos Anjos, M.A.S.; Cabral, K.C.; Dias, L.S. Development of composites for 3DP with reduced cement consumption. Constr. Build. Mater. 2022, 341, 127775. [Google Scholar] [CrossRef]
- Jiao, D.; Shi, C.; Yuan, Q.; An, X.; Liu, Y.; Li, H. Effect of constituents on rheological properties of fresh concrete: A review. Cem. Concr. Comp. 2017, 83, 146–159. [Google Scholar] [CrossRef]
- Salman, N.M.; Ma, G.; Ijaz, N.; Wang, L. Importance and potential of cellulosic materials and derivatives in extrusion-based 3D concrete printing (3DCP): Prospects and challenges. Constr. Build. Mater. 2021, 291, 123281. [Google Scholar] [CrossRef]
- Uehara, S.; Yasui, K.; Shima, K.; Sakamoto, K. Study on simple evaluation of thixotropy for mortar for construction 3DP. Proceedings of JSCE Western Branch Research Presentation V-009(2025), 759–760. (in Japanese).
- Hirano, S.; Nishi, H. Experimental study on handling evaluation of fresh concrete using vane shear test. Concr. Ann. J. 2018, 40, 1107–1112. (in Japanese). [Google Scholar]
- Matsui, K.; Miyazato, S. Study on evaluation methods of fresh properties for 3DP mortar. Concr. Eng. Ann. J. 2022, 44, 1570–1575. (in Japanese). [Google Scholar]
- Murata, T.; Kinomura, K.; Maehori, S.; Miyamoto, M. Experimental study on simple quality verification method of cement-based materials suitable for 3DP. Concr. Ann. J. 2019, 41, 2027–2032. (in Japanese). [Google Scholar]
- JIS R 5201; Physical testing methods for cement. Japanese Standards Association: Tokyo, Japan, 2015. (in Japanese)
- Zhang, Y.; Aslani, F. Mechanical and ultrasonic pulse velocity performance of 3D printed rubberised cementitious composites reinforced with PVA fibres. J. Build. Eng. 2021, 303, 124453. [Google Scholar] [CrossRef]
- Bakhshi, A.; Zafar, M.S.; Hojati, M. A study on achieving high tensile ductility in 3D-printable engineered cementitious composites reinforced with 8 mm fibers. J. Build. Engin. 2025, 103, 112196. [Google Scholar] [CrossRef]
- Liu, X.; Li, Q.; Li, J. Shrinkage and mechanical properties optimization of spray-based 3D printed concrete by PVA fiber. Mater. Lett. 2022, 319, 132253. [Google Scholar] [CrossRef]
- Kikuta, T.; Mitsuhashi, H. Constituents and basic properties of fiber-reinforced concrete. J. Jpn. Concr. Inst. 2012, 50, 414–417. (in Japanese). [Google Scholar]
- Okanai, N.; Sagawa, K; Kawakami, H. Study on bleeding suppression and early compressive strength improvement by modified naphthalene sulfonate formaldehyde condensate high-performance water-reducing agent. Concr. Ann. J. 2016, 38, 225–230. (in Japanese). [Google Scholar]
- Iwane, T.; Ueno, H.; Beppu, M.; Ogawa, A. Experimental study on dynamic uniaxial compression properties of PP and PVA fiber reinforced cementitious composites. J. Struct. Eng. 2018, 64A, 833–846. (in Japanese). [Google Scholar]
- Suemori, T. PVA short fibers and concrete. J. Jpn. Concr. Inst. 2016, 54, 926–929. (in Japanese). [Google Scholar]
- Sakuragi, I. Development trends of PVA fibers “Vinylon and Claron K-II”. Special Issue: Development Trends of Synthetic Fibers 2000, 56, 232–237. (in Japanese). [Google Scholar]
- Xie, F.; Cao, W.; Jin, Z. Study on uniaxial tensile mechanical properties and damage constitutive model of SAP-PVA fiber-reinforced concrete after high-temperature exposure. Constr. Build. Mater. 2025, 489, 142189. [Google Scholar] [CrossRef]
- Niu, M.; Wang, Y.; He, X.; Miao, D.; Li, G. Enhancing the self-healing capability of ternary repair mortar in marine environment based on the synergistic use of PVA fibers and CA. Constr. Build. Mater. 2025, 483, 141744. [Google Scholar] [CrossRef]
- Shibata, T. Study on vane shear strength of viscosity. J. Jpn. Soc. Civ. Eng. 1967, 138, 39–48. (in Japanese). [Google Scholar]
- JIS R 1108; Method of test for compressive strength of concrete. Japanese Standards Association: Tokyo, Japan, 2018. (in Japanese)
- Tanaka, T; Yoshida, K; Yamamoto, Y; Kinomura, K. Fundamental study on the evaluation of layering stability of 3d-printed mortar using the finite element method. 2024. (in Japanese). [Google Scholar]
- Kırca, Ö.; Turanlı, L.; Erdoğan, T.Y. Effects of retempering on consistency and compressive strength of concrete subjected to prolonged mixing. Cem. Concr. Res. 2002, 32, 441–445. [Google Scholar] [CrossRef]
- Pan, Z.; Wu, C.; Liu, J.; Wang, W.; Liu, J. Study on mechanical properties of cost-effective poly-vinyl alcohol engineered cementitious composites (PVA-ECC). Constr. Build. Mater. 2015, 78, 397–404. [Google Scholar] [CrossRef]
- Liu, B.; Cheng, X.-M.; Wang, L.-G.; Qian, K. Compressive performance of PVA fiber-reinforced 3D concrete printing permanent formwork composite columns reinforced with BFRP bar. J. Build. Eng. 2024, 98, 111174. [Google Scholar] [CrossRef]
- Sakurai, K.; Maruyama, H.; Chikamatsu, R. Predictive model of bleeding water considering dispersion effect and workability by high-performance AE water-reducing agent. J. Jpn. Soc. Civ. Eng., E2 (Mater. Concr. Struct.) 2014, 70, 169–179. (in Japanese). [Google Scholar]
- Le, T.T.; Austin, S.A.; Lim, S.; Buswell, R.A.; Law, R.; Gibb, A.G.F.; Thorpe, T. Hardened properties of high-performance printing concrete. Cem. Concr. Res. 2012, 42, 558–566. [Google Scholar] [CrossRef]
- Liu, J; Lv, C. Properties of 3D-printed polymer fiber-reinforced mortars: a review. Polymers 2022, 14, 1315. [Google Scholar] [CrossRef] [PubMed]
Figure 1.
Construction 3D printer.
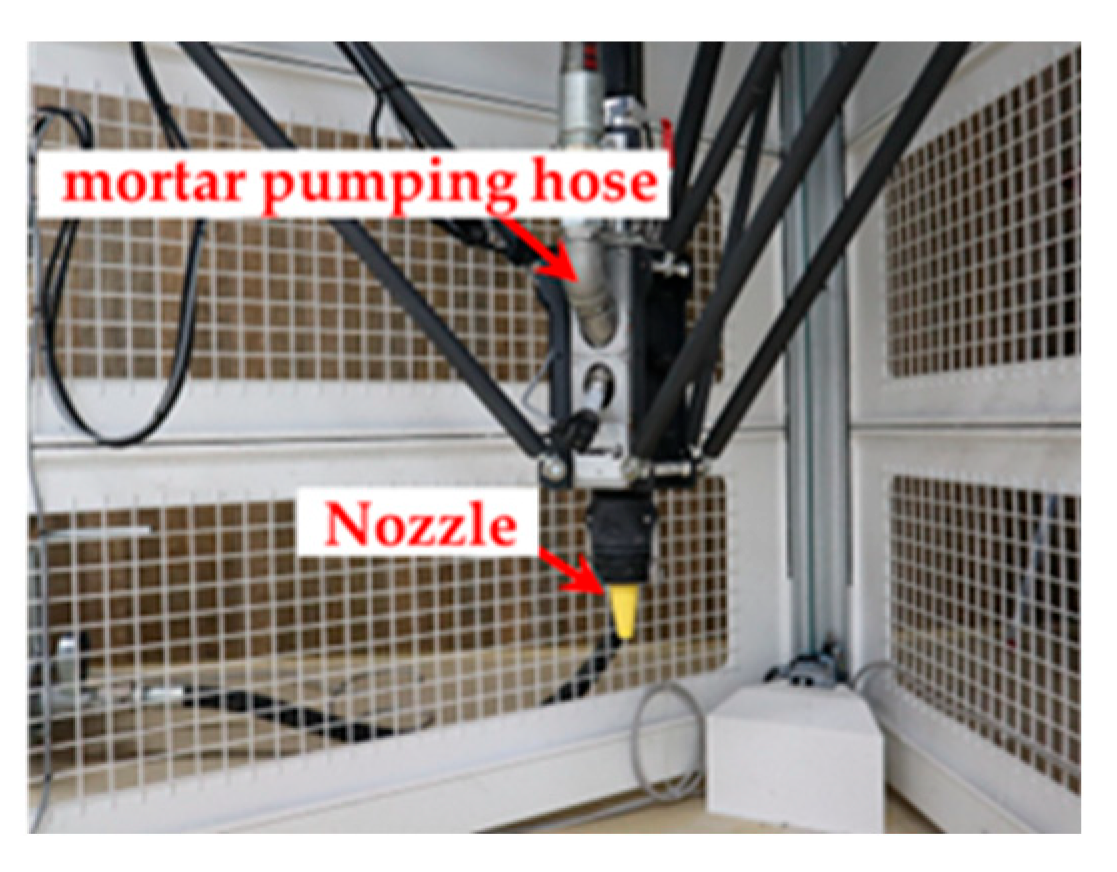
Figure 2.
PVA fibers.
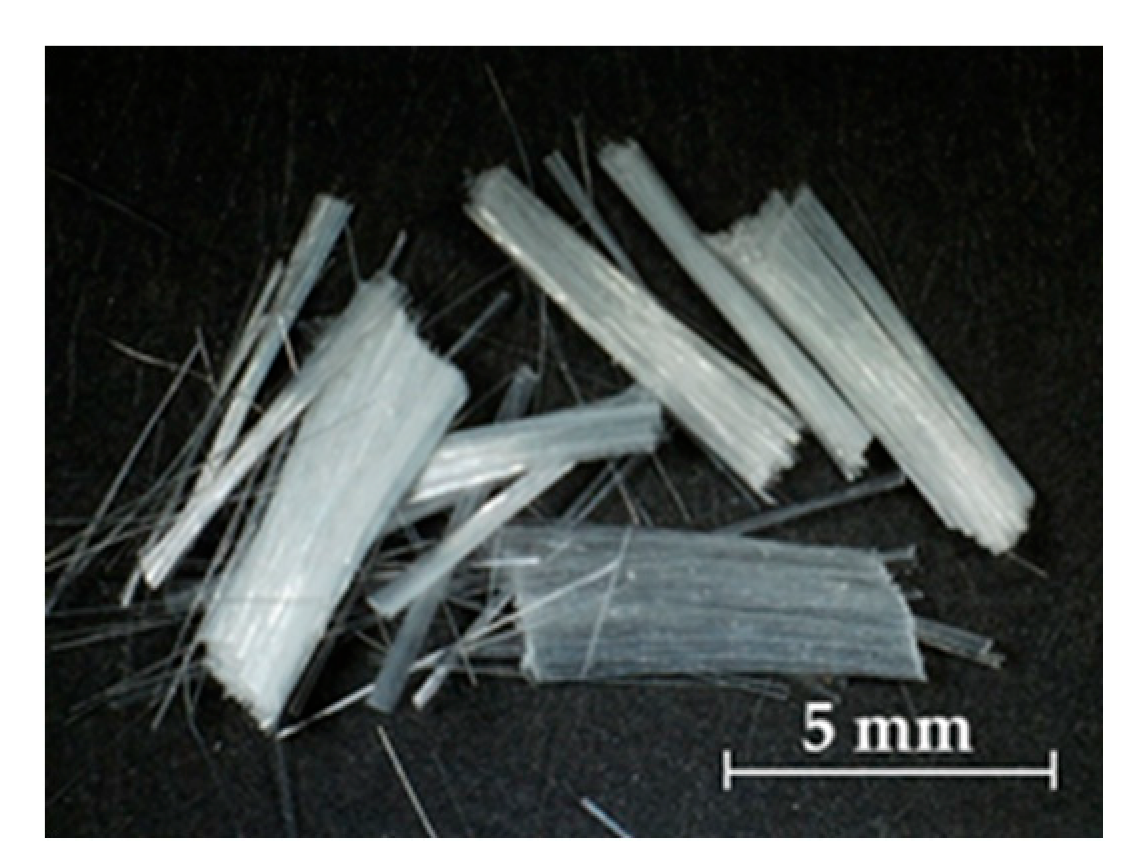
Figure 3.
Vane shear test in progress.
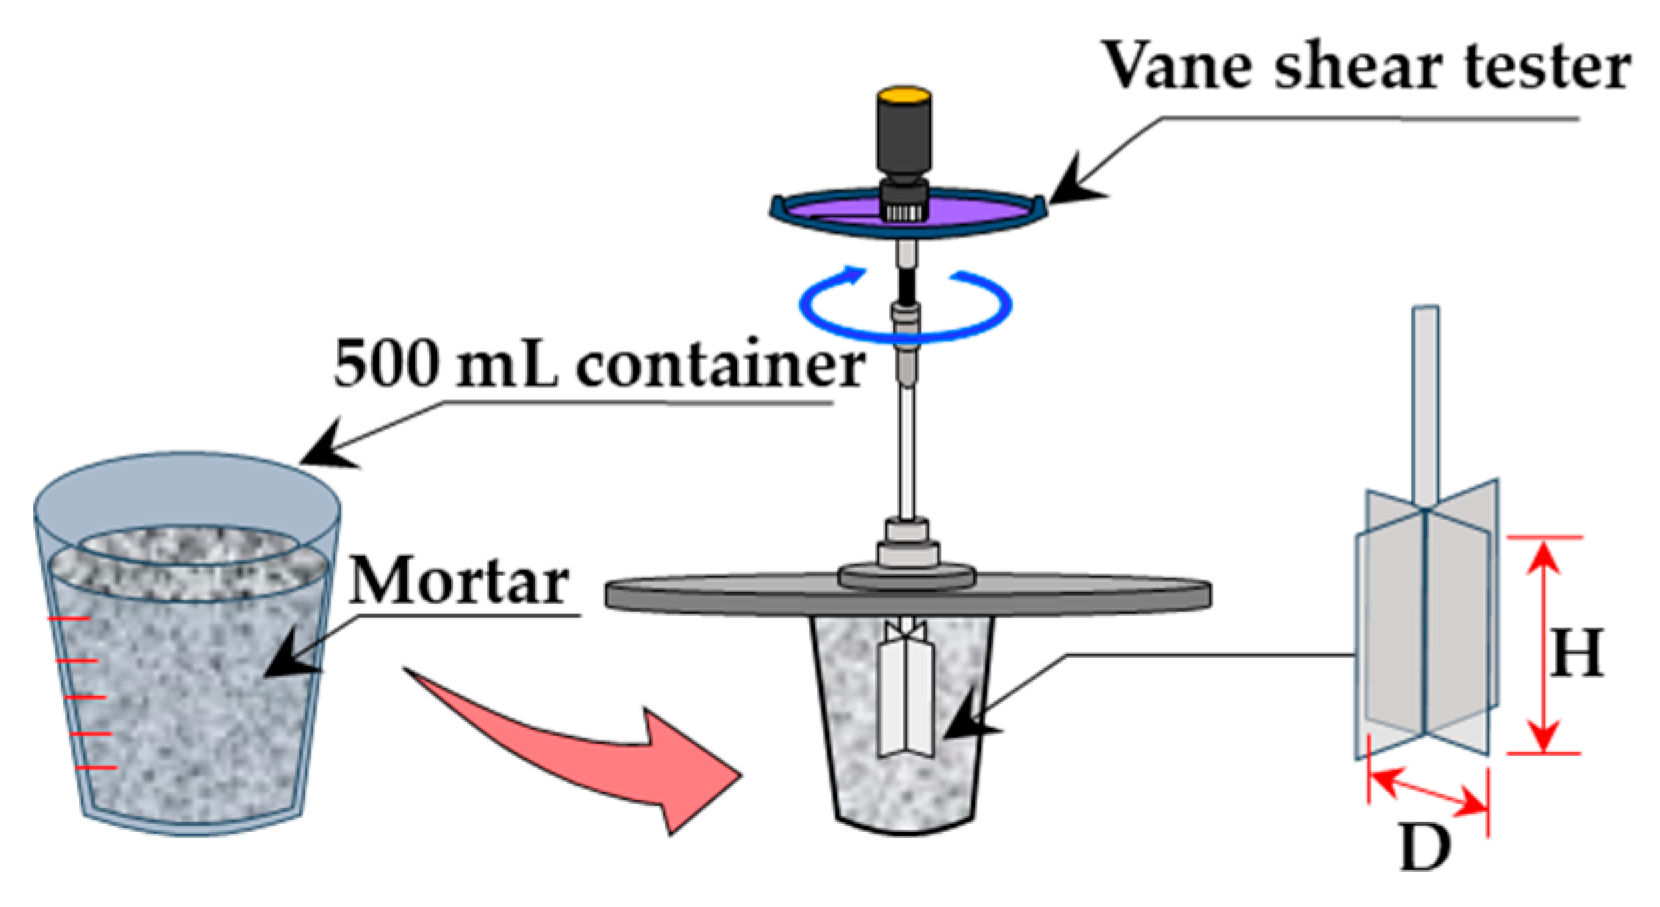
Figure 4.
15-stroke flow test in progress.
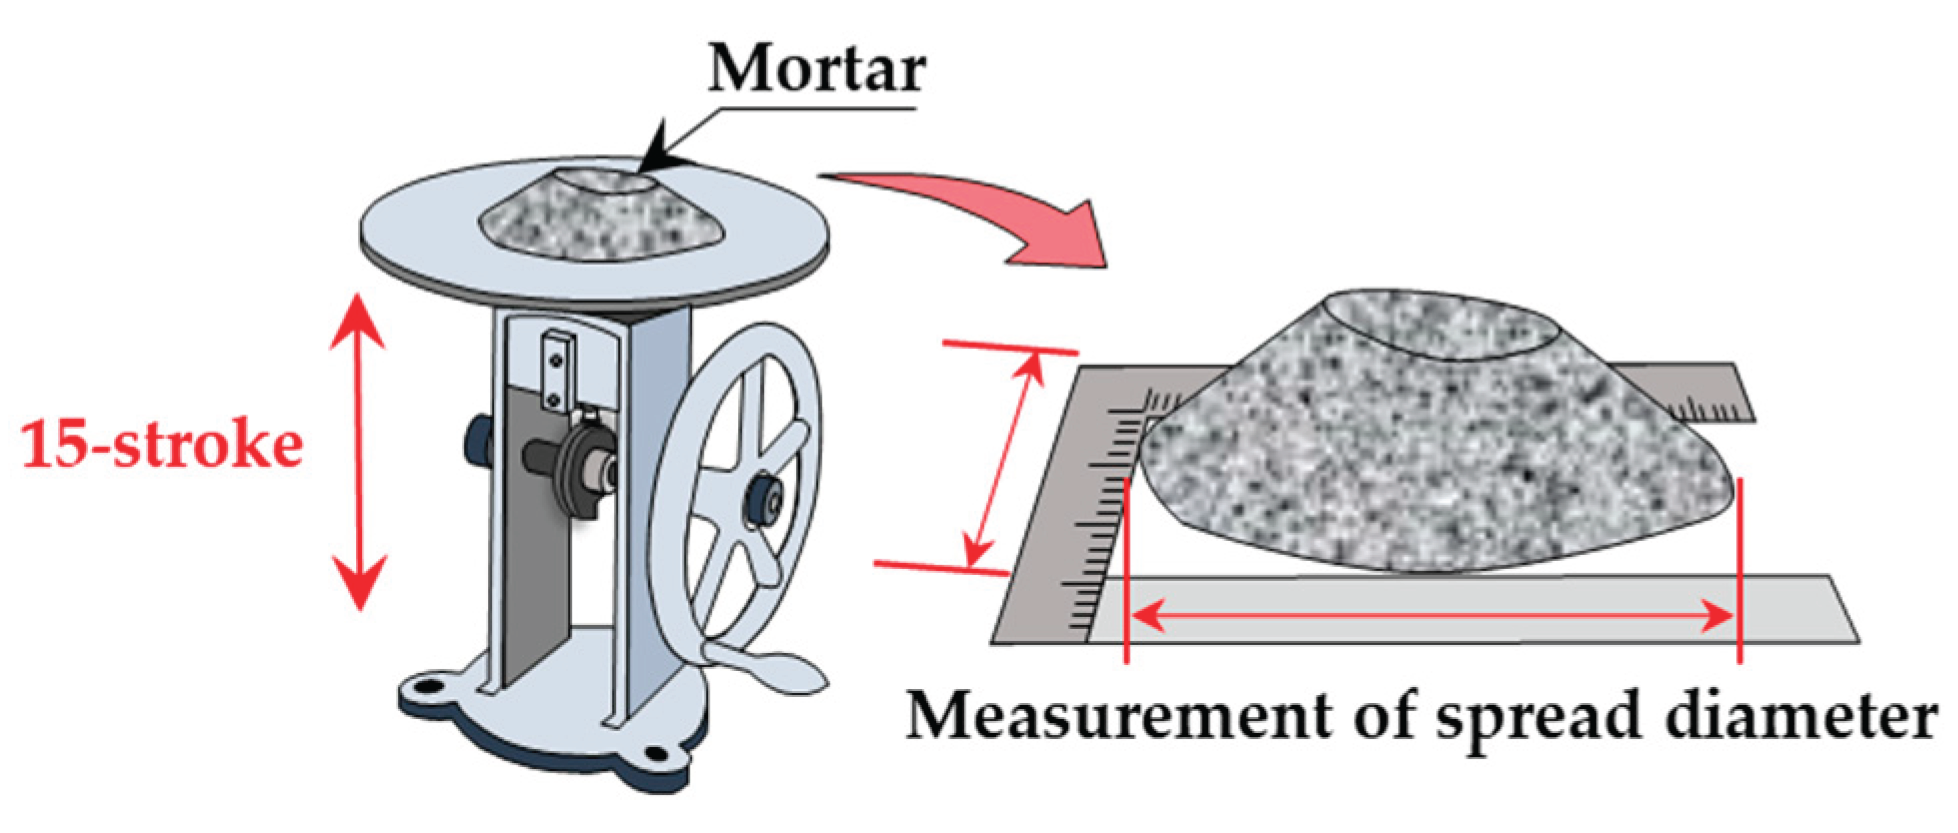
Figure 5.
Design overview for the lamination experiment.
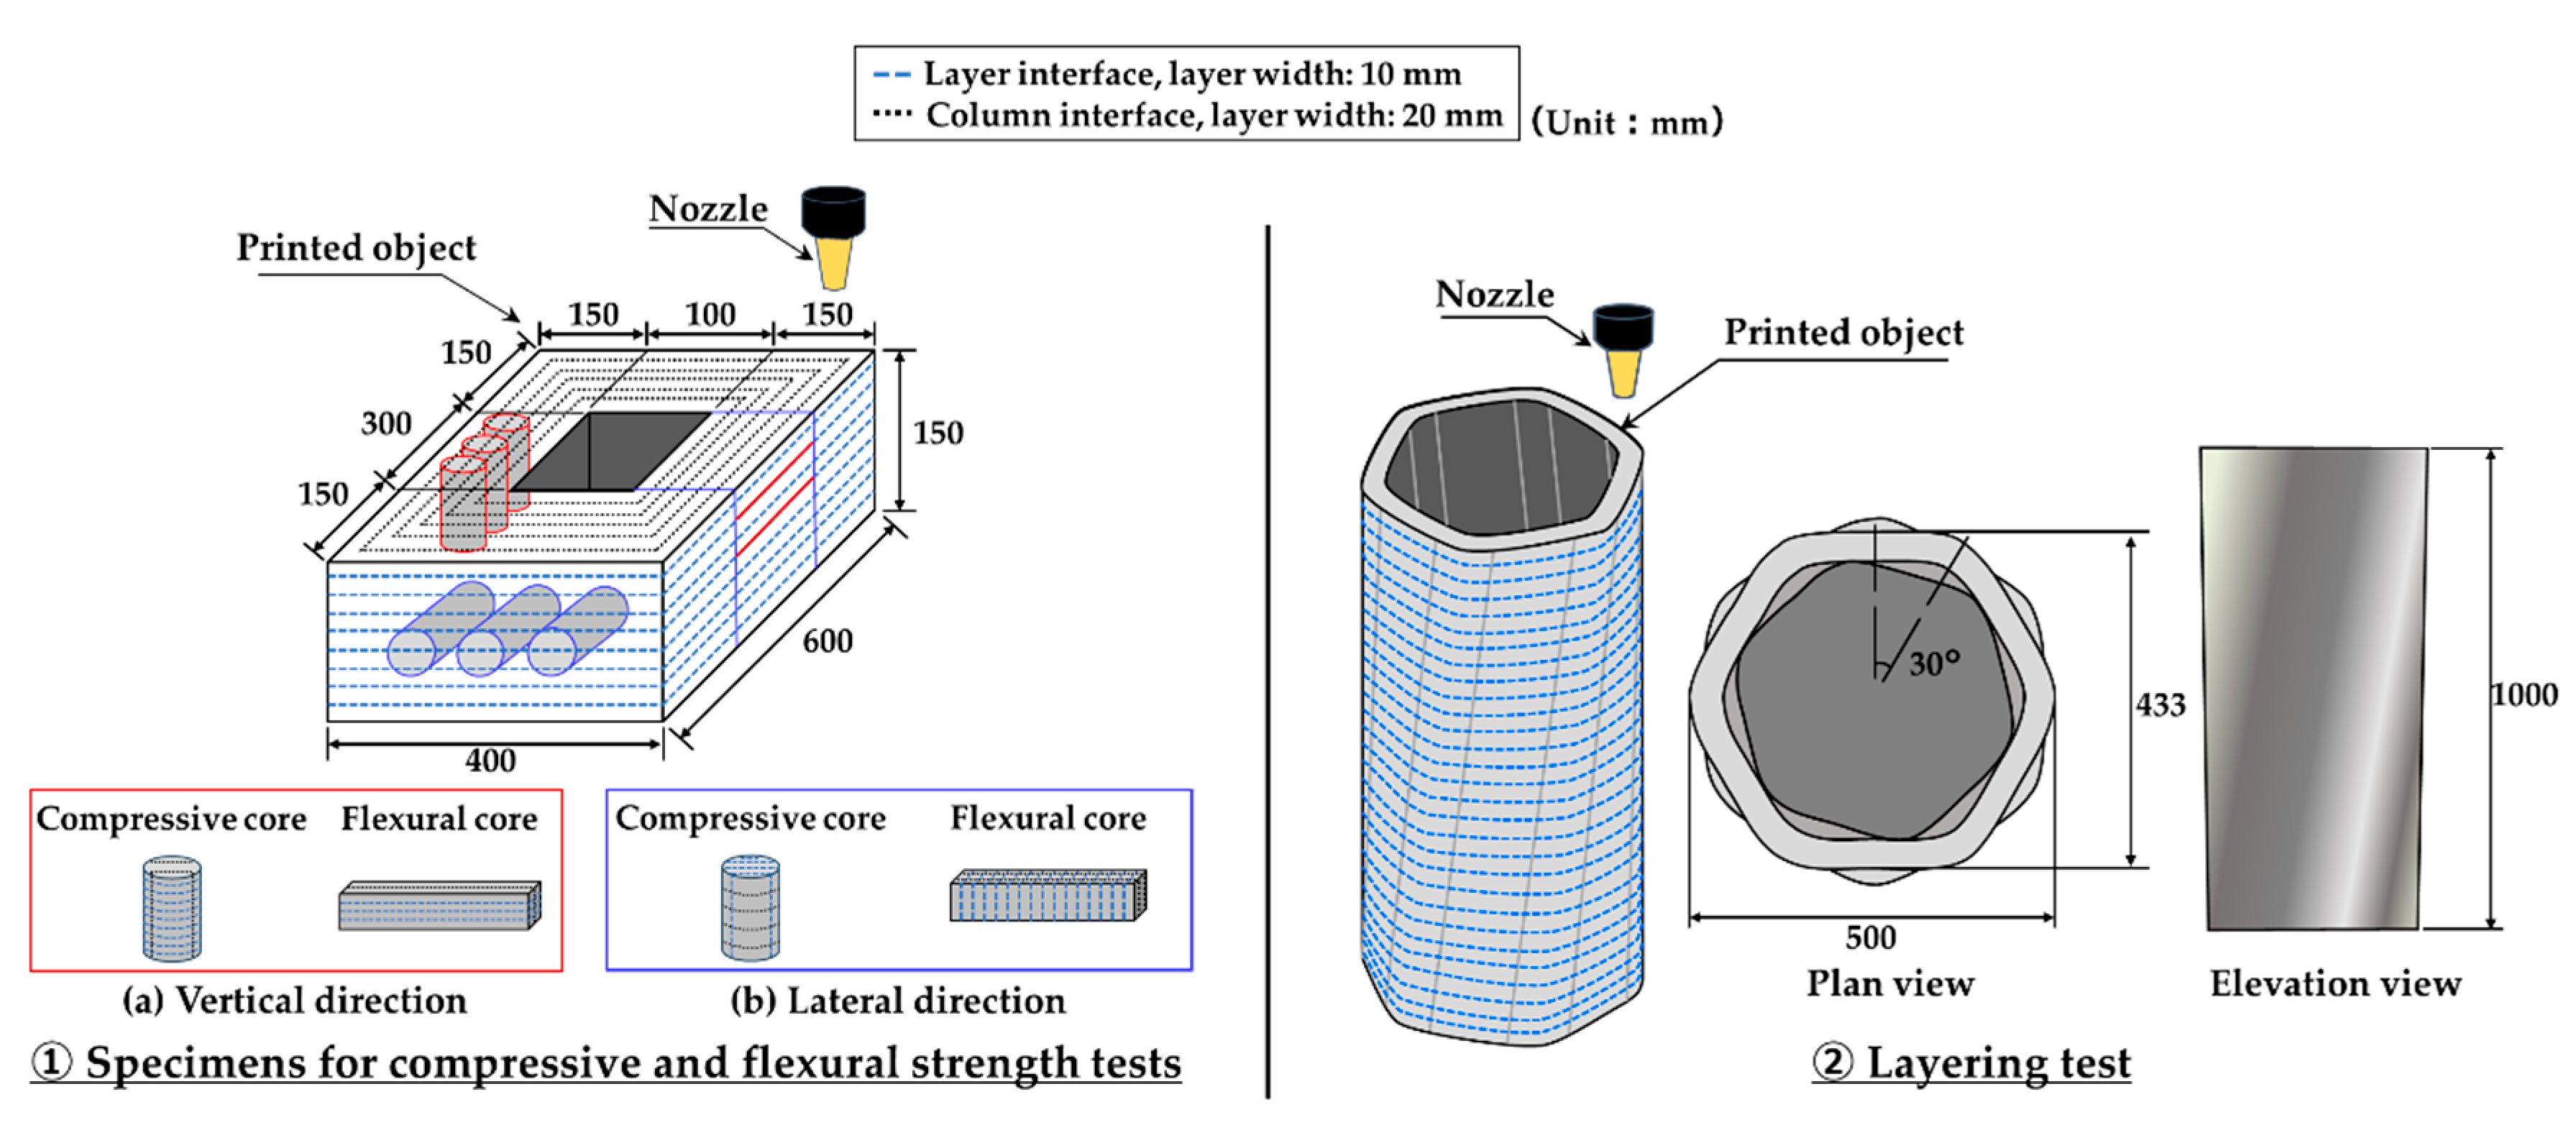
Figure 6.
Time-dependence of maximum shear stress. (a) Effect of fiber content, 0.9 % superplasticizer. (b) Effect of fiber content, 1.1 % superplasticizer.
Figure 6.
Time-dependence of maximum shear stress. (a) Effect of fiber content, 0.9 % superplasticizer. (b) Effect of fiber content, 1.1 % superplasticizer.
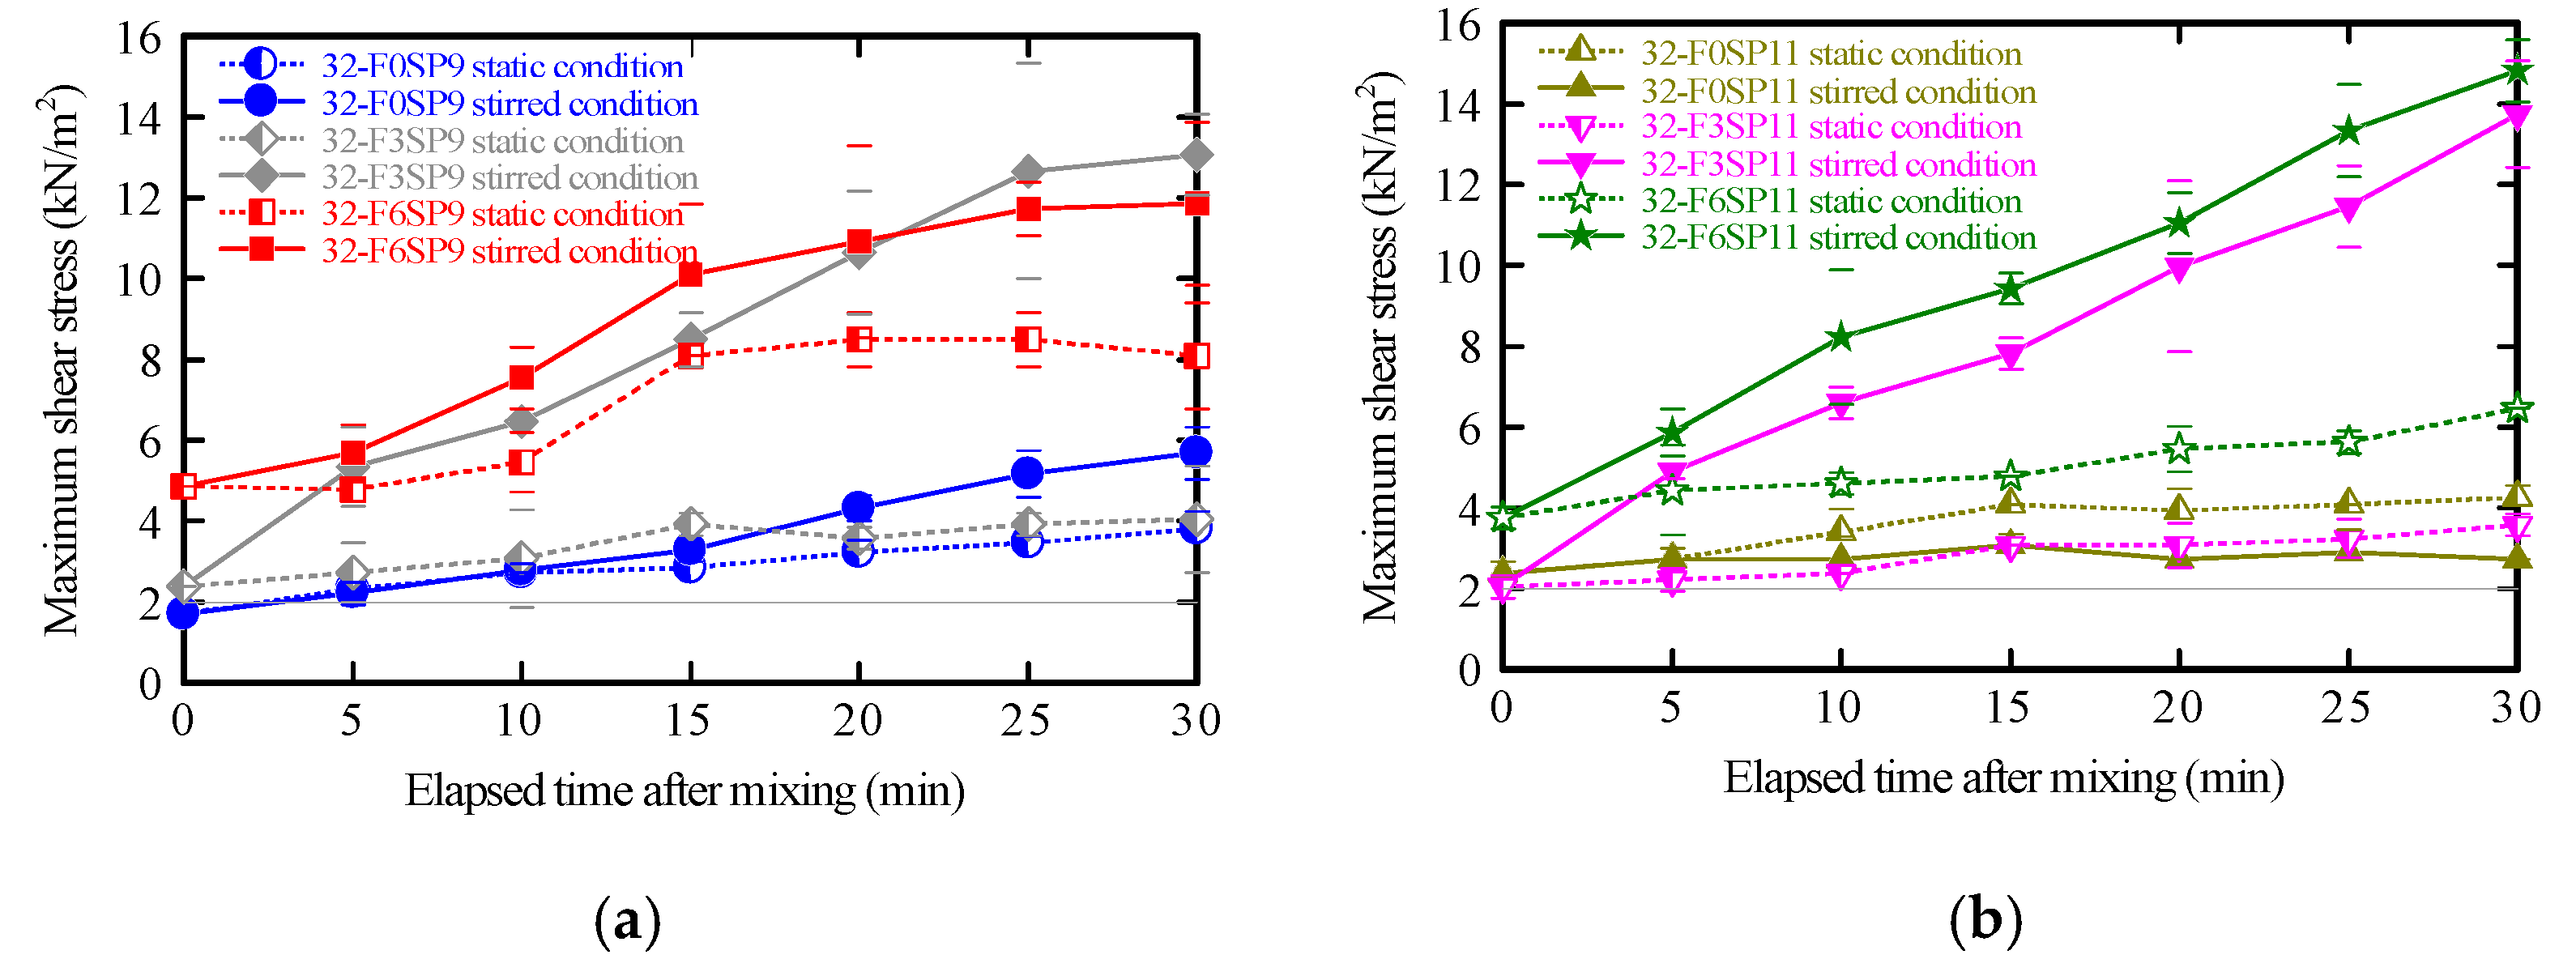
Figure 7.
Time-dependence of 15-stroke flow. (a) Effect of fiber content, 0.9 % superplasticizer. (b) Effect of fiber content, 1.1 % superplasticizer.
Figure 7.
Time-dependence of 15-stroke flow. (a) Effect of fiber content, 0.9 % superplasticizer. (b) Effect of fiber content, 1.1 % superplasticizer.
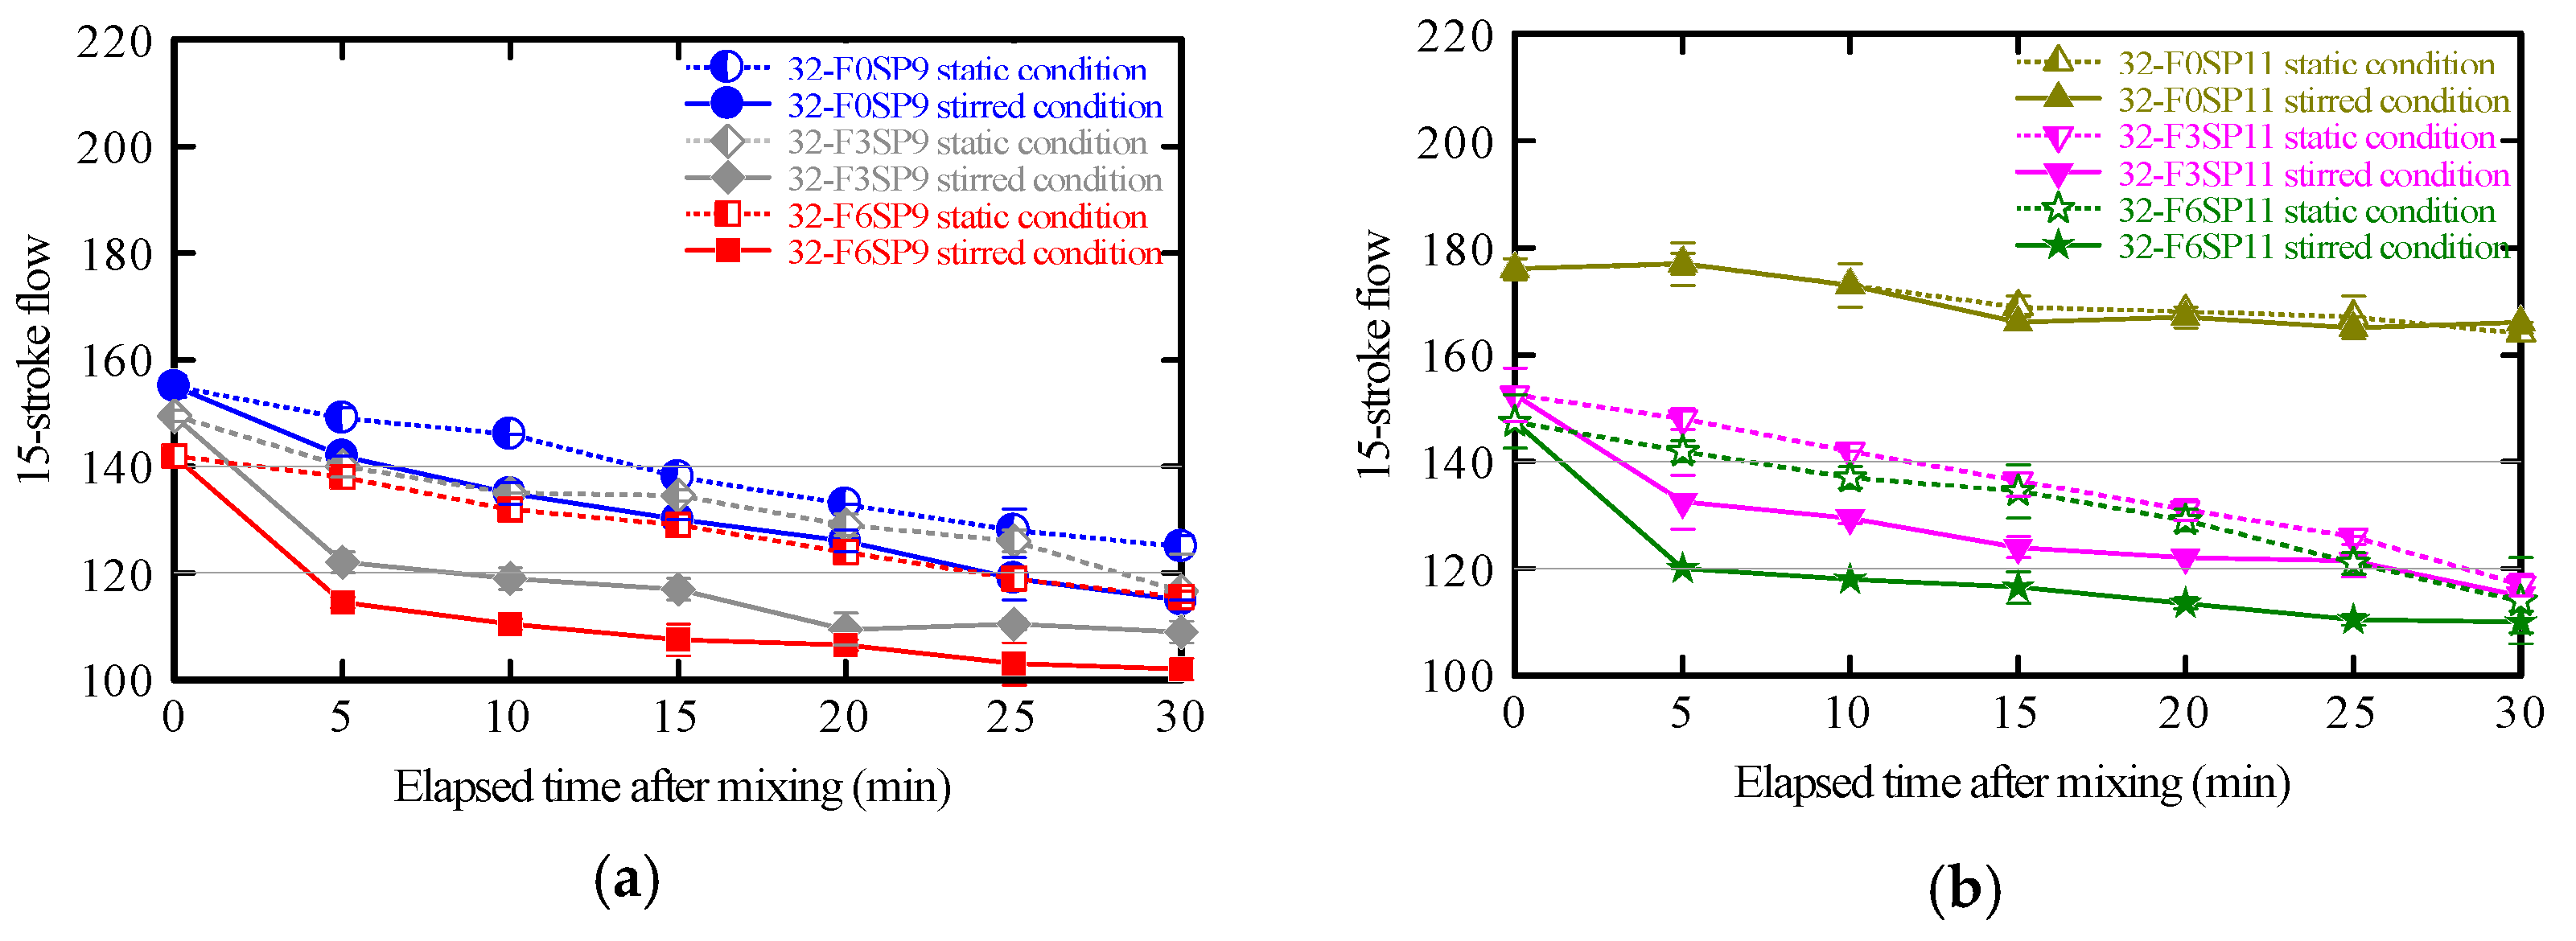
Figure 8.
Appearance of mortar during 15-stroke flow test. (a) immediately after mixing. (b) after 30 min of mixing.
Figure 8.
Appearance of mortar during 15-stroke flow test. (a) immediately after mixing. (b) after 30 min of mixing.
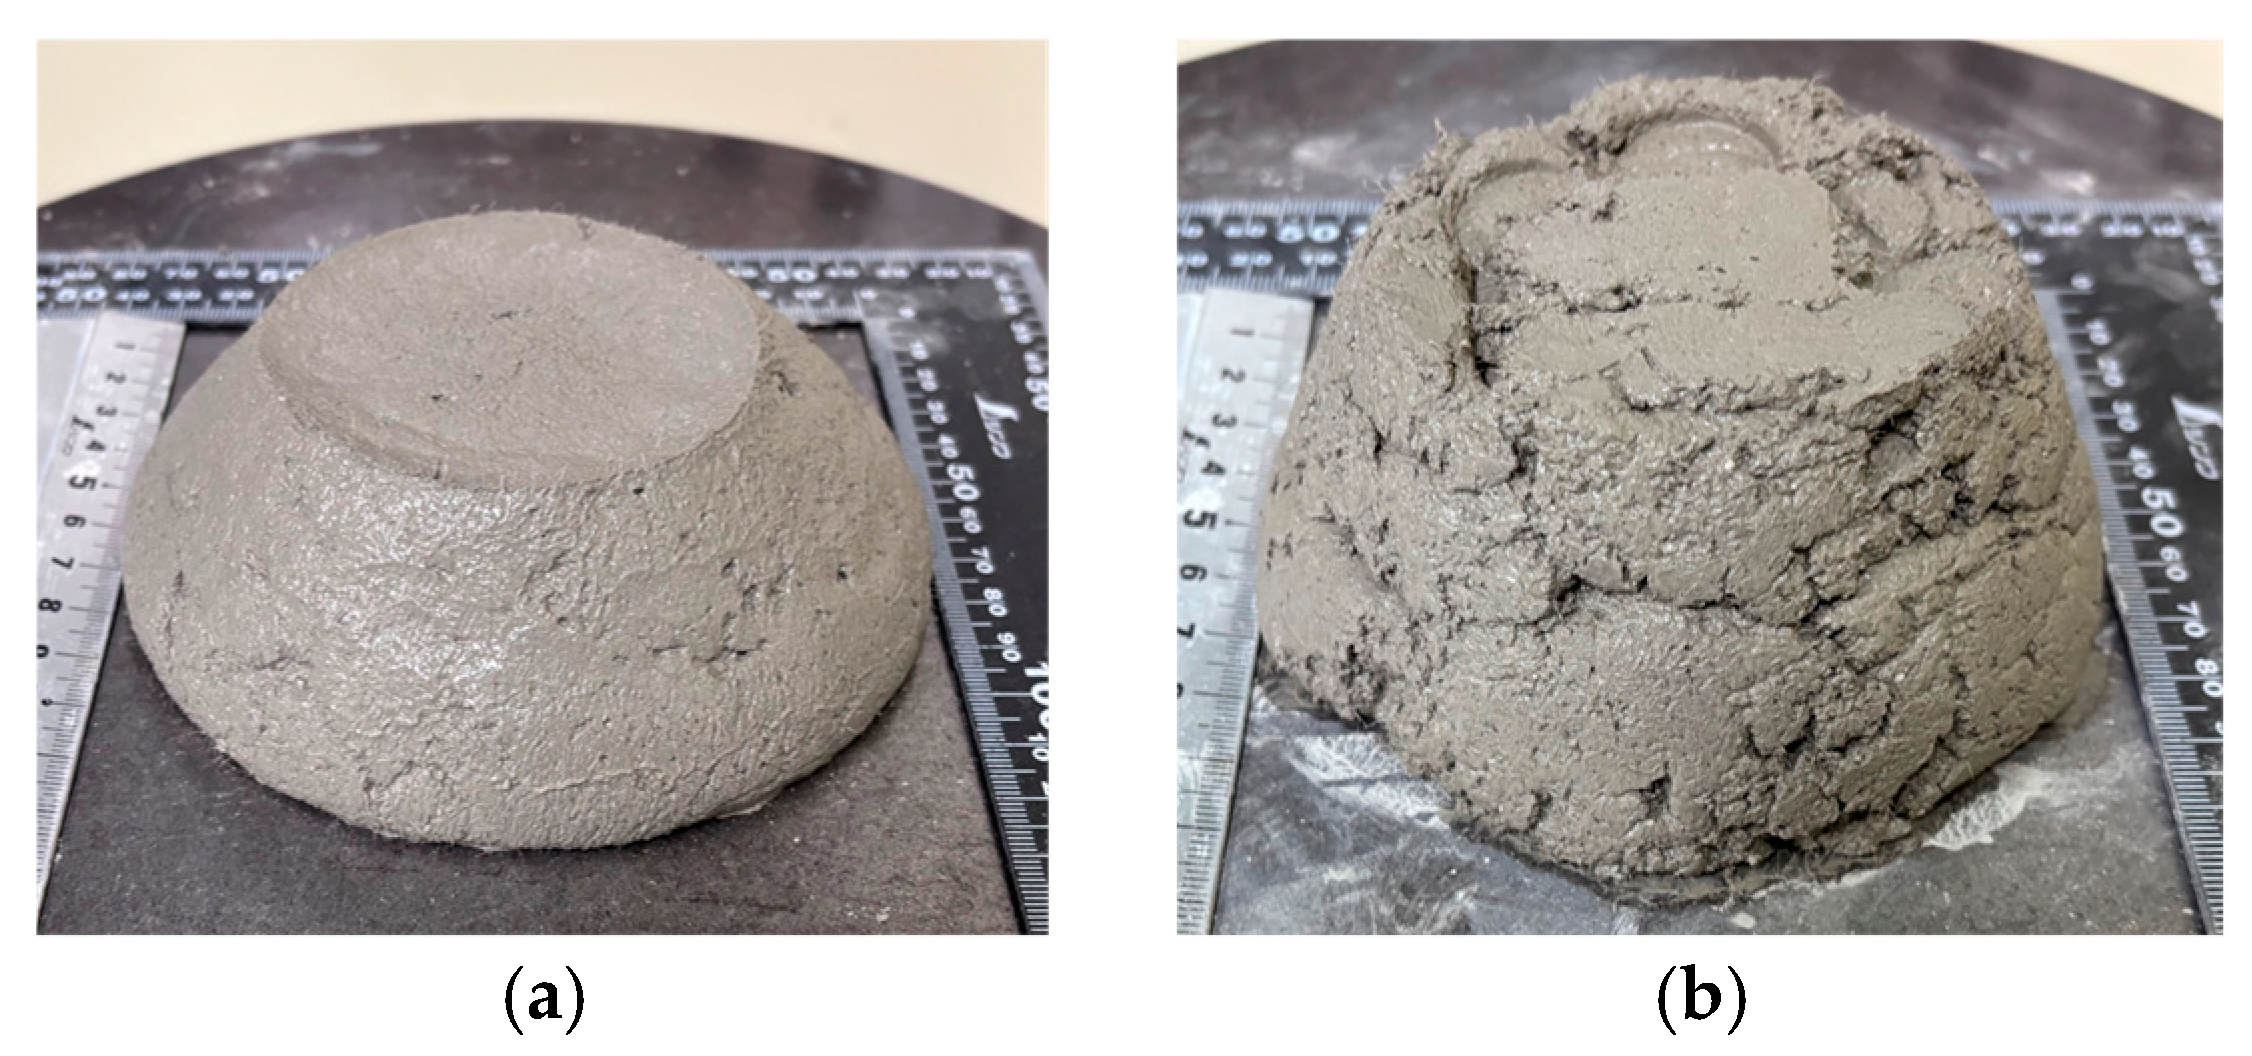
Figure 9.
Relationship between maximum shear stress ratio and 15-stroke flow ratio. (a) Effect of fiber content, 0.9 % superplasticizer. (b) Effect of fiber content, 1.1 % superplasticizer.
Figure 9.
Relationship between maximum shear stress ratio and 15-stroke flow ratio. (a) Effect of fiber content, 0.9 % superplasticizer. (b) Effect of fiber content, 1.1 % superplasticizer.
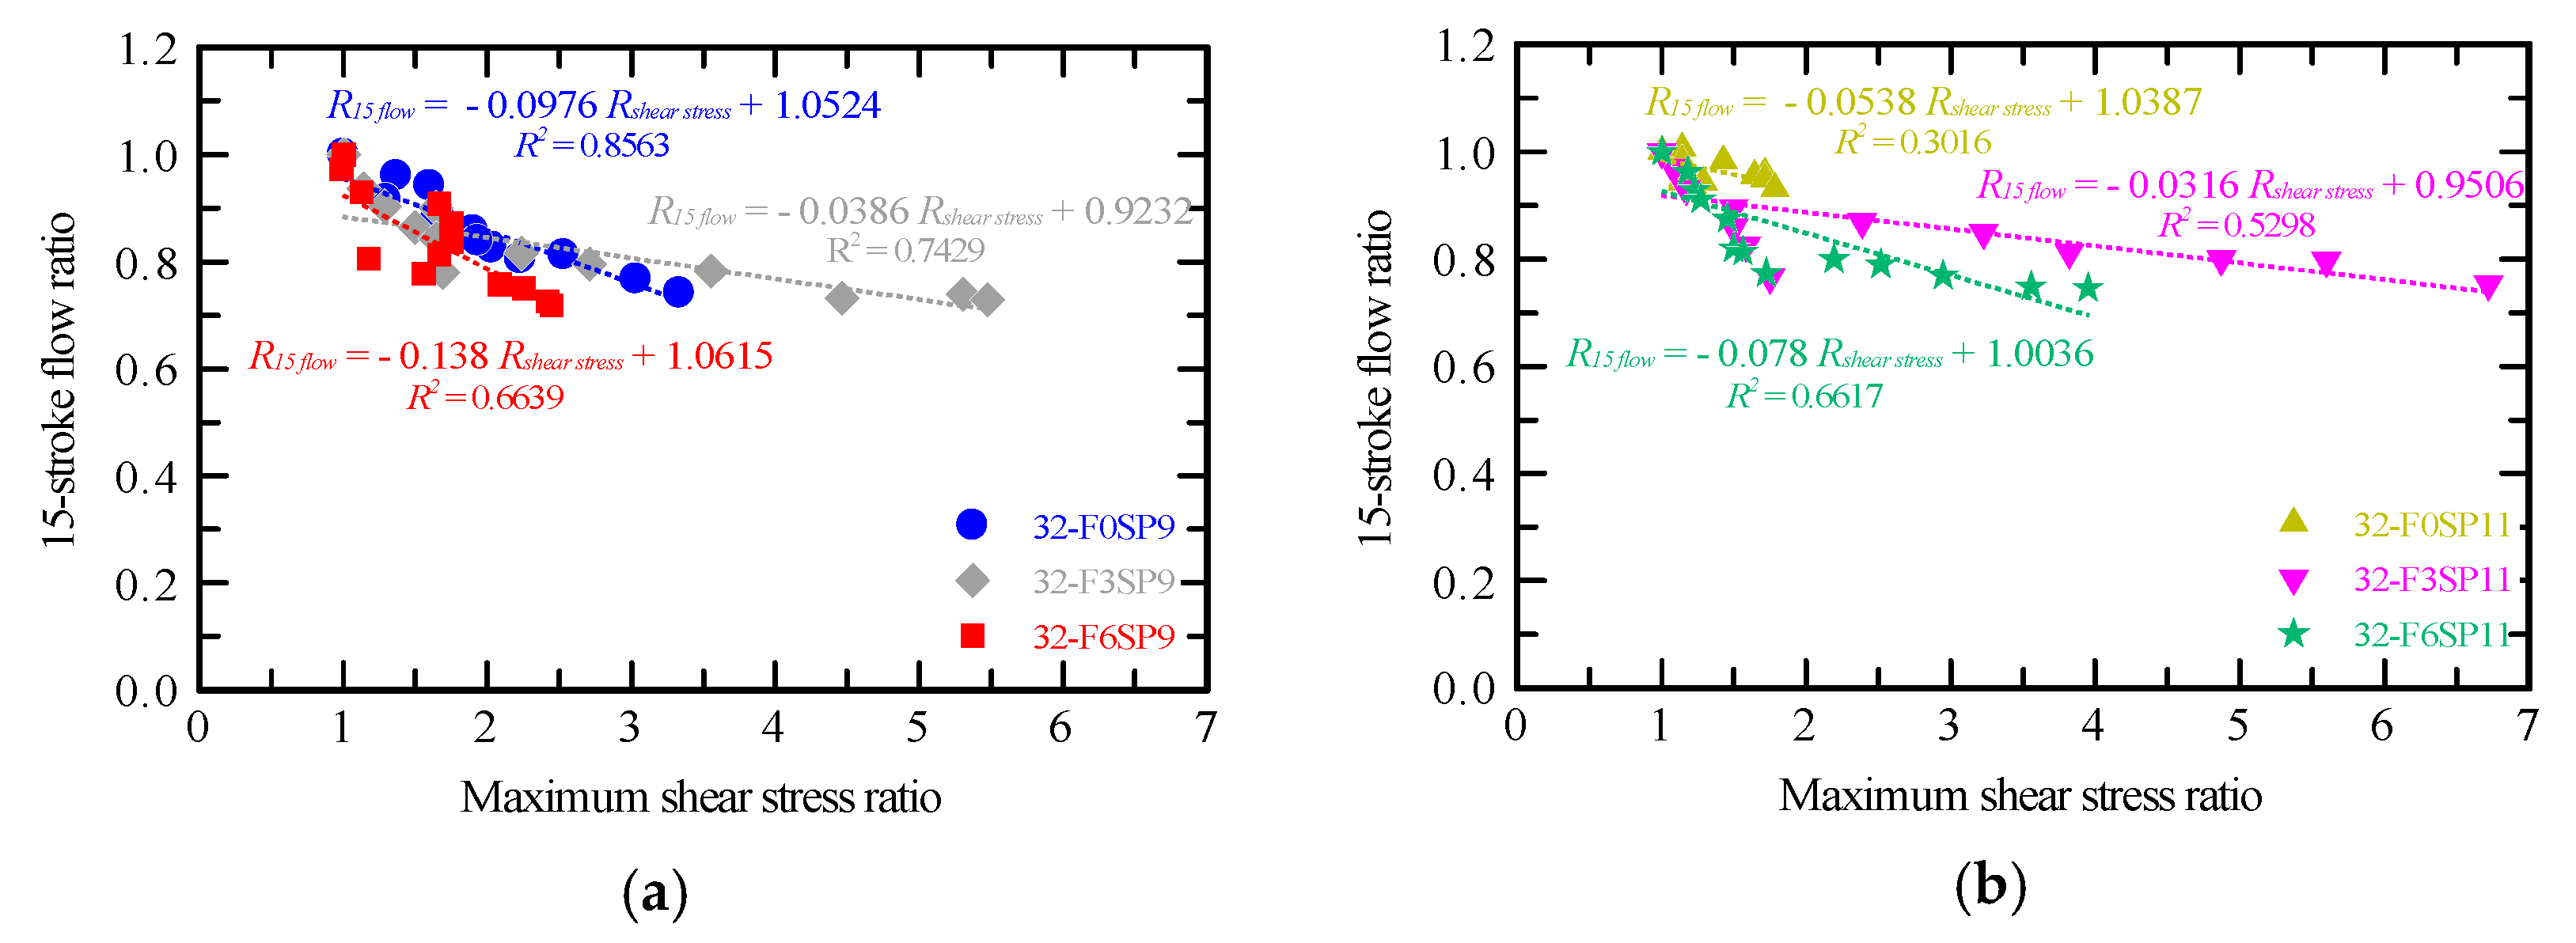
Figure 10.
Compressive strength.
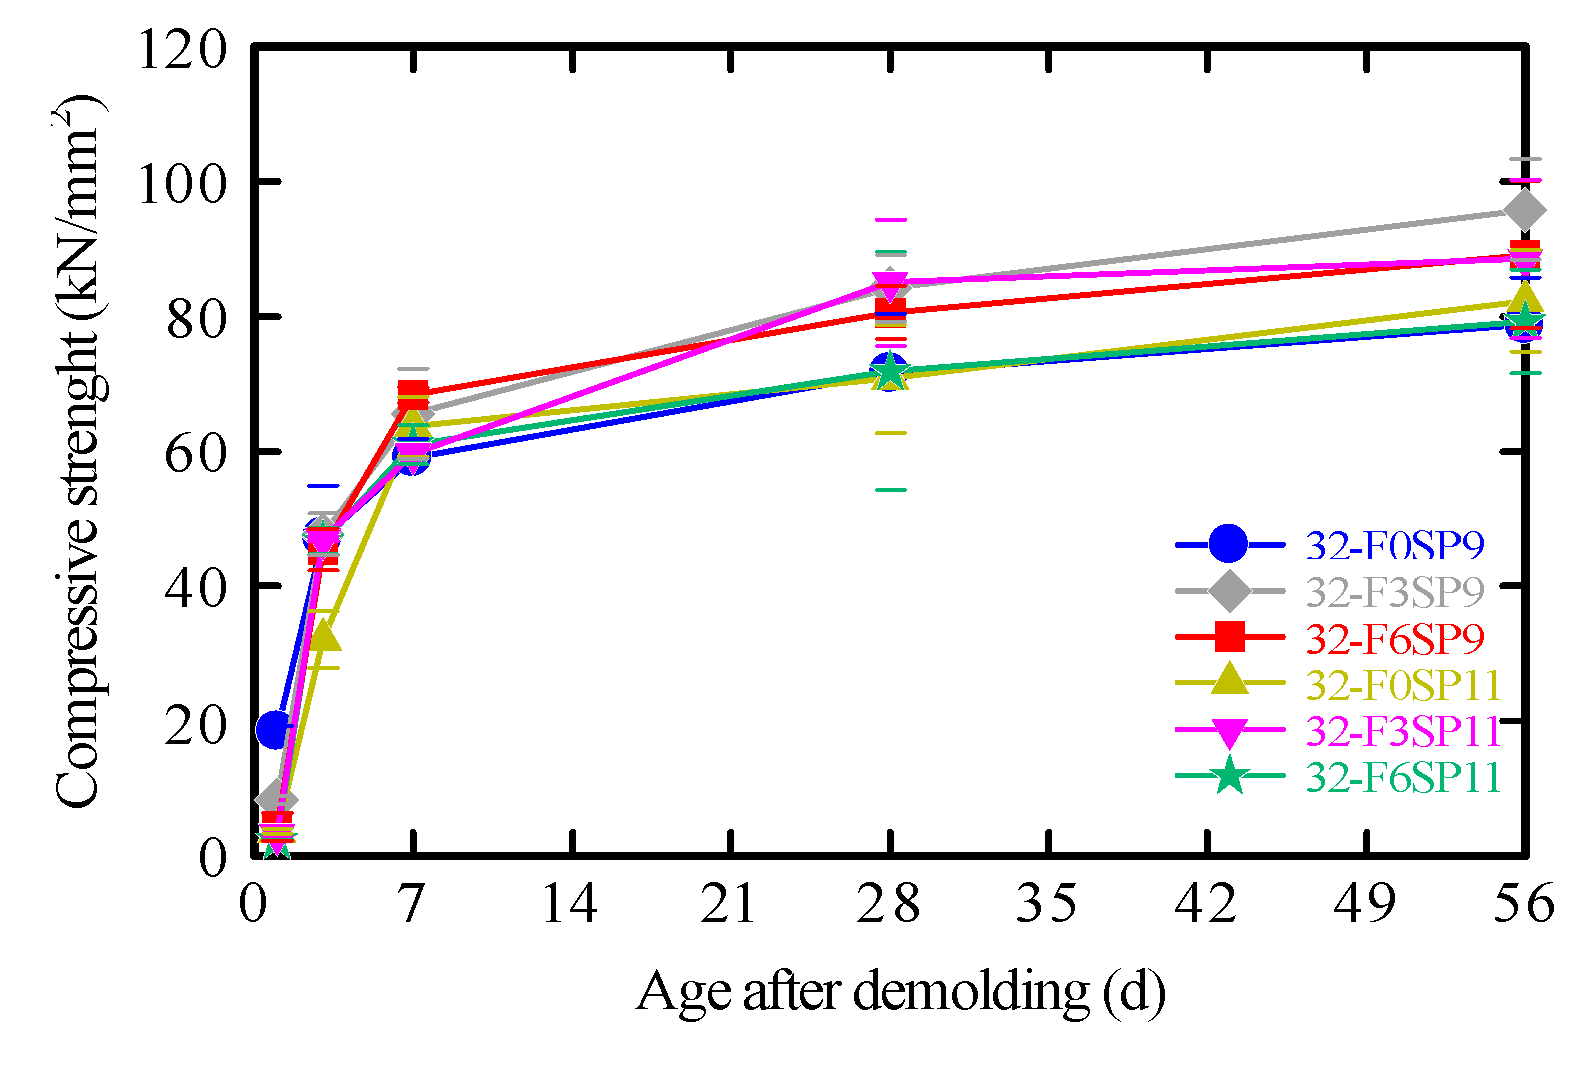
Figure 11.
Flexural strength.
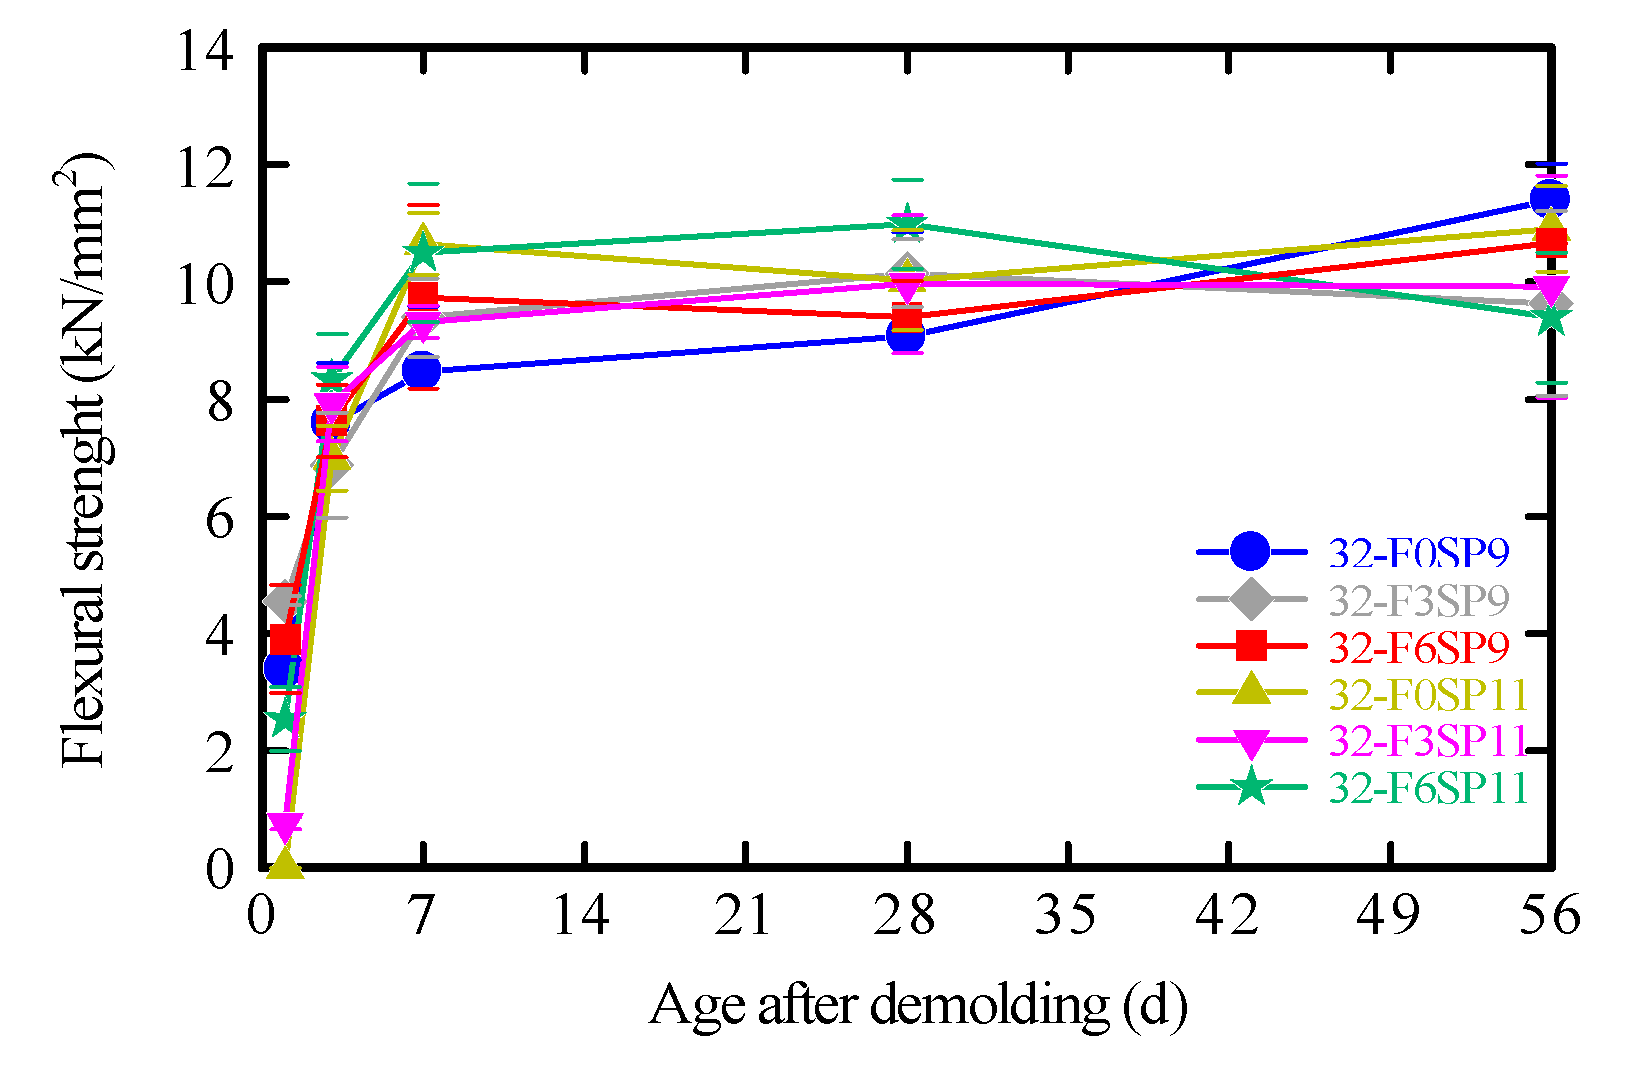
Figure 12.
Load–deflection at the specimen center.
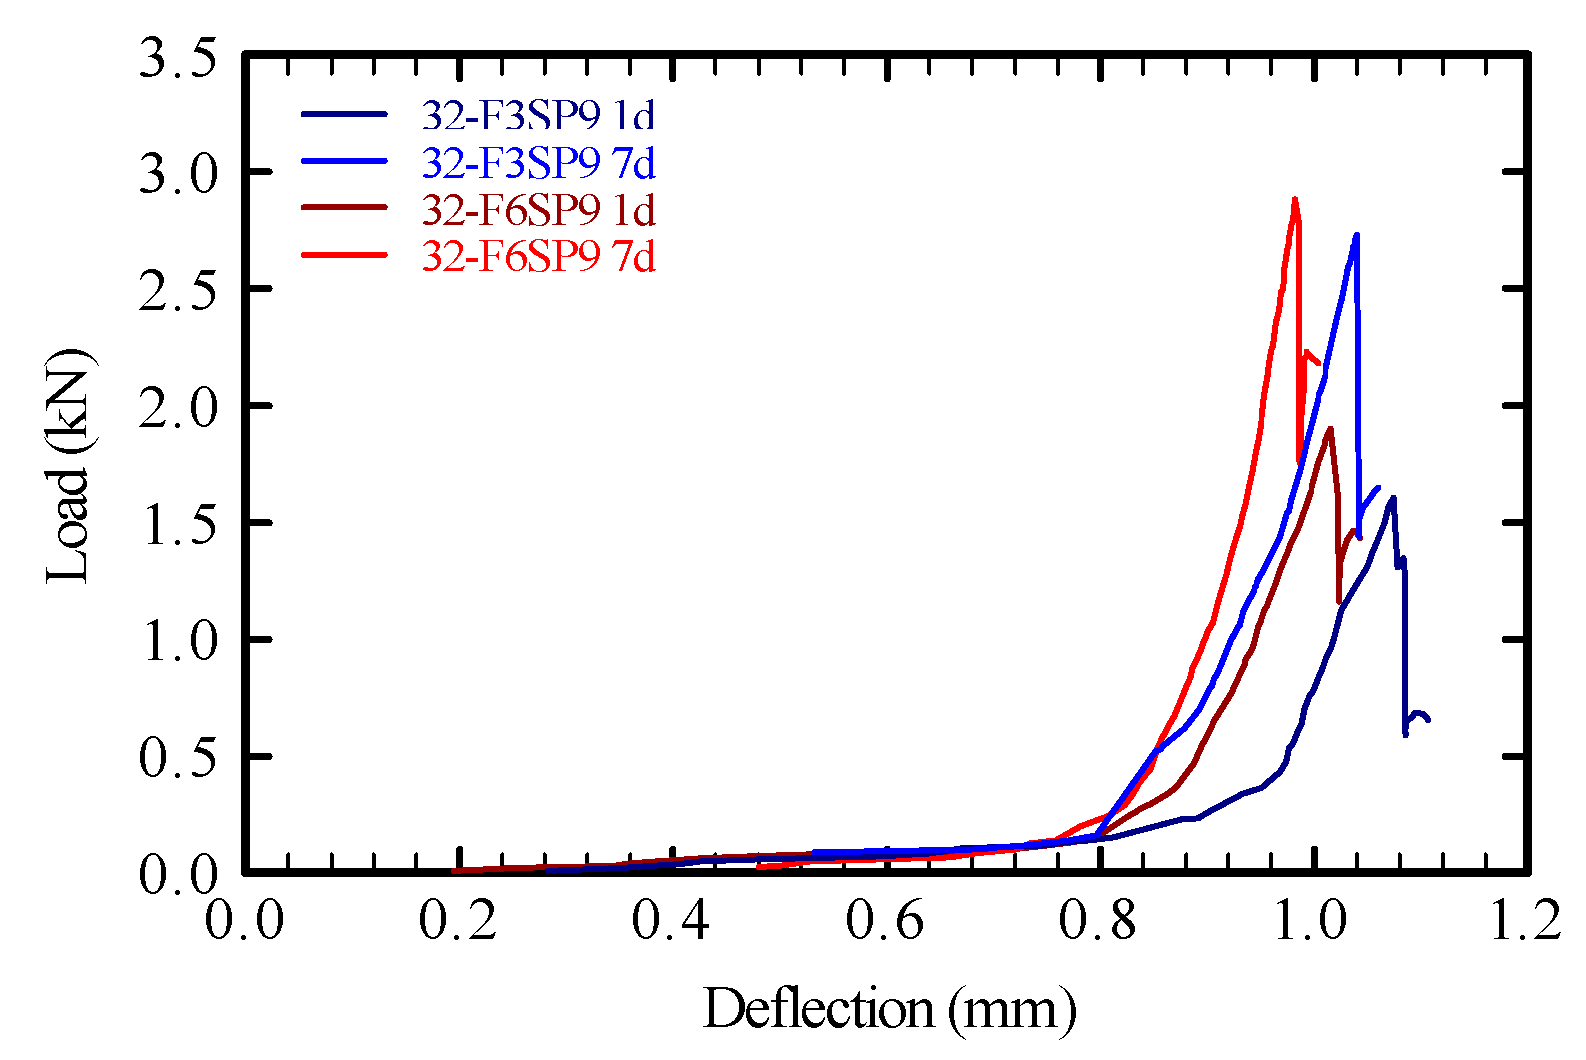
Figure 13.
Results of layering test implementation.
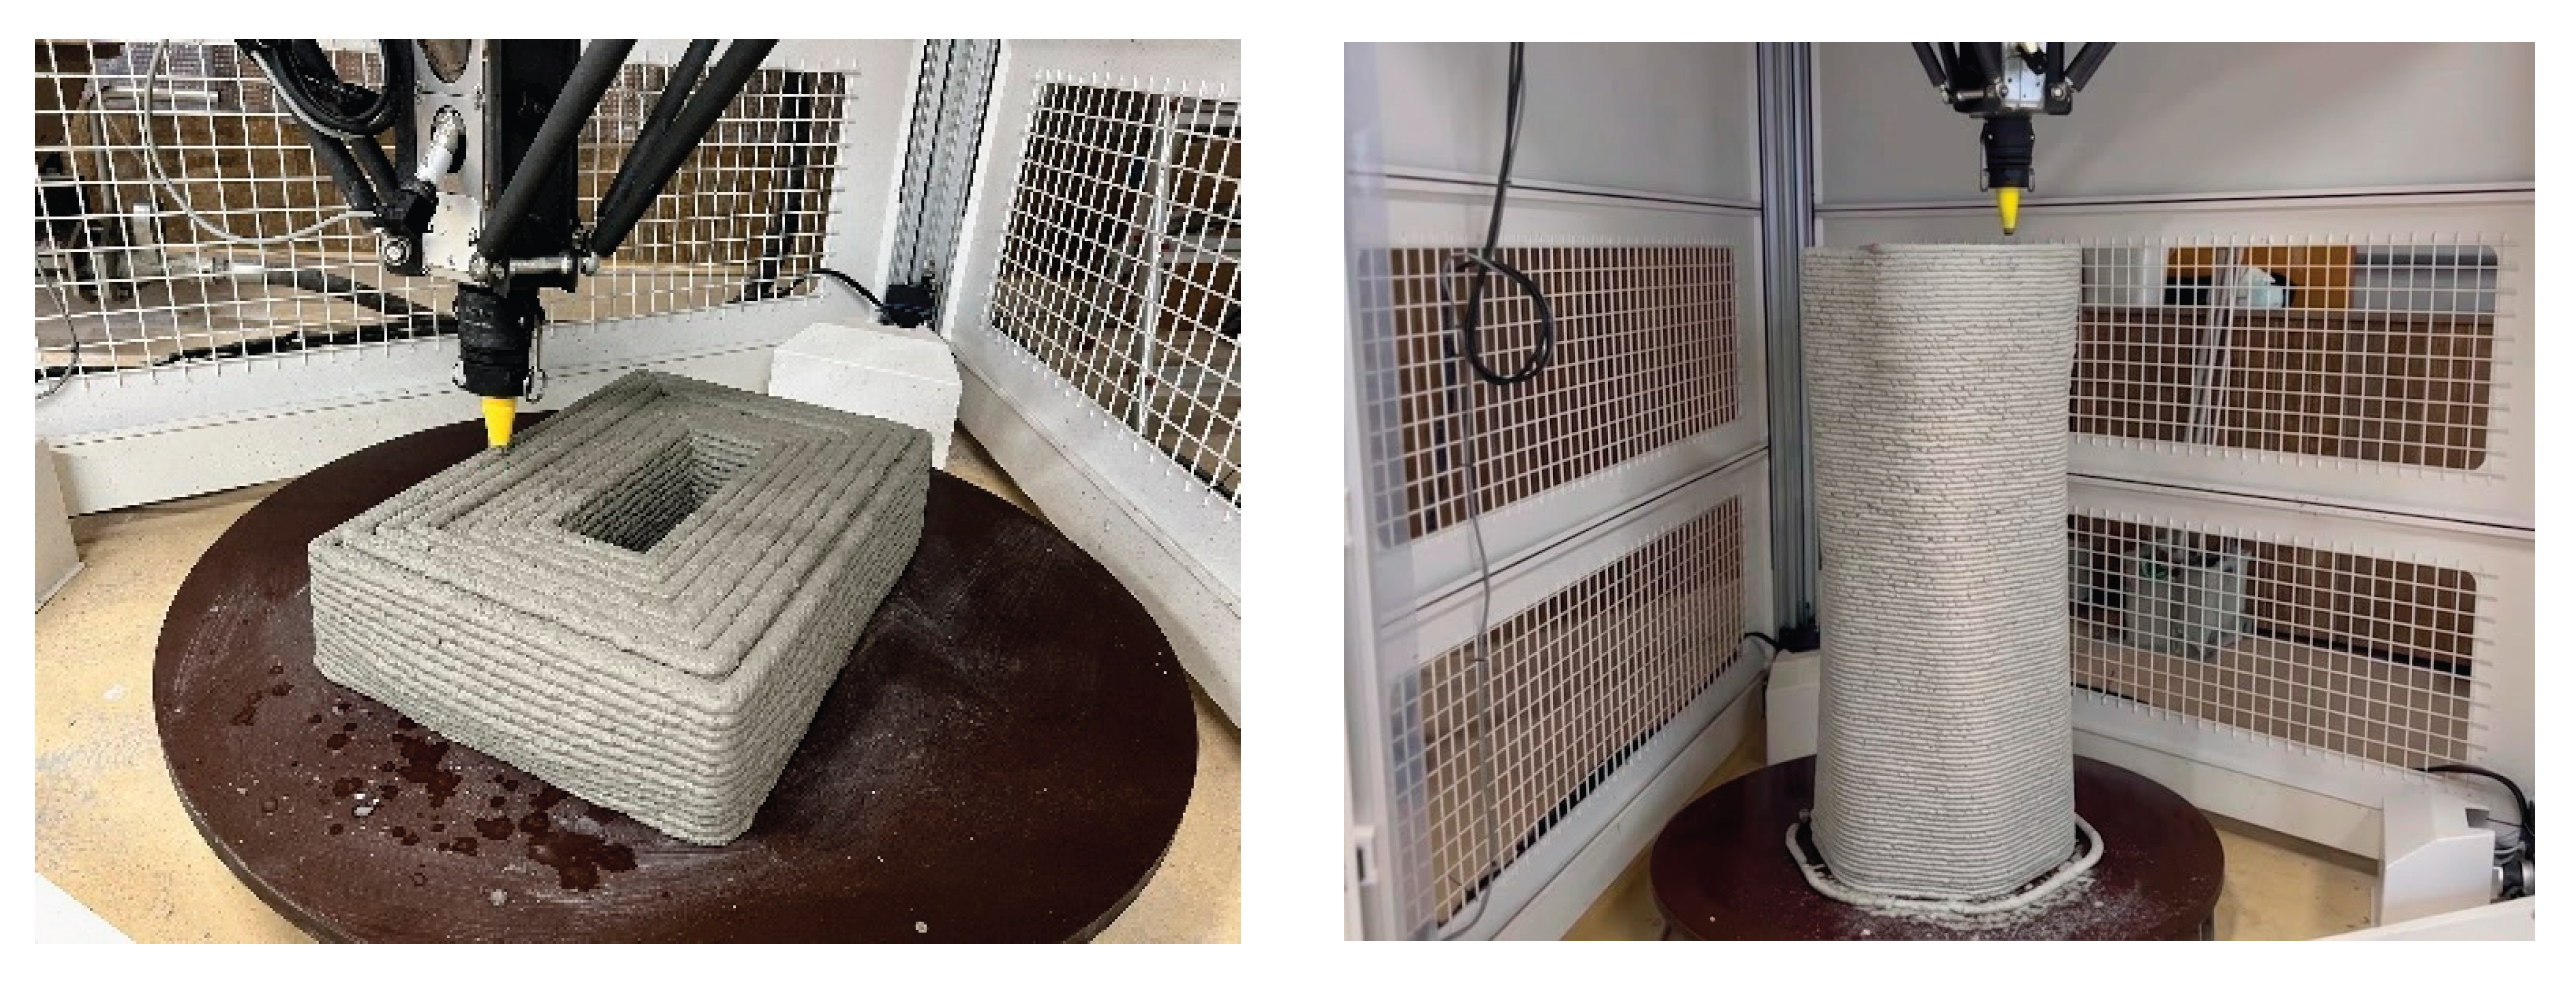
Figure 14.
Compressive strength of layered testing.
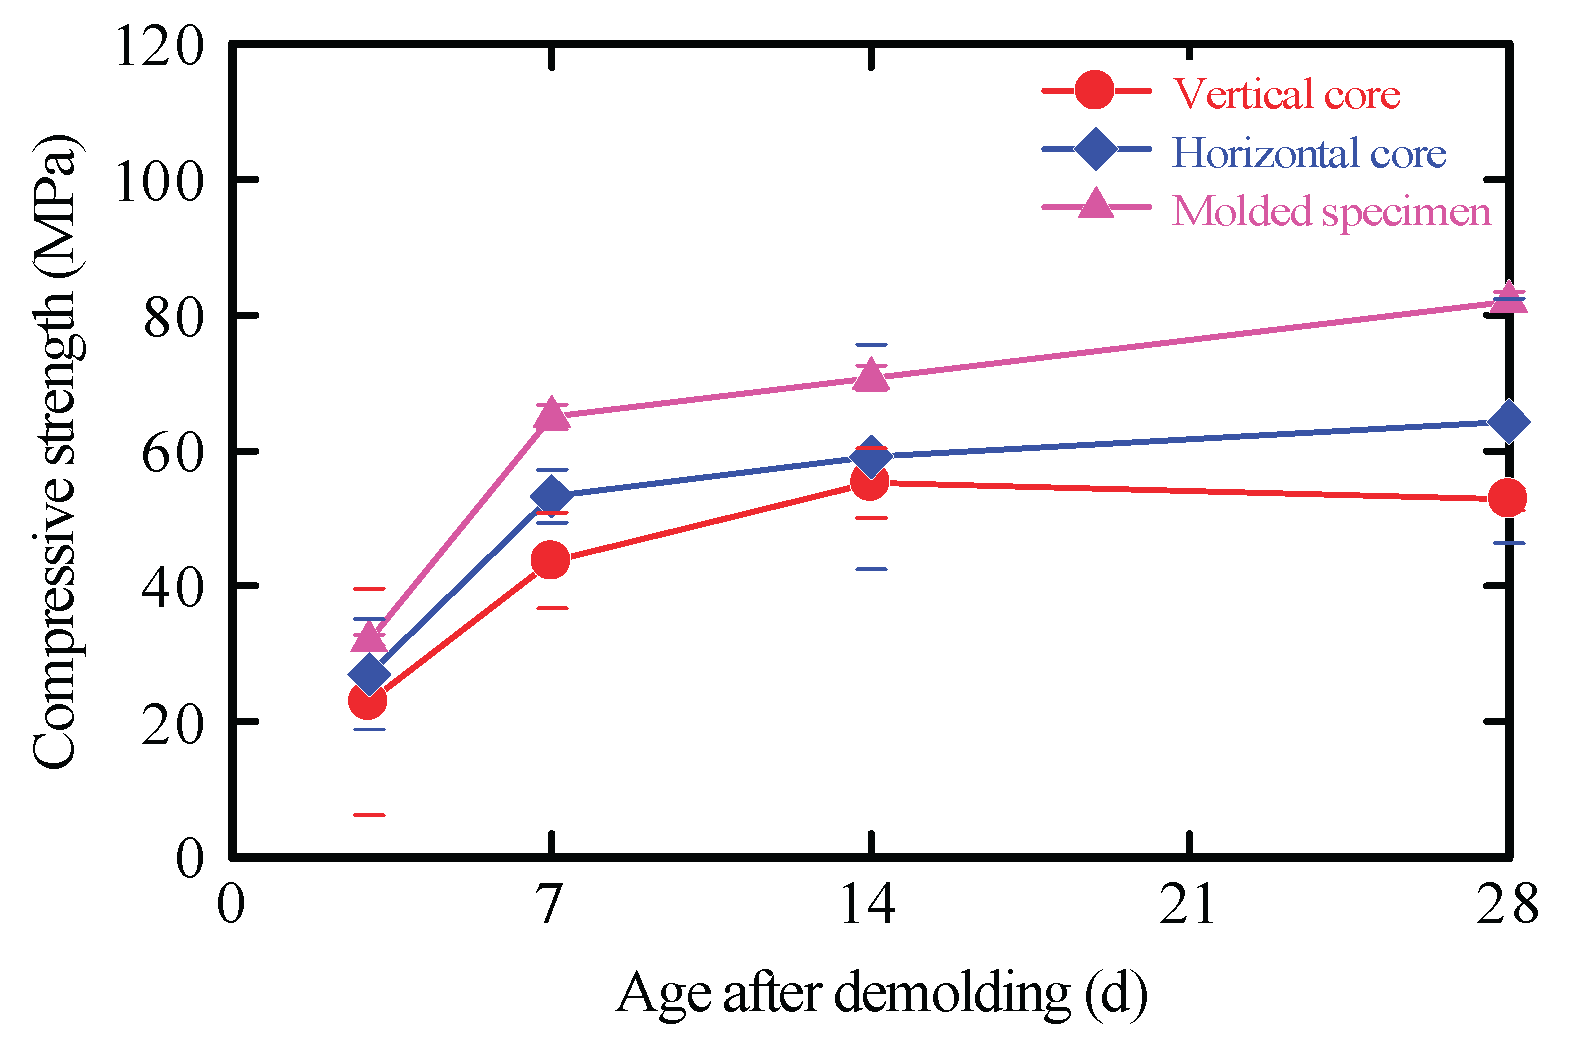
Figure 15.
Flexural strength of layered testing.
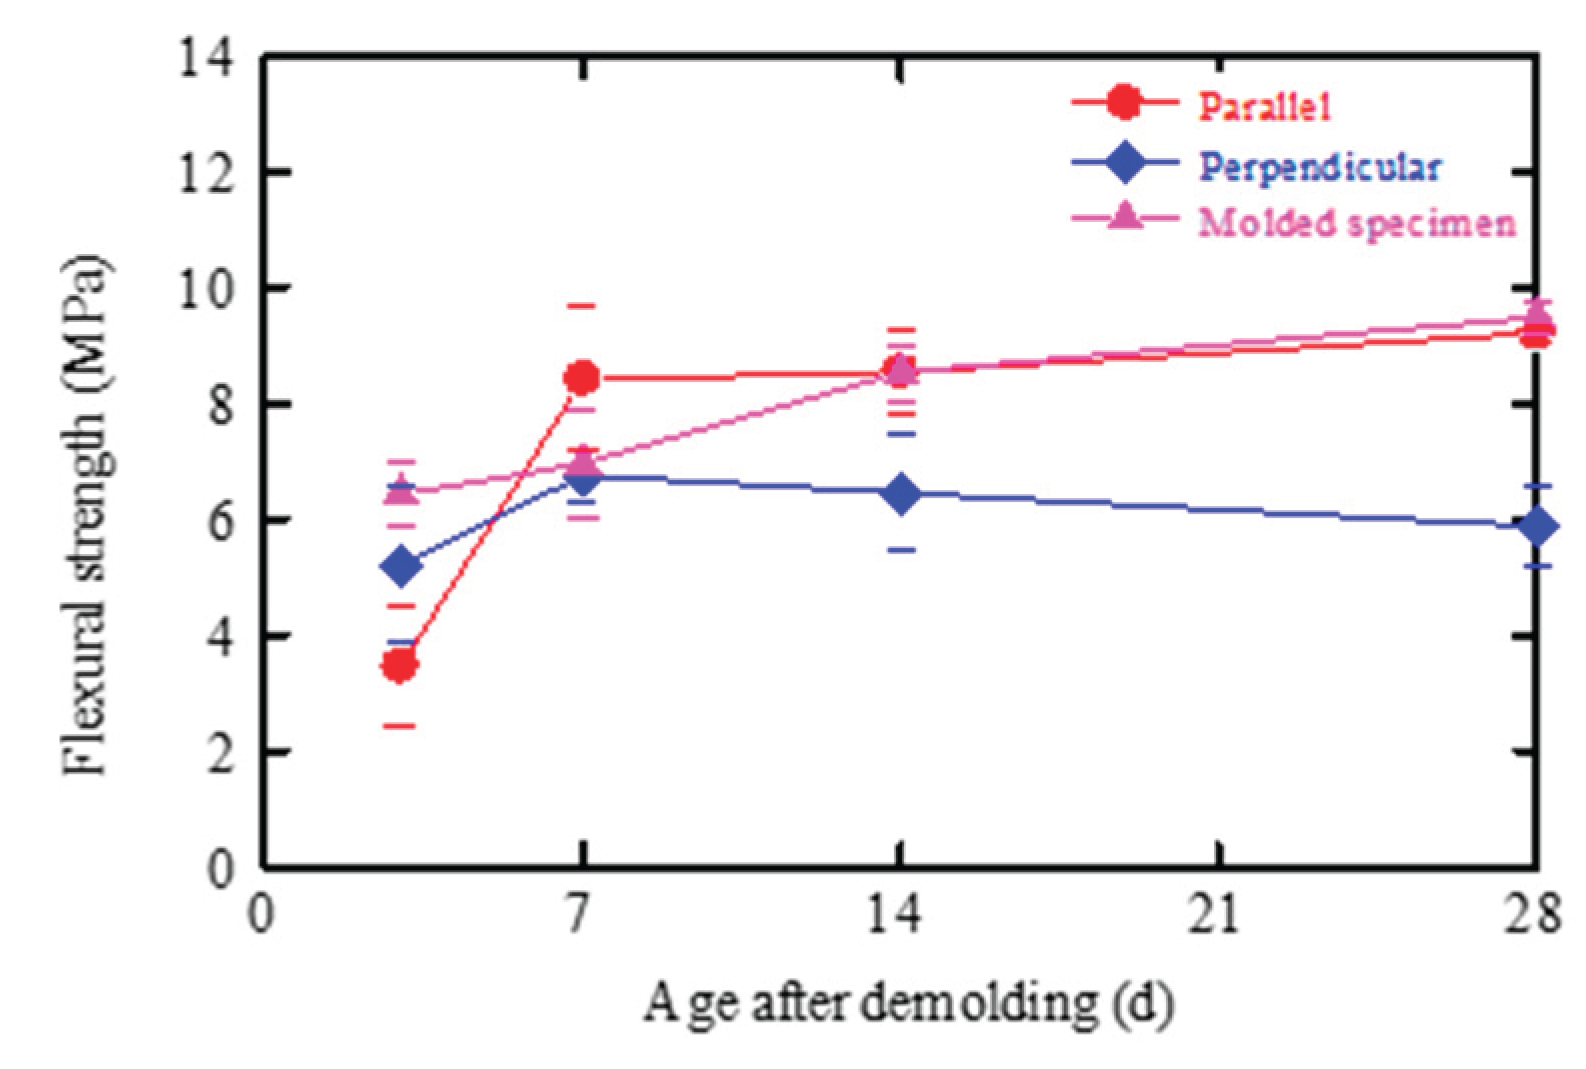

Table 1.
Raw-material specifications.
| Materials | Abbreviations | Details |
|---|---|---|
| Water | W | Tap water (Density: 1.00 g/cm3) |
| Cement | BB | Blast-furnace cement Type B (Density: 3.04 g/cm3; Brain: 3,770 cm2/g) |
| Reactive filler | SF | Silica fume (Density: 2.29 g/cm3; BET: 184,000 cm2/g) |
| Inert filler | Ca | Calcium carbonate powder (Density: 2.60 g/cm3; BET: 14,900 cm2/g) |
| Fine aggregate | S | Silica sand No. 4 (Place of origin: Nankan, Tamana, Japan; Density: 2.60 g/cm3; Particle size distribution: 0.212~1.18 mm) |
| Admixture | SP | Superplasticizer Type I (Density: 1.20 g/cm3) |
| Fiber | F | Polyvinyl alcohol (PVA)fibers (Density: 1.30 g/cm3; Length: 6 mm; Diameter: 40 µm; Elastic modulus: 23–40 GPa) |
Table 2.
3DP mortar mix proportions.
| Name | W/B (%) |
S/P (%) |
kg/m3 | ||||||
|---|---|---|---|---|---|---|---|---|---|
| W | BB | SF | Ca | S | SP | F | |||
| 32-F0SP9 | 32 | 49 | 320 | 928 | 86 | 254 | 621 | 9.1 | 0 |
| 32-F3SP9* | 3.9 | ||||||||
| 32-F6SP9 | 7.8 | ||||||||
| 32-F0SP11 | 11.2 | 0 | |||||||
| 32-F3SP11 | 3.9 | ||||||||
| 32-F6SP11 | 7.8 | ||||||||
| 33-F0SP9* | 33 | 52 | 330 | 910 | 90 | 223 | 636 | 9.0 | 3.9 |
Table 3.
Specifications of the vane blade.
| Symbol | Width (mm) | Height (mm) |
|---|---|---|
| A | 10 | 20 |
| B | 15 | 30 |
| C | 20 | 40 |
| D | 30 | 60 |
Disclaimer/Publisher’s Note: The statements, opinions and data contained in all publications are solely those of the individual author(s) and contributor(s) and not of MDPI and/or the editor(s). MDPI and/or the editor(s) disclaim responsibility for any injury to people or property resulting from any ideas, methods, instructions or products referred to in the content. |
© 2026 by the authors. Licensee MDPI, Basel, Switzerland. This article is an open access article distributed under the terms and conditions of the Creative Commons Attribution (CC BY) license (http://creativecommons.org/licenses/by/4.0/).
Copyright: This open access article is published under a Creative Commons CC BY 4.0 license, which permit the free download, distribution, and reuse, provided that the author and preprint are cited in any reuse.


