
Submitted:
06 February 2026
Posted:
06 February 2026
You are already at the latest version
Abstract
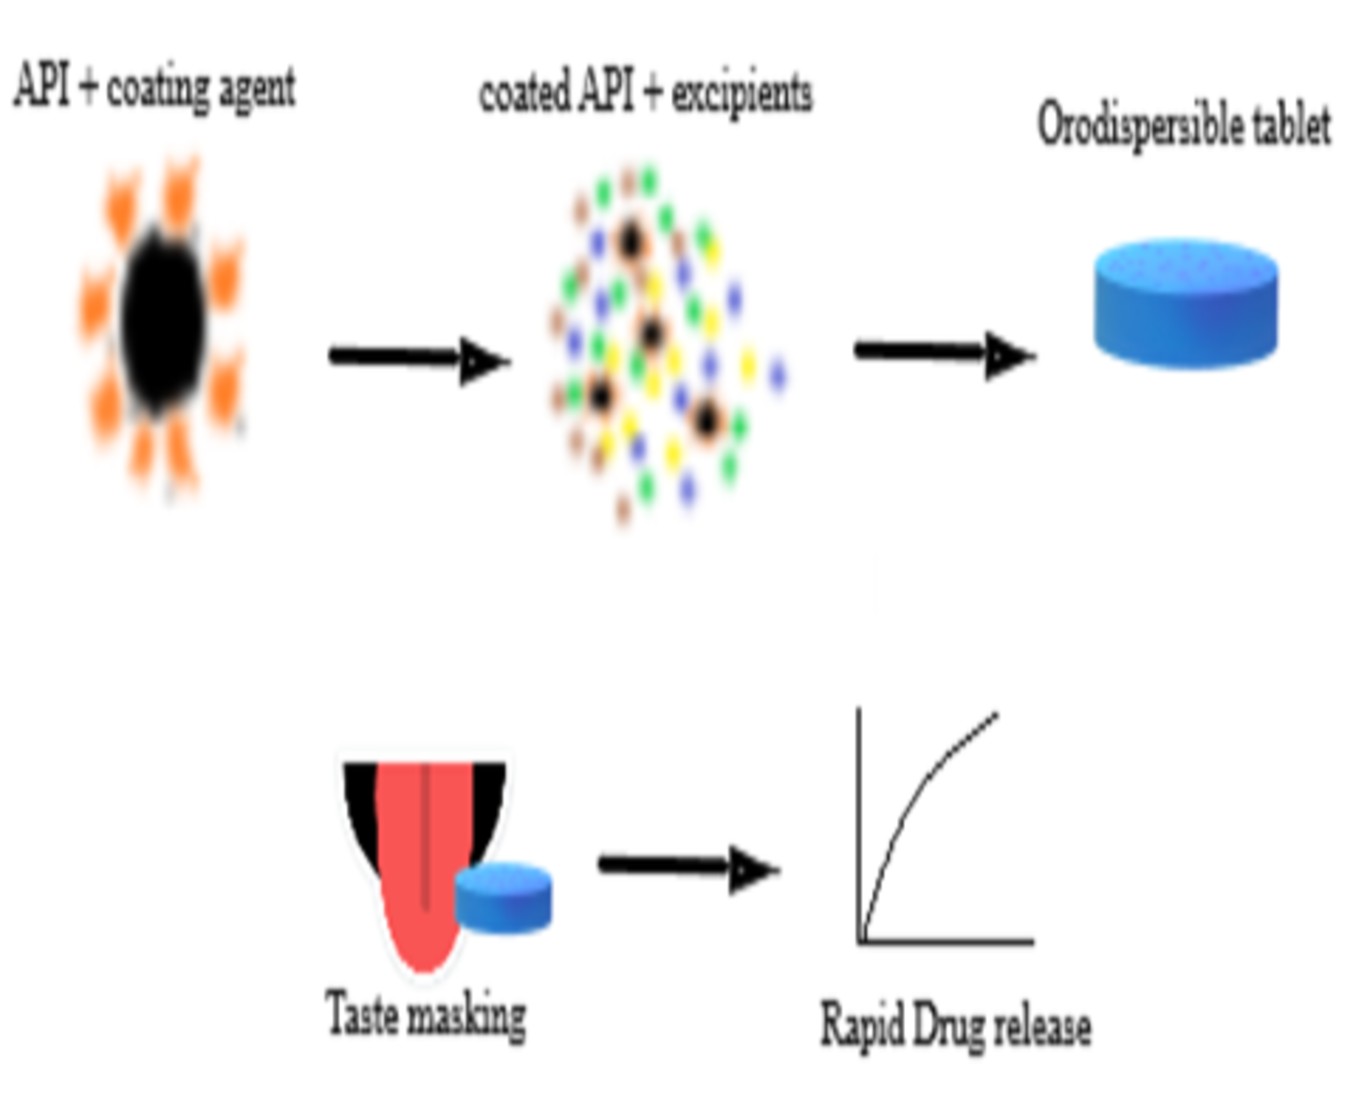
Orodispersible tablet is a patient-friendly alternative for delivering the drug to patients having problems with swallowing and sensitive to the bitterness of the drug. This study focuses on taste masking of cetirizine dihydrochloride by applying coating technique. Taste masked orodispersible tablet (ODT) was formulated using superdisintegrants and apply hydrophilic/hydrophopic polymer/lipid coating. Formulations were designed by 22 factorial central composite design, in which stearic acid and compritol 888 ATO were taken as independent variables. The taste masking was evaluated using the small-volume shake flask method, as an alternative to testing with a human panel. The concentration of stearic acid and compritol 888 ATO in the optimized formulation obtained from the Minitab software response optimization was nearly as same as that of formulation F3. Thus, formulation F3 was considered to be formulation of choice. The weight variation, disintegration time, friability, and dissolution were found to be satisfactory. The coating of API with compritol 888 ATO exhibited effective taste-masking properties while maintaining rapid disintegration and acceptable mechanical strength while masking the bitterness of the drug molecule. Taste masking of cetirizine dihydrochloride was successfully achieved using a lipid-based coating approach, with Compritol® 888 ATO and stearic acid as coating materials. Thus, the study successfully developed a taste-masked orodispersible tablet of cetirizine dihydrochloride using a lipid-based coating technique.
Keywords:
taste masking
; orodispersible
; superdisintegrant
; Minitab
; stearic acid
1. Introduction
“A system of formulation or process developed to introduce therapeutic agents into the body is called drug delivery system (DDS) [1]. Developing a new drug is costly and time-consuming, and also need to enhance safety, efficacy, and improve patient compliance. The conventional drug delivery system, such as tablets, capsules, etc., has a variety of drawbacks, such as the bitterness of the drug molecule, lack of target specificity, and severe side effects of the drugs [2]. Most of the drugs are undesirable to patients due to their bitterness. This can be seen in all patient groups, such as pediatric and geriatric populations [3]. Orally disintegrating tablets (ODTs), also called orodispersible tablets, are uncoated tablets designed to dissolve in the mouth within three minutes, making them easy to swallow without water. These tablets are good for children, the elderly, and individuals having difficulty swallowing traditional tablets and have the advantages of improved stability, ease of use, and accurate dosing. The popularity is increasing in the pharmaceutical industry due to their high patient acceptance, especially among those who struggle with conventional dosage forms. [4]. These tablets are designed to dissolve or break apart in the oral cavity without water, improving the administration of active pharmaceutical ingredients [5]. Literatures show that croscarmellose (3.00%) and crospovidone (3.92%), show good result giving disintegration time 40 seconds and a wetting time was of 33 seconds [6]. Orally disintegrating tablets are uncoated tablets intended to be used in the mouth, where they disperse within 3 min before swallowing [7]. Elwani et al has conducted an experimental study to compare different taste masking technique, such as granulation, coating, and complexation, followed by assessment of drug release and patient compliance [8]. A study conducted by Nakano, Y.et al. investigated the impact of different flavors on the taste perception and acceptability of orally disintegrating tablets which concluded that specific flavors influence the taste perception of drug [9]. Kurella et al showed the effectiveness of compritol 888 ATO in taste masking using met granulation technique while meeting required parameters for ODT formulation [10]. Cherian et al has demonstrated effective masking of bitterness of drug molecule by encapsulating the drug in erodible stearic acid which delay their release in the mouth [11].
An effective taste-masking techniques are required to enhance palatability and promote patient compliance. Nowadays, the pharmaceutical industries applied various approaches to address this challenge. These include the use of flavors, sweeteners, and amino acids. Advanced techniques, such as polymer coating, conventional granulation, desalination, salting-out systems, and ion-exchange resins are also applied for taste-masking [12]. Masking the bitter taste of the drug is necessary in ODT formulation; however, taste-masking strategies must not interfere with the drug’s intended bio-performance, ensuring proper in vivo release for effective treatment. To ensure the taste masking, the drug should dissolve as little as possible in the mouth but release quickly when it reaches the gastrointestinal tract [13]. The in vitro drug release using phosphate buffer at pH 6.8 as dissolution media can be used as a surrogate for in-vivo taste evaluation [14,15].
Various coating techniques have been developed to coat APIs, forming a physical and chemical barrier that prevents drug dissolution or diffusion. These coated particles serve as key components in the overall pharmaceutical formulation. The coating must remain intact throughout storage to avoid the perception of bitterness while ensuring that it dissolves or becomes permeable at the appropriate time for the drug to take effect [16]. The coated drug-polymer mixture can be processed into granules. Ethylcellulose was used to form a continuous and effective coating on the core element [17].The physical properties of granules could be improved after coating, which results in masking the unpleasant taste and can be formulated into orodispersible tablet [18]. In this paper, we report that hot melt granulation method was used to develop taste masked orodispersible tablet using stearic acid and compritol 888 ATO as coating agents. The formulations were evaluated for taste masking, disintegration behavior, mechanical properties, and in-vitro drug release to ensure minimal release in the oral cavity with rapid release under gastrointestinal conditions. The optimized formulation showed effective bitterness masking and acceptable tablet performance.
2. Materials and Methods
2.1. Materials
The raw materials were received as a gift sample from National Healthcare Pvt. Ltd, Chattapipra, Birgunj, Nepal. All the chemicals used were of lab grade, and the liquid solvent was HPLC grade.

Table 1.
List of Raw material.
| S.No. | Material | Source |
|---|---|---|
| 1. | Cetrizine Dihydrochloride | Raj Pioneer Laboratories Pvt, Ltd. (Rajeev Nagar, Madhya Pradesh, India) |
| 2. | Mannitol | Haihang Industry Co. Ltd. (South Gongye Road, Jinan City, Shandong Province, China) |
| 3. | MCCP 101 | NB Enerprenuers (Kamptee Road, Nagpur, Maharashtra , India) |
| 4. | Croscarmellose sodium | Sudarshan Trading (Royapettah, Chennai, Tamil Nadu, India) |
| 5. | Crospovidone | Sun Pharmaceutical Industries Ltd. (Jebel Ali Free Zone, Dubai, UAE) |
| 6. | Aspartame | Stevia world aggrotech (India) |
| 7. | Orange Flavour | VedaOils (Shivalik Nagar, Kanpur, Uttar Pradesh, India) |
| 8. | Aerosil-200 | Cbot sammar Ltd. |
| 9. | Talcum | Orchid lifesciences (Akodi Village, Daman U.T. 396210, India) |
| 10. | Magnesium stearate | MLA group of industries (Brahm Nagar, Kanpur, Uttar Pradesh, India) |
| 11. | Stearic acid | Innova corporate (West Shalimar Bagh, New Delhi, Delhi 110088, India) |
| 12. | Compritol 888 ATO | Gattefosse (Vikhroli (East), Mumbai, India) |
| 13. | Ethyl cellulose | Vizag chemicals (Visakhapatnam area, India) |
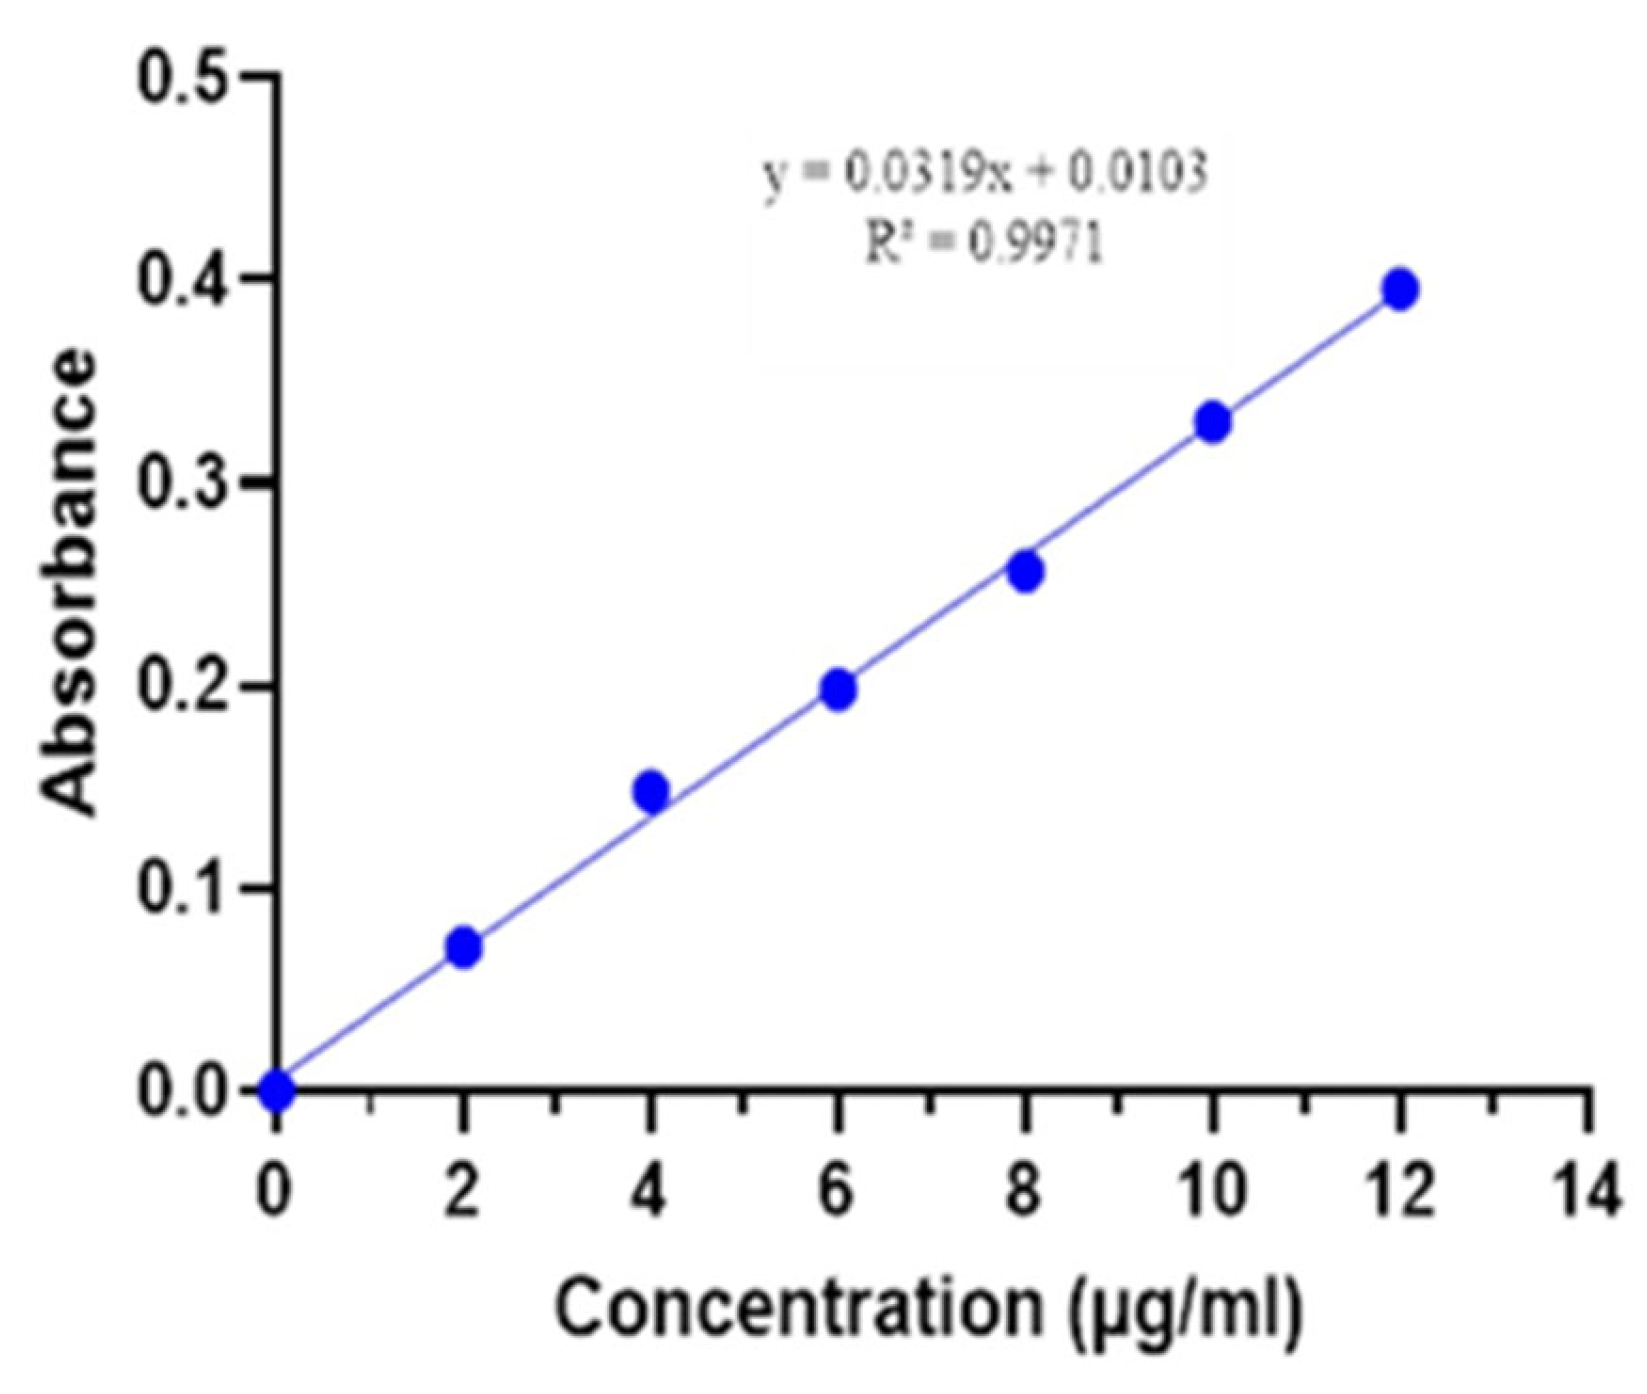
2.2. Development of Standard Calibration Curve
The reference drug was dissolved in HCl, as solvent to prepare a stock solution. The aliquot solution was serially diluted with 0.1 N HCl solvent to obtain different concentration solutions ranging from 2 µg/ml to 12 µg/ml. The sample was analyzed at 230 nm using solvent as a blank. The calibration curve was then plotted and validated by analyzing accuracy and precision [19].
2.3. Compatibility Study
A study was conducted to ensure that selected excipients do not interfere the active pharmaceutical ingredient (API), which could impact drug stability or efficacy. Guidance on compatibility studies is provided in Appendix 3 of the WHO Guidelines for registration of fixed-dose combination medicinal products (WHO Technical Report Series. No.929, 2005). As stated in WHO guidelines, in addition to visual inspection, chromatographic evaluation such as assay tests are essential to confirm the compatibility between APIs and between APIs and excipients. The drug-excipient mixture at a ratio of 1:2 was mixed and kept in a hot air oven at 50 °C for 1 week. Assay methods were performed to detect any potential chemical effect on API potency [20].
2.4. Preparation of Complex
Minitab software was utilized to design the experimental formulation of an API-coating complexation was aimed to mask the bitterness of Cetirizine dihydrochloride. The formulations were designed using 22 factorial central composite design, and optimized quantity of excipient was done using minitab software, Version 21 (Minitab, LLC, State College, PA, USA, 2022). Stearic acid and Compritol 888 ATO were served as independent variables, and drug content, release, and taste masking were dependent responses.
Table 2.
Independent variables/factor and dependent variables/responses used in design of experiments.
Table 2.
Independent variables/factor and dependent variables/responses used in design of experiments.
| Variable | units | Type | Coaded(actual) | |
|---|---|---|---|---|
| Low | High | |||
| Factors | ||||
| Stearic acid | mg | Numeric | -1 (0) | +1 (30) |
| Compirtol 888 ATO | mg | Numeric | -1 (0) | +1 (30) |
| Responses | Goal | |||
| Drug content | % | 100 | ||
| Drug release | % | 100 | ||
| In-vitro taste masking efficiency | % | maximum | ||
The melt granulation technique was used to prepare complexes of API and coating agent. The required quantity of coating material was weighed accurately and melted in stainless steel container at 60-70 °C, and the required quantity of the drug was added, followed by mixing for 10 minutes and cool. The solidified mass was milled and passed through a sieve #18 to obtain granular powder [21].
2.5. Characterization Study
Complex Formation
Drug Content in DCC
The cetirizine content within the granules was determined using liquid chromatography. A sample (equivalent to 25 mg of drug) was dispersed in the mobile phase and filtered. A portion of the filtrate was then diluted and analyzed. The assay was done to ensure the stability and uniformity of API, distributed during the coating process [19].
In-Vitro Taste Masking Assessment
In-vitro investigation of taste-masking effectiveness study shows a strong correlation between in-vitro drug release and hypothetical drug dissolution in the oral cavity [15]. The drug release from the DCC was evaluated in a pH 6.8 phosphate buffer, simulating salivary conditions. This assessment was conducted since the drug’s bitterness is directly associated with its release at salivary pH in the mouth, and data can be used to evaluate the taste masking efficiency.
Small-volume shake flask dissolution method can be used as a surrogate for human panel taste-masking assessment. Accurately weighed quantity of DCC equivalent to 10 mg of cetirizine dihydrochloride was transferred to 10 ml of pH 6.8 phosphate buffer solution in 10 ml VF. The mixture was filtered after 120 seconds. The filtrate was assayed for the drug content at 230 nm using High pressure liquid chromatography (Shimadzu) [15]. Chromatographic condition:
Column: Stainless steel (25 cm × 4.6 mm, packed with octadecylsilane chemically bonded to porous silica (5 µm)).
Flow rate: 1.2 ml per minute
Spectrophotometer: 230 nm
Injection volume: 20 µl
2.6. Preparation of Orodispersible Tablets (ODT) by Direct Compression
All excipient were passed through sieve number #40, while the drug/coating complex, which was passed through sieve number #2. The sieve material was then mixed uniformly for about 10 minutes to achieve homogenous distribution. The tablet was prepared by direct compression at constant force with shape, break-line on one side punches. Each batch size consisted of an average weight of 150 mg per tablet [22].
Table 3.
Formulation of ODT.
| S.No. | Ingredients | Quantity/batch (%) |
| 1. | Cetirizine dihydrochloride/coating complex | Equivalent to 10 mg |
| 2. | Microcrystalline cellulose 101 | 20.0 |
| 3. | Mannitol | 24.0 |
| 4. | Croscarmellose sodium | 3.0 |
| 5. | Crospovidone CL | 6.0 |
| 6. | Sodium lauryl sulphate | 2.0 |
| 7. | Aspartame | 3.0 |
| 8. | Orange flavor | 2.0 |
| 9. | Magnesium stearate | 1.0 |
| 10. | Talcum | 1.0 |
| 11. | Aerosol-200 | 1.0 |
2.7. Precompression Evaluation of Tablets
Angle of repose
The angle of repose shows the flow properties of bulk powder. It is determined by passing powder through a funnel which fall under the influence of gravity. [24]. The angle was calculated using:
where θ= angle of repose
h = height of pile of powder
r= ½ of the diameter
Bulk Density/tapped density
Bulk density analyzes how particles occupy space when loosely packed [24]. It is measured by:
Tapped density analyzes how particles occupy space when compactly packed [24].
Compressibility Index/Hausner’s ratio
The compression properties of bulk powder are expressed by the compressibility index [24].
Hausner’s ratio can also be calculated based on bulk density and tapped density and
is another indicator of powder flow properties.
2.8. Post-Compression Evaluation of Tablets
Following compression, the ODTs were assessed for their physical and chemical characteristics.
Weight variation
Twenty tablets were randomly selected and weighed individually. The mean weight
Hardness and Thickness
The hardness and thickness of the tablet was obtained using a tablet testing machine. Result was recorded in Newtons (N), ensuring uniform mechanical strength across batch [24].
Friability
Friability test was conducted using friability testing machine [25].
Friability (%): (W1-W2)/W1×100%
Where w1= initial weight
w2= weight after friability
Acceptance criteria: ≤ 1.0%
Disintegration time (DT)
There are different methods to determine disintegration time. To determine the disintegration of the ODT formulation, the IP method was followed, in which the DT apparatus was used, maintaining the temperature of 37.2 °C, containing 900 mL of water.
Wetting time
Wetting time is measured by placing tablet over the tissue paper positioned in a dish dilled with water. The time required for water to reach the upper surface of the tablet was noted as a wetting time [26].
Assay
The assay was carried out by HPLC as per IP specification [19]
Dissolution test
In-vitro drug release of tablet was conducted USP Type 2 apparatus maintaining given conditions [19]:
| Medium: | 0.1 N HCl |
| Volume: | 900 ml |
| Apparatus: | Type 2 |
| Rpm: | 100 |
| Time: | 45 minutes |
The percentage drug release was determined by the application of a standard calibration curve [19]
3. Results and Discussion
Cetirizine dihydrochloride showed absorption maxima at 230 nm when scanned 10 µg/ml of stock solution at 200-400 nm. The correlation coefficient (R2) value of cetirizine standard in HCL was 0.9971.
Figure 1.
Standard calibration curve of Cetirizine Dihydrochloride.
3.1. Accuracy and Precision
The %RSDs for accuracy and precision were found to be ≤ 2%. The results indicate that the method used was precise, as reflected by the low relative standard deviation (RSD) values. Furthermore, the average percentage recovery of cetirizine dihydrochloride was observed to fall within the acceptable range of 98% to 102%, which confirms the method’s reliability in quantifying the active ingredient.
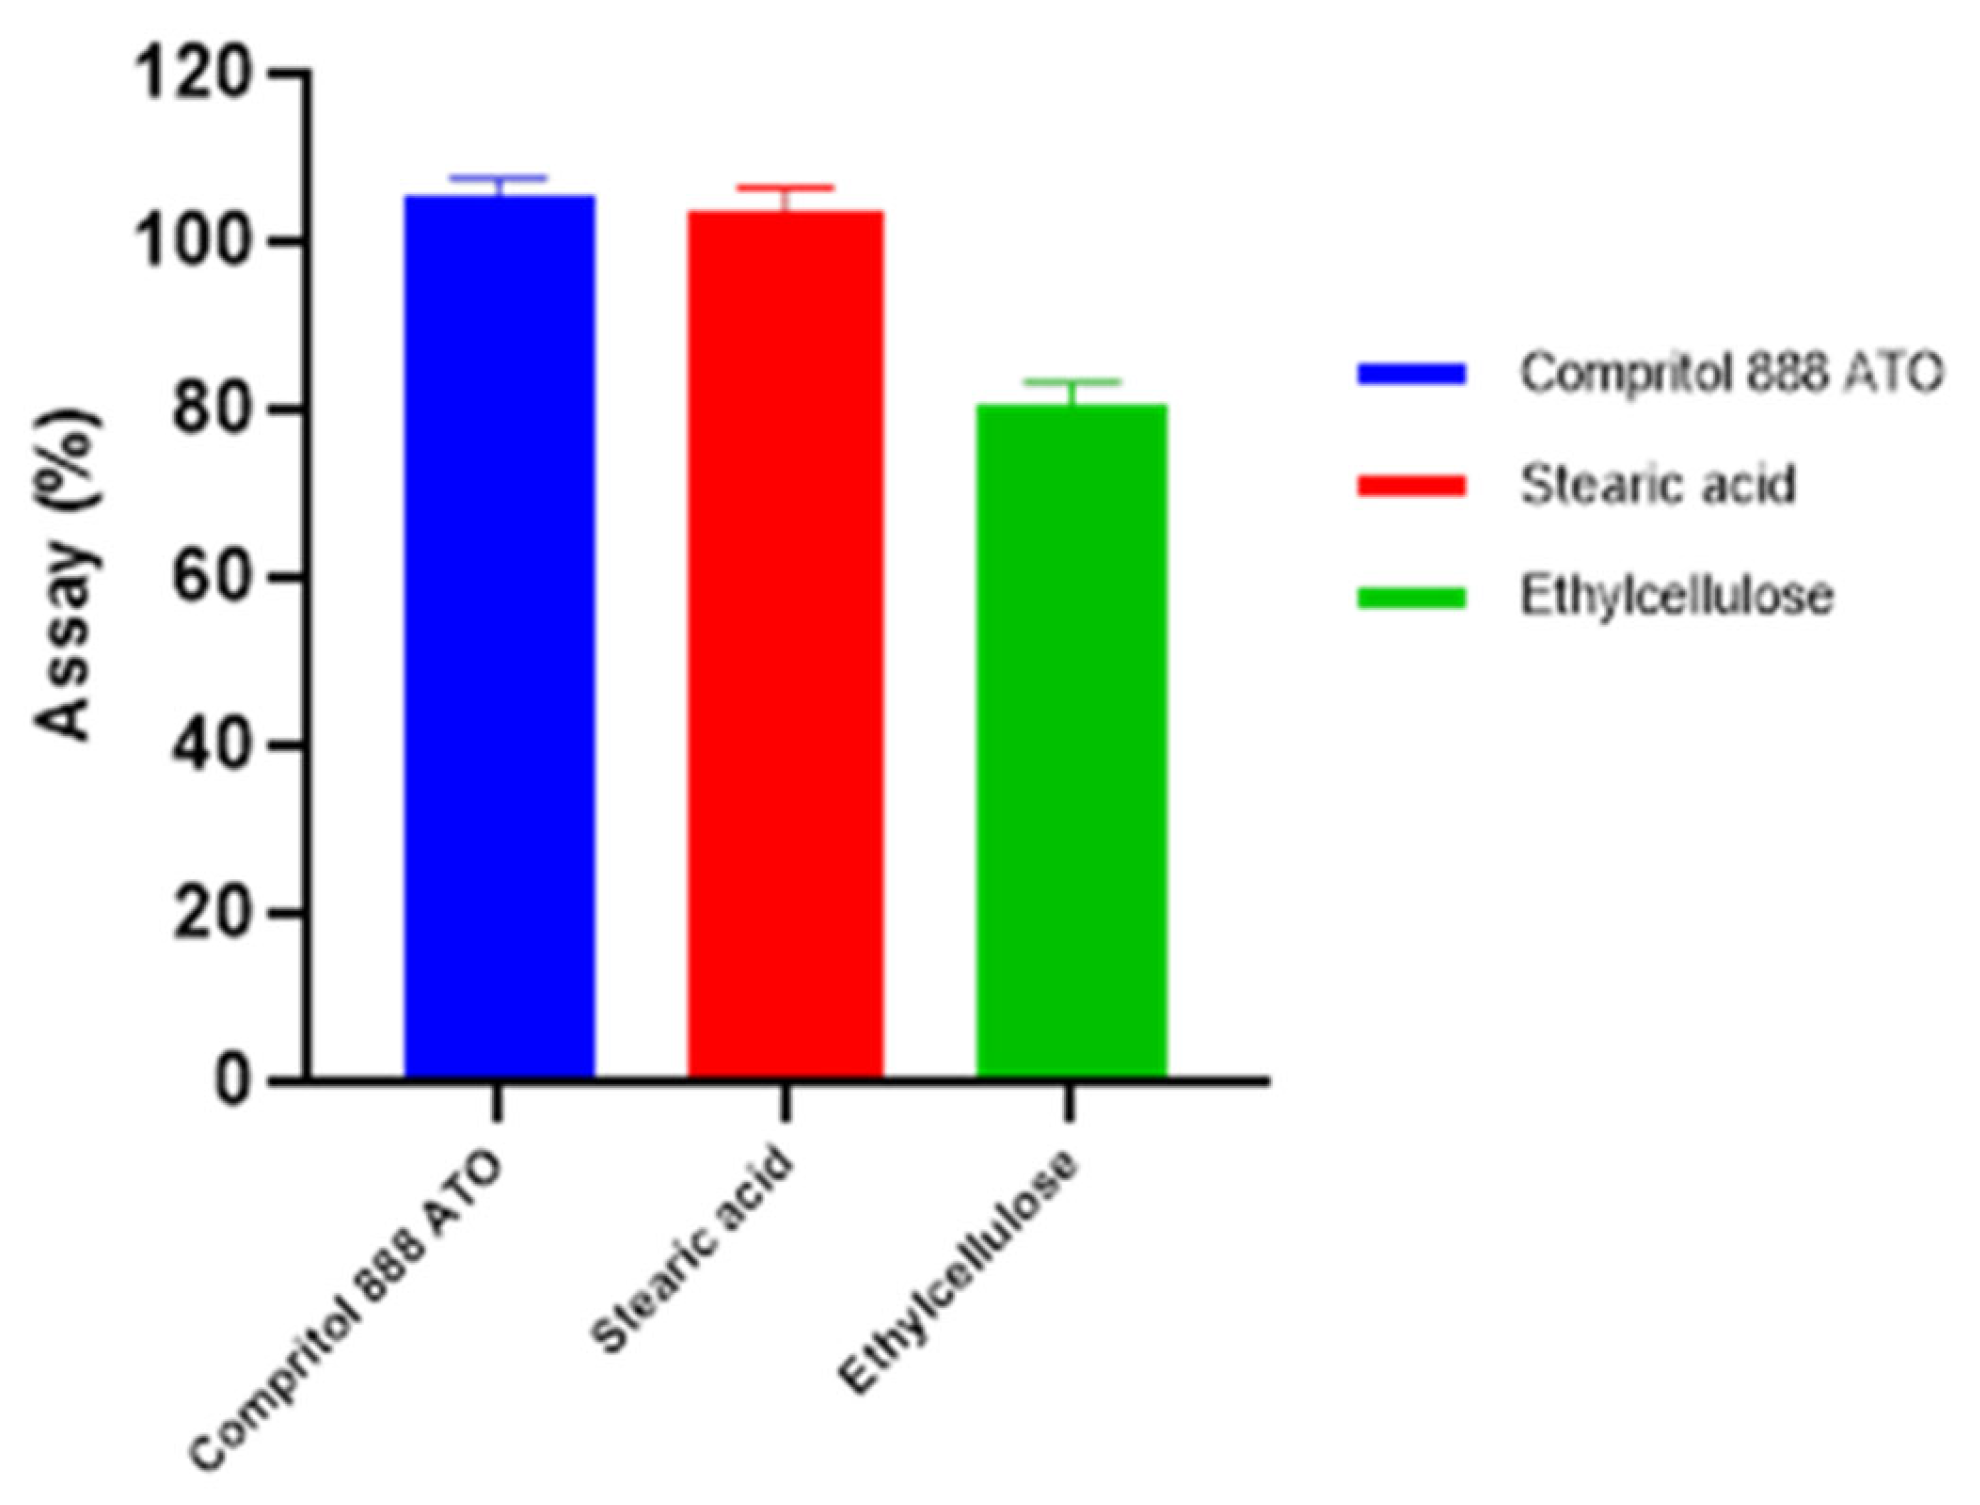
3.2. Compatibility Study
During compatibility analysis, ethylcellulose decreases the potency of API (80.7%) but not with stearic acid (assay: 98.6%) and compritol 888 ATO (assay: 105.3%). And there were no physical changes seen in test batches and no distortion of peak was found in each batch analyzed by HPLC, which showed that all the ingredients used in the formulation were compatible with the active moiety, except for ethylcellulose. So, ethylcellulose was discarded from the study, and continued with stearic acid and compritol 888 ATO.
Figure 2.
Compatibility study of drug with excipient.
3.3. Characterization of Complex Formation
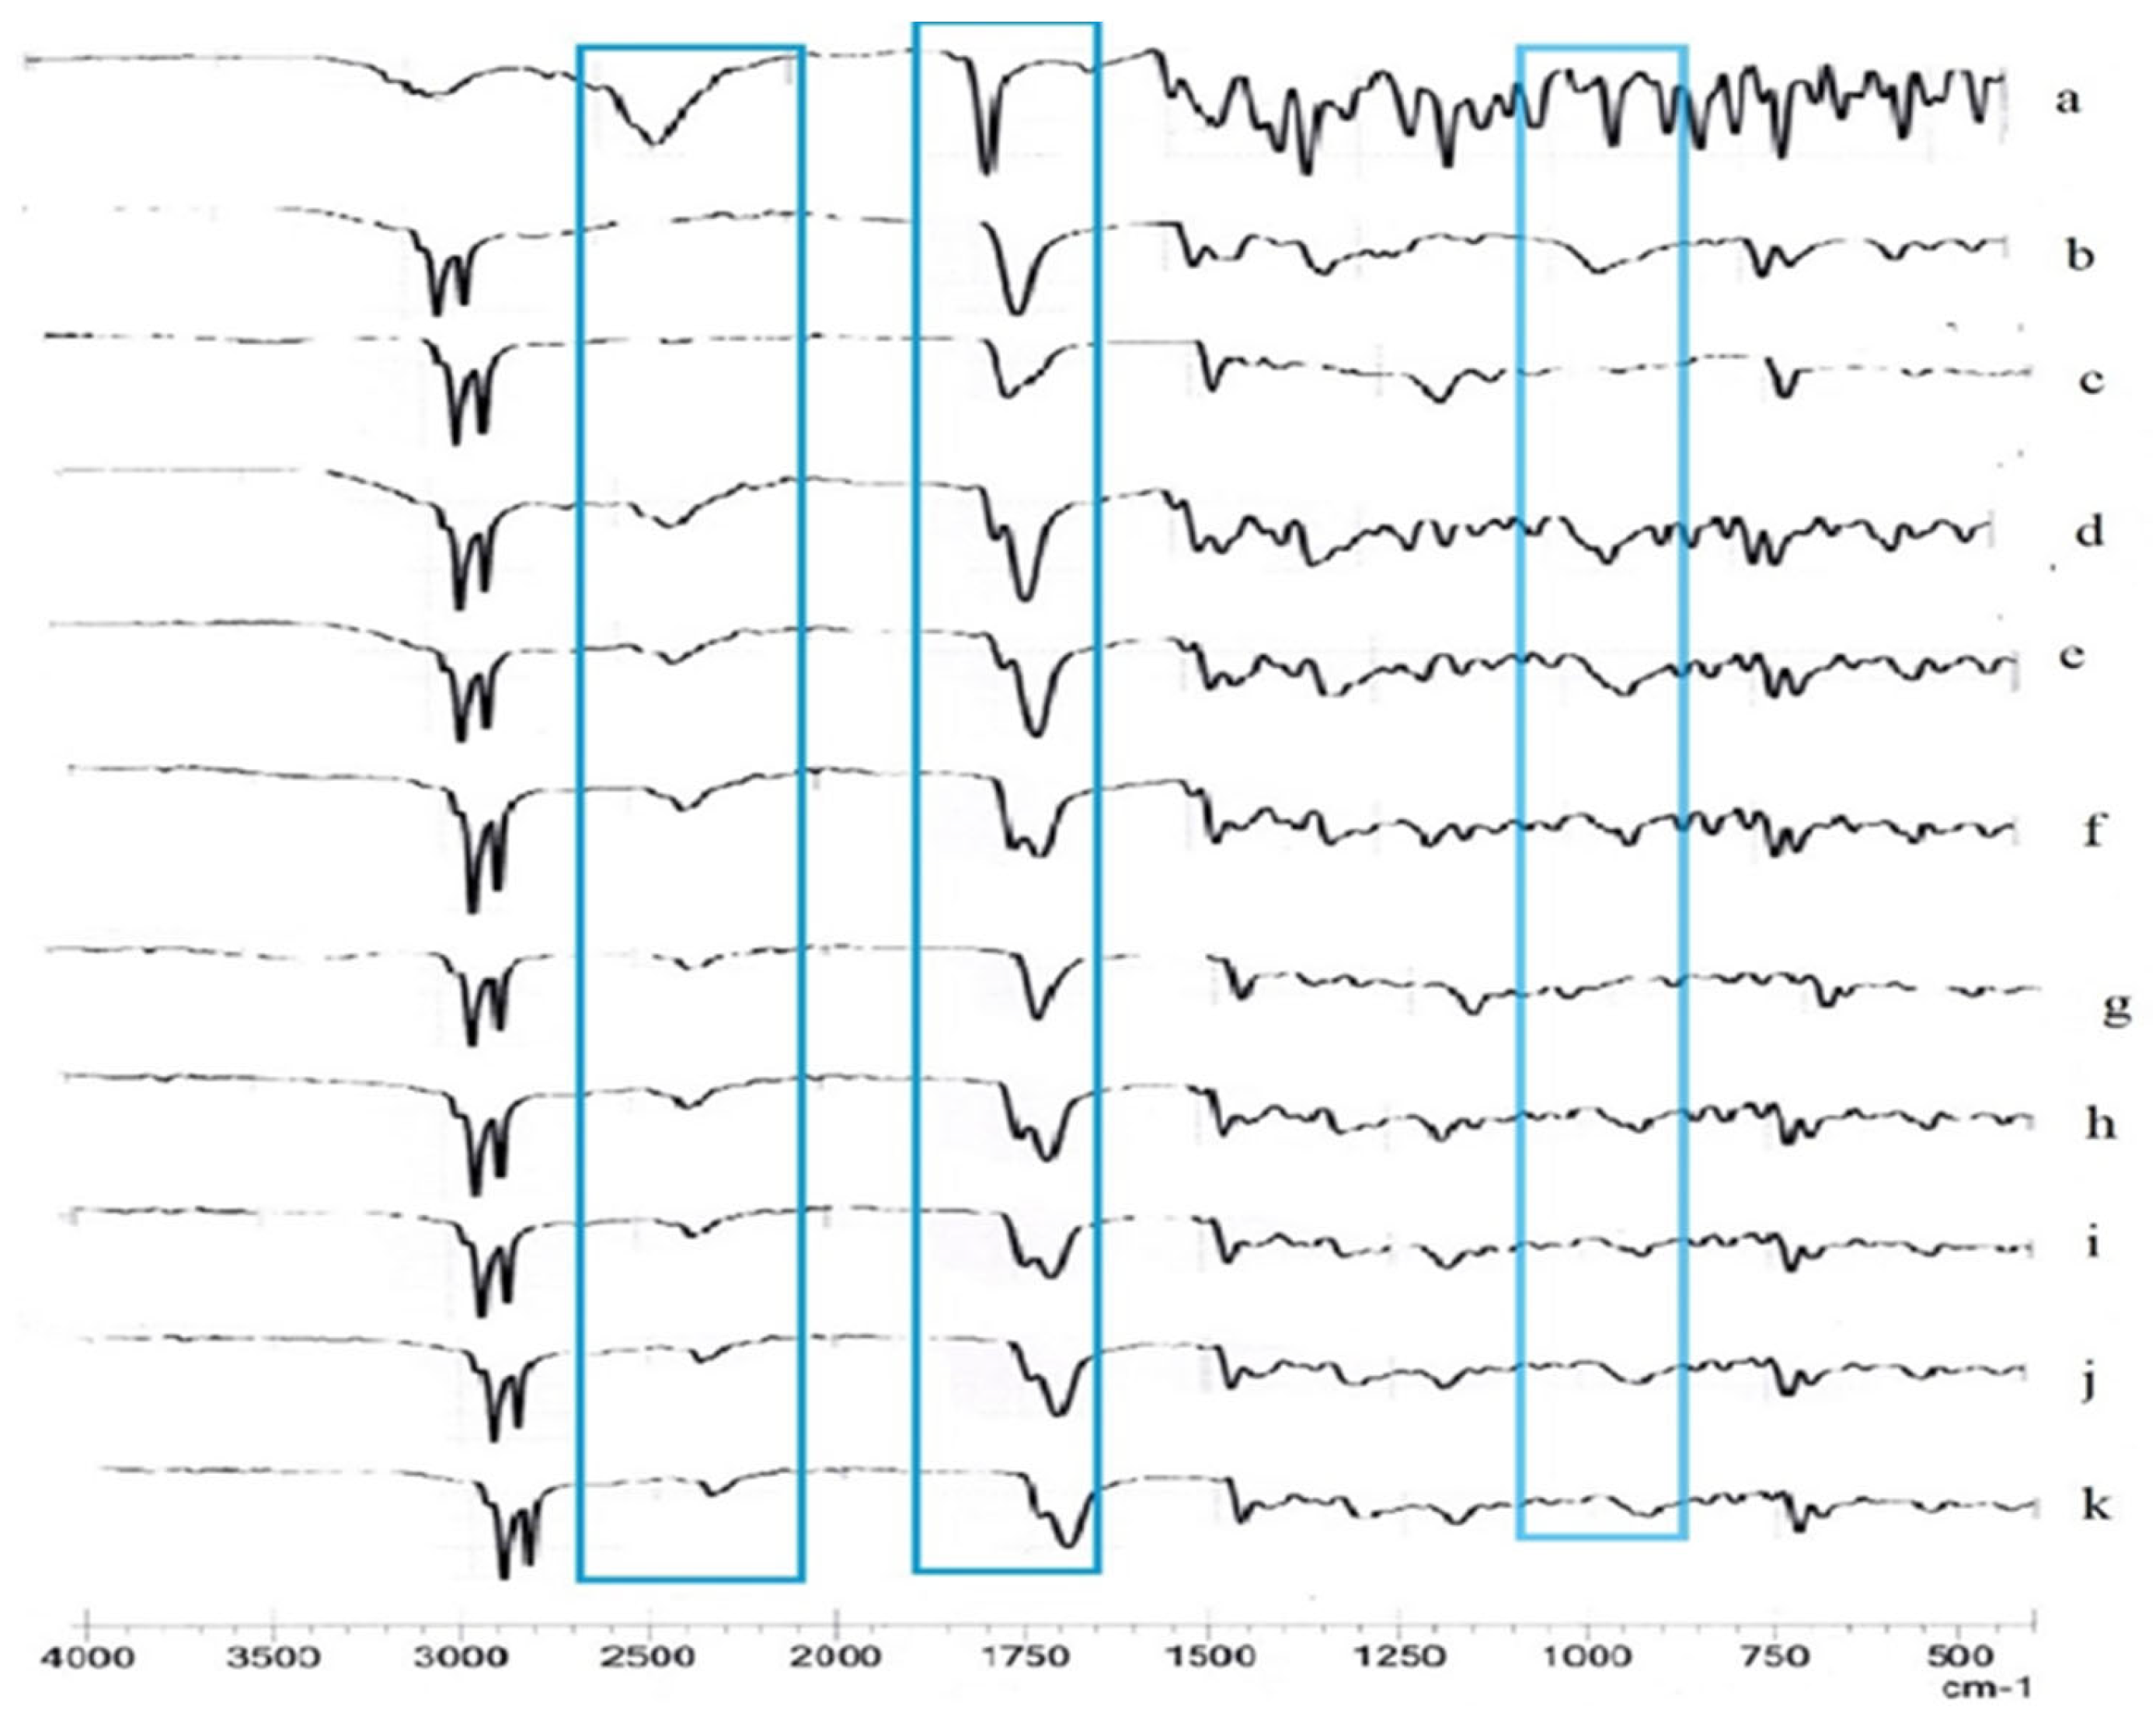
To confirm the formulation of a drug-excipient complex and rule out undesirable chemical interaction, Fourier Transform Infrared spectroscopy was used. The spectra were recorded for pure cetirizine, stearic acid, compritol, and drug-coating complexes. The interactions can be identified through several spectral changes, such as shifts in the position of characteristic absorption peaks, reduction in peak intensities or occurance of new band. Specifically, the carbonyl functional group is known to produce a strong and sharp absorption band in the region of 1680 to 1750 cm. The presented study, as illustrated in Figure 3, the pure form of cetirizine exhibited a prominent and well-defined absorption peak at 1741 cm−1, confirming the presence of carbonyl stretching vibrations, consistent with literature reports [23]. Furthermore, Cetirizine Dihydrochloride demonstrated notable absorption bands at 757.13 cm−1; 1312.37 cm−1, 1055.66 cm−1 and 1181.48 cm−1. These peaks correspond to the existence of aliphatic chloro-compounds, carboxylic acid, alkyl-substituted ethers, and tertiary amines, indicating the chemical structure and functional diversity of the drug molecule [22].
However, when the drug was incorporated into complexes (represented by spectra d, e, f, g, h, i, j, and k), significant changes were observed in the FTIR profiles compared to those of the pure drug. Notably, either a marked reduction in intensity or complete disappearance of the characteristic peaks was detected. In particular, the absorption bands at 1741 cm−1 (carbonyl stretching), 2362 cm−1, 757.13 cm−1; 1312.37 cm−1, 1055.66 cm−1 and 1181.48 cm−1appeared considerably less intense or were altogether absent in the spectra of the complexes [22]. Such observations strongly suggest the successful formation of a drug–coating material complex. Moreover, the absence or diminished intensity of other characteristic peaks in the spectra could be attributed to two primary factors. First, the relatively low weight proportion of drug in the physical mixture may have led to reduced spectral detectability. Second, partial complexation between the drug and the coating materials might have altered or masked certain functional groups, thus leading to the observed spectral changes.
Figure 3.
FTIR spectrum of (a) pure API, (b) stearic acid, (c) compritol 888 ATO, (d) F1, (e) F2, (f) F3, (g)F4, (h) F5, F10, F11, F12, F13, (i) F6, (j) F7, and (k) F8.
Figure 3.
FTIR spectrum of (a) pure API, (b) stearic acid, (c) compritol 888 ATO, (d) F1, (e) F2, (f) F3, (g)F4, (h) F5, F10, F11, F12, F13, (i) F6, (j) F7, and (k) F8.
3.4. Study on the Influence of Stearic Acid and Compritol 888 ATO on Drug Release, In-Vitro Taste-Masking Efficiency, and Drug Content
The taste-masking effectiveness of coating agents—stearic acid and compritol 888 ATO—was initially evaluated at different concentrations. The response analyzed by Minitab software, and a contour plot, main effect plot, and pareto chart were obtained. As per the main effect plot for in-vitro taste masking efficiency, both stearic acid and compritol 888 ATO significantly affect drug release in a non-linear fashion. Based on the contour plot and main effect plot, which illustrate the in-vitro taste masking efficiency as a function of compritol 888 ATO and stearic acid concentration, it has been concluded that as the concentration of stearic acid increases from very low values, taste masking efficiency tends to increase. However, at very high concentrations of stearic acid, the taste masking efficiency appears to plateau or even slightly decrease. At lower to medium concentrations of compritol 888 ATO, the taste masking efficiency increases and after certain concentration the efficiency tends to decreases, as shown in Figure 4(a) and 4 (b). Based on Pareto chart given in Figure 4 (c), the quadratic effect of stearic acid (AA) and compritol 888 ATO (BB) are statistically significant, as both exceed or about to exceed the threshold. Other terms (A, B, AB) are below the line, hence not statistically significant but significant effect was seen when analyzed quantitatively and qualitatively. The in-vivo and invitro taste evaluation shows effective taste masking when analyzed. The regression equation for in-vitro taste masking is as follows:
In-vitro taste masking efficiency= 30.50 - 3.203 stearic acid + 2.312 compritol 888 ATO + 0.0962 stearic acid*stearic acid- 0.0583 compritol 888 ATO*compritol 888 ATO - 0.0020 stearic acid*compritol 888 ATO.
Based on the counterplot and main effect for drug content shown in Figure 4(d) and 4(e), there was no significant effect seen on the drug content by the two excipients. Drug content shows a positive trend with increasing concentration, rising from about 99.1% at 0 mg to roughly 99.6% at 30 mg, which indicates the compatibility of coating excipient with API. None of the terms cross the threshold line, indicating no significant effect on drug content as shown in pareto chart in Figure 4(f). The regression equation for drug content is as follow:
drug content =99.93 - 0.136 stearic acid + 0.071 compritol 888 ATO + 0.00549 stearic acid*stearic acid- 0.00045 compritol 888 ATO* compritol 888 ATO - 0.00280 stearic acid*compritol 888 ATO.
Among the tested formulations, Compritol 888 ATO at a concentration of 15 mg per unit demonstrated the most effective taste-masking efficiency, which is formulation F3 as shown in the bar diagram Figure 5. In contrast, Formulation F9, which contained 0% concentration of both stearic acid and Compritol 888 ATO, showed poor taste-masking performance.
Similarly, the contour plot visualizes the effect of coting agent concentrations on release property, using color bands, representing different levels of drug release. This contour plot supports the findings from the main effects plot, confirming a non-linear interaction between the two excipients on drug release behavior. The main effect plot for the drug release displays the average percentage of drug release in relation to the concentration of two excipients. Drug release increases initially with excipient concentration, peaks, and then decreases. The optimal concentration for maximum drug release lies between 10 -15 mg for both excipients as shown in the main effect and contour plot. Higher concentration(>15mg) of these lipid-based excipients likely forms a more hydrophobic matrix, retarding drug release. None of the terms, including AB (interaction of stearic acid × compritol 888 ATO), exceed significance threshold line as shown in pareto chart (Figure 4(k). All terms (A, B, AB, AA, BB) are below the threshold, indicating no significant effect on drug release as seen in pareto chart. The contour plot and main effect plot are shown in Figure 4 (i) and 4 (j), respectively. The regression equation for drug release is as follows:
Drug release =89.96 + 0.596 stearic acid + 0.582 compritrol 888 ATO - 0.0099 stearic acid*stearic acid - 0.0111 compritol 888 ATO*compritol 888 ATO - 0.0251 stearic acid*compritol 888 ATO.
The overlaid contour plot shows the combined effect of stearic acid and compritol 888 ATO on drug release, in-vitro taste masking efficiency and drug content. Increasing the concentration of stearic acid and compritol 888 ATO generally reduces drug release, while improving taste masking efficiency due to stronger lipid coating. Drug content remains within acceptable limits across the design space. The overlapping region of contour plot as given in Figure 6, represents the optimized formulation zone where targeted drug release, effective taste masking and acceptable drug content are achieved.
3.5. In-Vitro Dissolution Study
The cumulative % drug released versus time was analyzed and the results obtained for the formulations are shown in Figure 7. The dissolution was found to increase rapidly in F9 in the first 15 minutes (≈95%) compared to all other formulation, which indicate that the coating of API slows down the drug release to some extent. All the formulation shows the drug release ≥60% in 5 minutes and ≥85% in 45 minutes, satisfactorily comply with the pharmacopoeial limit of drug release in 45 minutes, which is Q.NLT 75% of a stated amount of cetirizine dihydrochloride [19].
3.6. Optimization of Formulation
Optimization was done using Minitab software considering the response of drug release, in-vitro taste masking efficiency, and drug content. The optimization plot shows the effect of stearic acid and compritol 888 ATO on the selected responses using a desirability function approach. The red vertical line indicates the optimized levels (stearic acid= 0 mg, compritol= 14.85 mg) with a composite desirability of 0.7287 as shown in the Figure 8.
At these levels, the formulation achieves drug release close to the target, maximum taste-masking efficiency, and acceptable drug content. The given concentration was nearly as same as that of formulation F3. Therefore, formulation F3 was considered as best choice for further study. The taste masking efficiency of the optimized formulation was found to be 59.62%, which was increased up to 74% after compaction and the average drug content was found to be 99.37%.
The cumulative % drug release versus time for the reference (F9) and optimized batch is shown in Figure 9. In 0.1 N HCl medium, F9 showed a faster release (~77% in 5 minutes) compared to the optimized batch (~69% in 5 minutes), indicating that API coating slowed the initial drug release. However, both batches reached similar drug release levels after 45 minutes. This confirms that the coating can effectively delayed drug release in the mouth (pH 6.8) for a short period, while ensuring complete release over time. By delaying drug release for a brief period during disintegration in the mouth, the unpleasant taste of the drug is significantly reduced, enhancing patient compliance. Despite the slower initial release, both formulations showed similar dissolution profiles after 45 minutes, indicating that the coating did not hinder the overall drug release.
Table 4.
Drug content, drug release, and In-vitro taste masking efficiency.
| Batch no. | stearic acid (mg) | compritol 888 ATO (mg) | Drug content (%) |
Drug release (%) |
In-vitro taste masking efficiency (%) |
|---|---|---|---|---|---|
| F1 | 15 | 0 | 98.08 | 98.55 | 19.62 |
| F2 | 30 | 0 | 101.02 | 99.97 | 12.23 |
| F3 | 0 | 15 | 100.47 | 98.25 | 59.62 |
| F4 | 0 | 30 | 101.27 | 98.28 | 46.53 |
| F5 | 15 | 15 | 101.55 | 86.72 | 21.35 |
| F6 | 15 | 30 | 100.99 | 86.99 | 23.76 |
| F7 | 30 | 15 | 101.27 | 87.83 | 53.32 |
| F8 | 30 | 30 | 99.005 | 88.71 | 33.21 |
| F9 | 0 | 0 | 100.75 | 104.85 | 5.54 |
| F10 | 15 | 15 | 98.96 | 100.58 | 20.95 |
| F11 | 15 | 15 | 99.16 | 101.42 | 23.12 |
| F12 | 15 | 15 | 99.87 | 101.15 | 19.63 |
| F13 | 15 | 15 | 97.41 | 100.29 | 21.79 |
3.7. Similarity and Dissimilarity Study
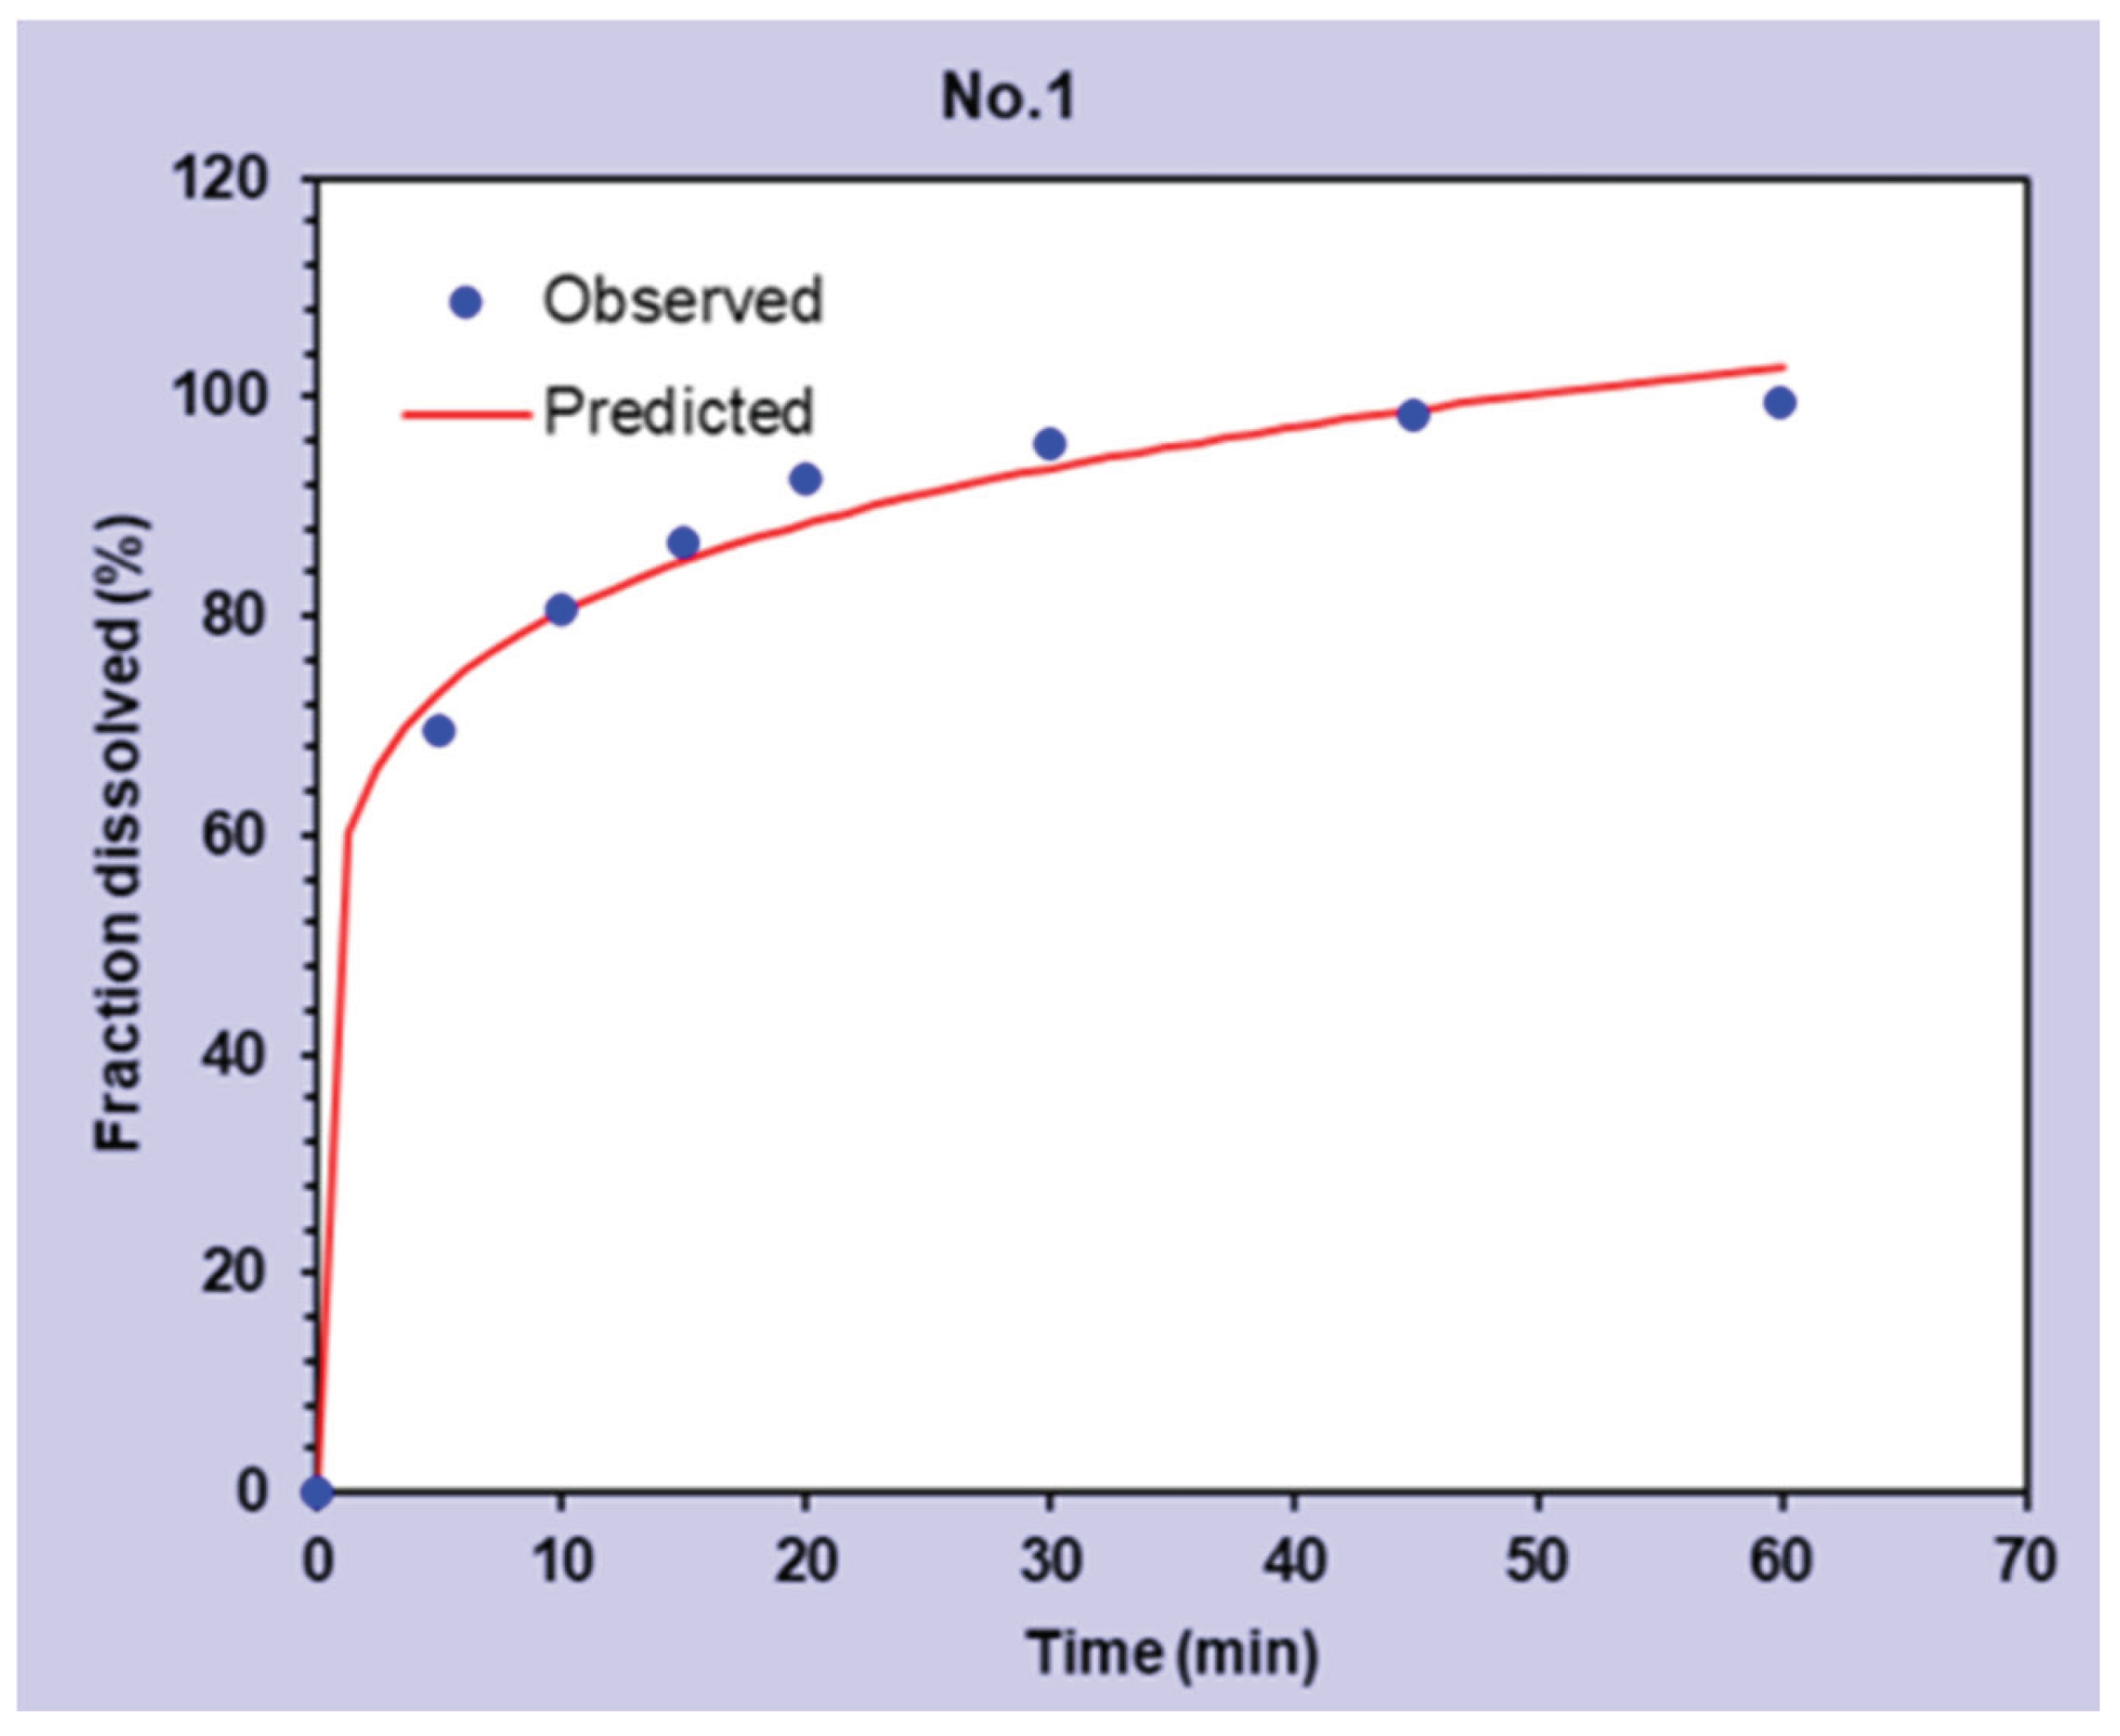
A comparative evaluation was conducted between the drug release of optimized batch and the predicted values to assess the level of similarity between the two drug release data. An f2 value of 50 or higher is generally considered acceptable for similarity, while and f1 value of 10 or lower indicates that the two dissolution profiles are not significantly different (Xie et al., 2015). The result showed that f2 value is 69.0 and f1 value is 2.48. The f2 value is greater than 50 (Xie et al., 2015). It indicated strong likelihood of similarity between the dissolution of optimized formulation and the predicted value. Therefore, the optimized batch can be considered to match closely with the theoretical predictions, validating the reliability and accuracy of the optimization process. The results are summarized in Table 5.
3.8. Drug Release Model Study
To better understand the drug release behavior from the tablets, five different kinetic models—Zero-order, First-order, Higuchi, Hixson–Crowell, and Korsmeyer–Peppas—were applied to the dissolution data. The optimized formulation showed that the drug release kinetic follows the Korsmeyer-Peppas model (“Mathematical Models of Drug Release,” 2015). The value of “n” was determined to be 0.137 in Korsmeyer–Peppas model, suggesting that the drug is released follows a Fickian diffusion-controlled mechanism, meaning the drug diffuses through the polymer matrix without significant relaxation or swelling of the matrix (C2sm27610k, n.d.). The value of ‘k’ was 58.677, and R2 value was 0.9925, showing a good fit. Akaike information criterion (AIC) has a lower value (35.16), and model selection criterion (MSC) was a value close to 3, which indicated better model fit with less complexity. It also showed a good correlation between predicted data and observed data in Korsmeyer–Peppas. The curve rises steeply at first and then gradually levels off, which is characteristic of first-order kinetics. Drug release slows down over time as the concentration of drug remaining in the tablet decreases. R2 value is 0.975, Akaike information criterion (AIC) has a lower value (44.0), and model selection criterion (MSC) has a value below 2, it suggests the model doesn’t fit the data strongly. The first-order model showed a moderate fit, with the predicted trend roughly matching the observed data; however, higher AIC and lower MSC values indicate that the Korsmeyer–Peppas model may better describe the drug release behavior. In contrast, the zero-order, Hixson–Crowell, and Higuchi models exhibited poor fits, as reflected by low or negative R2 values and weak correlation between predicted and observed data.
Figure 10.
Korsmeyer-Peppas drug release model.
4. Conclusions
The study successfully developed a taste-masked orodispersible tablet of cetirizine dihydrochloride using a lipid-based coating technique. The optimized formulation demonstrated effective bitterness masking, rapid disintegration, acceptable drug content, and sufficient mechanical strength. The validated analytical method proved to be precise and reliable. Experimental design and statistical analysis confirmed that both excipients significantly and non-linearly influenced taste masking and drug release behavior, with Compritol® 888 ATO emerging as the more effective taste-masking agent. Thus, the study successfully developed a taste-masked orodispersible tablet of cetirizine dihydrochloride using a lipid-based coating technique. Thus, it has been concluded that stearic acid and compritol 888 ATO can be used in taste masking of bitter drug.
Supplementary Materials
The following supporting information can be downloaded at the website of this paper posted on Preprints.org. Table S1 Accuracy data of Cetirizine Dihydrochloride. Table S2: Intraday precision data of Cetirizine Dihydrochloride. Table S3: Inter-day precision data of Cetirizine Dihydrochloride. Table S4: Formulation table for single tablet. Table S5: Precompression evaluation of formulated powder. Table S6: Post compression evaluation of tablet formulation. Figure S1: Drug release model (A)zero order (B) first order (C) Higuchi model (D) Hixson-Crowell. Figure S2: Sample of finished product of taste masked Cetirizine dihydrochloride orodispersible tablet.
References
- Urbán-Morlán, Z.; Serrano-Mora, L. E.; Martínez-Acevedo, L.; Leyva-Gómez, G.; Mendoza-Muñoz, N.; Quintanar-Guerrero, D. New developments in intrauterine drug delivery systems and devices. In Drug Delivery Devices and Therapeutic Systems; Elsevier, 2021; pp. 601–622. [Google Scholar] [CrossRef]
- Pandita, D.; et al. pH-sensitive polymeric nanocarriers for enhanced intracellular drug delivery. In Smart Polymeric Nano-Constructs in Drug Delivery; Elsevier, 2023; pp. 65–107. [Google Scholar] [CrossRef]
- Dey, P.; Maiti, S. Orodispersible tablets: A new trend in drug delivery. J Nat Sci Biol Med 2010, 1, 2. [Google Scholar] [CrossRef] [PubMed]
- Popa, G.; Gafiţanu, E. Oral disintegrating tablets. A new, modern, solid dosage form. Rev Med Chir Soc Med Nat Iasi 2003, 107, 337–42. [Google Scholar] [PubMed]
- Fu, Y.; Yang, S.; Jeong, S. H.; Kimura, S.; Park, K. Orally Fast Disintegrating Tablets: Developments, Technologies, Taste-Masking and Clinical Studies. Crit Rev Ther Drug Carrier Syst 2004, 21(no. 6), 433–476. [Google Scholar] [CrossRef] [PubMed]
- Changoiwala, N.; Gohel, M. C.; Mehta, K.; Modi, S. C.; Parikh, R. K. Formulation development and optimization of orodispersible tablet of cetrizine hydrochloride. 2012. Available online: www.ijprbs.com.
- Gopaiah, Kv.; Professor, A.; Professor, A. Formulation & Evaluation of Loratadine Hydrochloride Oral Disintegrating Tablets by Direct Compression Method by Using super Disintegrates. International Journal of Research and Analytical Reviews 2020, 7(no. 1). Available online: www.ijrar.org.
- Elawni, A. E.; Osman, Z.; Salih, M.; Elballa, W.; Shayoub, M. Implementation and comparison of different taste masking techniques to design and assess dispersible tablet formulations. Journal of Applied Pharmaceutical Research 2022, 10(no. 4), 1–13. [Google Scholar] [CrossRef]
- Nakano, Y.; Miura, M.; Namiki, N.; Uchida, S. Effects of Flavors on Taste Sensation of Pioglitazone Orally Disintegrating Tablets. Chem Pharm Bull (Tokyo) 2024, 72(no. 11), c24–00425. [Google Scholar] [CrossRef] [PubMed]
- Hari, Kurella; Rajeshwori, Saripiri. Preparation and evaluation of drotaverine hydrochloride orally disintegrating tablets using melt granulation. J Appl Pharm Sci 2018, 8(no. 10), 39–46. [Google Scholar] [CrossRef]
- Cherian, S.; Lee, B. S.; Tucker, R. M.; Lee, K.; Smutzer, G. Toward Improving Medication Adherence: The Suppression of Bitter Taste in Edible Taste Films. Adv Pharmacol Sci 2018, 2018, 1–11. [Google Scholar] [CrossRef] [PubMed]
- Nishiyama, T.; Ogata, T.; Ozeki, T. Preparation of bitter taste-masking granules of lafutidine for orally disintegrating tablets using water-insoluble/soluble polymer combinations. J Drug Deliv Sci Technol 2016, 32, 38–42. [Google Scholar] [CrossRef]
- Guhmann, M.; Preis, M.; Gerber, F.; Pöllinger, N.; Breitkreutz, J.; Weitschies, W. Design, development and in-vitro evaluation of diclofenac taste-masked orodispersible tablet formulations. Drug Dev Ind Pharm 2015, 41(no. 4), 540–551. [Google Scholar] [CrossRef] [PubMed]
- Mahale, S.; Tayde, M.; Ahire, Y. G.; Dhikale, R. S.; Gulecha, V. S. Design and evaluation of cost-effective oro-dispersible tablets of venlafaxine hydrochloride by effervescent method. Journal of Applied Pharmaceutical Research 2024, 12(no. 3), 46–55. [Google Scholar] [CrossRef]
- Drašković, M.; Medarević, D.; Aleksić, I.; Parojčić, J. In vitro and in vivo investigation of taste-masking effectiveness of Eudragit E PO as drug particle coating agent in orally disintegrating tablets. Drug Dev Ind Pharm 2017, 43(no. 5), 723–731. [Google Scholar] [CrossRef] [PubMed]
- Sharma. Development of disintegrating multiple-unit tablets WO. 2009. [Google Scholar]
- A. M. Evans. M. D. H. P. Stefan Lukas, “WO1997039747A1,” 1997 Accessed: Mar. 18, 2025. [Online]. Available online: https://patents.google.com/patent/WO1997039747A1/en.
- Islam, M. S.; Nm, A. A. Formulation Development, Preparation and Evaluation of Taste Masking Orodispersible Tablet of Tiemonium Methylsulfate by using HPMC as Taste Masking Agent. 2019. [Google Scholar]
- The Indian Pharmacopoeia Commission. cetrizine tablet monograph. In Indian pharmacopoeia; 2022; Volume 1, p. 1822. [Google Scholar]
- Khan, M. I.; Murtaza, G.; Awan, S. Development and validation of stability indicating assay method of cetirizine hydrochloride by HPLC. 2018. Available online: www.internationalscholarsjournals.org.
- Pawar, H. A.; Joshi, P. R. Development and Evaluation of Taste Masked Granular Formulation of Satranidazole by Melt Granulation Technique. J Pharm (Cairo) 2014, 2014, 1–7. [Google Scholar] [CrossRef] [PubMed]
- Sharma, D.; Singh, M. Formulation Development and Evaluation of Fast Disintegrating Tablet of Cetirizine Hydrochloride: A Novel Drug Delivery for Pediatrics and Geriatrics. J Pharm (Cairo) 2014, 2014, 1–8. [Google Scholar] [CrossRef] [PubMed]
- Lee, C.-W.; et al. Preparation of bitter taste masked cetirizine dihydrochloride/β-cyclodextrin inclusion complex by supercritical antisolvent (SAS) process. J Supercrit Fluids 2010, 55(no. 1), 348–357. [Google Scholar] [CrossRef]
- Thakur, D.; Sharma, R. Solid dispersion a novel approach for enhancement of solubility and dissolution rate: a review. Indian Journal of Pharmaceutical and Biological Research 2019, 7(no. 03), 05–11. [Google Scholar] [CrossRef]
- Tzakri, T.; et al. Determination of Gastric Water Emptying in Fasted and Fed State Conditions Using a Compression-Coated Tablet and Salivary Caffeine Kinetics. Pharmaceutics 2023, 15(no. 11), 2584. [Google Scholar] [CrossRef] [PubMed]
- Gaglani, R.; Shah, N.; Sheikh, A.; Jain, H.; Meshram, D. B. All rights reserved. International Journal of Pharma Research and Health Sciences 2017, 5(no. 5), 1868–72. [Google Scholar] [CrossRef]
Figure 4.
(A) Contour plot, (B) Main effect plot and (C) Pareto chart of in-vitro taste masking efficiency, (D) Contour plot, (E) Main effect plot and (F) Pareto chart of drug content, and (G) Contour plot, (H) Main effect plot and (I) Pareto chart of drug release.
Figure 4.
(A) Contour plot, (B) Main effect plot and (C) Pareto chart of in-vitro taste masking efficiency, (D) Contour plot, (E) Main effect plot and (F) Pareto chart of drug content, and (G) Contour plot, (H) Main effect plot and (I) Pareto chart of drug release.
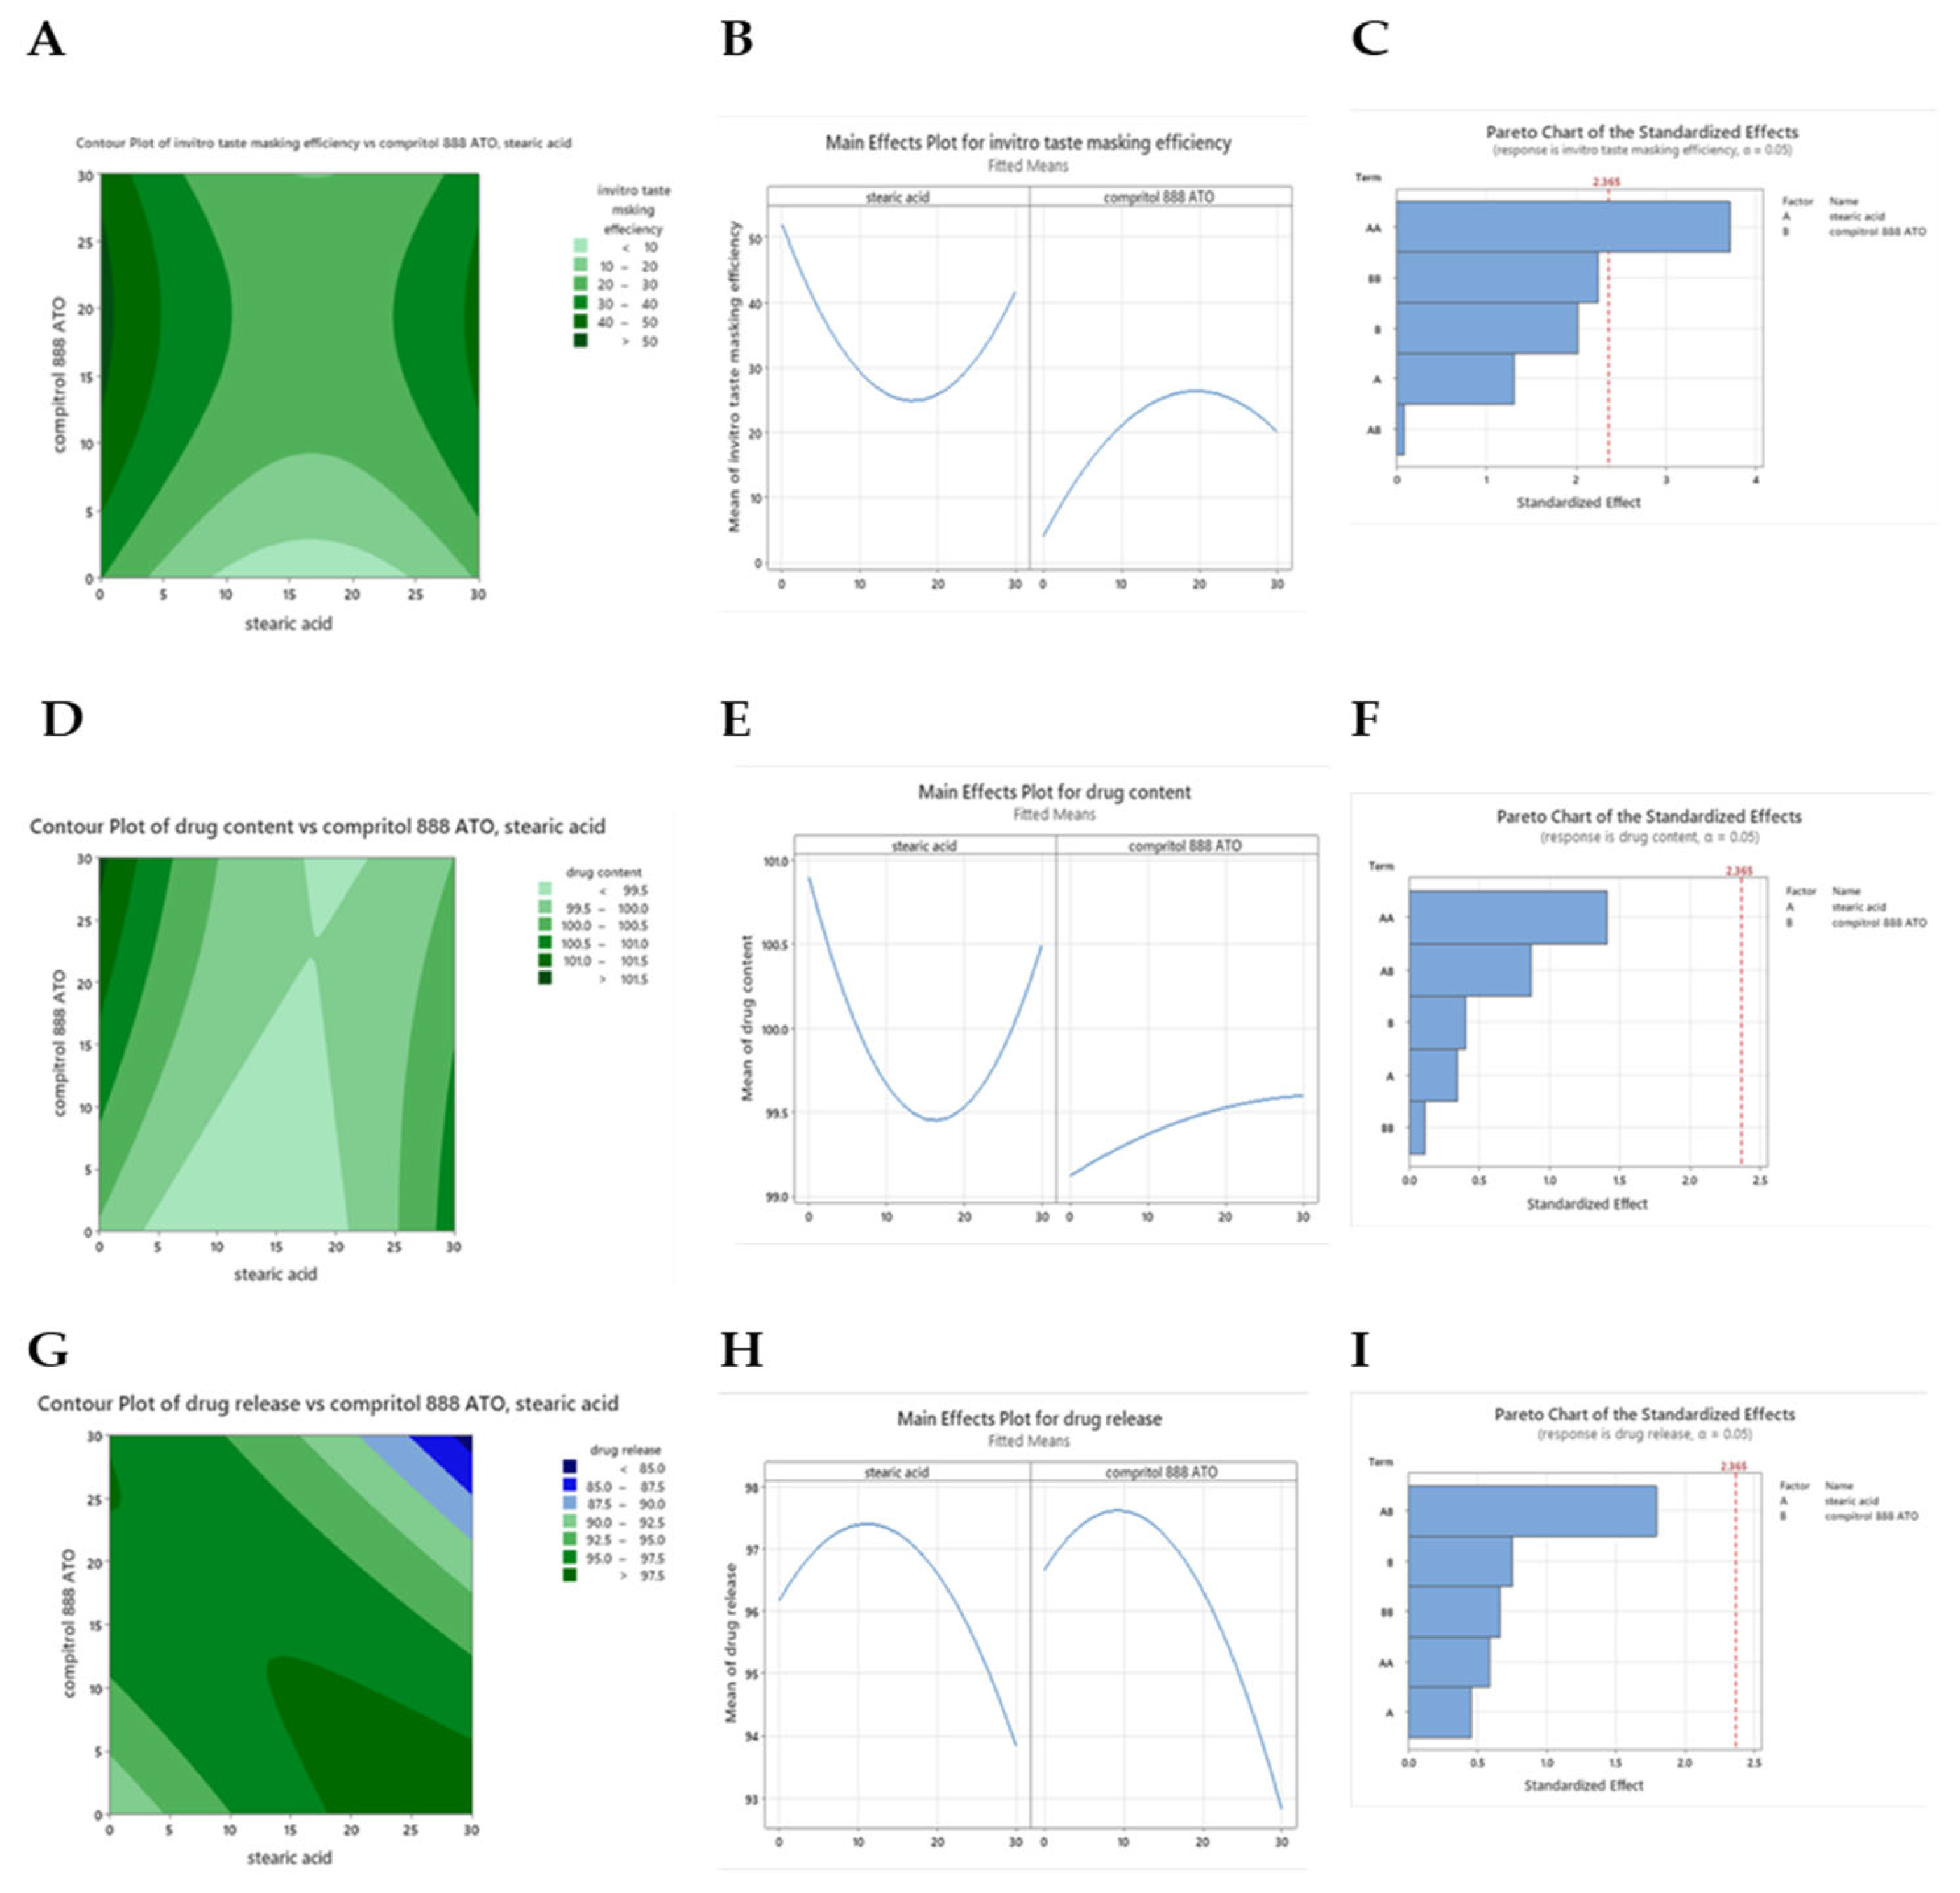
Figure 5.
In-vitro taste masking efficiency.
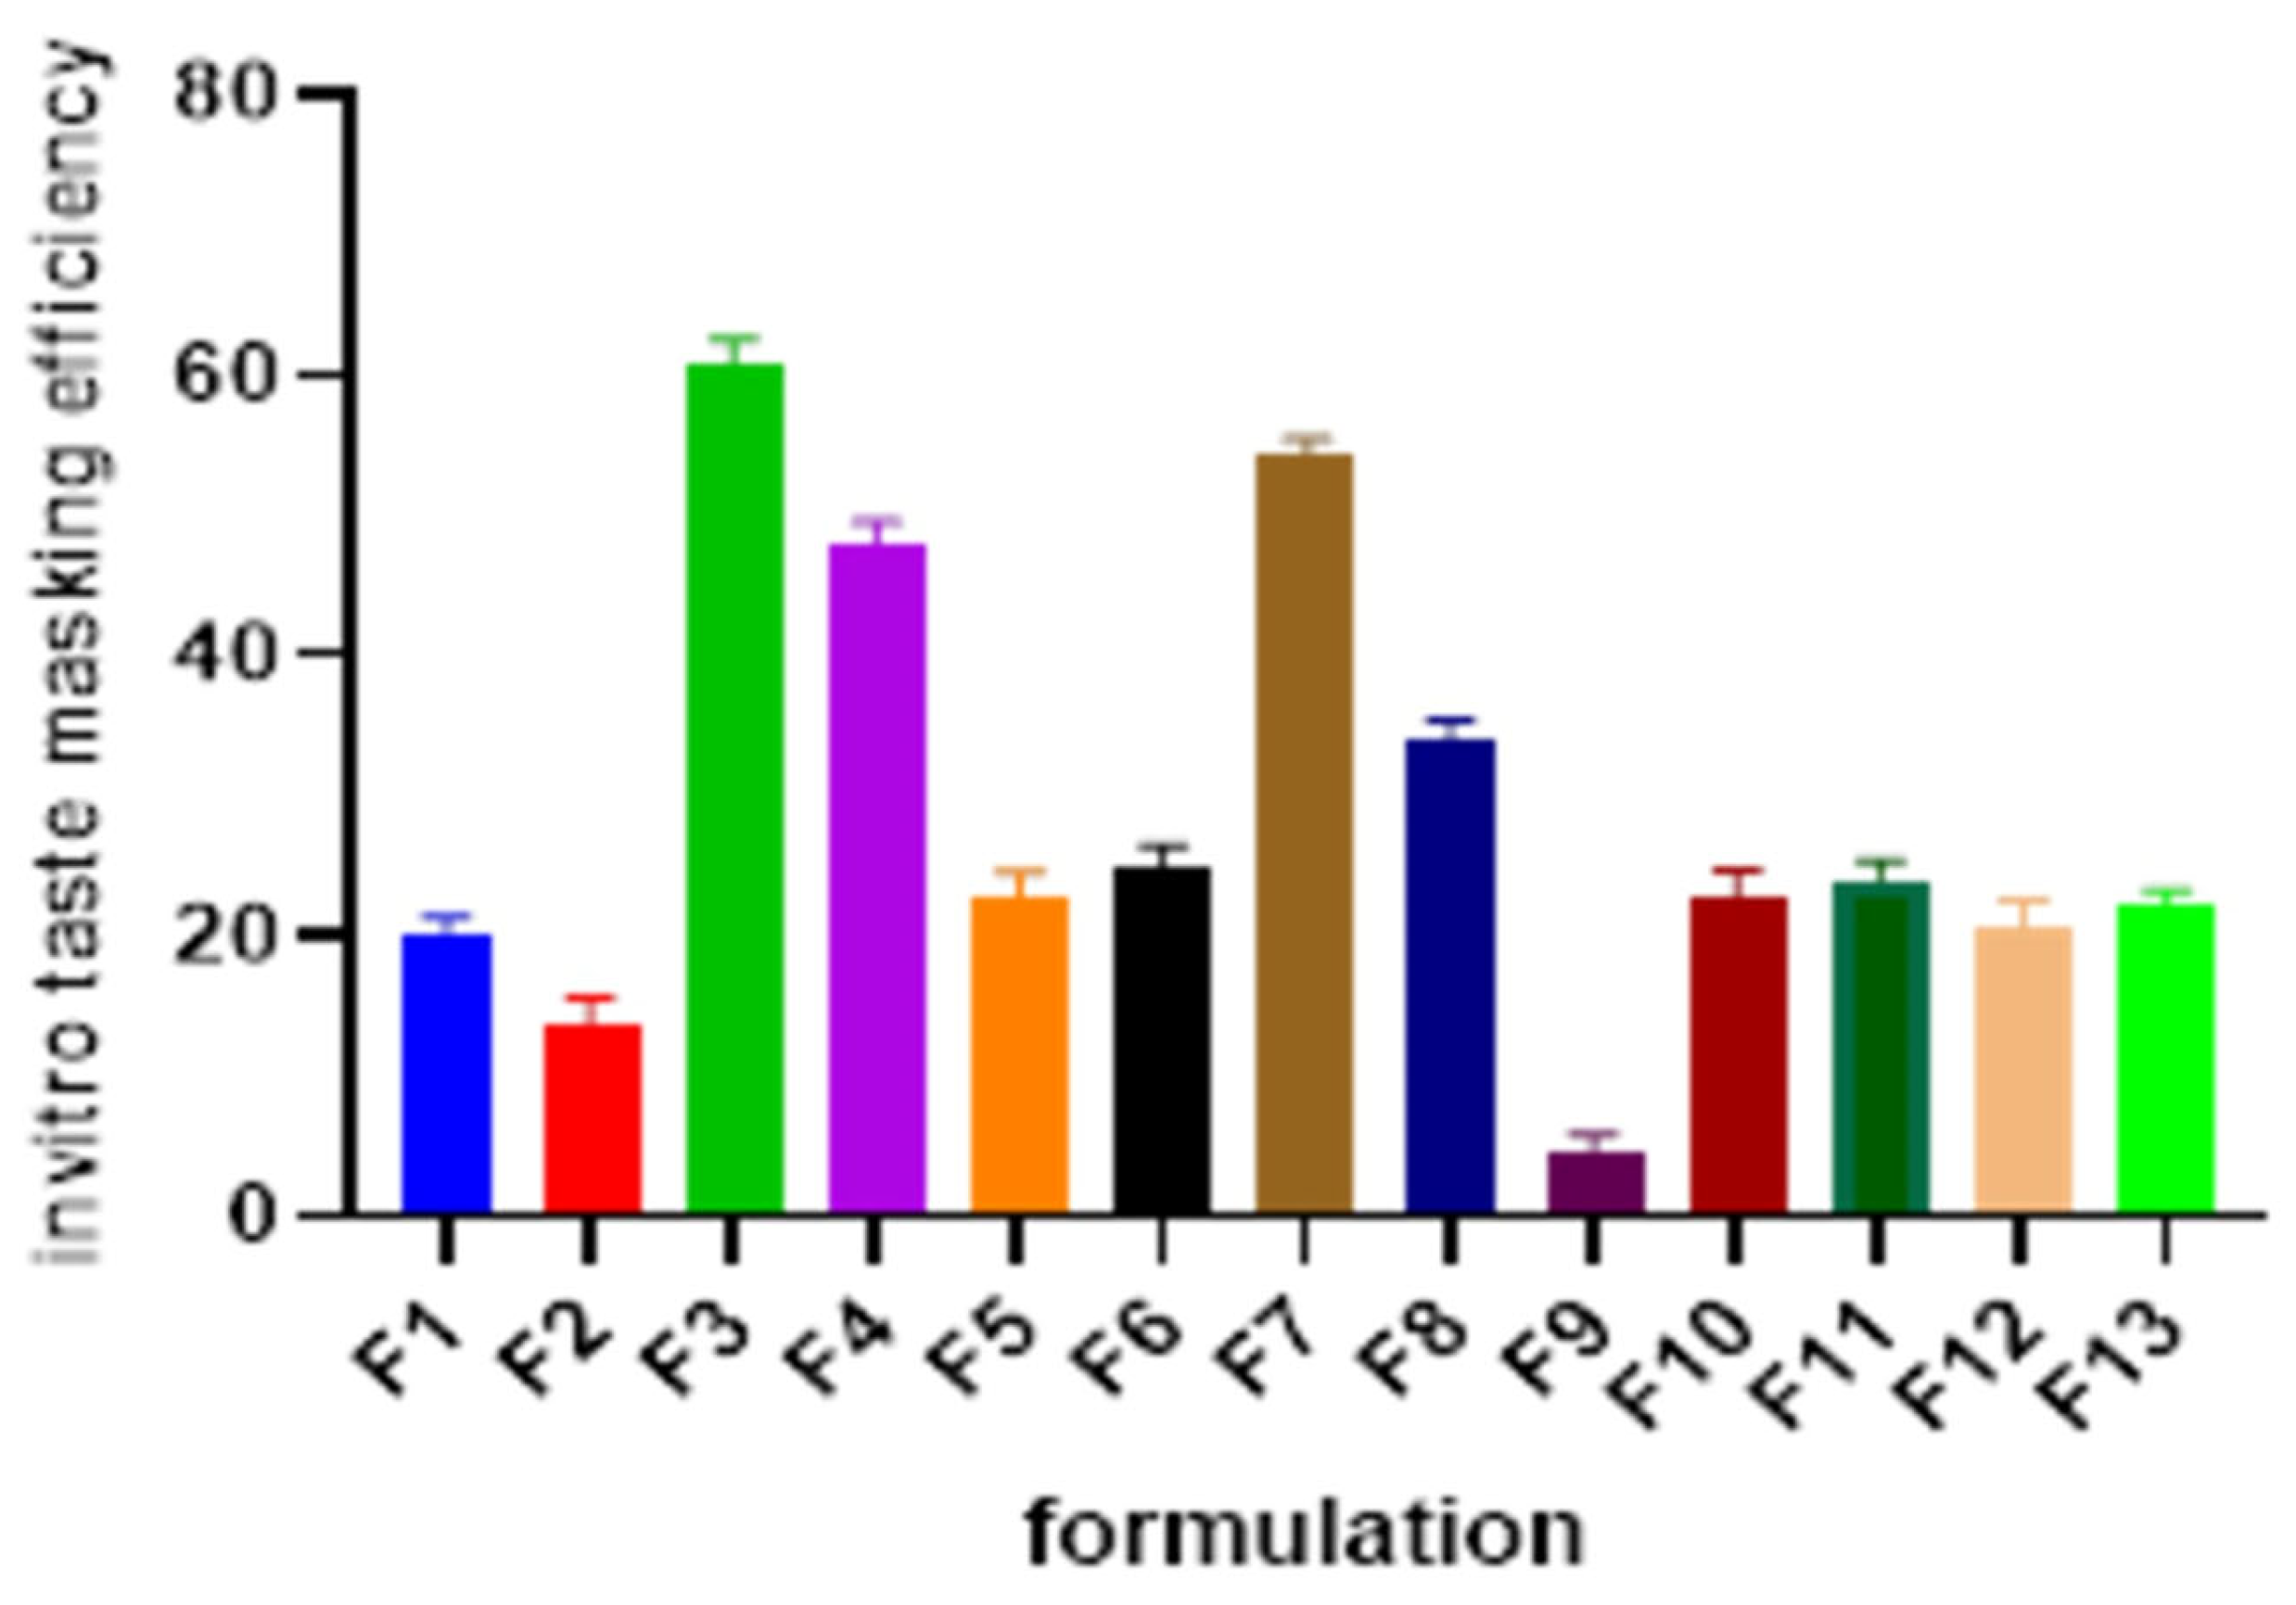
Figure 6.
Overlaid contour plot.
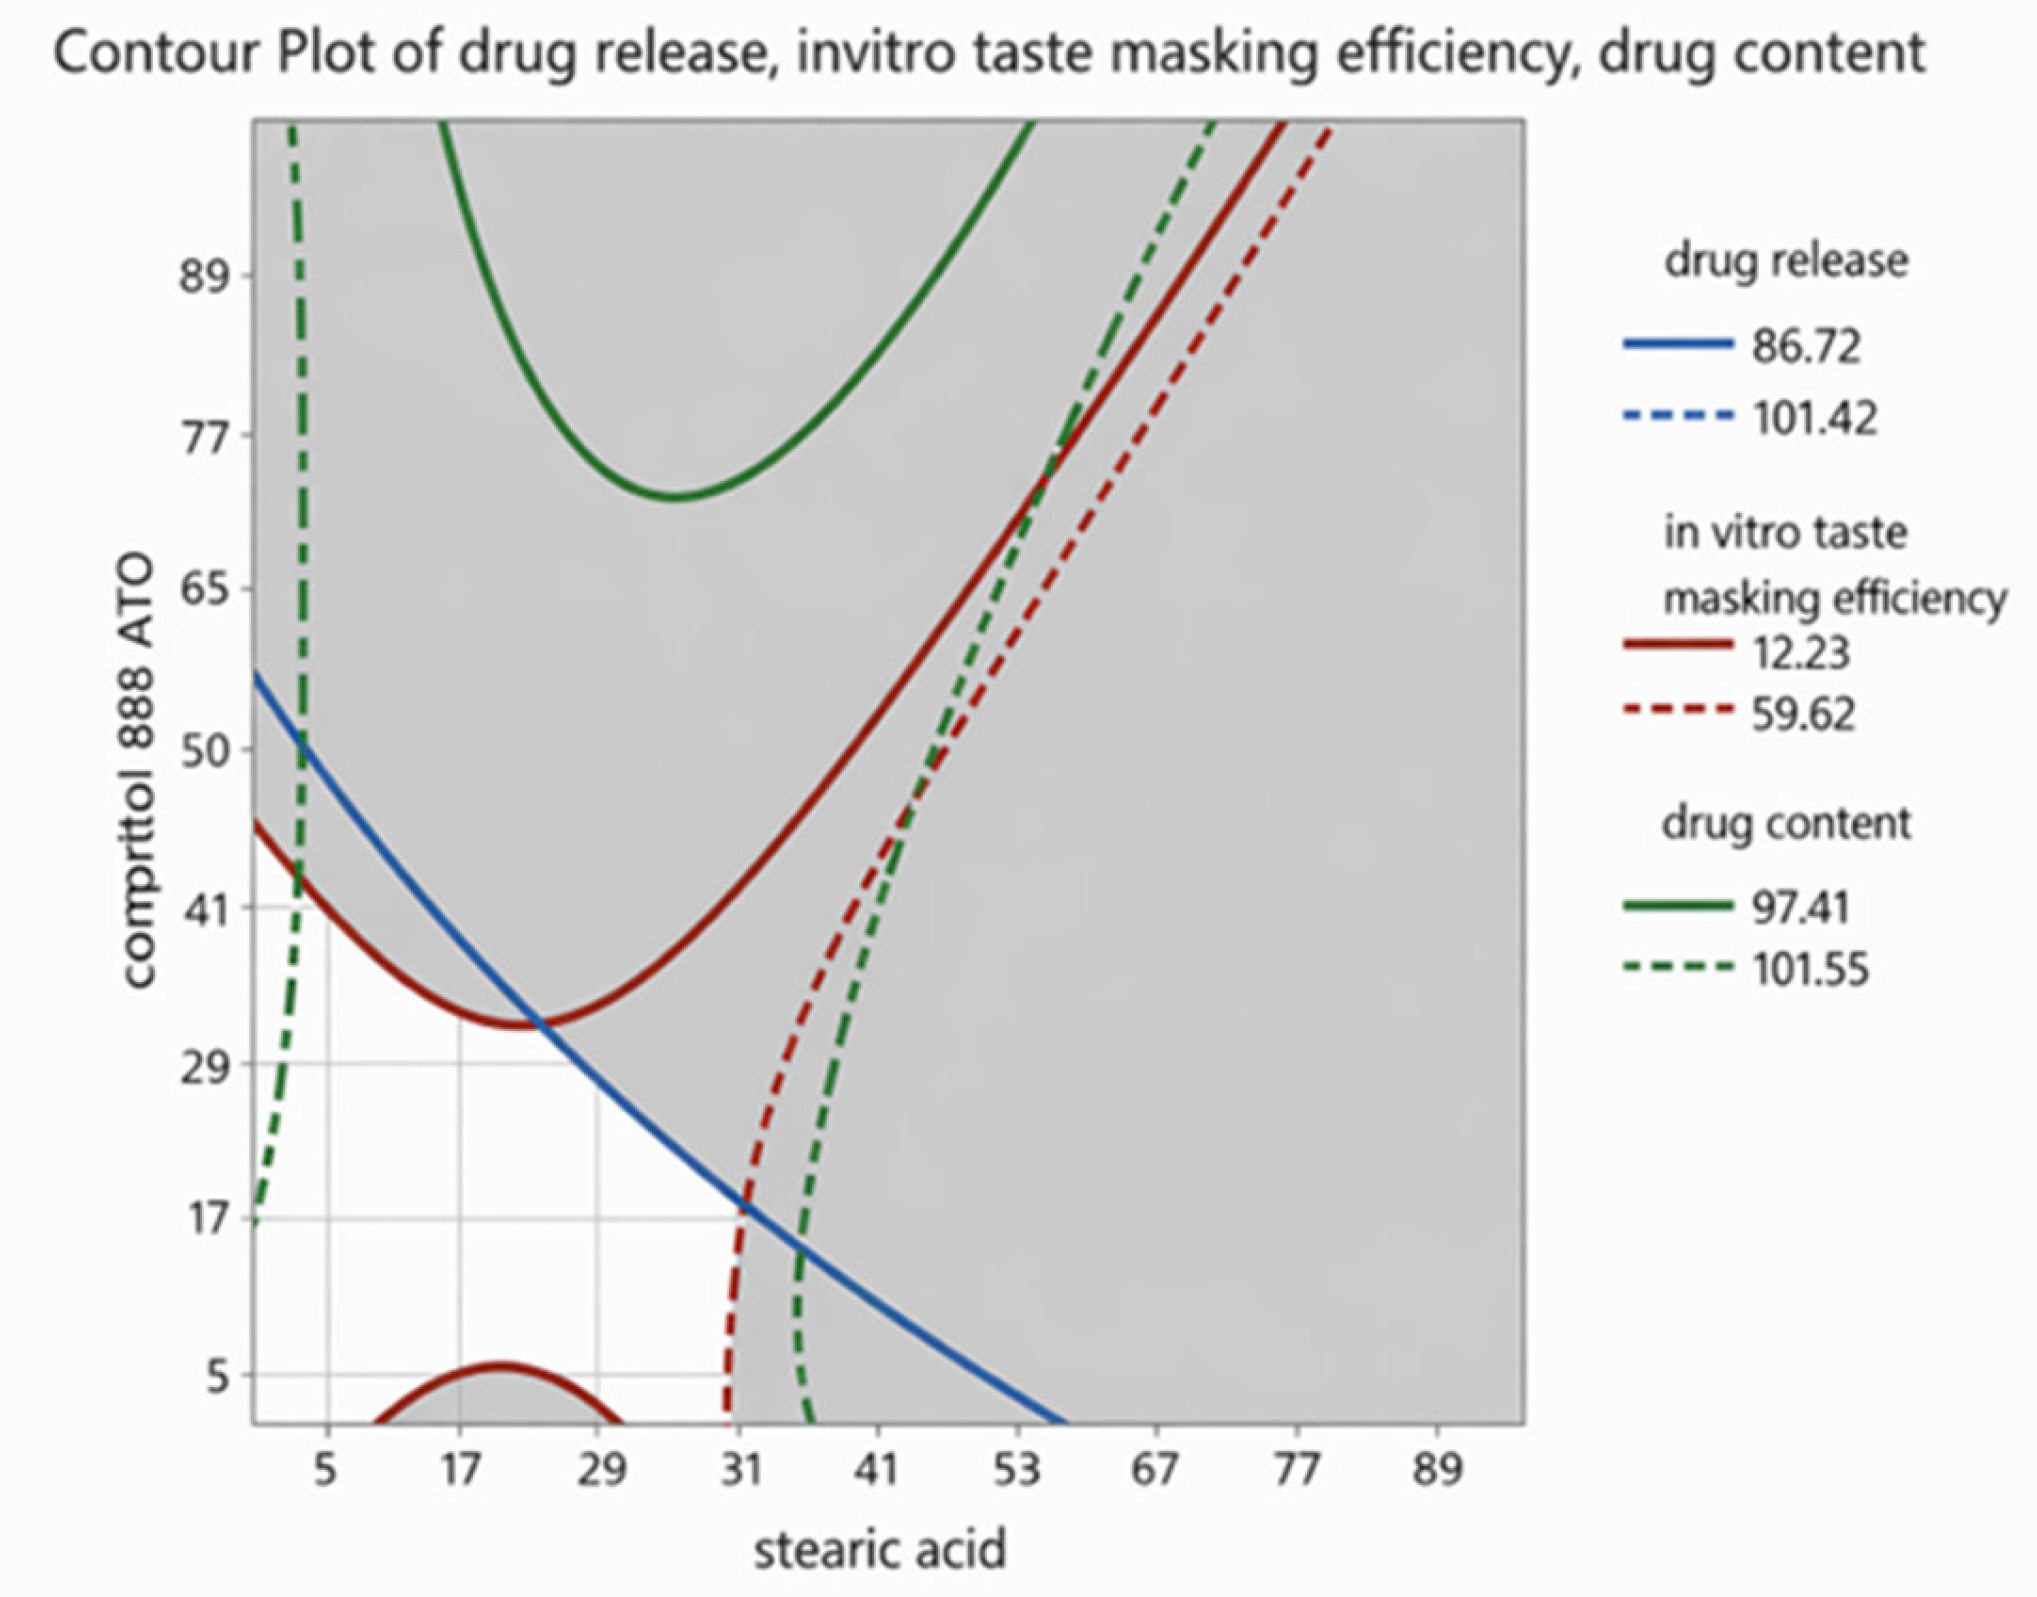
Figure 7.
Cumulative % drug release of Cetirizine Dihydrochloride ODT formulation.
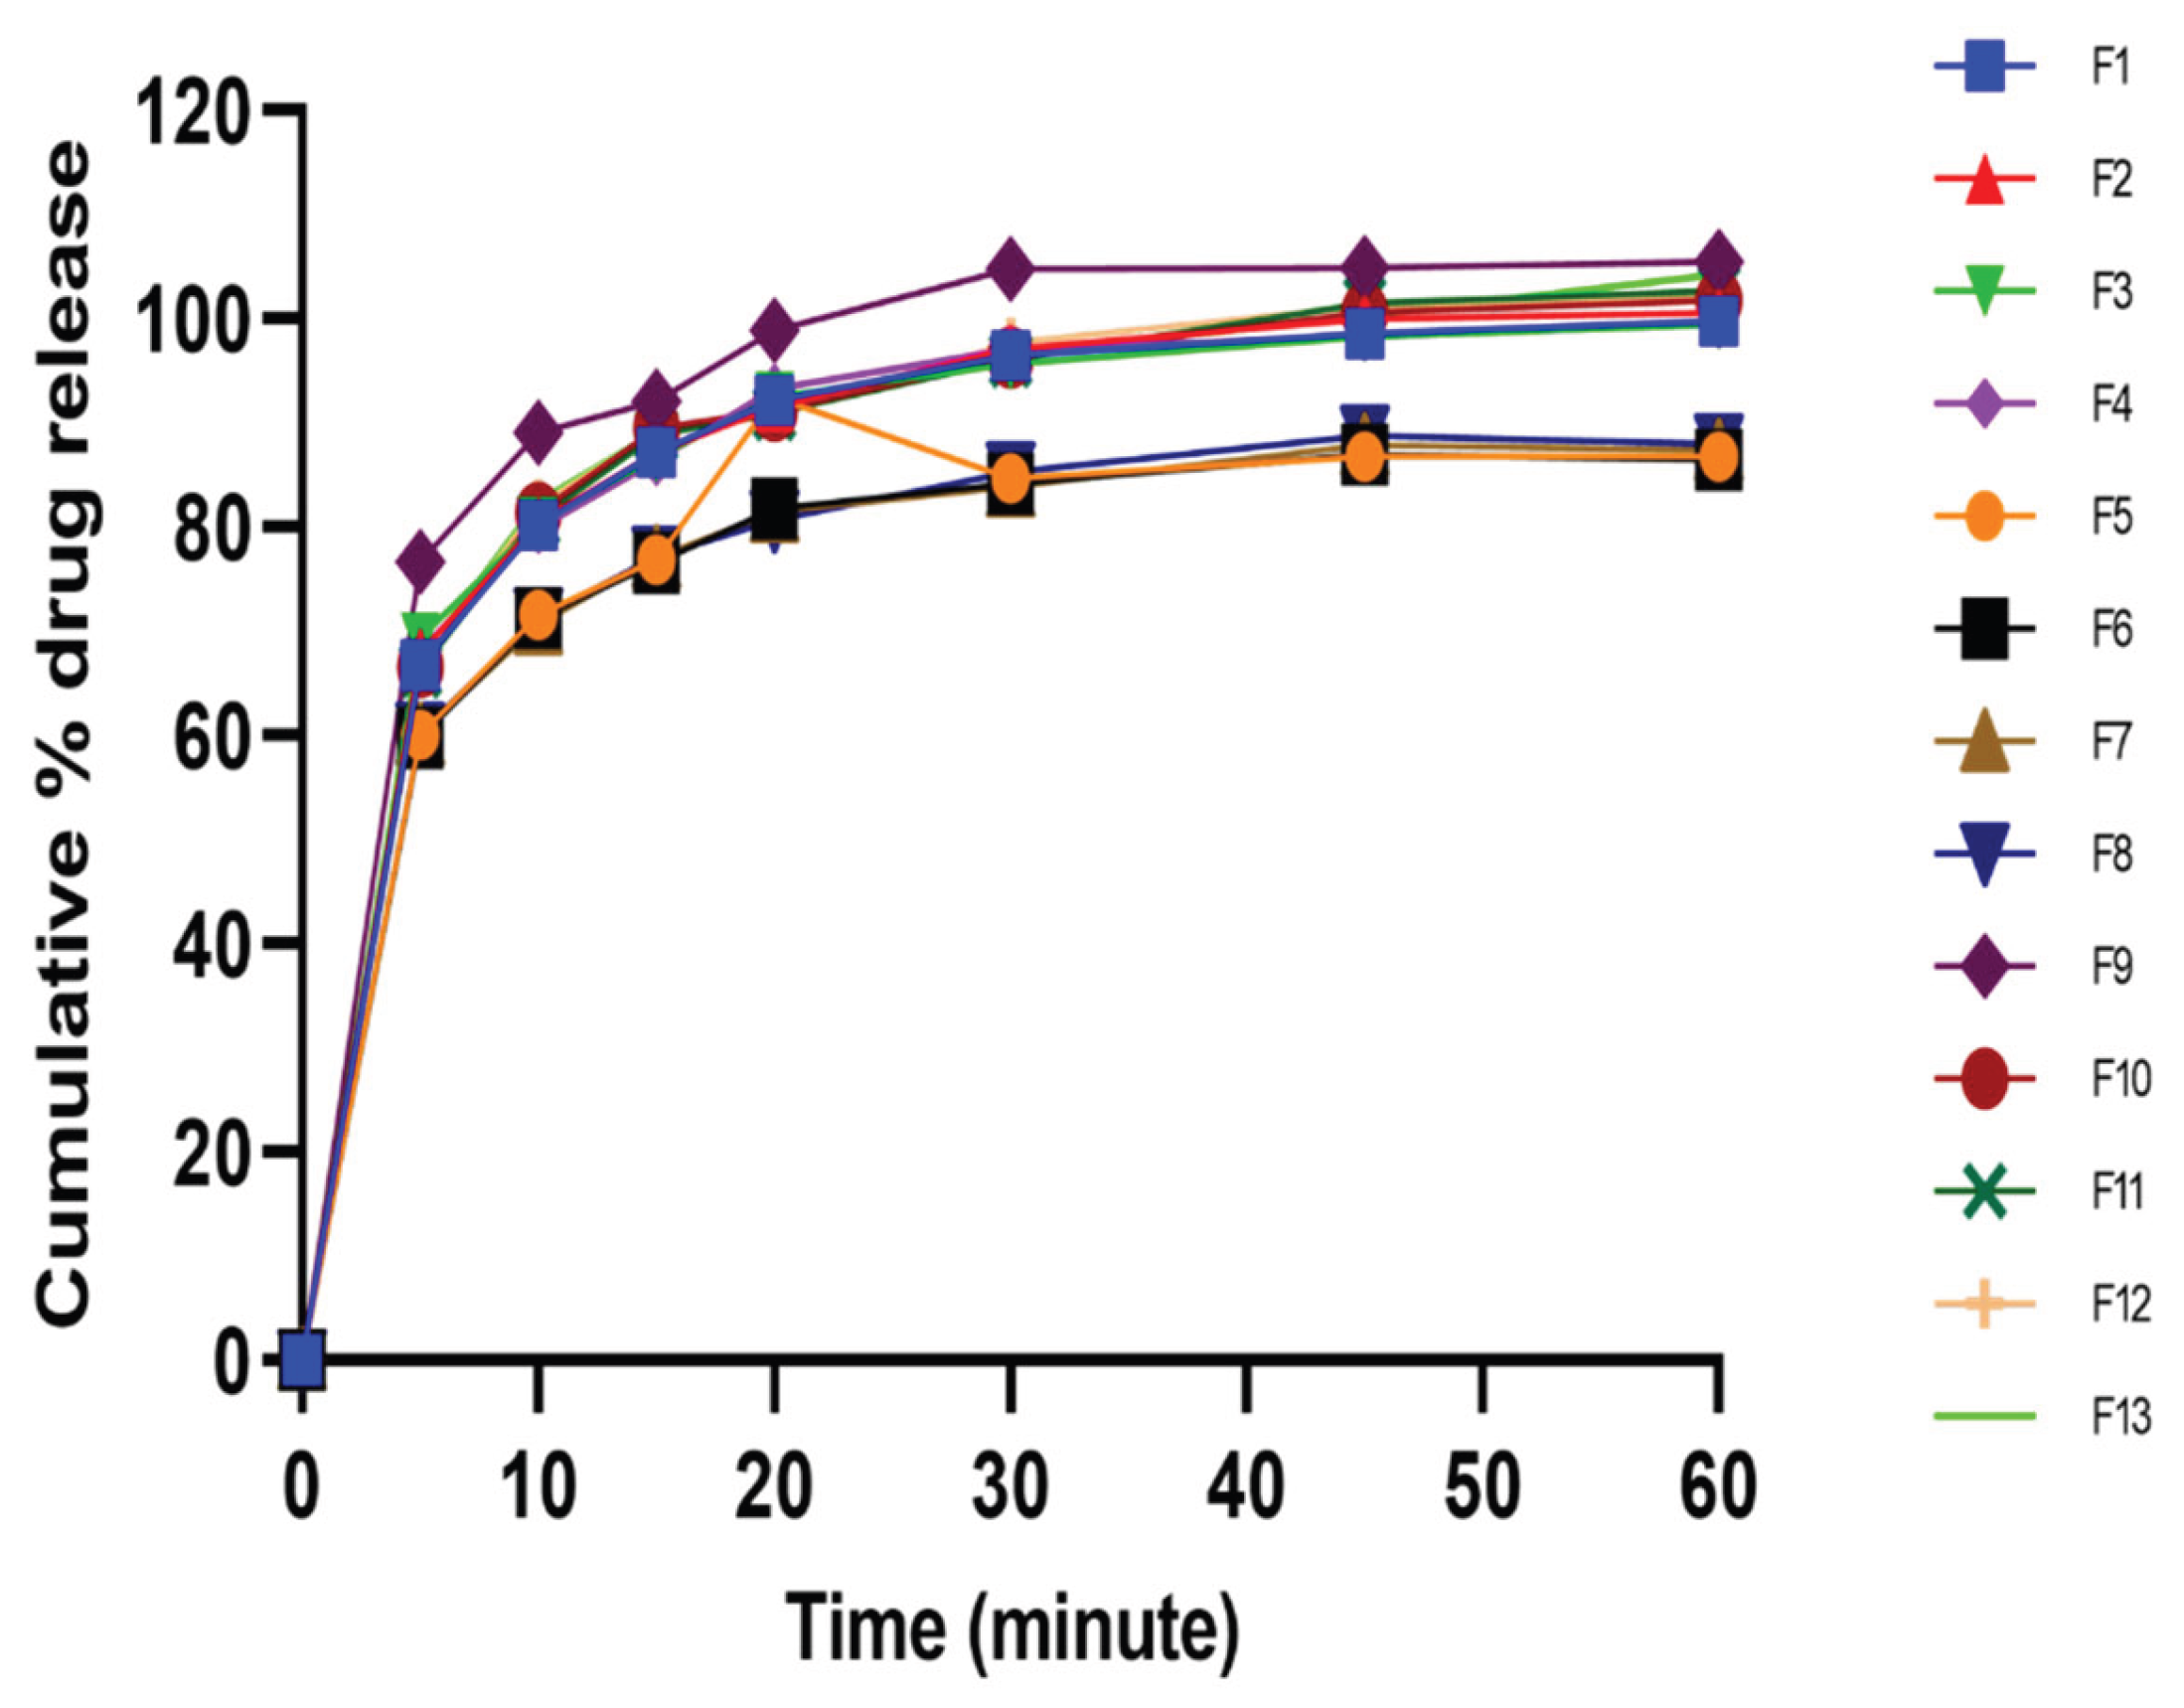
Figure 8.
Optimization plot.
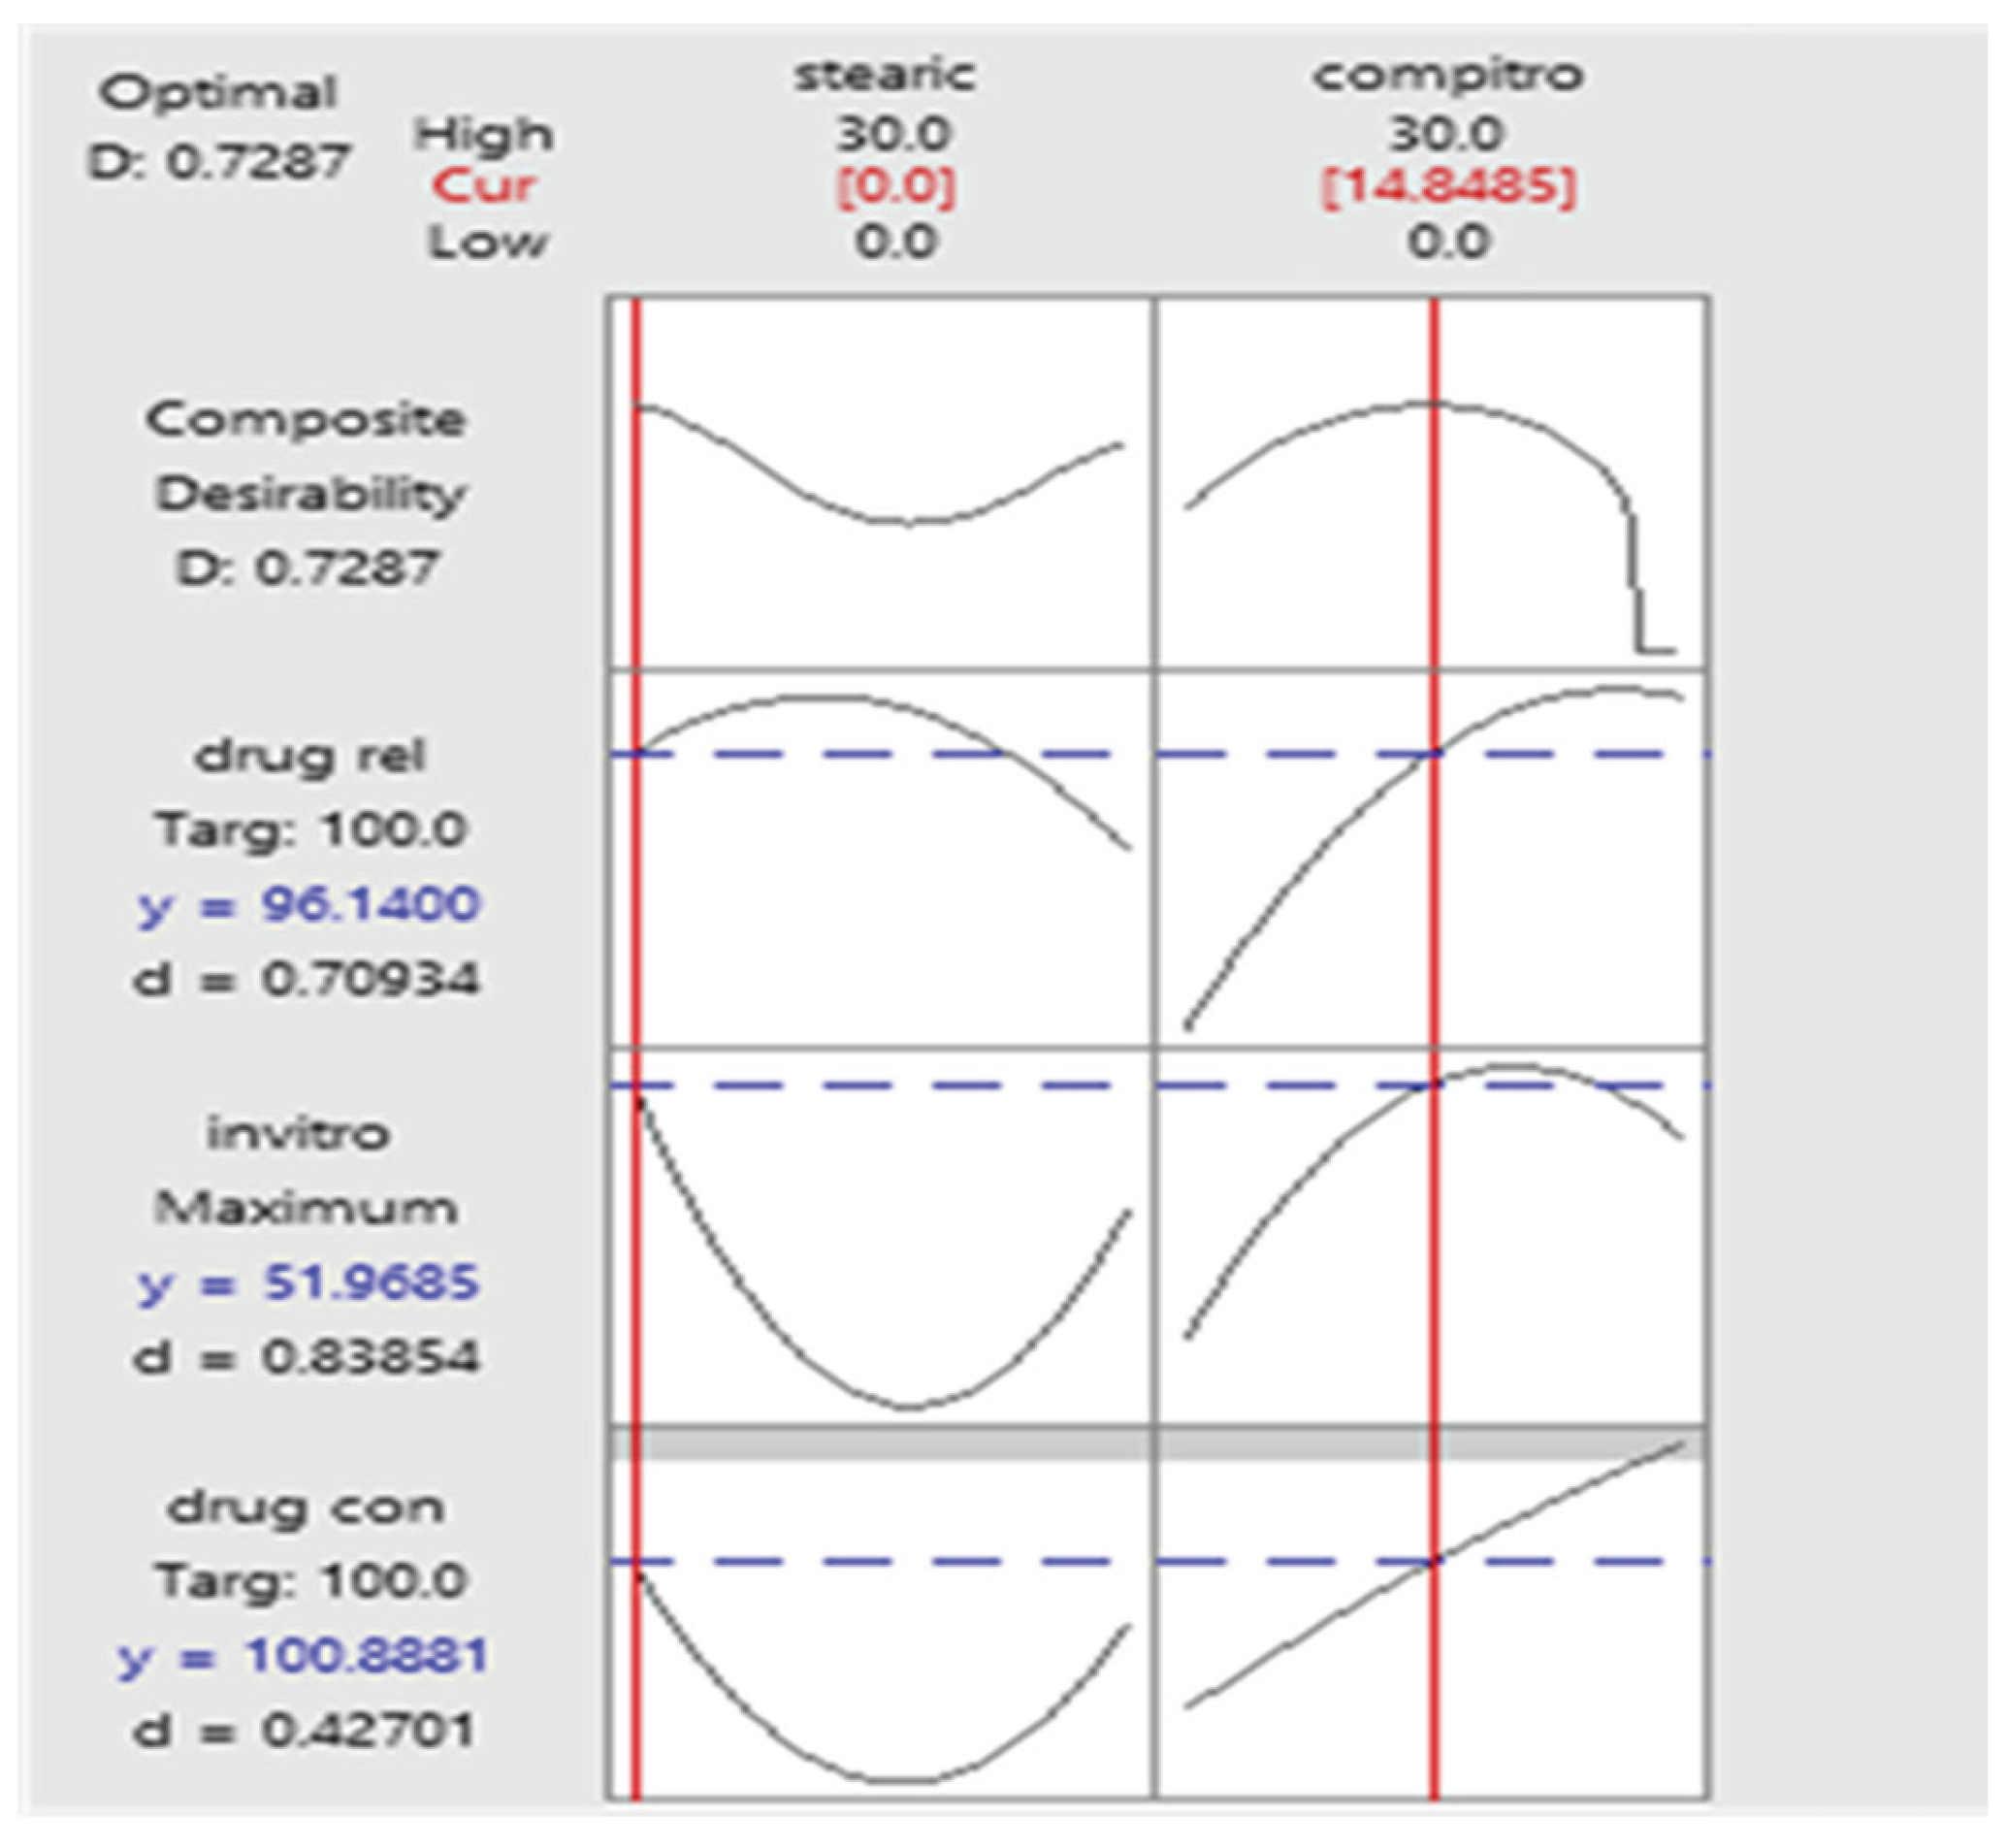
Figure 9.
Cummulative % drug release of optimized batch.
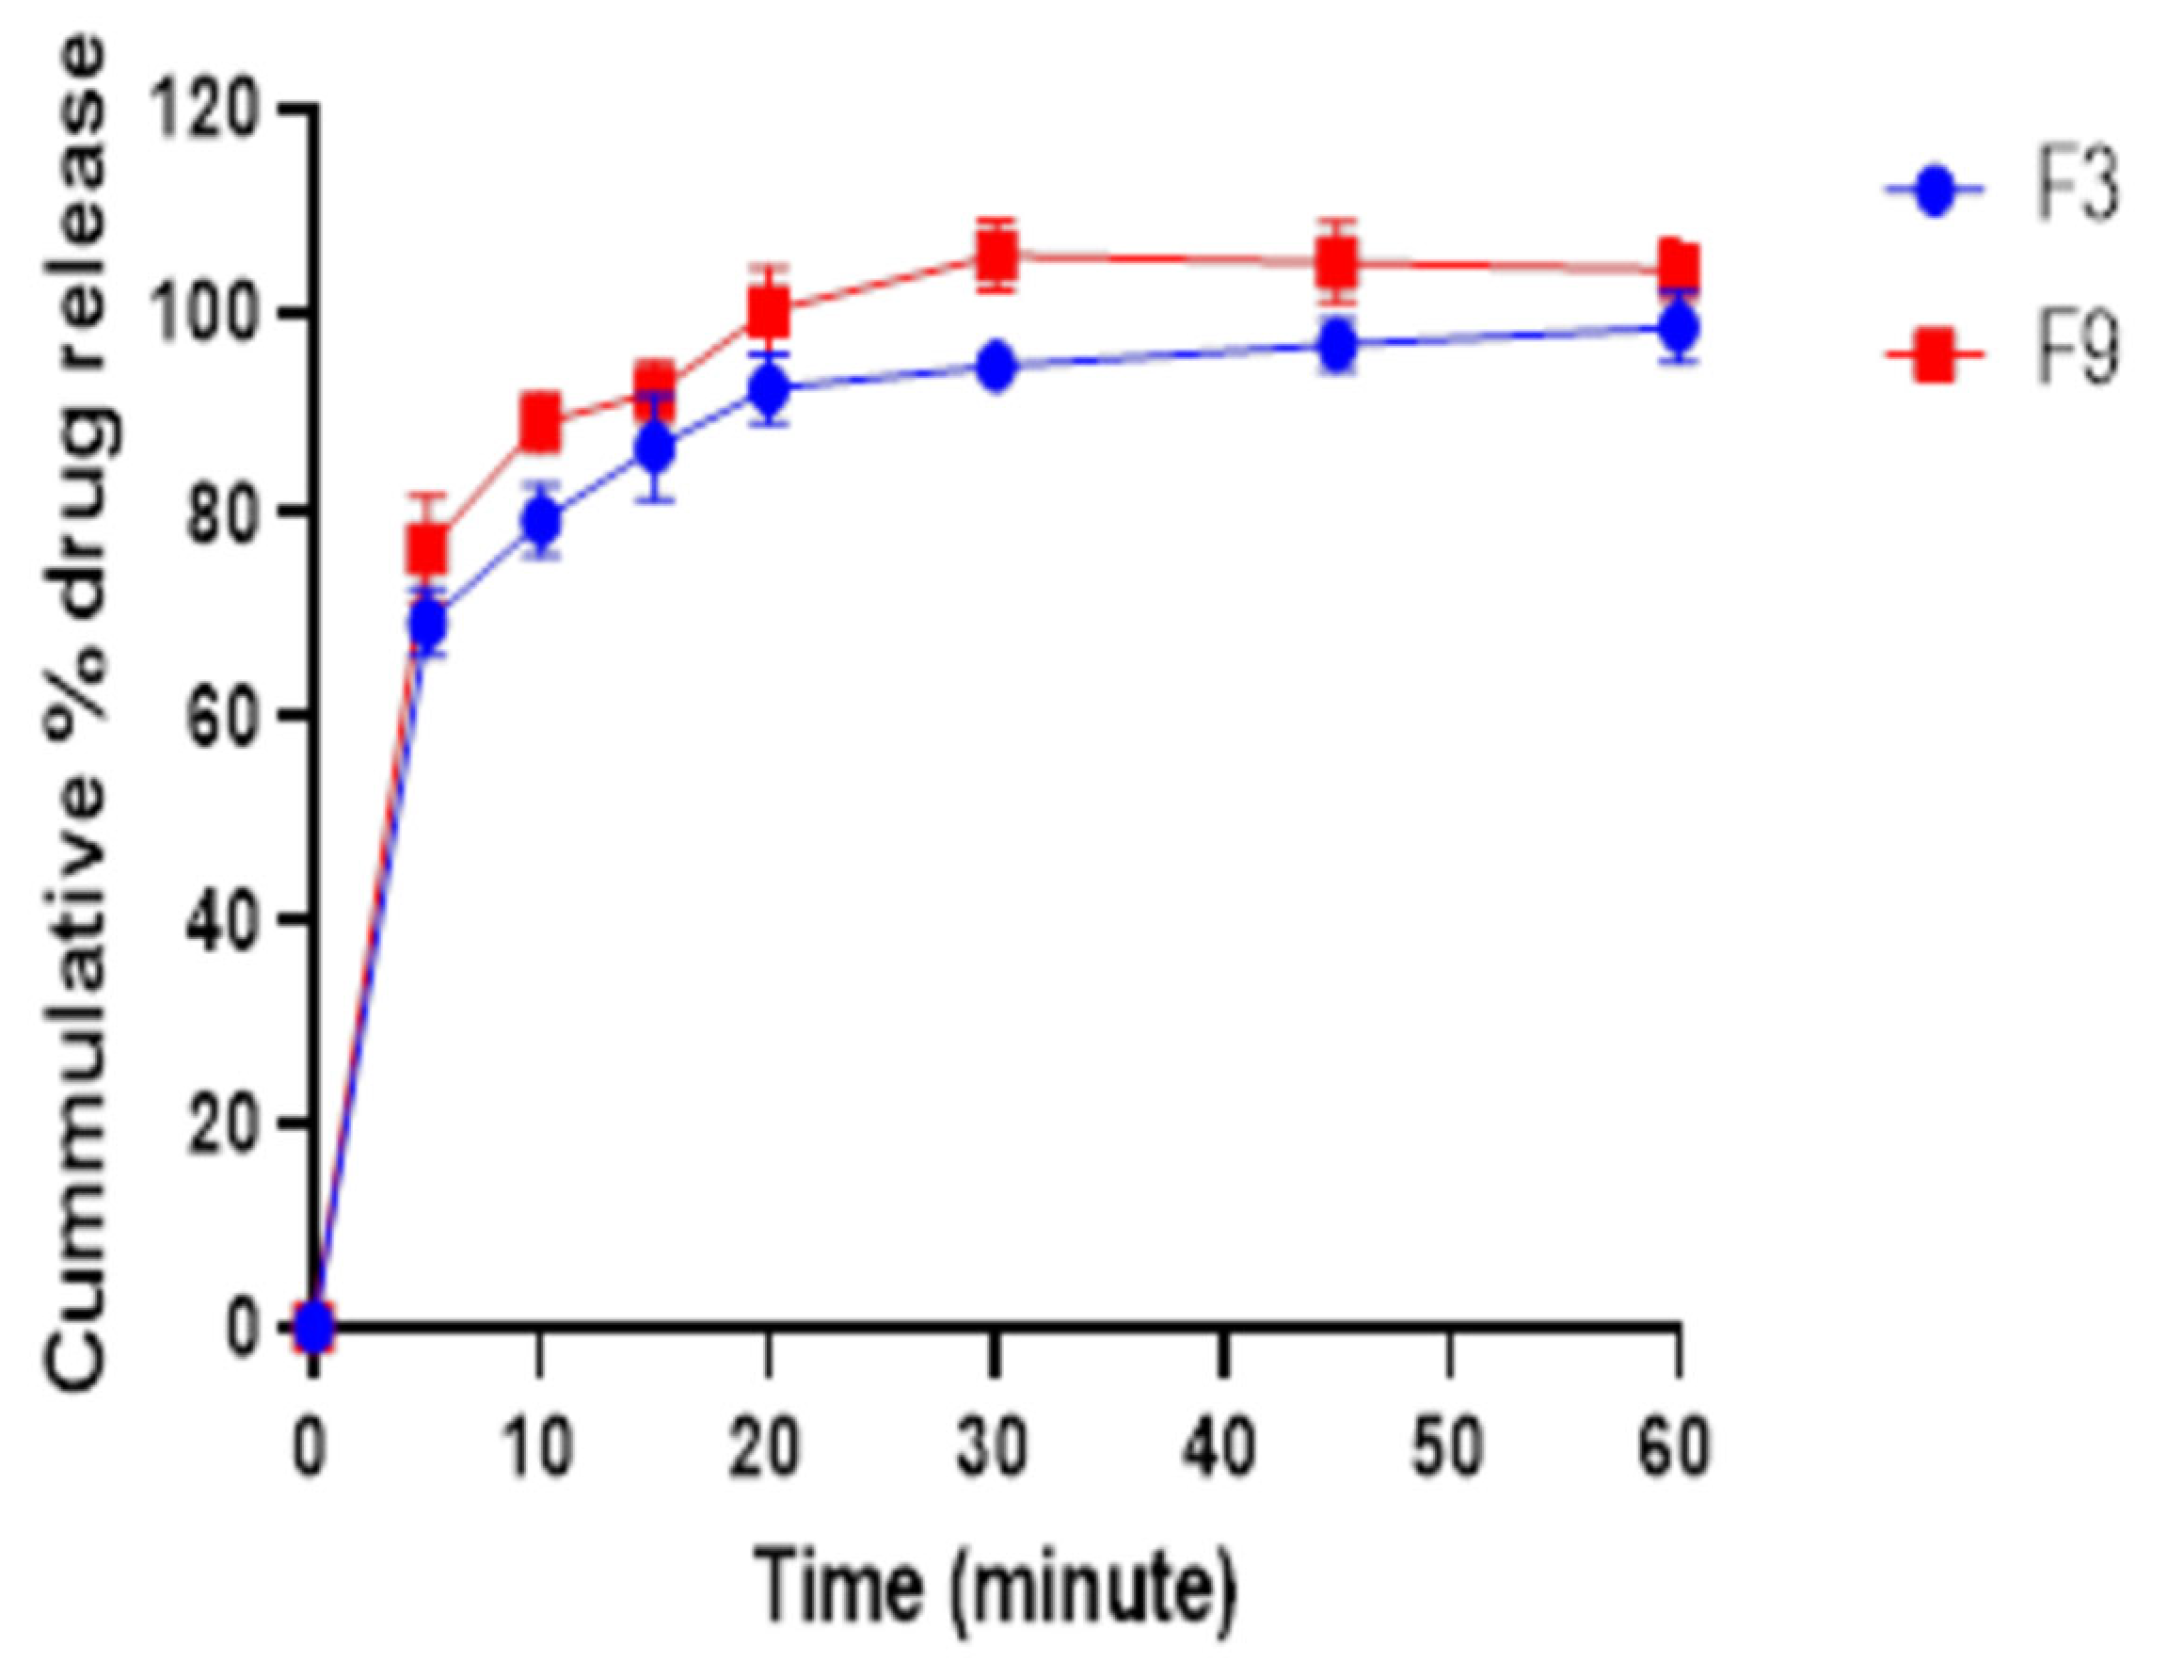
Table 5.
Similarity and dissimilarity summary.
| Time (minute) | Predicted value (RT) |
Observed value (Tt) | [Rt-Tt] | [Rt-Tt]2 |
|---|---|---|---|---|
| 5 | 69.32 | 73.15 | 3.83 | 14.66 |
| 10 | 80.45 | 80.44 | 0.01 | 0 |
| 15 | 86.62 | 85.03 | 1.59 | 2.52 |
| 20 | 92.40 | 88.45 | 3.95 | 15.60 |
| 30 | 95.64 | 93.50 | 2.13 | 4.53 |
| 45 | 98.25 | 98.84 | 0.59 | 0.34 |
| 60 | 99.43 | 102.82 | 3.38 | 11.42 |
| Sum [Rt-Tt] | 15.48 | |||
| Sum [Rt-Tt]2 | 49.109 | |||
| Sum Rt | 622.12 | |||
| Dissimilarity factor | 2.48 | |||
| Similarity factor | 69.0 | |||
Disclaimer/Publisher’s Note: The statements, opinions and data contained in all publications are solely those of the individual author(s) and contributor(s) and not of MDPI and/or the editor(s). MDPI and/or the editor(s) disclaim responsibility for any injury to people or property resulting from any ideas, methods, instructions or products referred to in the content. |
© 2026 by the authors. Licensee MDPI, Basel, Switzerland. This article is an open access article distributed under the terms and conditions of the Creative Commons Attribution (CC BY) license (http://creativecommons.org/licenses/by/4.0/).
Copyright: This open access article is published under a Creative Commons CC BY 4.0 license, which permit the free download, distribution, and reuse, provided that the author and preprint are cited in any reuse.


