
Submitted:
05 February 2026
Posted:
09 February 2026
You are already at the latest version
Abstract
Cyclin-Dependent Kinase-Like 5 (CDKL5) Deficient Disorder (CDD) is a rare X-linked developmental and epileptic encephalopathy characterized by early-onset refractory epilepsy, severe neurodevelopmental impairment, and lifelong disability. Although more than thirty anti-seizure medications are available, most CDD patients remain pharmaco-resistant. Gene-based therapies are emerging, but therapeutic development is hindered by marked clinical heterogeneity, small patient populations, and the lack of robust, translatable brain-based biomarkers for clinical trials. Genetically engineered Cdkl5 mouse models recapitulate many cognitive, behavioral, and molecular features of CDD, yet their utility is limited by the absence of overt seizures, precluding seizure-based outcome measures.
Here, we establish high-definition brain network (HDBN) biomarkers using advanced diffusion MRI tractography combined with graph-theoretical analysis to quantify whole-brain network organization in Cdkl5 knockout mice. Diffusion MRI enables non-invasive mapping of axonal connectivity by leveraging anisotropic water diffusion, while high-angular-resolution acquisition overcomes key limitations of conventional diffusion tensor imaging in regions with complex fiber architecture. We demonstrate that Cdkl5 knockout mice exhibit reproducible and region-specific disruptions in brain network organization, prominently affecting the somatosensory and somatomotor cortex, hippocampus, hypothalamus, amygdala, and superior colliculus—regions implicated in cognition, learning and memory, homeostasis, anxiety, and visual-motor function. In contrast, networks within the entorhinal cortex remain largely preserved.
These findings identify HDBN metrics as sensitive, non-invasive biomarkers that capture clinically relevant circuit-level abnormalities in CDD. Because diffusion MRI–based network analyses are directly translatable across species, HDBN biomarkers provide a unified framework for therapeutic evaluation in mouse models, large animals, and human clinical trials, enabling longitudinal monitoring of disease progression and treatment response.
Keywords:
CDKL5
; CDD
; MRI
; neurodevelopment
; brain network
; diffusion tensor imaging
1. Introduction
Cyclin-Dependent Kinase-Like 5 (CDKL5) Deficient Disorder (CDD)[1,2,3,4], affecting ~2.36 per 100,000 live births, is an X-linked (Xp22.13, OMIM #300203)[5,6,7,8,9] developmental and epileptic encephalopathy (DEE2, OMIM #300672) characterized by early-onset refractory epilepsy, hypotonia, cortical visual impairments, global developmental delay, sensorimotor, speech abnormalities, and intellectual disabilities[1,2,3,4,10,11,12]. CDD and Rett syndrome show substantial clinical and biological overlaps, which is why CDD was historically considered an early-onset variant of Rett syndrome [10,13,14]. Caused by different genetic mutations (CDD- CDKL5, Rett – MECP2), they are now recognized as distinct but related DEE within the Rett spectrum [10,15]. The CDKL5 gene encodes a serine/threonine protein kinase active in the brain and is essential for both neurodevelopment and normal neuronal function[10,16]. CDKL5 protein plays a major role in the growth and migration of neurons[10], as well as synaptic signaling and cellular division[10]. Although more than thirty anti-seizure medications (ASMs)[17] are now available in the U.S., most CDD patients are not responding to current ASMs[3,18], continuing to have frequent seizures. No effective cure is available[19]. Even Ztalmy (ganaxolone)[20]—an ASM for CDD-associated seizures that was approved by the Food and Drug Administration (FDA) in 2022—does not eliminate the high disease burden for health care systems[21,22] and caregivers[23,24,25]. Even if seizures can sometimes be controlled, CDD patients still suffer neurodevelopmental deficits (NDD), greatly impacting their quality of life. There is an unmet clinical need for new CDD intervention. Several gene therapy[26,27,28,29,30,31] efforts are underway to treat CDD. However, CDD patients present highly heterogeneous[10,11,32] clinical manifestations and varied temporal progression courses. Compounded with low prevalence and small patient populations[33], these make clinical trials for therapeutic development for CDD very challenging. It lacks robust brain-based biomarkers for CDD clinical trials.
Genetically engineered mouse (GEM) models are indispensable for modeling human diseases for mechanistical understanding and therapeutic development. Cdkl5 knockout (KO)[34] and knock-in (KI)[35] mice have existed for several years. Cdkl5 mice recapitulated some cognitive and behavioral deficits[36,37] similar to those in CDD patients, as well as molecular and pathological features[38,39]. However, their pre-clinical utility for developing new therapeutics has been hampered by a key deficit - Cdkl5 KO or KI mice do not exhibit overt seizures as CDD patients, thus one is unable to use seizures for therapeutic screening. Although some aged Cdkl5 mice can display heterogenous epileptic spasm[40] and age-related cognitive and motor declines[41,42], it is inappropriate to use aging phenotypes for neurodevelopmental investigations, because aged wild-type (WT) mice can also display epileptic spasm[43]. There is a major gap of a robust, brain-based biomarker for utilizing Cdkl5 mice for therapeutic development. Although large animal models of CDD which may exhibit seizures are being developed, there are no inbred strains for pigs or non-human primates, resulting in heterogeneous and variable manifestations of CDD symptoms similar to humans. The same challenge of human clinical trials remains in the large animal models of CDD.
The goal of this study is to establish clinically relevant brain-based biomarkers that will enable therapeutic testing of not only Cdkl5 KO mice, but of large animals and human clinical trials as well. Similar to human CDD patients, Cdkl5 KO mice exhibit impairments in spatial learning and memory and anxiety- and fear-related behaviors[36]. Cognitive functions are carried by unique organizations of the brain network, the “information highways,” to process signals and information in the brain. We hypothesize that Cdkl5 KO mice and CDD patients have altered brain network organization, resulting in cognitive deficits. This notion is consistent with the observation that loss of glutamatergic neurons in the hippocampus of Cdkl5 KO mice disrupted the hippocampal micro-circuitry leading to impaired spatial learning and memory[39].
Diffusion MRI tractography is a non-invasive way to map neuronal connections in the entire brain. Diffusion MRI[44,45,46,47,48,49,50,51,52] leverages anisotropic water diffusion properties in the biological tissue to generate MRI contrast[53,54], providing a non-invasive way to map white matter connections. In neuronal fibers, water molecules can readily diffuse along neuronal fiber orientation, but are very limited perpendicular to the neuronal fiber orientation due to diffusion barriers of cell membranes and myeline sheath[55,56,57,58], allowing non-invasive mapping of neuronal track orientations and connections in the brain. Diffusion tractography models water diffusion patterns in neuronal axons as a Gaussian distribution, and the determination of axonal direction by the principal direction of the tensor[44,45]. Based on this principal direction, the trajectories of the axonal connections can be tracked by diffusion fiber tractography, a computational approach which reveals the axonal orientations and connections between brain areas[59,60].
Diffusion tensor imaging (DTI)[44,45] is by far the most popular diffusion MRI model used. However, its major limitations have been well documented[61,62,63], as it is known to be limited to a coherent fiber population in large voxels and cannot model structures with complex fiber orientations. To overcome limitations of conventional DTI, this project leverages high-definition diffusion MRI with high angular resolutions in conjunction with brain topological analysis with graph theory to establish robust high-definition brain network (HDBN) analysis in Cdkl5 KO mice. We have successfully established HDBN characteristics in Cdkl5 KO mice corresponding to their cognitive and behavioral deficits. As diffusion MRI and HDBN analysis can be non-invasively conducted in live humans and large animals, HDBN-based biomarkers can be readily applicable for large animal studies and human translation for clinical trials. It is conceivable to compare HDBN-based biomarkers before and after gene therapy, or to monitor longitudinal CDD progression and regression with pharmacological interventions.
Our data demonstrate that HDBN can sensitively delineate brain network architecture in Cdkl5 KO mice, to distinguish them from WT mice. Cdkl5 KO mice displayed markedly altered neuronal network organization in the somatosensory and somatomotor cortices, hippocampus, hypothalamus, amygdala, and superior colliculus. These are the brain regions involved in cognition, learning and memory, homeostasis, anxiety and fear-condition, and visual/motor functions, respectively. This is consistent with the clinical presentations of CDD patients with cognitive, learning and memory deficits, anxiety, and cortical visual impairments. On the other hand, the entorhinal cortex, part of the olfactory circuitry, appears to be normal.
HDBN can sensitively detect brain network in CDD mouse models correlated with clinical presentations of CDD patients. As HDBN characteristics are qualitative and reproducible, it can potentially be a brain-based biomarker for therapeutic development in large animal models and clinical trials.
2. Materials and Methods
2.1. Animals
All animals received humane care in compliance with the NIH Office of Laboratory Animal Welfare (OLAW) guidelines. Animal protocols were approved by the University of Pittsburgh Institutional Animal Care and Use Committee (IACUC Protocol # 25066689, valid until June 4th, 2028). Mice were provided with ad libitum water and chow. Cdkl5[34] breeding pairs were obtained from the Jackson Laboratory (B6.129(FVB)-Cdkl5tm1.1Joez/J, Jax Strain #: 021967) as well as BL6/J (C57BL/6J, Jax Strain # 000664). Hemizygous Cdkl5 males (Y/-, n=12) and male BL6/J (n=8) were included in the study. All animals were weaned on post-natal day p28. Male littermates were housed with 2-4 littermates per cage on a 12:12 hour dark/light schedule. Brains were harvested for diffusion MRI at 3.5-5 months. Animals were euthanized with 5% isoflurane followed by cervical dislocation. The heart was exposed with a chest incision through the ribs. The brain was then perfused with 7 mL of 4% paraformaldehyde (PFA) via cardiac perfusion. The brain was then harvested and placed in 4% PFA for at least two days at 4°C. The brain was then placed in phosphate buffered saline (PBS) at 4°C for two days for re-hydration before imaging.
2.2. High-Resolution Diffusion and Anatomical MRI Acquisition
2.2.1. MRI Sample Preparation
Well-fixed mouse brains were transferred to a custom-made MRI holder immersed in Fomblin-Y (perfluoropolyether, Milipore Sigma, HVAC 18/8, average molecular weight 1,800) to eliminate susceptibility artifact at the air-tissue interface and background proton signals. High-resolution MRI was acquired on a Bruker Biospec 7T/30 system (Bruker Biospin MRI, Billerica, MA) with a 35-mm quadrature coil for both signal transmission and reception. Two mouse brains are scanned at the same time.
2.2.2. High-Resolution 3D Isotropic Diffusion MRI Acquisition
High-resolution 3D isotropic diffusion MRI images were acquired with spin echo diffusion preparation, field of view (FOV)= 40 mm x 11 mm x 11 mm, acquisition matrix = 256 x 70 x 70, voxel size = 0.003796 mm3, repetition time (TR) = 1000 ms, echo time (TE) = 16.665ms, diffusion gradient duration (d) = 4 ms, diffusion gradient separation (D) = 8ms, diffusion directions = 30, b = 1200 s/mm2.
2.2.3. High-Resolution 3D Isotropic Anatomical MRI
High-resolution 3D anatomical MRI was acquired for co-registration of diffusion MRI to the atlas space. 3D T2-weighted isotropic anatomical MRI was acquired with 3D Rapid Imaging with Relaxation Enhancement (RARE), a Fast Spin-Echo (FSE) sequence, with exactly the same geometry as the diffusion scans, for anatomical registration in the same brain space with the following parameters: FOV = 40mm x 11mm x 11mm , matrix size = 512 x 141 x 141, TR = 1000ms, TE = 12 ms, RARE factor = 8, effective TE = 48 ms, refocusing flip angle 180 degrees.
2.3. Mouse Brain Template
Two ex vivo mouse brains underwent Diffusion MRI at the same time, so each diffusion-weighed imaging (DWI) Nifti volumes contained two mouse brains. The first volume of the DWI data was used to detect each mouse brain via watershed segmentation and a manually guided segmentation approach. Based on this segmentation for multiple mouse brains, the DWI data of each animal was stored in separate 4D Nifti files.
2.4. Atlas-Based segmentation
We have established an automatic atlas-based segmentation pipeline for mouse brains. The 3D volumes of high-resolution RARE anatomical MRI (Figure 1C) and diffusion MRI (Figure 1A) are first registered to the Allen mouse brain atlas[64,65,66] space as described previously[67] using ANTx2, a custom MATLAB toolbox and segmented into gray matter (GM), white matter (WM) and cerebrospinal fluid (CSF) tissue maps using the Unified Segmentation approach[68] as implemented in statistical parametric maps (SPM)[69]. For the segmentation task, the tissue probability maps (TPMs) are generated based on Hikishima et al.[70] tissue classification. A weighted image is constructed using the tissue segments of the animal and the TPMs of the template, respectively. The weighted images are co-registered using affine and nonlinear B-spline transformation via Elastix package[71]. The resulting parameters for forward transformation are stored to allow a subsequent image transformation from native animal space to mouse template space. Parameter files for inverse transformation are also generated and stored to allow a subsequent image transformation from template space to native space (e.g. hemispheric brain mask). Using the files for inverse transformation, we transform the template to the native, 1st volume of the 3D data to create the final brain segmentation mask. Each mouse brain is parcellated into 72 regions without assigning any region of interest (ROI) or region of avoidance (ROA). Abbreviations for each brain region are listed in Table S1.
2.5. Diffusion Tractography
Quantification of fiber tracking (Figure 1B) was completed using DSI studio June 2018 version, with a minimum fiber track length of 0, maximum fiber track length 300 mm, tracking algorithm RK4, angular threshold 0, and a total of 1,000,000 seeds calculated using a 0.07710 threshold. These parameters were used for whole brain seeding, left hemisphere fiber tracking, and right hemisphere fiber tracking. Seeds were placed on an entire hemisphere and the corresponding hemisphere atlas added to see where of the 36 regions the fiber tracts mapped. This allowed us to assess the amount of fiber tracts in each region. The process was repeated for the right hemisphere. We investigated both the ipsilateral and contralateral fiber tracking to see if the left and right hemispheres were comparable. For the contralateral tracking, seeds were placed in the left hemisphere and compared to the right hemisphere’s fiber numbers. This was then repeated with the opposite hemispheres. After performing the ipsilateral and contralateral fiber tracking, we ultimately found them to not be significant and instead combined both into whole brain fiber tracking. The whole brain fiber tracking was performed on predetermined regions of interest that consisted of cerebellum, entorhinal cortex, hippocampus, hypothalamus, medulla, somatomotor cortex, somatosensory cortex, superior colliculus, thalamus, and visual cortex. Of these, the hippocampus region was made by combining the CA1, CA2, CA3, and dentate gyrus (DG) regions and the isocortex region was used for the visual cortex. The whole brain tract rendering was set to local index and either FA, MD, AD, or RD (Table S2) on a heat scale of 0-1 in DSI studio. The fiber track colors indicate their direction with red being left to right fibers, blue being front to back fibers, and green being top to bottom fibers.
2.6. Adjacency Matrix and Connectogram:
The hemisphere of the 72-region atlas-based parcellation used as the ROIs to create the adjacency matrices (Figure 1F) and connectograms (Figure 1G) depended on ipsilateral or contralateral analysis. For close-range fiber analysis, the hemisphere ipsilateral to where the seeds were placed of the 72-region atlas-based parcellation was used as the ROIs, and an adjacency matrix was calculated by using count of the connecting tracks in DSI studios after tractography. For long-range fiber analysis, the hemisphere contralateral to where the seeds were placed was used for calculation of the count of connecting tracts. The graph theory extraction threshold for both ipsilateral and contralateral was 0.001. In contralateral analysis, heat maps will display all 72x72 regions. Chord diagrams of adjacency matrices were generated using Circos table viewer (http://circos.ca/), where row and column size were matched creating ribbons that are to scale with the number of connections between two regions of interest, each color representing a different region. Graphs are undirected. Chord diagrams of contralateral data display cross hemisphere connections, either 36x36 left seeds to map tracks to right regions and vice versa, to avoid redundancy. Representative ball and stick plots are 3D graph visualizations in which balls represent nodes and sticks represent edges. The size of the ball corresponds to the number of connections in a brain region, and the width of the sticks is proportional in size to the number of edges between nodes. As such, these are visual representations of our network parameters.
2.7. Network Topography
Brain network topology was characterized for WT and Cdkl5 mice following the previously described protocol[67]. Using the same tractography that made the adjacency matrices, graph theoretical analysis was calculated by DSI studio for various network parameters. The graph theory [72,73,74] extraction threshold was 0.001. These network parameters included measures of efficiency, global efficiency and small worldness, and measures of segregation, local efficiency, and clustering coefficient.
The process from imaging to network topology and connectogram are depicted in Figure 1. Characterizing neuronal networks into network measures through graph theory describes the physiological aspect of information processing, quantifying structure and function[75]. Network measures in DSI studio follow the implementation of the brain connectivity toolbox. Graph theoretical analysis treats brain connections like a graph, so its topology can be quantitatively described by network parameters. We graph weighted measures, such that the connectivity matrix will be normalized so the maximum value of the matrix is one.
2.8. Statistical Analysis
We performed multiple unpaired t-tests with corrections to assess the volume, FA, AD, MD, and RD of regional ROIs. For differences in fiber tracking, we used multiple unpaired t-tests at 95% confidence level. A P-value map was then generated showing the regional differences where the p<0.05. A t-test was used for network parameters as well.
Differences between WT and KO brain connectivities were performed by comparing the distribution of fiber tracts in between all 36(36-1)/2=630 pairs of brain regions. We excluded pairs where >50% of their observations were 0 and, to alleviate skewing and make the data more amenable to linear models, log-transformed the data after adding a pseudo count of 1 to avoid taking the log of zero. T-tests with nWT + nKO – 2=17 degrees of freedom were used to compare WT and KO pairs and resulting p-values (Figure 1H) were adjusted using the Benjamini Hochberg procedure to adjust for multiple testing by controlling the FDR at 5%[76]. These computations were performed in Rv4.1.2.
3. Results
3.1. Probing Brain Micro-Environment and Connectivity with Diffusion MRI and Diffusion Tractography
Diffusion MRI (Figure 1A) generating high-definition fiber tractography (HDFT, Figure 1B) is a non-invasive way to characterize brain micro-environment and to map neuronal connections in the entire brain. Diffusion MRI[44,45,46,47,48,49,50,51,52] leverages anisotropic water diffusion properties in the biological tissue to generate MRI contrast[53,54] sensitive to local structural or pathophysiological micro-environment. Neuronal fibers (axons, long dendrites) found in white matter tracks, fasciculi, and commissures are the long, slender projections of neurons that transmit electrical and chemical signals inter-connecting brain regions to form “information highway” networks that process information and conduct cognitive functions. There are also afferent (sensory) fibers and efferent (motor) fibers to carry information to and from the central nervous system (CNS) respectively, as well as autonomic fibers to relay information to regulate involuntary sympathetic and parasympathetic functions. In neuronal fibers, water molecules can readily diffuse along neuronal fiber orientation, but are very limited perpendicular to the neuronal fiber orientation due to diffusion barriers of cell membranes and myeline sheath[55,56,57,58]. Diffusion MRI leverages this anisotropic restricted water diffusion property in nerves to non-invasively map neuronal track orientations and connections in the brain. Diffusion tractography models water diffusion patterns in neuronal fibers as a Gaussian distribution and determination of axonal direction by the three principal directions of the tensor[44,45].
Although diffusion tensor imaging (DTI) is by far the most widely used diffusion MRI method, its major limitations have been well described[61,62,63], particularly its inability to represent the crossing of multiple fibers[77]. The diffusion tensor model assumes one dominant fiber orientation per voxel. This assumption fails when multiple fiber populations with different orientations are present, leading to misinterpretation of DTI metrics [61]. Mouse brains (~1 to 1.5 cm in length, ~0.4–0.5 cm³ in volume) are ~3,000 times smaller than human brains (~14 to 16 cm in length, ~1,200–1,400 cm³ in volume) [78,79,80,81]. Even with much smaller voxel sizes, conventional DTI[82,83,84] often fall short and cannot distinguish multiple fiber orientations within a voxel in small mouse brains. Several alternative advanced methods have been proposed to address this limitation[85]. Here we use high-angular generalized q-sampling imaging (GQI)[86] with deterministic fiber tracking for this study[50,87,88], optimized for small mouse brains.
GQI[86] is a model-free reconstruction method that quantifies the density of diffusing water at different orientations. This measurement, termed spin distribution function (SDF), is an orientation distribution function of diffusing spins. Studies have shown its greater sensitivity and specificity to white matter characteristics and pathology[89,90,91]. GQI can calculate SDF from a variety of diffusion data sets[92,93], including DSI dataset, high angular resolution diffusion imaging (HARDI) [62,94,95], multiple-shell [96,97,98], or combined DTI datasets. GQI provides an analytical relation to compute SDF, and the reconstruction requires only a simple matrix multiplication.
The deterministic fiber tracking algorithm makes use of the local fiber orientations to delineate the whole trajectory. It starts from a seeding point and propagates along fiber orientation until the termination criteria are met. Examples of this approach include the fiber assignment continuous tracking (FACT) method[50] and streamline fiber tracking algorithm[46], both of which assume a single fiber orientation per voxel. With high angular resolution data, multiple fiber orientations can be resolved per voxel to catch the complex connections of the fiber geometry[87,99,100], more suitable for small mouse brains.
By quantifying the tensors for these principal directions, the trajectories of the axonal connections can be tracked by diffusion fiber tractography, which reveals the axonal orientations and connections between brain areas[59,60]. Eigenvalues of each tensor direction (λ1, λ2, λ3) can quantify diffusivity (Table S2) for each brain region, sensitive to the local micro-structure and micro-environment, thus they can reflect neurodevelopmental and pathophysiological features[101,102,103]. Fractional anisotropy (FA)[44] quantifies the degrees of anisotropy (non-uniformity) of water diffusion in neuronal fibers. FA represents the degree to which diffusion within a voxel-of-interest in isotropic or anisotropic, with a value of 0 representing the former and 1 representing the latter FA is a fraction derived from the ratio between λ1, λ2, and λ3. It has a value ranged from 0 (isotropic) to 1(totally anisotropic). FA reflects neuronal fiber integrity and coherency. Axial diffusivity (AD) [102] measure diffusion along the axonal orientation, which can reflect axonal integrity and or axonal injury. AD, denoted by λ parallel, quantifies how fast water diffuses along the axonal fibers[104,105,106]. It is estimated by λ1, the first eigenvalue of the tensor. Radial diffusivity (RD)[102] measure diffusion perpendicular to the axonal orientation, reflecting myeline integrity. RD, denoted by λ perpendicular, quantified how fast water diffuses across the axonal bundles. It is estimated by (λ2+λ3)/2, the average of the second and third eigenvalues of the tensor. It can be used to study demyelination[107]. Mean diffusivity (MD), or apparent diffusion coefficient (ADC), measures overall diffusivity for all directions[102]. MD is the diffusivity average from the three eigenvalues of the tensor. It is often regarded as an approximation of the overall ADC.
Quantitative diffusivity (FA, AD, RD, MD) are sensitive to micro-environment and micro-structure, thus providing a non-invasive way to probe the pathophysiological and neurodevelopmental features in live brains. Numerous studies have investigated the relation between diffusivity and pathological conditions. For example, axonal injury, traumatic injury, stroke, amyotrophic lateral sclerosis (ALS), advanced multiple sclerosis (MS) can increase AD, demyelination can increase RD, a tumor can decrease MD, immune cell infiltration has decreased MD. Vasogenic edema increases MD/ADC whereas cytotoxic edema decreases MD/ADC. Age-dependent changes in AD, RD, and MD during neurodevelopment are well recognized[108,109,110]. Developing brains rapidly change axonal characteristics in axonal density, axonal caliber, and myelination[108,109,110]. Diffusive parameters can be used to characterize brain maturation in pre-term infants[111,112,113,114] which showed gestation-age dependent and brain-region specific changes in AD, RD, and MD. Children with dyslexia[115,116,117] showed changes in these diffusivity parameters. Thus, quantitative diffusivity are increasingly used as biomarkers for white matter for neurodevelopment[108,109,110], brain maturation[111,112,113,114], cognitive abilities[115,116,117], brain injury[118,119,120,121,122], and neurodegeneration[123,124,125,126].
Diffusion MRI was successful in detecting selective vulnerability of the frontal lobes in Rett Syndrome[127]. It is conceivable that quantitative diffusivity might be able to quantify brain changes in CDD to provide a non-invasive quantitative brain-based biomarker for CDD trials.
We first investigated quantitative diffusivity in hemizygous male Cdkl5 KO mouse brains compared to those of the age- and sex-matched WT counterparts (Figure 2). Group-averaged quantitative diffusivity mapping covers 3D volumes of the entire brain. They can be viewed in any orientation for each brain region, allowing visual comparison between WT and Cdkl5 KO mice. Figure 2 shows a mid-sagittal view of the 3D isotropic mapping of group-averaged FA (Figure 2A-C), MD (Figure 2D-F), AD (Figure 2G-I), and RD (Figure 2J-L) maps for WT (Figure 2 A, D, G, J) and Cdkl5 KO mice (Figure 2B, E, H, K) as well as the p value maps (Figure 2 C, F, I, L, and Table S3) for group comparisons between the hemizygous male Cdkl5 KO mice and the WT counterparts. A two-sample unpaired t-test was used to determine the brain regions with significant differences between the two groups (Figure 2 C, F, I, L, and Table S3).
Cdkl5 KO mice showed significant changes in FA in the corpus collosum (Figure 2C), the colossal white matter gateway for communicating between the left and right hemispheres. This is consistent with the observation that CDKL5 sculpts functional callosal connectivity to promote cognitive flexibility[128].
MD (Figure 2F), AD (Figure 2I), and RD (Figure 2L) were altered in the somatosensory and somatomotor cortex, hippocampus, amygdala, hypothalamus, superior colliculus, pons, and other subcortical regions (Table S3). Somatosensory and somatomotor cortex are crucial for cognitive functioning and decision-making, hippocampus[129,130,131,132] for contextual learning and memory, amygdala[133,134,135,136,137] for anxiety- and fear-like responses, hypothalamus for homeostasis, pons for connecting to spinal cord, and superior colliculus[138,139,140] for visual/motor functions involving in processing optical stimuli, orienting attention, and coordinating hand-eye movements. We found that the brain regions showed significant different diffusivity in Cdkl5 KO mice are consistent with clinical symptoms in CDD patients. This suggests that brain-region specific quantitative diffusivity mapping can potentially be brain-based biomarkers for CDD.
Our data showed that quantitative diffusivity with diffusion MRI can sensitively detect micro-environmental changes in Cdkl5 KO mice. The brain areas with significant changes correlated with the brain regions underlying cognitive disabilities found in CDD patients.
3.2. Global High-Definition Fiber Tractography (HDFT):
Next, we compared streamlines of the 72 regions on a whole brain level. The high-definition fiber tractography (HDFT Figure 1B) and high-resolution anatomical T2-weighted MRI (Figure 1C) were first co-registered to the Allen Brain Atlas[64,65,66] space (Figure 1D) for atlas-based segmentation (Figure 1E) to parcellate each mouse brain into 72 brain regions.
The diffusion parameters (Figure 2, Table S3) showed significant differences in many regions between Cdkl5 and WT mice. We investigated if the neuronal fiber numbers were also altered. To do this, the numbers of diffusion streamlines passing through each brain region for each mouse were generated, then the group mean streamline numbers are compared between Cdkl5 and WT mice using a two-sample unpaired t-test adjusting for FDR at 5%. The average numbers of diffusion streamlines, reflecting the total neuronal fibers, were significantly altered in several regions of Cdkl5 mice (Table S4, highlighted brain regions), including corpus callosum (LCC), cerebellum (LCB), motor related superior colliculus (LSUC), hypothalamus (LHY), inferior colliculus (LIC), amygdala (LCOA), somatomotor cortex (LMO), somatosensory cortex (LSS), piriform cortex (LPIR), taenia tecta (LTT), retrohippocampal region (LRHP), and mid-brain (LMB). Each of the altered brain regions are responsible for different cognitive functions – cortex[141,142] involved in executive functions, hippocampus[143,144,145,146,147,148] in contextual learning, amygdala[133,134,135,136,137] in anxiety and fear conditioning, cerebellum[149,150] in motor functions, piriform cortex [151,152] for olfactory processing, hypothalamus [153,154] for homeostasis, autonomic regulation, emotional expression, and stress responses, whereas the motor related superior colliculus[155,156,157] transforms sensory and cognitive signals into motor commands for saccadic eye movements and coordination of eye–head–body movements. These altered brain regions carrying out cognitive functions correlated with clinical presentations of CDD patients[1,2,3,4,5,6,7,8,9,10,11,12], such as intellectual disabilities; anxiety and irritability; circadian rhythm dysregulation and sleep disturbances; autonomic dysfunctions; visual and cortical visual impairments with poor visual tracking and reduced eye contact; hypotonia and motor abnormalities with spasticity, dystonia, or poor motor coordination.
Our data demonstrated that Cdkl5 mutant mice exhibited region-specific alterations in diffusion-derived streamline density, a proxy for neuronal fiber numbers, within brain regions implicated in the cognitive impairments characteristic to CDD clinical manifestation.
3.3. Brain Topology with High-Definition Brain Network (HDBN) Analysis:
We further characterize the brain topology in Cdkl5 brains using graph theory. Brain topology[75,158,159,160] refers to the organizational principles of the brain’s structural or functional networks, describing how neural elements (e.g., neurons, neuronal populations, or brain regions) are interconnected, formalized using graph theory[74,158,161,162], in which brain regions are modeled as nodes and their anatomical or functional connections as edges. This framework enables quantitative characterization of global and local network properties that govern information integration, segregation, and robustness of brain systems. Graph theory provides a powerful mathematical framework for delineating brain network architecture by representing the brain as a complex system of interconnected elements and enabling quantitative characterization of its organization across multiple spatial scales. In this framework, nodes typically correspond to anatomically or functionally defined brain regions, while edges represent structural or functional connections between nodes, derived from diffusion tractography. Topological features of brain networks include measures such as density, clustering coefficient, path length, global or local efficiency, and small-worldness, which collectively capture how efficiently information is transferred and processed across the brain. Alterations in brain topology have been widely reported in neurodevelopmental, neuropsychiatric, and neurodegenerative disorders, suggesting that disrupted network organization is a core mechanism underlying cognitive and behavioral impairments.
Here we investigate if disruption of the brain network architecture underlies neurocognitive impairments in CDD. Adjacency matrices (Figure 1F) represent interconnections among 72 brain regions. Adjacency matrices (Figure 1F) capturing interregional connectivity among 72 brain regions were aggregated across individual mice within the WT or Cdkl5 cohorts to generate group-level connectogram (Figure 1G, right), which is a circular graphical representation that visualizes the structural or functional connectivity between brain regions, depicting nodes as regions and links as their pairwise connections. The brain topology can also be represented with the he ball-and-stick model (Figure 1G, left), which is a simplified network representation in which brain regions are modeled as nodes (“balls”) and their structural or functional connections are modeled as edges (“sticks”), allowing the topological organization of the brain (e.g., hubs, modules, and small-world properties) to be analyzed using graph theory.
To compare connectivity between WT and Cdkl5 KO brains, we performed two-sample unpaired t-test for pair-wise comparisons of the distribution of fiber tracts in between all 36(36-1)/2=630 pairs of brain regions, aggregating among all individual brains to generate the adjusted p value matrix (Figure 1H), using the two-step adjusted p values with signs. The lighter colors represent |p| values are between 0.01-0.05, whereas the darker colors represent |p| values between 0 - 0.01. Although p values do not have signs, we artificially assign “positive” or “negative” denotations to indicate the direction of deviations of Cdkl5 brains from the WT brains. The blue colors denote artificially assigned “negative” p values, indicating Cdkl5 KO brains have less connections than WT brains, whereas the orange colors denote artificially assigned “positive” p values, indicating Cdkl5 KO brains have more connections than the WT counterparts. The adjusted p value matrix can compare shorter pair-wide connections within the hemispheres (ipsilateral) or longer range pair-wide connections to the other hemisphere (contralateral). The topological analysis can be performed at the whole brain levels or for each sub-circuitry.
In brain network analysis using graph theory[163,164,165,166,167], brain network topological characteristics can be quantified by network parameters. Healthy brains typically exhibit a “small-world”[168,169,170] topology. The “small-worldness” in brain networks refers to a topological property where the brain’s connectivity graph shows both high local clustering (segregation) and short average path lengths (global integration), supporting efficient information processing compared to random networks. In neuroscience, it’s quantified by comparing the clustering coefficient and path length of a real brain network to those of equivalent random graphs, with a small-world index (σ) > 1 indicating small-world characteristics in structural and functional connectomes. The “path length” refers to the average shortest number of edges that must be traversed to connect any two nodes, reflecting the efficiency of information transfer across the network. Shorter path lengths indicate faster global communication between brain regions, while longer path lengths suggest less efficient connectivity. The “clustering coefficient” is a measure in network theory that quantifies how “clustered” or “connected” a node’s neighbors are. In other words, it tells you the likelihood that two nodes that are both connected to a common node are also connected to each other. It is commonly used in social networks, brain networks, and other complex networks to describe local connectivity. The “global efficiency” measures the ability of the network to integrate information across the whole brain. It quantifies how efficiently signals can travel between any pair of nodes in the network. The “local efficiency” measures how efficiently information is exchanged within the immediate neighborhood of a node. It reflects the fault tolerance of the network — how well communication is preserved if a node is removed. The “density” is a measure of how many connections (edges) exist in a network relative to the maximum possible number of connections. For a brain network, nodes typically represent brain regions, and edges represent structural (e.g., white matter tracts) or functional (e.g., correlated activity) connections. High density can mean that brain regions are highly interconnected; the network is more integrated, whereas low density usually means fewer connections relative to possible ones, indicating that the brain network is sparser. “Transitivity” is a measure of the tendency for nodes (brain regions) to form triangles, reflecting the likelihood that two neighbors of a node are also connected. It’s a global measure of clustering in the network. Essentially, high transitivity indicates tightly interconnected modules or communities in the brain. The “assortativity coefficient” measures the tendency of nodes (brain regions) to connect to other nodes that are similar in some property, most commonly degree (number of connections). If the assortativity coefficient is positive, high-degree nodes tend to connect to other high-degree nodes (and low-degree to low-degree), showing a “like-with-like” connectivity pattern. If it is negative, high-degree nodes tend to connect to low-degree nodes, indicating disassortative mixing. If it is near zero, connections are roughly random with respect to node degree. In brain networks, assortativity can indicate network resilience and organization. Positive assortativity suggests robustness against random damage because highly connected hubs are interconnected. Negative assortativity often occurs in biological networks where hubs connect to peripheral nodes, which can optimize communication efficiency. In graph theory applied to brain networks, a “rich club” refers to a set of highly connected hub nodes that are more densely interconnected with each other than expected by chance. These nodes typically have a high degree of connections and form a “club” of influential regions that facilitate efficient communication and integration across the brain. The “rich club” organization of the brain supports global integration, efficient information transfer, and resilience to localized damage.
3.4. Data-Driven Network Topology Characterization of Cdkl5 KO Brains
We first characterize brain network topology in Cdkl5 KO brains by data-driven approach. Our data found significant changes in diffusion parameters (Figure 2, Table S3) and diffusion streamlines (Table S4) which reflect the numbers of neuronal fibers in Cerebellum, Superior Colliculus, Hippocampus, Thalamus, Entorhinal Cortex, Hypothalamus, Medulla, Motor Cortex, and Somatosensory Cortex. All these areas carry out cognitive functions that are characteristic of CDD clinical manifestations. We delineate network topology in these brain regions.
3.4.1. Network Topology Changes in Cdkl5 at the Whole Brain Level
Brain topological analysis at the whole brain level (Figure 3 and Table S5) found extensive changes in many pairs of connections for the Cdkl5 group. While Cdkl5 brains showed many brain connections deviated from those in WT counterparts (blue or orange colors in p value matrixes in Figure 5G-J), many brain connections are normal (blank in the p value matrixes in Figure 5G-J). None of the brain network parameters by graph theory at the whole brain level (small-worldness, path length, clustering coefficient, global efficiency, local efficiency, density, transitivity, assortativity coefficient, or rich clubs, etc) showed significant differences between Cdkl5 KO and WT brains. This indicates that Cdkl5 brain network changes are region-specific in local circuitries, not at the global whole brain level.
3.4.2. Regional Network Topology Changes in Cdkl5 Brains
We then characterized regional brain network topology in brain regions that showed significant changes in diffusion parameters (Figure 2, Table S3) and diffusion streamlines (Table S4) which reflect the numbers of neuronal fibers, including Cerebellum (Figure 4, Table S6), Superior Colliculus (Figure 5, Table S7), Hippocampus (Figure 6, Table S8), Thalamus (Figure 7, Table S9), Entorhinal Cortex (Figure 8, Table S10), Hypothalamus (Figure 9, Table S11), Medulla (Figure 10, Table S12), Motor Cortex (Figure 11, Table S13), and Somatosensory Cortex (Figure 12, Table S14). All these areas carry out cognitive functions that are characteristic of CDD clinical manifestations. All these brain areas showed varied degrees of altered brains short-ranged in the ipsilateral hemispheres (Figure 4, Figure 5, Figure 6, Figure 7, Figure 8, Figure 9, Figure 10, Figure 11 and Figure 12, G, J) as well as in the long-ranged contralateral hemispheres (Figure 4, Figure 5, Figure 6, Figure 7, Figure 8, Figure 9, Figure 10, Figure 11 and Figure 12, H, I). Contrary to the whole brain network topology, all these brain regions showed changes in brain network parameters. Hypothalamus (Figure 9L) showed changes in small-worldness. Entorhinal Cortex (Figure 8M) and IsoCortex (Figure 13N) showed changes in path length. Superior Colliculus (Figure 5K), Medulla (Figure 10K), and IsoCortex (Figure 13L) showed changes in clustering coefficient. Hypothalamus (Figure 9N) and Medulla (Figure 10L) showed changes in global efficiency. Hypothalamus (Figure 9M) and Medulla (Figure 10M) also showed changes in local efficiency. Hippocampus (Figure 6K), Thalamus (Figure 7K), Entorhinal Cortex (Figure 8K), Hypothalamus (Figure 9K), Motor Cortex (Figure 11K), Somatosensory Cortex (Figure 12K), and IsoCortex (Figure 13K) showed changes in density. Superior Colliculus (Figure 5L), Entorhinal Cortex (Figure 8L), and Medulla (Figure 10N) showed changes in transitivity. Cerebellum (Figure 4K), Entorhinal Cortex (Figure 8N), and IsoCortex (Figure 13M) showed changes in assortativity coefficient. The regional brain network topological analysis indicates that Cdkl5 deficiency leads to regional brain network alterations in brain-region specific manners.
Figure 4.
Diffusion tractography and brain network analysis for cerebellum. (A, B) Diffusion tractography (B, E) connectogram (C, F) adjacency matrix for WT (A-C) or hemizygous Cdkl5 KO mice (D-F). (G-J) P value matrix to compare connectomes, an adjacency matrix of signed FDR adjusted p-values shows connections between regions where Cdkl5 KO > WT (0.01-0.05 light orange, 0.005-0.01 dark orange) and connections between regions where WT > Cdkl5 KO (0.0- -0.05 light blue, -0.005- -0.01 dark blue) for (G) left ipsilateral hemisphere connections (left to left hemisphere), (H) right contralateral connections (right to left hemispheres) (I) left contralateral connections (left to right hemispheres) and (J) right ipsilateral hemisphere connections (right to right hemisphere). (K) Network parameter - Assortativity coefficient (weighted). Blue – WT, Red – Cdkl5 KO. .
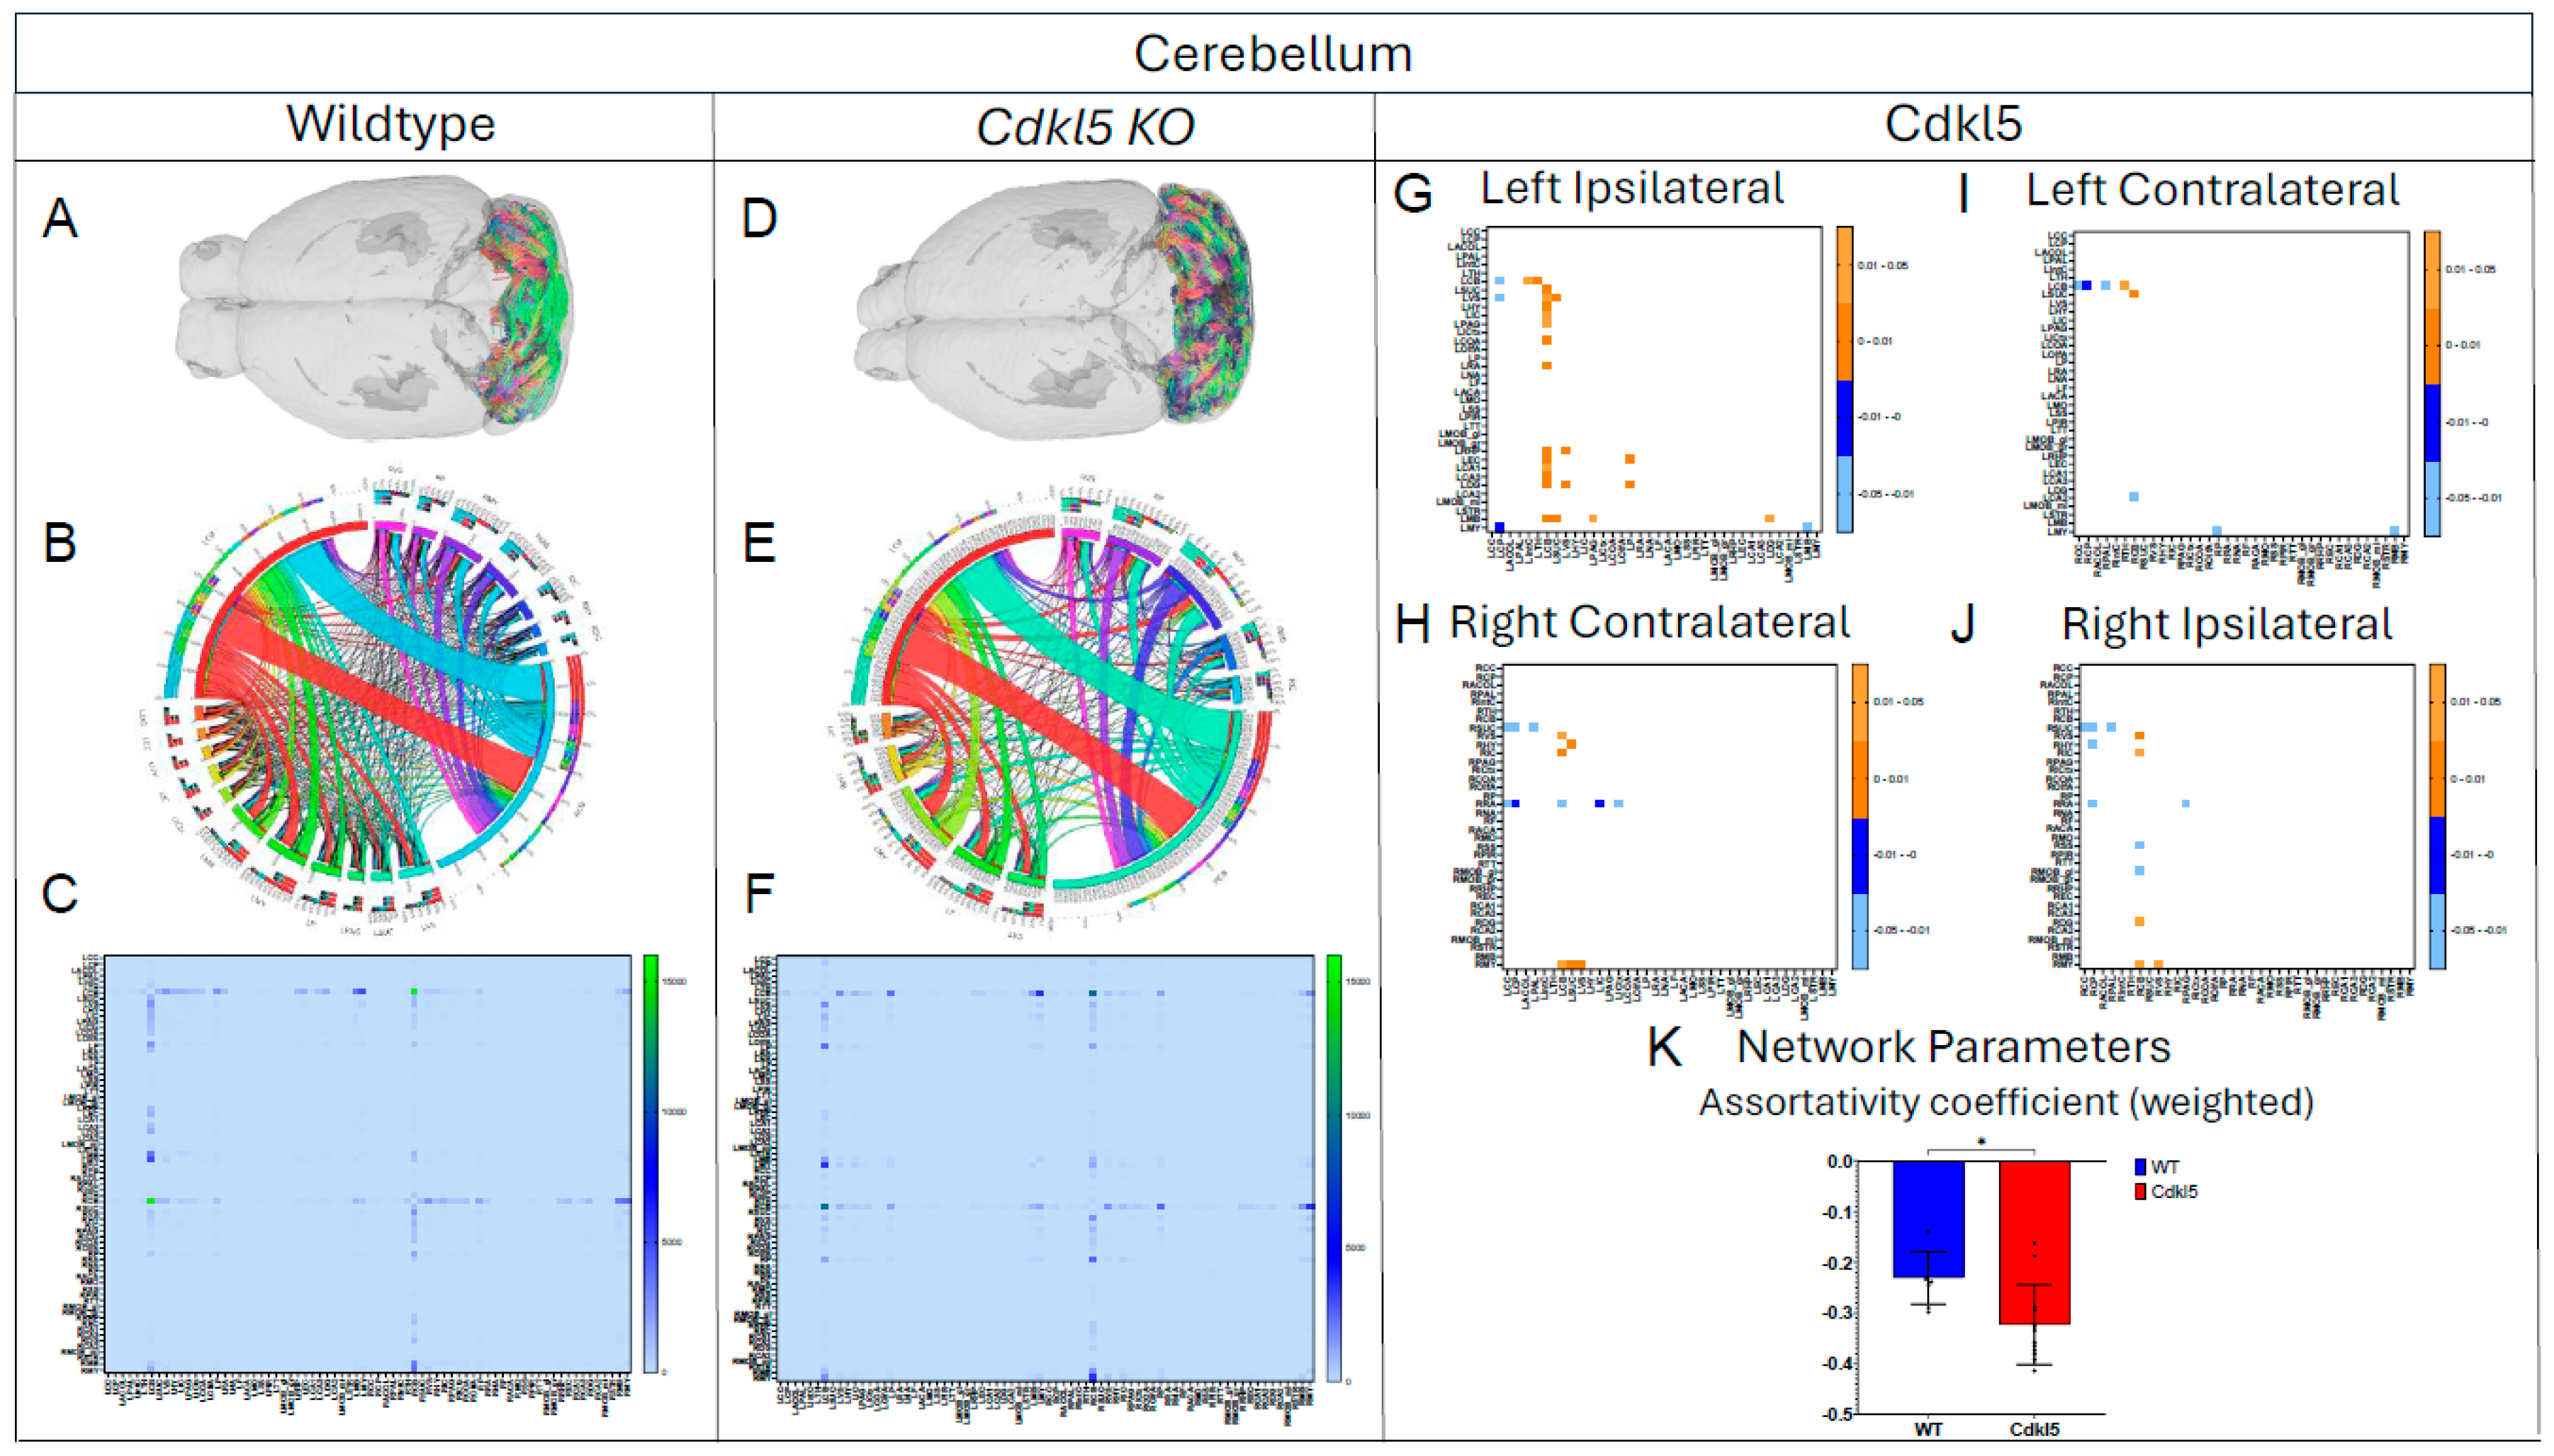
Figure 5.
Diffusion tractography and brain network analysis for Superior Colliculus. (A, B) Diffusion tractography (B, E) connectogram (C, F) adjacency matrix for WT (A-C) or hemizygous Cdkl5 KO mice (D-F). (G-J) P value matrix to compare connectomes, an adjacency matrix of signed FDR adjusted p-values shows connections between regions where Cdkl5 KO > WT (0.01-0.05 light orange, 0.005-0.01 dark orange) and connections between regions where WT > Cdkl5 KO (0.0- -0.05 light blue, -0.005- -0.01 dark blue) for (G) left ipsilateral hemisphere connections (left to left hemisphere), (H) right contralateral connections (right to left hemispheres) (I) left contralateral connections (left to right hemispheres) and (J) right ipsilateral hemisphere connections (right to right hemisphere). (K-L) Network parameters, (K) Clustering coefficient (weighted) (L) Transivity (weighted). Blue – WT, Red – Cdkl5 KO. .
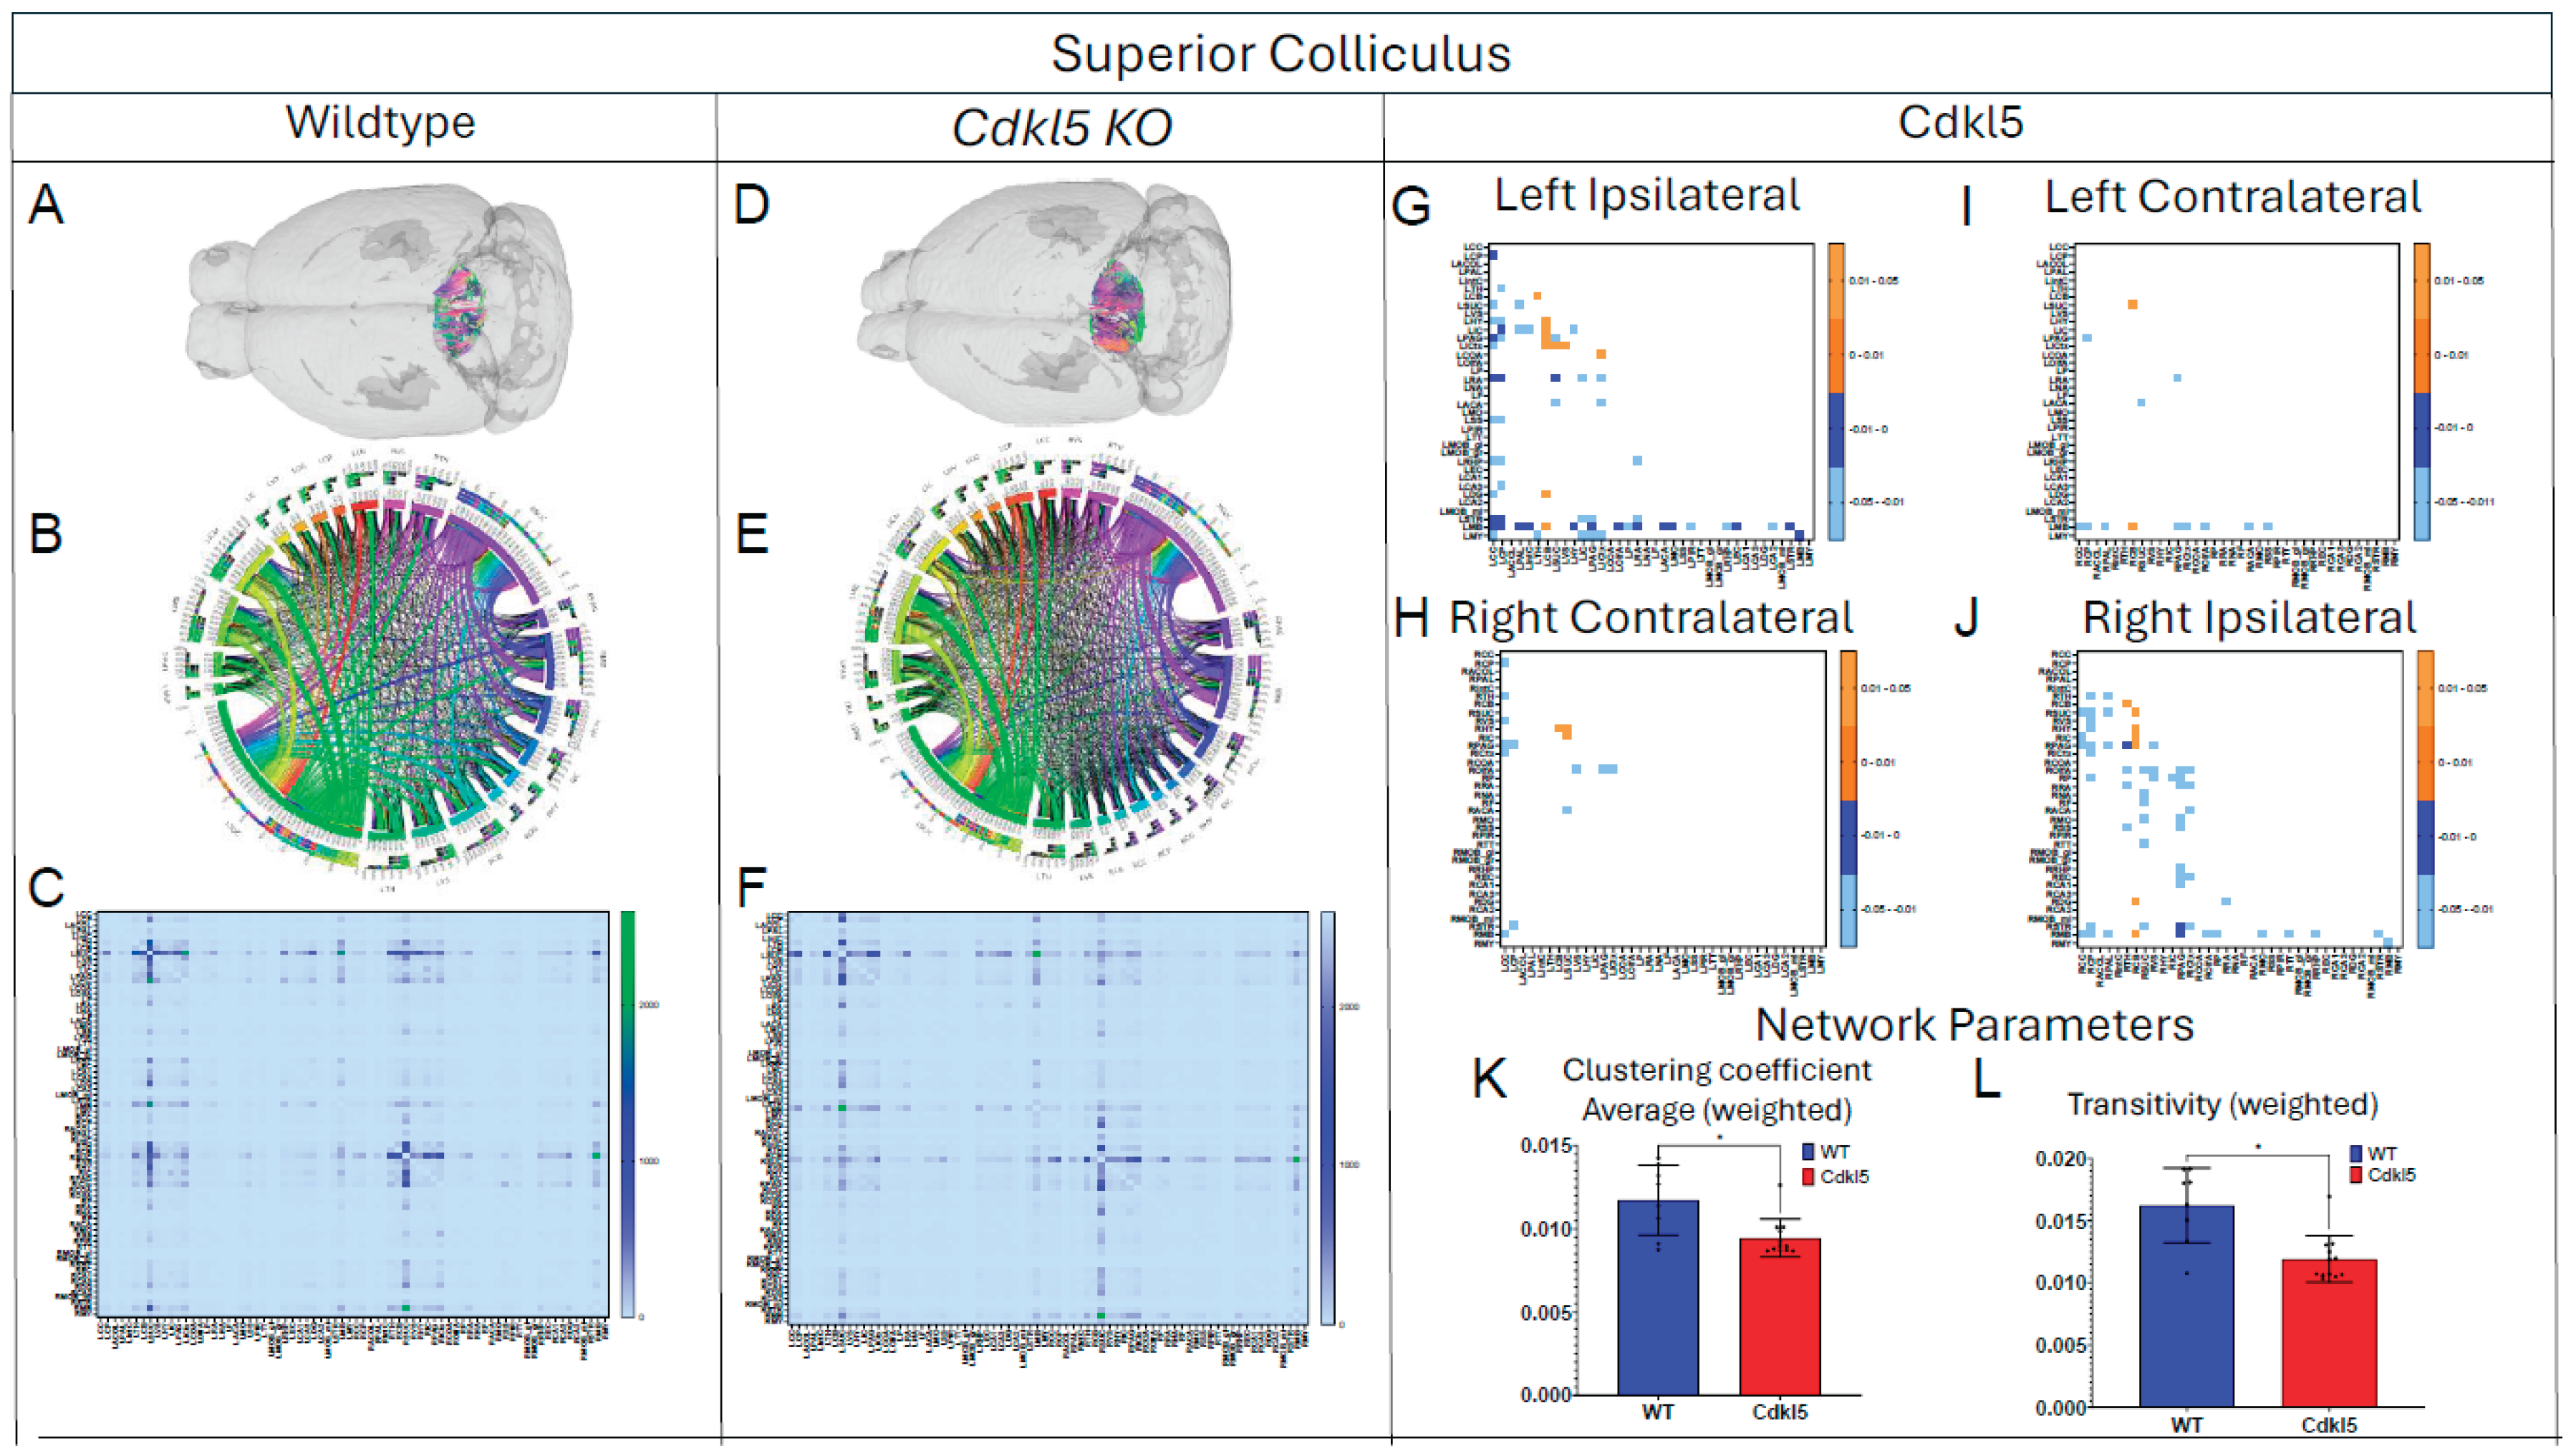
Figure 6.
Diffusion tractography and brain network analysis for Hippocampus. (A, B) Diffusion tractography (B, E) connectogram (C, F) adjacency matrix for WT (A-C) or hemizygous Cdkl5 KO mice (D-F). (G-J) P value matrix to compare connectomes, an adjacency matrix of signed FDR adjusted p-values shows connections between regions where Cdkl5 KO > WT (0.01-0.05 light orange, 0.005-0.01 dark orange) and connections between regions where WT > Cdkl5 KO (0.0- -0.05 light blue, -0.005- -0.01 dark blue) for (G) left ipsilateral hemisphere connections (left to left hemisphere), (H) right contralateral connections (right to left hemispheres) (I) left contralateral connections (left to right hemispheres) and (J) right ipsilateral hemisphere connections (right to right hemisphere). (K) Network parameter – Density. Blue – WT, Red – Cdkl5 KO. .
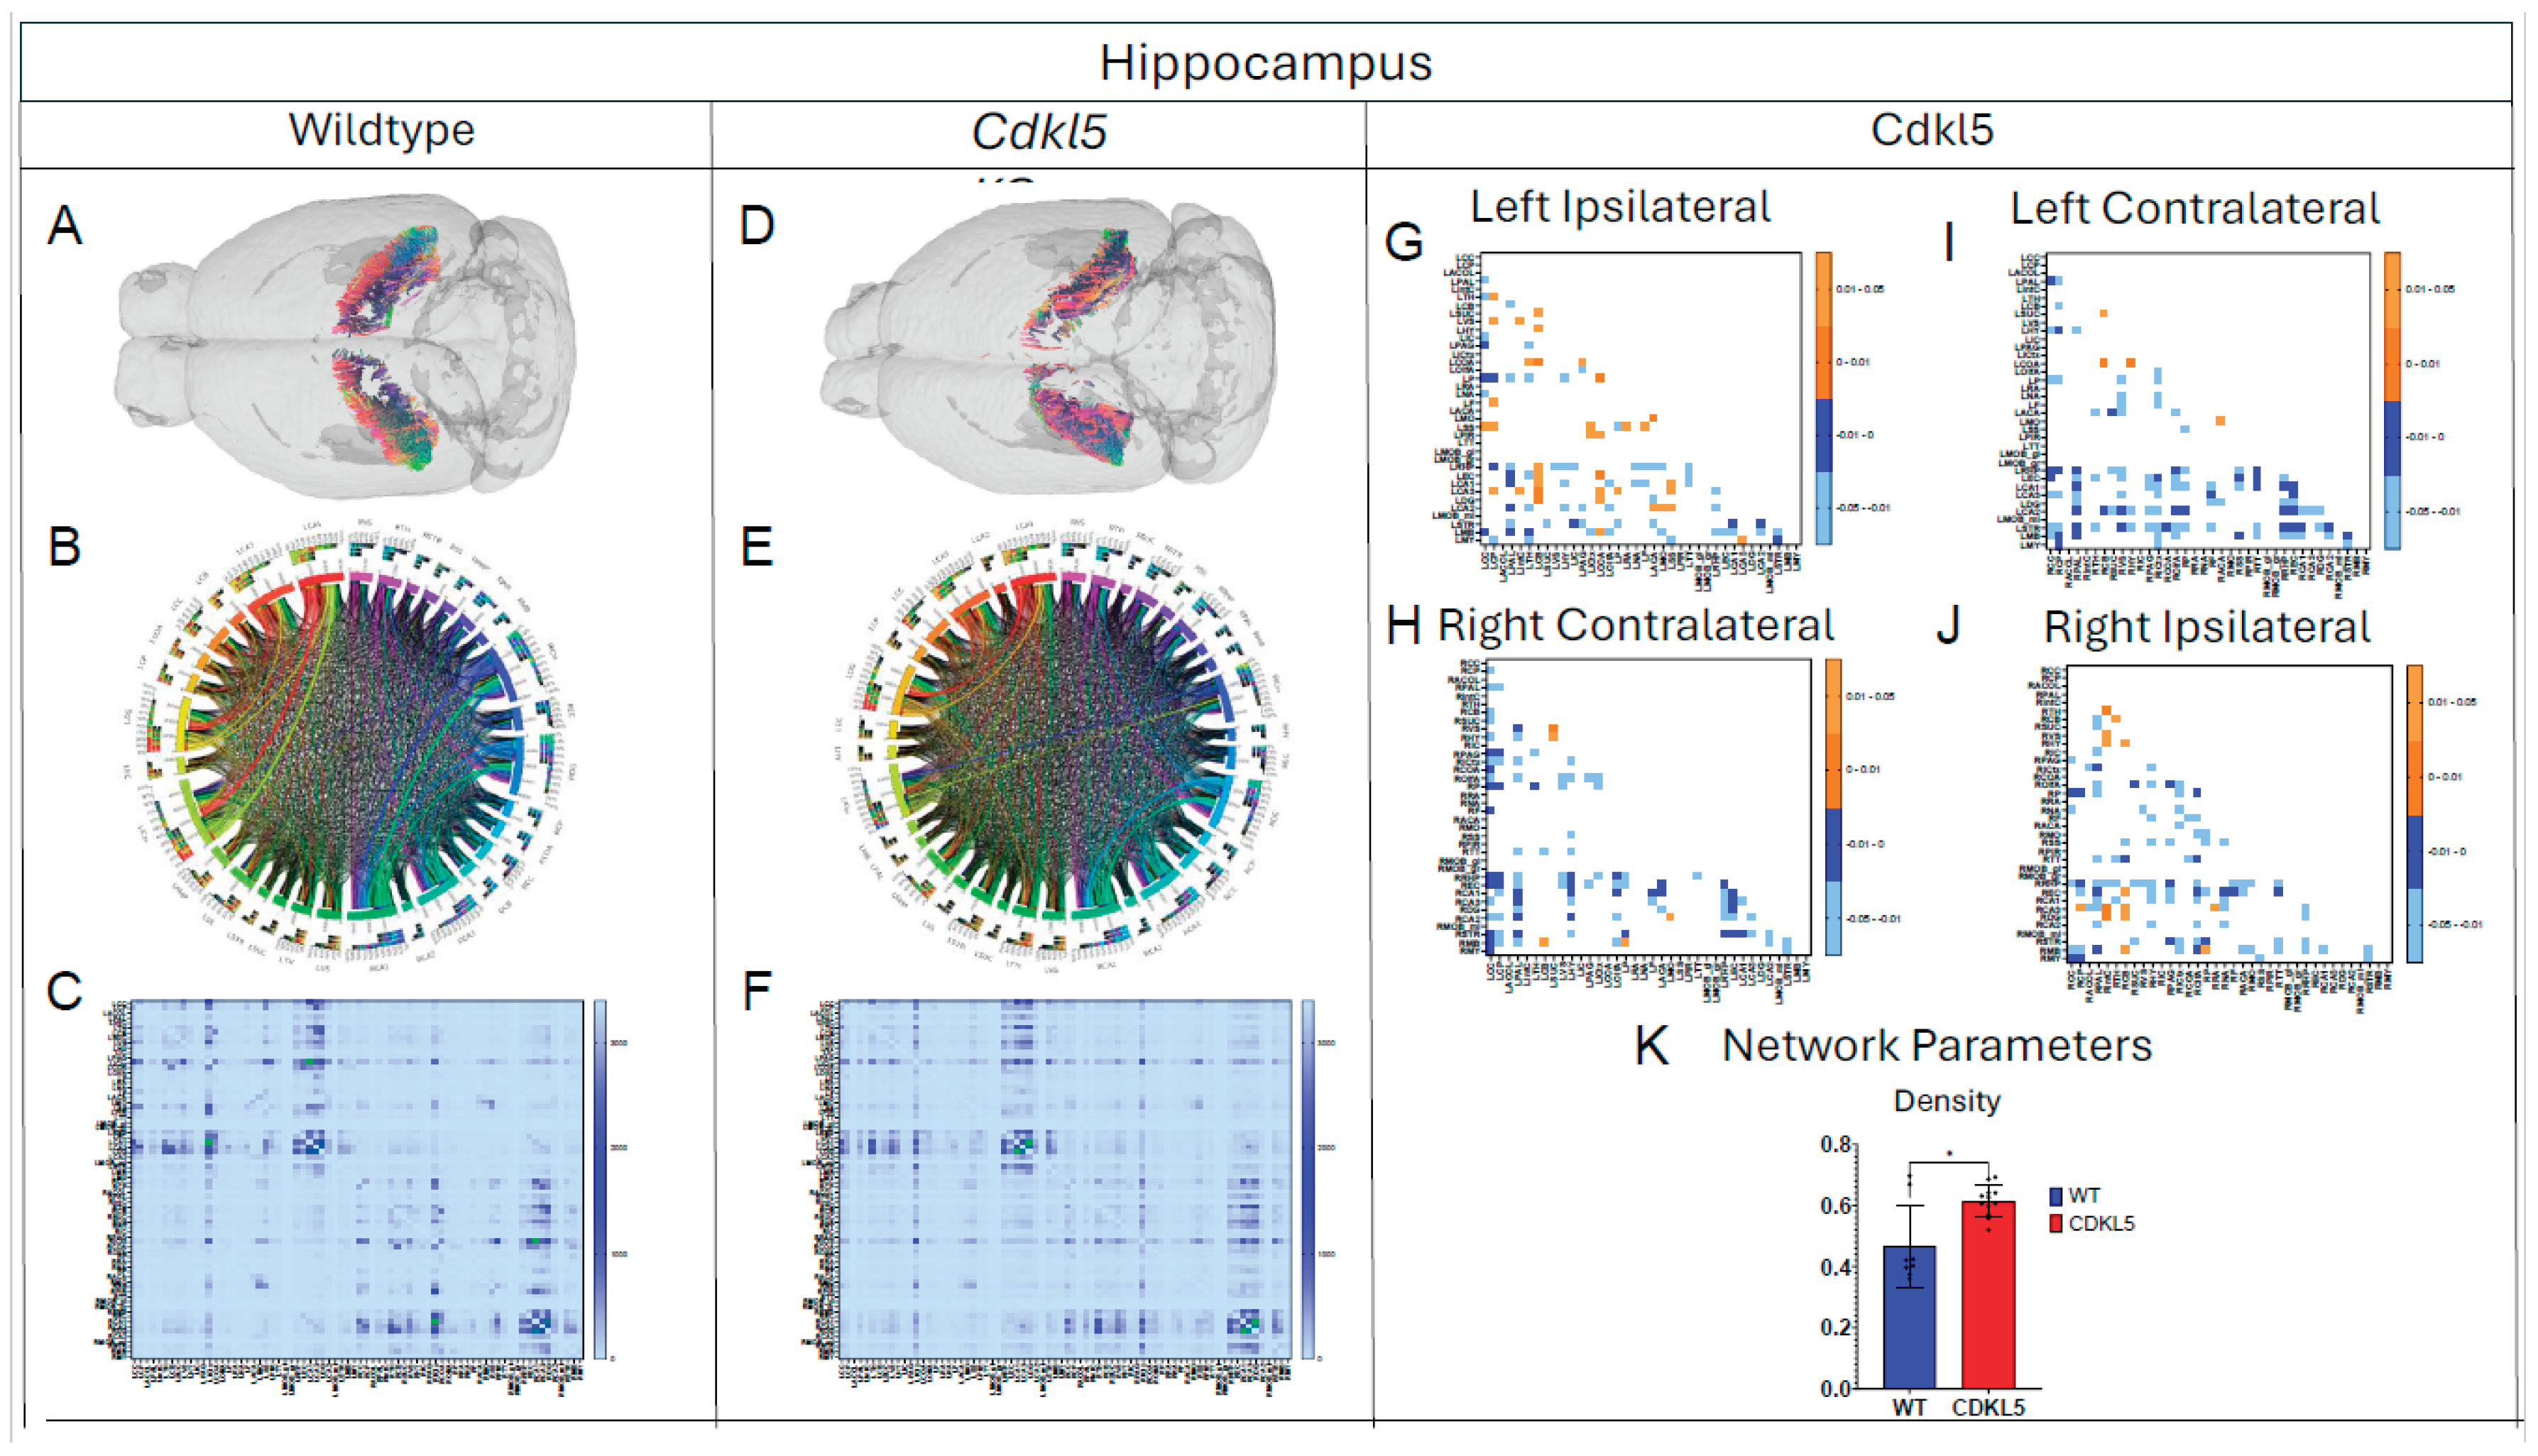
Figure 7.
Diffusion tractography and brain network analysis for Thalamus. (A, B) Diffusion tractography (B, E) connectogram (C, F) adjacency matrix for WT (A-C) or hemizygous Cdkl5 KO mice (D-F). (G-J) P value matrix to compare connectomes, an adjacency matrix of signed FDR adjusted p-values shows connections between regions where Cdkl5 KO > WT (0.01-0.05 light orange, 0.005-0.01 dark orange) and connections between regions where WT > Cdkl5 KO (0.0- -0.05 light blue, -0.005- -0.01 dark blue) for (G) left ipsilateral hemisphere connections (left to left hemisphere), (H) right contralateral connections (right to left hemispheres) (I) left contralateral connections (left to right hemispheres) and (J) right ipsilateral hemisphere connections (right to right hemisphere). (K) Network parameter – Density. Blue – WT, Red – Cdkl5 KO. .
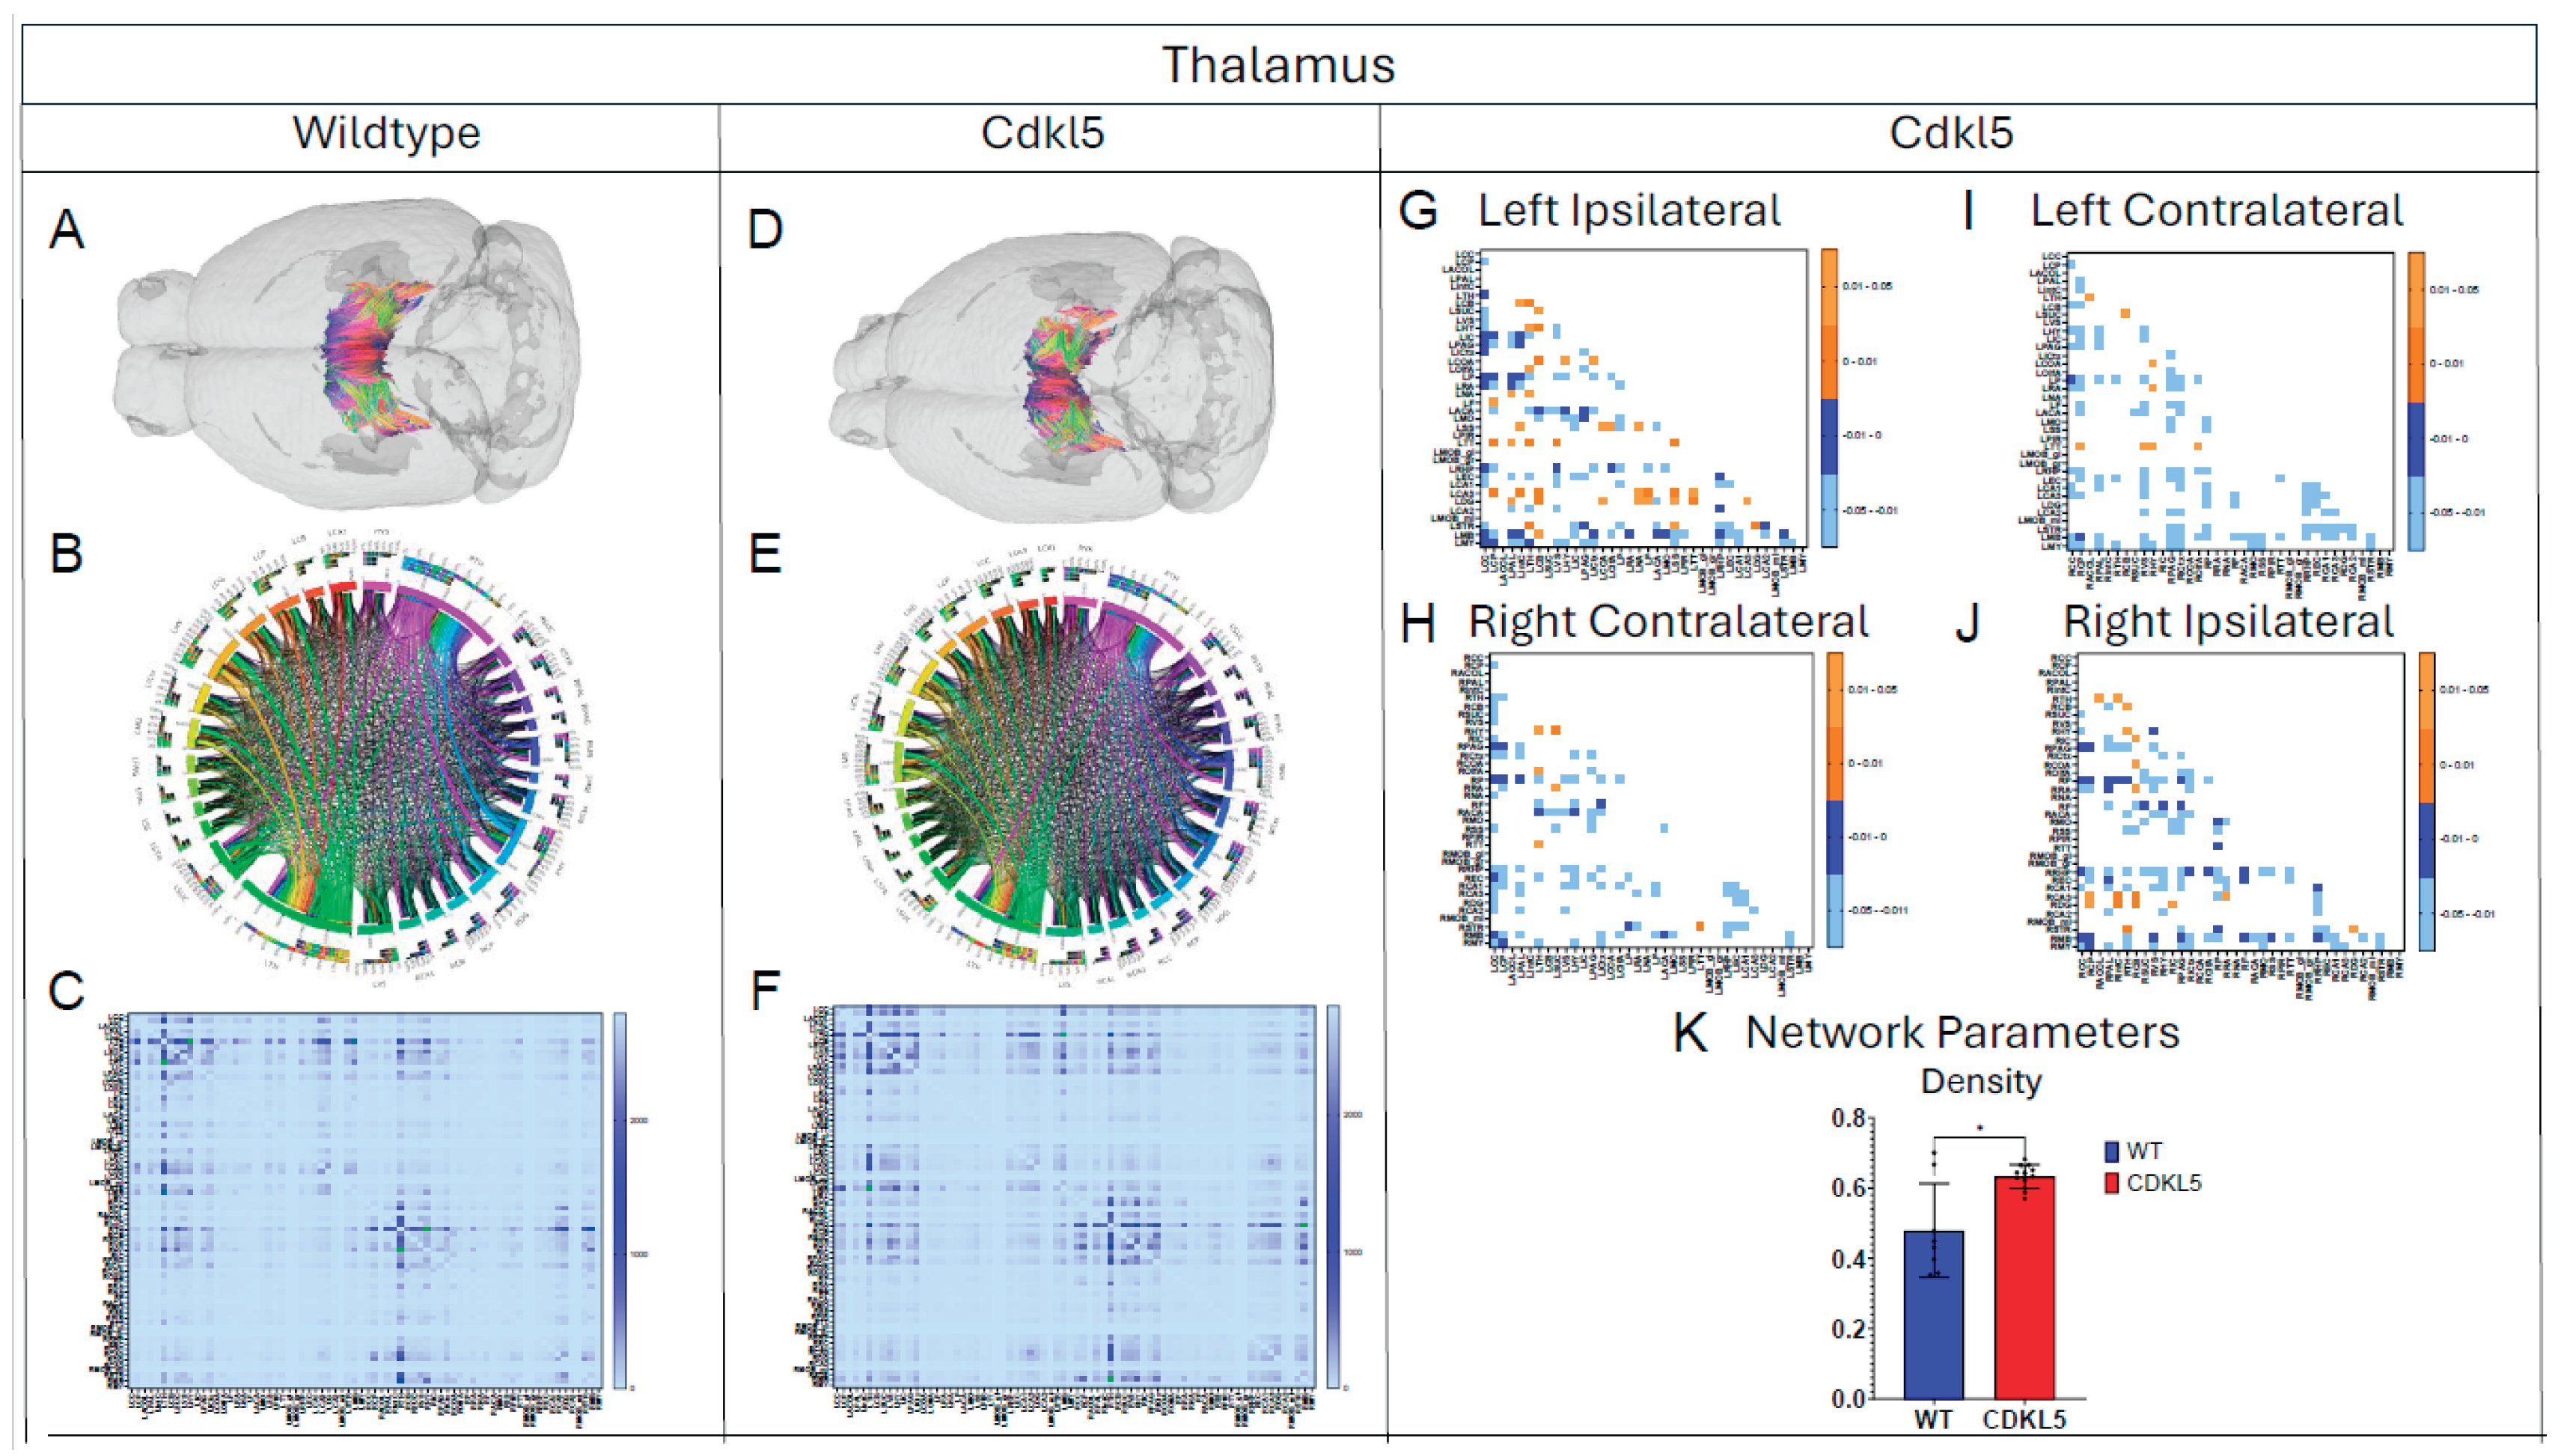
Figure 8.
Diffusion tractography and brain network analysis for Entorhinal Cortex. (A,B) Diffusion tractography (B, E) connectogram (C, F) adjacency matrix for WT (A-C) or hemizygous Cdkl5 KO mice (D-F). (G-J) P value matrix to compare connectomes, an adjacency matrix of signed FDR adjusted p-values shows connections between regions where Cdkl5 KO > WT (0.01-0.05 light orange, 0.005-0.01 dark orange) and connections between regions where WT > Cdkl5 KO (0.0- -0.05 light blue, -0.005- -0.01 dark blue) for (G) left ipsilateral hemisphere connections (left to left hemisphere), (H) right contralateral connections (right to left hemispheres) (I) left contralateral connections (left to right hemispheres) and (J) right ipsilateral hemisphere connections (right to right hemisphere). (K-N) Network parameter (K) Density, (L) Transivity (weighted), (M) Path length, (N) Assortativity coefficient (weighted). Blue – WT, Red – Cdkl5 KO. .
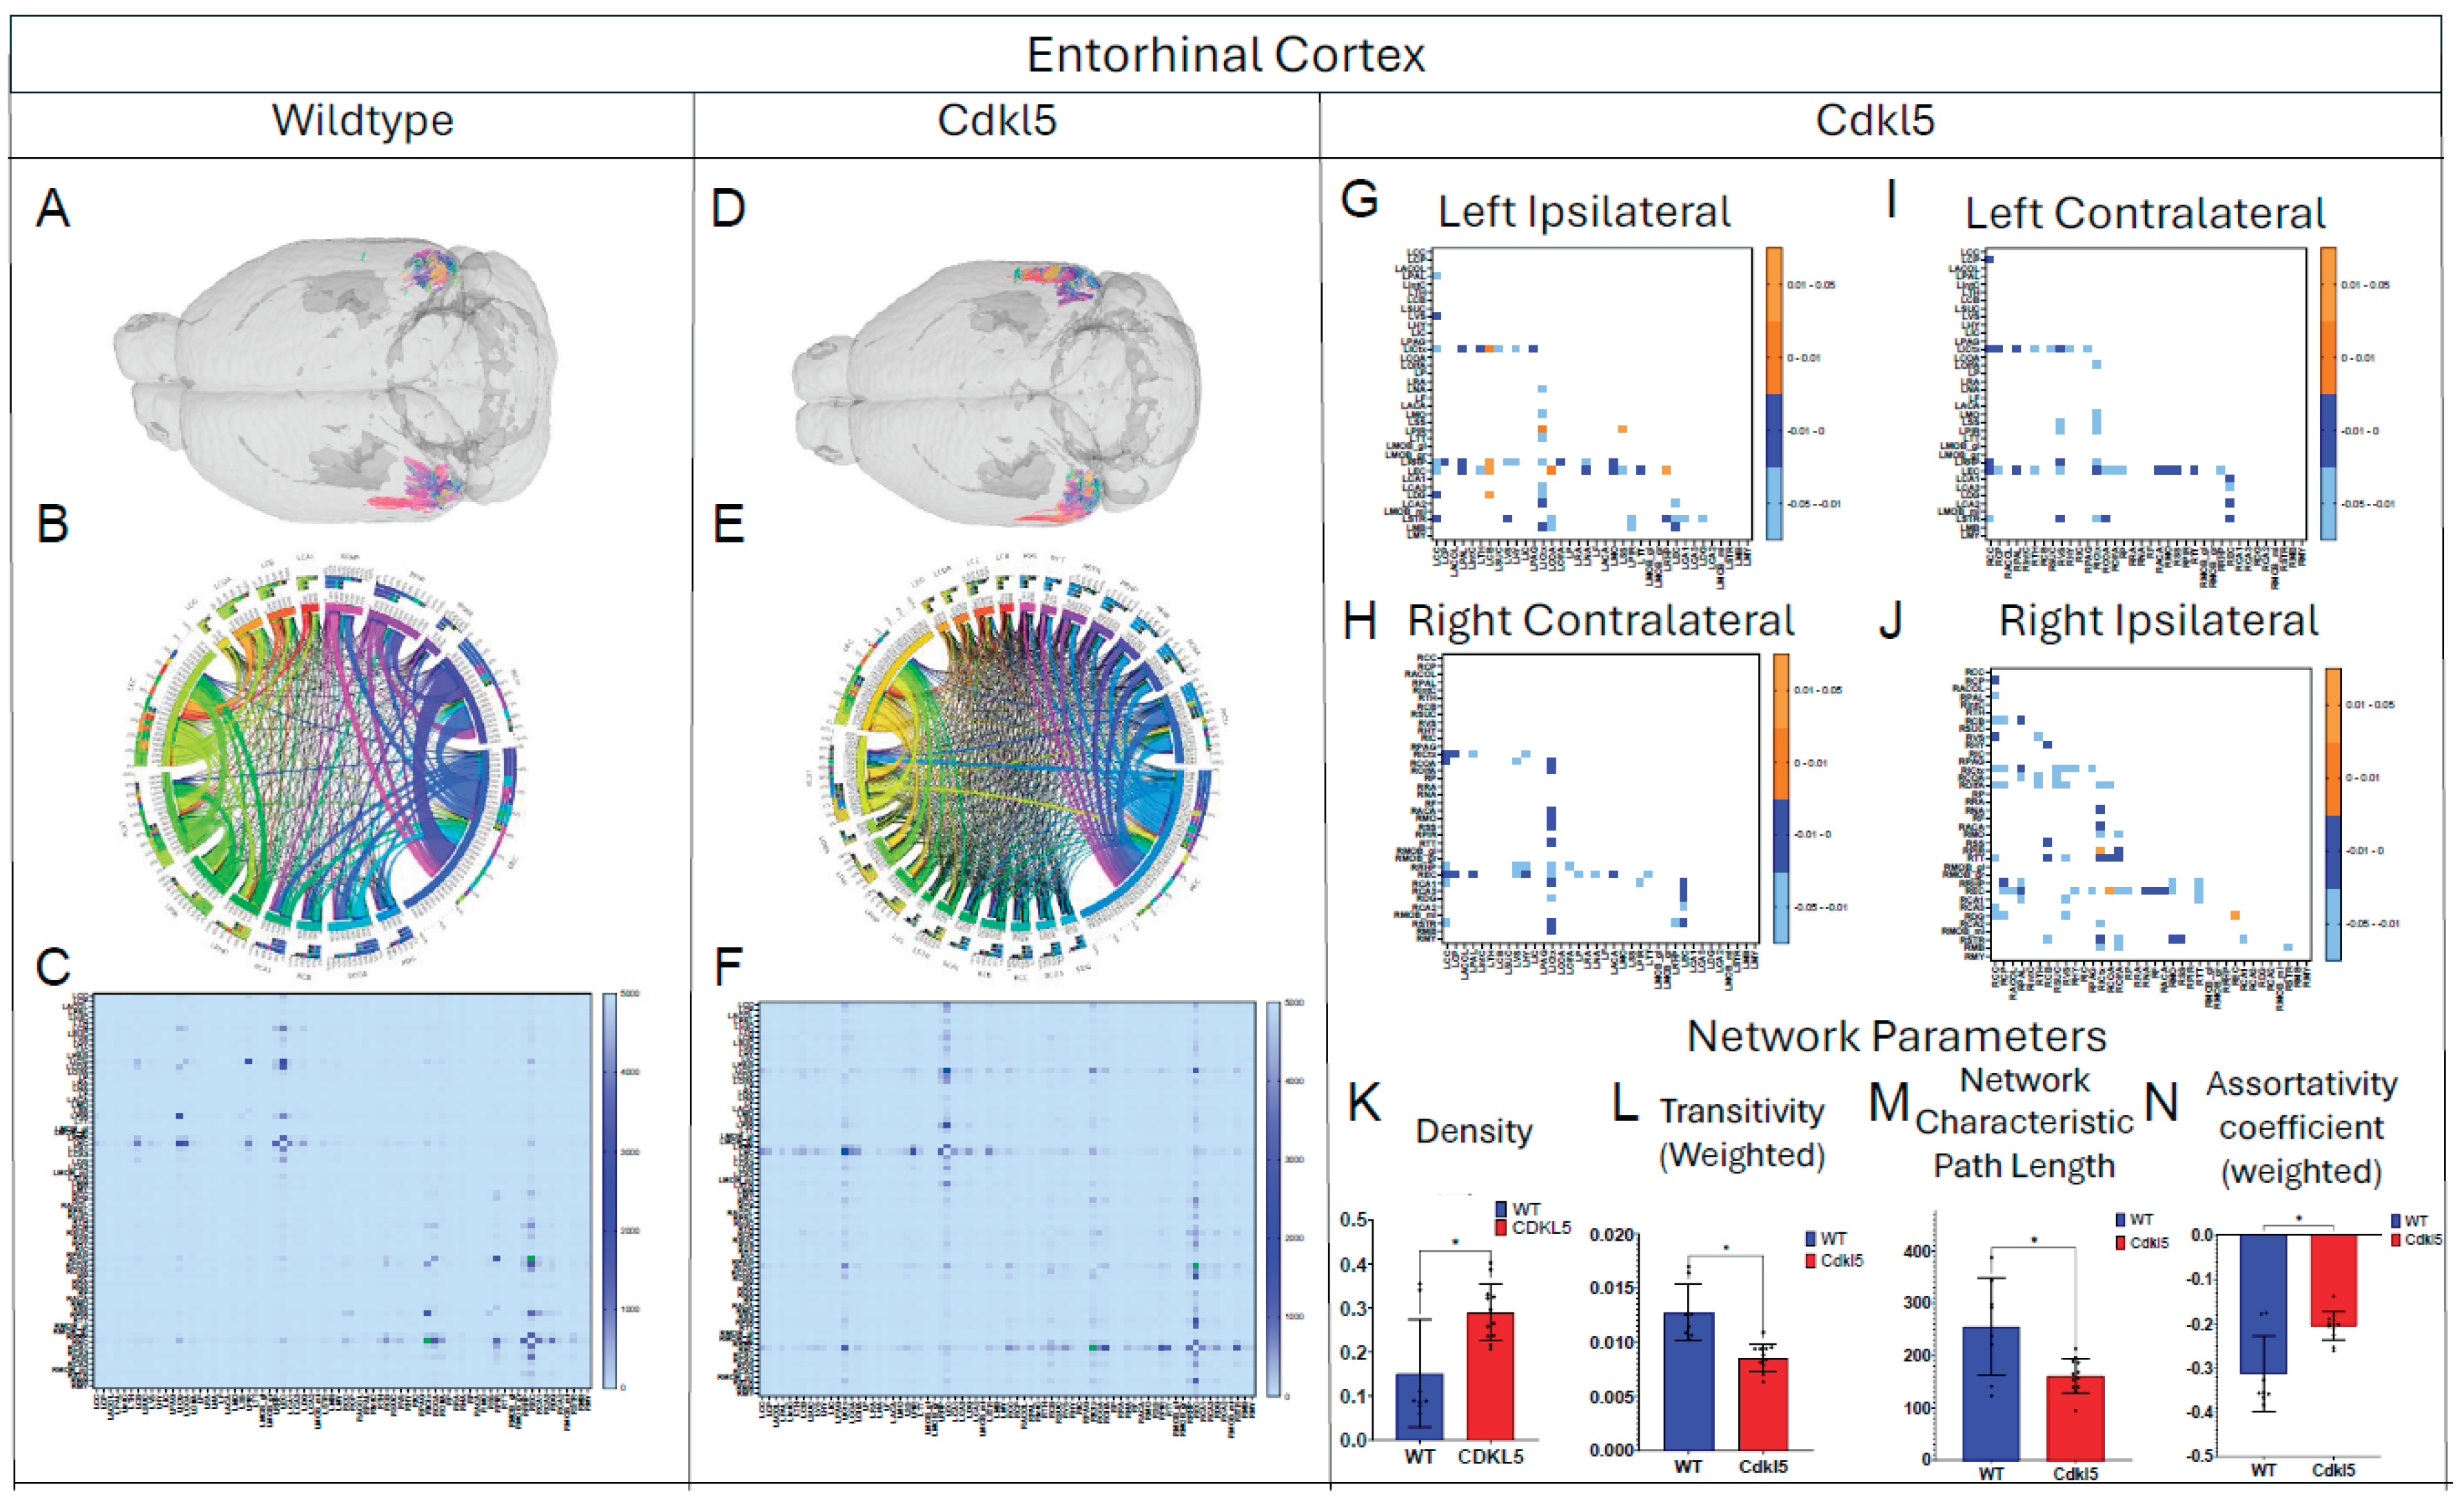
Figure 9.
Diffusion tractography and brain network analysis for Hypothalamus. (A, B) Diffusion tractography (B, E) connectogram (C, F) adjacency matrix for WT (A-C) or hemizygous Cdkl5 KO mice (D-F). (G-J) P value matrix to compare connectomes, an adjacency matrix of signed FDR adjusted p-values shows connections between regions where Cdkl5 KO > WT (0.01-0.05 light orange, 0.005-0.01 dark orange) and connections between regions where WT > Cdkl5 KO (0.0- -0.05 light blue, -0.005- -0.01 dark blue) for (G) left ipsilateral hemisphere connections (left to left hemisphere), (H) right contralateral connections (right to left hemispheres) (I) left contralateral connections (left to right hemispheres) and (J) right ipsilateral hemisphere connections (right to right hemisphere). (K-N) Network parameter (K) Density, (L) Small worldness (weighted), (M) Local coefficiency (weighted), (N) Global efficiency (weighted). Blue – WT, Red – Cdkl5 KO. .
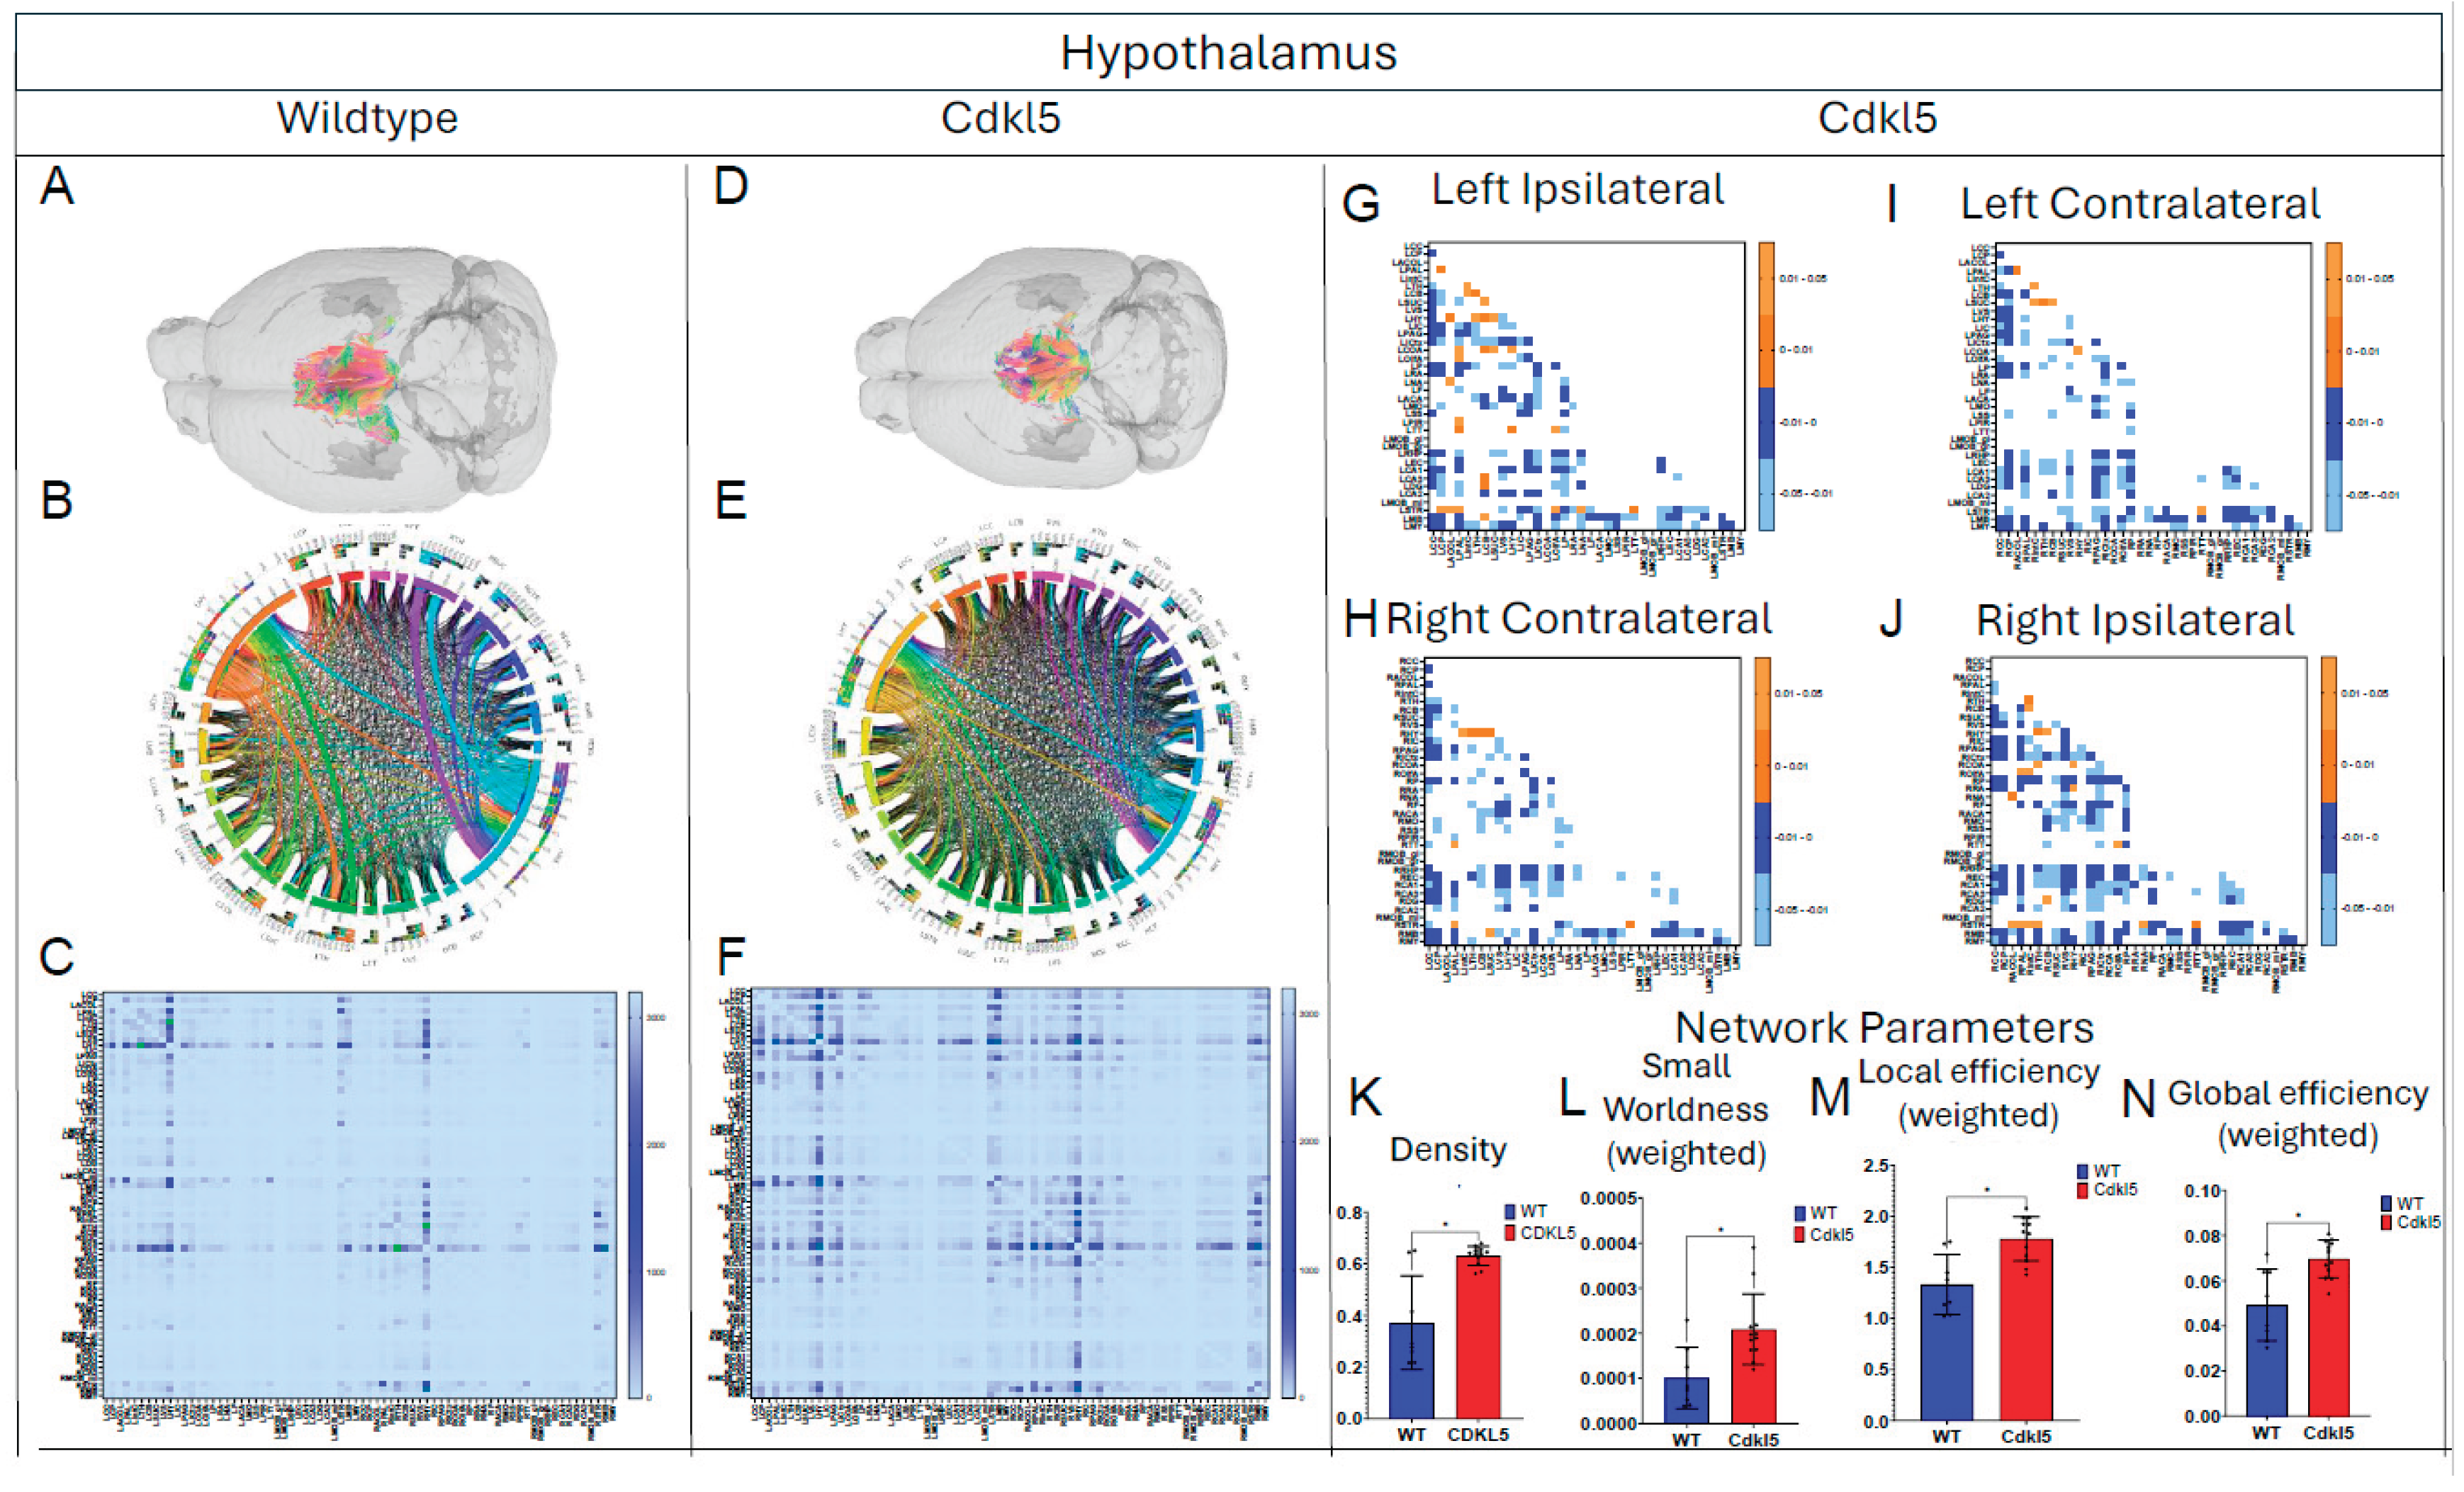
Figure 10.
Diffusion tractography and brain network analysis for Medulla. (A, B) Diffusion tractography (B, E) connectogram (C, F) adjacency matrix for WT (A-C) or hemizygous Cdkl5 KO mice (D-F). (G-J) P value matrix to compare connectomes, an adjacency matrix of signed FDR adjusted p-values shows connections between regions where Cdkl5 KO > WT (0.01-0.05 light orange, 0.005-0.01 dark orange) and connections between regions where WT > Cdkl5 KO (0.0- -0.05 light blue, -0.005- -0.01 dark blue) for (G) left ipsilateral hemisphere connections (left to left hemisphere), (H) right contralateral connections (right to left hemispheres) (I) left contralateral connections (left to right hemispheres) and (J) right ipsilateral hemisphere connections (right to right hemisphere). (K-N) Network parameter (K) Clustering coefficient, (L) Global efficiency, (M) Local efficiency, (N) Transivity. Blue – WT, Red – Cdkl5 KO. .
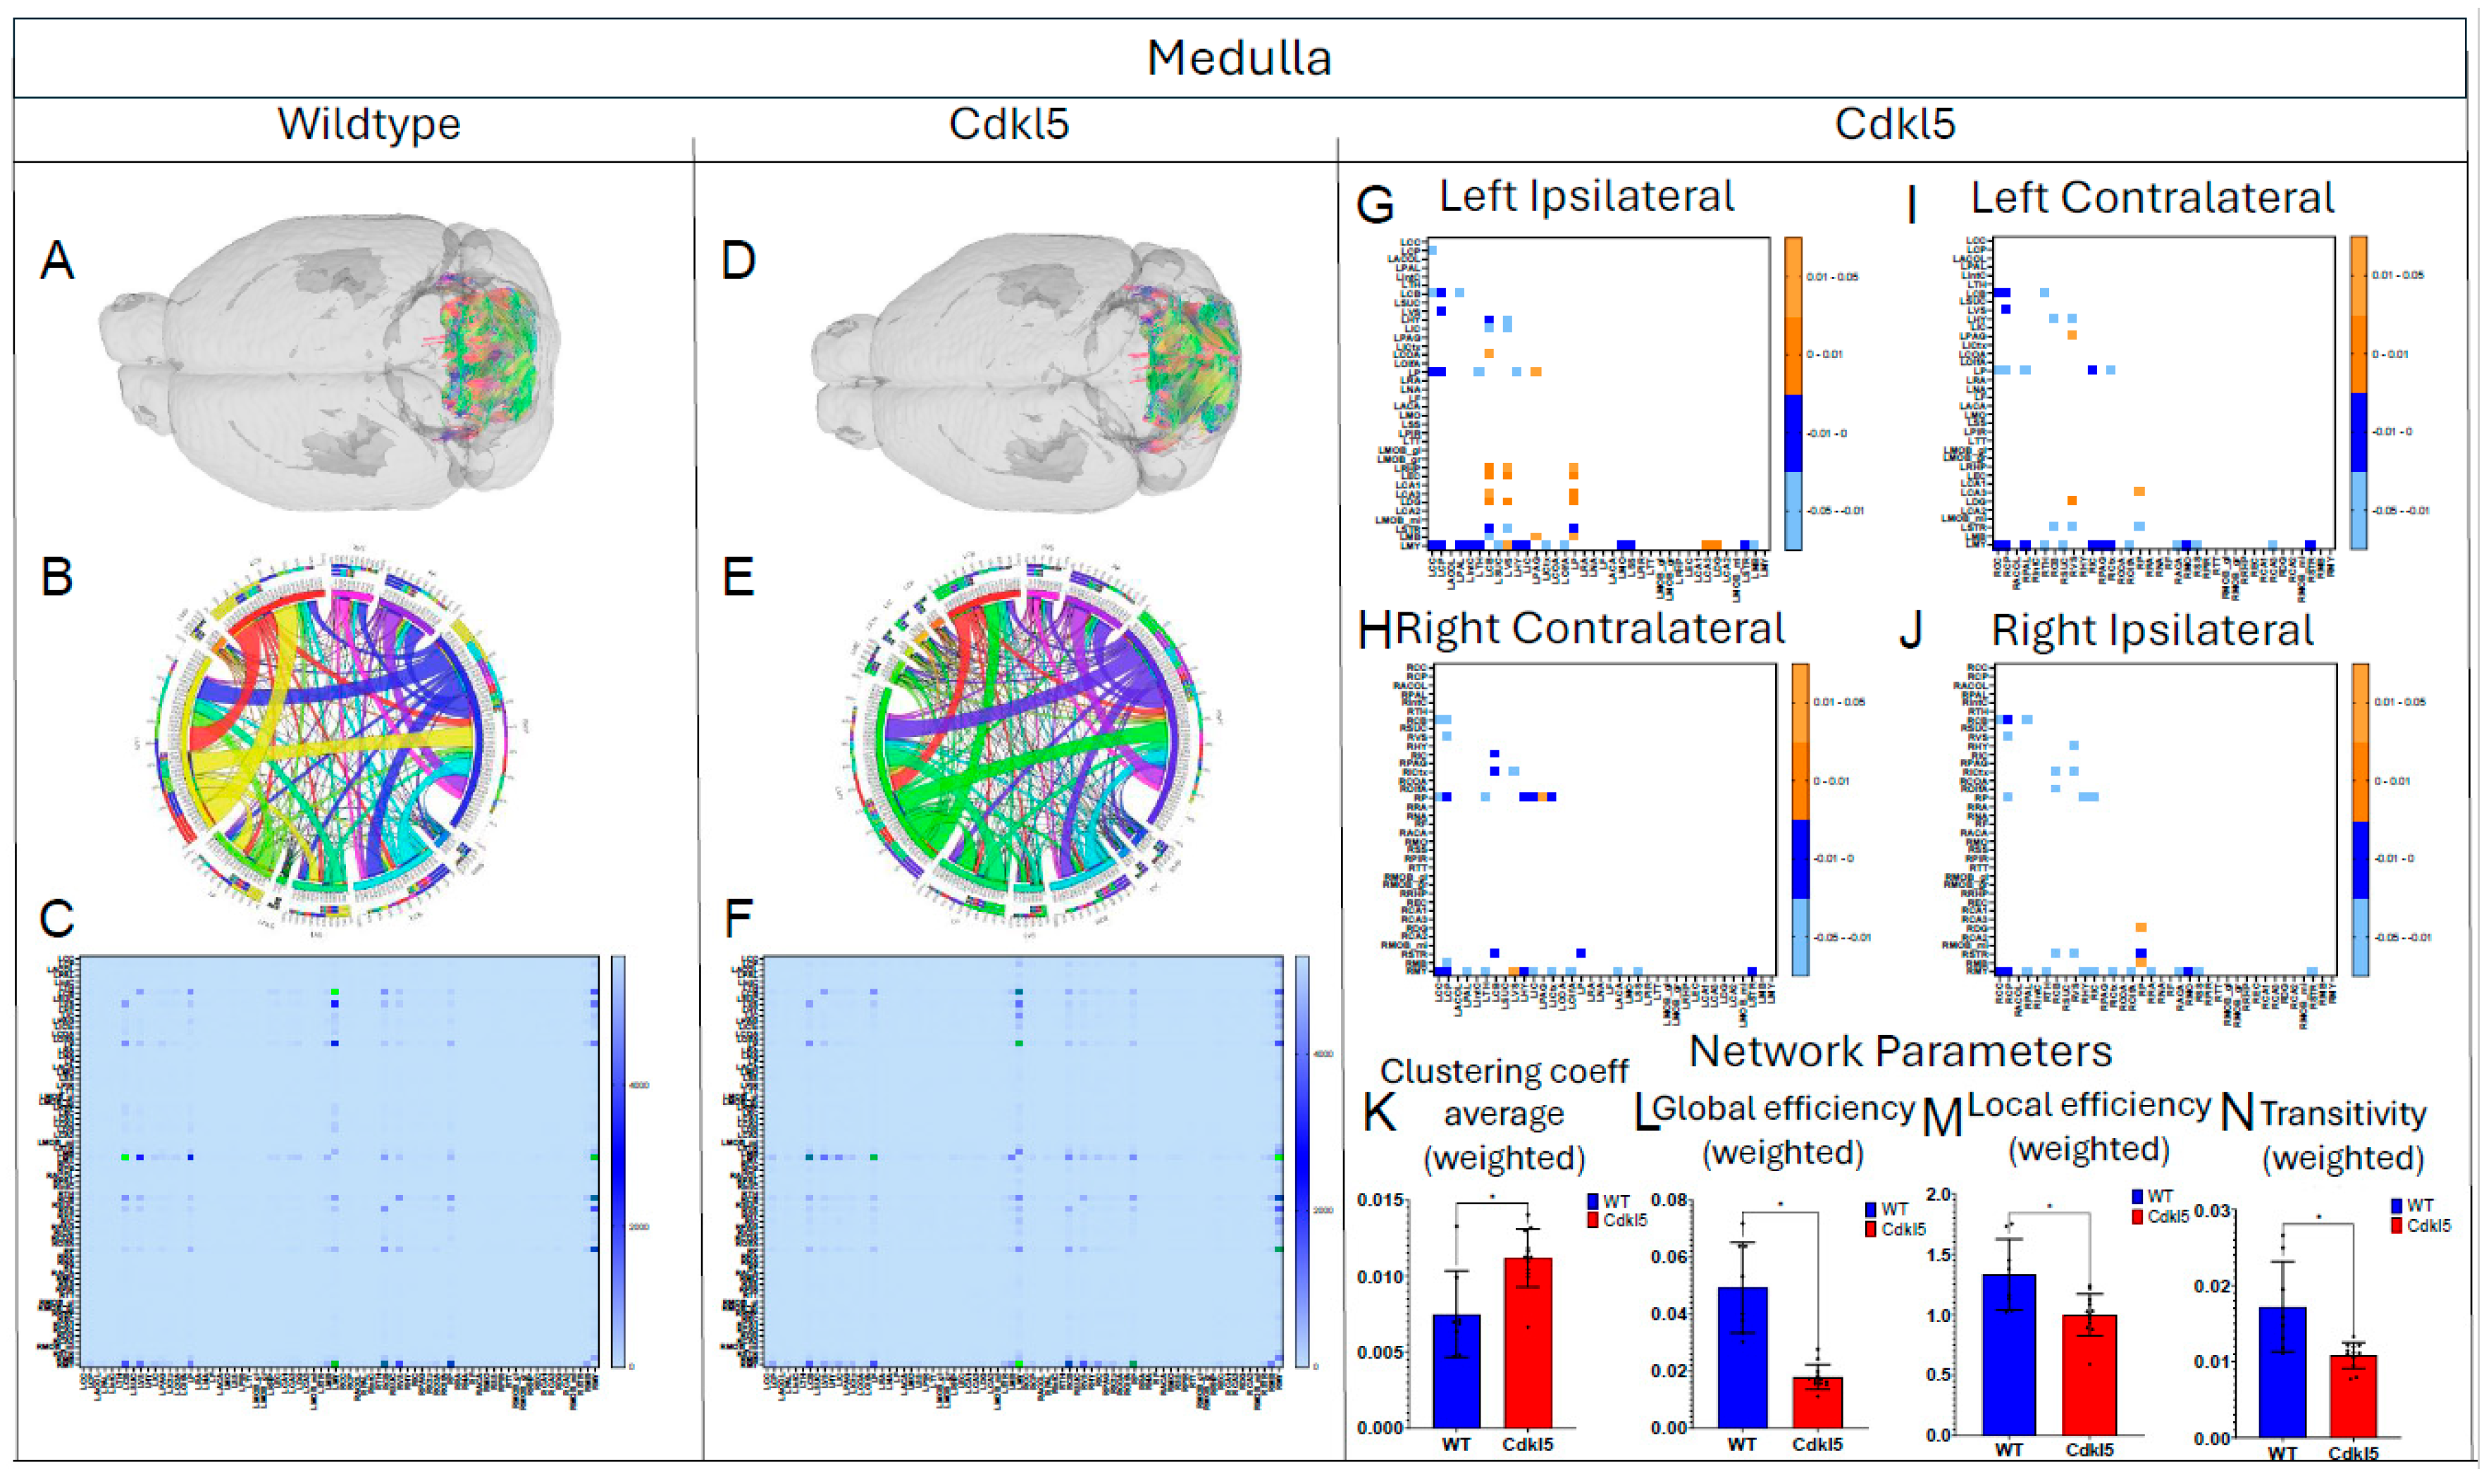
Figure 11.
Diffusion tractography and brain network analysis for Motor Cortex. (A, B) Diffusion tractography (B, E) connectogram (C, F) adjacency matrix for WT (A-C) or hemizygous Cdkl5 KO mice (D-F). (G-J) P value matrix to compare connectomes, an adjacency matrix of signed FDR adjusted p-values shows connections between regions where Cdkl5 KO > WT (0.01-0.05 light orange, 0.005-0.01 dark orange) and connections between regions where WT > Cdkl5 KO (0.0- -0.05 light blue, -0.005- -0.01 dark blue) for (G) left ipsilateral hemisphere connections (left to left hemisphere), (H) right contralateral connections (right to left hemispheres) (I) left contralateral connections (left to right hemispheres) and (J) right ipsilateral hemisphere connections (right to right hemisphere). (K) Network parameter – Density. Blue – WT, Red – Cdkl5 KO. .
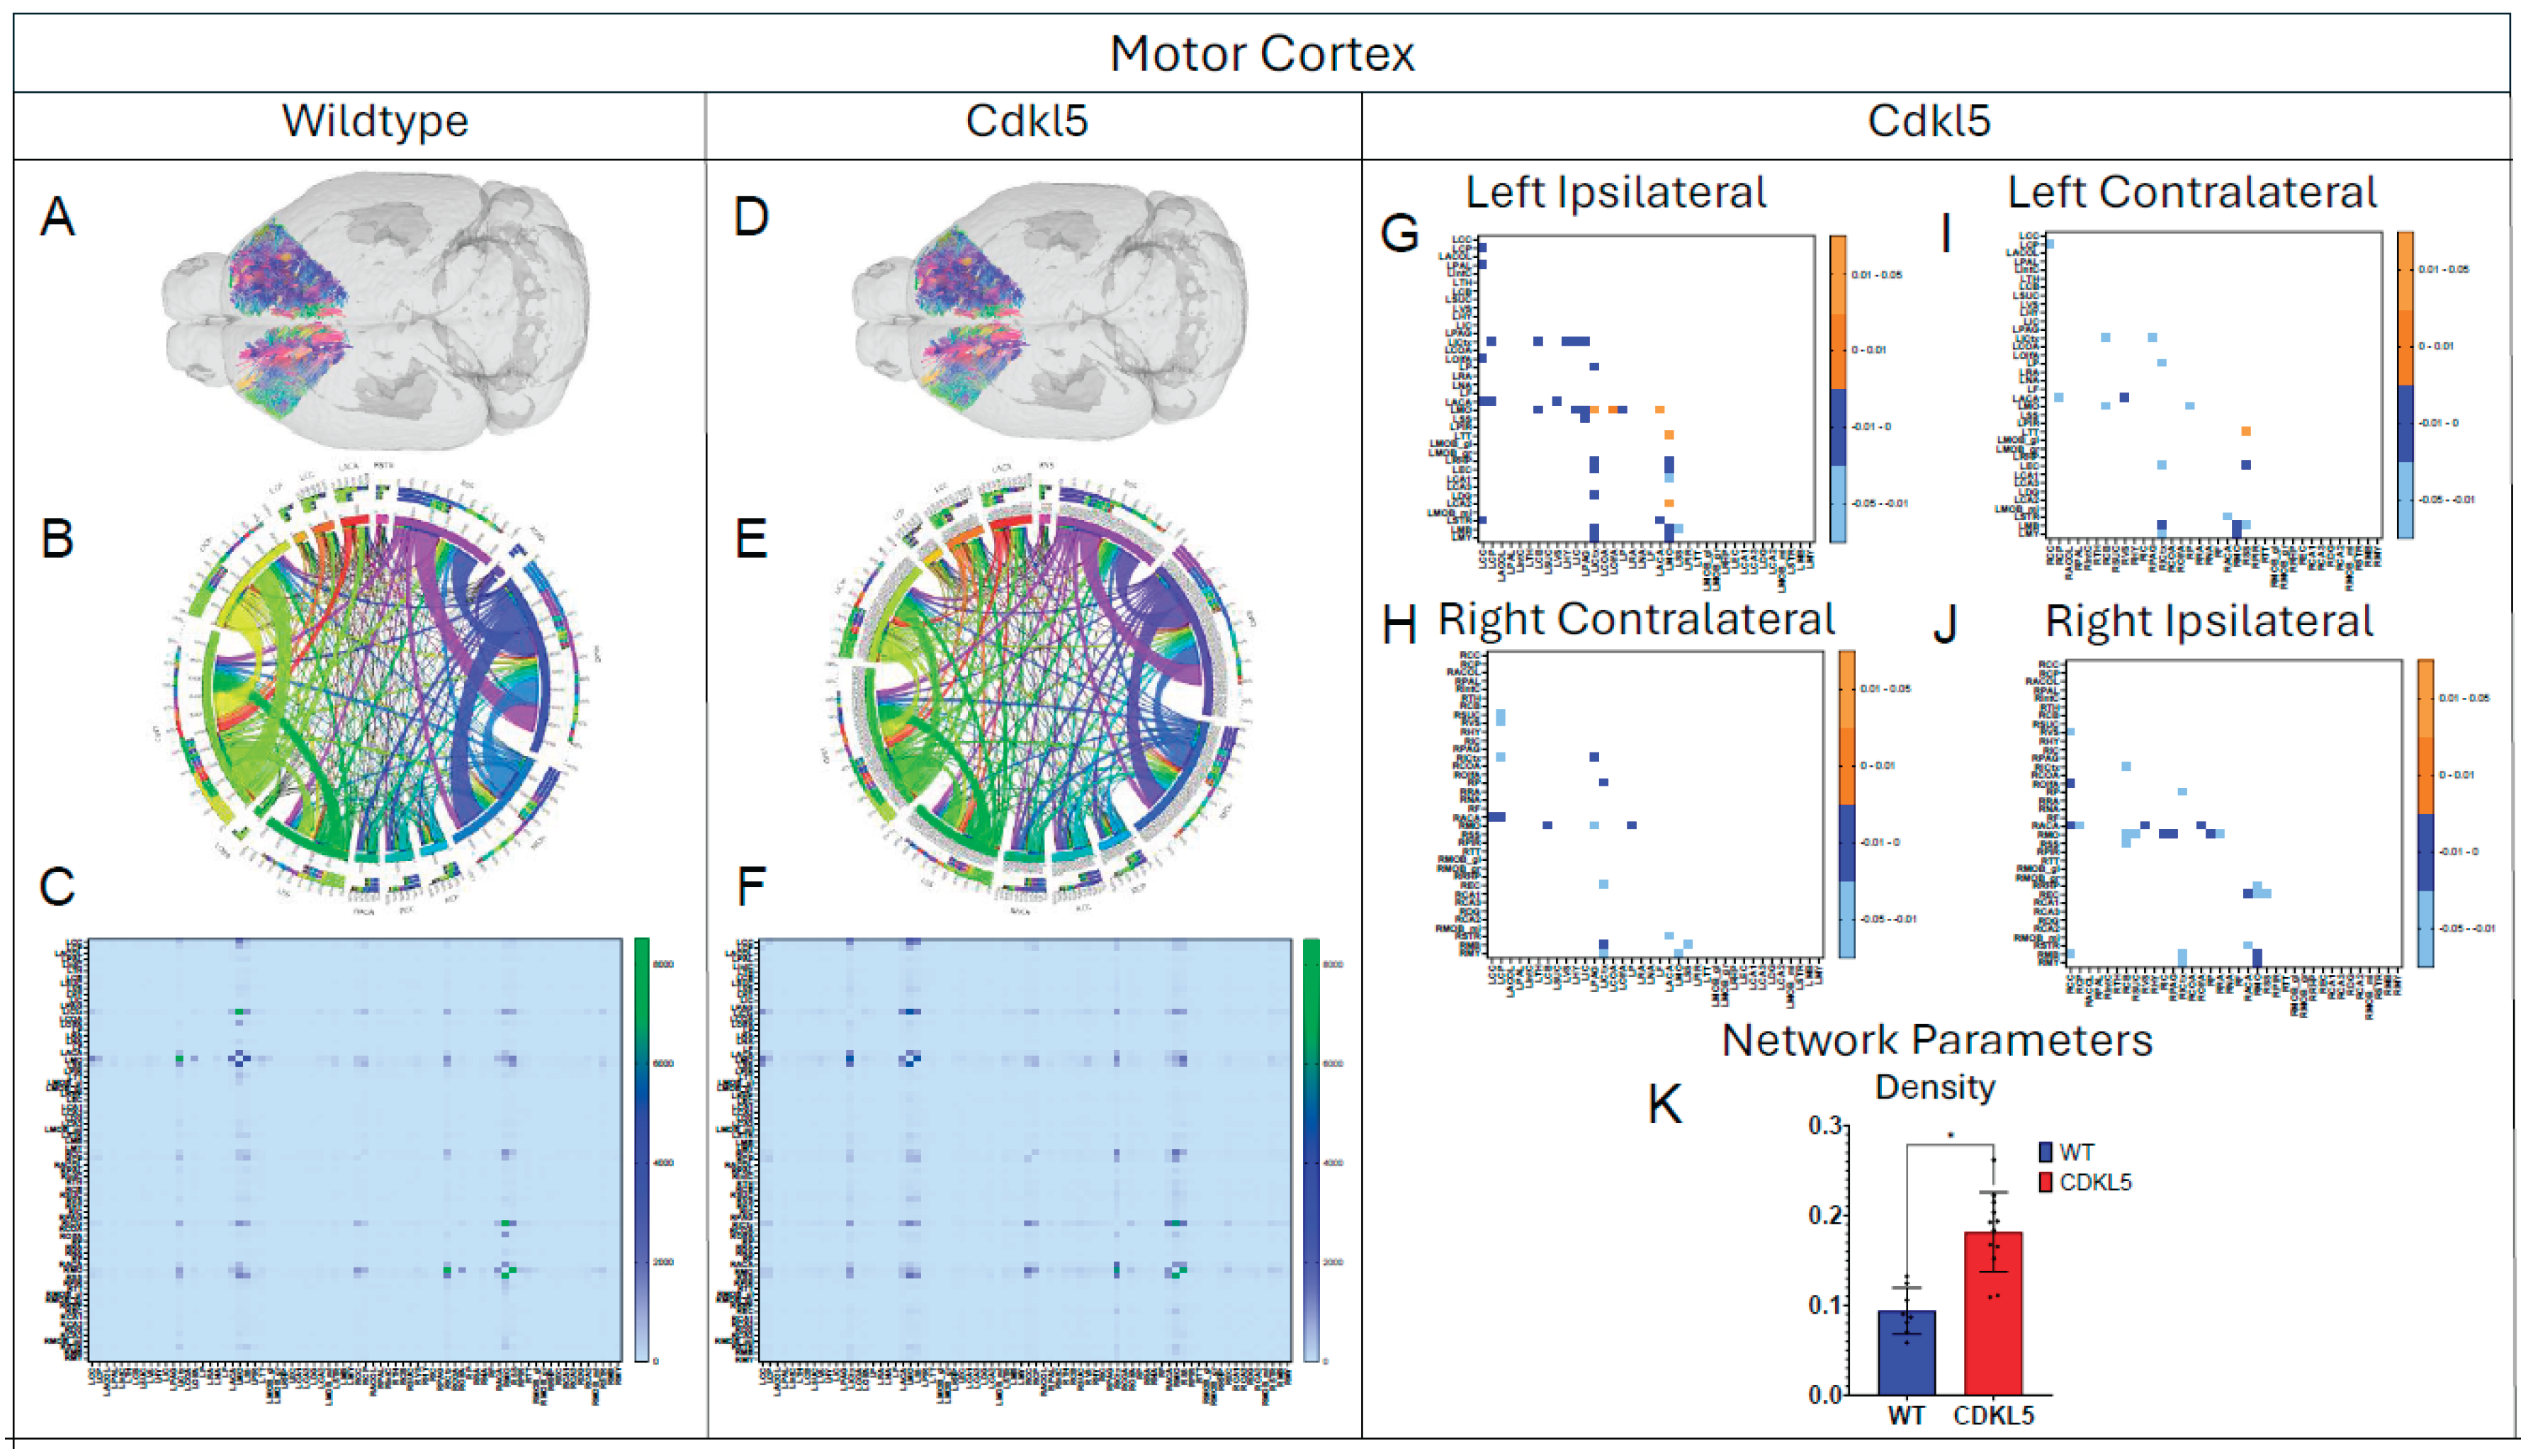
Figure 12.
Diffusion tractography and brain network analysis for Somatosensory Cortex. (A, B) Diffusion tractography (B, E) connectogram (C, F) adjacency matrix for WT (A-C) or hemizygous Cdkl5 KO mice (D-F). (G-J) P value matrix to compare connectomes, an adjacency matrix of signed FDR adjusted p-values shows connections between regions where Cdkl5 KO > WT (0.01-0.05 light orange, 0.005-0.01 dark orange) and connections between regions where WT > Cdkl5 KO (0.0- -0.05 light blue, -0.005- -0.01 dark blue) for (G) left ipsilateral hemisphere connections (left to left hemisphere), (H) right contralateral connections (right to left hemispheres) (I) left contralateral connections (left to right hemispheres) and (J) right ipsilateral hemisphere connections (right to right hemisphere). (K) Network parameter – Density. Blue – WT, Red – Cdkl5 KO. .
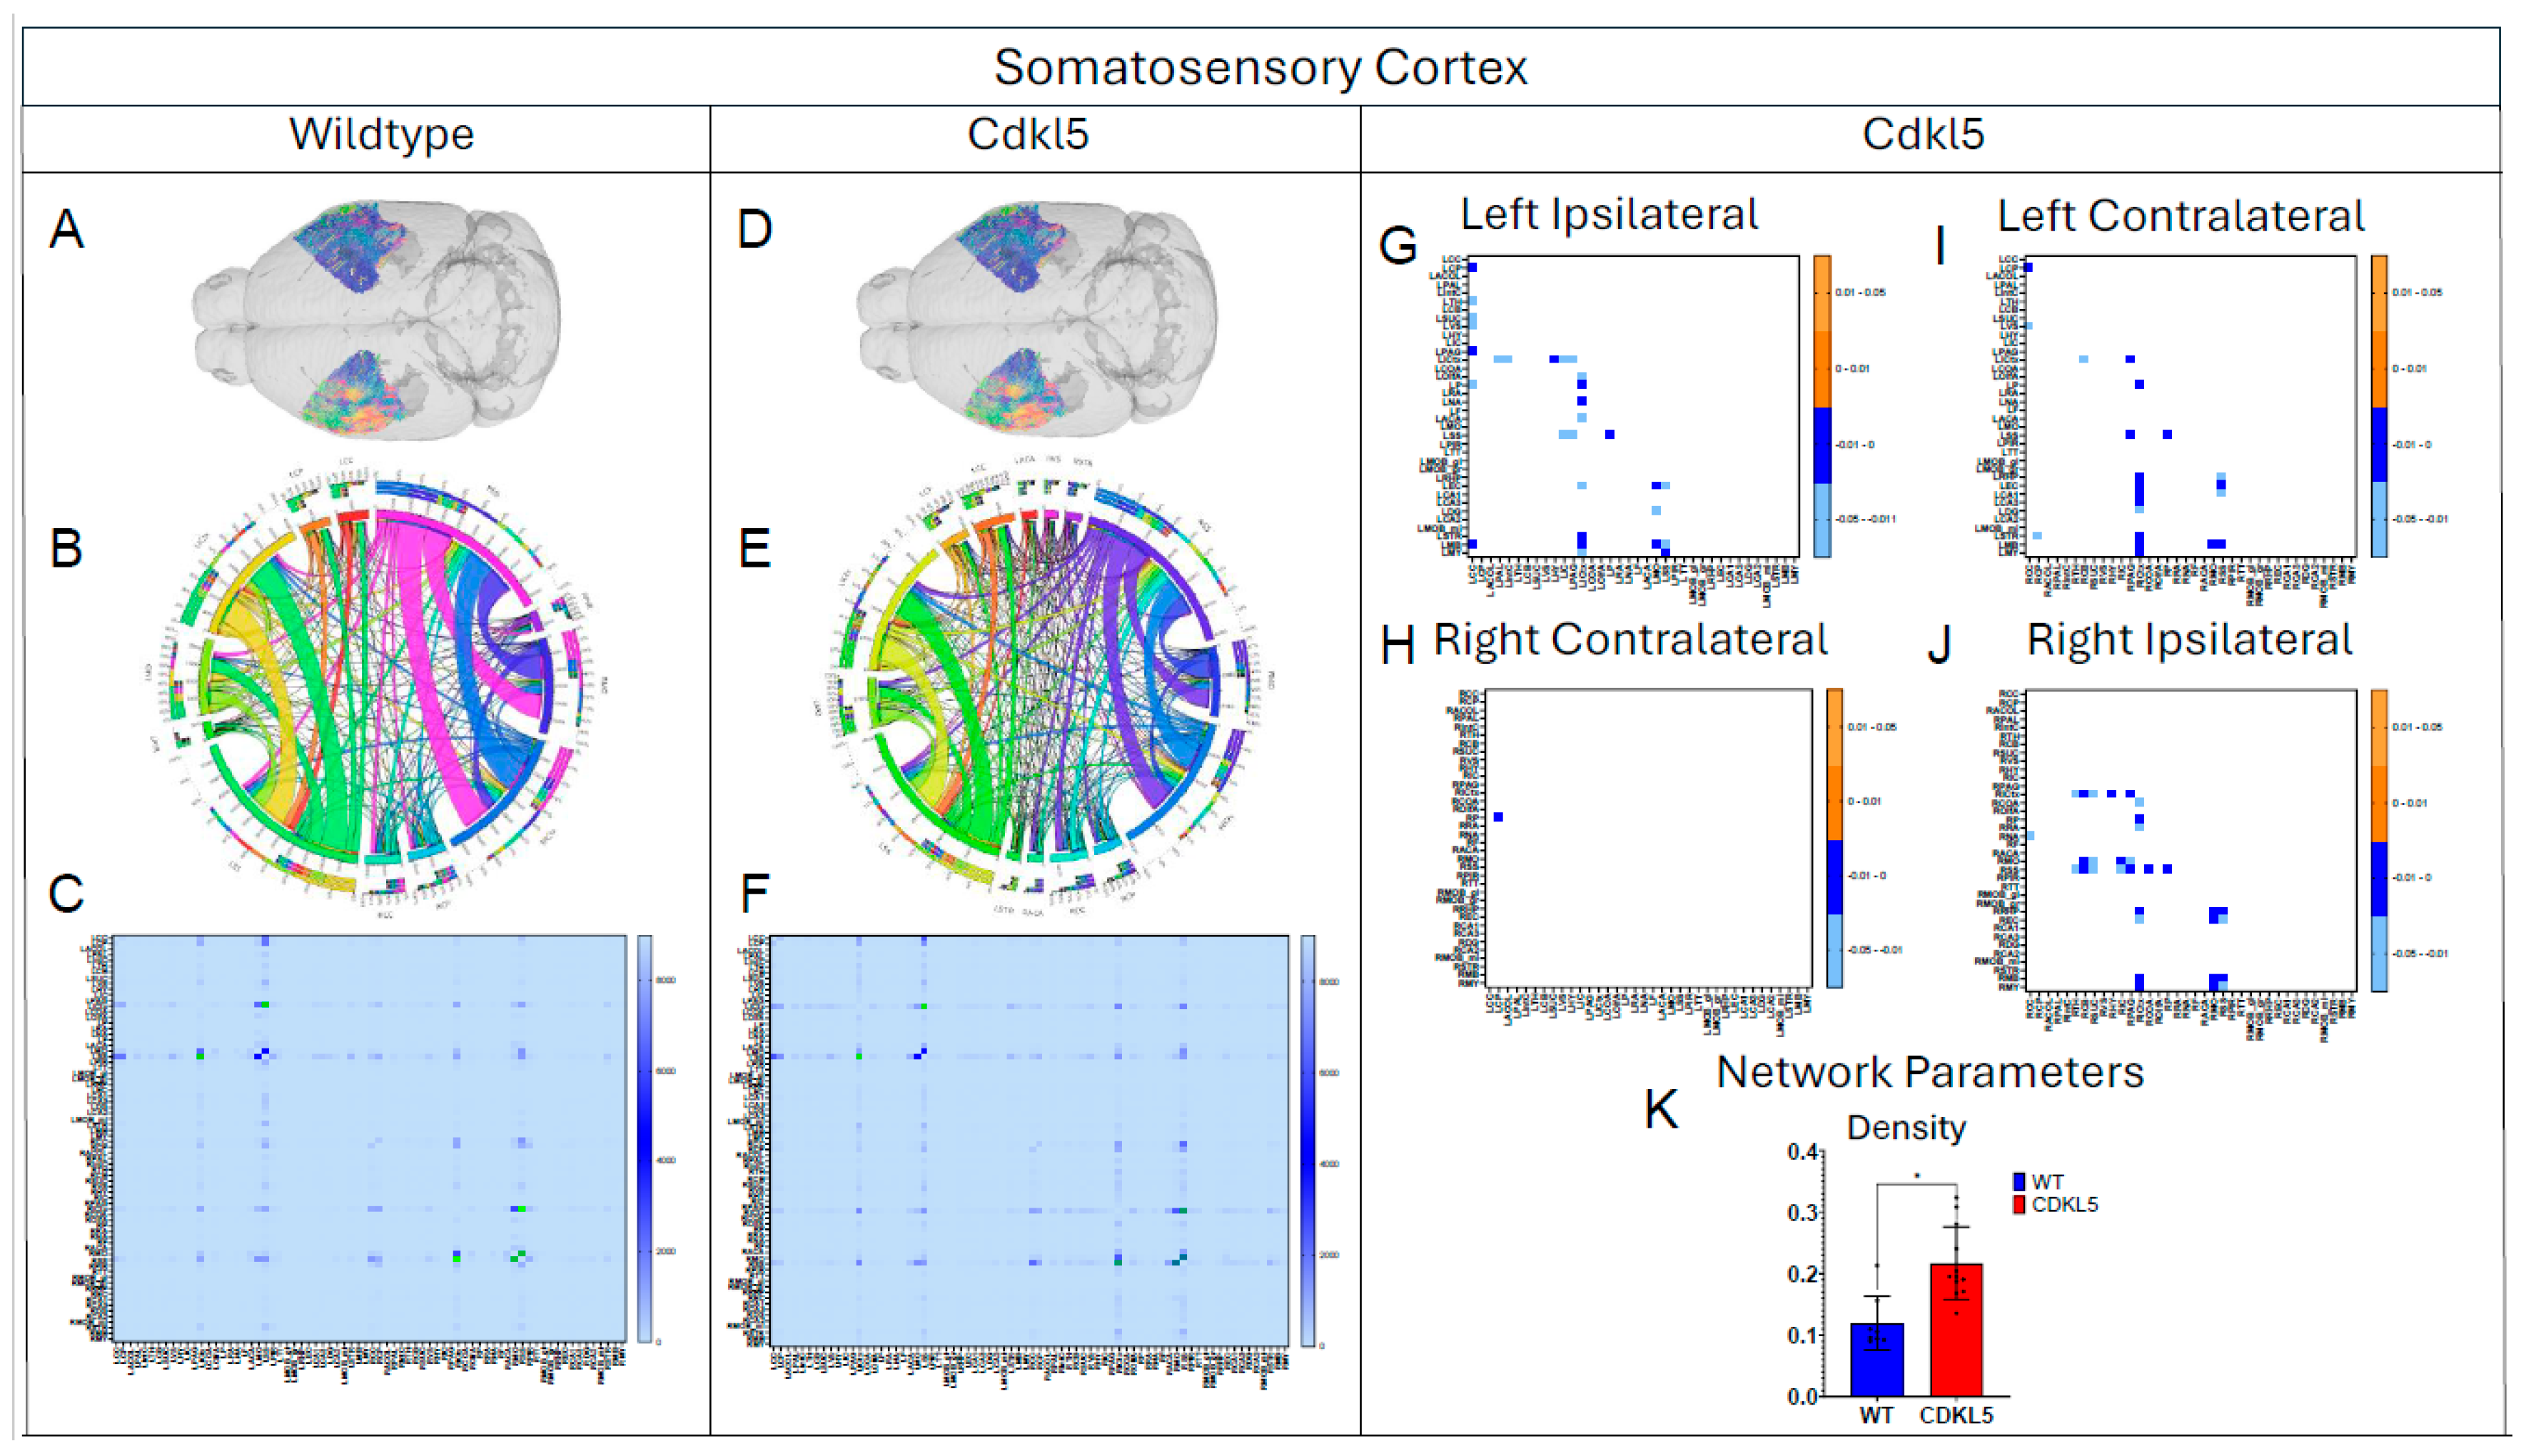
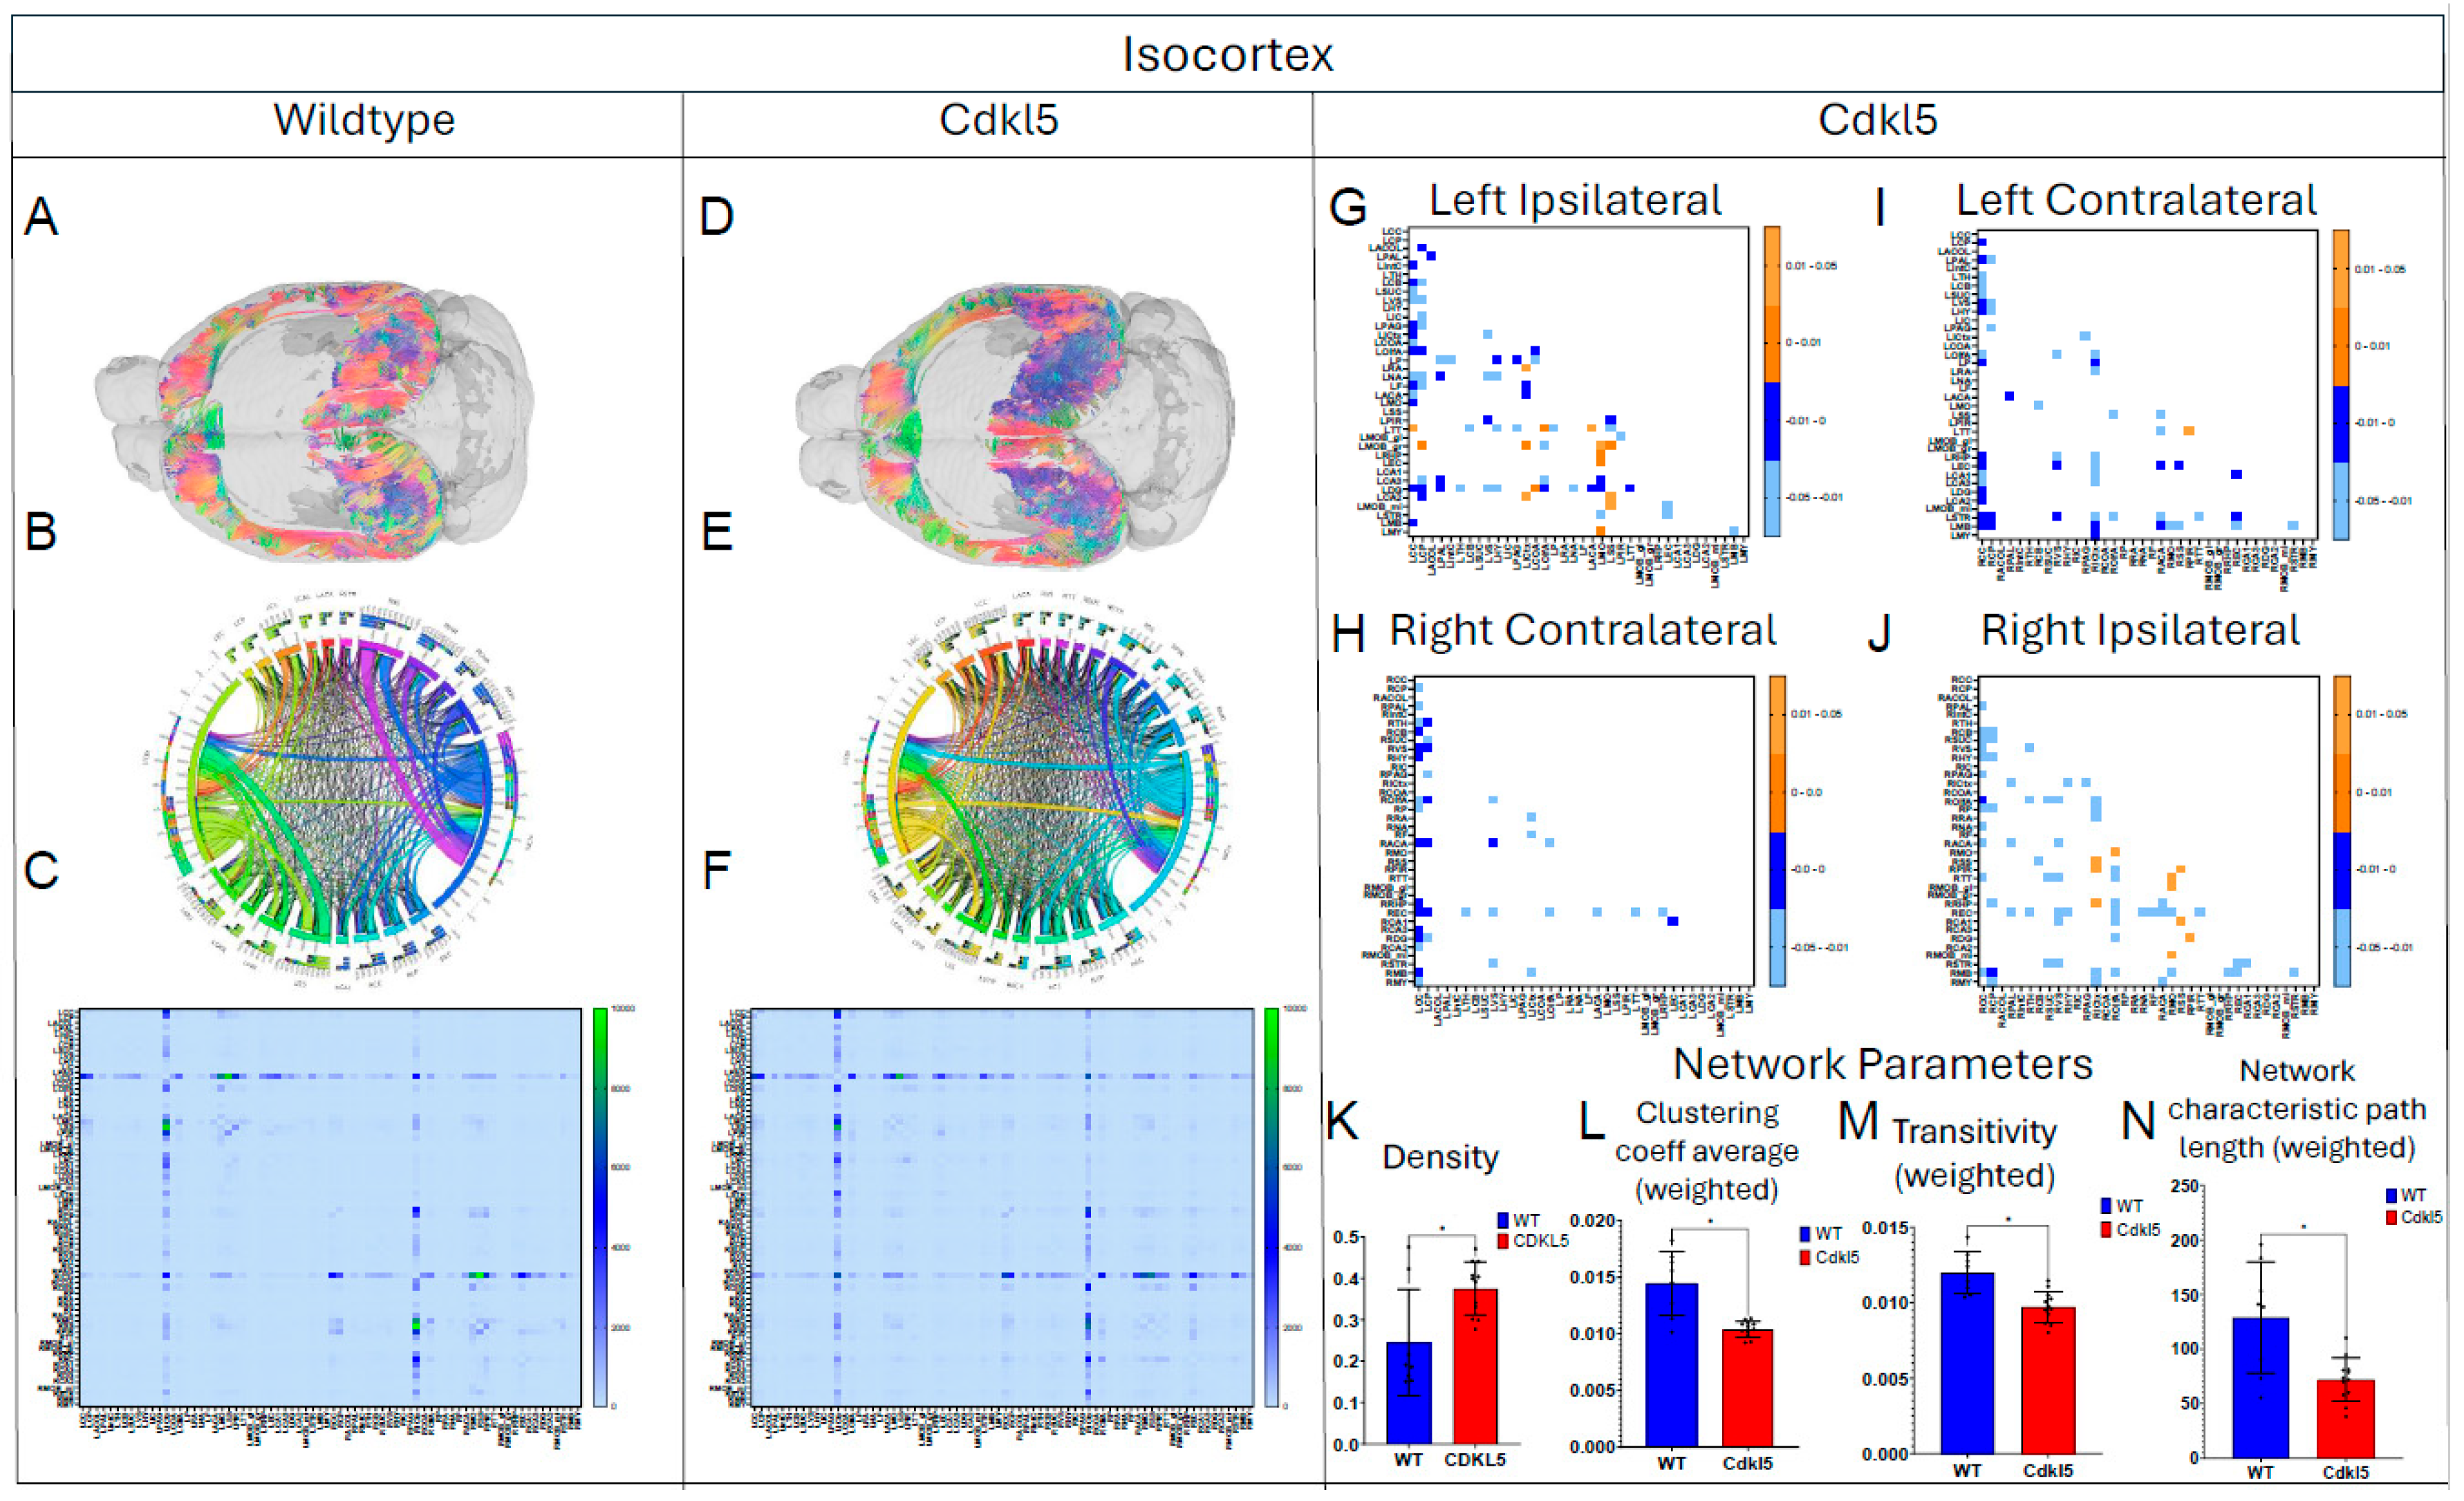
Figure 13.
Diffusion tractography and brain network analysis for IsoCortex. (A, B) Diffusion tractography (B, E) connectogram (C, F) adjacency matrix for WT (A-C) or hemizygous Cdkl5 KO mice (D-F). (G-J) P value matrix to compare connectomes, an adjacency matrix of signed FDR adjusted p-values shows connections between regions where Cdkl5 KO > WT (0.01-0.05 light orange, 0.005-0.01 dark orange) and connections between regions where WT > Cdkl5 KO (0.0- -0.05 light blue, -0.005- -0.01 dark blue) for (G) left ipsilateral hemisphere connections (left to left hemisphere), (H) right contralateral connections (right to left hemispheres) (I) left contralateral connections (left to right hemispheres) and (J) right ipsilateral hemisphere connections (right to right hemisphere). (K-N) Network parameter (K) Density, (L) Clustering coefficient (M) Transivity, (N) Network characteristic path length (weighted). Blue – WT, Red – Cdkl5 KO. .
3.5. Hypothesis-Driven Characterization of Brain Circuitry for CDD
We then characterize brain circuitry indicated by clinical presentations of CDD patients, in particular, circuitry for anxiety and fear related behavior (3.5.1) and hippocampal-thalamic projection in the temporal lobe epilepsy (3.5.2).
3.5.1. Brain Network Characterization in the Fear Conditioning Circuitry
CDD patients can show anxiety and fear-related behaviors with increased irritability, anxiety and fear-related behavior, and emotional dysregulation, which suggests potential amygdala dysfunction. Cdkl5 KO mice[36] displayed similar behavioral phenotypes with significant increases in anxiety- and fear-related responses, as well as hypervigilance. Cdkl5 KO mice performed poorly in various rodent behavioral testing paradigms, including the fear conditioning[34]. The neuronal circuitry for amygdala-dependent fear conditioning[171] has been uncovered, which involves neuronal pathways (Figure 14 A) from the external stimulation to thalamus (TH, Figure 14A orange), somatosensory cortex (SS, Figure 14A, dark blue), isocortex (ICtx, Figure 14A, purple), hypothalamus (HY, Figure 14A, light blue), and amygdala (CoA, Figure 14A, green). We characterized the neuronal connections between these brain regions in WT (Figure 14B-G, and Figure 15 blue) and Cdkl5 KO brains (Figure 14 H-M, and Figure 15 red). Neuronal connections between isocortex and thalamus, (Figure 15A, ICtx-TH), amygdala and thalamus (Figure 15B COA-TH), between amygdala and hypothalamus (Figure 15D, COA-HY), and between amygdala and isocortex (Figure 15E, COA-ICtx) in the ipsilateral hemispheres are significantly altered in Cdkl5 KO mice compared to the WT counterparts. This indicates that the maladapted neuronal circuitry underlies the behavioral deficits of fear conditioning paradigm in Cdkl5 KO mice. On the other hand, long-range connections of these areas to the contralateral hemispheres (Figure 15 G-L) are not different. This suggests that the neurocognitive deficits of fear conditioning arisen from local neuronal circuitry not from the long-range inter-hemisphere connections.
3.5.2. Brain Network Characterization of Circuitry in the Temporal Lobe Epilepsy
Majority of CDD patients suffer from refractory epilepsy with frequent seizures that cannot be controlled by current ASMs. Temporal lobe epilepsy (TLE) [172] is the most common focal epilepsy and often involves complex alterations in neuronal pathways. Understanding the circuitry helps explain seizure generation, propagation, and associated cognitive/emotional symptoms. In addition to key brain regions involved in TLE, such as hippocampus (Figure 16A blue), entorhinal cortex (Figure 16A orange), amygdala (Figure 16A, light pink), and isocortex (Figure 16A, lavender), the hippocampal (Figure 16A blue)–thalamic (Figure 16A green) pathway [173,174,175] is critically involved in both seizure propagation and modulation. Thalamus is a target for surgery [176] or deep brain stimulation (DBS) [177,178] to treat drug-resistant TLE. Furthermore, thalamus[179,180,181] is a crucial brain structure for sensory relay, motor integration, cognitive and emotional processing, and regulation of consciousness, wakefulness and sleep rhythms. These functions are often impaired in CDD patients.
Here we characterize the TLE and hippocampal–thalamic pathway in Cdkl5 mice (Figs. 16, 17). The neuronal connections between hippocampus and isocortex (Figure 17D Hipp-ICtx), entorhinal cortex and amygdala (Figure 17E EC-CoA), and hippocampus and amygdala (Figure 17F, Hipp-CoA) are significantly altered in the ipsilateral hemisphere. However, surprisingly, the hippocampal-thalamic connections (Figure 17A, Hipp-TH) and hippocampal-entorhinal cortex connections (Figure 17G, Hipp-EC) remain largely unchanged. Similar to the fear conditioning circuitry, the long-range TLE connections to the contralateral hemispheres remain the same. This again indicates the re-wiring of the local circuitry.
4. Conclusions and Discussion
Although some CDD patients do have abnormal brain structures, most CDD patients have unremarkable anatomical MRI in the first year of life [182]. In a study of male cohorts, brain MRI was completely normal in ~38% of cases [183]. CDD patients did not show reduced cortical volumes until later in age [182,184]. Similar to most CDD patients, Cdkl5 KO mice showed largely normal gross brain anatomy with no significant cerebral atrophy or gross structural abnormalities detectable on standard MRI scans, except subtle regional changes[185,186]. Our study demonstrated that diffusion MRI can sensitively detect neurodevelopmental differences in hemizygous Cdkl5 KO mice. Although gross anatomy is largely normal, quantitative diffusivity (FA, AD, RD, MD) can sensitively detect regional alteration in Cdkl5 KO mice. The brain regions that showed altered quantitative diffusivity correlated to the brain regions underlying clinical presentations of cognitive impairments of CDD patients. Our study showed that diffusion MRI is more sensitive than conventional anatomical MRI in detecting neurodevelopmental changes in Cdkl5 KO mice, consistent with clinical observations in CDD patients[182,183,184].
Diffusion MRI can be non-invasively performed longitudinally in patients. Regional diffusion parameters (FA, AD, RD, MD) are quantitative thus can potentially be individual patient-specific brain-based biomarkers for differential diagnosis, to track CDD progression, and to monitor therapeutic efficacy for clinical trials. Although each diffusion parameter (FA, AD, RD, or MD) is non-specific and can be influenced by many pathological conditions related to demyelination, injury, inflammation, infections, etc., combined profiles of all diffusion parameters and brain-region specific patterning may better depict the specific brain changes in individual CDD patients. Furthermore, it can be used to aid precision medicine to monitor CDD progression and CDD repression with therapeutic interventions.
In addition to neurodevelopmental changes, some CDD patients have frequent refractory epilepsy that cannot be controlled by current ASMs. Prolonged seizures with excessive neuron excitation, such as status epilepticus, can lead to excess glutamate release, calcium overload, bioenergetic crisis, and excitotoxicity and metabolic stress resulting in regional brain injury and inflammation. This can acutely change diffusion MRI parameters. To avoid confounding diffusion MRI readouts, diffusion MRI should not be performed acutely after seizure episodes, but should wait until the acute seizure effects resolved for more accurate readouts.
Our data-driven approach that Cdkl5 KO mice exhibit region-specific alterations in diffusion-derived streamline density, a proxy for neuronal fiber organization, within brain regions implicated in the cognitive impairments characteristic of CDKL5 deficiency disorder (CDD) and underlying neurobehavioral phenotypes in Cdkl5 KO mice[34,128]. Our data-driven approach identified regional alterations that converged with known CDD neuropathology, particularly within the cerebellum and superior colliculus. Cdkl5 KO mice exhibited significant changes in cerebellar fiber counts, consistent with human imaging studies implicating cerebellar dysfunction in CDD [187]. Notably, disruptions were observed not only in cerebellar afferent and efferent connectivity but also in fibers traversing the cerebellum, suggesting that Cdkl5 loss impairs cerebellar hub-like integration and long-range information flow across distributed brain networks. The superior colliculus[188], a key node in visual processing [189], also showed marked network disruption, aligning with cortical-visual deficits reported in CDD patients [190]. Cdkl5 KO mice displayed reduced incoming and outgoing connections but increased through-passing fibers, indicating a shift from active network participation toward passive conduit-like function. These changes were accompanied by decreased global clustering coefficient and transitivity, consistent with impaired local network segregation and reduced efficiency of sensorimotor integration. The hippocampus has been consistently implicated as a vulnerable region in individuals with CDD[187]; therefore, we examined hippocampal network organization in greater detail. To capture hippocampal-wide connectivity, we combined ROIs encompassing CA1, CA2, CA3, and the dentate gyrus into a single hippocampal node. Network analysis revealed pronounced alterations in hippocampal fiber connectivity in Cdkl5 KO mice relative to WT controls, indicating disrupted integration of this region within the broader brain network. In addition to changes in fiber connectivity, we observed a significant increase in hippocampal network density in Cdkl5 KO mice. This elevated density is consistent with prior reports of hippocampal enlargement in Cdkl5-deficient mice and may reflect aberrant circuit expansion, altered synaptic pruning, or compensatory reorganization of hippocampal circuitry associated with CDKL5 loss. The thalamus serves as a major integrative hub, relaying and modulating information across cortical and subcortical systems that support sensory processing, cognition, and motor control. In Cdkl5 KO mice, thalamic network architecture was disrupted in multiple dimensions. Specifically, we observed a significant reduction in the number of fibers traversing the thalamus, accompanied by a marked decrease in thalamic network density. These findings suggest impaired thalamic connectivity and reduced network integration, potentially contributing to widespread circuit dysfunction in CDD.
Our study demonstrated that even though Cdkl5 KO mouse brains appear to be structurally normal without overt anatomical abnormalities, the brain networks, “the information highways” of the brain, are wired very differently. We have successfully probed these changes in brain network development using high-definition brain network (HDBN) delineation in Cdkl5 KO mouse brains. Our findings demonstrate that HDBN provides a sensitive and precise method for mapping brain network architecture in Cdkl5 KO mice, allowing clear differentiation from WT controls. Cdkl5 KO mice exhibited pronounced alterations in neuronal network organization across multiple key regions, including the somatosensory and somatomotor cortices, hippocampus, hypothalamus, amygdala, and superior colliculus. These regions are critically involved in cognition, learning and memory, regulation of homeostasis, anxiety and fear conditioning, and visual-motor function, respectively, correlated with neurocognitive phenotypes in Cdkl5 KO mice[34,36,191,192]. The observed network disruptions in these areas closely parallel the clinical manifestations of CDD patients, who frequently present with cognitive and memory deficits[1,2,3,4], anxiety[193], and cortical visual impairments[190]. Notably, the entorhinal cortex, a central component of the olfactory circuitry, appeared largely unaffected, suggesting region-specific vulnerability in Cdkl5 deficiency. Together, these results highlight both the utility of HDBN for sensitive detection of network-level brain abnormalities and the selective impact of Cdkl5 loss on functional brain circuits relevant to CDD pathophysiology. This is indicative that CDD, as a developmental and epileptic encephalopathy (DEE), even without epilepsy in mice, the brain network developed abnormally in Cdkl5 mice. This is similar to clinical observations that some CDD patients do not have frequent seizures, or some seizures can be controlled, but CDD patients still suffer from neurodevelopmental disabilities suggesting underlying brain network abnormalities. Our study suggests that HDBN characterizing brain network topology might be more appropriate and sensitive for depicting CDKL5 deficiency in the brains for both humans and mice. HDBN delineation can also enables utilizing Cdkl5 KO mice for mechanistic understanding and therapeutic development despite lacking overt seizures.
Both CDD patients and Cdkl5 KO mice displayed anxiety and fear-related behaviors suggesting amygdalar dysfunctions. Our hypothesis-driven characterization of brain circuitry for fear conditioning found significant alterations of amygdala-related connections, confirming phenotypical observations in Cdkl5 mouse models and in clinical manifestation of CDD patients.
Our characterization of neural circuitry for TLE further demonstrates the maladaptive neuronal network development underlie cognitive challenges in CDD. TLE is the most frequent form of epilepsy in CDD. TLE[194,195,196] emerges from maladaptive circuitry within the mesial temporal lobe, particularly the hippocampus, entorhinal cortex, and amygdala. Hyperexcitability of pyramidal neurons, combined with loss of inhibitory interneurons, disrupts excitation–inhibition balance, while mossy fiber sprouting of dentate granule cells establishes recurrent excitatory loops that promote seizure initiation. The entorhinal cortex–hippocampus loop sustains epileptiform activity, and amygdalar interactions facilitate propagation and emotional manifestations. Hippocampal sclerosis, characterized by selective hippocampal neuronal loss, further remodels circuitry to favor hyperexcitability. Additional temporal neocortical and thalamic networks mediate seizure spread, producing complex partial or secondary generalized seizures. These findings highlight TLE as a network disorder[197,198,199] in which synaptic reorganization, interneuron loss, and aberrant connectivity converge to generate recurrent, self-sustaining epileptic activity. Surprisingly, we found that the hippocampal-thalamic pathway in Cdkl5 KO mice was normal. Most CDD patients suffer from refractory epilepsy, predominantly TLE. Hippocampal-thalamus project is important in managing drug-resistant TLE. However, Cdkl5 KO mice do not exhibit TLE. Our hypothesis-driven characterization of brain circuitry for the hippocampal-thalamic project found no changes in Cdkl5 KO mice. Cdkl5 KO mice have normal hippocampus-thalamus projection. This is consistent with the observed phenotypes for Cdkl5 KO mice. Our data demonstrates that HDBN can be sensitive in testing hypothesis-driven brain circuitry delineation in CDD and other DEE.
Allen Brain Atlas are constructed based on ex vivo histology with very thin slices (100 µm sampling density) and 0.35 µm pixel resolution[200] yielding 461 brain regions[66], whereas MRI voxels are 78 µm and 156 µm in size for anatomical and diffusion MRI respectively. Many Allen Brain Atlas brain regions are too small and below the detection threshold of MRI signal to noise ratio (SNR). Thus, we combined smaller brain regions in Allen Brain Atlas to form 72 ROIs used in our analysis. This yielded good SNR and robust and reproducible HDBN results.
Conventional DTI can fall short of resolving neuronal fibers in small mouse brains. Our study used model-free generalized q-sampling imaging (GQI)[86] with high angular resolutions and deterministic fiber tracking algorithm more optimal for high-definition fiber tractography in small mouse brains, having overcome the drawbacks of conventional DTI. In conjunction with topological analysis with graph theory, our study has successfully depicted the neuronal network architecture in Cdkl5 KO mouse brains. Although Cdkl5 KO mice do not exhibit over seizures as CDD patients, HDBN can sensitively depict neurodevelopmental changes in Cdkl5 KO mice, providing a sensitive, robust, and quantitative means for using Cdkl5 KO mice for preclinical therapeutic development.
Studies show that neurocognitive abnormalities due to CDKL5 deficiency can be reversible. Terzic et al.[201] demonstrated that post-developmental loss of CDKL5 in mice leads to abnormal neuronal morphology and behavioral deficits, but restoring CDKL5 expression later in life ameliorated these deficits and reversed many functional abnormalities. CDKL5 is important for maintaining neuronal functions beyond development [201,202]. Using a conditional rescue mouse model, restoration of Cdkl5 expression[201] after the early stages of brain development significantly ameliorated CDD-associated behavioral deficits and normalized aberrant NMDA receptor–mediated signaling. These findings demonstrate that CDKL5 function is required not only during early neurodevelopment but also for the maintenance of mature neural circuit function. Importantly, the ability to reverse core behavioral and synaptic abnormalities following post-developmental gene restoration provides compelling evidence that key aspects of CDD pathophysiology remain plastic beyond early critical periods. Together, these results underscore the potential for disease modification rather than purely symptomatic treatment and support the existence of a broad therapeutic time window for interventions targeting CDKL5-related deficits. Restoration of cognitive and behavioral deficits later in life with CDKL5 suggests normalization of the brain network. HDBN can sensitively delineate and quantify normalization of the brain network with therapeutic interventions. Further studies to determine the time frame that HDBN changes after therapeutic intervention can facilitate applications to accelerate therapeutic development for CDD beyond neurodevelopment.
Abbreviation
CDKL5 – Cyclin-dependent kinase-like 5
CDD – CDKL5 Deficient Disorder
DEE – developmental and epileptic encephalopathy
ASM – anti-seizure medication
NDD – neurodevelopmental deficit
KO – Knock out
MRI – Magnetic Resonance Imaging
DTI – Diffusion Tensor Imaging
DWI – Diffusion weighted imaging
HDFT – High-definition Fiber Tractography
HDBN – High-definition Brain Network
ROI – Region of Interest
FOV – Field of View
TE – Echo Time
TR – Repetition Time
FA – Fractional anisotropy
AD – Axial diffusivity
RD – radial diffusivity
MD – mean diffusivity
ADC – apparent diffusion coefficient
RARE – Rapid Imaging with Relaxation Enhancement
FAS – Fast Spin-Echo
GQI – generalized q-sampling imaging
SDF – spin distribution function
TPM – tissue probability map
SPM – statistical parametric maps
GM – grey matter
WM – white matter
OLAW – Office of Laboratory Animal Welfare
IACUC – Institutional Animal Care and Use Committee
FDA – Food and Drug Administration
GEM – genetically engineered mouse
WT – wild type
Supplementary Materials
The following supporting information can be downloaded at the website of this paper posted on Preprints.org.
Author Contributions
Dalton West: Investigation, Methodology, Formal analysis, Software, Validation, Data curation, Writing – original draft; Writing – review & editing. Noah W. Coulson: Investigation, Methodology, Formal analysis, Software, Validation, Data curation, Writing – original draft; Writing – review & editing. Devin R. E. Cortes: Methodology, Formal analysis, Software, Writing – review & editing. Kristina E. Schwab: Data curation, Methodology, Formal analysis, Writing – review & editing. Thomas Becker-Szurszewski: Data curation, Methodology, Formal analysis, Writing – review & editing. Sean Hartwick: Data curation, Methodology, Formal analysis, Writing – review & editing. Margaret C. Stapleton: Methodology, Formal analysis, Writing – review & editing. Gabriella M. Saladino: Formal analysis, Writing – review & editing. Cecilia W. Lo: Writing – review & editing. Christina M. Patterson: Writing – review & editing. Subramanian Subramanian: Writing – review & editing. Deepa S. Rajan: Writing – review & editing. Yijen L. Wu: Conceptualization, Investigation, Methodology, Formal analysis, Software, Validation, Data curation, Project administration, Funding acquisition, Supervision, Writing – original draft, Writing – review & editing.
Institutional Review Board Statement
Animal protocols were approved by the University of Pittsburgh Institutional Animal Care and Use Committee (IACUC Protocol # 25066689, valid until June 4th, 2028).
Informed Consent Statement
Not applicable.
Data Availability Statement
The datasets are available from the corresponding author upon reasonable request.
Acknowledgments
This study was supported in part by funding to YLW from NIH (R21-EB023507, R21-NS121706, R21-NS142555), AHA (18CDA34140024), and DoD (W81XWH1810070, W81XWH-22-1-0221). .
Conflicts of Interest
The authors declare no conflicts of interest.
References
- Olson, HE; Demarest, ST; Pestana-Knight, EM; Swanson, LC; Iqbal, S; Lal, D; Leonard, H; Cross, JH; Devinsky, O; Benke, TA. Cyclin-Dependent Kinase-Like 5 Deficiency Disorder: Clinical Review. Pediatric neurology 2019, 97, 18–25. [Google Scholar] [CrossRef]
- Bahi-Buisson, N; Bienvenu, T. CDKL5-Related Disorders: From Clinical Description to Molecular Genetics. Mol Syndromol. 2012, 2, 137–152. [Google Scholar] [CrossRef] [PubMed]
- Demarest, ST; Olson, HE; Moss, A; Pestana-Knight, E; Zhang, X; Parikh, S; Swanson, LC; Riley, KD; Bazin, GA; Angione, K; et al. CDKL5 deficiency disorder: Relationship between genotype, epilepsy, cortical visual impairment, and development. Epilepsia 2019, 60, 1733–1742. [Google Scholar] [CrossRef] [PubMed]
- Jakimiec, M; Paprocka, J; Śmigiel, R. CDKL5 Deficiency Disorder-A Complex Epileptic Encephalopathy. Brain Sci. 2020, 10. [Google Scholar] [CrossRef] [PubMed]
- Montini, E; Andolfi, G; Caruso, A; Buchner, G; Walpole, SM; Mariani, M; Consalez, G; Trump, D; Ballabio, A; Franco, B. Identification and characterization of a novel serine-threonine kinase gene from the Xp22 region. Genomics 1998, 51, 427–433. [Google Scholar] [CrossRef]
- Kalscheuer, VM; Tao, J; Donnelly, A; Hollway, G; Schwinger, E; Kübart, S; Menzel, C; Hoeltzenbein, M; Tommerup, N; Eyre, H; et al. Disruption of the serine/threonine kinase 9 gene causes severe X-linked infantile spasms and mental retardation. Am J Hum Genet. 2003, 72, 1401–1411. [Google Scholar] [CrossRef]
- Fichou, Y; Nectoux, J; Bahi-Buisson, N; Chelly, J; Bienvenu, T. An isoform of the severe encephalopathy-related CDKL5 gene, including a novel exon with extremely high sequence conservation, is specifically expressed in brain. J Hum Genet. 2011, 56, 52–57. [Google Scholar] [CrossRef]
- Rademacher, N; Hambrock, M; Fischer, U; Moser, B; Ceulemans, B; Lieb, W; Boor, R; Stefanova, I; Gillessen-Kaesbach, G; Runge, C; et al. Identification of a novel CDKL5 exon and pathogenic mutations in patients with severe mental retardation, early-onset seizures and Rett-like features. Neurogenetics 2011, 12, 165–167. [Google Scholar] [CrossRef]
- Williamson, SL; Giudici, L; Kilstrup-Nielsen, C; Gold, W; Pelka, GJ; Tam, PP; Grimm, A; Prodi, D; Landsberger, N; Christodoulou, J. A novel transcript of cyclin-dependent kinase-like 5 (CDKL5) has an alternative C-terminus and is the predominant transcript in brain. Hum Genet. 2012, 131, 187–200. [Google Scholar] [CrossRef]
- Leonard, H; Downs, J; Benke, TA; Swanson, L; Olson, H; Demarest, S. CDKL5 deficiency disorder: clinical features, diagnosis, and management. The Lancet Neurology 2022, 21, 563–576. [Google Scholar] [CrossRef]
- Bahi-Buisson, N; Nectoux, J; Rosas-Vargas, H; Milh, M; Boddaert, N; Girard, B; Cances, C; Ville, D; Afenjar, A; Rio, M; et al. Key clinical features to identify girls with CDKL5 mutations. Brain 2008, 131, 2647–2661. [Google Scholar] [CrossRef] [PubMed]
- Sampedro-Castañeda, M; Baltussen, LL; Lopes, AT; Qiu, Y; Sirvio, L; Mihaylov, SR; Claxton, S; Richardson, JC; Lignani, G; Ultanir, SK. Epilepsy-linked kinase CDKL5 phosphorylates voltage-gated calcium channel Cav2.3, altering inactivation kinetics and neuronal excitability. Nature Communications 2023, 14, 7830. [Google Scholar] [CrossRef] [PubMed]
- Kadam, SD; Sullivan, BJ; Goyal, A; Blue, ME; Smith-Hicks, C. Rett Syndrome and CDKL5 Deficiency Disorder: From Bench to Clinic. International journal of molecular sciences 2019, 20. [Google Scholar] [CrossRef]
- Laurvick, CL; de Klerk, N; Bower, C; Christodoulou, J; Ravine, D; Ellaway, C; Williamson, S; Leonard, H. Rett syndrome in Australia: a review of the epidemiology. The Journal of pediatrics 2006, 148, 347–352. [Google Scholar] [CrossRef]
- Artuso, R; Mencarelli, MA; Polli, R; Sartori, S; Ariani, F; Pollazzon, M; Marozza, A; Cilio, MR; Specchio, N; Vigevano, F; et al. Early-onset seizure variant of Rett syndrome: definition of the clinical diagnostic criteria. Brain Dev. 2010, 32, 17–24. [Google Scholar] [CrossRef] [PubMed]
- Silvestre, M; Dempster, K; Mihaylov, SR; Claxton, S; Ultanir, SK. Cell type-specific expression, regulation and compensation of CDKL5 activity in mouse brain. Mol Psychiatry 2024, 29, 1844–1856. [Google Scholar] [CrossRef]
- Vossler, D; Gidal, B; Committee AT. A Summary of Antiseizure Medications Available in the United States: 4th Edition; Accessed; American Epilepsy Society, 2024; (accessed on 1 April 2024). [Google Scholar]
- Olson, HE; Daniels, CI; Haviland, I; Swanson, LC; Greene, CA; Denny, AMM; Demarest, ST; Pestana-Knight, E; Zhang, X; Moosa, AN; et al. Current neurologic treatment and emerging therapies in CDKL5 deficiency disorder. J Neurodev Disord. 2021, 13, 40. [Google Scholar] [CrossRef]
- Dell'Isola, GB; Portwood, KE; Consing, K; Fattorusso, A; Bartocci, A; Ferrara, P; Di Cara, G; Verrotti, A; Lodolo, M. Current Overview of CDKL-5 Deficiency Disorder Treatment. Pediatr Rep. 2024, 16, 21–25. [Google Scholar] [CrossRef]
- FDA UFaDA. FDA approves drug for treatment of seizures associated with rare disease in patients two years of age and older. 2022. Available online: https://www.fda.gov/drugs/news-events-human-drugs/fda-approves-drug-treatment-seizures-associated-rare-disease-patients-two-years-age-and-older.
- Junaid, M; Wong, K; Korolainen, MA; Amin, S; Downs, J; Leonard, H. Measuring the Burden of Epilepsy Hospitalizations in CDKL5 Deficiency Disorder. Pediatric neurology 2025, 163, 68–75. [Google Scholar] [CrossRef]
- Lavery, D; Cronin, A; Rakibuz-Zaman, M; Crosby, K; Gwadry - Sridhar, F. PCR70 Diagnostic Journey, Seizure Burden, and Quality of Life Among Patients With CDKL5 Deficiency Disorder Using Real-World Data. Value in Health 2024, 27, S308. [Google Scholar] [CrossRef]
- Wong, K; Junaid, M; Alexander, S; Olson, HE; Pestana-Knight, EM; Rajaraman, RR; Downs, J; Leonard, H. Caregiver Perspective of Benefits and Side Effects of Anti-Seizure Medications in CDKL5 Deficiency Disorder from an International Database. CNS drugs 2024, 38, 719–732. [Google Scholar] [CrossRef]
- Velarde-García, JF; Güeita-Rodríguez, J; Jiménez-Antona, C; García-Bravo, C; Aledo-Serrano, Á; Gómez-Sánchez, SM; Palacios-Ceña, D. The impact of developmental and epileptic encephalopathies on families: a qualitative study. Eur J Pediatr. 2024, 183, 4103–4110. [Google Scholar] [CrossRef] [PubMed]
- Amin, S; Møller, RS; Aledo-Serrano, A; Arzimanoglou, A; Bager, P; Jóźwiak, S; Kluger, GJ; López-Cabeza, S; Nabbout, R; Partridge, CA; et al. Providing quality care for people with CDKL5 deficiency disorder: A European expert panel opinion on the patient journey. Epilepsia open. 2024, 9, 832–849. [Google Scholar] [CrossRef]
- Gautam, N. Grant from the California Institute for Regenerative Medicine will fund research into CDKL5. Accessed. UC Davis MIND Insitute, 2022. (accessed on 10 August 2022).
- Jogani, J; Stansfield, N. CDKL5 and Gene Therapy; Accessed; Strategic Alliance Partnership, 2025; (accessed on 24 September 2025). [Google Scholar]
- Medici, G; Tassinari, M; Loi, M; Bove, AM; Casadei Garofani, B; Volpedo, G; Mottolese, N; Matteoli, G; Lo Martire, V; Berteotti, C; et al. Safety and efficacy of Igk-TATk-CDKL5 gene therapy in mosaic CDKL5 deficiency. Neurotherapeutics: the journal of the American Society for Experimental NeuroTherapeutics 2025, e00727. [Google Scholar] [CrossRef]
- Song, X; Xia, Z; Martinez, D; Xu, B; Spritzer, Z; Zhang, Y; Nugent, E; Ho, Y; Terzic, B; Zhou, Z. Independent genetic strategies define the scope and limits of CDKL5 deficiency disorder reversal. Cell Rep Med. 2025, 6, 101926. [Google Scholar] [CrossRef]
- Ultragenyx. UX055 AAV9 gene therapy for the potential treatment of CDKL5 Deficiency Disorder (CDD). 2025. [Google Scholar]
- Voronin, G; Narasimhan, J; Gittens, J; Sheedy, J; Lipari, P; Peters, M; DeMarco, S; Cao, L; Varganov, Y; Kim, MJ; et al. Preclinical studies of gene replacement therapy for CDKL5 deficiency disorder. Mol Ther. 2024, 32, 3331–3345. [Google Scholar] [CrossRef] [PubMed]
- Vázquez-Montante, JJ; Márquez-Rojo, P; Saavedra-Milán, B; Hernández-Medrano, C; Bravo-Oro, A. Clinical and molecular heterogeneity in CDLK5 disorders. Bol Med Hosp Infant Mex. 2023, 80, 47–52. [Google Scholar] [CrossRef]
- Discorders NNOoR. CDKL5 Deficiency Disorder. NORD National Organization of Rare Discorders. Accessed. 2024. (accessed on 4/25/2024).
- Wang, IT; Allen, M; Goffin, D; Zhu, X; Fairless, AH; Brodkin, ES; Siegel, SJ; Marsh, ED; Blendy, JA; Zhou, Z. Loss of CDKL5 disrupts kinome profile and event-related potentials leading to autistic-like phenotypes in mice. Proceedings of the National Academy of Sciences of the United States of America 2012, 109, 21516–21521. [Google Scholar] [CrossRef] [PubMed]
- Tang, S; Terzic, B; Wang, IJ; Sarmiento, N; Sizov, K; Cui, Y; Takano, H; Marsh, ED; Zhou, Z; Coulter, DA. Altered NMDAR signaling underlies autistic-like features in mouse models of CDKL5 deficiency disorder. Nat Commun. 2019, 10, 2655. [Google Scholar] [CrossRef]
- Okuda, K; Takao, K; Watanabe, A; Miyakawa, T; Mizuguchi, M; Tanaka, T. Comprehensive behavioral analysis of the Cdkl5 knockout mice revealed significant enhancement in anxiety- and fear-related behaviors and impairment in both acquisition and long-term retention of spatial reference memory. PloS one 2018, 13, e0196587. [Google Scholar] [CrossRef]
- Amendola, E; Zhan, Y; Mattucci, C; Castroflorio, E; Calcagno, E; Fuchs, C; Lonetti, G; Silingardi, D; Vyssotski, AL; Farley, D; et al. Mapping pathological phenotypes in a mouse model of CDKL5 disorder. PloS one 2014, 9, e91613. [Google Scholar] [CrossRef]
- Mari, F; Azimonti, S; Bertani, I; Bolognese, F; Colombo, E; Caselli, R; Scala, E; Longo, I; Grosso, S; Pescucci, C; et al. CDKL5 belongs to the same molecular pathway of MeCP2 and it is responsible for the early-onset seizure variant of Rett syndrome. Human molecular genetics 2005, 14, 1935–1946. [Google Scholar] [CrossRef]
- Tang, S; Wang, IJ; Yue, C; Takano, H; Terzic, B; Pance, K; Lee, JY; Cui, Y; Coulter, DA; Zhou, Z. Loss of CDKL5 in Glutamatergic Neurons Disrupts Hippocampal Microcircuitry and Leads to Memory Impairment in Mice. J Neurosci. 2017, 37, 7420–7437. [Google Scholar] [CrossRef]
- Mulcahey, PJ; Tang, S; Takano, H; White, A; Davila Portillo, DR; Kane, OM; Marsh, ED; Zhou, Z; Coulter, DA. Aged heterozygous Cdkl5 mutant mice exhibit spontaneous epileptic spasms. Exp Neurol. 2020, 332, 113388. [Google Scholar] [CrossRef]
- Gennaccaro, L; Fuchs, C; Loi, M; Pizzo, R; Alvente, S; Berteotti, C; Lupori, L; Sagona, G; Galvani, G; Gurgone, A; et al. Age-Related Cognitive and Motor Decline in a Mouse Model of CDKL5 Deficiency Disorder is Associated with Increased Neuronal Senescence and Death. Aging Dis. 2021, 12, 764–785. [Google Scholar] [CrossRef] [PubMed]
- Fuchs, C; Gennaccaro, L; Trazzi, S; Bastianini, S; Bettini, S; Lo Martire, V; Ren, E; Medici, G; Zoccoli, G; Rimondini, R; et al. Heterozygous CDKL5 Knockout Female Mice Are a Valuable Animal Model for CDKL5 Disorder. Neural plasticity 2018, 2018, 9726950. [Google Scholar] [CrossRef] [PubMed]
- Purtell, H; Dhamne, SC; Gurnani, S; Bainbridge, E; Modi, ME; Lammers, SHT; Super, CE; Hameed, MQ; Johnson, EL, 3rd; Sahin, M; et al. Electrographic spikes are common in wildtype mice. Epilepsy & behavior: E&B 2018, 89, 94–98. [Google Scholar] [CrossRef]
- Basser, PJ; Pierpaoli, C. Microstructural and physiological features of tissues elucidated by quantitative-diffusion-tensor MRI. J Magn Reson B 1996, 111, 209–219. [Google Scholar] [CrossRef]
- Basser, PJ; Mattiello, J; LeBihan, D. Estimation of the effective self-diffusion tensor from the NMR spin echo. J Magn Reson B 1994, 103, 247–254. [Google Scholar] [CrossRef] [PubMed]
- Basser, PJ; Pajevic, S; Pierpaoli, C; Duda, J; Aldroubi, A. In vivo fiber tractography using DT-MRI data. Magnetic resonance in medicine 2000, 44, 625–632. [Google Scholar] [CrossRef]
- Pierpaoli, C; Basser, PJ. Toward a quantitative assessment of diffusion anisotropy. Magnetic resonance in medicine 1996, 36, 893–906. [Google Scholar] [CrossRef] [PubMed]
- Pierpaoli, C; Jezzard, P; Basser, PJ; Barnett, A; Di Chiro, G. Diffusion tensor MR imaging of the human brain. Radiology 1996, 201, 637–648. [Google Scholar] [CrossRef]
- Mori, S; van Zijl, PC. Diffusion weighting by the trace of the diffusion tensor within a single scan. Magnetic resonance in medicine 1995, 33, 41–52. [Google Scholar] [CrossRef] [PubMed]
- Mori, S; Crain, BJ; Chacko, VP; van Zijl, PC. Three-dimensional tracking of axonal projections in the brain by magnetic resonance imaging. Ann Neurol. 1999, 45, 265–269. [Google Scholar] [CrossRef]
- Xue, R; van Zijl, PC; Crain, BJ; Solaiyappan, M; Mori, S. In vivo three-dimensional reconstruction of rat brain axonal projections by diffusion tensor imaging. Magnetic resonance in medicine 1999, 42, 1123–1127. [Google Scholar] [CrossRef]
- Mori, S; Itoh, R; Zhang, J; Kaufmann, WE; van Zijl, PC; Solaiyappan, M; Yarowsky, P. Diffusion tensor imaging of the developing mouse brain. Magnetic resonance in medicine 2001, 46, 18–23. [Google Scholar] [CrossRef]
- O'Donnell, LJ; Westin, CF. An introduction to diffusion tensor image analysis. Neurosurg Clin N Am. 2011, 22, 185–196, viii. [Google Scholar] [CrossRef]
- Ackerman, JJH; Neil, JJ. Biophysics of Diffusion in Cells. In Diffusion MRI: Theory, Methods and Applications; Jones, DK, Ed.; Oxford U. Press: Oxford, 2010; pp. 110–124. [Google Scholar]
- Beaulieu, C. The basis of anisotropic water diffusion in the nervous system - a technical review. NMR in biomedicine 2002, 15, 435–455. [Google Scholar] [CrossRef] [PubMed]
- Le Bihan, D; Turner, R; Douek, P. Is water diffusion restricted in human brain white matter? An echo-planar NMR imaging study. Neuroreport 1993, 4, 887–890. [Google Scholar] [CrossRef]
- Norris, DG. The effects of microscopic tissue parameters on the diffusion weighted magnetic resonance imaging experiment. NMR in biomedicine 2001, 14, 77–93. [Google Scholar] [CrossRef]
- Tuch, DS; Reese, TG; Wiegell, MR; Van, JW. Diffusion MRI of Complex Neural Architecture. Neuron 2003, 40, 885–895. [Google Scholar] [CrossRef]
- Alexander, DC; Barker, GJ. Optimal imaging parameters for fiber-orientation estimation in diffusion MRI. NeuroImage 2005, 27, 357–367. [Google Scholar] [CrossRef]
- Wiegell, MR; Larsson, HB; Wedeen, VJ. Fiber crossing in human brain depicted with diffusion tensor MR imaging. Radiology 2000, 217, 897–903. [Google Scholar] [CrossRef]
- Vos, SB; Jones, DK; Jeurissen, B; Viergever, MA; Leemans, A. The influence of complex white matter architecture on the mean diffusivity in diffusion tensor MRI of the human brain. NeuroImage 2012, 59, 2208–2216. [Google Scholar] [CrossRef] [PubMed]
- Tuch, DS; Reese, TG; Wiegell, MR; Makris, N; Belliveau, JW; Wedeen, VJ. High angular resolution diffusion imaging reveals intravoxel white matter fiber heterogeneity. Magnetic resonance in medicine 2002, 48, 577–582. [Google Scholar] [CrossRef] [PubMed]
- Alexander, AL; Hasan, KM; Lazar, M; Tsuruda, JS; Parker, DL. Analysis of partial volume effects in diffusion-tensor MRI. Magnetic resonance in medicine 2001, 45, 770–780. [Google Scholar] [CrossRef]
- Wang, Q; Ding, SL; Li, Y; Royall, J; Feng, D; Lesnar, P; Graddis, N; Naeemi, M; Facer, B; Ho, A; et al. The Allen Mouse Brain Common Coordinate Framework: A 3D Reference Atlas. Cell. 2020, 181, 936–953.e920. [Google Scholar] [CrossRef] [PubMed]
- MacKenzie-Graham, A; Jones, ES; Shattuck, DW; Dinov, ID; Bota, M; Toga, AW. The informatics of a C57BL/6J mouse brain atlas. Neuroinformatics 2003, 1, 397–410. [Google Scholar] [CrossRef]
- Science, AIfB. Allen Mouse Brain Atlas. 2020. Available online: https://mouse.brain-map.org/static/atlas.
- Stapleton, MC; Koch, SP; Cortes, DRE; Wyman, S; Schwab, KE; Mueller, S; McKennan, CG; Boehm-Sturm, P; Wu, YL. Apolipoprotein-E deficiency leads to brain network alteration characterized by diffusion MRI and graph theory. Frontiers in neuroscience 2023, 17, 1183312. [Google Scholar] [CrossRef]
- Ashburner, J; Friston, KJ. Unified segmentation. NeuroImage 2005, 26, 839–851. [Google Scholar] [CrossRef]
- Friston, KJ; Holmes, AP; Worsley, KJ; Poline, J-P; Frith, CD; Frackowiak, RSJ. Statistical parametric maps in functional imaging: A general linear approach. Human Brain Mapping 1994, 2, 189–210. [Google Scholar] [CrossRef]
- Hikishima, K; Komaki, Y; Seki, F; Ohnishi, Y; Okano, HJ; Okano, H. In vivo microscopic voxel-based morphometry with a brain template to characterize strain-specific structures in the mouse brain. Sci Rep. 2017, 7, 85. [Google Scholar] [CrossRef]
- Klein, S; Staring, M; Murphy, K; Viergever, MA; Pluim, JP. elastix: a toolbox for intensity-based medical image registration. IEEE Trans Med Imaging 2010, 29, 196–205. [Google Scholar] [CrossRef]
- Scharwächter, L; Schmitt, FJ; Pallast, N; Fink, GR; Aswendt, M. Network analysis of neuroimaging in mice. NeuroImage 2022, 253, 119110. [Google Scholar] [CrossRef] [PubMed]
- Ingalhalikar, M; Parker, D; Ghanbari, Y; Smith, A; Hua, K; Mori, S; Abel, T; Davatzikos, C; Verma, R. Connectome and Maturation Profiles of the Developing Mouse Brain Using Diffusion Tensor Imaging. Cerebral cortex (New York, NY: 1991) 2015, 25, 2696–2706. [Google Scholar] [CrossRef]
- Rubinov, M; Sporns, O. Complex network measures of brain connectivity: uses and interpretations. NeuroImage 2010, 52, 1059–1069. [Google Scholar] [CrossRef]
- Bullmore, E; Sporns, O. Complex brain networks: graph theoretical analysis of structural and functional systems. Nat Rev Neurosci. 2009, 10, 186–198. [Google Scholar] [CrossRef]
- Benjamini, Y; Hochberg, Y. Controlling the False Discovery Rate: A Practical and Powerful Approach to Multiple Testing. Journal of the Royal Statistical Society Series B (Methodological) 1995, 57, 289–300. [Google Scholar] [CrossRef]
- Landman, BA; Wan, H; Bogovic, JA; Bazin, PL; Prince, JL. Resolution of Crossing Fibers with Constrained Compressed Sensing using Traditional Diffusion Tensor MRI. Proc SPIE Int Soc Opt Eng. 2010, 7623, 76231h. [Google Scholar] [CrossRef] [PubMed]
- Wong, HH; Chou, CYC; Watt, AJ; Sjöström, PJ. Comparing mouse and human brains. Elife 2023, 12. [Google Scholar] [CrossRef]
- Sun, T; Hevner, RF. Growth and folding of the mammalian cerebral cortex: from molecules to malformations. Nat Rev Neurosci. 2014, 15, 217–232. [Google Scholar] [CrossRef] [PubMed]
- Xu, N; LaGrow, TJ; Anumba, N; Lee, A; Zhang, X; Yousefi, B; Bassil, Y; Clavijo, GP; Khalilzad Sharghi, V; Maltbie, E; et al. Functional Connectivity of the Brain Across Rodents and Humans. Frontiers in neuroscience 2022, 16, 816331. [Google Scholar] [CrossRef]
- Li, C; Li, J; Lai, L; Li, S; Yan, S. Genetically engineered pig models of neurological diseases. Ageing and Neurodegenerative Diseases 2022, 2, 13. [Google Scholar] [CrossRef]
- Kjer, HM; Andersson, M; He, Y; Pacureanu, A; Daducci, A; Pizzolato, M; Salditt, T; Robisch, A-L; Eckermann, M; Töpperwien, M; et al. Bridging the 3D geometrical organisation of white matter pathways across anatomical length scales and species. eLife 2025, 13, RP94917. [Google Scholar] [CrossRef]
- Zhang, J. Diffusion tensor imaging of white matter pathology in the mouse brain. Imaging Med. 2010, 2, 623–632. [Google Scholar] [CrossRef]
- Müller, HP; Roselli, F; Rasche, V; Kassubek, J. Diffusion Tensor Imaging-Based Studies at the Group-Level Applied to Animal Models of Neurodegenerative Diseases. Frontiers in neuroscience 2020, 14, 734. [Google Scholar] [CrossRef]
- Abhinav, K; Yeh, FC; Mansouri, A; Zadeh, G; Fernandez-Miranda, JC. High-definition fiber tractography for the evaluation of perilesional white matter tracts in high-grade glioma surgery. Neuro Oncol. 2015, 17, 1199–1209. [Google Scholar] [CrossRef] [PubMed]
- Yeh, FC; Wedeen, VJ; Tseng, WY. Generalized q-sampling imaging. IEEE Trans Med Imaging 2010, 29, 1626–1635. [Google Scholar] [CrossRef] [PubMed]
- Yeh, FC; Verstynen, TD; Wang, Y; Fernandez-Miranda, JC; Tseng, WY. Deterministic diffusion fiber tracking improved by quantitative anisotropy. PloS one 2013, 8, e80713. [Google Scholar] [CrossRef]
- Conturo, TE; Lori, NF; Cull, TS; Akbudak, E; Snyder, AZ; Shimony, JS; McKinstry, RC; Burton, H; Raichle, ME. Tracking neuronal fiber pathways in the living human brain. Proceedings of the National Academy of Sciences of the United States of America 1999, 96, 10422–10427. [Google Scholar] [CrossRef] [PubMed]
- Shen, CY; Tyan, YS; Kuo, LW; Wu, CW; Weng, JC. Quantitative Evaluation of Rabbit Brain Injury after Cerebral Hemisphere Radiation Exposure Using Generalized q-Sampling Imaging. PloS one 2015, 10, e0133001. [Google Scholar] [CrossRef] [PubMed]
- Lim, SY; Tyan, YS; Chao, YP; Nien, FY; Weng, JC. New insights into the developing rabbit brain using diffusion tensor tractography and generalized q-sampling MRI. PloS one 2015, 10, e0119932. [Google Scholar] [CrossRef] [PubMed]
- Zhang, H; Wang, Y; Lu, T; Qiu, B; Tang, Y; Ou, S; Tie, X; Sun, C; Xu, K; Wang, Y. Differences between generalized q-sampling imaging and diffusion tensor imaging in the preoperative visualization of the nerve fiber tracts within peritumoral edema in brain. Neurosurgery 2013, 73, 1044–1053; discussion 1053. [Google Scholar] [CrossRef]
- Yeh, FC; Tseng, WY. Sparse solution of fiber orientation distribution function by diffusion decomposition. PloS one 2013, 8, e75747. [Google Scholar] [CrossRef]
- Yeh, FC; Wedeen, VJ; Tseng, WY. Estimation of fiber orientation and spin density distribution by diffusion deconvolution. NeuroImage 2011, 55, 1054–1062. [Google Scholar] [CrossRef] [PubMed]
- Berman, JI; Lanza, MR; Blaskey, L; Edgar, JC; Roberts, TP. High angular resolution diffusion imaging probabilistic tractography of the auditory radiation. AJNR American journal of neuroradiology 2013, 34, 1573–1578. [Google Scholar] [CrossRef]
- Caiazzo, G; Fratello, M; Di Nardo, F; Trojsi, F; Tedeschi, G; Esposito, F. Structural connectome with high angular resolution diffusion imaging MRI: assessing the impact of diffusion weighting and sampling on graph-theoretic measures. Neuroradiology 2018, 60, 497–504. [Google Scholar] [CrossRef] [PubMed]
- Tong, Q; He, H; Gong, T; Li, C; Liang, P; Qian, T; Sun, Y; Ding, Q; Li, K; Zhong, J. Multicenter dataset of multi-shell diffusion MRI in healthy traveling adults with identical settings. Scientific Data 2020, 7, 157. [Google Scholar] [CrossRef]
- Li, CX; Patel, S; Zhang, X. Evaluation of multi-shell diffusion MRI acquisition strategy on quantitative analysis using multi-compartment models. Quant Imaging Med Surg. 2020, 10, 824–834. [Google Scholar] [CrossRef] [PubMed]
- Vanden Bulcke, C; Stölting, A; Maric, D; Macq, B; Absinta, M; Maggi, P. Comparative overview of multi-shell diffusion MRI models to characterize the microstructure of multiple sclerosis lesions and periplaques. NeuroImage: Clinical 2024, 42, 103593. [Google Scholar] [CrossRef] [PubMed]
- Descoteaux, M; Deriche, R; Knosche, TR; Anwander, A. Deterministic and probabilistic tractography based on complex fibre orientation distributions. IEEE Trans Med Imaging 2009, 28, 269–286. [Google Scholar] [CrossRef]
- Wedeen, VJ; Wang, RP; Schmahmann, JD; Benner, T; Tseng, WY; Dai, G; Pandya, DN; Hagmann, P; D'Arceuil, H; de Crespigny, AJ. Diffusion spectrum magnetic resonance imaging (DSI) tractography of crossing fibers. NeuroImage 2008, 41, 1267–1277. [Google Scholar] [CrossRef]
- Mori, S; Barker, PB. Diffusion magnetic resonance imaging: its principle and applications. Anat Rec. 1999, 257, 102–109. [Google Scholar] [CrossRef]
- Winklewski, PJ; Sabisz, A; Naumczyk, P; Jodzio, K; Szurowska, E; Szarmach, A. Understanding the Physiopathology Behind Axial and Radial Diffusivity Changes-What Do We Know? Front Neurol 2018, 9, 92. [Google Scholar] [CrossRef] [PubMed]
- Wheeler-Kingshott, CA; Cercignani, M. About "axial" and "radial" diffusivities. Magnetic resonance in medicine 2009, 61, 1255–1260. [Google Scholar] [CrossRef] [PubMed]
- Sun, SW; Liang, HF; Trinkaus, K; Cross, AH; Armstrong, RC; Song, SK. Noninvasive detection of cuprizone induced axonal damage and demyelination in the mouse corpus callosum. Magnetic resonance in medicine 2006, 55, 302–308. [Google Scholar] [CrossRef]
- Budde, MD; Xie, M; Cross, AH; Song, SK. Axial diffusivity is the primary correlate of axonal injury in the experimental autoimmune encephalomyelitis spinal cord: a quantitative pixelwise analysis. J Neurosci. 2009, 29, 2805–2813. [Google Scholar] [CrossRef]
- Song, SK; Sun, SW; Ramsbottom, MJ; Chang, C; Russell, J; Cross, AH. Dysmyelination revealed through MRI as increased radial (but unchanged axial) diffusion of water. NeuroImage 2002, 17, 1429–1436. [Google Scholar] [CrossRef] [PubMed]
- Song, SK; Yoshino, J; Le, TQ; Lin, SJ; Sun, SW; Cross, AH; Armstrong, RC. Demyelination increases radial diffusivity in corpus callosum of mouse brain. NeuroImage 2005, 26, 132–140. [Google Scholar] [CrossRef]
- Kumar, R; Nguyen, HD; Macey, PM; Woo, MA; Harper, RM. Regional brain axial and radial diffusivity changes during development. Journal of neuroscience research 2012, 90, 346–355. [Google Scholar] [CrossRef]
- Barnea-Goraly, N; Menon, V; Eckert, M; Tamm, L; Bammer, R; Karchemskiy, A; Dant, CC; Reiss, AL. White matter development during childhood and adolescence: a cross-sectional diffusion tensor imaging study. Cerebral cortex (New York, NY: 1991) 2005, 15, 1848–1854. [Google Scholar] [CrossRef]
- Mukherjee, P; Miller, JH; Shimony, JS; Philip, JV; Nehra, D; Snyder, AZ; Conturo, TE; Neil, JJ; McKinstry, RC. Diffusion-tensor MR imaging of gray and white matter development during normal human brain maturation. AJNR American journal of neuroradiology 2002, 23, 1445–1456. [Google Scholar] [PubMed]
- Counsell, SJ; Shen, Y; Boardman, JP; Larkman, DJ; Kapellou, O; Ward, P; Allsop, JM; Cowan, FM; Hajnal, JV; Edwards, AD; et al. Axial and radial diffusivity in preterm infants who have diffuse white matter changes on magnetic resonance imaging at term-equivalent age. Pediatrics 2006, 117, 376–386. [Google Scholar] [CrossRef] [PubMed]
- Quinones, JF; Hildebrandt, A; Pavan, T; Thiel, CM; Heep, A. Preterm birth and neonatal white matter microstructure in in-vivo reconstructed fiber tracts among audiovisual integration brain regions. Developmental Cognitive Neuroscience 2023, 60, 101202. [Google Scholar] [CrossRef]
- Dibble, M; Ang, JZ; Mariga, L; Molloy, EJ; Bokde, ALW. Diffusion Tensor Imaging in Very Preterm, Moderate-Late Preterm and Term-Born Neonates: A Systematic Review. The Journal of pediatrics 2021, 232, 48–58.e43. [Google Scholar] [CrossRef] [PubMed]
- Rogers, CE; Smyser, T; Smyser, CD; Shimony, J; Inder, TE; Neil, JJ. Regional white matter development in very preterm infants: perinatal predictors and early developmental outcomes. Pediatric research 2016, 79, 87–95. [Google Scholar] [CrossRef]
- Vandermosten, M; Boets, B; Wouters, J; Ghesquière, P. A qualitative and quantitative review of diffusion tensor imaging studies in reading and dyslexia. Neuroscience and biobehavioral reviews 2012, 36, 1532–1552. [Google Scholar] [CrossRef]
- Vandermosten, M; Boets, B; Poelmans, H; Sunaert, S; Wouters, J; Ghesquière, P. A tractography study in dyslexia: neuroanatomic correlates of orthographic, phonological and speech processing. Brain 2012, 135, 935–948. [Google Scholar] [CrossRef]
- El-Sady, S; Mohammad, SA; Aboualfotouh Ahmed, K; Khattab, AN; Nashaat, NH; Orabi, G; Abdelraouf, ER. Correlation between diffusion tensor imaging measures and the reading and cognitive performance of Arabic readers: dyslexic children perspective. Neuroradiology 2020, 62, 525–531. [Google Scholar] [CrossRef]
- Mac Donald, CL; Johnson, AM; Cooper, D; Nelson, EC; Werner, NJ; Shimony, JS; Snyder, AZ; Raichle, ME; Witherow, JR; Fang, R; et al. Detection of blast-related traumatic brain injury in U.S. military personnel. The New England journal of medicine 2011, 364, 2091–2100. [Google Scholar] [CrossRef] [PubMed]
- Aung, WY; Mar, S; Benzinger, TL. Diffusion tensor MRI as a biomarker in axonal and myelin damage. Imaging Med. 2013, 5, 427–440. [Google Scholar] [CrossRef]
- Arfanakis, K; Haughton, VM; Carew, JD; Rogers, BP; Dempsey, RJ; Meyerand, ME. Diffusion tensor MR imaging in diffuse axonal injury. AJNR American journal of neuroradiology 2002, 23, 794–802. [Google Scholar]
- Robinson, S; Berglass, JB; Denson, JL; Berkner, J; Anstine, CV; Winer, JL; Maxwell, JR; Qiu, J; Yang, Y; Sillerud, LO; et al. Microstructural and microglial changes after repetitive mild traumatic brain injury in mice. Journal of neuroscience research 2017, 95, 1025–1035. [Google Scholar] [CrossRef]
- Bennett, RE; Mac Donald, CL; Brody, DL. Diffusion tensor imaging detects axonal injury in a mouse model of repetitive closed-skull traumatic brain injury. Neuroscience letters 2012, 513, 160–165. [Google Scholar] [CrossRef]
- Du, G; Lewis, MM; Kanekar, S; Sterling, NW; He, L; Kong, L; Li, R; Huang, X. Combined Diffusion Tensor Imaging and Apparent Transverse Relaxation Rate Differentiate Parkinson Disease and Atypical Parkinsonism. AJNR American journal of neuroradiology 2017, 38, 966–972. [Google Scholar] [CrossRef]
- Metwalli, NS; Benatar, M; Nair, G; Usher, S; Hu, X; Carew, JD. Utility of axial and radial diffusivity from diffusion tensor MRI as markers of neurodegeneration in amyotrophic lateral sclerosis. Brain Res. 2010, 1348, 156–164. [Google Scholar] [CrossRef]
- Kamagata, K; Andica, C; Hatano, T; Ogawa, T; Takeshige-Amano, H; Ogaki, K; Akashi, T; Hagiwara, A; Fujita, S; Aoki, S. Advanced diffusion magnetic resonance imaging in patients with Alzheimer's and Parkinson's diseases. Neural Regen Res. 2020, 15, 1590–1600. [Google Scholar] [CrossRef]
- Lin, CP; Frigerio, I; Bol, J; Bouwman, MMA; Wesseling, AJ; Dahl, MJ; Rozemuller, AJM; van der Werf, YD; Pouwels, PJW; van de Berg, WDJ; et al. Microstructural integrity of the locus coeruleus and its tracts reflect noradrenergic degeneration in Alzheimer's disease and Parkinson's disease. Transl Neurodegener. 2024, 13, 9. [Google Scholar] [CrossRef] [PubMed]
- Naidu, S; Kaufmann, WE; Abrams, MT; Pearlson, GD; Lanham, DC; Fredericksen, KA; Barker, PB; Horska, A; Golay, X; Mori, S; et al. Neuroimaging studies in Rett syndrome. Brain Dev. 2001, 23 Suppl 1, S62–71. [Google Scholar] [CrossRef] [PubMed]
- Awad, PN; Zerbi, V; Johnson-Venkatesh, EM; Damiani, F; Pagani, M; Markicevic, M; Nickles, S; Gozzi, A; Umemori, H; Fagiolini, M. CDKL5 sculpts functional callosal connectivity to promote cognitive flexibility. Mol Psychiatry 2024, 29, 1698–1709. [Google Scholar] [CrossRef]
- Olds, J. Learning and the hippocampus. Rev Can Biol. 1972, 31, Suppl:215–238. [Google Scholar]
- McClelland, JL; McNaughton, BL; O'Reilly, RC. Why there are complementary learning systems in the hippocampus and neocortex: insights from the successes and failures of connectionist models of learning and memory. Psychol Rev. 1995, 102, 419–457. [Google Scholar] [CrossRef]
- Biane, JS; Ladow, MA; Stefanini, F; Boddu, SP; Fan, A; Hassan, S; Dundar, N; Apodaca-Montano, DL; Zhou, LZ; Fayner, V; et al. Neural dynamics underlying associative learning in the dorsal and ventral hippocampus. Nature neuroscience 2023, 26, 798–809. [Google Scholar] [CrossRef] [PubMed]
- Dickerson, KC; Delgado, MR. Contributions of the hippocampus to feedback learning. Cogn Affect Behav Neurosci. 2015, 15, 861–877. [Google Scholar] [CrossRef]
- Rogan, MT; Staubli, UV; LeDoux, JE. Fear conditioning induces associative long-term potentiation in the amygdala. Nature 1997, 390, 604–607. [Google Scholar] [CrossRef] [PubMed]
- Dityatev, AE; Bolshakov, VY. Amygdala, long-term potentiation, and fear conditioning. The Neuroscientist: a review journal bringing neurobiology, neurology and psychiatry 2005, 11, 75–88. [Google Scholar] [CrossRef]
- Kochli, DE; Thompson, EC; Fricke, EA; Postle, AF; Quinn, JJ. The amygdala is critical for trace, delay, and contextual fear conditioning. Learning & memory (Cold Spring Harbor, NY) 2015, 22, 92–100. [Google Scholar] [CrossRef]
- Skelly, MJ; Ariwodola, OJ; Weiner, JL. Fear conditioning selectively disrupts noradrenergic facilitation of GABAergic inhibition in the basolateral amygdala. Neuropharmacology 2017, 113, 231–240. [Google Scholar] [CrossRef] [PubMed]
- Kim, WB; Cho, JH. Encoding of Discriminative Fear Memory by Input-Specific LTP in the Amygdala. Neuron 2017, 95, 1129–1146.e1125. [Google Scholar] [CrossRef] [PubMed]
- Guillamón-Vivancos, T; Favaloro, F; Dori, F; López-Bendito, G. The superior colliculus: New insights into an evolutionarily ancient structure. Current Opinion in Neurobiology 2024, 89, 102926. [Google Scholar] [CrossRef] [PubMed]
- Ito, S; Feldheim, DA. The Mouse Superior Colliculus: An Emerging Model for Studying Circuit Formation and Function. Front Neural Circuits 2018, 12, 10. [Google Scholar] [CrossRef]
- Goossens, HH; van Opstal, AJ. Optimal control of saccades by spatial-temporal activity patterns in the monkey superior colliculus. PLoS Comput Biol. 2012, 8, e1002508. [Google Scholar] [CrossRef]
- Yuan, P; Raz, N. Prefrontal cortex and executive functions in healthy adults: a meta-analysis of structural neuroimaging studies. Neuroscience and biobehavioral reviews 2014, 42, 180–192. [Google Scholar] [CrossRef]
- Burzynska, AZ; Nagel, IE; Preuschhof, C; Gluth, S; Bäckman, L; Li, SC; Lindenberger, U; Heekeren, HR. Cortical thickness is linked to executive functioning in adulthood and aging. Hum Brain Mapp. 2012, 33, 1607–1620. [Google Scholar] [CrossRef]
- Cao, J; Xu, J; Chen, S; Fan, F; Chen, M; Liu, F; Li, G. Odor-mediated contextual learning induced memory consolidation and hippocampus development in neonate rat. Neuroreport 2020, 31, 64–68. [Google Scholar] [CrossRef]
- Yau, SY; Li, A; So, KF. Involvement of Adult Hippocampal Neurogenesis in Learning and Forgetting. Neural plasticity 2015, 2015, 717958. [Google Scholar] [CrossRef]
- Morris, RG; Garrud, P; Rawlins, JN; O'Keefe, J. Place navigation impaired in rats with hippocampal lesions. Nature 1982, 297, 681–683. [Google Scholar] [CrossRef]
- Amsel, A. Hippocampal function in the rat: cognitive mapping or vicarious trial and error? Hippocampus 1993, 3, 251–256. [Google Scholar] [CrossRef] [PubMed]
- D'Hooge, R; De Deyn, PP. Applications of the Morris water maze in the study of learning and memory. Brain research Brain research reviews 2001, 36, 60–90. [Google Scholar] [CrossRef] [PubMed]
- Wenk, GL. Assessment of spatial memory using the radial arm maze and Morris water maze. In Current protocols in neuroscience; 2004; Volume Chapter 8:Unit 8.5A. [Google Scholar] [CrossRef]
- Sullivan, EV; Rosenbloom, MJ; Deshmukh, A; Desmond, JE; Pfefferbaum, A. Alcohol and the Cerebellum: Effects on Balance, Motor Coordination, and Cognition. Alcohol Health Res World 1995, 19, 138–141. [Google Scholar]
- Kansal, K; Yang, Z; Fishman, AM; Sair, HI; Ying, SH; Jedynak, BM; Prince, JL; Onyike, CU. Structural cerebellar correlates of cognitive and motor dysfunctions in cerebellar degeneration. Brain 2017, 140, 707–720. [Google Scholar] [CrossRef]
- Johnson, DM; Illig, KR; Behan, M; Haberly, LB. New features of connectivity in piriform cortex visualized by intracellular injection of pyramidal cells suggest that "primary" olfactory cortex functions like "association" cortex in other sensory systems. J Neurosci. 2000, 20, 6974–6982. [Google Scholar] [CrossRef]
- Borghei, A; Kelly, R; Pearce, JJ; Stoub, TR; Sani, S. Structural Connectivity of the Human Piriform Cortex: an Exploratory Study. Neurosurgery 2024, 94, 856–863. [Google Scholar] [CrossRef]
- Miller, WL. The Hypothalamic-Pituitary-Adrenal Axis: A Brief History. Horm Res Paediatr. 2018, 89, 212–223. [Google Scholar] [CrossRef] [PubMed]
- Fong, H; Zheng, J; Kurrasch, D. The structural and functional complexity of the integrative hypothalamus. Science 2023, 382, 388–394. [Google Scholar] [CrossRef] [PubMed]
- Basso, MA; May, PJ. Circuits for Action and Cognition: A View from the Superior Colliculus. Annu Rev Vis Sci. 2017, 3, 197–226. [Google Scholar] [CrossRef]
- Basso, MA; Bickford, ME; Cang, J. Unraveling circuits of visual perception and cognition through the superior colliculus. Neuron 2021, 109, 918–937. [Google Scholar] [CrossRef] [PubMed]
- Ghitani, N; Bayguinov, PO; Basso, MA; Jackson, MB. A sodium afterdepolarization in rat superior colliculus neurons and its contribution to population activity. J Neurophysiol. 2016, 116, 191–200. [Google Scholar] [CrossRef]
- Sporns, O; Tononi, G; Kötter, R. The human connectome: A structural description of the human brain. PLoS Comput Biol. 2005, 1, e42. [Google Scholar] [CrossRef]
- He, Y; Evans, A. Graph theoretical modeling of brain connectivity. Current opinion in neurology 2010, 23, 341–350. [Google Scholar] [CrossRef] [PubMed]
- Bassett, DS; Bullmore, ET. Human brain networks in health and disease. Current opinion in neurology 2009, 22, 340–347. [Google Scholar] [CrossRef] [PubMed]
- Lo, CY; He, Y; Lin, CP. Graph theoretical analysis of human brain structural networks. Reviews in the neurosciences 2011, 22, 551–563. [Google Scholar] [CrossRef] [PubMed]
- Chiang, S; Haneef, Z. Graph theory findings in the pathophysiology of temporal lobe epilepsy. Clinical neurophysiology: official journal of the International Federation of Clinical Neurophysiology 2014, 125, 1295–1305. [Google Scholar] [CrossRef]
- Stam, CJ; Reijneveld, JC. Graph theoretical analysis of complex networks in the brain. Nonlinear Biomedical Physics 2007, 1, 3. [Google Scholar] [CrossRef]
- Reijneveld, JC; Ponten, SC; Berendse, HW; Stam, CJ. The application of graph theoretical analysis to complex networks in the brain. Clinical Neurophysiology 2007, 118, 2317–2331. [Google Scholar] [CrossRef]
- Vecchio, F; Miraglia, F; Maria Rossini, P. Connectome: Graph theory application in functional brain network architecture. Clinical Neurophysiology Practice 2017, 2, 206–213. [Google Scholar] [CrossRef]
- Rubinov, M; Sporns, O. Weight-conserving characterization of complex functional brain networks. NeuroImage 2011, 56, 2068–2079. [Google Scholar] [CrossRef]
- Cohen, JR; D'Esposito, M. The Segregation and Integration of Distinct Brain Networks and Their Relationship to Cognition. J Neurosci. 2016, 36, 12083–12094. [Google Scholar] [CrossRef]
- Bassett, DS; Bullmore, E. Small-world brain networks. The Neuroscientist: a review journal bringing neurobiology, neurology and psychiatry 2006, 12, 512–523. [Google Scholar] [CrossRef]
- Bassett, DS; Bullmore, ET. Small-World Brain Networks Revisited. The Neuroscientist: a review journal bringing neurobiology, neurology and psychiatry 2017, 23, 499–516. [Google Scholar] [CrossRef]
- Kukla, B; Anthony, M; Chen, S; Turnbull, A; Baran, TM; Lin, FV. Brain Small-Worldness Properties and Perceived Fatigue in Mild Cognitive Impairment. J Gerontol A Biol Sci Med Sci. 2022, 77, 541–546. [Google Scholar] [CrossRef] [PubMed]
- Medina, JF; Repa, JC; Mauk, MD; LeDoux, JE. Parallels between cerebellum- and amygdala-dependent conditioning. Nat Rev Neurosci. 2002, 3, 122–131. [Google Scholar] [CrossRef]
- Téllez-Zenteno, JF; Hernández-Ronquillo, L. A review of the epidemiology of temporal lobe epilepsy. Epilepsy Res Treat. 2012, 2012, 630853. [Google Scholar] [CrossRef]
- Sinjab, B; Martinian, L; Sisodiya, SM; Thom, M. Regional thalamic neuropathology in patients with hippocampal sclerosis and epilepsy: a postmortem study. Epilepsia 2013, 54, 2125–2133. [Google Scholar] [CrossRef]
- Feng, L; Motelow, JE; Ma, C; Biche, W; McCafferty, C; Smith, N; Liu, M; Zhan, Q; Jia, R; Xiao, B; et al. Seizures and Sleep in the Thalamus: Focal Limbic Seizures Show Divergent Activity Patterns in Different Thalamic Nuclei. J Neurosci. 2017, 37, 11441–11454. [Google Scholar] [CrossRef]
- Park, KM; Kim, TH; Mun, CW; Shin, KJ; Ha, SY; Park, J; Lee, BI; Lee, H-J; Kim, SE. Reduction of ipsilateral thalamic volume in temporal lobe epilepsy with hippocampal sclerosis. Journal of Clinical Neuroscience 2018, 55, 76–81. [Google Scholar] [CrossRef] [PubMed]
- Cho, KH; Lee, HJ; Heo, K; Kim, SE; Lee, DA; Park, KM. Intrinsic Thalamic Network in Temporal Lobe Epilepsy With Hippocampal Sclerosis According to Surgical Outcomes. [CrossRef] [PubMed]
- Fisher, RS. Deep brain stimulation of thalamus for epilepsy. Neurobiology of disease 2023, 179, 106045. [Google Scholar] [CrossRef]
- Bouwens van der Vlis, TAM; Schijns, O; Schaper, F; Hoogland, G; Kubben, P; Wagner, L; Rouhl, R; Temel, Y; Ackermans, L. Deep brain stimulation of the anterior nucleus of the thalamus for drug-resistant epilepsy. Neurosurg Rev. 2019, 42, 287–296. [Google Scholar] [CrossRef] [PubMed]
- Shine, JM; Lewis, LD; Garrett, DD; Hwang, K. The impact of the human thalamus on brain-wide information processing. Nature Reviews Neuroscience 2023, 24, 416–430. [Google Scholar] [CrossRef]
- Marcuse, LV; Langan, M; Hof, PR; Panov, F; Saez, I; Jimenez-Shahed, J; Figee, M; Mayberg, H; Yoo, JY; Ghatan, S; et al. The thalamus: Structure, function, and neurotherapeutics. Neurotherapeutics: the journal of the American Society for Experimental NeuroTherapeutics 2025, 22, e00550. [Google Scholar] [CrossRef] [PubMed]
- Cacciatore, M; Magnani, FG; Barbadoro, F; Ippoliti, C; Stanziano, M; Clementi, L; Nigri, A; Nanetti, L; Marino, S; La Porta, F; et al. Thalamus and consciousness: a systematic review on thalamic nuclei associated with consciousness. Front Neurol. 2025, 16, 1509668. [Google Scholar] [CrossRef] [PubMed]
- Specchio, N; Trivisano, M; Lenge, M; Ferretti, A; Mei, D; Parrini, E; Napolitano, A; Rossi-Espagnet, C; Talenti, G; Longo, D; et al. CDKL5 deficiency disorder: progressive brain atrophy may be part of the syndrome. Cerebral cortex (New York, NY: 1991) 2023, 33, 9709–9717. [Google Scholar] [CrossRef]
- Rodak, M; Jonderko, M; Rozwadowska, P; Machnikowska-Sokołowska, M; Paprocka, J. CDKL5 Deficiency Disorder (CDD)—Rare Presentation in Male. Children 2022, 9. [Google Scholar] [CrossRef] [PubMed]
- Takeguchi, R; Akaba, Y; Kuroda, M; Tanaka, R; Tanaka, T; Itoh, M; Takahashi, S. Neurophysiological and brain structural insights into cyclin-dependent kinase-like 5 deficiency disorder: Visual and auditory evoked potentials and MRI analysis. J Neurol Sci. 2024, 461, 123063. [Google Scholar] [CrossRef]
- Lupori, L; Sagona, G; Fuchs, C; Mazziotti, R; Stefanov, A; Putignano, E; Napoli, D; Strettoi, E; Ciani, E; Pizzorusso, T. Site-specific abnormalities in the visual system of a mouse model of CDKL5 deficiency disorder. Human molecular genetics 2019, 28, 2851–2861. [Google Scholar] [CrossRef]
- Carli, S; Chaabane, L; Butti, C; De Palma, C; Aimar, P; Salio, C; Vignoli, A; Giustetto, M; Landsberger, N; Frasca, A. In vivo magnetic resonance spectroscopy in the brain of Cdkl5 null mice reveals a metabolic profile indicative of mitochondrial dysfunctions. J Neurochem. 2021, 157, 1253–1269. [Google Scholar] [CrossRef]
- Serrano, RJ; Lee, C; Douek, AM; Kaslin, J; Bryson-Richardson, RJ; Sztal, TE. Novel preclinical model for CDKL5 deficiency disorder. Disease models & mechanisms 2022, 15. [Google Scholar] [CrossRef]
- Lupori, L; Sagona, G; Fuchs, C; Mazziotti, R; Stefanov, A; Putignano, E; Napoli, D; Strettoi, E; Ciani, E; Pizzorusso.
- Benarroch, E. What Are the Functions of the Superior Colliculus and Its Involvement in Neurologic Disorders? Neurology 2023, 100, 784–790. [Google Scholar] [CrossRef]
- Quintiliani, M; Ricci, D; Petrianni, M; Leone, S; Orazi, L; Amore, F; Gambardella, ML; Contaldo, I; Veredice, C; Perulli, M; et al. Cortical Visual Impairment in CDKL5 Deficiency Disorder. Front Neurol. 2021, 12, 805745. [Google Scholar] [CrossRef]
- Adhikari, A; Buchanan, FKB; Fenton, TA; Cameron, DL; Halmai, J; Copping, NA; Fink, KD; Silverman, JL. Touchscreen cognitive deficits, hyperexcitability and hyperactivity in males and females using two models of Cdkl5 deficiency. Human molecular genetics 2022, 31, 3032–3050. [Google Scholar] [CrossRef]
- Mottolese, N; Uguagliati, B; Tassinari, M; Cerchier, CB; Loi, M; Candini, G; Rimondini, R; Medici, G; Trazzi, S; Ciani, E. Voluntary Running Improves Behavioral and Structural Abnormalities in a Mouse Model of CDKL5 Deficiency Disorder. Biomolecules 2023, 13. [Google Scholar] [CrossRef] [PubMed]
- Downs, J; Jacoby, P; Specchio, N; Cross, H; Amin, S; Bahi-Buisson, N; Rajaraman, R; Suter, B; Devinsky, O; Aimetti, A; et al. Effects of ganaxolone on non-seizure outcomes in CDKL5 Deficiency Disorder: Double-blind placebo-controlled randomized trial. Eur J Paediatr Neurol. 2024, 51, 140–146. [Google Scholar] [CrossRef] [PubMed]
- Lau, T; Miller, T; Klein, T; Benbadis, SR; Vale, FL. Temporal lobe surgery in medically refractory epilepsy: a comparison between populations based on MRI findings. Seizure 2014, 23, 20–24. [Google Scholar] [CrossRef] [PubMed]
- Tabibian, F; Mehvari Habibabadi, J; Maracy, MR; Kahnouji, H; Rahimi, M; Rezaei, M. Evaluation of Cognitive Impairment in Refractory Temporal Lobe Epilepsy Patients Concerning Structural Brain Lesions. Basic Clin Neurosci. 2023, 14, 385–395. [Google Scholar] [CrossRef]
- Frazzini, V; Cousyn, L; Navarro, V. Semiology, EEG, and neuroimaging findings in temporal lobe epilepsies. Handbook of clinical neurology 2022, 187, 489–518. [Google Scholar] [CrossRef]
- Zhang, C; Hu, W; Wu, Y; Li, G; Yang, C; Wu, T. Altered Directed-Connectivity Network in Temporal Lobe Epilepsy: A MEG Study. Sensors 2025, 25. [Google Scholar] [CrossRef]
- Ives-Deliperi, V; Butler, JT. Mechanisms of cognitive impairment in temporal lobe epilepsy: A systematic review of resting-state functional connectivity studies. Epilepsy & Behavior 2021, 115, 107686. [Google Scholar] [CrossRef]
- Ishizaki, T; Maesawa, S; Suzuki, T; Hashida, M; Ito, Y; Yamamoto, H; Tanei, T; Natsume, J; Hoshiyama, M; Saito, R. Frequency-specific network changes in mesial temporal lobe epilepsy: Analysis of chronic and transient dysfunctions in the temporo-amygdala-orbitofrontal network using magnetoencephalography. Epilepsia open. 2025, 10, 557–570. [Google Scholar] [CrossRef] [PubMed]
- Alfiler, L. ALLEN BRAIN ATLAS API. 2024. [Google Scholar]
- Terzic, B; Davatolhagh, MF; Ho, Y; Tang, S; Liu, YT; Xia, Z; Cui, Y; Fuccillo, MV; Zhou, Z. Temporal manipulation of Cdkl5 reveals essential postdevelopmental functions and reversible CDKL5 deficiency disorder-related deficits. J Clin Invest. 2021, 131. [Google Scholar] [CrossRef] [PubMed]
- Kind, PC; Bird, A. CDKL5 deficiency disorder: a pathophysiology of neural maintenance. J Clin Invest. 2021, 131. [Google Scholar] [CrossRef]
Figure 1.
Flow diagram of diffusion MRI tractography and high-definition brain network (HDBN) delineation (A) Representative images of diffusion MRI. (B) High-definition 3D diffusion tractography generated from diffusion MRI. (C) Parallel acquisition of high-resolution T2-weighted anatomical MRI with the same geometry as diffusion MRI. (D) Co-registration of diffusion tractography and high-resolution anatomical MRI the Allen brain atlas space to perform (E) Atlas based segmentation. (F) Adjacency matrix that is generated from a combination of tractography through various regions of the atlas-based segmentation. (G) Brain topology and connectogram generated from adjacency matrix. (H) Group comparisons between WT and Cdkl5 KO mice to generate p value matrix for brain region connectivity that are significantly different in the adjacency matrixes.
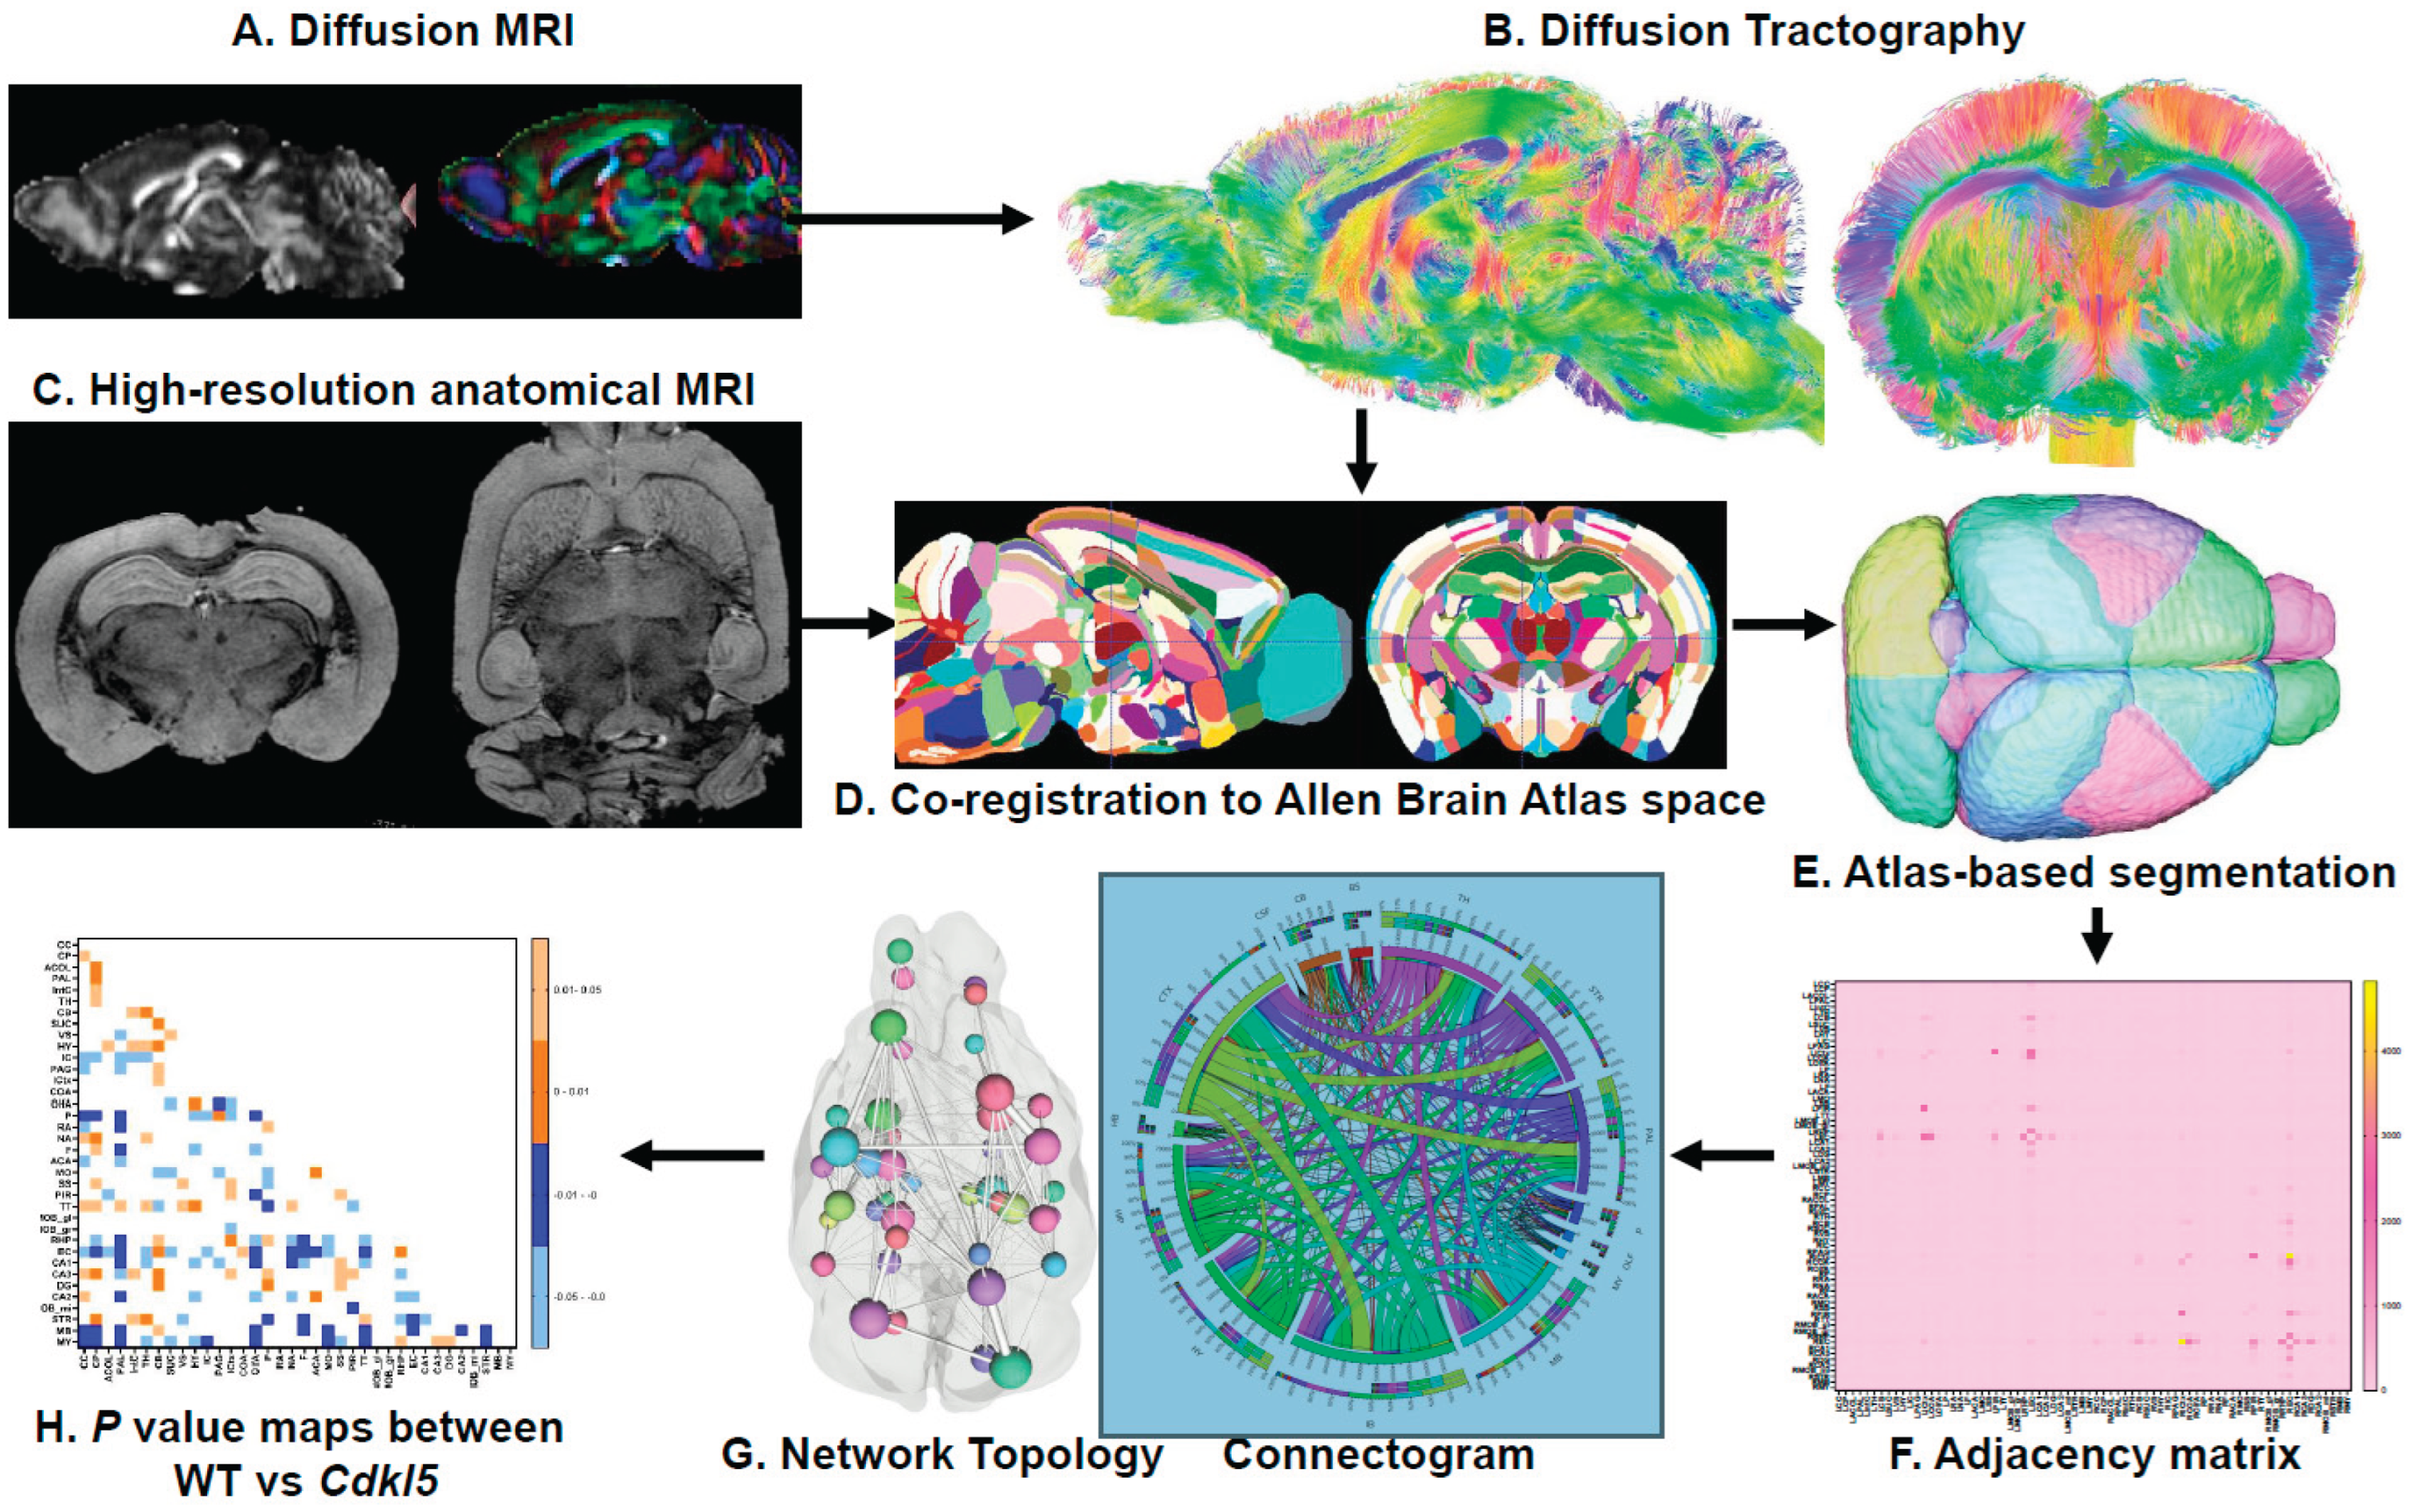
Figure 2.
Group comparison of quantitative diffusivity (A) Representative images of whole brain have been rendered on a scale of 0–0.6 for average fractional anisotropy (FA), medial diffusivity (MD), axial diffusivity (AD), and radial diffusivity (RD) per ROI. General patterning of FA appears to be the same between WT and Cdkl5, but different patterning for MD, AD, and RD. (B) Representative images highlighting regions that are significantly different according to the t-test.
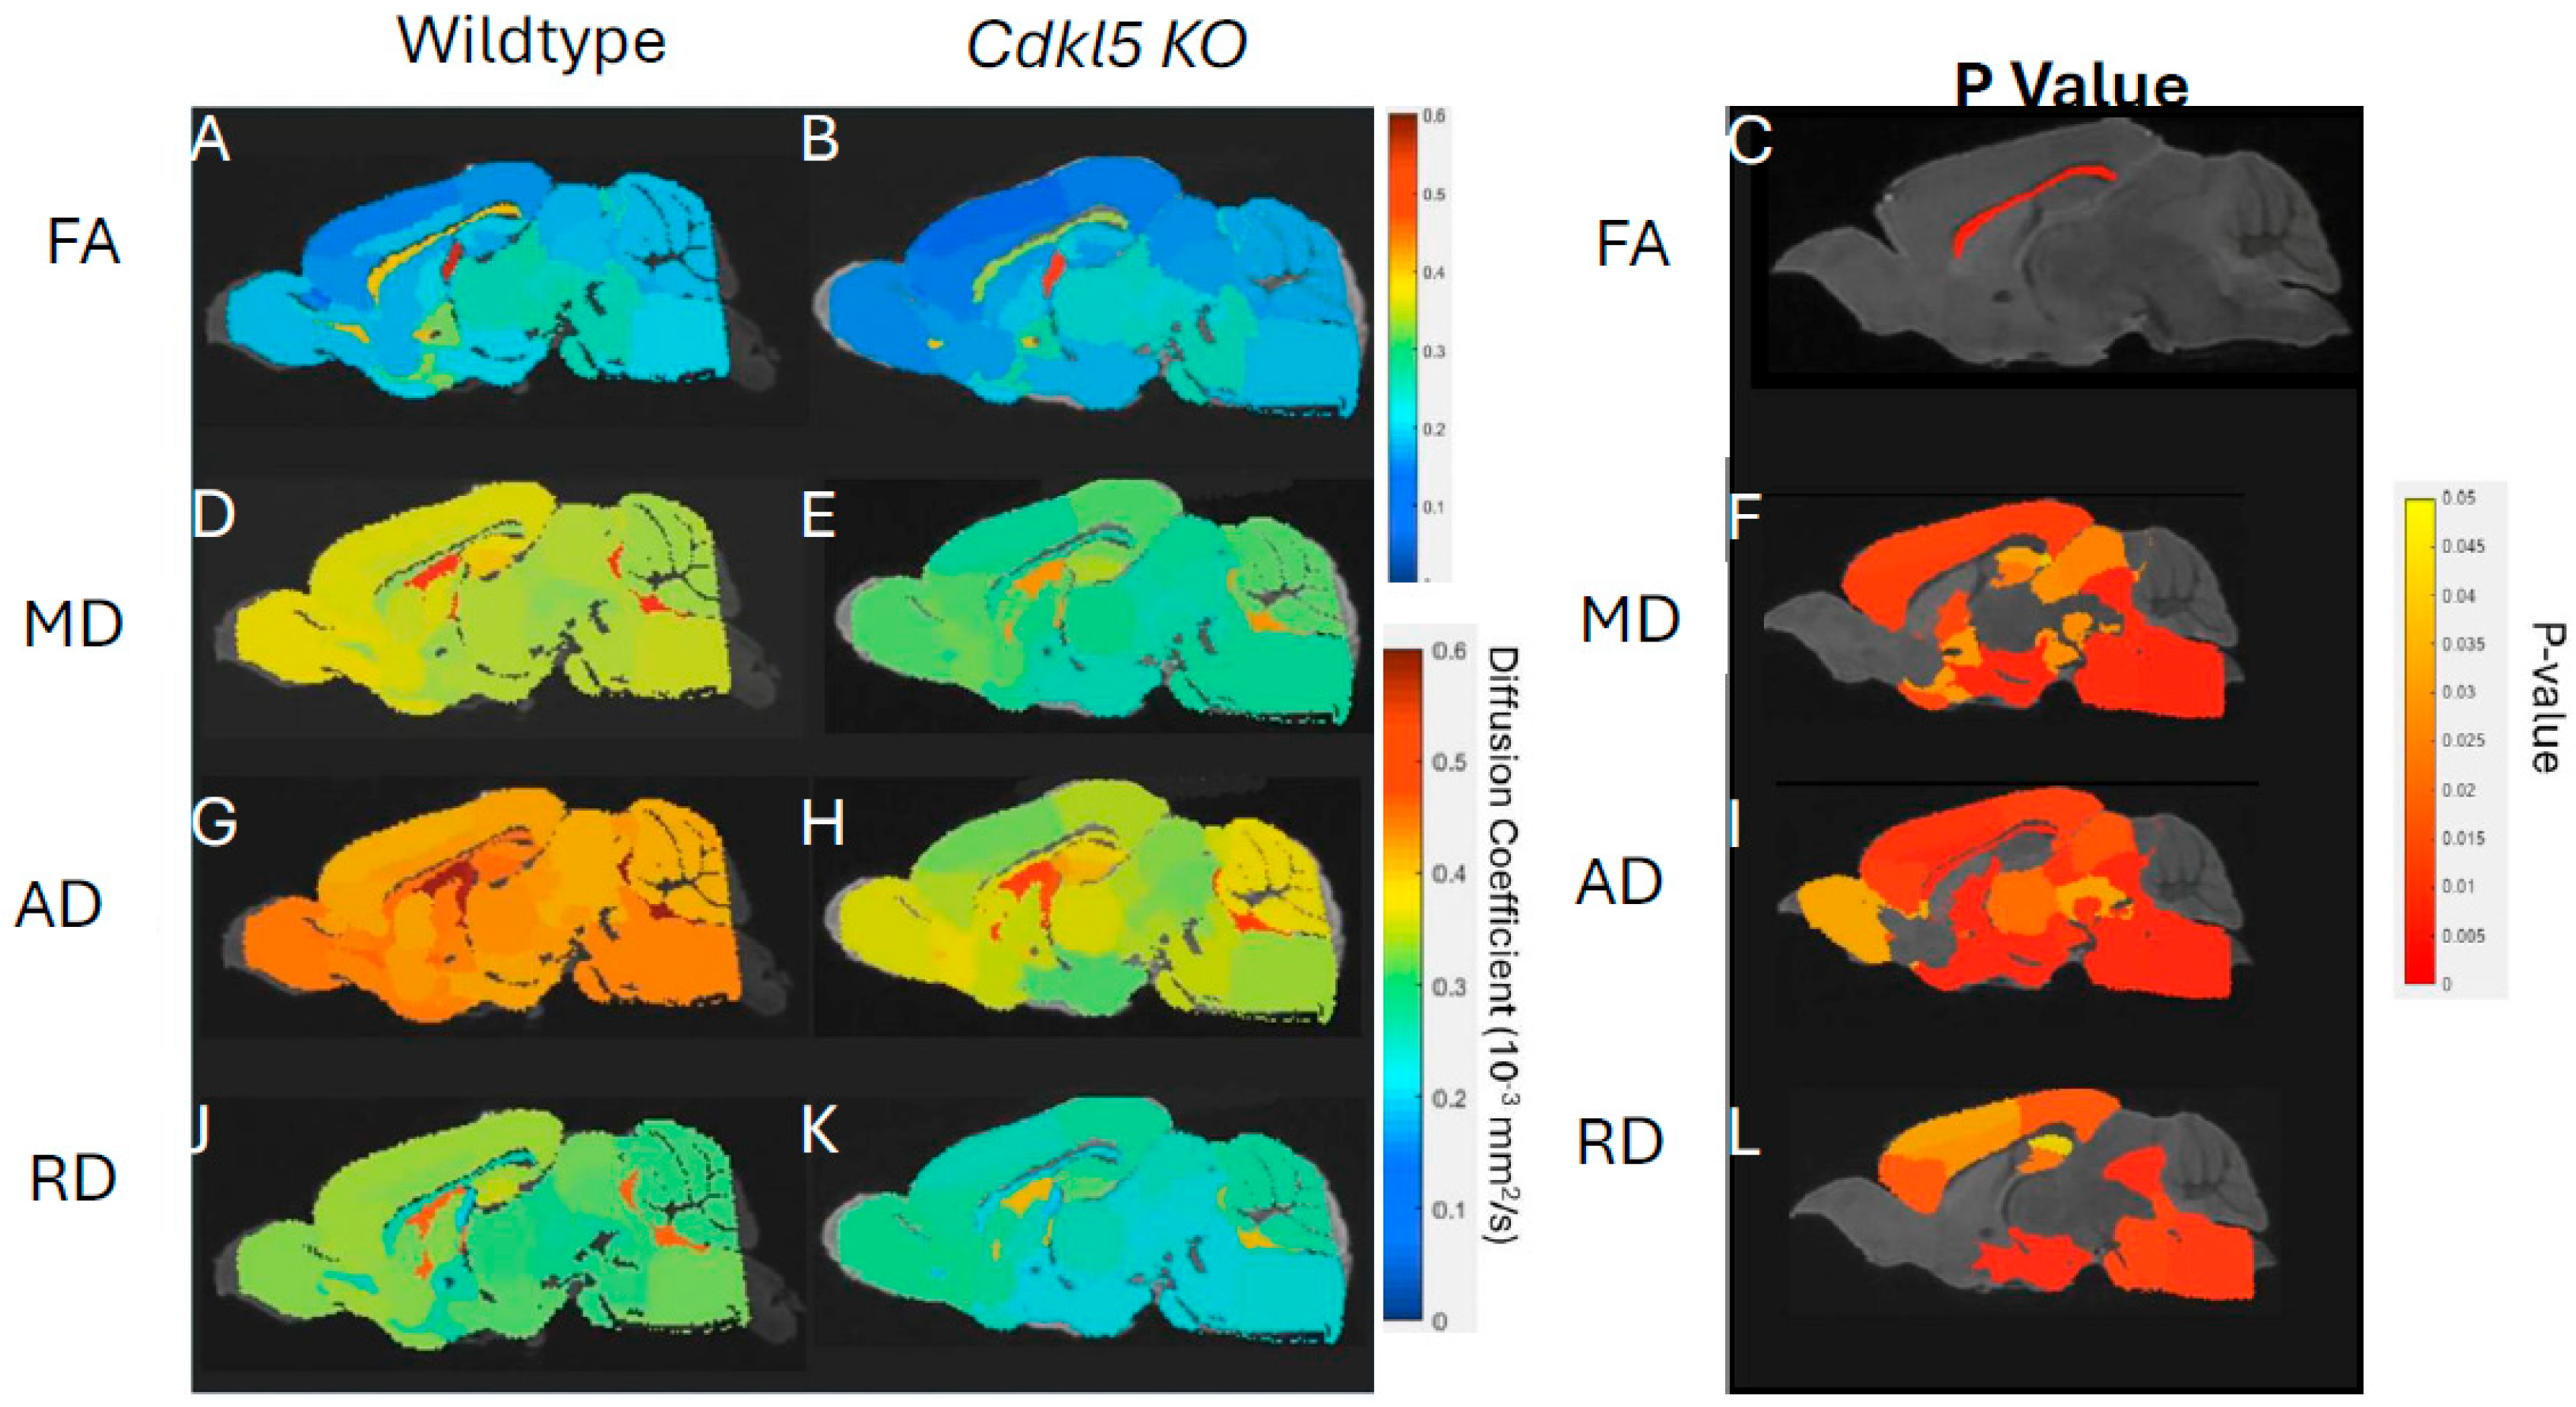
Figure 3.
Diffusion tractography and brain network analysis for the whole brain (A, B) Diffusion tractography (B, E) connectogram (C, F) adjacency matrix for WT (A-C) or hemizygous Cdkl5 KO mice (D-F). (G-J) P value matrix to compare connectomes, an adjacency matrix of signed FDR adjusted p-values shows connections between regions where Cdkl5 KO > WT (0.01-0.05 light orange, 0.005-0.01 dark orange) and connections between regions where WT > Cdkl5 KO (0.0- -0.05 light blue, -0.005- -0.01 dark blue) for (G) left ipsilateral hemisphere connections (left to left hemisphere), (H) right contralateral connections (right to left hemispheres) (I) left contralateral connections (left to right hemispheres) and (J) right ipsilateral hemisphere connections (right to right hemisphere). .
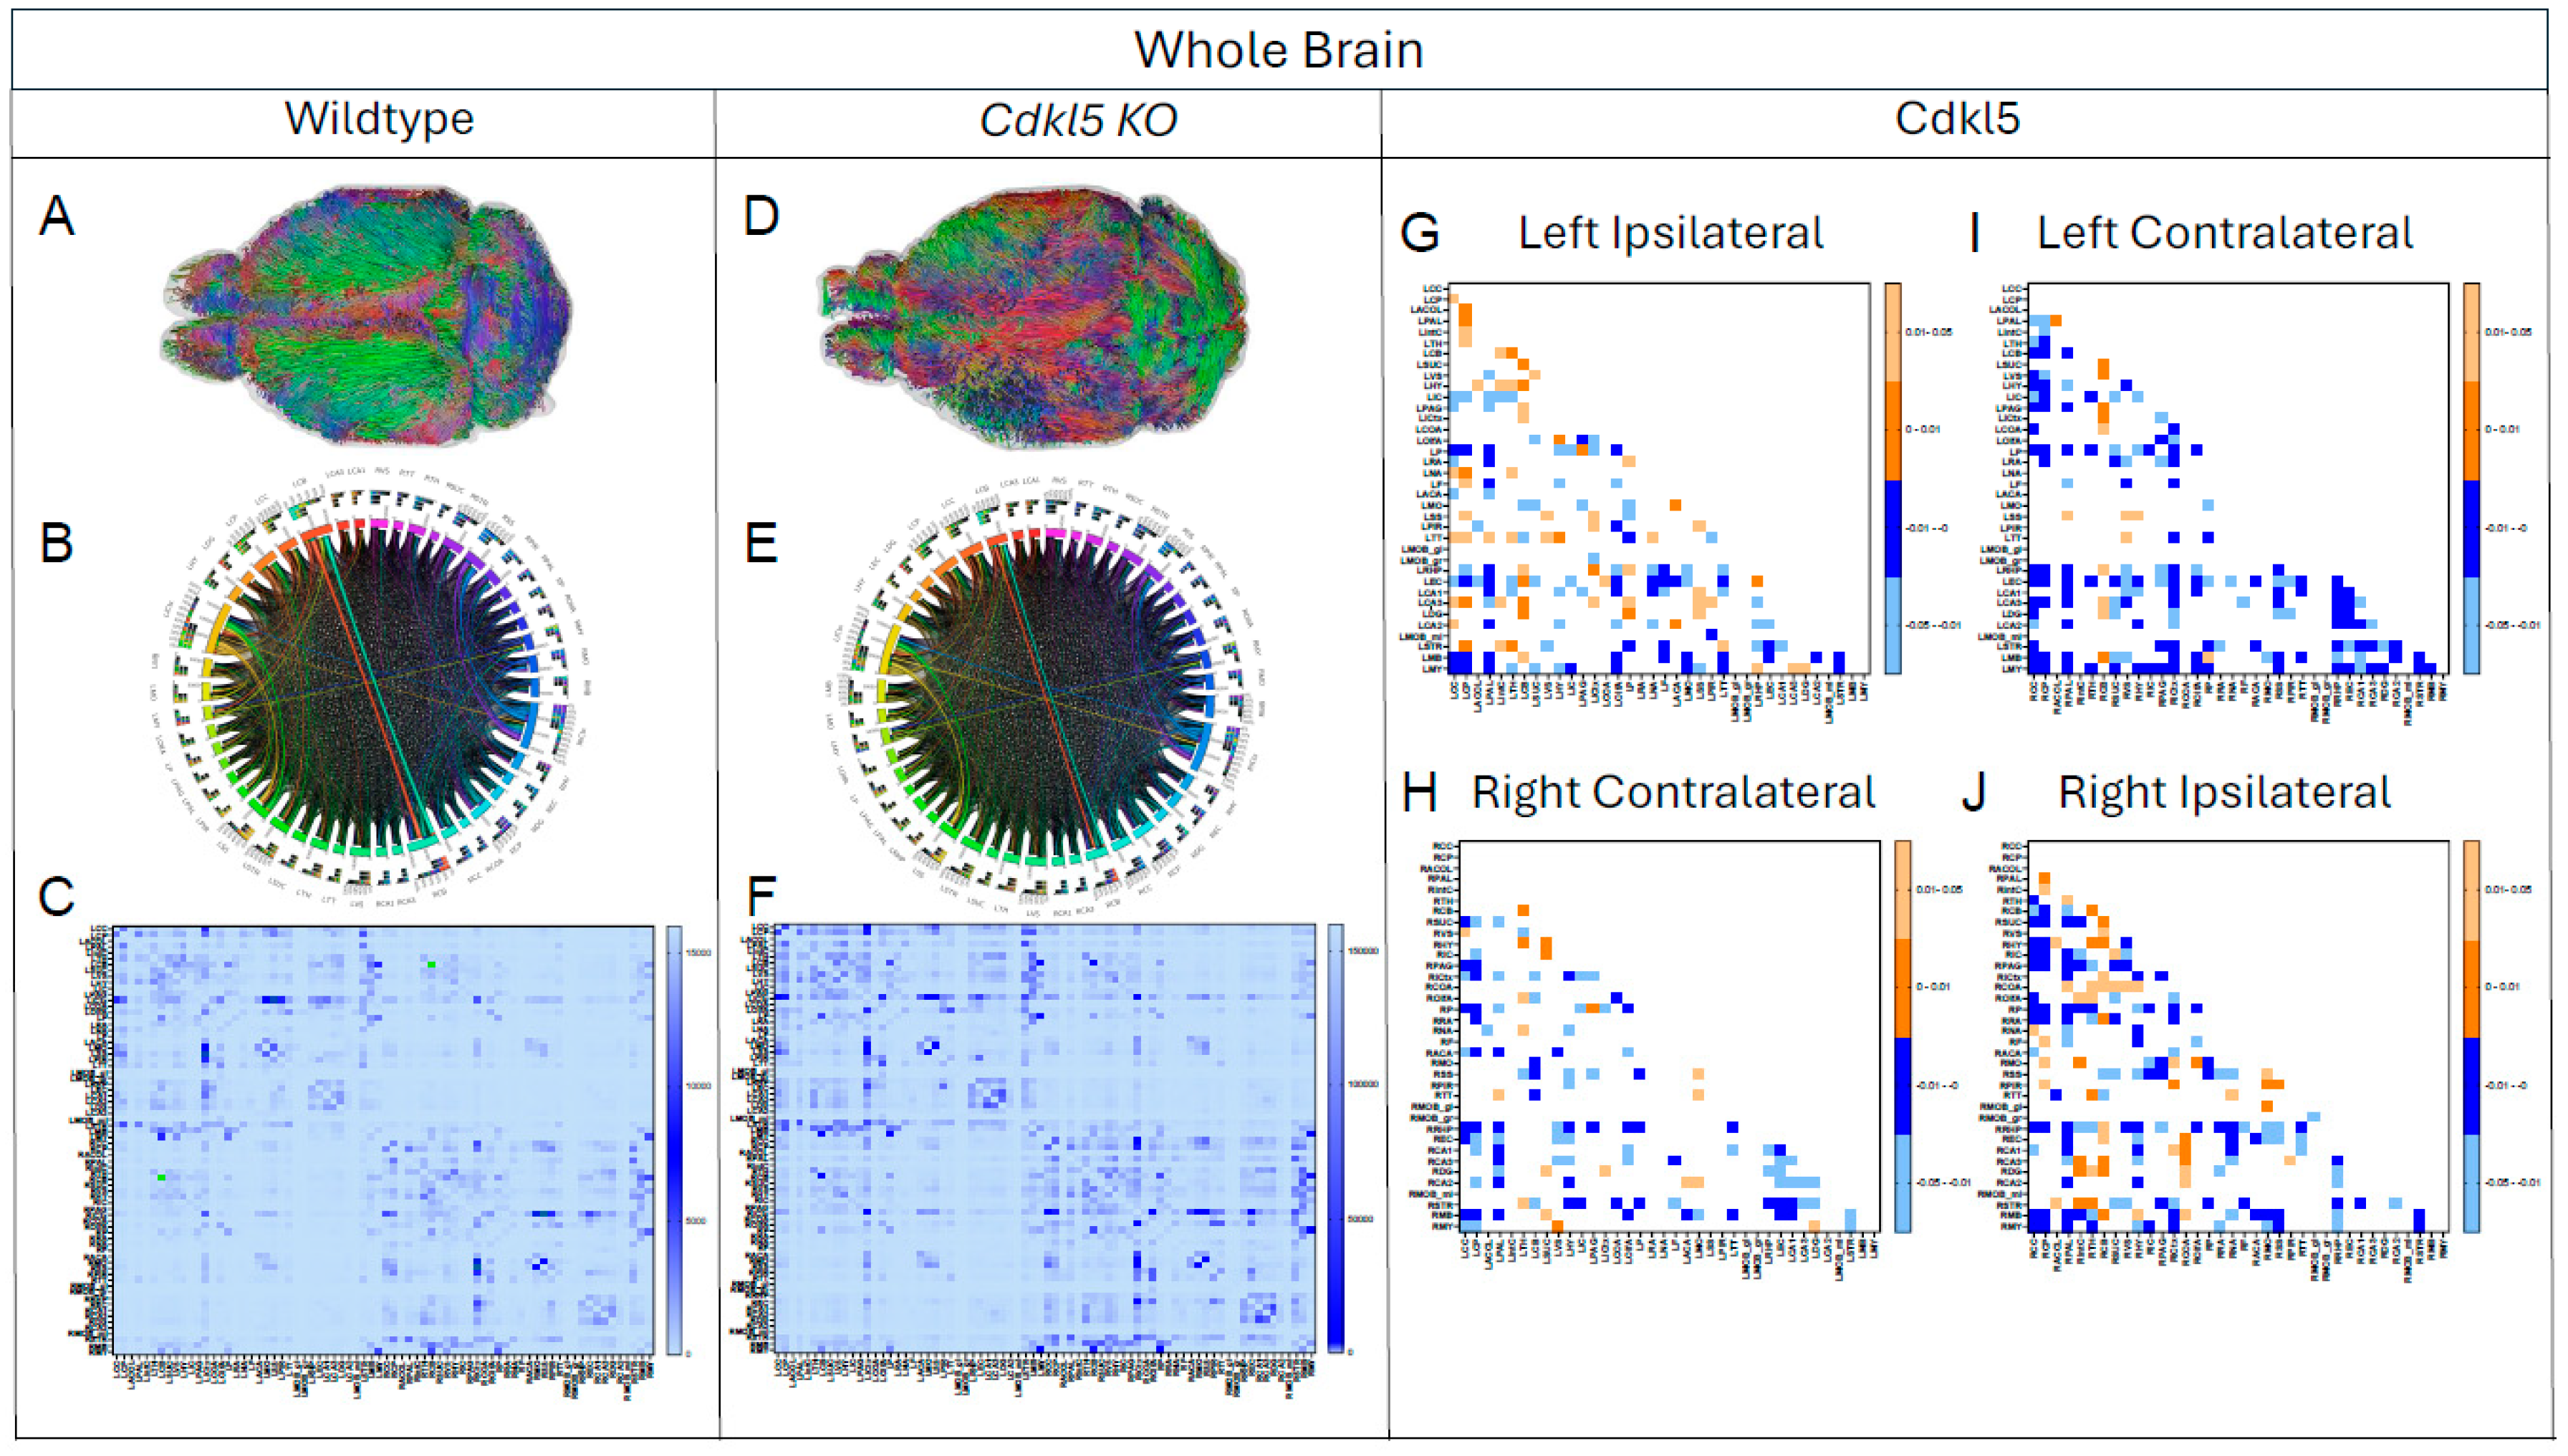
Figure 14.
Diffusion tractography and brain network analysis for the fear conditioning pathway. (A) Diagram of fear conditioning pathway from Visual stimulation through the optic track and through sound stimulation to midbrain, Thalamus (TH), hypothalamus (HY), amygdala (CoA), somatosensory cortex (SS) and Isocortex (ICtx). (B-M) Diffusion tractography for (B-G) WT and (H-M) Cdkl5, for connections between TH-ICtx (B, H), ICtx-COA (C, I), TH-SS (D, J), SS-COA (E, K), TH-COA (F, L), COA-HY (G, M). .
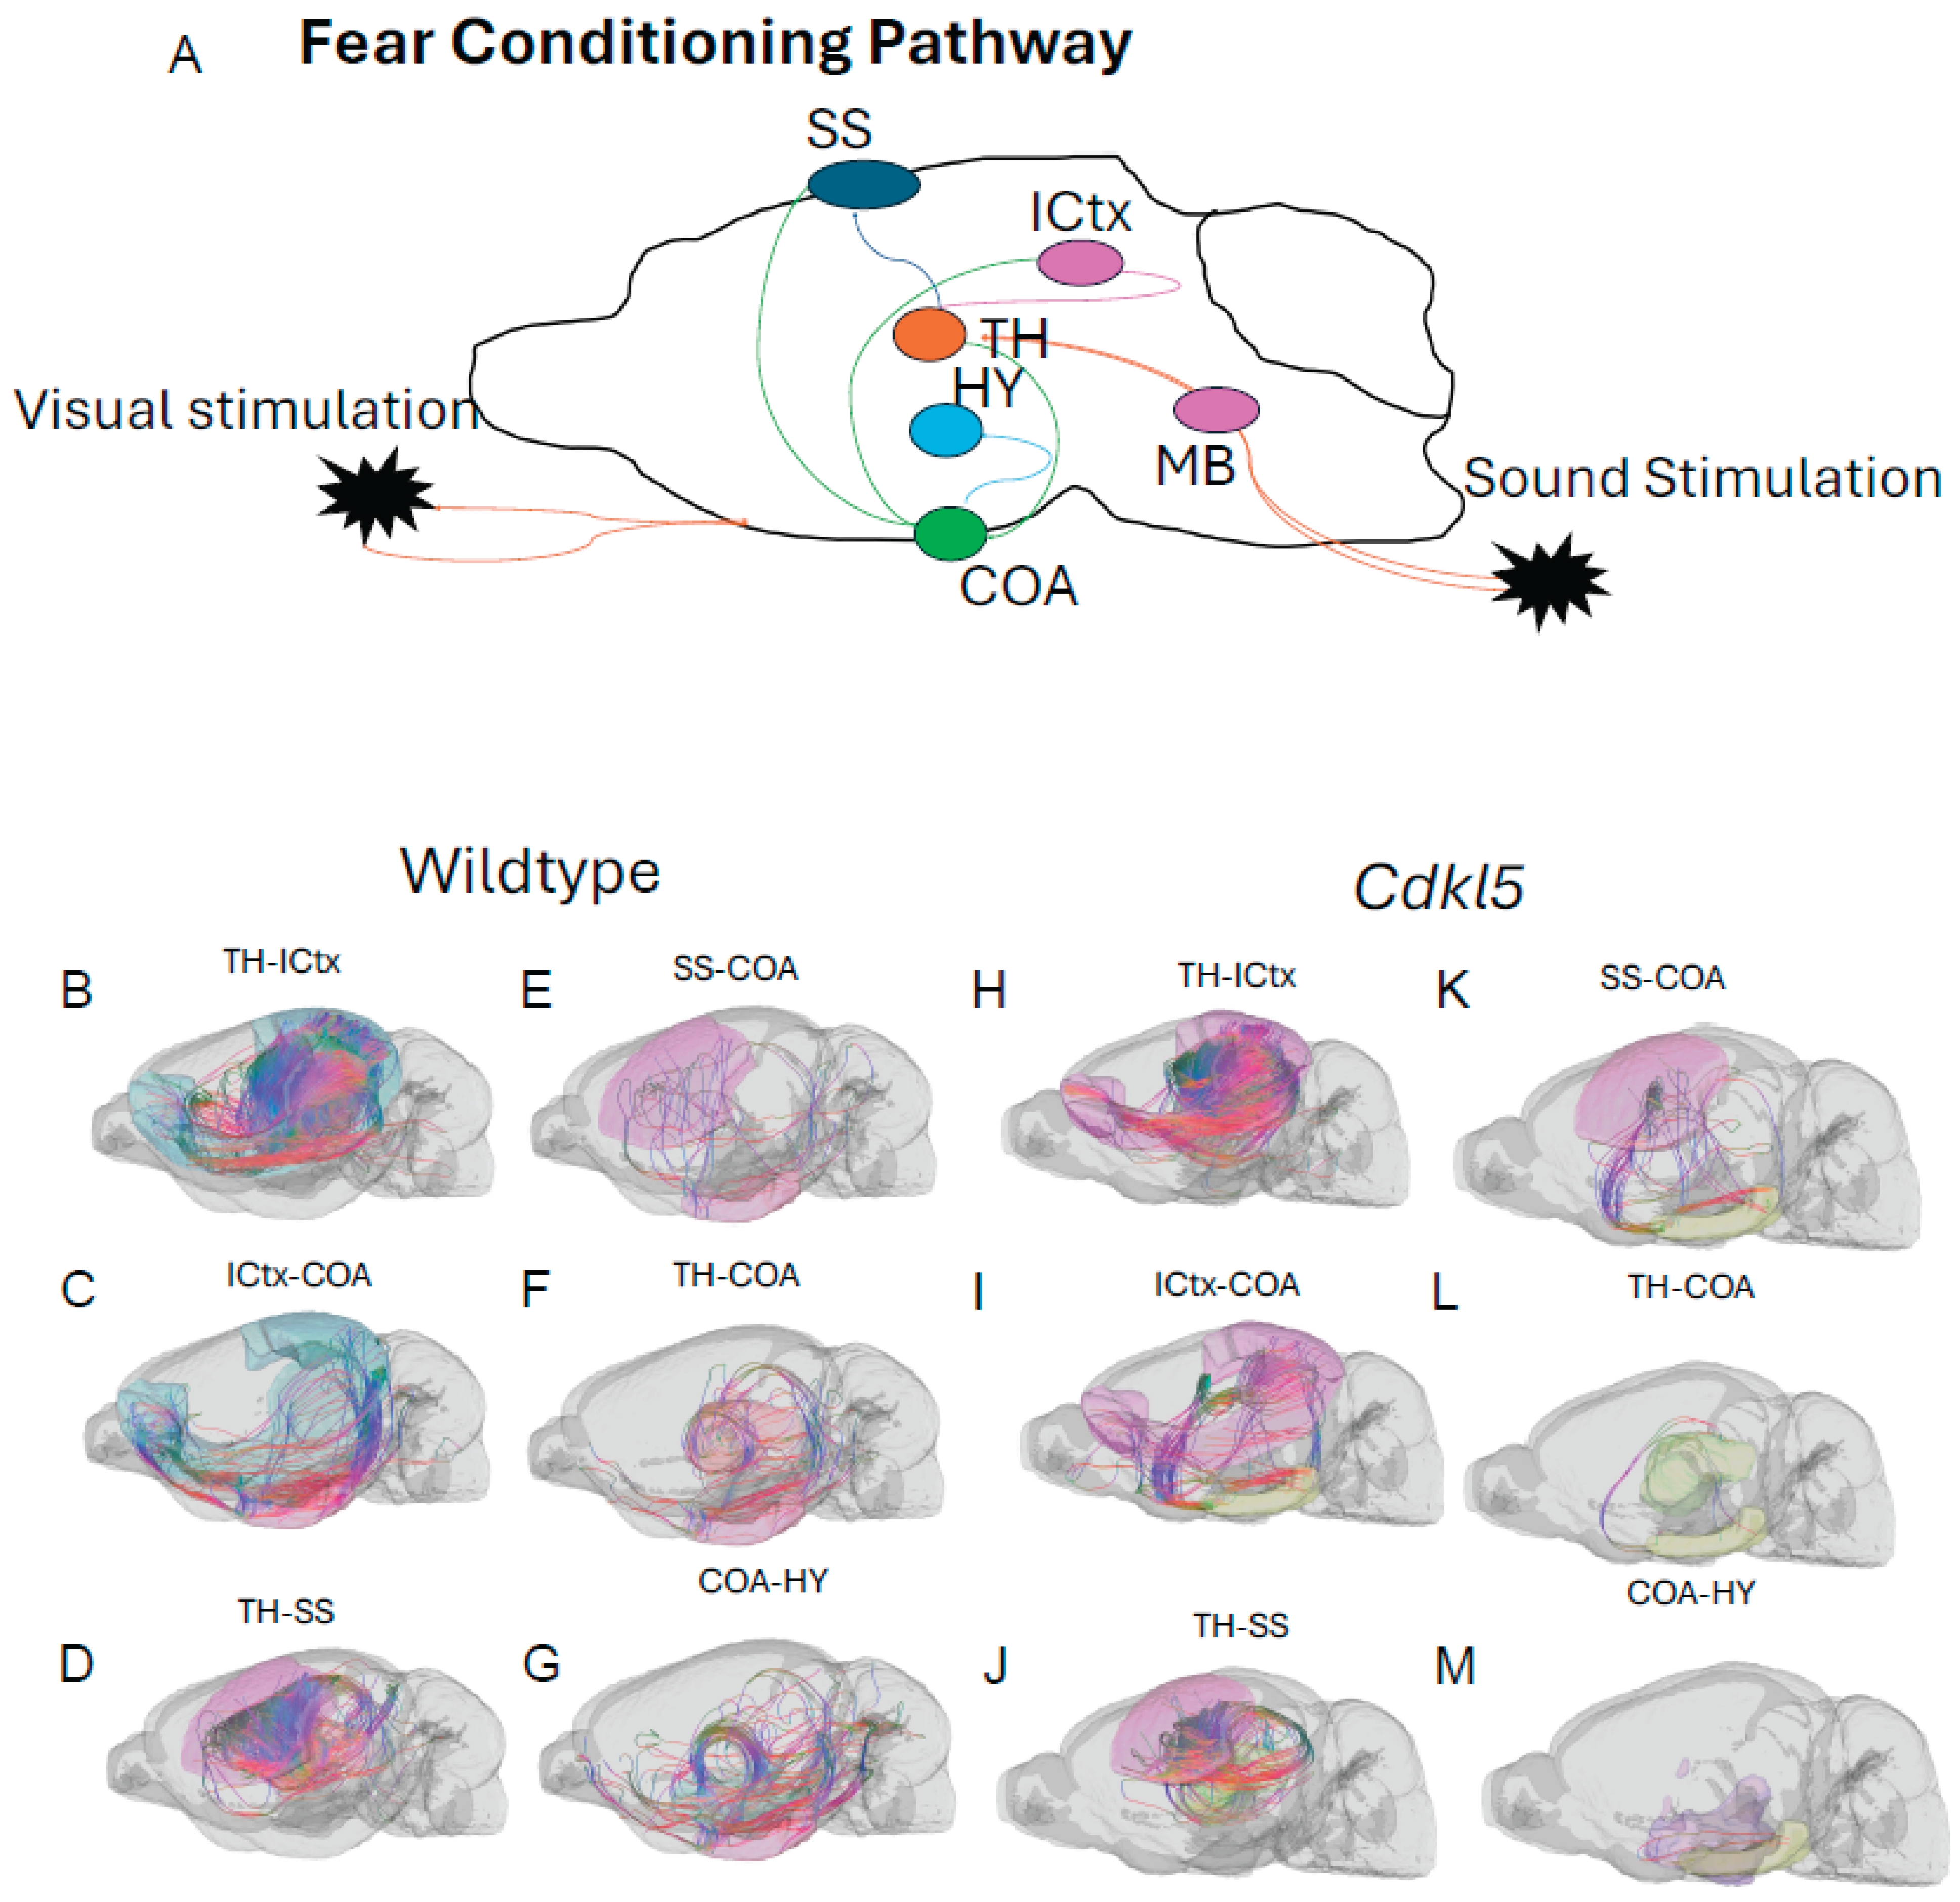
Figure 15.
Diffusion tractography and brain network analysis for the fear conditioning. (A-F) Group averaged connections in Ipsilateral connections (G-L) or the Contralateral connections(S-X) for ICtx-TH (A, G), COA-TH (B, H), SS-TH (C-I), COA-HY (D, J), COA-ICtx (E, K), SS-COA (F, L). Blue – WT, Red – Cdkl5 KO.
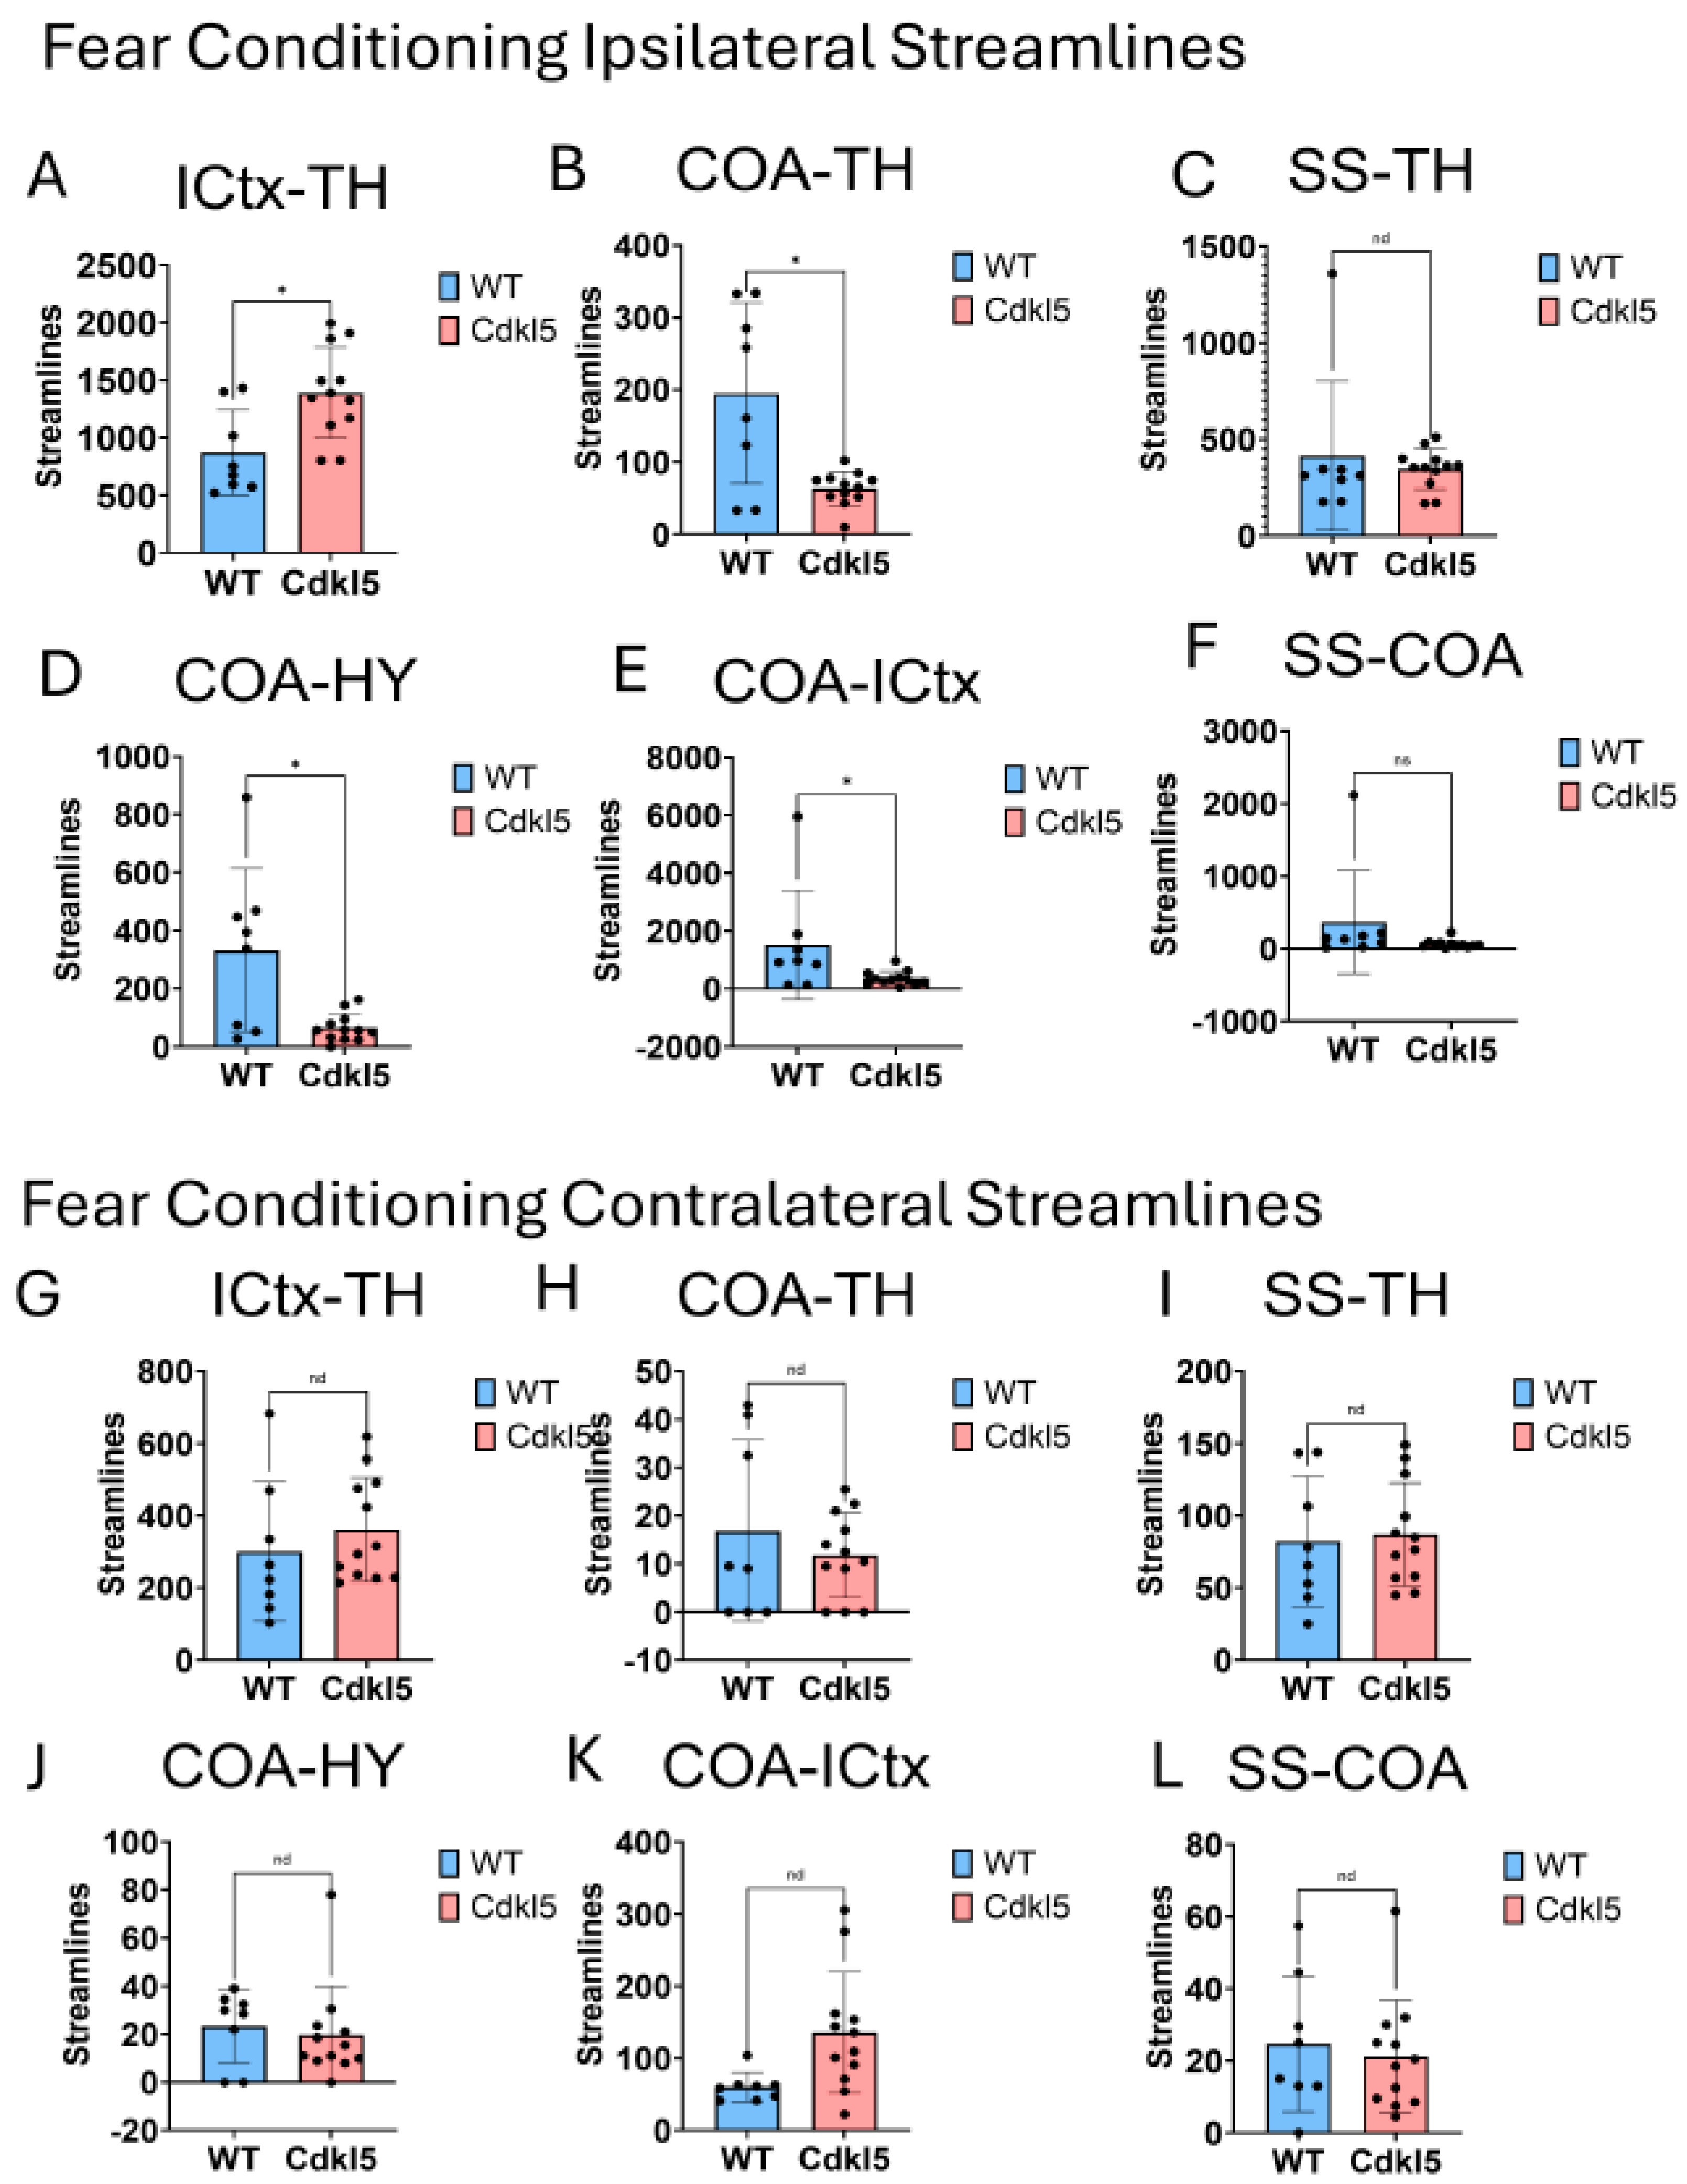
Figure 16.
Diffusion tractography and brain network analysis for temporal lobe epilepsy (TLE). (A) Diagram of temporal lobe epilepsy pathways from hippocampus (blue) to thalamus (green), isocortex (dark pink), amygdala (light pink), or entorhinal cortex (orange). (B-O) Diffusion tractography for (B-H) WT and (I-O) Cdkl5, for connections between thalamus and-hippocampus(B,I), entorhinal cortex-hippocampus (C, J), isocortex-hippocampus (D, K), amygdala-hippocampus (E, L), entorhinal cortex - amygdala (F, M), entorhinal cortex - isocortex(G, N) and isocortex – amygdala (H, O).
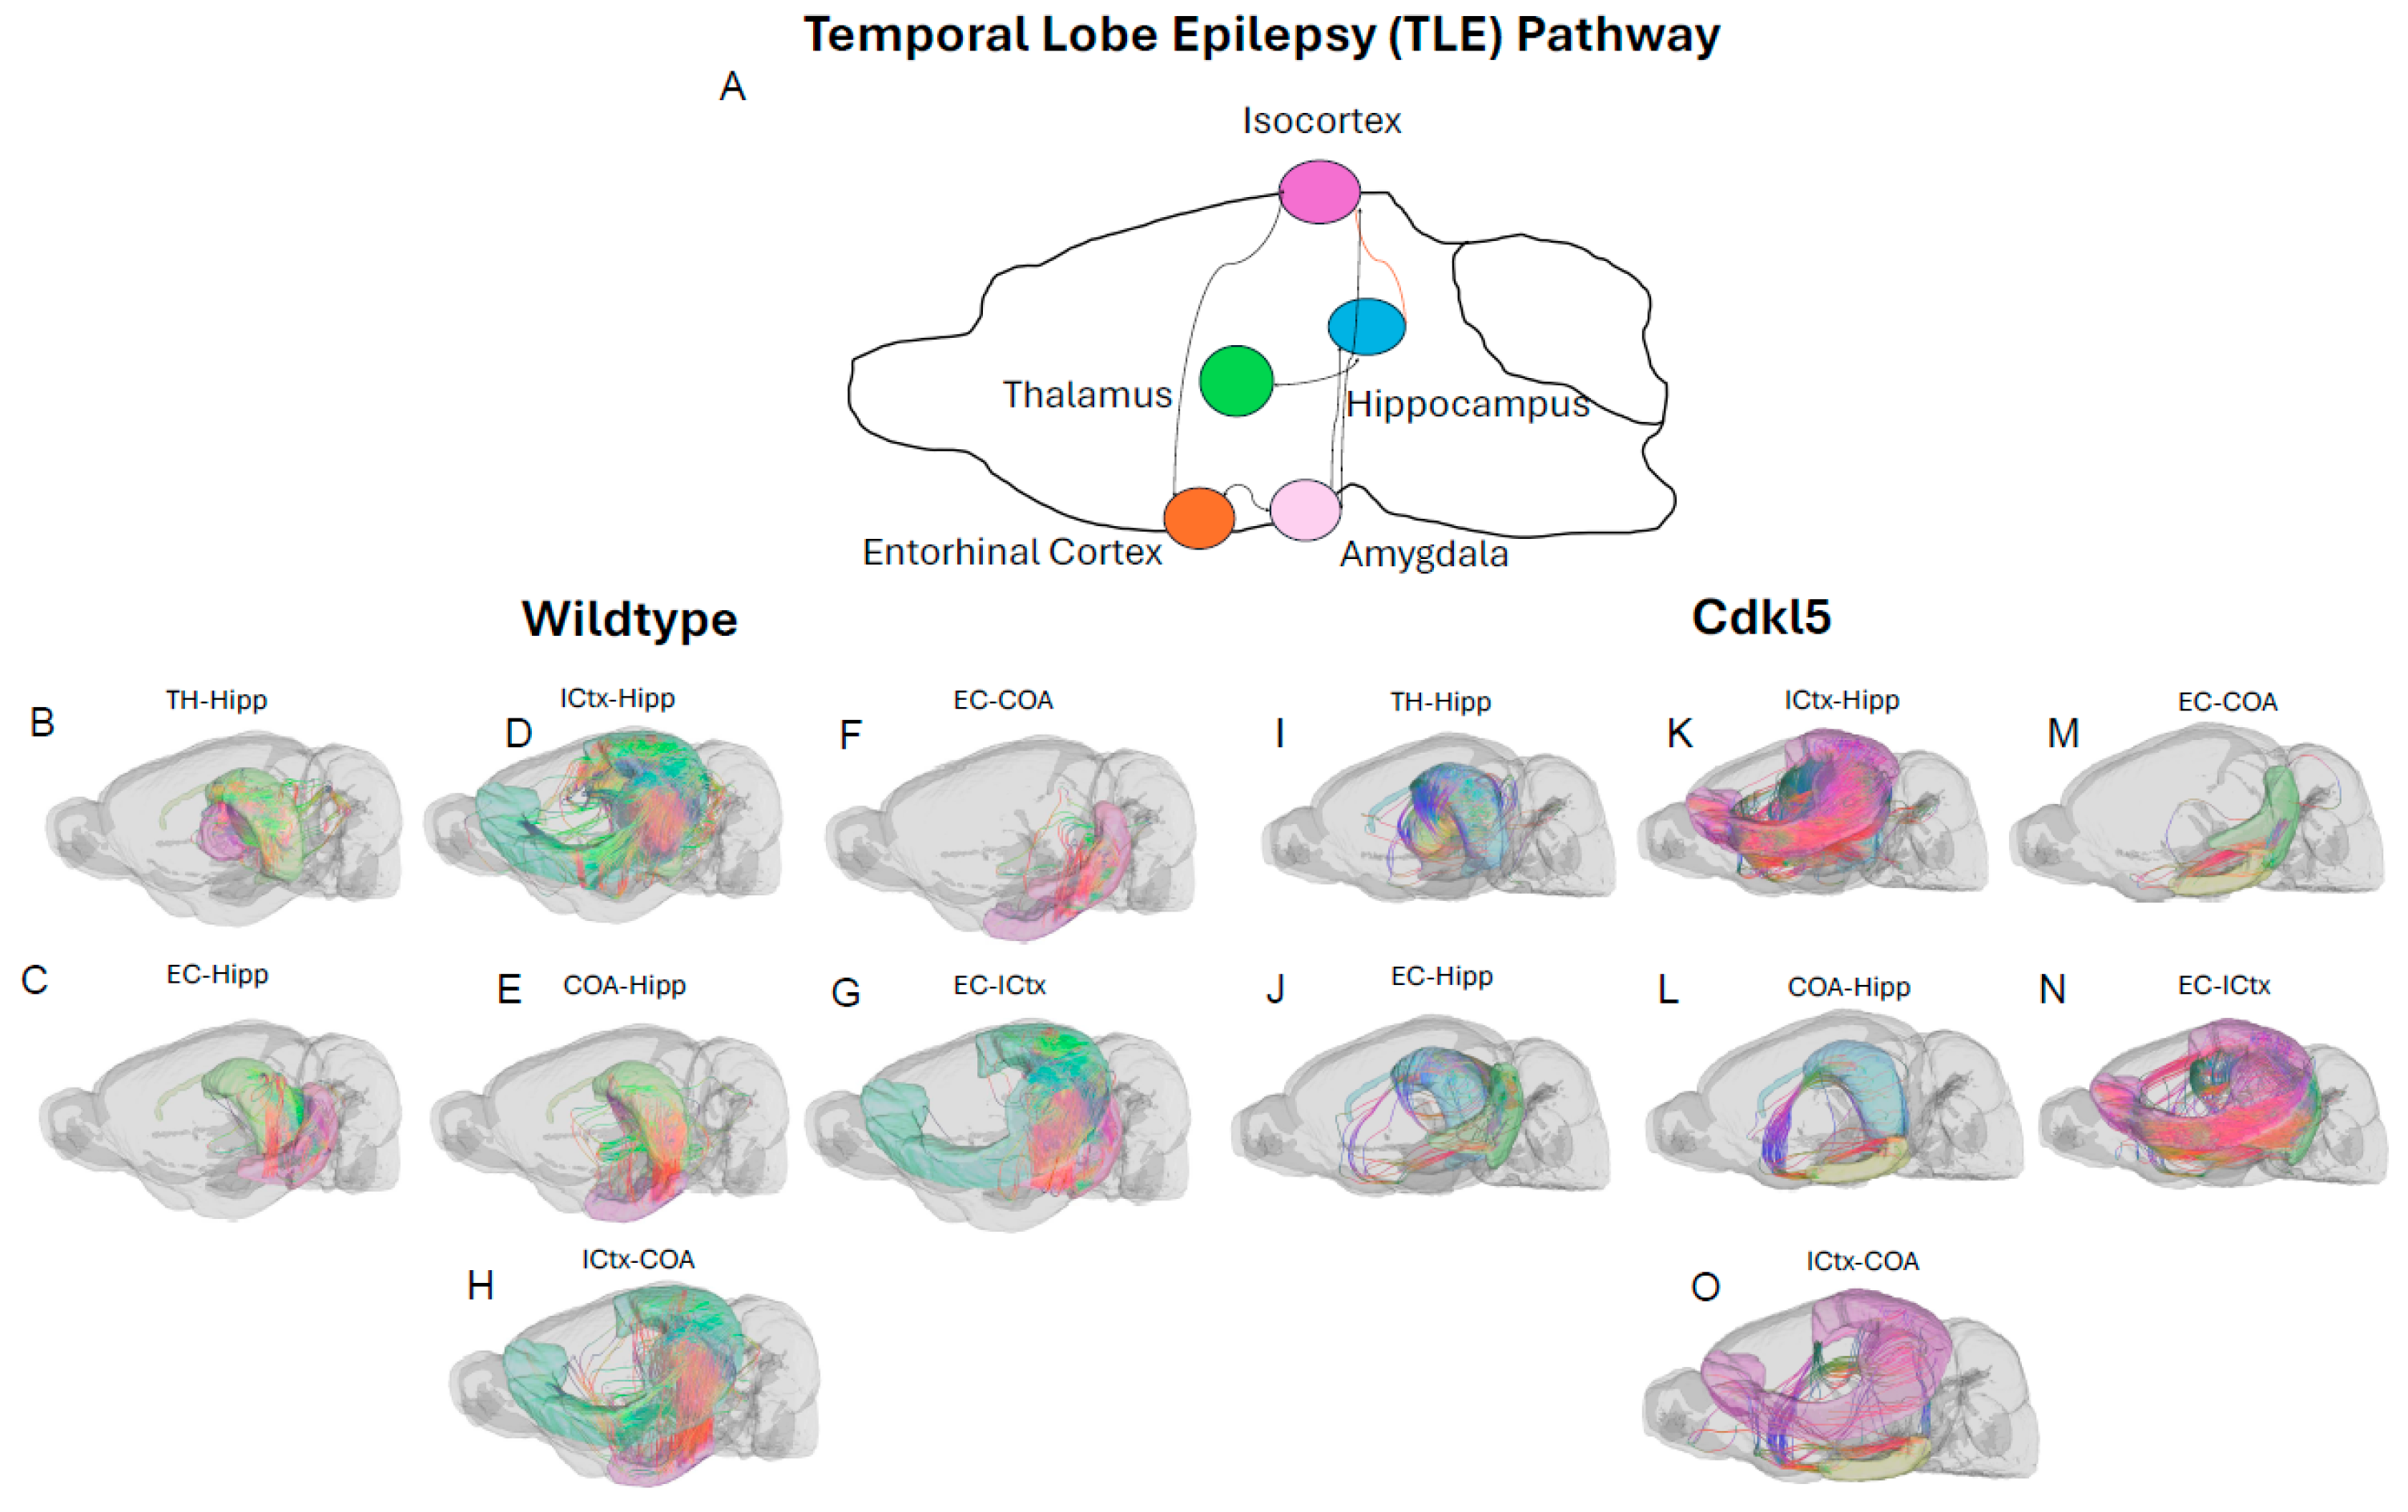
Figure 17.
Diffusion tractography and brain network analysis for temporal lobe epilepsy.(M-X) Group averaged TLE connections in left hemisphere (M-R) or right hemisphere (S-X) for hippocampus-somatomotor cortex (M, S), hippocampus-somatorsenory cortex (N,T), hippocampus-thalamus (O, U), somatomotor cortex -thalamus (P, V), somatosensory cortex-thalamus (Q, W), somatosensory-somatomotor cortex (R, X). Blue – WT, Red – Cdkl5 KO.
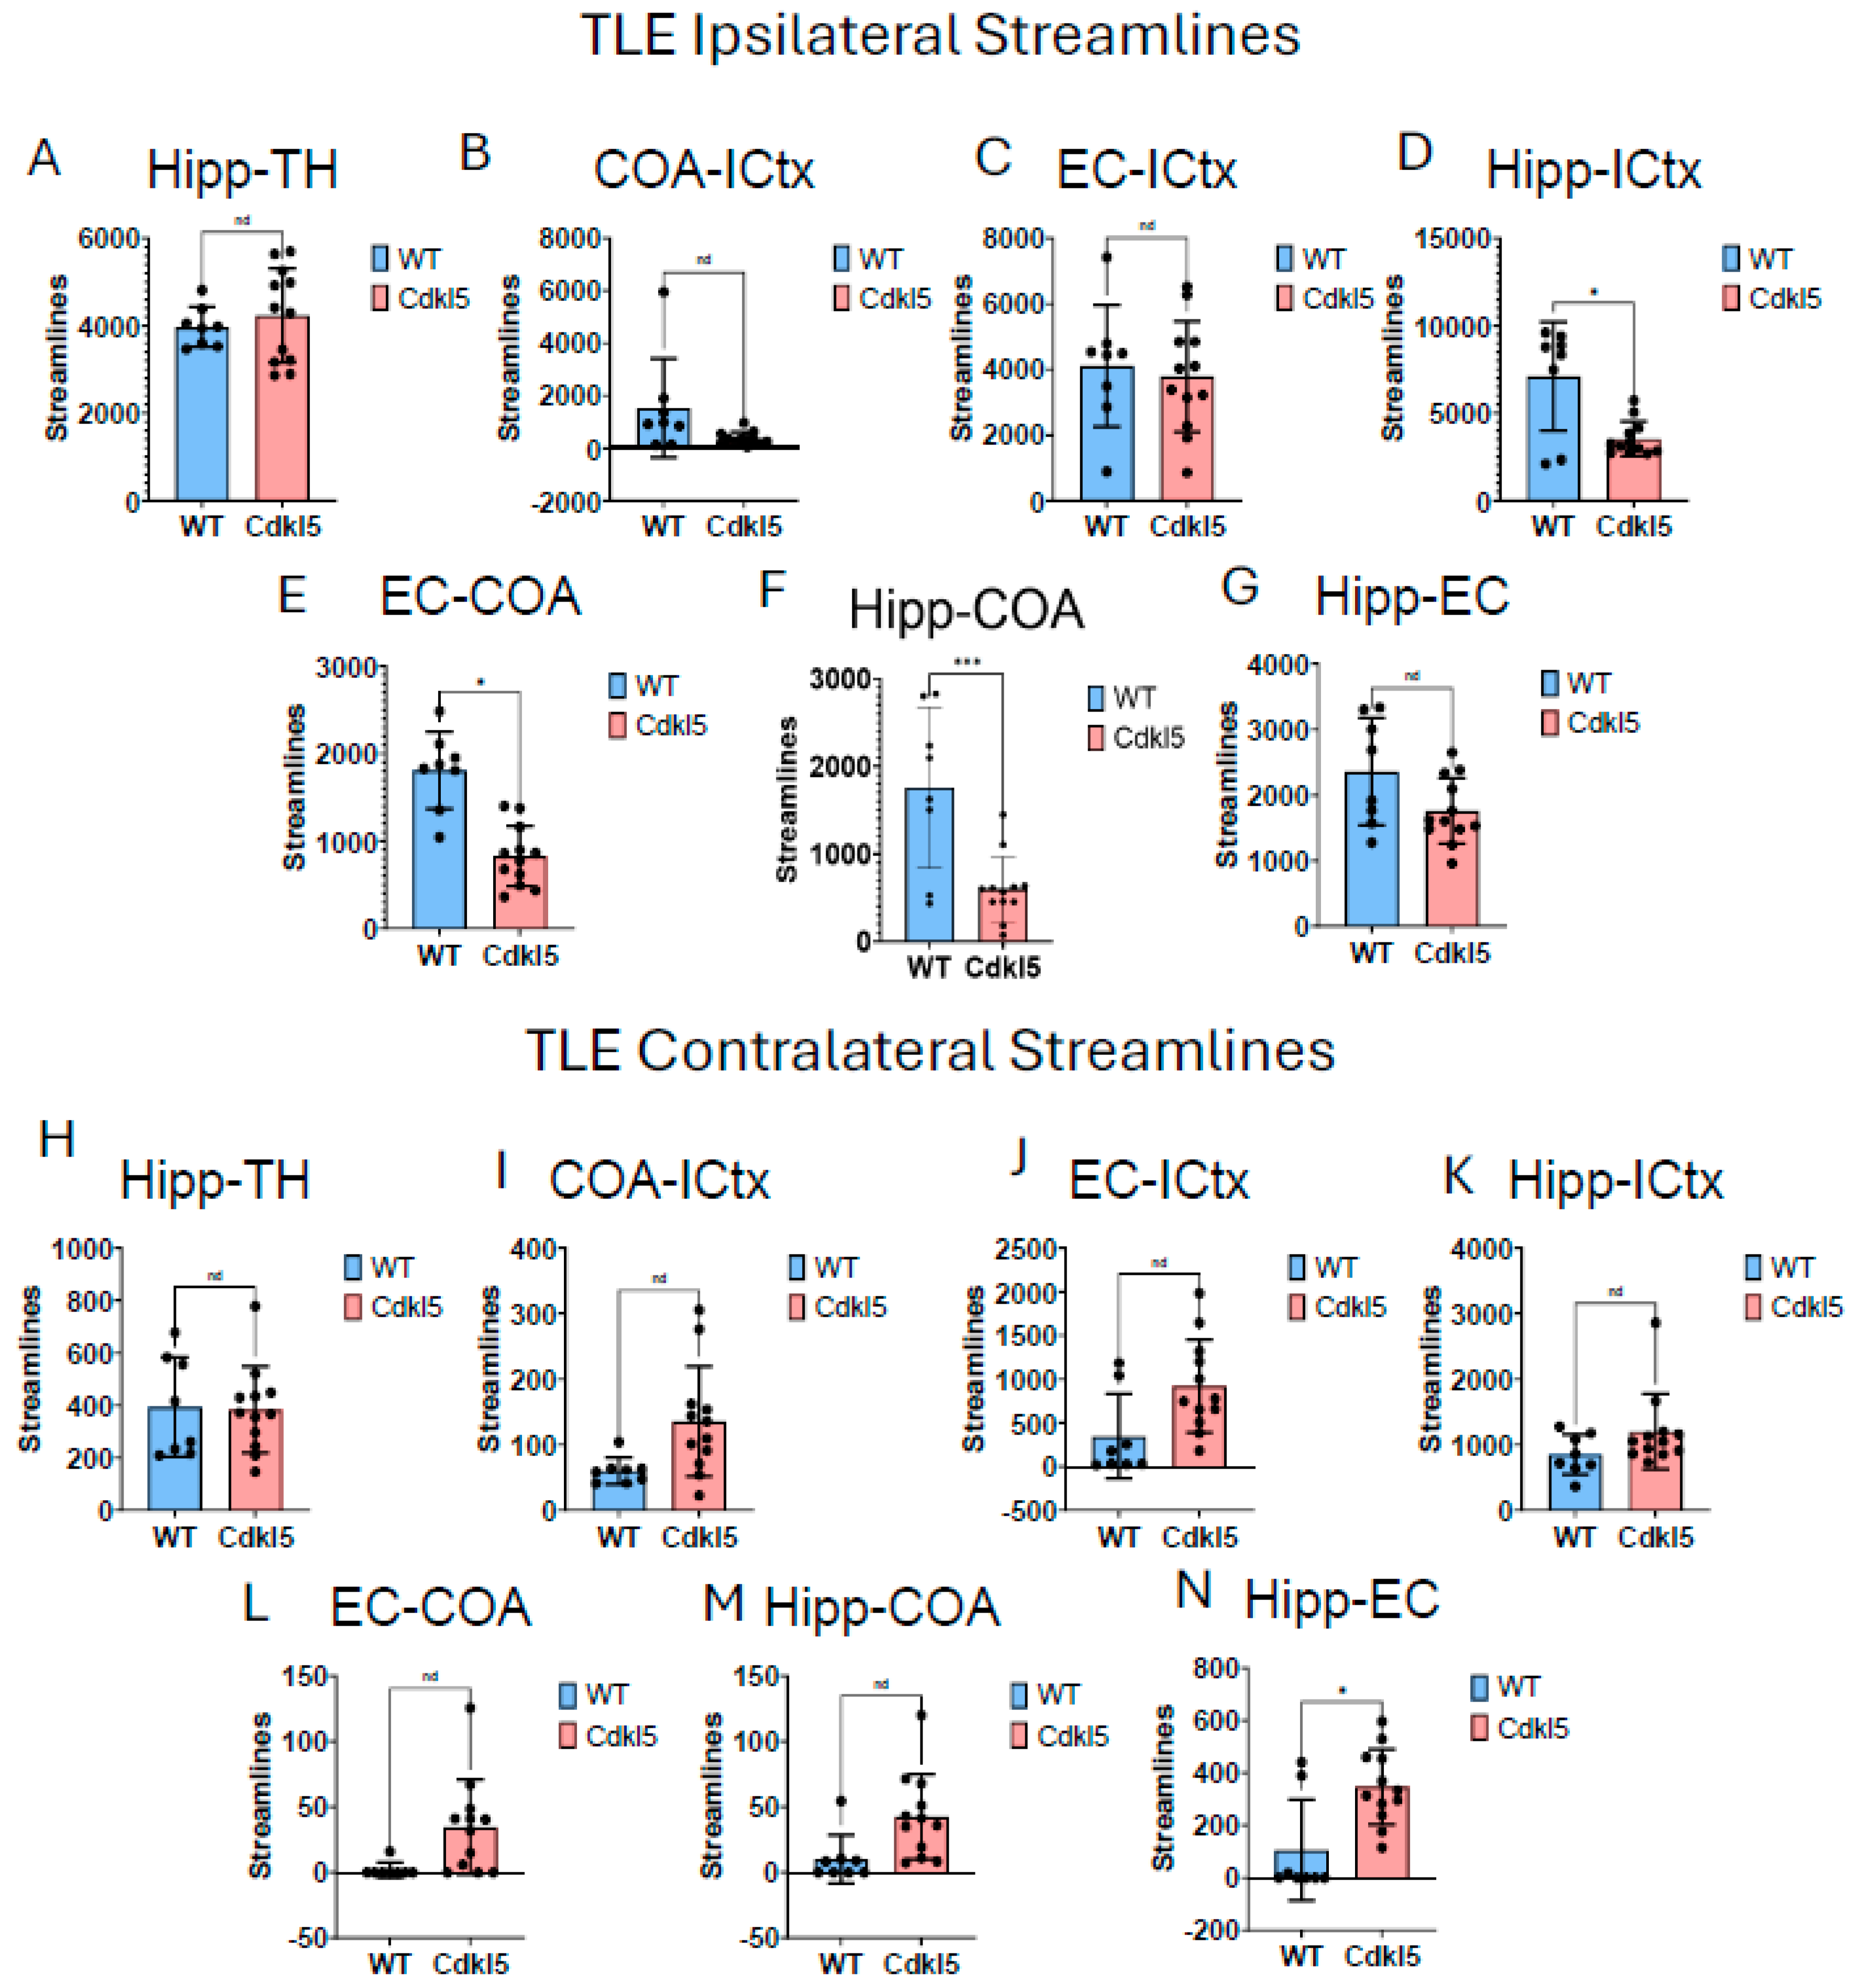
Disclaimer/Publisher’s Note: The statements, opinions and data contained in all publications are solely those of the individual author(s) and contributor(s) and not of MDPI and/or the editor(s). MDPI and/or the editor(s) disclaim responsibility for any injury to people or property resulting from any ideas, methods, instructions or products referred to in the content. |
© 2026 by the authors. Licensee MDPI, Basel, Switzerland. This article is an open access article distributed under the terms and conditions of the Creative Commons Attribution (CC BY) license (http://creativecommons.org/licenses/by/4.0/).
Copyright: This open access article is published under a Creative Commons CC BY 4.0 license, which permit the free download, distribution, and reuse, provided that the author and preprint are cited in any reuse.


