
Submitted:
05 February 2026
Posted:
06 February 2026
You are already at the latest version
Abstract
Background: Polypharmacy is increasingly prevalent worldwide and is strongly associated with adverse drug reactions (ADRs) and drug–drug interactions (DDIs). Traditional pharmacovigilance (PV) systems rely heavily on spontaneous reporting and manual signal detection, which suffer from substantial underreporting, delayed signal identification, and limited capacity to manage complex multidrug interactions. Artificial intelligence (AI) and machine learning (ML) offer scalable, data-driven approaches that may enhance the detection, assessment, and prevention of medication-related harms in polypharmacy populations. This systematic review evaluates current AI/ML models in PV for polypharmacy, compares their predictive performance, and identifies key methodological facilitators and challenges. Methods: A systematic review was conducted in accordance with PRISMA 2020 guidelines and a pre-registered PROSPERO protocol (CRD420251134685). Seven electronic databases, including grey literature sources, were searched from inception to 2025. Eligible studies were primary computational modeling investigations that developed AI/ML models using polypharmacy-focused datasets and reported performance using the area under the receiver operating characteristic curve (AUROC) and the area under the precision–recall curve (AUPRC). Study quality was appraised using the Mixed Methods Appraisal Tool (MMAT). Results: Of 7,513 records identified, 23 studies met the inclusion criteria. All studies employed computational modeling designs using large pharmacovigilance and biomedical datasets such as TWOSIDES, Decagon, STITCH, SIDER, and DrugBank. Reported AUROC values ranged from 0.553 to 0.9993, while AUPRC values ranged from 0.112 to 0.999. High-performing models included PU-MLP, DPSP, SimVec, TriVec, and SimplE, many of which achieved AUROC and AUPRC values exceeding 0.95. Key strengths of AI/ML approaches included high predictive accuracy, effective handling of class imbalance, and integration of heterogeneous data sources. Major challenges included data sparsity, limited interpretability, cold-start prediction problems, and a lack of external or clinical validation. Conclusion: AI and ML models demonstrate strong potential to enhance pharmacovigilance in polypharmacy settings by improving the detection of ADRs and DDIs. Future research should prioritize standardized benchmarking, model interpretability, and real-world clinical validation to support safe and effective regulatory and clinical implementation.
Keywords:
machine learning
; knowledge extraction
; pharmacovigilance
; polypharmacy
; drug–drug interaction prediction
; drug safety
1. Introduction
The World Health Organization defines Pharmacovigilance (PV) as the science and activities related to the detection, assessment, understanding, and prevention of adverse effects and other drug-related problems [1]. Despite advances in medication safety, adverse drug reactions (ADRs) and medication-related harms remain a major global public health concern [2]. A critical limitation of current PV systems is the substantial underreporting of ADRs, with a median global underreporting rate estimated at approximately 94%, which delays signal detection and exposes patients to preventable harm [3].
Polypharmacy, commonly defined as the concurrent use of five or more medications, is a major contributor to medication-related risk, particularly among older adults and patients with multiple chronic conditions [4]. Evidence suggests that up to 70% of geriatric patients experience polypharmacy and that these patients have nearly twice the risk of ADRs compared with non-polypharmacy populations, with a substantial proportion of ADRs considered preventable [5,6]. The complexity of multiple drug combinations, comorbidities, and physiological changes makes the detection of ADRs and DDIs in polypharmacy especially challenging for traditional PV approaches.
Conventional PV systems rely largely on spontaneous reporting, manual review, and rule-based signal detection. While these approaches have contributed to drug safety monitoring, they are reactive, resource-intensive, and poorly suited to the analysis of large, heterogeneous datasets such as electronic health records, molecular interaction networks, and post-marketing safety databases [7,8]. As medication use continues to expand in scale and complexity, these limitations have become increasingly apparent.
Artificial intelligence (AI) and machine learning (ML) have emerged as promising tools to address these challenges. AI refers to computational systems capable of performing tasks that typically require human intelligence, while ML enables algorithms to learn patterns from data and improve performance over time [9]. In pharmacovigilance, AI/ML models can analyze structured and unstructured data, identify complex non-linear relationships, and detect rare or multifactorial adverse events that may be missed by traditional methods [10,11]. Recent studies have demonstrated that advanced ML models, including graph-based neural networks, tensor factorization methods, transformer architectures, and positive–unlabeled learning approaches, can achieve high predictive performance in detecting ADRs and DDIs, particularly in polypharmacy contexts [12,13,14,15].
Despite growing interest and promising results, important methodological and implementation challenges remain. These include limited external validation, poor interpretability of complex models, concerns about data quality and representativeness, and uncertainty regarding integration into clinical and regulatory workflows [16,17,18]. To date, there is no consensus on the most effective AI/ML approaches for pharmacovigilance in polypharmacy populations.
The objective of this systematic review is to comprehensively evaluate existing AI and ML applications in pharmacovigilance with a specific focus on polypharmacy. The review aims to (1) identify and classify AI/ML models used in polypharmacy-focused PV, (2) assess their effectiveness using standardized performance metrics, and (3) synthesize reported advantages, challenges, and future directions for research and practice.
2. Materials and Methods
Study Design
This study employed a mixed-methods systematic review design, integrating quantitative performance outcomes with a qualitative synthesis of reported advantages and challenges. The review followed the PRISMA 2020 reporting guidelines [19].
Research Questions
- What AI and ML models are currently used in pharmacovigilance to detect and prevent ADRs and DDIs in polypharmacy settings?
- How effective are these models based on reported AUROC and AUPRC metrics?
- What are the key advantages, limitations, and implementation challenges of AI/ML-based pharmacovigilance systems?
The PICO framework is structured [20] as the following: P (Population): Polypharmacy patients; I (Intervention): Use of artificial intelligence (AI) and machine learning (ML) in pharmacovigilance; C (Comparator): Traditional pharmacovigilance methods or no AI/ML use, or other AI/ML models; and (Outcome): Improved detection, assessment, and prevention of ADRs and DDIs; implementation, advantages and challenges of AI/ML.
Eligibility Criteria
The inclusion criteria for this review included primary computational modeling studies that used polypharmacy-related datasets and focused on developing original artificial intelligence or machine learning models. Eligible studies were required to report key performance metrics, including AUROC and AUPRC, and be published in English between 2015 and 2025. Exclusion criteria included reviews, editorials, commentaries, opinion pieces, non-computational studies, research not centered on polypharmacy, studies lacking the required performance metrics, and conference abstracts without full-text availability.
Effect Measures
The primary performance metrics assessed were the Area Under the Receiver Operating Characteristic Curve (AUROC) and the Area Under the Precision-Recall Curve (AUPRC). AUROC reflects the overall discriminative ability of a binary classification model, indicating how well it distinguishes between positive and negative cases across different thresholds [21]. Its values range from 0 to 1, where a score close to 1 denotes excellent discrimination, 0.5 suggests random guessing, and values near 0 indicate poor performance. AUPRC, on the other hand, is particularly informative for imbalanced datasets, such as those encountered in pharmacovigilance, where true ADRs and DDIs are rare. Unlike AUROC, AUPRC accounts for precision and recall, with baseline performance equal to the prevalence of the positive class (e.g., 8% positives → baseline ≈ 0.08). Higher AUPRC values indicate better model performance, with 1.0 representing perfect precision and recall. Given the challenges posed by imbalanced data in polypharmacy research, AUPRC was considered particularly relevant for evaluating AI/ML models in this context.
In addition, this study carried out a narrative synthesis of the advantages and challenges of AI and/or ML.
Information Sources and Search Strategy
Seven electronic databases (PubMed, EMBASE, CINAHL, Web of Science, Scopus, ProQuest Central, and ProQuest Dissertations and Theses Global) were searched from inception to 2025. Search strategies combined controlled vocabulary and keywords across three domains: (1) artificial intelligence and machine learning, (2) pharmacovigilance and drug safety, and (3) polypharmacy. Boolean operators were used to optimize sensitivity and specificity.
Study Selection and Data Management
All retrieved records were imported into EndNote for deduplication and then screened using Rayyan. Title and abstract screening was followed by full-text review by independent reviewers, with disagreements resolved by consensus.
Data Extraction
Data extracted included authors, year, country, datasets used, model type, performance metrics (AUROC and AUPRC), and reported advantages and challenges.
Quality Assessment
Study quality was assessed using the Mixed Methods Appraisal Tool (MMAT) 2018 (23). No study was excluded based on the quality assessment.
3. Results
Study Selection and Characteristics
The literature search identified 7,513 records. After removal of duplicates and screening, 23 studies met all inclusion criteria and were included in the final synthesis [24,25,26,27,28,29,30,31,32,33,34,35,36,37,38,39,40,41,42,43,44,45,46] (Figure 1).
All included studies employed computational modeling designs and were published between 2018 and 2025 (Table 1). Studies originated from Asia, North America, and Europe, with the highest representation from China, the United States, and Iran (Figure 2). Commonly used datasets in the studies to represent DDIs and ADRs included TWOSIDES, Decagon, STITCH, SIDER, OFFSIDES, and DrugBank. Many studies integrated additional biological data such as protein–protein interaction networks and chemical structure representations. Biological interaction databases/datasets such as STITCH, Protein–Protein Interaction (PPI) datasets, KEGG and PubChem were utilized in the studies. Furthermore, some studies used LINCS L1000, SMILES-based chemical datasets, and Inxight Drugs API to cover gene expression.
AI/ML Models and Performance
A wide range of AI/ML architectures were identified, including graph neural networks, tensor factorization models, embedding-based approaches, transformer-based models, and positive–unlabeled learning frameworks (Figure 3, Table 2). AUROC values ranged from 0.553 to 0.9993, while AUPRC values ranged from 0.112 to 0.999. The highest-performing models included PU-MLP (AUROC 0.992; AUPRC 0.999), DPSP (AUROC up to 0.999; AUPRC up to 0.977), and SimVec (AUROC 0.975; AUPRC 0.968) (Figure 4). These models demonstrated strong ability to detect ADRs and DDIs despite severe class imbalance. Lower performance was observed in cold-start scenarios involving previously unseen drug combinations.
Advantages and Challenges
The advantages and challenges associated with applying AI and ML in polypharmacy-focused pharmacovigilance were systematically identified from the included studies and are summarized in Table 3. Reported advantages include high predictive accuracy and enhanced sensitivity to rare adverse events, effective handling of imbalanced datasets, and the ability to integrate heterogeneous pharmacological and biological data sources. These models also demonstrate scalability, enabling analysis of large datasets and supporting high-throughput screening. However, several challenges persist. Model performance is highly dependent on data quality and completeness, and the interpretability of complex algorithms remains limited, posing barriers to clinical adoption. Additionally, reduced effectiveness in cold-start scenarios, lack of external and clinical validation, and practical constraints related to integration into routine clinical workflows continue to hinder widespread implementation.
Quality Assessment
To assess the quality of the included studies in the systematic review, the Mixed Methods Appraisal Tool (MMAT) was used because it enables standardized, consistent quality appraisal across studies with heterogeneous methodologies. Table 4 in the appendix shows full details of the assessment. 22 of 23 studies met all criteria and received a full score. This indicates strong methodological quality with fulfillment of all appraisal criteria. However, only one study received a score of 4 out of 5 because it did not meet one of the criteria. No study was excluded due to methodological weakness.
4. Discussion
This systematic review evaluated the current applications of artificial intelligence and machine learning in pharmacovigilance, focusing on their capacity to detect, assess, and predict adverse drug reactions and drug-drug interactions in polypharmacy contexts. Among the 23 studies reviewed, AI/ML models consistently exhibited strong predictive performance in identifying and preventing ADRs, DDIs and other medication-related issues in data from polypharmacy patients, with most reporting AUROC and AUPRC values exceeding 0.90. These results support the expanding literature that identifies AI as a valuable computational complement to traditional pharmacovigilance systems, providing increased sensitivity, earlier detection of safety signals, and improved management of complex polypharmacy data [47,48]. This advancement is especially significant given the persistent limitations of spontaneous reporting systems, which are affected by substantial underreporting estimated at nearly 94% globally and consequent delays in recognizing clinically significant ADRs [3].
Beyond demonstrating high predictive performance across studies, this review identified that AI and machine learning systems were developed using a range of computational tools and programming environments. The majority of models utilized Python, with additional reliance on frameworks such as TensorFlow and the Adam optimizer. These platforms enabled the creation of diverse architectures capable of distinguishing complex risk signals within high-dimensional polypharmacy datasets. Furthermore, the findings support the increasing consensus that traditional pharmacovigilance approaches, which rely primarily on spontaneous reporting, are insufficient for the timely detection of medication-related harms, especially among populations exposed to multiple drugs simultaneously.
The performance of these models underscores the significant analytical advances enabled by contemporary AI architectures. Notably, models such as TriVec, SimplE, SimVec, and PU-MLP achieved high effectiveness by integrating multiple sources of biomedical data, including chemical fingerprints, drug-target interactions, phenotype-based side effects, and molecular similarity embeddings. This multidimensional approach enabled the identification of interaction patterns that are often undetectable through human evaluation or conventional statistical methods. These results are consistent with broader AI-in-healthcare research demonstrating that combining diverse data streams enhances predictive accuracy, and they illustrate the ongoing shift toward precision-focused, data-intensive pharmacovigilance frameworks [49].
Both AUROC and AUPRC were consistently reported as primary evaluation metrics across all included studies. AUPRC was identified as more clinically meaningful for polypharmacy risk prediction, as adverse drug reactions and harmful interactions are rare but critical outcomes in highly imbalanced datasets. AUROC may be artificially inflated due to the prevalence of true negatives, whereas AUPRC, which emphasizes precision and recall in the positive class, provides a more reliable measure of a model’s ability to detect clinically relevant risks while minimizing false positives [50,51]. Among the evaluated models, PU-MLP demonstrated the highest overall performance, followed by DPSP, SimVec, and TriVec. PU-MLP combines Random Forest, clustering techniques, Graph Neural Networks, and Positive Unlabeled learning to address data sparsity and uncertainty inherent in pharmacovigilance datasets, achieving strong predictive capability when assessed using benchmark datasets such as TWOSIDES and OFFSIDES.
Despite general alignment with external literature, several notable challenges and divergences persist. The cold-start problem, characterized by poor model performance when predicting interactions involving novel or underrepresented drugs, remains a significant limitation and reflects issues commonly reported in computational pharmacology. Additionally, none of the reviewed models underwent prospective or external clinical validation, resulting in a substantial gap between high in-silico accuracy and practical, real-world application. The absence of standardized datasets, inconsistent preprocessing methods, and variability in performance metrics further contributed to heterogeneity across studies and hindered precise model comparisons. These observations are consistent with previous systematic reviews that highlight the necessity for harmonized reporting standards and improved benchmarking in AI-driven pharmacovigilance.
Methodologically, the included studies demonstrated several strengths that enhance the internal validity of the evidence base. Most employed clear analytical workflows, reproducible code, publicly available datasets, and robust validation techniques. The high MMAT scores (22 of 23 studies achieving 5/5) reflect strong adherence to computational research standards. Despite this, important methodological limitations persist. Heavy reliance on secondary datasets introduces uncertainties arising from labeling errors, reporting bias, noise, incompleteness, and imbalanced class distributions, all of which significantly affect the reliability of predictions. High-performing deep neural networks and transformer-based models also suffer from limited interpretability, raising ethical concerns regarding transparency and accountability. These challenges underscore the need for explainable AI frameworks that allow clinicians and regulators to understand how predictions are generated.
The analysis identified several advantages of artificial intelligence and machine learning models in improving pharmacovigilance, particularly in detecting complex, rare, or multi-drug interactions that traditional systems frequently overlook. The integration of diverse data sources, including drug-protein interaction networks and chemical structural information, enabled more comprehensive modeling of polypharmacy-related risks. However, numerous studies have indicated that data sparsity, class imbalance, and reliance on incomplete or noisy public datasets adversely affect predictive performance, particularly for rare interactions. These results help clarify the variability observed across models, even when similar datasets and evaluation metrics are employed.
Ethical considerations are also critical for interpreting these findings. In the absence of clinical validation, the premature deployment of AI models may lead to misclassification of ADRs, the overlooking of safety signals, or the perpetuation of biases present in training datasets. Models predominantly trained on data from the United States, Europe, or East Asia may not generalize effectively to underrepresented populations, raising concerns about fairness. Moreover, the lack of standardized performance reporting undermines reproducibility and may hinder regulatory assessment. Addressing these ethical and methodological challenges is essential to ensure the safe and equitable integration of AI tools into clinical and regulatory settings.
Strengths and limitations
This review demonstrates several strengths that enhance the reliability and relevance of its findings. The search strategy was comprehensive and systematically implemented across multiple major scientific databases, ensuring extensive coverage of literature concerning AI and ML applications in pharmacovigilance. Rigorous screening and data extraction procedures were conducted in accordance with PRISMA guidelines, which supports methodological consistency and transparency. Quality appraisal using the MMAT indicated that nearly all included studies achieved the highest possible score, reflecting strong methodological rigor within the primary evidence base. The review synthesizes findings across a range of AI models, datasets, and analytical approaches, providing a detailed overview of the current technological landscape in adverse drug reaction and drug-drug interaction prediction. By integrating results from multiple high-performing architectures and emphasizing both their strengths and limitations, this review offers a balanced, evidence-based assessment of AI's role in contemporary pharmacovigilance.
However, several limitations of this review should be acknowledged. The search was limited to English-language publications, potentially excluding relevant studies in other languages and introducing selection bias. Considerable heterogeneity was present among the included studies regarding model architectures, data sources, data preprocessing pipelines, and performance metrics. This variability restricted the ability to conduct direct comparisons or quantitative synthesis and may have contributed to inconsistencies in reported performance outcomes. The lack of standardized reporting frameworks across AI and ML pharmacovigilance studies further exacerbated this challenge. Furthermore, as all included studies relied on secondary in-silico datasets rather than real-world clinical data, external validity is limited, and findings cannot be readily generalized to patient populations or real-time pharmacovigilance systems. These limitations underscore the need for harmonized methodologies, multilingual search strategies, and rigorous prospective validation in future research.
Recommendations
Based on the challenges and insights identified in this review, several targeted recommendations are proposed to advance AI-enabled pharmacovigilance. Given the strong performance of leading models such as PU-MLP, DPSP, and SimVec, it is essential to evaluate them in real-world clinical settings to determine whether their high AUROC and AUPRC values are reproducible outside controlled research environments. This recommendation aligns with the first research question outlined in the Discussion, underscoring the importance of assessing the effectiveness of these systems in identifying adverse drug reactions and drug-drug interactions within actual patient populations.
Future research should investigate how AI and machine learning models can adapt to evolving medication patterns and the ongoing introduction of new drugs, as highlighted in the second research question. Maintaining model responsiveness to changes in prescribing trends is critical for ensuring long-term accuracy and clinical relevance.
First, prospective clinical validation should be conducted by evaluating AI and machine learning models with real-world data from electronic health records, hospital medication systems, and active surveillance networks to establish external validity. Second, harmonization of datasets, performance metrics, and reporting guidelines is necessary to reduce methodological variability and facilitate accurate cross-study comparisons. Third, explainable AI approaches should be prioritized to improve transparency and clinician trust, especially for high-performing models with opaque internal reasoning. Policymakers and regulators should also establish robust frameworks for the evaluation, approval, and monitoring of AI tools in medication safety to ensure fairness, accountability, and patient protection. Finally, training and capacity-building initiatives for pharmacists, clinicians, and healthcare regulators should be expanded to support the safe and informed integration of AI systems into pharmacovigilance workflows. Simultaneously, improvements in data quality, model interpretability, and clinical usability are essential. The development of AI and machine learning tools that can be seamlessly integrated into routine clinical workflows will help ensure that these technologies effectively support medication safety in polypharmacy. Collectively, these actions will enable AI-enabled pharmacovigilance to transition from theoretical potential to practical, safe, and equitable implementation in real-world healthcare settings.
In response to the challenges identified in this review, two primary research questions are proposed for future investigation:
- How does the performance of advanced AI and machine learning models, such as PU-MLP, differ when evaluated on real-world clinical data that are noisy, incomplete, and heterogeneous, as opposed to curated benchmark datasets?
- Does incorporating additional real-world information, such as patient history or prescribing context, enhance the predictive accuracy of AI and machine learning models for rare adverse drug reactions and drug-drug interactions in patients receiving polypharmacy?
5. Conclusions
This review shows that AI and ML models have strong potential to improve pharmacovigilance, particularly in polypharmacy, where the risk of adverse drug reactions and drug–drug interactions is high. Across 23 studies, model performance was consistently strong, indicating reliable prediction of harmful medication combinations. The best-performing models—PU-MLP, DPSP, and SimVec—achieved near-perfect scores, highlighting the ability of advanced algorithms to capture complex drug relationships and predict adverse outcomes with high precision. Common advantages included strong predictive capability, integration of diverse data sources, and scalability for large-scale screening. However, challenges remain, such as dependence on data quality, limited interpretability, lack of external validation, and practical barriers to clinical integration. Overall, AI and ML offer promising tools to enhance medication safety in polypharmacy. Future efforts should focus on improving data quality, model transparency, and real-world validation to enable successful clinical adoption.
Author Contributions
Conceptualization, Visualization, Writing (Original Draft)— KT, MG, RT, MIMI; Writing (Reviewing and Editing)— RA, MIMI; Project Administration— all authors. All authors have read and agreed to the published version of the manuscript.
Funding
This research received no external funding.
Institutional Review Board Statement
Not applicable.
Informed Consent Statement
Not applicable.
Data Availability Statement
No new data were created or analyzed in this study. Data sharing is not applicable to this article.
Acknowledgments
The APC support is provided by Qatar University.
Conflicts of Interest
The authors declare no conflicts of interest.
Abbreviations
The following abbreviations are used in this manuscript:
| ADR | Adverse drug reactions |
| DDIs | Drug–drug interactions |
| AI | Artificial intelligence |
| ML | Machine learning |
| PV | Pharmacovigilance |
| AUROC | Area under the receiver operating characteristic curve |
| AUPRC | Area under the precision–recall curve |
References
- World Health Organization. The importance of pharmacovigilance: safety monitoring of medicinal products; WHO: Geneva, 2002. [Google Scholar]
- Edwards, IR; Aronson, JK. Adverse drug reactions: definitions, diagnosis, and management. Lancet 2000, 356(9237), 1255–1259. [Google Scholar] [CrossRef]
- Hazell, L; Shakir, SAW. Under-reporting of adverse drug reactions: a systematic review. Drug Saf. 2006, 29(5), 385–396. [Google Scholar]
- Maher, RL; Hanlon, J; Hajjar, ER. Clinical consequences of polypharmacy in elderly. Expert Opin Drug Saf. 2014, 13(1), 57–65. [Google Scholar] [CrossRef] [PubMed]
- Alhawassi, TM; Krass, I; Bajorek, BV; Pont, LG. A systematic review of the prevalence and risk factors for adverse drug reactions in the elderly in the acute care setting. Clin Interv Aging 2014, 9, 2079–2086. [Google Scholar]
- Beijer, HJ; de Blaey, CJ. Hospitalisations caused by adverse drug reactions (ADR): a meta-analysis of observational studies. Pharm World Sci. 2002, 24(2), 46–54. [Google Scholar] [CrossRef] [PubMed]
- Waller, P; Evans, SJW. A model for the future conduct of pharmacovigilance. Pharmacoepidemiol Drug Saf. 2003, 12(1), 17–29. [Google Scholar]
- Bate, A; Evans, SJW. Quantitative signal detection using spontaneous ADR reporting. Pharmacoepidemiol Drug Saf. 2009, 18(6), 427–436. [Google Scholar] [CrossRef]
- Russell, S; Norvig, P. Artificial Intelligence: A Modern Approach, 3rd ed.; Pearson, 2010. [Google Scholar]
- Harpaz, R; DuMouchel, W; LePendu, P; Bauer-Mehren, A; Ryan, P; Shah, NH. Performance of pharmacovigilance signal-detection algorithms for the FDA adverse event reporting system. Clin Pharmacol Ther. 2013, 93(6), 539–546. [Google Scholar] [PubMed]
- Sarker, A; Gonzalez, G. Portable automatic text classification for adverse drug reaction detection via multi-corpus training. J Biomed Inform. 2015, 53, 196–207. [Google Scholar] [PubMed]
- Zitnik, M; Agrawal, M; Leskovec, J. Modeling polypharmacy side effects with graph convolutional networks. Bioinformatics 2018, 34(13), i457–i466. [Google Scholar] [CrossRef]
- Zhang, W; Chen, Y; Liu, F; Luo, F; Tian, G; Li, X. Predicting drug–drug interactions based on multi-source information fusion. J Cheminform 2017, 9, 3. [Google Scholar]
- Deng, Y; Xu, X; Qiu, Y; Xia, J; Zhang, W; Liu, S. A multimodal deep learning framework for predicting drug–drug interactions. Bioinformatics 2020, 36(15), 4316–4322. [Google Scholar] [CrossRef] [PubMed]
- Zhou, T; Wang, X; Li, J. PU-learning based framework for polypharmacy side effect prediction. Brief Bioinform. 2025, 26(1), bbad123. [Google Scholar]
- Rudin, C. Stop explaining black box machine learning models for high stakes decisions and use interpretable models instead. Nat Mach Intell. 2019, 1, 206–215. [Google Scholar] [CrossRef]
- Doshi-Velez, F; Kim, B. Towards a rigorous science of interpretable machine learning. arXiv 2017, arXiv:1702.08608. [Google Scholar] [CrossRef]
- Topol, EJ. High-performance medicine: the convergence of human and artificial intelligence. Nat Med. 2019, 25, 44–56. [Google Scholar] [CrossRef]
- Page, MJ; Moher, D; Bossuyt, PM; Boutron, I; Hoffmann, TC; Mulrow, CD; et al. PRISMA 2020 explanation and elaboration: updated guidance and exemplars for reporting systematic reviews. BMJ 2021, 372, n160. [Google Scholar] [CrossRef]
- Programme, CAS. How to use the PICO framework: Critical Appraisal Skills Programme. Available online: https://casp-uk.net/pico-framework/.
- AUC-ROC curve in Machine Learning: GeeksforGeeks. 2025. Available online: https://www.geeksforgeeks.org/machine-learning/auc-roc-curve/.
- Precision-Recall curve in machine learning: GeeksforGeeks. 2025. Available online: https://www.geeksforgeeks.org/machine-learning/precision-recall-curve-ml/.
- Hong, QN PP; Fàbregues, S; Bartlett, G; Boardman, F; Cargo, M; Dagenais, P; et al. Mixed Methods Appraisal Tool (MMAT), version 2018.
- Dasgupta, S; Jayagopal, A; Hong, ALJ; Mariappan, R; Rajan, V. Adverse Drug Event Prediction Using Noisy Literature-Derived Knowledge Graphs: Algorithm Development and Validation 2021 2021-10-1. e32730 p.
- Deng, Z; Xu, J; Feng, Y; Dong, L; Zhang, Y; Deng, Z; et al. MAVGAE: a multimodal framework for predicting asymmetric drug-drug interactions based on variational graph autoencoder. Computer Methods In Biomechanics And Biomedical Engineering 2025, 28(7), 1098–110. [Google Scholar] [CrossRef] [PubMed]
- Gromova, AA; Maida, AS. ChemBERTaDDI: Transformer Driven Molecular Structures and Clinical Data for predicting drug-drug interactions. bioRxiv 2025, 2025.01.22, 634309. [Google Scholar] [CrossRef]
- Gromova, AA; Maida, AS. ChemBERTaDDI: Transforming Drug-Drug Interaction Prediction with Transformers and Clinical Insights. 2025, 2025-1-25. [Google Scholar]
- Burkhardt, HA; Subramanian, D; Mower, J; Cohen, T. Predicting Adverse Drug-Drug Interactions with Neural Embedding of Semantic Predications. AMIA Annual Symposium proceedings AMIA Symposium 2019, 2019, 992–1001. [Google Scholar]
- Keshavarz, A; Lakizadeh, A. PU-MLP: A PU-learning based method for polypharmacy side-effects detection based on multi-layer perceptron and feature extraction techniques. Intell Based Med 2025, 12. [Google Scholar] [CrossRef]
- Keshavarz, A; Lakizadeh, A; Keshavarz, A; Lakizadeh, A. PU-GNN: A Positive-Unlabeled Learning Method for Polypharmacy Side-Effects Detection Based on Graph Neural Networks. International Journal Of Intelligent Systems 2024. [Google Scholar] [CrossRef]
- Kim, E; Nam, H; Kim, E; Nam, H. DeSIDE-DDI: interpretable prediction of drug-drug interactions using drug-induced gene expressions. Journal Of Cheminformatics 2022, 14(1). [Google Scholar] [CrossRef]
- Kim, J; Shin, M; Kim, J; Shin, M. A Knowledge Graph Embedding Approach for Polypharmacy Side Effects Prediction. Applied Sciences-Basel 2023, 13(5). [Google Scholar] [CrossRef]
- Lakizadeh, A; Babaei, M; Lakizadeh, A; Babaei, M. Detection of polypharmacy side effects by integrating multiple data sources and convolutional neural networks. Molecular Diversity 2022, 26(6), 3193–203. [Google Scholar] [CrossRef] [PubMed]
- Lin, S; Zhang, G; Dong-Qing, W; Xiong, Y. DeepPSE: Prediction of polypharmacy side effects by fusing deep representation of drug pairs and attention mechanism2022 2022-10.
- Liu, Q; Yao, E; Liu, C; Zhou, X; Li, Y; Xu, M; et al. M2GCN: multi-modal graph convolutional network for modeling polypharmacy side effects. Applied Intelligence 2023, 53(6), 6814–25. [Google Scholar] [CrossRef]
- Liu, T; Cui, J; Zhuang, H; Wang, H; Liu, T; Cui, J; et al. Modeling polypharmacy effects with heterogeneous signed graph convolutional networks. Applied Intelligence 2021, 51(11), 8316–33. [Google Scholar] [CrossRef]
- Lukashina, N; Kartysheva, E; Spjuth, O; Virko, E; Shpilman, A. SimVec: predicting polypharmacy side effects for new drugs2022 2022-12.
- Masumshah, R; Aghdam, R; Eslahchi, C. A neural network-based method for polypharmacy side effects prediction2021 2021.
- Masumshah, R; Eslahchi, C; Masumshah, R; Eslahchi, C. DPSP: a multimodal deep learning framework for polypharmacy side effects prediction. Bioinformatics Advances 2023, 3(1). [Google Scholar] [CrossRef] [PubMed]
- Lloyd, O; Liu, Y; Gaunt, TR. Fast polypharmacy side effect prediction using tensor factorization. Bioinformatics (Oxford, England) 2024, 40(12). [Google Scholar] [CrossRef] [PubMed]
- Ragkousis, A; Flogera, O; Megalooikonomou, V; Ragkousis, A; Flogera, O; Megalooikonomou, V. MFSE: A Meta-Fusion Model for Polypharmacy Side-Effect Prediction with Graph Neural Networks2022 2022. 563–70 p.
- Stock, M; De Baets, B. Cold-Start Problems in Data-Driven Prediction of Drug–Drug Interaction Effects2021 2021.
- Nováček, V; Mohamed, SK. Predicting Polypharmacy Side-effects Using Knowledge Graph Embeddings. AMIA Joint Summits on Translational Science proceedings AMIA Joint Summits on Translational Science 2020, 2020, 449–58. [Google Scholar]
- Wang, N; Taylor, C; Wang, N; Taylor, CO. DrIVeNN: Drug Interaction Vectors Neural Network. Journal Of Computational Biology 2025. [Google Scholar] [CrossRef]
- Wang, Y; Ma, H; Zhang, R; Gao, Z. Gorge: graph convolutional networks on heterogeneous multi-relational graphs for polypharmacy side effect prediction2023 2023-4. 6 p.
- Zitnik, M; Agrawal, M; Leskovec, J; Zitnik, M; Agrawal, M; Leskovec, J. Modeling polypharmacy side effects with graph convolutional networks. BIOINFORMATICS 2018, 34(13), 457–66. [Google Scholar] [CrossRef]
- Rao, PCV. Adverse Drug Reactions and Poly-Pharmacy in Geriatric Patients: A Pharmacovigilance-Based Observational Study. Journal of Population Therapeutics & Clinical Pharmacology (JPTCP) 2025, 32(3), 181–8. [Google Scholar]
- Pathuri, V. Revolutionizing Drug Safety: The Role of Artificial Intelligence and Machine Learning in Pharmacovigilance. International Journal of Computer Science and Information Technology Research (IJCSITR) 2025, 6(1), 51–61. [Google Scholar]
- Al-Nafjan, A; Aljuhani, A; Alshebel, A; et al. Artificial Intelligence in Predictive Healthcare: A Systematic Review. Journal of Clinical Medicine 2025, 14(19), 6752. [Google Scholar] [CrossRef] [PubMed]
- Lee, S. Mastering AUPRC in Biomedical ML: Unlock the Power of Precision-Recall Curves for Enhanced Model Evaluation. In Number Analytics Blog; 30 June 2025. [Google Scholar]
- Li, Y. AUROC and AUPRC. Medium. Available online: https://medium.com/@yukims19/auroc-and-auprc-b25183827e5a.
Figure 1.
PRISMA flow chart.
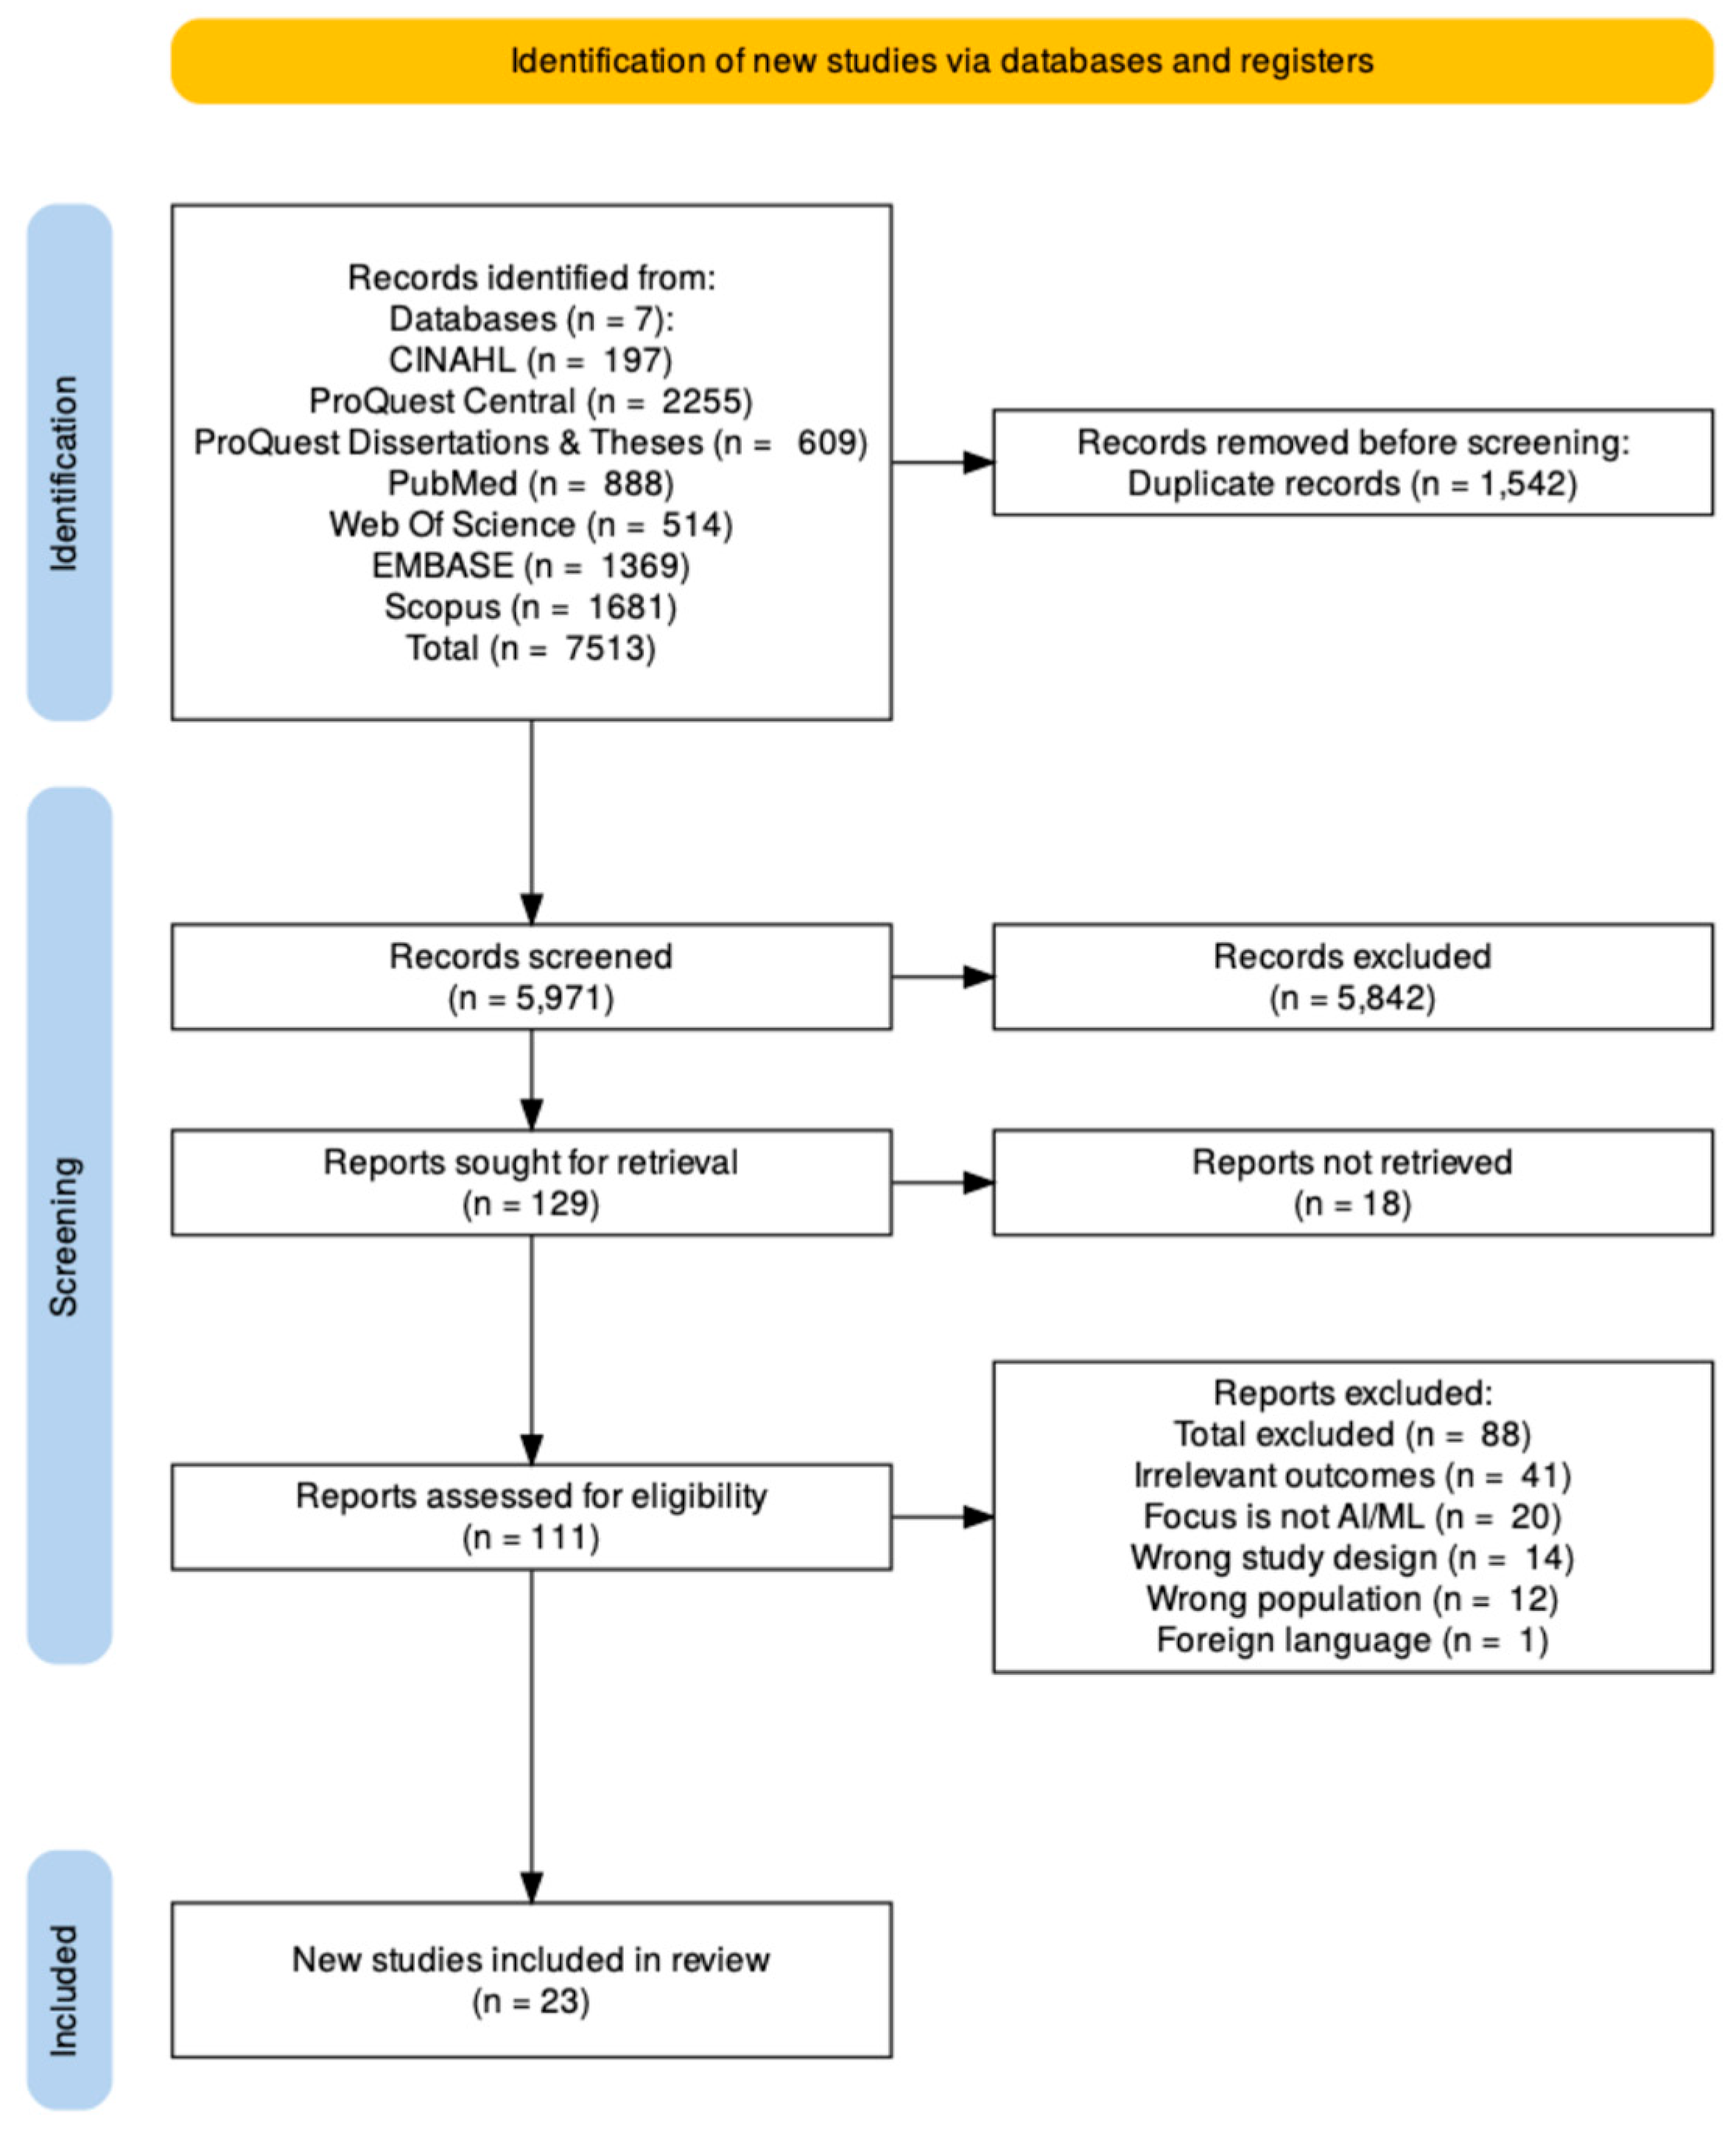
Figure 2.
Country Distribution of Computational Studies.
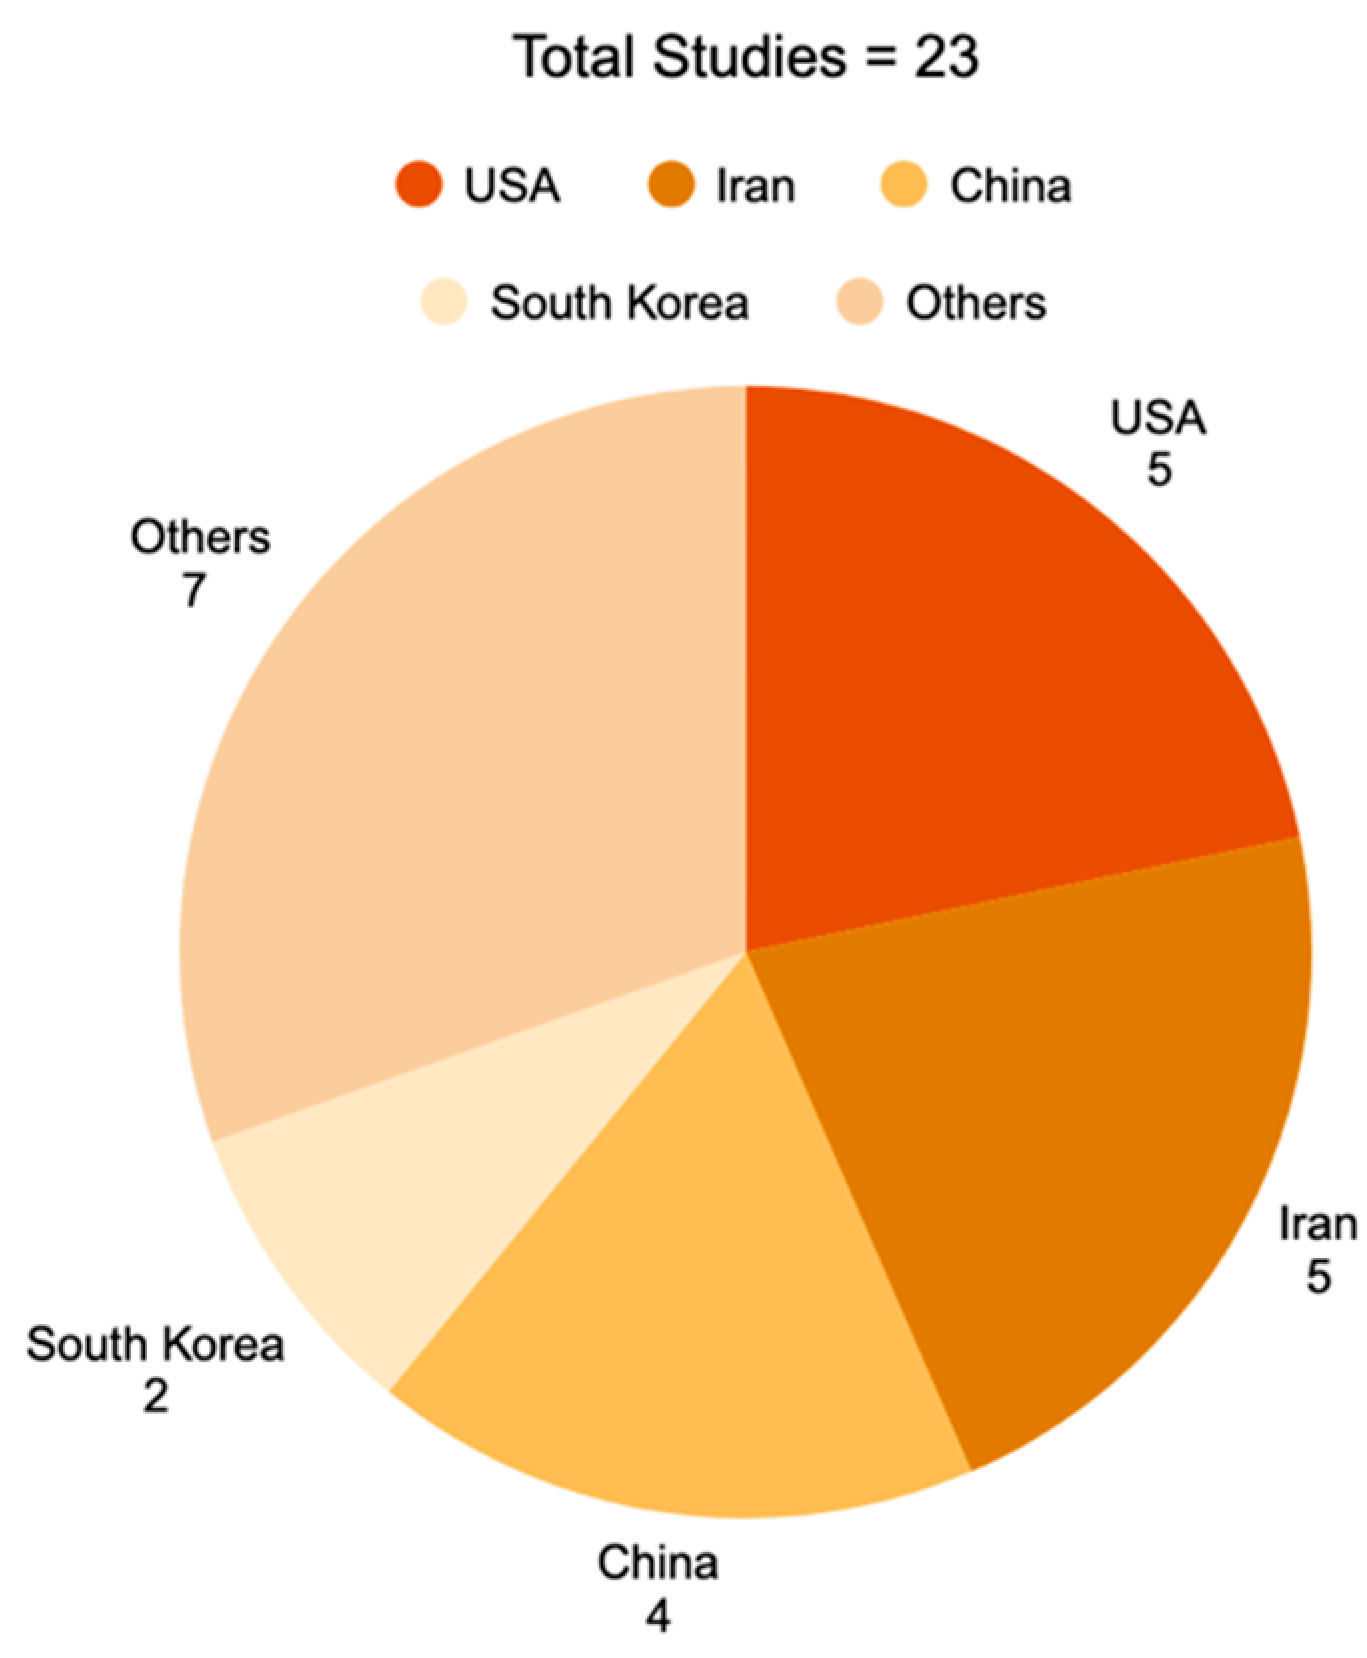
Figure 3.
Top High-Performance Models.
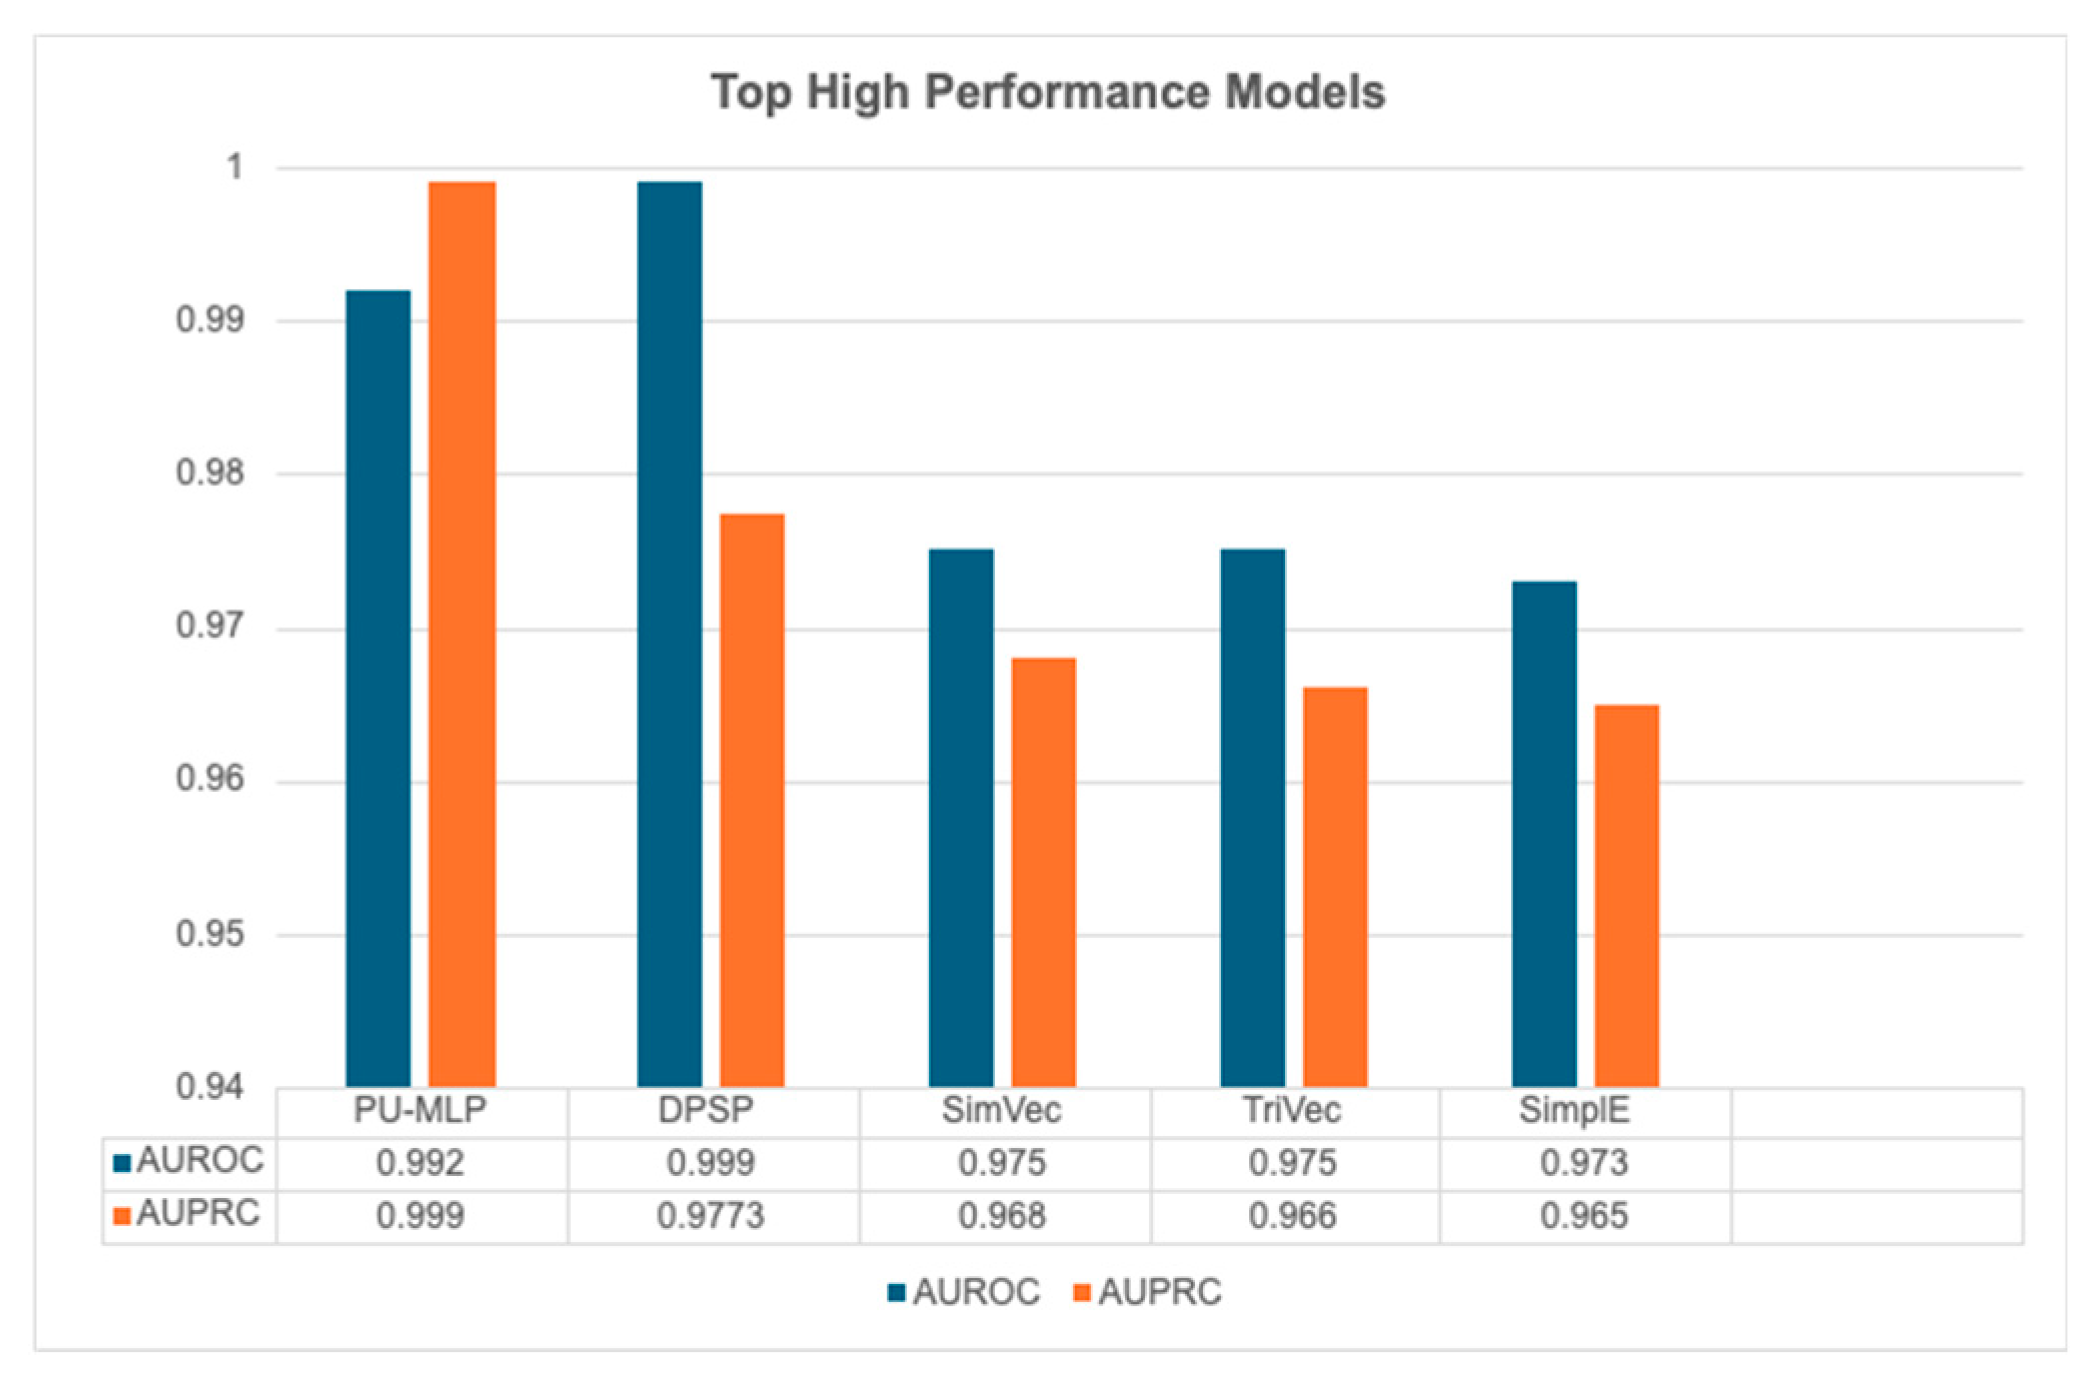
Figure 4.
Comparison of Model Performance grouped by country origin.
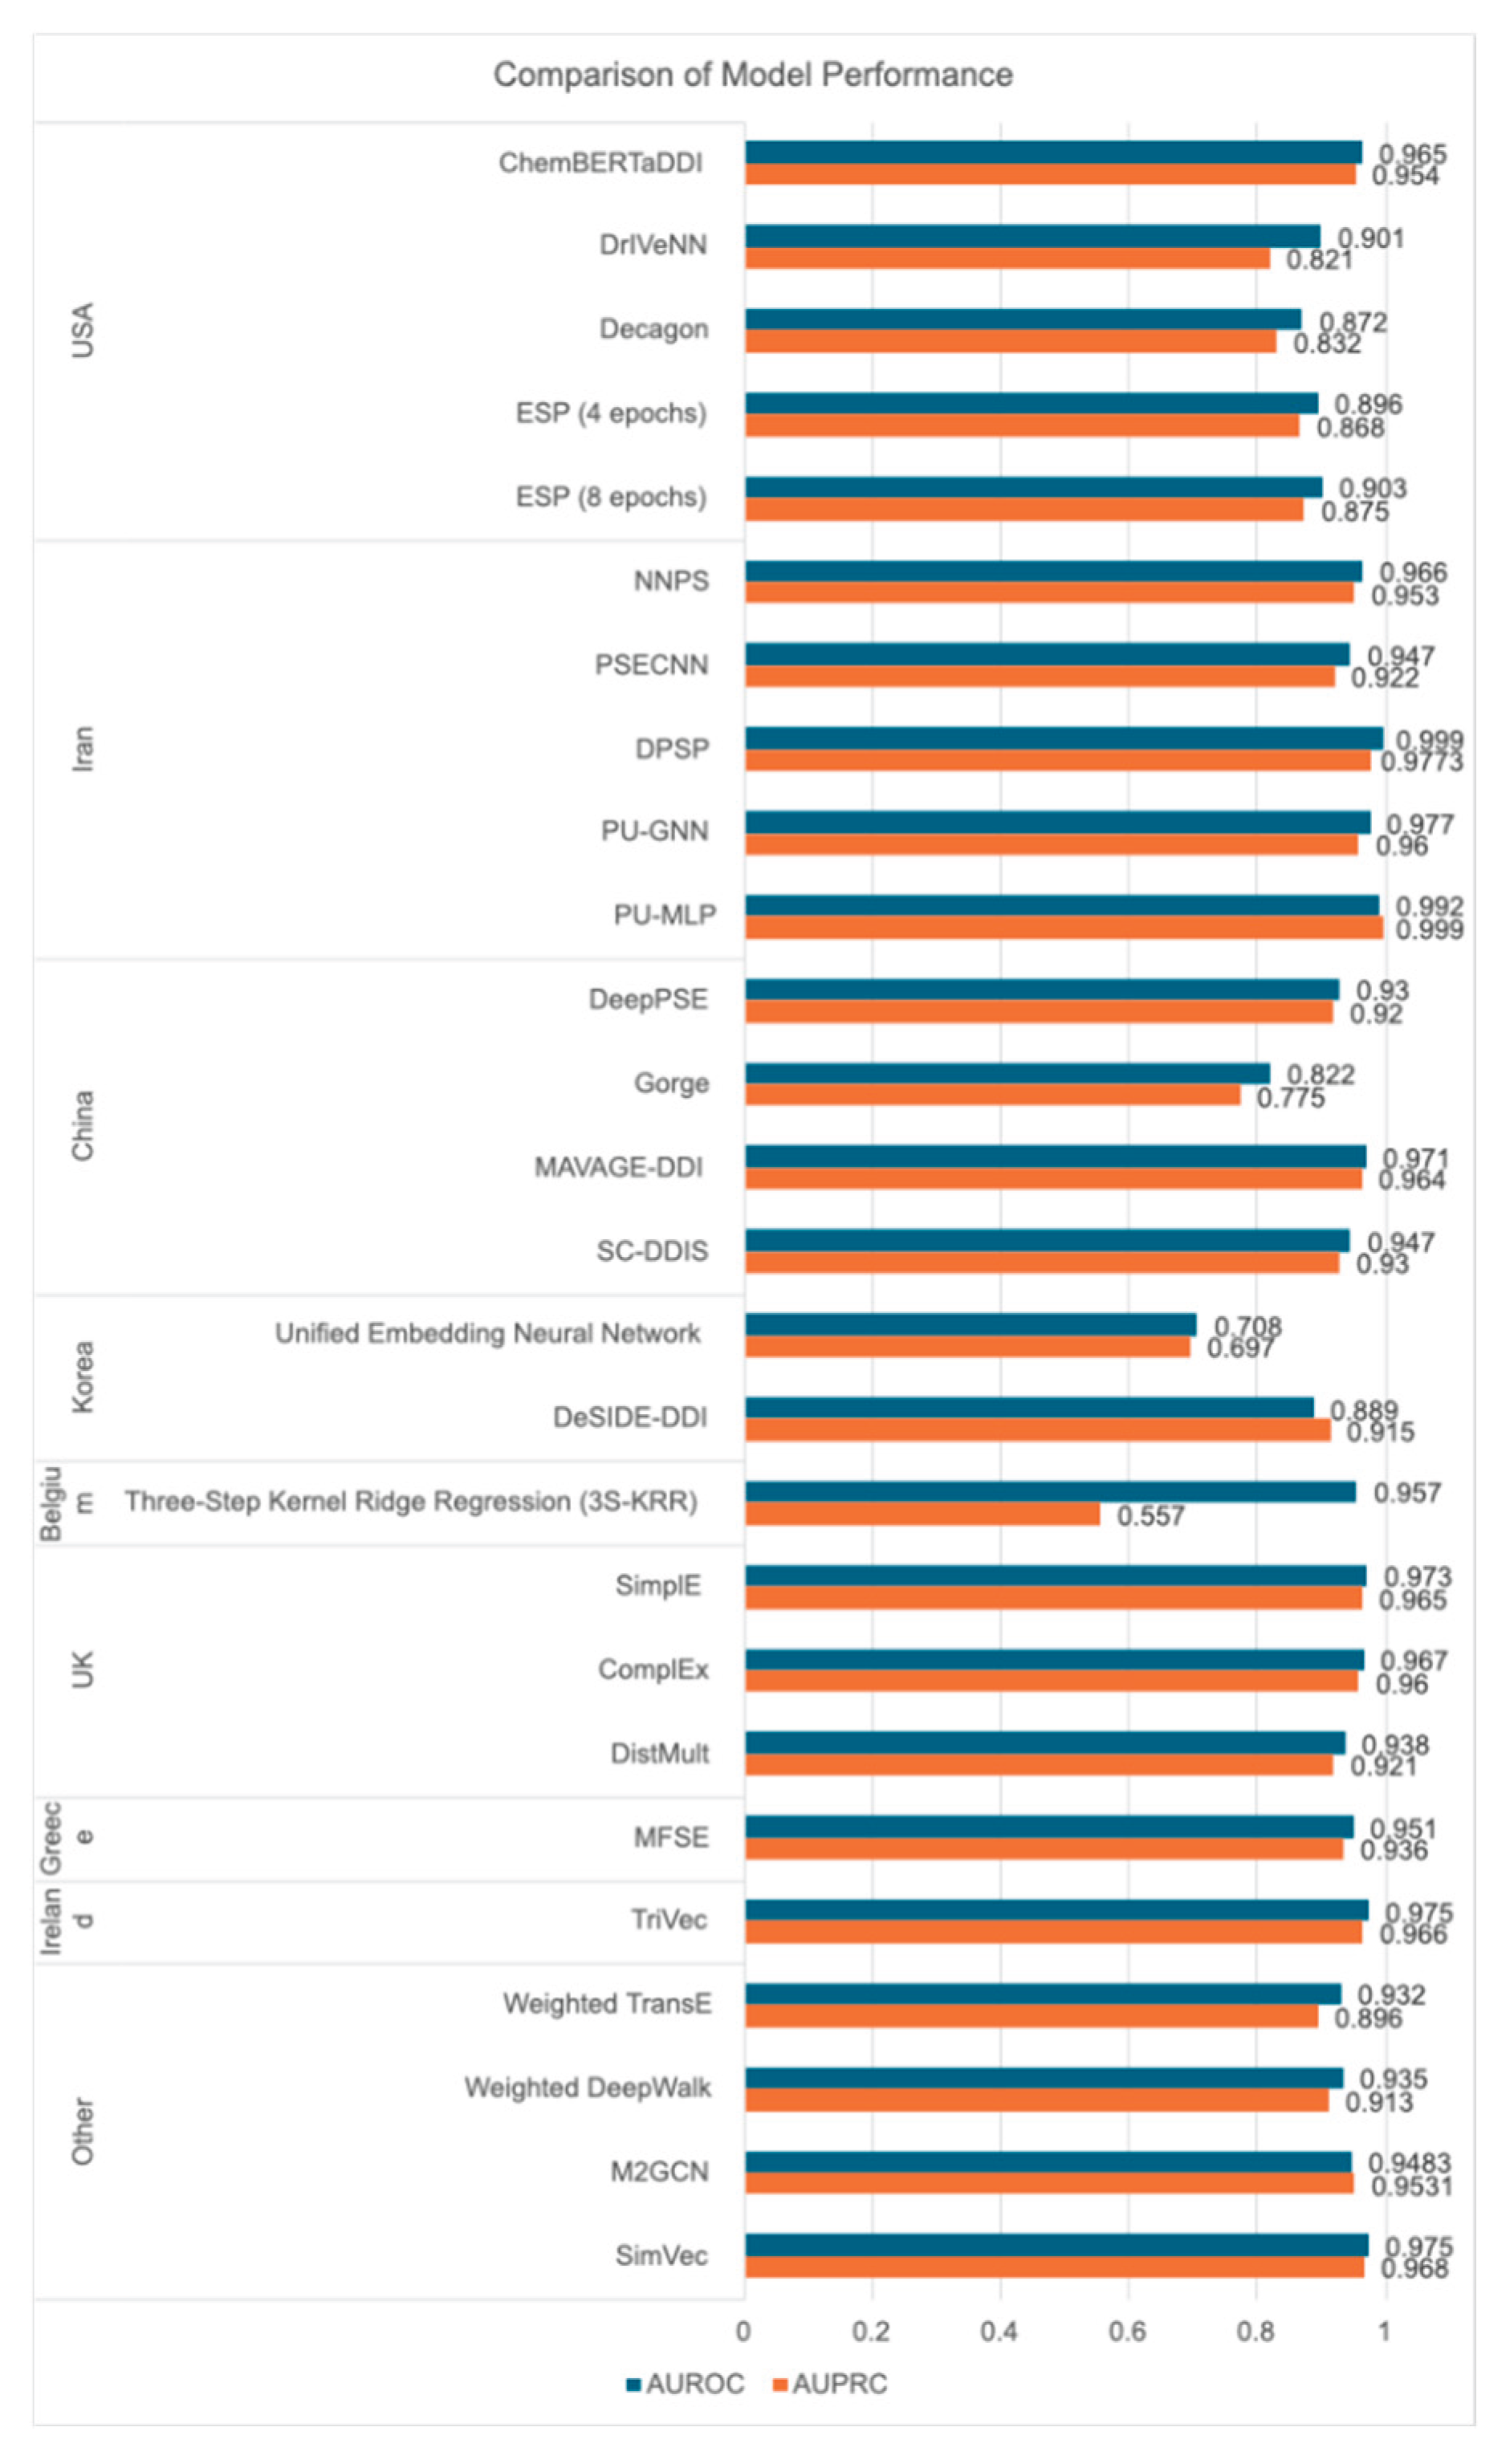

Table 1.
Characteristics of the included studies (n=23).
| Study number | Authors/year | Country of study | Study design | Sample characteristics |
| Study 1 | Zitnik M et al. 2018 |
United States | Computational modeling study |
|
| Study 2 | Burkhardt H et al. 2020 |
United States | Computational modeling study |
|
| Study 3 | Nováček V, Mohamed S 2020 |
Ireland | Computational modeling study |
|
| Study 4 | Dasgupta S et al. 2021 |
Singapore and India |
Computational modeling study |
|
| Study 5 | Masumshah R et al. 2021 |
Iran | Computational modeling study |
|
| Study 6 | Dewulf P et al. 2021 |
Belgium | Computational modeling study |
|
| Study 7 | Liu T et al. 2021 |
China | Computational modeling study |
|
| Study 8 | Lin S et al. 2022 |
China | Computational modeling study |
|
| Study 9 | Kim E, Nam H 2022 |
Republic of Korea | Computational modeling study |
|
| Study 10 | Lakizadeh A, Babaei M 2022 |
Iran | Computational modeling study |
|
| Study 11 | Liu Q et al. 2022 |
China and Singapore | Computational modeling study |
|
| Study 12 | Ragkousis A et al. 2022 |
Greece | Computational modeling study |
|
| Study 13 | Lukashina N et al.2022 | Russia and Sweden |
Computational modeling study |
|
| Study 14 | Kim J, Shin M 2023 |
Republic of Korea | Computational modeling study |
|
| Study 15 | Masumshah R, Eslahchi C 2023 | Iran | Computational modeling study |
|
| Study 16 | Wang Y et al. 2023 |
China | Computational modeling study |
|
| Study 17 | Lloyd O et al. 2024 |
United Kingdom | Computational comparative analysis of tensor factorization (TF) models |
|
| Study 18 | Keshavarz H, Lakizadeh A 2024 |
Iran | Computational modeling study |
|
| Study 19 | Gromova A, Maida A 2025 |
United States | Computational modeling study |
|
| Study 20 | Gromova A, Maida A 2025 |
United States | Computational modeling study |
|
| Study 21 | Wang N, Taylor C 2025 |
United States | Computational modeling study |
|
| Study 22 | Deng Z et al. 2025 |
China | Computational modeling study |
|
| Study 23 | Keshavarz H, Lakizadeh A 2025 |
Iran | Computational modeling study |
|
Table 2.
Models and Performance Metrics Outcomes.
| Study Number | Authors | Year of Publication | Model | Programs and Applications used | AUROC | AUPRC |
| 1 | Zitnik M et al. | 2018 | Decagon |
|
|
|
| 2 | Burkhardt H et al. | 2020 | ESP (4 epochs) |
|
|
|
| ESP (8 epochs) |
|
|
||||
| 3 | Nováček V, Mohamed S | 2020 | TriVec |
|
|
|
| 4 | Dasgupta S et al. | 2021 | Weighted TransE Weighted DeepWalk |
|
|
|
| 5 | Masumshah R et al. | 2021 | NNPS |
|
|
|
| 6 | Dewulf P et al. | 2021 | Three-Step Kernel Ridge Regression (3S-KRR) |
|
|
|
| 7 | Liu T et al. | 2021 | SC-DDIS |
|
|
|
| 8 | Lin S et al. | 2022 | DeepPSE |
|
|
|
| 9 | Kim E, Nam H | 2022 | DeSIDE-DDI |
|
|
|
| 10 | Lakizadeh A, Babaei M | 2022 | PSECNN |
|
|
|
| 11 | Liu Q et al. | 2022 | M2GCN |
|
|
|
| 12 | Ragkousis A et al. | 2022 | MFSE |
|
|
|
| 13 | Lukashina N et al. | 2022 | SimVec |
|
|
|
| 14 | Kim J, Shin M | 2023 | Unified Embedding Neural Network |
|
|
|
| 15 | Masumshah R, Eslahchi C | 2023 | DPSP |
|
|
|
| 16 | Wang Y et al. | 2023 | Gorge |
|
|
|
| 17 | Lloyd O et al. | 2024 | SimplE ComplEx DistMult |
|
|
|
| 18 | Keshavarz H, Lakizadeh A | 2024 | PU-GNN |
|
|
|
| 19 | Gromova A, Maida A | 2025 | ChemBERTaDDI |
|
|
|
| 20 | Gromova A, Maida A | 2025 | ChemBERTaDDI |
|
|
|
| 21 | Wang N, Taylor C | 2025 | DrIVeNN |
|
|
|
| 22 | Deng Z et al. | 2025 | MAVAGE-DDI |
|
|
|
| 23 | Keshavarz H, Lakizadeh A | 2025 | PU-MLP |
|
|
|
Table 3.
Advantages and Challenges of AI and/or ML.
| Study number | Authors/ year | Advantages of AI and/or ML | Challenges of AI and/or ML |
| 1 | Zitnik M et al. 2018 |
|
|
| 2 | Burkhardt H et al. 2020 |
|
▪ Training data (mined text) may be low quality, stemming from literature mining that may contain inaccuracies.
|
| 3 | Nováček V, Mohamed S 2020 |
|
|
| 4 | Dasgupta S et al. 2021 |
|
|
| 5 | Masumshah R et al. 2021 |
|
|
| 6 | Dewulf P et al. 2021 |
|
|
| 7 | Liu T et al. 2021 |
|
|
| 8 | Lin S et al. 2022 |
|
|
| 9 | Kim E, Nam H 2022 |
|
|
| 10 | Lakizadeh A, Babaei M 2022 |
|
|
| 11 | Liu Q et al. 2022 |
|
|
| 12 | Ragkousis A et al. 2022 |
|
▪ N/A |
| 13 | Lukashina N et al. 2022 |
|
|
| 14 | Kim J, Shin M 2023 |
|
|
| 15 | Masumshah R, Eslahchi C 2023 |
|
|
| 16 | Wang Y et al. 2023 |
|
|
| 17 | Lloyd O et al. 2024 |
|
|
| 18 | Keshavarz H, Lakizadeh A 2024 |
|
|
| 19 | Gromova A, Maida A 2025 |
|
|
| 20 | Gromova A, Maida A 2025 |
|
|
| 21 | Wang N, Taylor C 2025 |
|
|
| 22 | Deng Z et al. 2025 |
|
|
| 23 | Keshavarz H, Lakizadeh A 2025 |
|
|
Table 4.
Quality assessment summary using MMAT tool - Quantitative non randomized studies.
| Screening questions | Quantitative non-randomized studies | ||||||||
| Study | Authors | S1. Are there clear research questions? | S2. Do the collected data allow to address the research questions? | 3.1. Are the participants representative of the target population? | 3.2. Are measurements appropriate regarding both the outcome and intervention (or exposure)? | 3.3. Are there complete outcome data? | 3.4. Are the confounders accounted for in the design and analysis? | 3.5. During the study period, is the intervention administered (or exposure occurred) as intended? | MMAT Score |
| Study 1 | Zitnik M et al. 2018 |
Yes | Yes | Yes | Yes | Yes | Yes | Yes | 5/5 |
| Study 2 | Burkhardt H et al. 2020 |
Yes | Yes | Yes | Yes | Yes | Yes | Yes | 5/5 |
| Study 3 | Nováček V, Mohamed S 2020 |
Yes | Yes | Yes | Yes | Yes | Yes | Yes | 5/5 |
| Study 4 | Dasgupta S et al. 2021 |
Yes | Yes | Yes | Yes | Yes | Yes | Yes | 5/5 |
| Study 5 | MasumshahR et al. 2021 |
Yes | Yes | Yes | Yes | Yes | Yes | Yes | 5/5 |
| Study 6 | Dewulf P et al. 2021 |
Yes | Yes | Yes | Yes | Yes | Yes | Yes | 5/5 |
| Study 7 | Liu T et al. 2021 |
Yes | Yes | Yes | Yes | Yes | Yes | Yes | 5/5 |
| Study 8 | Lin S et al. 2022 |
Yes | Yes | Yes | Yes | Yes | Yes | Yes | 5/5 |
| Study 9 | Kim E, Nam H 2022 |
Yes | Yes | Yes | Yes | Yes | Yes | Yes | 5/5 |
| Study 10 | LakizadehA, Babaei M 2022 |
Yes | Yes | Yes | Yes | Yes | Yes | Yes | 5/5 |
| Study 11 | Liu Q et al. 2022 |
Yes | Yes | Yes | Yes | Yes | Yes | Yes | 5/5 |
| Study 12 | RagkousisA et al. 2022 |
Yes | Yes | Yes | Yes | No | Yes | Yes | 4/5 |
| Study 13 | LukashinaN et al. 2022 | Yes | Yes | Yes | Yes | Yes | Yes | Yes | 5/5 |
| Study 14 | Kim J, Shin M 2023 |
Yes | Yes | Yes | Yes | Yes | Yes | Yes | 5/5 |
| Study 15 | MasumshahR,EslahchiC 2023 | Yes | Yes | Yes | Yes | Yes | Yes | Yes | 5/5 |
| Study 16 | Wang Y et al. 2023 |
Yes | Yes | Yes | Yes | Yes | Yes | Yes | 5/5 |
| Study 17 | Lloyd O et al. 2024 |
Yes | Yes | Yes | Yes | Yes | Yes | Yes | 5/5 |
| Study 18 | Keshavarz H,LakizadehA 2024 |
Yes | Yes | Yes | Yes | Yes | Yes | Yes | 5/5 |
| Study 19 | Gromova A, Maida A 2025 |
Yes | Yes | Yes | Yes | Yes | Yes | Yes | 5/5 |
| Study 20 | Gromova A, Maida A 2025 |
Yes | Yes | Yes | Yes | Yes | Yes | Yes | 5/5 |
| Study 21 | Wang N, Taylor C 2025 |
Yes | Yes | Yes | Yes | Yes | Yes | Yes | 5/5 |
| Study 22 | Deng Z et al. 2025 |
Yes | Yes | Yes | Yes | Yes | Yes | Yes | 5/5 |
| Study 23 | Keshavarz H, Lakizadeh A 2025 |
Yes | Yes | Yes | Yes | Yes | Yes | Yes | 5/5 |
Disclaimer/Publisher’s Note: The statements, opinions and data contained in all publications are solely those of the individual author(s) and contributor(s) and not of MDPI and/or the editor(s). MDPI and/or the editor(s) disclaim responsibility for any injury to people or property resulting from any ideas, methods, instructions or products referred to in the content. |
© 2026 by the authors. Licensee MDPI, Basel, Switzerland. This article is an open access article distributed under the terms and conditions of the Creative Commons Attribution (CC BY) license (http://creativecommons.org/licenses/by/4.0/).
Copyright: This open access article is published under a Creative Commons CC BY 4.0 license, which permit the free download, distribution, and reuse, provided that the author and preprint are cited in any reuse.


