Preprint
Article

This version is not peer-reviewed.

Based a Machine Learning Approach to Investigate the Factors Influencing Nirmatrelvir/ritonavir Exposure in Human Plasma: A Multicenter, Observational Study

Submitted:

18 November 2024

Posted:

20 November 2024

You are already at the latest version

Abstract

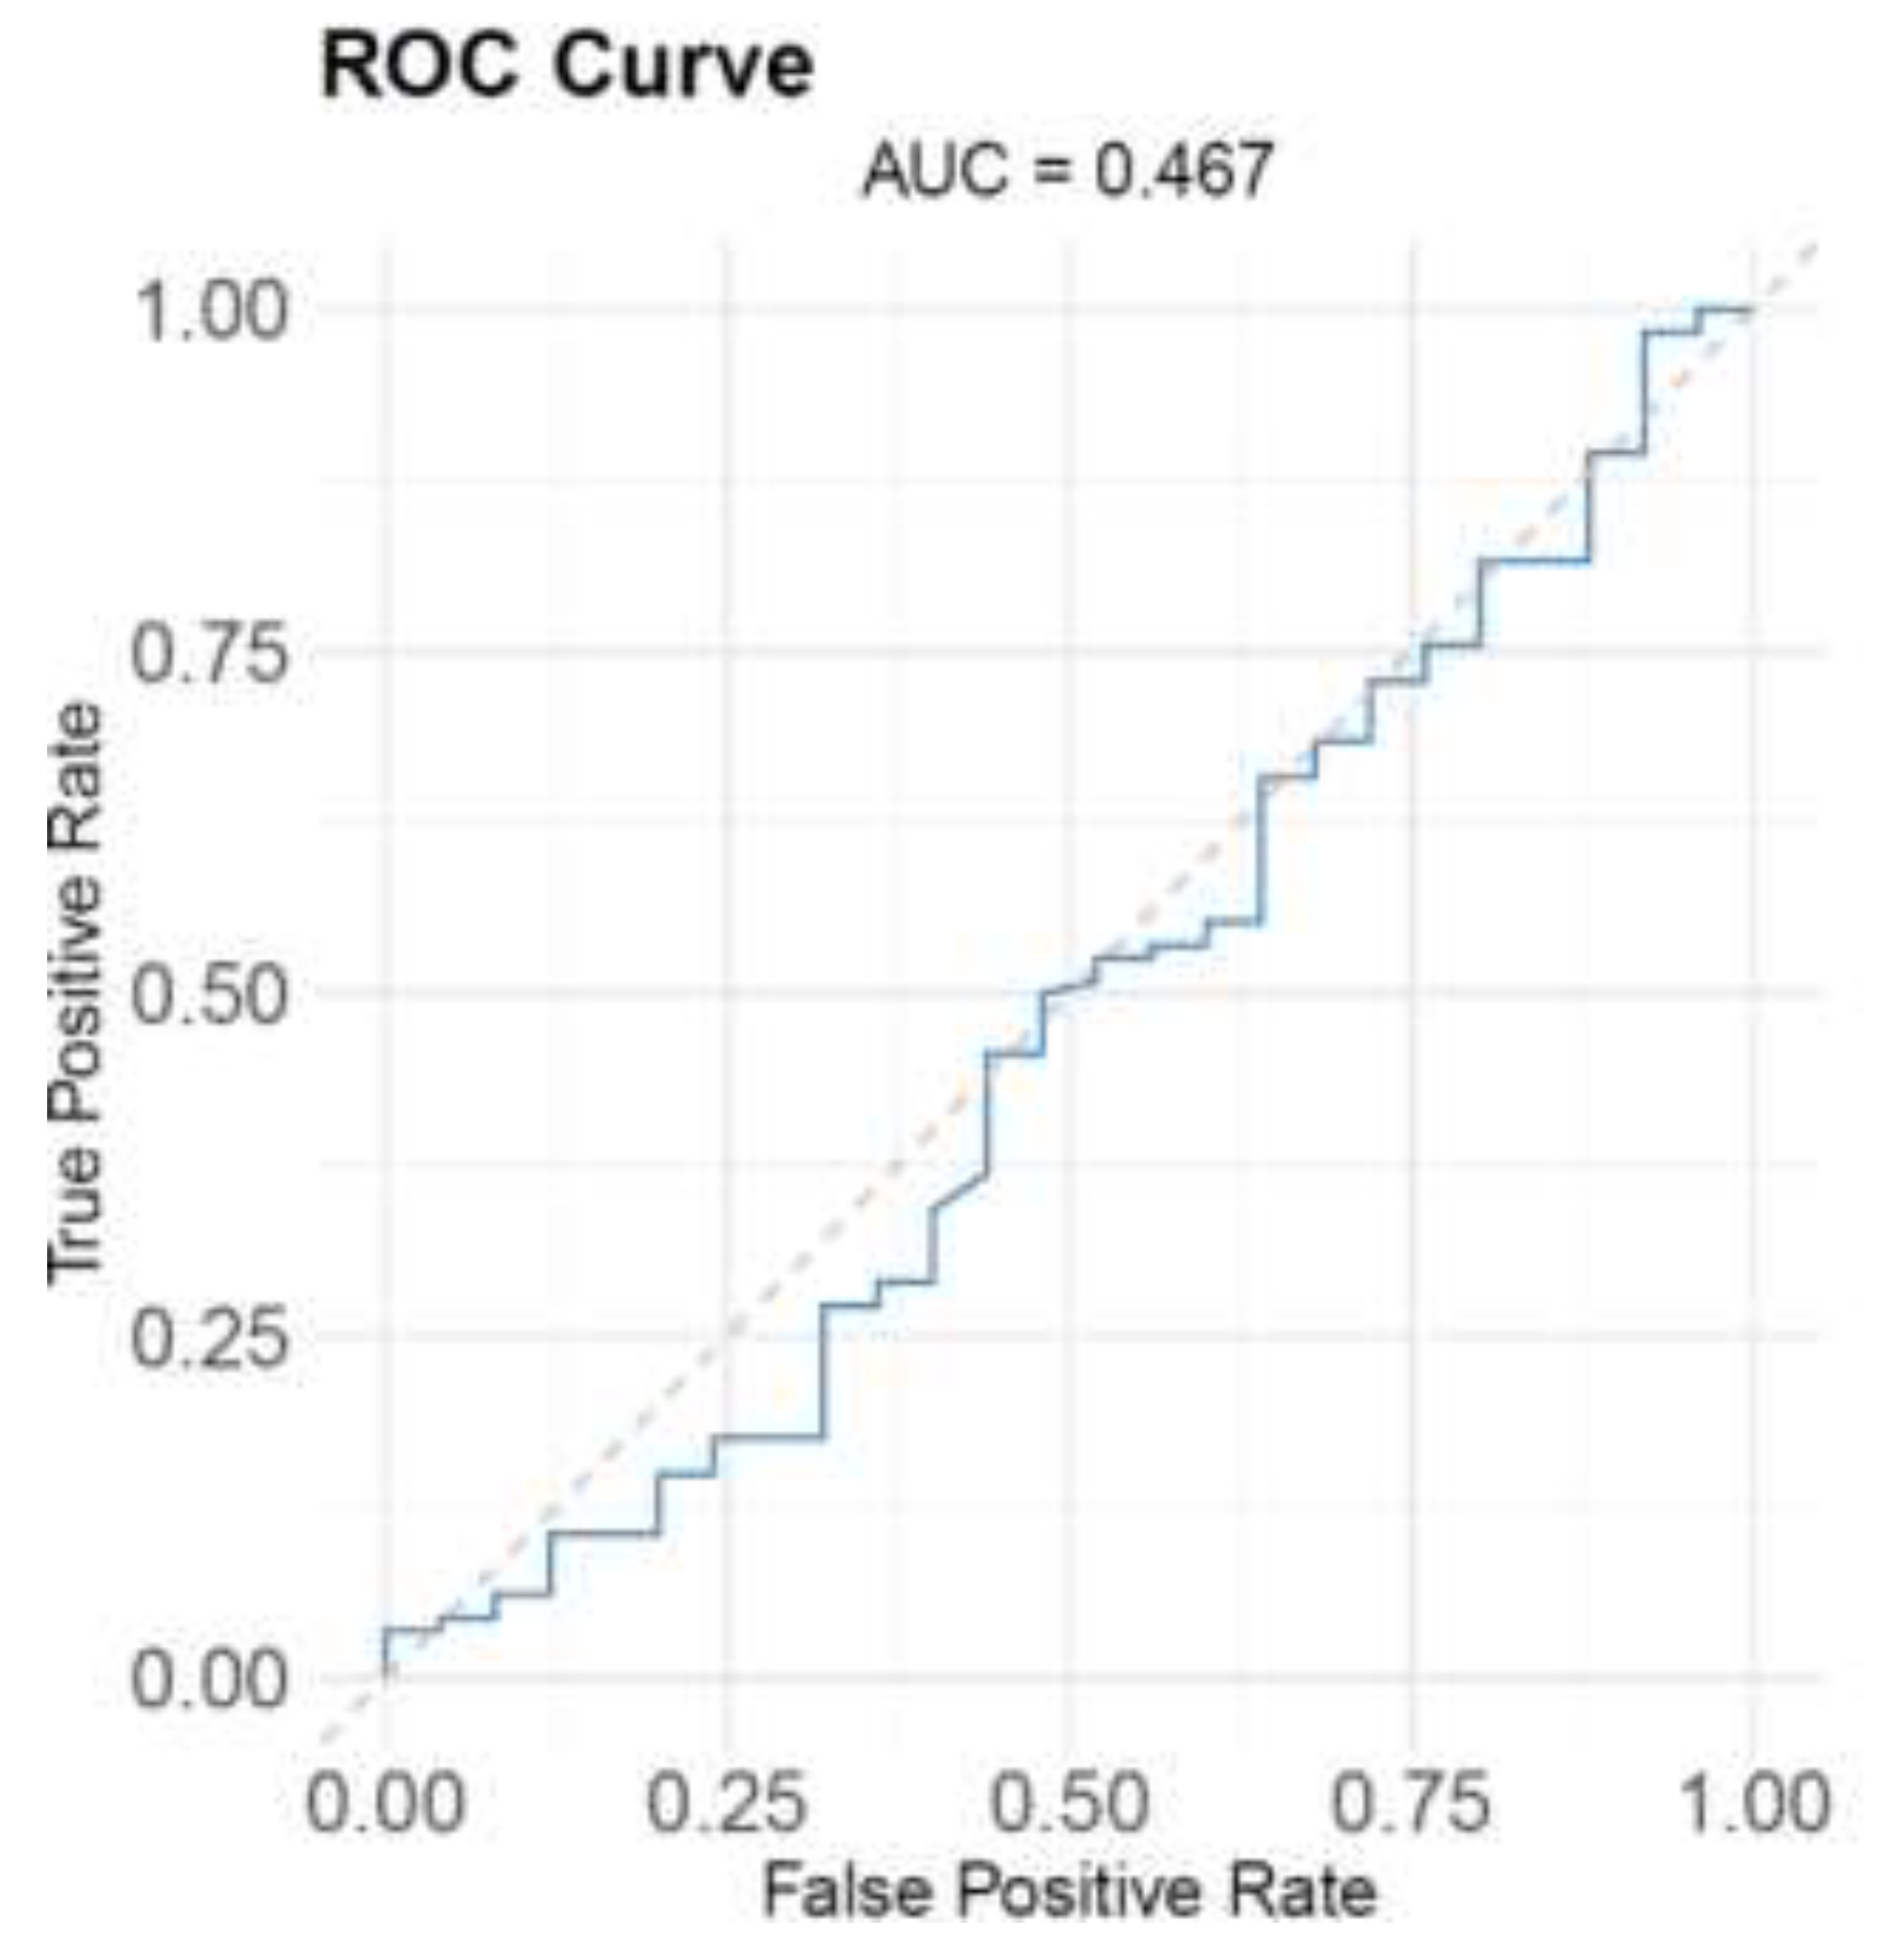
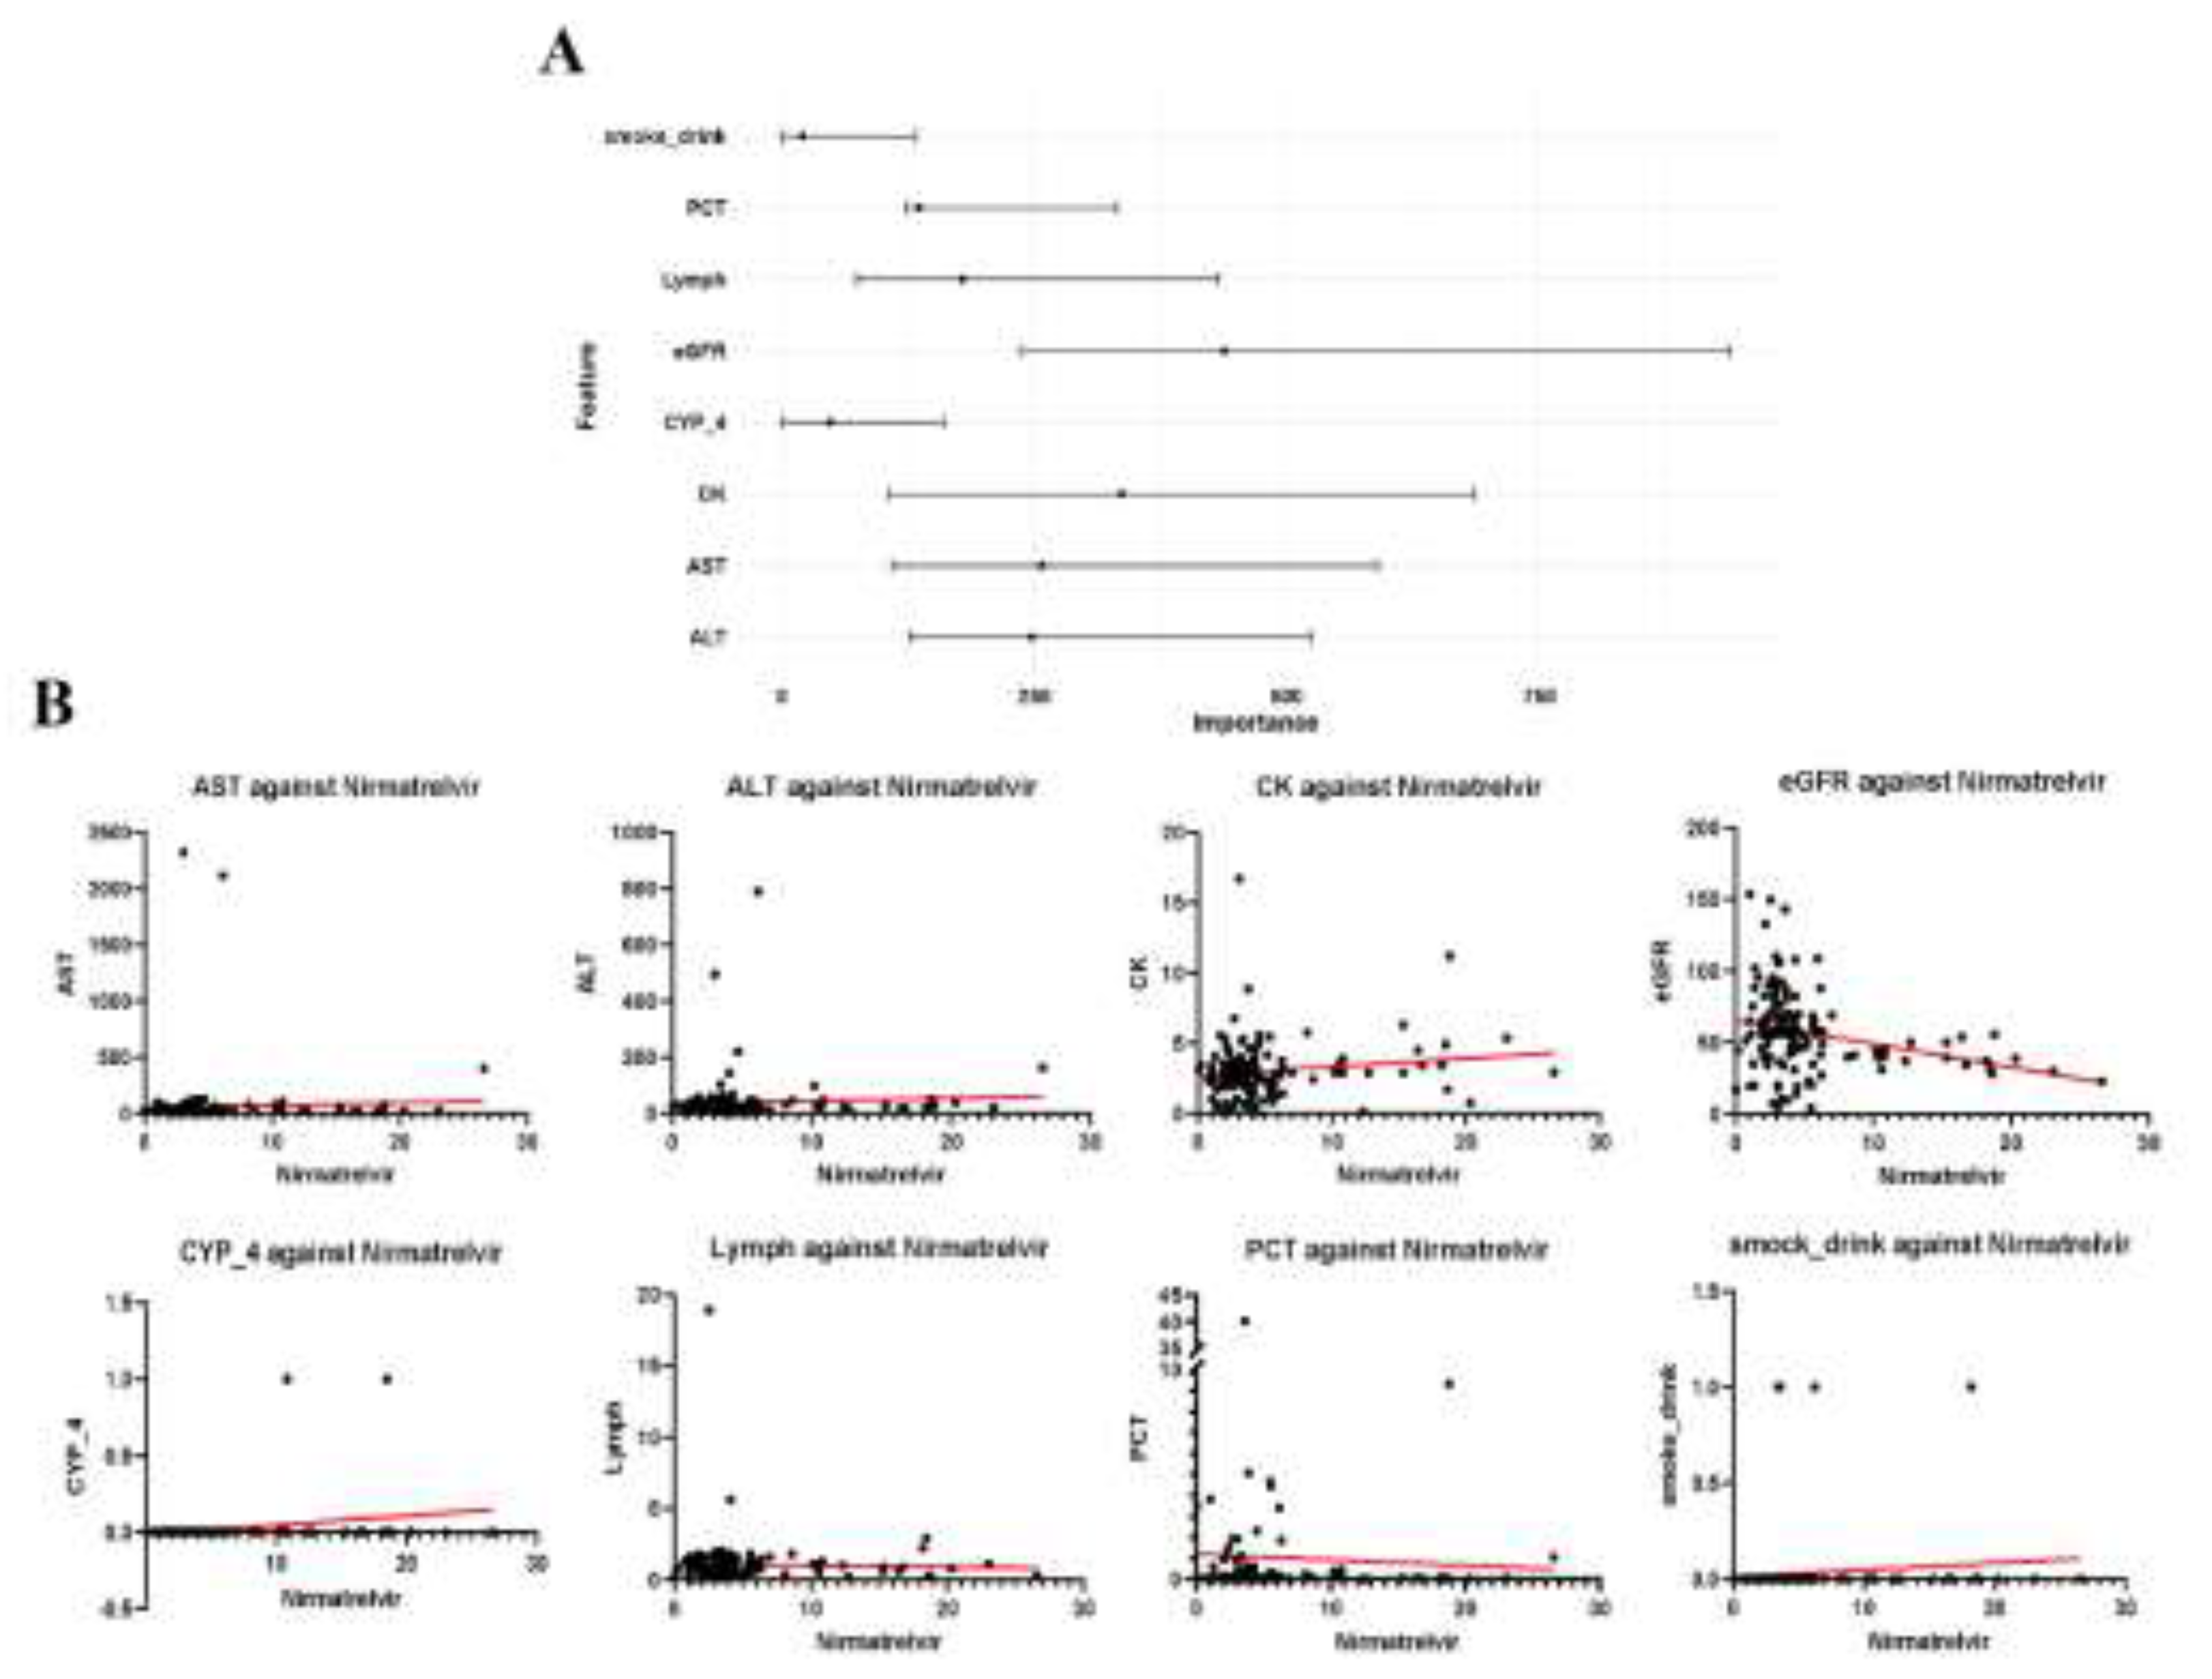
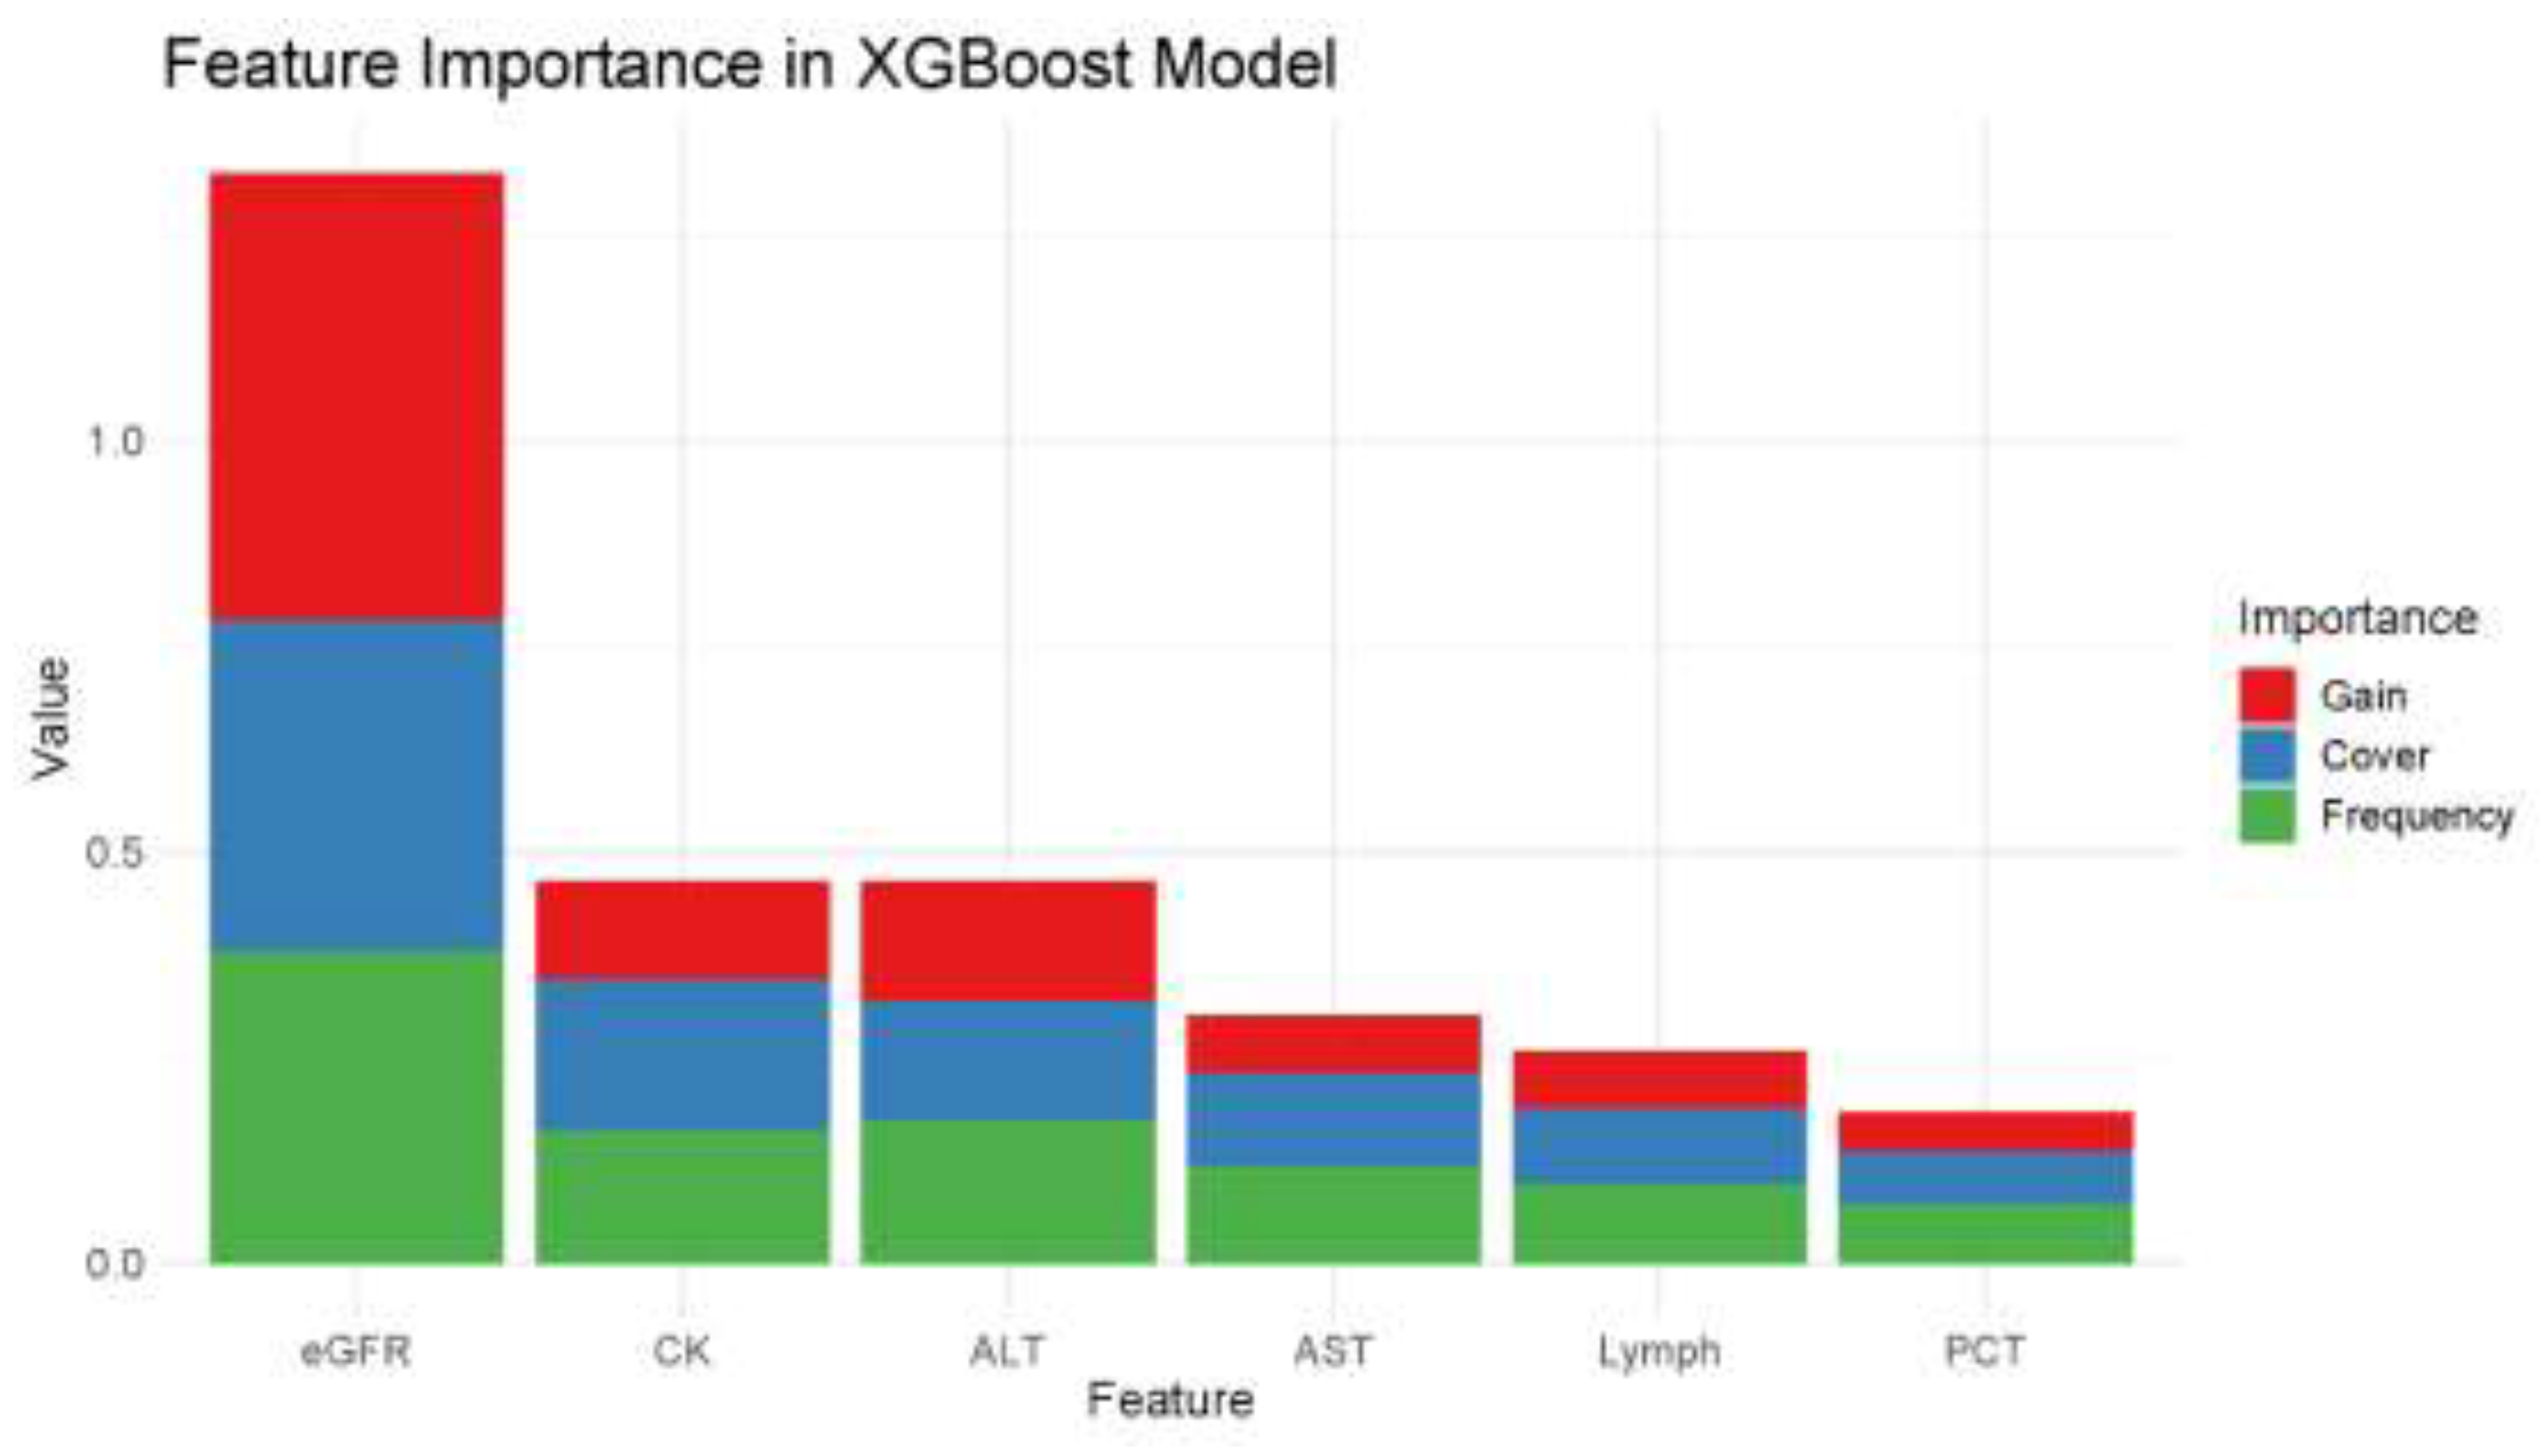
Objectives: Nirmatrelvir/ritonavir (N/R) is an effective drug for treating COVID-19. However, there is currently a lack of evidence for therapeutic drug monitoring of N/R, which may increase the risk of adverse drug reactions and compromise its efficacy. Methods: In this study, we retrospectively analyzed data from 139 patients in two center who were prescribed N/R. We collected baseline data from all patients and monitored nirmatrelvir and ritonavir concentrations on the third day of medication. We conducted a logistic regression analysis to investigate the relationship between drug concentration and prognosis. We also analyzed the correlations among features and used a random forest model to select significant factors that affect drug exposure. Subsequently, we constructed an XGBoost model to predict drug concentration using the selected features. Results: Our findings indicated that the concentration of N/R could not predict patient outcomes. We also identified potential factors that affect N/R concentration, including estimated glomerular filtration rate, creatine kinase, aspartate aminotransferase, alanine aminotransferase, lymphocytes, and platelet count. Ultimately, the evaluation of the predictive model resulted in a mean absolute error (MAE) of 0.717, mean squared error (MSE) of 1.328, root mean squared error (RMSE) of 1.152, and coefficient of determination (R-squared) of 0.779. The prediction model performs well and can provide risk prediction for medication management for N/R, as well as assist in personalized medication. Conclusions: We identified a set of variables that affect the treatment of N/R through therapeutic drug monitoring and established a machine learning model to identify drug risks. This provides a reference for clarifying the significance of therapeutic drug monitoring for N/R treatment and the subsequent development of multivariate prognostic models.

Keywords: 
;  ;  ;  

1. Introduction

COVID-19, caused by severe acute respiratory syndrome coronavirus 2019 (SARS-CoV-19), poses a significant threat to global public health systems. Antiviral drugs, including remdesivir [1], lopinavir/ritonavir [2], molnupiravir [3], and nirmatrelvir/ritonavir (N/R) [4], have demonstrated promising therapeutic effects against COVID-1. N/R, an oral antiviral drug manufactured by Pfizer in the United States, is considered an ideal treatment for mild to moderate COVID-19 and severe disease risk factors [5,6]. N/R consists of two active substances: nirmatrelvir and ritonavir. Nirmatrelvir is a potent inhibitor of SARS-CoV-2 protease, which hinders the processing of viral polyproteins and prevents viral replication. Ritonavir, on the other hand, primarily inhibits the cytochrome P450 3A4 enzyme (CYP3A4), preventing premature metabolic inactivation of nirmatrelvir and increasing its serum concentrations [7]. Thus, the combination of nirmatrelvir and ritonavir can enhance the effectiveness of nirmatrelvir in alleviating clinical symptoms in patients with COVID-19.
Despite the effectiveness of N/R in combating COVID-19, the inhibition of CYP3A metabolism by ritonavir can lead to a rapid increase in the concentration of drugs such as tacrolimus and cyclosporine, which are also metabolized by CYP3A4. This increase can result in adverse effects such as brain damage, epilepsy, kidney damage, and even death [8,9,10,11]. N/R is not recommended for patients with severe renal or hepatic impairment. Therefore, for patients taking N/R, especially those with special conditions, timely monitoring of drug concentration is crucial for effective treatment. Therapeutic drug monitoring (TDM) has become an important tool for optimizing the use of biopharmaceuticals. It is primarily used to monitor drugs with challenging target concentrations, significant pharmacokinetic variability, and adverse reactions [12,13]. Therefore, based on previous experience [14,15], TDM may be an optimized tool for drug therapy to manage drug-drug interactiong (DDI), specifically for patients using potential related medications.
To ensure the effectiveness of N/R and minimize its side effects, TDM was utilized to monitor the blood concentrations of nirmatrelvir and ritonavir during COVID-19 treatment with N/R. In this study, we analyzed patients who received N/R treatment and underwent TDM monitoring in two study center (Changxing People's Hospital and Second Affiliated Hospital of Xi’an Jiaotong University). We identified several factors that could potentially influence N/R blood levels, providing a foundation and reference for the clinical use of N/R.

2. Patients and Methods

2.1. Study Design

This retrospective multicenter study included all patients who received N/R treatment at Changxing People’s Hospital and Second Affiliated Hospital of Xi’an Jiaotong University from December 2022 to June 2023. Informed consent forms were signed by all patients. All patients were administered two tablets of nirmatrelvir and one tablet of ritonavir orally or nasally every 12 hours. Patients are advised to take nirmatrevir and ritonavir simultaneously. The maintenance dose was 300 mg administered for 5 days.

2.2. Patients Enrollment

Inclusion criteria: age≥18 years; patients adhered to the prescribed medication regimen. Blood samples were collected from all patients on the third day after drug administration, 30 minutes prior to drug administration. At least one sample from each patient was tested for TDM. If patients discontinued medication for reasons other than the study, the time of re-administration was considered as the initial treatment. The primary disease under investigation was neocoronitis. Exclusion criteria: incomplete clinical data recording, failure to meet blood sample collection and testing requirements.

2.3. Clinical Data and Definitions

At baseline, we collected and recorded the following information from patients: sex, age, department, diagnosis, smoking and alcohol abuse history, underlying diseases (hypertension), blood routine index, liver function indicators (alkaline phosphatase [ALP], glutamyl transpeptidase [GGT], aspartate transaminase [AST], and alanine transaminase [ALT]), renal function indicators (creatine kinase [CK], creatinine, and estimated glomerular filtration rate [eGFR]), clinical symptoms, and use of CYP inducers and inhibitors.

2.4. Quantification of Nirmatrelvir and Ritonavir Plasma Concentrations

2.4.1. Chromatographic and mass spectrometric conditions

A methodology for the analysis of N/R in the body has been established using UPLC-MS/MS [16]. Specifically, we utilized an ACQUITY UPLC BEH C18 (2.1 mm×50 mm, 1.7 μm) column, with 100% acetonitrile as the A-phase and water containing 0.1% formic acid as the B-phase. To enhance sample separation and improve separation efficiency, we performed gradient elution on the samples. The gradient elution consisted of the following conditions: 0-1.2 min, 22% A; 1.2-1.9 min, 100% A; 1.9-2 min, 100% A; 2-3 min, 22% A. The elution was carried out at a flow rate of 0.3 mL/min, with a column temperature of 45℃ and an injection volume of 2μL.
The electrospray ionization source (ESI)+ mode was utilized, with a capillary voltage of 3000 V, a desolvation temperature of 350℃, an N2 flow rate of 600 L/h, and a scanning mode of MRM. Positive and negative ions were alternated for scanning and analysis, and the parameters for mass spectrometry detection are provided in the table below (Table 1).

2.4.2. Preparation of Reserve Solution and Working Solution

The Nirmatrelvir and ritonavir standards were accurately weighed. Nirmatrelvir and its internal standard, nirmatrelvir-D9, were dissolved in acetonitrile, while ritonavir and its internal standard, 13C, 2H3--ritonavir, were dissolved in acetonitrile: water (50:50, V/V). Nirmatrelvir and ritonavir were prepared as separate standard stock solutions with a concentration of 1.00 mg/mL each. Nirmatrelvir-D9 and 13C, 2H3-ritonavir were dissolved separately, mixed, and then diluted with acetonitrile: methanol (3:1, V/V) containing 0.1% formic acid. This resulted in a mixed internal standard working solution with concentrations of 1.00 μg/mL for nirmatrelvir- D9 and 0.50 μg/mL for 13C, 2H3-ritonavir.
Take the appropriate amount of nirmatrelvir and ritonavir standard stock solution. Dilute them step by step with acetonitrile: water (3:1, V/V) containing 0.1% formic acid to obtain a series of mixed standard working solutions. The concentrations of nirmatrelvir in the solutions are 300, 100, 50, 20, 10, 5, and 1 μg/mL, while the concentrations of ritonavir are 50, 40, 20, 10, 5, 1, and 0.5 μg/mL. Additionally, prepare low concentration quality control (QC) samples with nirmatrelvir at 5 μg/mL and ritonavir at 1 μg/mL, medium concentration QC samples with nirmatrelvir at 10 μg/mL and ritonavir at 10 μg/mL, and high concentration QC samples with nirmatrelvir at 80 μg/mL and ritonavir at 40 μg/mL.

2.4.3. Preparation of Standard Curve and Quality Control

The standard curve and QC were prepared by adding 10 μL of a mixed standard working solution containing nirmatrelvir and ritonavir to 90 μL of blank human plasma. The standard curve for nirmatrelvir ranged from 30, 10, 5, 2, 1, 0.5, 0.1 μg/mL, while the standard curve for ritonavir ranged from 5, 4, 2, 1, 0.5, 0.1, 0.05 μg/mL. The low concentration levels were 0.5 μg/mL for nirmatrelvir and 0.1 μg/mL for ritonavir. The medium concentration levels were 1 μg/mL for nirmatrelvir and 1 μg/mL for ritonavir. The high concentration levels were 8 μg/mL for nirmatrelvir and 4 μg/mL for ritonavir. The lower limit of quantification was 0.1 μg/mL for nirmatrelvir and 0.05 μg/mL for ritonavir.

2.4.4. Sample Pretreatment

Transfer 100 μL of plasma sample into a tube, then add 300 μL of a mixed internal standard working solution. Mix the contents thoroughly and centrifuge at 12000 rpm/min for 5 minutes. Finally, take 2 μL of the supernatant for analysis.

2.4.5. Statistical Methods

To ensure the stability of the subsequent model, we conducted an initial assessment of the sample (n = 139) for multicollinearity. Through Spearman correlation analysis, we identified highly correlated features and selectively eliminated statistically significant ones to mitigate the effects of multicollinearity.
To construct a logistic regression model, we treated prognostic outcome as the dependent variable and nirmatrelvir blood concentration as the independent variable. The purpose of this model was to analyze the correlation between the two variables and determine the optimal blood concentration thresholds for distinguishing prognostic outcomes. To assess the predictive performance of the model, we calculated the receiver operating characteristic curve (ROC) and the area under the curve (AUC)[17]. To tackle the imbalance in prognostic outcomes, we employed cost-sensitive learning by incorporating inverse frequency weights derived from the distribution of prognostic categories. This technique aimed to improve the model’s sensitivity to less frequent categories. Furthermore, we improved our model through an iterative threshold adjustment process. In each cycle, we systematically eliminated the sample with the highest nirmatrelvir blood concentration. Subsequently, we reevaluated the model to assess its impact on AUC and the threshold value. This iterative exclusion aimed to optimize the threshold for prognostic discrimination, ensuring resilience against outliers or extreme values.
We employed a random forest model [18] to determine the factors influencing blood drug concentration. All samples were divided into a training cohort (n = 112) and a validation cohort (n = 27) at a 4:1 ratio using R software (version 4.3.0). The random forest model consisted of 1,000 trees and underwent 10-fold cross-validation. Features that showed a positive percentage increase in mean squared error (IncMSE) during training were considered significant and chosen for the XGBoost prediction model. We evaluated the performance of the XGBoost model by generating learning curves through iteration over various hyperparameter combinations. The learning curves helped determine the optimal combination to fine-tune the model. Metrics such as Root Mean Squared Error (RMSE), Mean Absolute Error (MAE), R-squared (Coefficient of Determination), and Mean Squared Error (MSE) were used to assess the accuracy and calibration of the model. Additionally, we confirmed the model’s internal validity through five-fold cross-validation.

3. Results

3.1 Patient Summary
This study included a total of 139 subjects, all of whom were initially diagnosed with SARS-CoV-2 infection. The age of the subjects ranged from 18 to 97 years, with a mean age of 73.42 ± 21.36 years. A total of 77 male and 62 female patients were included. Additional baseline laboratory findings are presented in Table 2.

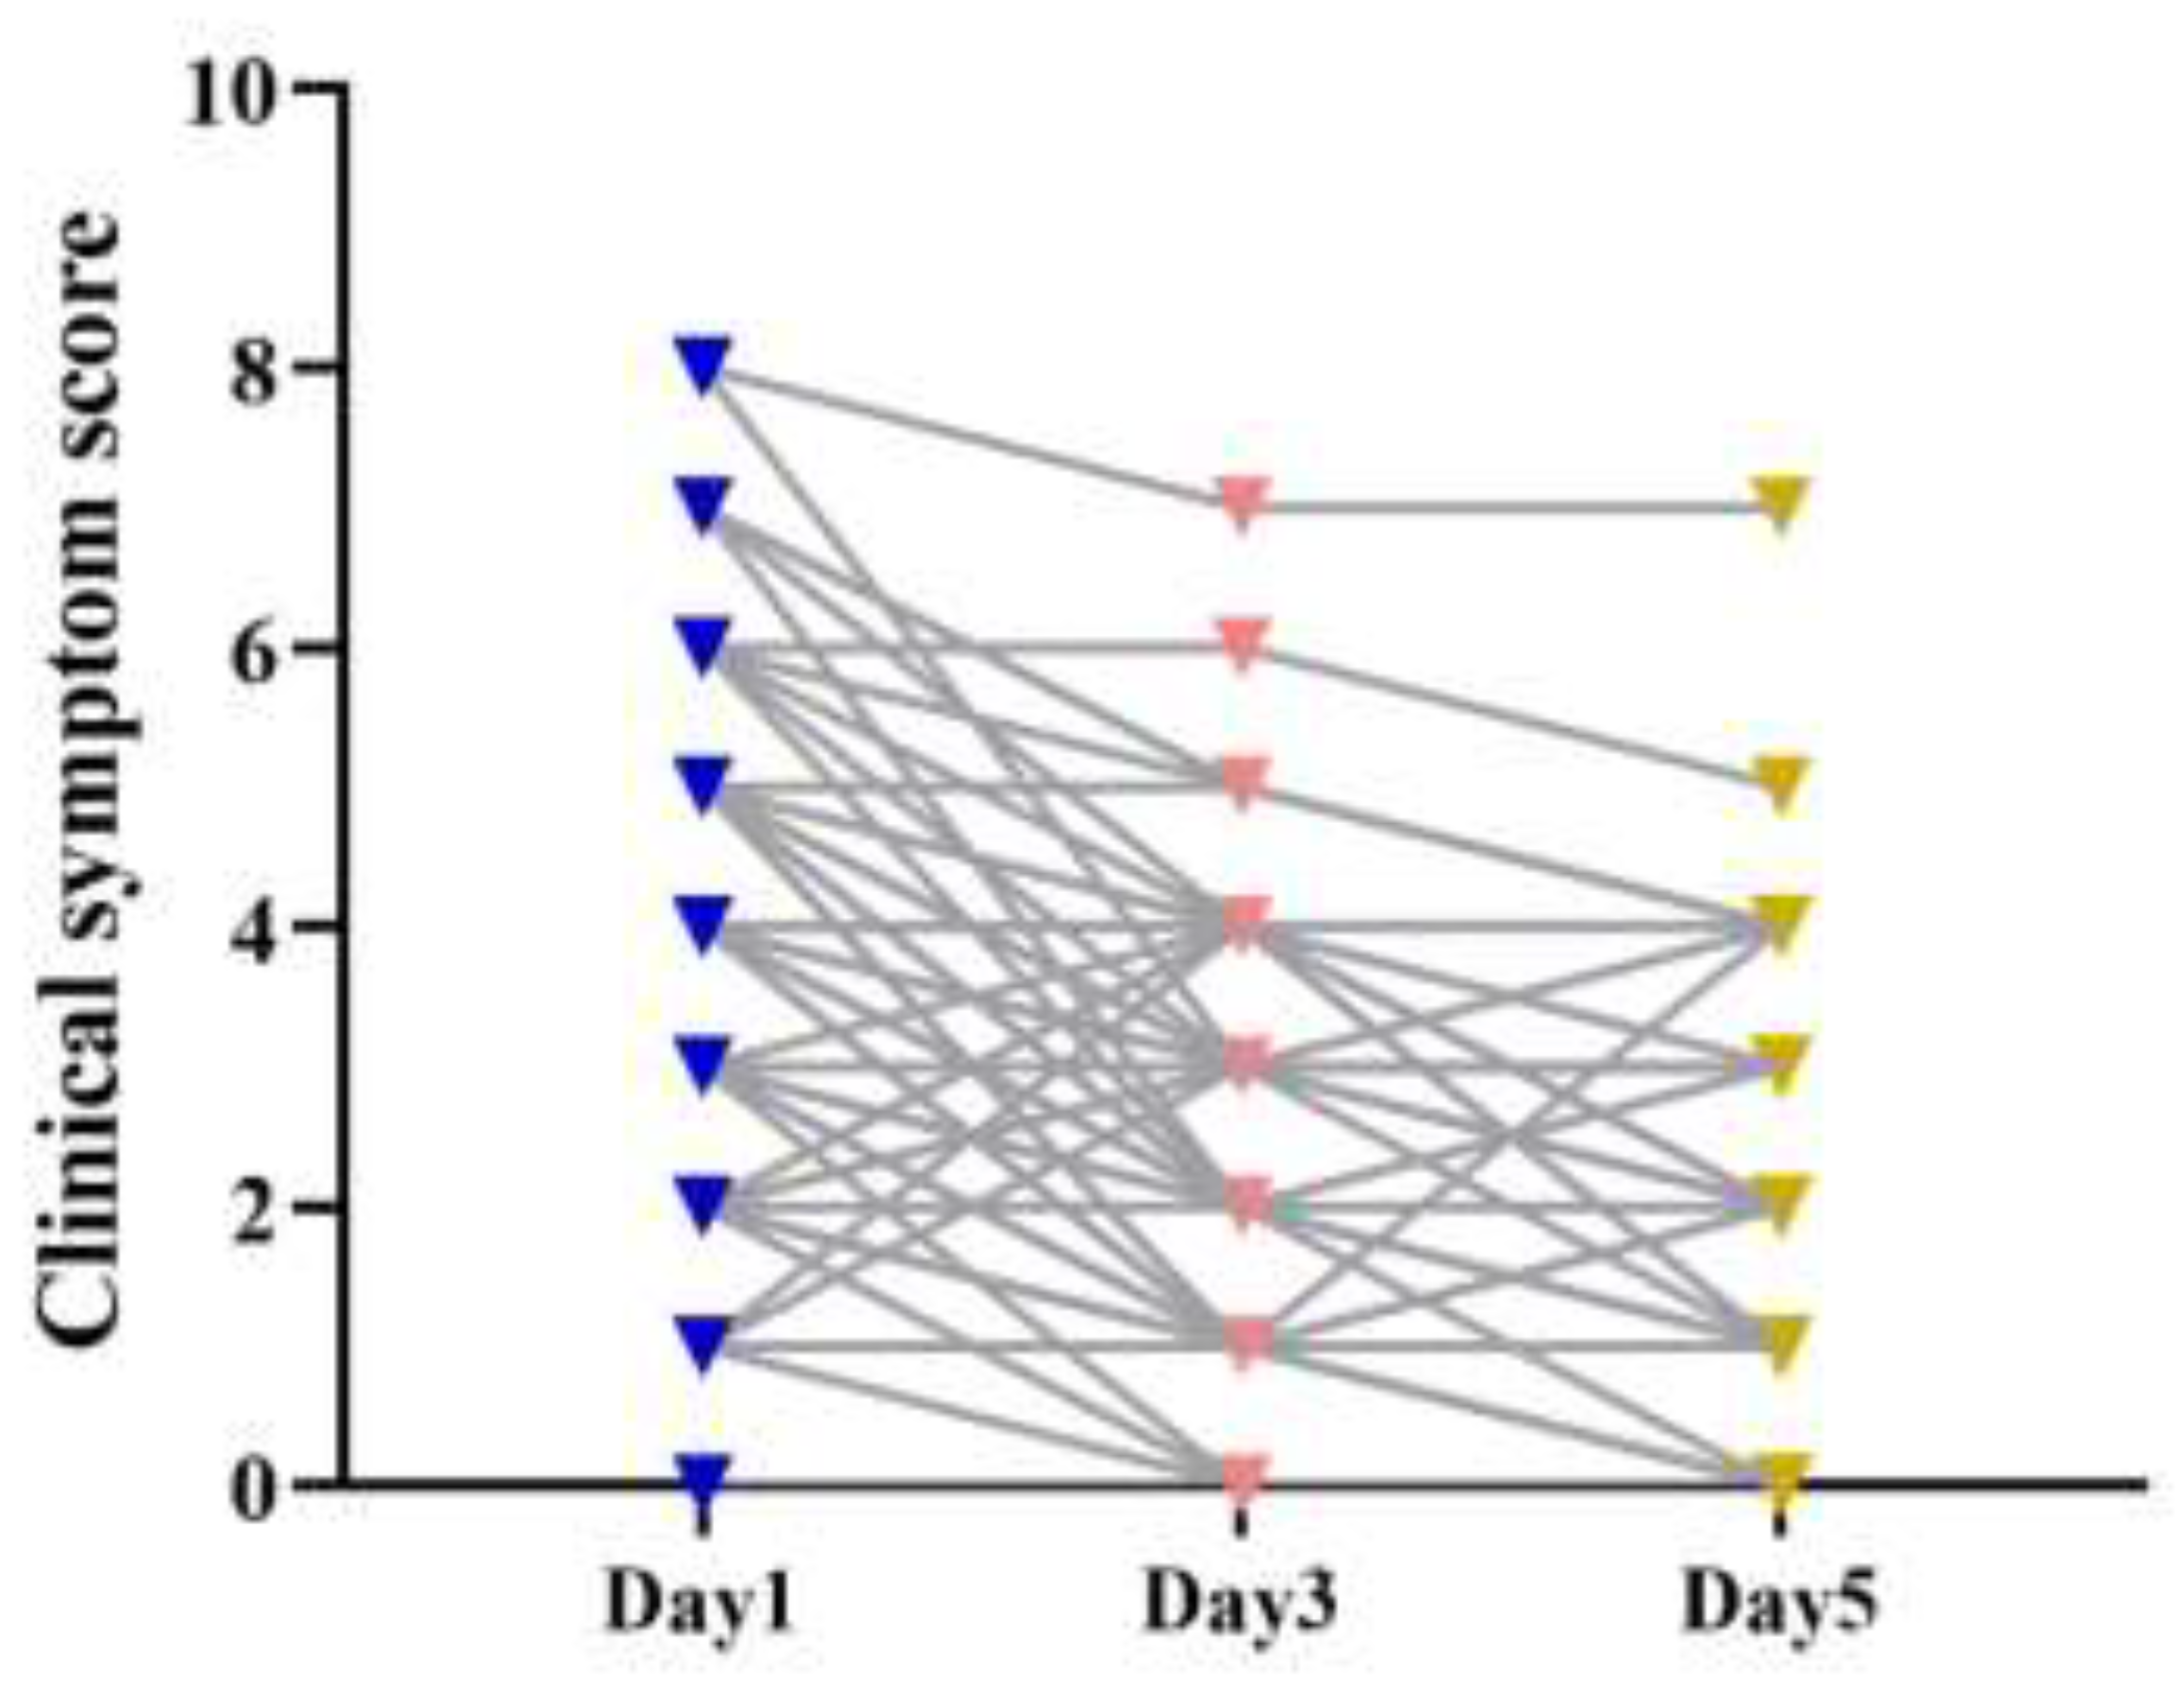
3.2. Changes in Clinical Symptom Score

We assessed the severity of common symptoms in COVID-19 patients, including fever, cough, nasal congestion, headache, muscle ache, nausea, chills, vomiting, and diarrhea, using a quantitative scoring system (0-none, 1-mild, 2-moderate, 3-severe). As depicted in Figure 1, the clinical symptom scores of nearly all patients showed a gradual decrease over the course of N/R administration. The aforementioned symptoms exhibited a gradual decrease in patients who received continuous N/R administration. These findings suggest that N/R exhibits efficacy in the treatment of SARS-CoV-19, and the timing of administration may influence its effectiveness.

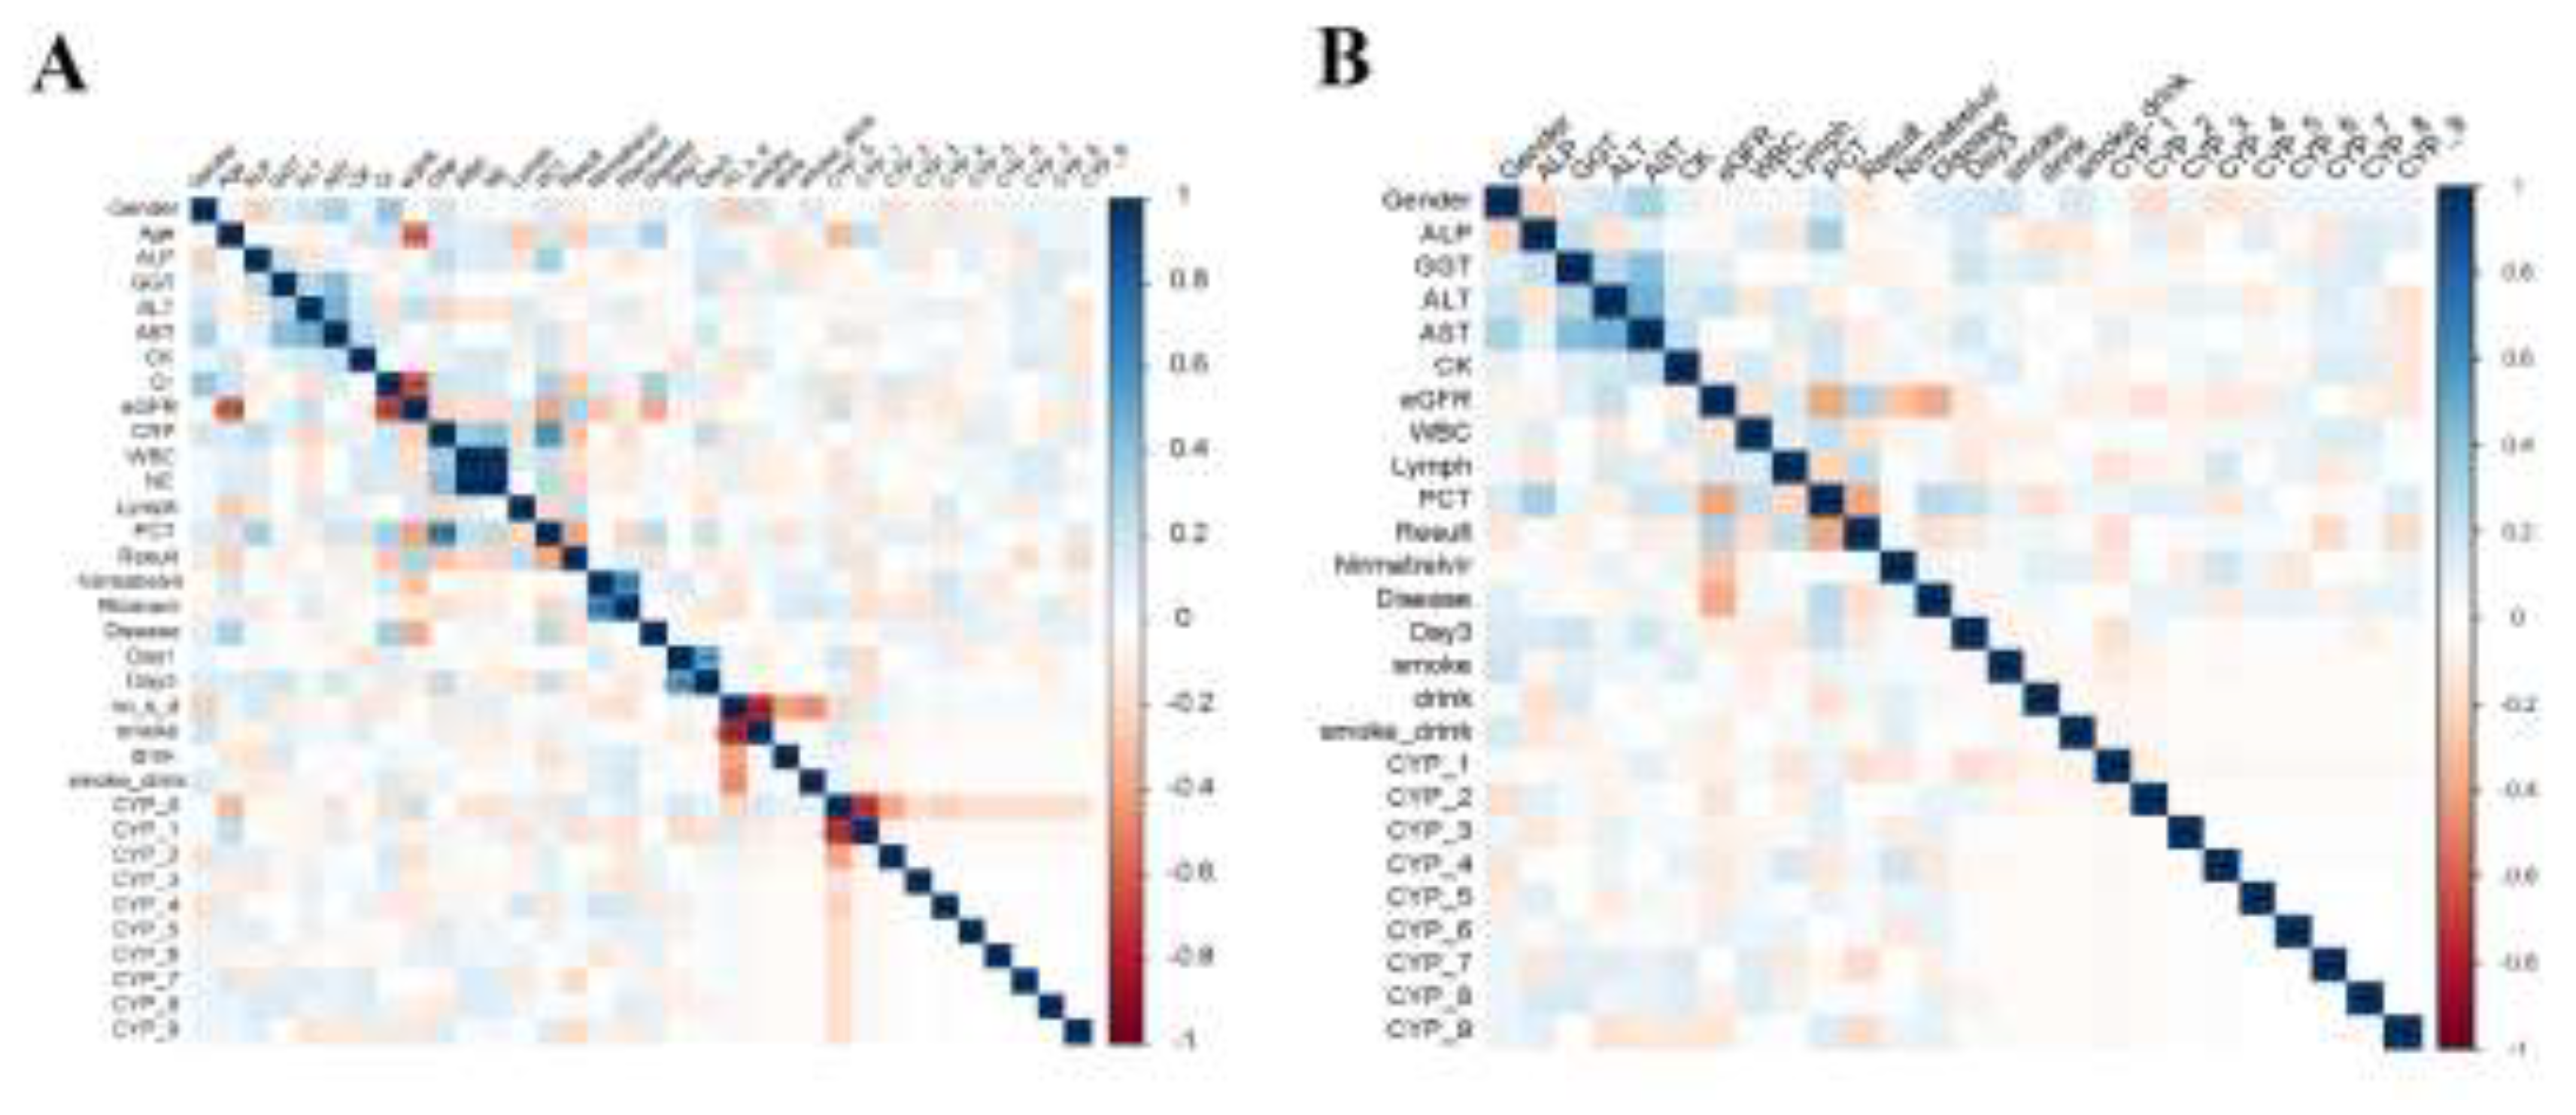
3.3. Feature Correlation Analysis

Before performing feature selection, we conducted a correlation analysis on all variables to identify and eliminatehighly correlated features. Highly correlated features were defined as those with an absolute correlation coefficient greater than 0.5 and a P-value less than 0.05. Figure 2A shows the Spearman correlation heatmap for all features, and Figure 2B displays the heatmap after removing features with correlations beyond the defined threshold. Stronger correlations are represented by darker shades. We observed a strong correlation between the concentrations of nirmatrelvir and ritonavir (Correlation: 0.6063156, P<0.001). Therefore, we decided to analyze only the concentrations of nirmatrelvir in the subsequent analyses.

3.4. Nirmatrelvir Blood Concentration Predicts The Prognosis

We evaluated the predictive value of Nirmatrelvir blood concentration for COVID-19 patient outcomes using the receiver operating characteristic (ROC) curve. The area under the ROC curve (AUC) was 0.467, indicating that the model’s predictive ability is similar to random guessing. This finding suggests that Nirmatrelvir blood concentrations may not have a significant correlation with prognostic outcomes, indicating limited usefulness in predicting patient prognosis (Figure 3).

3.5. Feature Selection from Random Forest Model

The Random Forest model was used to identify the features that had the greatest impact on our analysis. This model ranked the features based on their importance. The most important feature identified was the eGFR, which is an indicator of renal function. It was followed by creatine kinase, AST, ALT, Lymph, PCT, the use of the cytochrome P450 enzyme inhibitor omeprazole (CYP-4), and the patient’s smoking and drinking history. These results suggest that factors such as renal and liver function, lymphocyte and platelet counts, and lifestyle choices like smoking and alcohol consumption may significantly affect the metabolism and elimination of N/R, as shown in Figure 4A.
Further analysis was performed to investigate the relationship between these features and blood drug concentration. Scatter plots were created to visually represent the distribution of each feature’s value in relation to blood drug concentration. Linear regression was then applied to these distributions, and the resulting regression lines were used to illustrate the linear relationships between each feature and blood drug concentration, as depicted in Figure 4B.

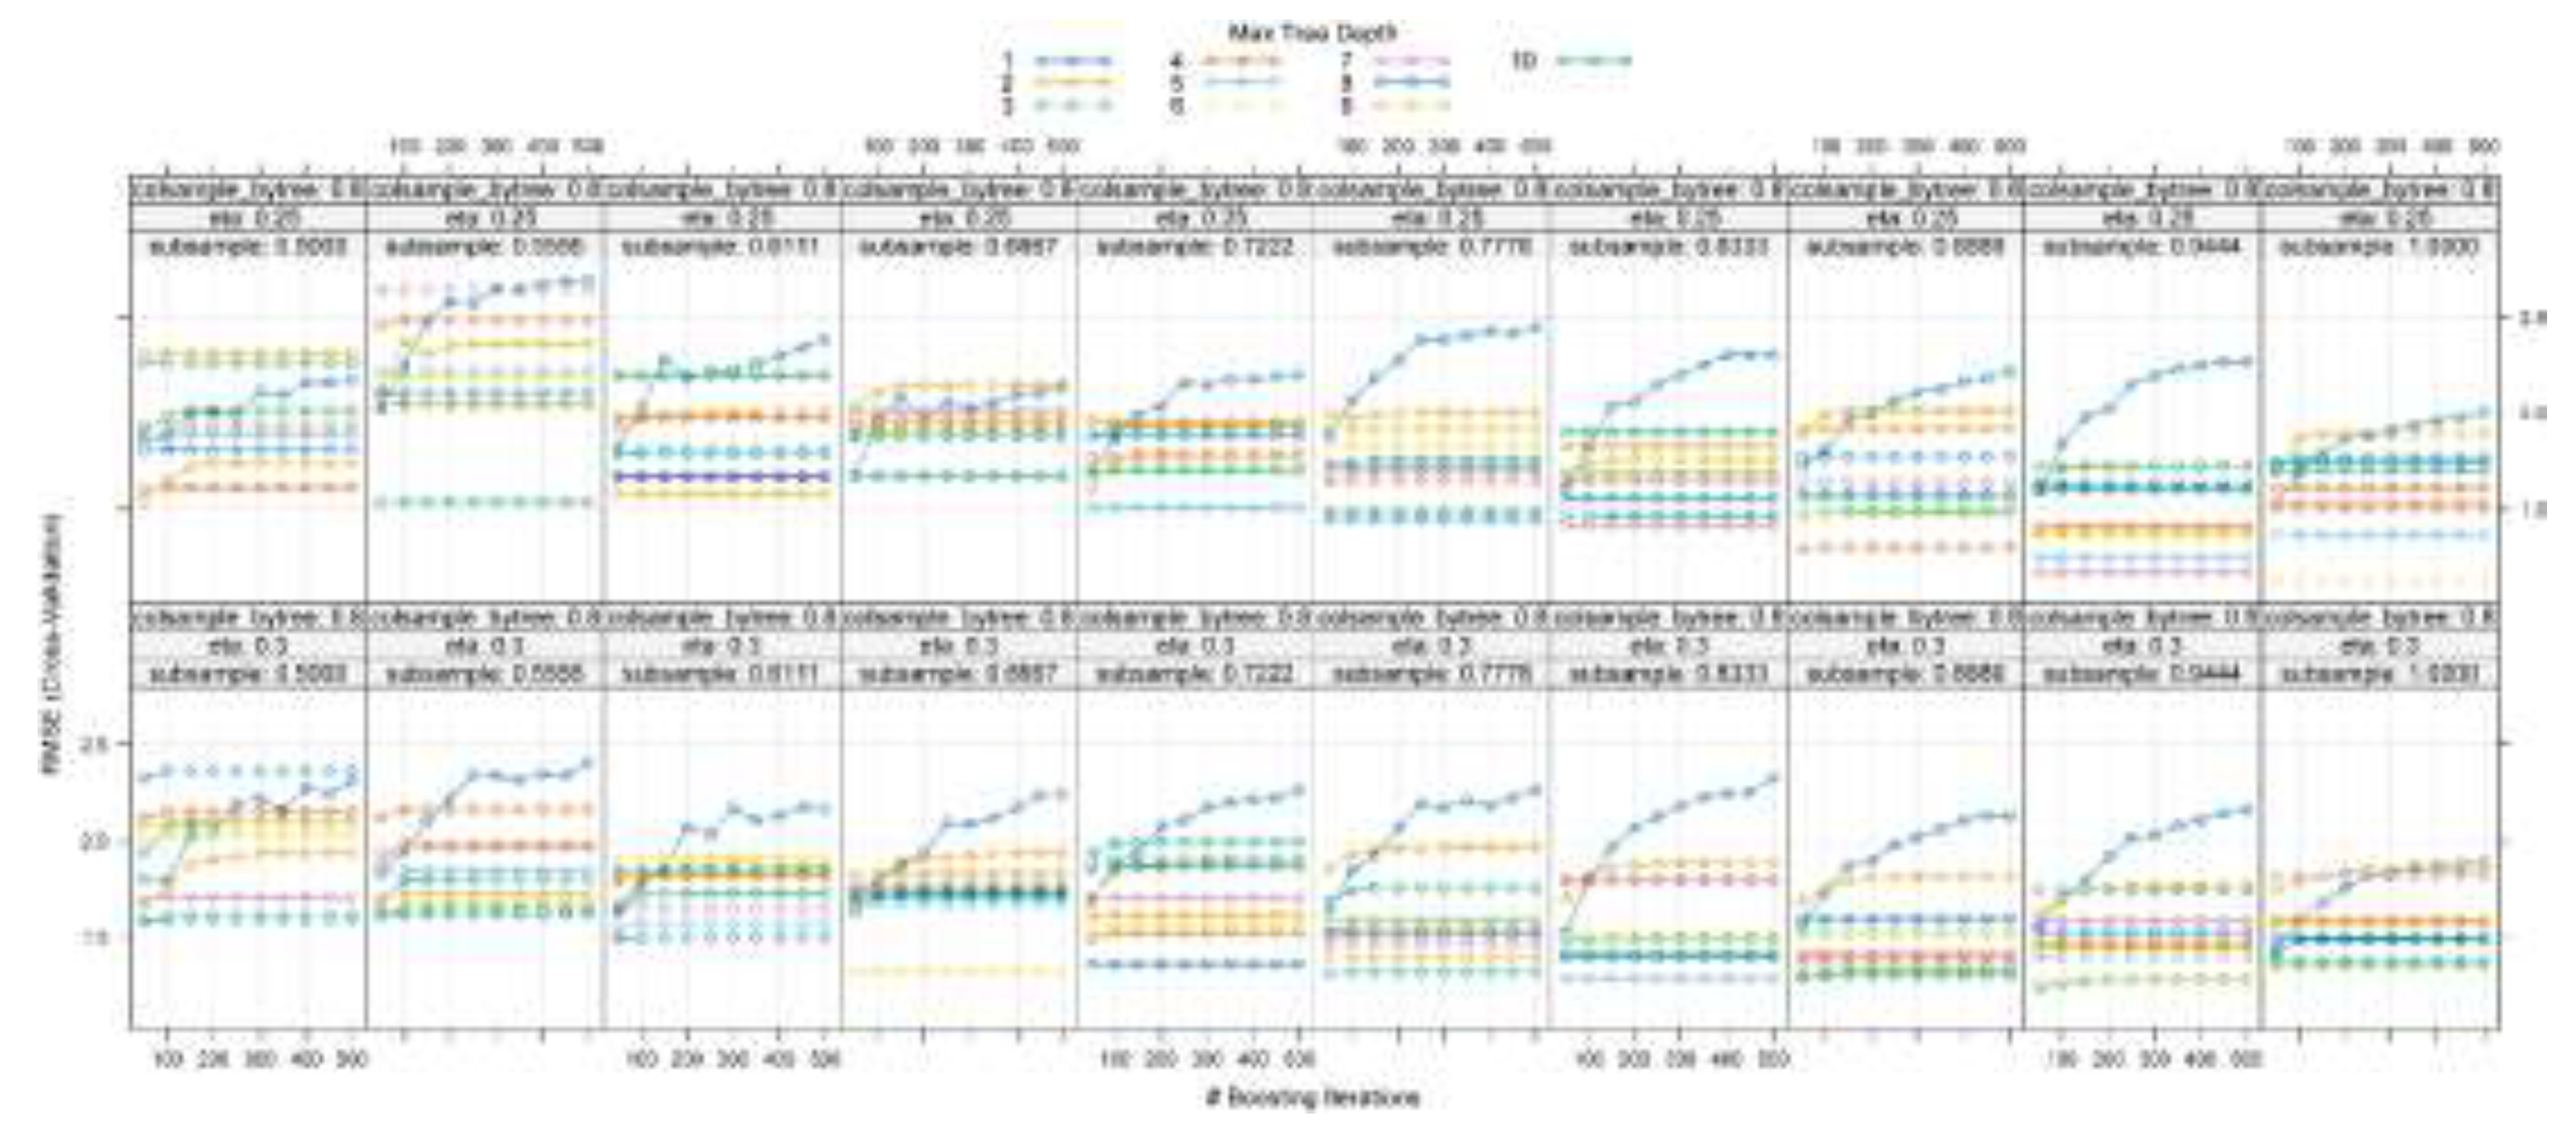
3.6. Learning Curve Analysis for Hyperparameter Optimization

After selecting important features using the random forest model, we trained the XGBoost model with these features to determine the optimal hyperparameters for the model’s generalization performance. We analyzed the learning curves to observe how the model’s error, measured by RMSE, changed with increasing boosting iterations under different settings of eta (learning rate) and subsample (random sampling rate of samples), as shown in Figure 5.
The results shown in Figure 5 indicate that the model, with an eta of 0.25 and a subsample of 1, consistently achieved a low and stable RMSE. This suggests that the model had an appropriate learning rate and effectively utilized the dataset. Additionally, a max tree depth of 6 was found to be effective in maintaining the model’s performance without overfitting, even as the number of iterations increased.
In conclusion, we chose a hyperparameter set that included eta = 0.25, subsample = 1, and max tree depth = 6. The training process was terminated after 500 iterations, as it was found to yield the best validation performance. This particular hyperparameter configuration allowed us to effectively utilize the selected features and capture the intricate relationships within the data, while avoiding overfitting.

3.7. XGBoost Model

After training the XGBoost model with the optimally selected hyperparameters, we assessed the importance of each feature in the model. The model output includes three metrics of feature importance: Gain, Cover, and Frequency. ‘Gain’ represents the average gain of splits that utilize the feature, ‘Cover’ corresponds to the average coverage of splits that utilize the feature, and ‘Frequency’ indicates the proportion of times a feature is used in splits across all trees.
The results, depicted in Figure 6, emphasize that eGFR has the highest gain among the features, implying its significant influence on model predictions. Additionally, liver enzymes ALT and AST, CK, Lymph, and PCT exhibit notable importance, signifying their relevance in the model’s decision-making process. Analyzing these metrics reveals the biological factors that are most predictive of blood drug concentrations based on the trained model (Figure 6).
We trained the XGBoost model with the selected features and hyperparameters, and then evaluated its predictive performance using the validation set. The model’s predictions were assessed using various statistical metrics to measure prediction error and goodness of fit. The mean squared error (MSE) was 1.328, indicating the average squared difference between the observed actual outcomes and the model’s predictions. The root mean squared error (RMSE), which measures error in the same units as the response variable, was 1.152. The mean absolute error (MAE), representing the average absolute difference between observed and predicted values, was 0.717. Additionally, the model achieved an R-squared (R²) value of 0.779, suggesting that approximately 77.9% of the variability in the response variable was explained by the model. As shown in Table 3, these metrics collectively demonstrate a strong predictive performance, with the model accurately forecasting blood drug concentrations.

4. Discussion

N/R has been crucial in treating the SARS-CoV-2019 pandemic. N/R has been administered to adult patients with COVID-19 at risk of severe disease, as well as pediatric patients with moderate to mild disease (≥12 years of age weighing at least 40 kg). Studies have demonstrated that N/R use significantly reduces hospitalization and mortality rates in patients with COVID-19 [5,19,20]. However, N/R is not without flaws, and several studies have revealed that its use may lead to varying degrees of side effects in patients [10,21]. With the advancement of individualized medicine, TDM has emerged as a prominent precision medicine tool. TDM assists clinicians in tailoring dosage adjustments for patients’ medication, maximizing drug efficacy, and minimizing adverse drug reactions by considering individual differences in pharmacokinetics [22,23]. While TDM has been used for clinical monitoring of various drugs, no study has investigated the potential factors influencing N/R blood concentration in different patients using TDM. Therefore, it is promising and highly meaningful for TDM to guide individualized dosing in the clinical study of N/R.
In our baseline data, we observed that patients with a prognosis of worsening or death were significantly older compared to those with an improved or cured prognosis, which aligns with previous findings. Age is a widely recognized risk factor for COVID-19 [24,25]. Older adults exhibit weakened immune systems, making them more vulnerable to viral infections and prone to immune system overactivation caused by chronic inflammation, potentially resulting in pneumonia. Furthermore, compromised organ function and pre-existing chronic conditions in older adults play crucial roles in pneumonia development. The slowing down of the body’s metabolism with increasing age suggests that elderly individuals need regular monitoring of blood levels and adjustment of the therapeutic regimen when using N/R. Additionally, a wide range of laboratory biochemical indicators are considered the main risk factors for the severity and mortality of COVID-19. Our study found significant differences in eGFR, CRP, PCT, Cr, WBC, NE, and Lymph in both groups, which is consistent with the findings of a previous study [24]. Differences in biochemical parameters may be associated with the prognosis of patients. On one hand, they can alter the metabolism and absorption of drugs, and on the other hand, they can influence the response of the immune system. During inflammation, the immune system stimulates a rapid increase in WBC and NE to combat pathogenic bacteria. Additionally, Lymph is massively translocated to the site of inflammation to recognize and destroy virus-infected cells. Elevated levels of CRP and PCT, which are markers of acute inflammation, indicated the presence of severe inflammatory infections in our patients in the group with worsening prognosis or death. While a small percentage of patients on N/R still failed to recover from COVID-19, the majority of patients had a favorable prognosis, indicating the beneficial effects of N/R against COVID-19.
In the study conducted by Cao et al [26], all patients in the nirmatrelvir-ritonavir group achieved sustained clinical recovery. Clinical recovery was defined as the remission of all target symptoms related to COVID-19, with a total score of 0 or 1 for each symptom. Consistent with their findings, our study involved patients who received a maintenance dose of N/R for 3 days. During this period, there was a gradual decrease in clinical symptom scores. On the fifth day, the majority of patients (111 cases) had a total score of less than 2, indicating significant relief from symptoms. We can hypothesize that the extended duration of N/R administration allowed nirmatrelvir to maintain high drug concentrations and sustained efficacy in patients. Despite the initial indication of a relationship between nirmatrelvir and patient outcomes, the logistic regression modeling analysis unexpectedly showed weak correlation between prognostic outcomes and nirmatrelvir blood concentrations. This could be attributed to the older age and presence of severe underlying diseases, including cardiovascular disease (including hypertension), diabetes, and leukemia, among the patients. The poorer prognostic outcome of the patients was likely a result of the underlying disease, causing organ dysfunction, failure, or excessive immunocompromise, unrelated to SARS-CoV-2 infection.
N/R blocks the activity of the SARS-COV-2-3Cl protease, which is necessary for coronavirus replication, to exert its antiviral effect [27,28,29]. After excluding highly correlated individual features, Spearman correlation analyses revealed a high correlation between nirmatrelvir and ritonavir concentrations, indicating that low-dose ritonavir had an effect. Nimatrevir alone may be eliminated by the body due to lack of recognition. The combination of nimaltegravir and ritonavir slows down the metabolism and breakdown of PF-07321332, thereby prolonging its high activity and exerting antiviral effects. The random forest model screened eight important features that affect blood drug concentrations by comparing the training cohort (n = 112) with the validation cohort (n = 27). Interestingly, the most important feature was eGFR, followed by Creatine Kinase, PCT, AST, ALT, Lymph, CYP4, and smoke-drink. Previous studies reported significantly higher Creatine kinase concentrations in deceased patients compared to recovered patients [30]. Creatine kinase is a risk factor for patient severity and mortality [31,32]. In this study, we discovered for the first time that both Creatine kinase and PCT have significant effects on N/R blood concentrations, which is a meaningful finding. During inflammation, cells are destroyed and release creatine kinase into the bloodstream, leading to elevated concentrations. Elevated levels of creatine kinase in the blood indicate substantial damage to existing cells, which affects the absorption of N/R. PCT, which is normally expressed at low levels, is released in large quantities into the bloodstream during infection and is considered an important indicator for assessing the severity of severe infections. In our study, we found that PCT had a significant effect on N/R concentration. The PCT results in the good prognosis group showed mild infection in patients (0.5-2 ng/mL), while in the poor prognosis outcome group, PCT reached 3.12 ± 8.01 ng/mL, indicating severe infection in patients. N/R inhibits the replication of the SARS-CoV-2 virus, but it does not affect established viral loads. In severe cases, where the viral load is high, the inhibition of viral replication alone is limited. Nirmatrelvir is metabolized and eliminated from the body when it fails to exert its antiviral effect. Therefore, the range of PCT significantly affects the concentration of nirmatrelvir and ritonavir. The liver plays a crucial role in drug metabolism, and AST and ALT are commonly used to assess liver damage. Elevated AST and ALT levels indicate impaired liver function, leading to reduced metabolism of N/R and affecting its efficacy. Additionally, omeprazole (CYP-4) may also play a significant role in influencing the concentration of N/R. Omeprazole down-regulates immunoglobulin E (IgE) receptor sites on plasma cell-like dendritic cells, leading to increased production of interferon alpha (INF-alpha) and enhanced antiviral immunity. We hypothesize that this could be attributed to the alteration of immune status by omeprazole, which may affect the cellular metabolism of N/R through immunokines or immune cells. The primary function of lymph is to maintain immune system homeostasis and to identify and eliminate abnormal cells. The quantity of lymph is indicative of the body’s immune function, which can potentially impact cellular behavior and consequently alter N/R blood levels.
This study represents the first application of the XGBoost modeling algorithm to identify the features that influence the concentration of N/R in the blood. Through careful selection of hyperparameters, we optimized the model’s performance in validation, striking a balance between complexity and generalization to mitigate the risk of overfitting. Learning curves played a crucial role in this process, allowing us to iteratively fine-tune the model until we achieved the optimal configuration. The XGBoost model identified six features, namely eGFR, CK, AST, ALT, Lymph, and PCT, as significant predictors of N/R concentration levels in COVID-19 patients. These features were consistent with those identified by the Random Forest model, thereby strengthening the validity of our feature selection process. The identification of these key features highlights the potential physiological and metabolic factors that may impact the response of patients to N/R. Integrating these findings into clinical practice could improve the therapeutic monitoring of N/R, potentially leading to more personalized and effective treatment strategies for COVID-19 patients.
It is important to acknowledge the limitations of the current study. Firstly, we did not continuously monitor N/R blood concentrations using TDM, which may not provide an optimal approach for observing continuous changes in drug concentrations. Secondly, the sample size we utilized was relatively small, and we plan to conduct a larger study to further validate our findings. Additional research is necessary to gain a better understanding of the factors contributing to N/R in COVID-19 patients and to accurately predict patient outcomes.

5. Conclusions

We identified a set of variables through therapeutic drug monitoring (TDM) to influenced N/R exposure levels and developed a new machine-learning model to identify them. These variables offer valuable predictive information about patients’ N/R exposure levels and prognosis. Furthermore, we provide approximate ranges of nirmatrelvir and ritonavir concentrations, which can guide the establishment of standardized ranges for steady-state concentrations. Clinicians can refer to our findings to customize management strategies for patients, while researchers can utilize our findings to develop multivariate prognostic models for enhancing patient prognosis.

Author Contributions

Conceptualization, Jing Fan; methodology, Jing Fan and Jiao Xie; software, Daoming Zhang; validation, Junjie Chen, Weibin Fan and Runcong Zhang; writing—original draft preparation, Yan Wang and Liang Sun; Designed the research protocol, Yuetian Yu, Nengming Lin and Bin Lin; reviewed and revised the final version of the manuscript, Yuetian Yu, Nengming Lin and Bin Lin.

Funding

This research was funded by Huzhou Municipal Science and Technology Bureau, grant number 2023GY60. Zhejiang Provincial Natural Science Foundation, grant number LYQ20H310002. The Clinical Medical Research Special Funds of the Zhejiang Medical, grant number 2022ZYC-Z34. The Hospital Pharmacy Special Research Funding Project of the Zhejiang Pharmaceutical, grant number 2023ZYY46.

Institutional Review Board Statement

The study was conducted in accordance with the Declaration of Helsinki, and approved by the Institutional Ethics Committee of Changxing People's Hospital Ethics Committee (2023-EC-046).

Informed Consent Statement

Informed consent was obtained from all subjects involved in the study.

Data Availability Statement

All relevant data are contained within the article. The original contributions presented in the study were included in the main article. Further inquiries can be directed to the corresponding authors.

Acknowledgments

None

Conflicts of Interest

The authors declare no conflicts of interest.

References

  1. Elsawah, H.K.; Elsokary, M.A.; Abdallah, M.S.; et al. Efficacy and safety of remdesivir in hospitalized covid-19 patients: Systematic review and meta-analysis including network meta-analysis, Rev. Med. Virol. 2021, 31, e2187. [Google Scholar] [CrossRef]
  2. Amani, B.; Khanijahani, A.; Amani, B.; et al. Lopinavir/ritonavir for covid-19: A systematic review and meta-analysis. J. Pharm. Pharm. Sci. 2021, 24, 246–257. [Google Scholar] [CrossRef] [PubMed]
  3. Jayk Bernal, A.; Gomes da Silva, M.M.; Musungaie, D.B.; et al. Molnupiravir for oral treatment of covid-19 in nonhospitalized patients. N. Engl. J. Med. 2022, 386, 509–520. [Google Scholar] [CrossRef] [PubMed]
  4. Burki, T. ; The future of paxlovid for covid-19. Lancet. Respir. Med. 2022, 10, e68. [Google Scholar] [CrossRef] [PubMed]
  5. Amani, B. and Amani, B. Efficacy and safety of nirmatrelvir/ritonavir (paxlovid) for covid-19: A rapid review and meta-analysis. J. Med. Virol. 2023, 95, e28441. [Google Scholar] [CrossRef]
  6. Najjar-Debbiny, R.; Gronich, N.; Weber, G.; et al. Effectiveness of paxlovid in reducing severe coronavirus disease 2019 and mortality in high-risk patients. Clin. Infect. Dis. 2023, 76, e342–e349. [Google Scholar] [CrossRef]
  7. Martens-Lobenhoffer, J.; Böger, C.R.; Kielstein, J.; et al. Simultaneous quantification of nirmatrelvir and ritonavir by lc-ms/ms in patients treated for covid-19. J. Chromatogr. B. Analyt. Technol. Biomed. Life. Sci. 2022, 1212, 123510. [Google Scholar] [CrossRef]
  8. Luo, X.; Zhu, L.J.; Cai, N.F.; et al. Prediction of tacrolimus metabolism and dosage requirements based on cyp3a4 phenotype and cyp3a5(*)3 genotype in chinese renal transplant recipients. Acta. Pharmacol. Sin. 2016, 37, 555–60. [Google Scholar] [CrossRef]
  9. Prikis, M. and Cameron, A. Paxlovid (nirmatelvir/ritonavir) and tacrolimus drug-drug interaction in a kidney transplant patient with sars-2-cov infection: A case report. Transplant. Proc. 2022, 54, 1557–1560. [Google Scholar] [CrossRef]
  10. Lemaitre, F.; Budde, K.; Van Gelder, T.; et al. Therapeutic drug monitoring and dosage adjustments of immunosuppressive drugs when combined with nirmatrelvir/ritonavir in patients with covid-19. Ther. Drug. Monit. 2023, 45, 191–199. [Google Scholar] [CrossRef]
  11. Hashemian, S.M.R.; Sheida, A.; Taghizadieh, M.; et al. Paxlovid (nirmatrelvir/ritonavir): A new approach to covid-19 therapy? Biomed. Pharmacother. 2023, 162, 114367. [Google Scholar] [CrossRef] [PubMed]
  12. Bienvenu, A.L.; Pradat, P.; Plesa, A.; et al. Association between voriconazole exposure and sequential organ failure assessment (sofa) score in critically ill patients. PLoS One. 2021, 16, e0260656. [Google Scholar] [CrossRef] [PubMed]
  13. Bassetti, M.; Garnacho-Montero, J.; Calandra, T.; et al. Intensive care medicine research agenda on invasive fungal infection in critically ill patients. Intensive. Care. Med. 2017, 43, 1225–1238. [Google Scholar] [CrossRef] [PubMed]
  14. Kang, J.S. and Lee, M.H. Overview of therapeutic drug monitoring. Korean. J. Intern. Med. 2009, 24, 1–10. [Google Scholar] [CrossRef]
  15. Papamichael, K.; Afif, W.; Drobne, D.; et al. Therapeutic drug monitoring of biologics in inflammatory bowel disease: Unmet needs and future perspectives. Lancet. Gastroenterol. Hepatol. 2022, 7, 171–185. [Google Scholar] [CrossRef]
  16. Fan, J.; Tang, H.; Wang, Y.; et al. Monitoring Concentration of Nirmatrelvir and Ritonavir by Ultra High Performance Liquid Chromatography-tandem Mass Spectormetry Method. Herald of Medicine. 2024, 43, 190–195. [Google Scholar] [CrossRef]
  17. Obuchowski, N.A. and Bullen, J.A. Receiver operating characteristic (roc) curves: Review of methods with applications in diagnostic medicine. Phys. Med. Biol. 2018, 63, 07tr01. [Google Scholar] [CrossRef]
  18. Toth, R.; Schiffmann, H.; Hube-Magg, C.; et al. Random forest-based modelling to detect biomarkers for prostate cancer progression. Clin. Epigenetics. 2019, 11, 148. [Google Scholar] [CrossRef]
  19. Hammond, J.; Leister-Tebbe, H.; Gardner, A.; et al. Oral nirmatrelvir for high-risk, nonhospitalized adults with covid-19. N. Engl. J. Med. 2022, 386, 1397–1408. [Google Scholar] [CrossRef]
  20. Yip, T.C.; Lui, G.C.; Lai, M.S.; et al. Impact of the use of oral antiviral agents on the risk of hospitalization in community coronavirus disease 2019 patients (covid-19). Clin. Infect. Dis. 2023, 76, e26–e33. [Google Scholar] [CrossRef]
  21. Park, J.J.; Kim, H.; Kim, Y.K.; et al. Effectiveness and adverse events of nirmatrelvir/ritonavir versus molnupiravir for covid-19 in outpatient setting: Multicenter prospective observational study. J. Korean. Med. Sci. 2023, 38, e347. [Google Scholar] [CrossRef] [PubMed]
  22. Fang, Z.; Zhang, H.; Guo, J.; et al. Overview of therapeutic drug monitoring and clinical practice. Talanta. 2024, 266, 124996. [Google Scholar] [CrossRef] [PubMed]
  23. Luong, M.L.; Al-Dabbagh, M.; Groll, A.H.; et al. Utility of voriconazole therapeutic drug monitoring: A meta-analysis. J. Antimicrob. Chemother. 2016, 71, 1786–99. [Google Scholar] [CrossRef] [PubMed]
  24. Gao, Y.D.; Ding, M.; Dong, X.; et al. Risk factors for severe and critically ill covid-19 patients: A review. Allergy. 2021, 76, 428–455. [Google Scholar] [CrossRef]
  25. Zhang, J.J.; Dong, X.; Liu, G.H.; et al. Risk and protective factors for covid-19 morbidity, severity, and mortality. Clin. Rev. Allergy. Immunol. 2023, 64, 90–107. [Google Scholar] [CrossRef] [PubMed]
  26. Cao, Z.; Gao, W.; Bao, H.; et al. Vv116 versus nirmatrelvir-ritonavir for oral treatment of covid-19. N. Engl. J. Med. 2023, 388, 406–417. [Google Scholar] [CrossRef]
  27. Wen, W.; Chen, C.; Tang, J.; et al. Efficacy and safety of three new oral antiviral treatment (molnupiravir, fluvoxamine and paxlovid) for covid-19:a meta-analysis. Ann. Med. 2022, 54, 516–523. [Google Scholar] [CrossRef]
  28. Reina, J. and Iglesias, C. [nirmatrelvir plus ritonavir (paxlovid) a potent sars-cov-2 3clpro protease inhibitor combination]. Rev. Esp. Quimioter. 2022, 35, 236–240. [Google Scholar] [CrossRef]
  29. Eng, H.; Dantonio, A.L.; Kadar, E.P.; et al. Disposition of nirmatrelvir, an orally bioavailable inhibitor of sars-cov-2 3c-like protease, across animals and humans. Drug. Metab. Dispos. 2022, 50, 576–590. [Google Scholar] [CrossRef]
  30. Chen, T.; Wu, D.; Chen, H.; et al. Clinical characteristics of 113 deceased patients with coronavirus disease 2019: Retrospective study. Bmj. 2020, 368, m1091. [Google Scholar] [CrossRef]
  31. Malik, P.; Patel, U.; Mehta, D.; et al. Biomarkers and outcomes of covid-19 hospitalisations: Systematic review and meta-analysis. BMJ. Evid. Based. Med. 2021, 26, 107–108. [Google Scholar] [CrossRef] [PubMed]
  32. Izcovich, A.; Ragusa, M.A.; Tortosa, F.; et al. Correction: Prognostic factors for severity and mortality in patients infected with covid-19: A systematic review. PLoS One. 2022, 17, 0269291. [Google Scholar] [CrossRef] [PubMed]
Figure 1. Changes in clinical symptom score. Blue is the symptom score of all patients on day 1, pink is the symptom score of all patients on day 3, and yellow is the symptom score of all patients on day 5.
Preprints 139994 g001
Figure 2. Correlation matrix between features. (A) Spearman correlation analysis between all features. (B) Spearman correlation analysis after excluding significantly correlated features. Disease represents hypertensive. Blue color indicates positive correlation, red color indicates negative correlation, and dark color indicates stronger correlation. ***p < 0.001.
Preprints 139994 g002
Figure 3. ROC analysis of nirmatrelvir blood concentrations for predicting prognosis.
Preprints 139994 g003
Figure 4. Feature Screening Results. (A) Feature Importance from Random Forest Model. (B). Scatterplot showing linear relationship between characterization and blood drug concentration.
Preprints 139994 g004
Figure 5. Learning Curves for XGBoost Model Hyperparameter Optimization. This figure displays the RMSE on the cross-validation set over 500 boosting iterations for various combinations of eta (learning rate) and subsample (sample random sampling rate) values. Each line corresponds to a different max tree depth, reflecting changes in model performance with increasing complexity.
Preprints 139994 g005
Figure 6. Feature Importance in the Trained XGBoost Model. The stacked bar chart displays the relative importance of each feature according to three metrics: Gain (red), Cover (blue), and Frequency (green). The total height of each bar represents the cumulative importance of each feature.
Preprints 139994 g006
Table 1. Mass spectrometric parameters of analytes and internal standards.
Detected ions Precursor ion Product ion Cone/V Collision/V
Nirmatrelvir 500.20 319.10 10 20
Nirmatrelvir-D9 508.59 328.10 10 20
Ritonavir 721.30 426.10 20 20
13C,2H3- ritonavir 725.30 426.10 20 20
Table 2. Baseline characteristics of the included patients (N = 139).
Variables Level COVID-19 P-value
Group 1 (114), n (%) /
median (IQR)
Group 0 (25), n (%) /
median (IQR)
Sex Male 60 (52.63%) 17 (68%) 0.164
Age year 75 (64 - 83) 81 (73 - 89) 0.009
History of smoking Yes 12(10.53%) 2 (8%) 0.989
No 102 (89.47%) 23 (92%)
History of alcoholism Yes 6 (5.26%) 1 (4%) 1
No 108 (94.74) 24 (96%)
Underlying disease of hypertension Yes 49 (42.98%) 16 (64%) 0.092
No 65 (57.02) 9 (36%)
Department ICU 5 (4.39%) 13 (52%) /
Respiratory and Critical Care Medicine 53(46.49%) 7 (28%) /
Cardiovascular 4 (3.51%) 1 (4%) /
Oncology and hematology 6 (5.26%) 0 (0%) /
Neurology 5 (4.39%) 0 (0%) /
Infectious diseases 11 (9.65%) 0 (0%) /
Nephrology 3 (2.63%) 2 (8%) /
Gastroenterology 1 (0.88) 1 (4%) /
Urological 1 (0.88) 0 (0%) /
Gynecology and obstetrics 1 (0.88) 0 (0%) /
Orthopedic surgery 1 (0.88) 0 (0%) /
Emergency medicine 3 (2.63%) 0 (0%) /
Endocrinology 2 (1.75%) 0 (0%) /
General medicine 13 (11.4%) 1 (4%) /
Rehabilitation medicine 2 (1.75%) 1 (4%) /
Gerontology 2 (1.75%) 0 (0%) /
ALT U/L 23.56 (18.89 - 32.25) 25.46 (9.2 - 36.18) 0.884
AST U/L 23.96 (16.74 - 34.12) 30.73 (16.9 - 44.45) 0.274
eGFR mL/minute 55.92 (43.62 - 69.5) 41.75 (20.33 - 55.92) <0.001
CRP mg/L 31.8 (7.23 - 82.08) 113.1 (33.7 - 140.8) 0.001
PCT ng/mL 0.06 (0.03 - 0.08) 0.65 (0.06 - 2.29) <0.001
ALP U/L 65.9 (54 - 79) 69 (54 - 85) 0.641
GGT U/L 31.30 (19.56 - 49.98) 40.01 (26.93 - 55) 0.329
CK U/L 2.91 (2.1 - 3.5) 2.94 (2.59- 3.93) 0.348
Cr μmol/L 81.1 (64.78 - 101.58) 100.3 (82.2 - 163.3) 0.003
WBC ×109/L 5.56 (4.2 - 8.3) 7.5 (5 - 11.9) 0.037
NE ×109/L 4.25 (3 - 6.9) 6.2 (4.4 - 10.2) 0.013
Lymph ×109/L 0.69 (0.5 - 1.28) 0.6 (0.3 - 0.8) 0.004
Note: Creatinine: Cr, C-reactionprotein: CRP, White blood cell: WBC, Neutrophil: NE, Lymphocyte: lymph, Procalcitonin: PCT. Group 1: Patients had an improved prognosis or were cured. Group 0: Patients had a worsening prognosis or died.
Disclaimer/Publisher’s Note: The statements, opinions and data contained in all publications are solely those of the individual author(s) and contributor(s) and not of MDPI and/or the editor(s). MDPI and/or the editor(s) disclaim responsibility for any injury to people or property resulting from any ideas, methods, instructions or products referred to in the content.
Copyright: This open access article is published under a Creative Commons CC BY 4.0 license, which permit the free download, distribution, and reuse, provided that the author and preprint are cited in any reuse.
Prerpints.org logo

Preprints.org is a free preprint server supported by MDPI in Basel, Switzerland.

Subscribe

Disclaimer

Terms of Use

Privacy Policy

Privacy Settings

© 2025 MDPI (Basel, Switzerland) unless otherwise stated