Submitted:
04 February 2026
Posted:
05 February 2026
You are already at the latest version
Abstract
The current research demonstrates boundaries of waste red seaweed furcellaran (FUR) for development of thermoplastically processable thermoplastic starch (TPS) compositions. Three different FUR concentrations (10, 30 and 50 wt.%) in relation to potato starch replacement were examined for their thermoplastic processability. Thermogravimetric (TGA), differential scanning calorimetry (DSC), rheology and tensile mechanical tests were performed to assess performance of the developed TPS/FUR compositions. It was observed that the highest mechanical stress at break (almost 3 times higher than for neat TPS) is observed for TPS+50wt.% FUR composition, however, on the account of decreased deformability (only ca 10%), reduced thermal resistance at processing temperatures (150oC) as well as high shear sensitivity. Thus compositions TPS+30wt.% FUR and especially TPS+10wt.% FUR are more suitable for thermoplastic processing and development of TPS based composites with improved exploitation properties.
Keywords:
furcellaran
; thermoplastic starch
; composite
1. Introduction
Algae are a polyphyletic assembly of main photosynthetic life forms, most usually in water bodies, which vary between microscopic single celled types to multicellular seaweeds [1]. The organisms have critical functions in terrestrial and marine biogeochemical working, and are estimated to generate half or more of the photosynthetic capacity of the world and they form the foundation of aquatic food webs [2]. Algae do not have true roots, stems, and leaves as in higher plant (thallus character), but assume a simple filamentous form or a complex parenchymatous one. There is more to the algae contribution to ecology than just primary production [3]. They also involve themselves in nitrogen fixation, play a major role in sediment formation and give important habitat structures in the sea. The possibility of using them in the production of biofuels, nutraceuticals and carbon sequestration technology is confirmed by the recent development in biotechnology, considering that they can grow with rapid rates ranging between doubling themselves within 24 hours under optimum conditions [4].
Marine macroalgae species may be classified within 3 main groups, including green algae Chlorophyta, red algae Rhodophyta and brown algae Phaeophyceae. From them, F. lumbricalis, one of the red algae species, is abundant in the Baltic Sea area, being a vital source of furcellaran, a sulfated polysaccharide with a chemical structure similar to carrageenans. In addition to furcellaran, ensuring good gelling properties, F. lumbricalis contains 10–15% cellulose, 5–10% proteins, and 15–25% minerals (primarily K⁺ and Ca²⁺) [5], thus being potential candidate for development of new multifunctional biobased materials, including bioplastics.
In its turn, development of biodegradable bioplastics share (presently less then 0.5% [6]) within global plastics market may be considered as one of the ways for sustainable development by reducing the necessity for consumption of fossil resource and decreasing the rate of generation of solid waste. Unfortunately, many of commercially produced bio-based plastics, still are obtained by partly using fossil resources. Besides it, synthesis of bioplastics is consuming natural resources, which otherwise could be used for production of food. In the light of growing population, increasing pollution and decreasing suitable space for arable land, competition between bioplastics production and crop growing for food production is not sustaineble. Although there are some examples of commercially produced microbial bioplastics, such as polyhydroxyalcanoates [7], their competivity with fossil based plastics is considerably reduced due to their high synthesis costs and reduced exploitation properties.
Consequently, recently large attention is paid for development of bioplastics from waste resources, e.g., fruit peels, plant seeds, leaves, food processing industry wastewater, aquafarming etc. [8,9,10], which could lead to new almost totally biodegradable waste based materials, not competeing with food production.
To enhance functionality and use areas of such materials, a common approach is development of blends or composites, allowing obtaining new materials with unique spectrum of properties, not characteristic to it individual components. There is a great variety of natural materials, which could be obtained from bio-degradable waste resources, on the one hand, and be helpful in increasing technological and/or exploitation properties of some other base matrix, on the other hand. To mention only some of the numereous examples, furcellaran, extracted from waste seaweed, scrapped in shoreline due to sea-water exchange, may be used as thickener in food industry, adhesive agent or rigid filler for composites. Unfortunately, waste seaweed presently is seldom utilized in such a sustainable way, mainly being disposed in landfill. For an example seaside of Liepāja in 2022 was polluted with 9300 m³ of algal biomass requiring 45 792 EUR for cleaning works.
This led to our idea of using waste red seaweed F. Lumbricalis for development of new furcellaran containing bioplastic composites. By considering that, presently there is almost no research done for transformation of furcellaran into totally biobased thermoplastics, our aim was assessment of the addition of the waste red seaweed extracted furcellaran on the properties of the thermoplastic starch, obtained from local potatoe resources.
2. Materials and Methods
Potato starch from SIA Aloia Starkelsen was used. According to Almonaityte, K., et al [11] the starch contained 21-23 wt% of amylose, 77-79 wt% of amylopectin, and has intrinsic viscosity of 0.39 l/g and molecular weight of 103-104 kDa. Commercial glycerol and distilled water were used as plasticizers and rheology modifiers.
Furcellaran (FUR) was obtained from Est-Agar AS. According to the manufacturer, commercial carrageenan consisted of beige to brownish yellow powder with greyish shade, a neutral taste and odor. It is expected to be soluble in hot water, insoluble in alcohol for a 1.5% dilution. Loss on drying ≤12%. Particle size at least 95% < 150 μm.
To obtain neat plasticized starch the dried potato starch was manually mixed with glycerol and distilled water with a specific ratio by weight (5:3.3:2). In the case of FUR containing systems (10 wt.%, 30wt.% and 50wt.% in respect to the starch replacement amount) it was, however, necessary, to increase water amount yielding the ratio between starch, glycerol and water as 5 : 3.3 : 5, respectively. After this initial pre-mixing step, the vessel with the prepared pre-mixture was placed in the Bandelin ultrasonic bath and was further processed by using ultrasound until beginning of gelation at ca 80oC. After sonification the dough-like mass of the plasticized starch or its blend with FUR was processed by using LabTech Engineering two-roll mills LRM-S-110/3E at the friction 1.25 and the roll temperatures of 140oC and 135 oC. The well-mixed thermoplastic starch (TPS) composite was carefully placed into the frame mould of the LabTech Engineering hydraulic press LP-S-50/S.ASTM to obtain plates with lateral dimensions of 10 cm x 10 cm. Thickness of the plates was 0.5 mm for obtaining of tensile test specimens and 1 mm for obtaining test specimens for rheology tests. The compression moulding was carried out at a temperature of 140 °C for a duration of 3 minutes. The samples were stored in a desiccator with freshly pre-heated CaCl2 to avoid absorbing moisture from the environment until the tests were performed.
Tensile properties of neat TPS and its composites with FUR were tested using Tinius Olsen Universal Testing Machine H25K (ST25) equipped with 5 kN Z-type load cell. Initial grip to grip distance was 40 mm, whereas gage length was 30 mm. Testing speed was 50 mm/min. Testing was performed at 25oC and 50% RH. Five dumbbell test specimens (type 5B according to LVS EN ISO 527), cut from the compression moulded plates, were tested.
Rheological properties of neat TPS and its composites with FUR were examined using Anton Paar SmartPave 102 DSR rheometer in plate-plate configuration. The plate diameter was 25 mm and the gap size was 1 mm. Testing temperature was 150oC. Disc shaped test specimens were cut from the compression moulded plates. Initially the measurements were performed by changing shear strain amplitude at oscillation rate equal to 1Hz, to determine linear viscoelasticity region (LVER). At the determined shear strain, frequency scan tests were performed. After the frequency scan test, LVER test was repeated to evaluate complex viscosity change due to thermal ageing of the test specimen. Besides it, flow curves were measured over the shear rate range 0.01-100 s-1. All the measurements were made in duplicate.
Differential scanning calorimetry (DSC) of neat TPS and its composites with FUR was performed using Mettler Toledo DSC-3+ apparatus. Typical sample size for the measurements was ca 10 mg. The DSC test was performed in an inert atmosphere under N2 flow rate of 50 ml/min. To remove thermal pre-history test specimens were heated from -90oC to 200oC with heating rate 10oC/min., followed by holding at 200oC for 5 min., cooling back to -90oC with the same rate of 10oC/min. and holding at -90oC for 5 min., then finished by second heating up to 200oC, maintaining the same rate.
Thermogravimetric analysis (TGA) of neat TPS and its composites with FUR was performed using Mettler Toledo TGA/DSC3+ apparatus. Typical sample size for the measurements was ca 10 mg. The TGA test was performed in an oxidative atmosphere under air flow rate of 50 ml/min. The heating was performed from 25oC up to 800oC with heating rate of 10 oC.
3. Results
3.1. Thermogravimetric Analysis
Thermal stability of raw materials for production of TPS and FUR, as well as the investigated TPS/FUR compositions is characterized by TGA thermograms, shown in Figure 1.
It is clearly seen that raw potato starch, waste red seaweed and especially from the red seaweed extracted FUR are sensitive to temperature. Remarkable exotermic effect of FUR is observed close to 150oC, which therefore should be considered as maximum recommendable thermoplastic processing temperature of TPS/FUR compositions. Higher thermal stability of seaweed in comparison to is FUR is due to the presence of thermally more resistant components, e.g., cellulose (typically 10–15%), proteins (5–10%), and minerals (primarily K⁺ and Ca²⁺) 15–25% [5]. By examining the effect of FUR on the the thermal stability of TPS, complicated multistep (at least 4 clearly distinguishable steps) thermodegaradation pattern is observed. The first thermodegradation step, observed from 25oC – 200oC, is eviently related to evaporation of water and other low molecular compounds. In this temperature range, weight loss of the compositions increases by increasing the FUR content. The next thermodegradation step occuring within 200-320 oC, is related to decomposition of starch moieties, while the height of the second step increases by increasing the TPS concentration in the TPS/FUR compositions. Meantimes, this degradation step is influenced also by presence of FUR, while TGA curve within this temperature region is shifted towards the direction of FUR decomposition thermogram, i.e., in the presence of FUR itself as well as by rising its content, thermal decomposition begins earlier. Degradation within this temperature region is influenced also by the presence of glycerol plasticiser. Due to the largest TPS content in TPS+10%FUR, this composition within 200-320 oC degradates to the greates extent; as a result at 320oC the highest remaining mass is for compositions with higest FUR content, namely, TPS+10%FUR. Next thermal degradation step within 320-500oC, is mainly because of FUR degradation. During the last mass loss step within 500-620oC thermodegradation of oxidation products, developed within previous mass loss steps, occurs. Interestingly that at the end of thermogravimetric test, the highest remaining mass is observed for TPS composition with 50% FUR, denoting to the dominat role of FUR in fomation of combustible gas impermeable char layer during the carbonisation process. This may denote to possible improvemet of flame retardancy of the compositions containing FUR.
3.2. Differential Scanning Calorimetry
DSC thermograms of TPS and its compositions with FUR collected from 1st and 2nd heating runs as well as cooling run are demonstrated in Figure 2.
The large endotheric peak, observed in the 1st run thermogram of TPS, denote to the presence of considerable amount of water. Concomitant, broad endothermic effect is also observed for the composition containing the greatest amount of FUR (50 wt.%). Consequently this broad enothermic effect is most probably related to the presence of FUR and may denote to evaporation of different low molecular compounds, including water. In all the thermograms low-temperature transition temperature TLT , as reported also by other authors [12], is clearly visible, shifting to the direction of higher temperatures by increasing FUR content: -72oC for TPS, -56oC for TPS+10%FUR and -52oC for the TPS compositions with 30 and 50wt.% FUR. This may denote to certain interaction between TPS and FUR, most probably due to the development of H bonding. Although glass transition temperature Tg of neat TPS in the 1st run thermograms is masked with endothermic peak of water, it is clearly visible around 46oC for TPS+50%FUR. The fact that Tg of starch is not visible for the compositions with lower FUR content, may denote that the compositions with 10 and 30 wt.% of FUR have better compatibility with TPS matrix, while it is well known that Tg of the individual components of polymer blend tend to approach each other and even merge due to increasing compatibility. However, it should be also noted that Tg from the 1st run thermograms may not be visible due to rather low heating rate, while it has been previously determined that, if temperature change rate is lower than 50 °C/min, it may disturb observation of Tg, especially with lower water contents [13]. From the cooling thermograms it is visible that large endothermic effect is observed for the composition with the highest FUR wt. content, denoting that partial degradation of the material occurs. At lower FUR contents, no endothermic effects are observed testifying about larger thermal stability of these compositions. From cooling runs 2 thermal transition regions may be observed, evidently related to Tg and TLT, especially in the case of TPS+50%FUR. The 2nd heating run thermograms, in general, confirm the above observed effects. Namely TLT is increased and becomes more visible by rising FUR content. Meanwhile, in comparison to the 1st heating run tests, TLT observed from the 2nd heating run experiments is higher to some extent, namely, -10oC for TPS+50%FUR, -20oC for TPS+30%FUR and -25oC for TPS+10%FUR. Concomitant, Tg of TPS is not observed most probably due to too low temperature change rate (10oC/min.). In general, DSC tests confirm, that TPS+50%FUR composition may be the least suitable for thermal processing due to its lowest thermal stability.
3.3. Rheological Properties
Complex viscosity η* - strain amplitude sweep relationships of TPS/FUR compositions before and after frequency scan test are shown in Figure 3, revealing that for all of the compositions linear viscoelasticity region LVER is below 1% of shear strain, which was selected for further frequency scan tests. As it is demonstrated in Fig.2, by increasing FUR concentration, initial η* of the investigated compsitions decreases; however, if the content of FUR is increased from 10 wt.% to 30 wt.%, the decrease in η* is insignificant, in opposite to considerable η* drop, if FUR content is increased from 30 wt.% to 50 wt.%. It also important to mention that by increasing FUR content, η* drop of the TPS/FUR increases with rising shear strain, especially by changing FUR content from 30 wt.% to 50 wt.%, denoting to increased shear sensitivity of the composition. After frequency scan tests η* of the compositions has dropped due to material ageing during the test, however, the η* drop greatly differs: if for TPS+10%FUR there is insignificant η* change, showing some deviation generally beyond LVER, for TPS+30%FUR and TPS+50%FUR significant differences are observed within the whole shear strain range. This denotes to relatively low η* stability of TPS+30%FUR and especially TPS+50%FUR at high shear strains, making the latter two less suitable for thermoplastic processing.
Results of frequency scan tests of TPS/FUR compositions in oscillation and rotation modes is demonstrated in Figure 4. As expected, viscosity, measured both in oscilliation and rotation modes, decrease with increasing shear rate, whereas the highest viscosity values are observed for neat TPS as well as its composition with 10 wt.% of FUR followed by the compositions with 30 wt.% of FUR and 50 wt.% of FUR. The higher viscosity values of TPS+10%FUR most probably are explained with better intermolecular interaction between TPS and FUR, whereas at higher FUR concentration due to increased intermolecular interactions between FUR chains itselves, partly prevent binding between TPS and FUR.
3.4. Tensile Properties
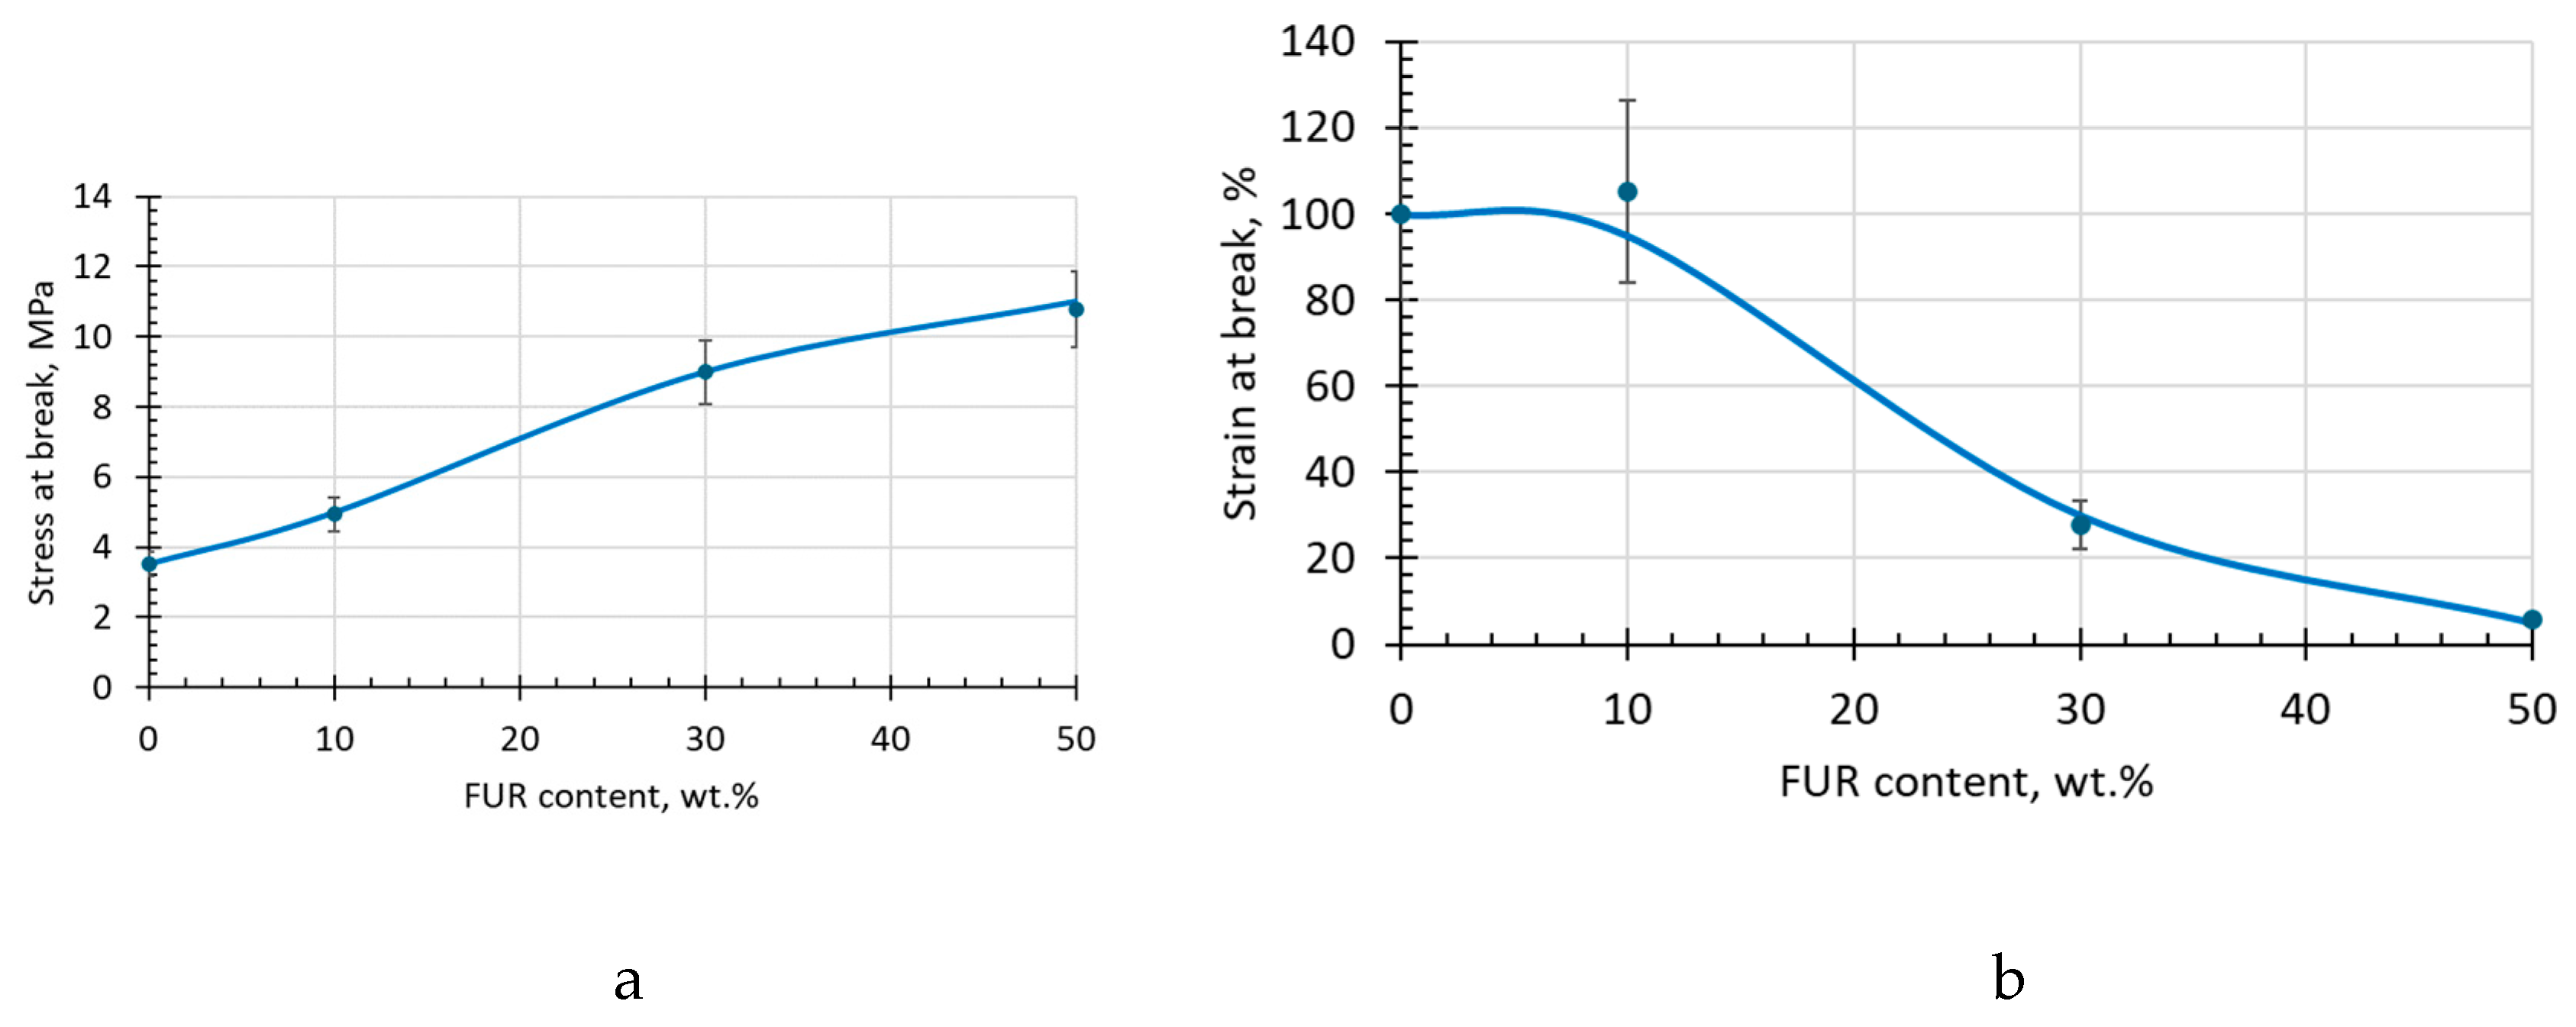
The effect of FUR on the ultimate stress-strain characteristics of TPS/FUR composites is depicted in Figure 5 and reveals, that by increasing the FUR content until 50% the stress at break σb is increased almost 3 times, however, accompanied with considerable drop strain at break εb. Interesting, that the TPS composition with 10wt.% FUR maintains almost the same εb as the matrix; meanwhile σb of this composition is ca 20% larger than that for neat TPS. By increasing FUR content above 10 wt.% leads to considerable decrement of εb until ca 25-30%. At this level, however, σb of the composition reaches almost 10 MPa, which is more than 2 times higher than for neat TPS matrix. By increasing FUR concentration even more, rate of σb rise and in εb decrese is diminishing. Such changes most probably are related to formation of intermolecular H bonds between plasticised starch and FUR at elevated temperatures (ca 80oC) during the first manufacturing stage of the investigated compositions. As may be concluded from Figure 5, in respects to mechanical properties, 10-30 wt.% of FUR in TPS could be suggested as most preferable choice.
4. Conclusions
Results of the current research on waste red seaweed extracted furcellaran F. Lumbricalis FUR use possibilities for obtaining thermoplastic starch (TPS) based biodegradable and biobased composites allows conclude on following. For the first time is possible to obtain thermoplastically processable TPS based compositions with FUR concentration up to 50 wt.% by using ultrasound assisted two-step manufacturing approach due to development of inter and intramolecular network (thermally induced development of cross-links within FUR phase itself, as well as intermolecular intearction between FUR and TPS in the boundary area). Because of both of these intaercations highest stress at break is observed for TPS composition with 50 wt.% of FUR (up to 12 MPa, which is almost 3 times higher than for neat TPS matrix), however, on the account of considerably decreased strain at break (ca 10%); meanwhile the TPS composition with 10 wt.% FUR maintained almost the same ultimate deformation as TPS, but showed 1.4 times larger strength at break ( 5 MPa). Addition of 10 wt.% of FUR practically left practically no influence on melt viscosity of the TPS/FUR compositions, meanwhiles, showing smallest viscosity dependance on shear rate, whereas at the highest FUR content (50 wt.%) largest viscosity dependance on shear rate was observed, indirectly denoting to the lowest intermolecular interaction between the components, even if intramolecular network developed within FUR phase may be the strongest. TPS+50% FUR composition demonstrated the least thermal stability at the maximum suggestable processing temperature (150oC) due to the highest content of thermally less resistant FUR phase as it was confirmed by TGA measurements as well as the lowest compatibility between TPA and FUR phase as observed by DSC tests. TPS+30%FUR and especially TPS+10%FUR compositions demonstrated higher thermal resistance as well as more stable melt processing behaviour (smaller time and shear rate dependant viscosity change), allowing to suggest these compositions as more suitable for thermoplastic processing.
Author Contributions
Conceptualization, R.M.M., J.Z., K.B. and U.Z.; methodology, P.P.J., I.B., J.B., Z.E.R., R.B., A.B., T.I., R.R.; investigation, P.P.J., I.B., J.B., Z.E.R., R.B., A.B., R.R.; data curation, T.I.; writing—original draft preparation, R.M.M.; writing—review and editing, R.M.M., K.B.; supervision, R.M.M., K.B.; project administration, K.B.; funding acquisition, R.M.M., J.Z., K.B., U.Z. All authors have read and agreed to the published version of the manuscript.
Funding
This work has been supported by research and development grant No RTU-PA-2024/1-0048 under the EU Recovery and Resilience Facility funded project No. 5.2.1.1.i.0/2/24/I/CFLA/003 “Implementation of consolidation and management changes at Riga Technical University, Liepaja University, Rezekne Academy of Technology, Latvian Maritime Academy and Liepaja Maritime College for the progress towards excellence in higher education, science, and innovation”.
Data Availability Statement
The raw data supporting the conclusions of this article will be made available by the authors on request.
Conflicts of Interest
The authors declare no conflicts of interest.
References
- Cook, M.E.; Graham, L.E. Chlorokybophyceae, Klebsormidiophyceae, Coleochaetophyceae. In Handbook of the Protists; Springer, 2016; pp. 1–20. [Google Scholar]
- Lee, R.E. Phycology; Cambridge university press, 2018. [Google Scholar]
- Lobban, C.S.; Harrison, P.J. Seaweed ecology and physiology; Cambridge University Press, 1994. [Google Scholar]
- Chisti, Y. Biodiesel from microalgae. Biotechnology advances 2007, 25(3), 294–306. [Google Scholar] [CrossRef] [PubMed]
- Zgrundo, A. and I. Złoch, Gone and Back—The Anthropogenic History of Coccotylus brodiei (Turner) Kutzing and Furcellaria lumbricalis (Hudson) JV Lamouroux in the Gulf of Gdańsk (Southern Baltic Sea). Water 2022, 14(14), 2181. [CrossRef]
- Global bio-based plastics production capacity. Available online: https://www.eea.europa.eu/en/circularity/sectoral-modules/plastics/global-bio-based-plastics-production-capacity (accessed on 22.01.2026).
- Sangtani, R.; Nogueira, R.; Yadav, A.K.; et al. Systematizing Microbial Bioplastic Production for Developing Sustainable Bioeconomy: Metabolic Nexus Modeling, Economic and Environmental Technologies Assessment. J Polym Environ 2023, 31, 2741–2760. [Google Scholar] [CrossRef] [PubMed]
- Ahmed, M, Md; Bin Nabi, H, Md; Mia, S, Md; Ahmad, I; Zzaman, W. Valorization of plant-based agro-waste into sustainable food packaging materials: Current approaches and functional applications. Applied Food Research 2025, 101368, 1–23. [Google Scholar] [CrossRef]
- Gautam, S.; Bora, B.; Dutta, D.; Tripathi, A.D.; Srivastava, J.; Thatoi, H.N.; Srivastava, S.K.; Khade, S.M.; Geed, S.R. Integrated biorefinery approaches for the sustainable valorization of agricultural residues into biofuels, bioplastics, and bioactive compounds. Sustainable Chemistry for Climate Action 2026, 8, 100173. [Google Scholar] [CrossRef]
- Dissanayake, Kasun Kumara; Kurniawan, Tonni Agustiono; Sarangi, Prakash Kumar; AlSultan, G. Abdulkareem; Goh, Hui Hwang; Wong, Hin Yong; Onn, Choo Wou; Tharikulislam, Mohamed; Aziz, Faisal; Othman, Mohd Hafiz Dzarfan; Anouzla, Abdelkader; Ali, Imran; Khan, M. Imran; Zhang, Dongdong. Upcycling marine food waste into biodegradable food packaging: A sustainable approach toward zero-waste society and biocircular economy. Biomass and Bioenergy 2026, 208, 108837. [Google Scholar] [CrossRef]
- Almonaityte, K. Structure and properties of cationic starches synthesized by using 3-chloro-2-hydroxypropyltrimethylammonium chloride. International Journal of Biological Macromolecules 2020. 164, 2010–2017. [Google Scholar] [CrossRef] [PubMed]
- Wang, 12 Hong-Yuan; Huang, Ming-Fu. Preparation, characterization and performances of biodegradable thermoplastic starch. Polym. Adv. Technol. 2007, 18, 910–915. [Google Scholar] [CrossRef]
- Liu, Peng; Yu, Long; Liu, Hongsheng; Chen, Ling; Li, Lin. Glass transition temperature of starch studied by a high-speed DSC. Carbohydrate Polymers 2009, 77(2), 250–253. [Google Scholar] [CrossRef]
Figure 1.
Thermogravimetric analysis curves of waste seaweed, FUR, TPS and its composites with FUR.
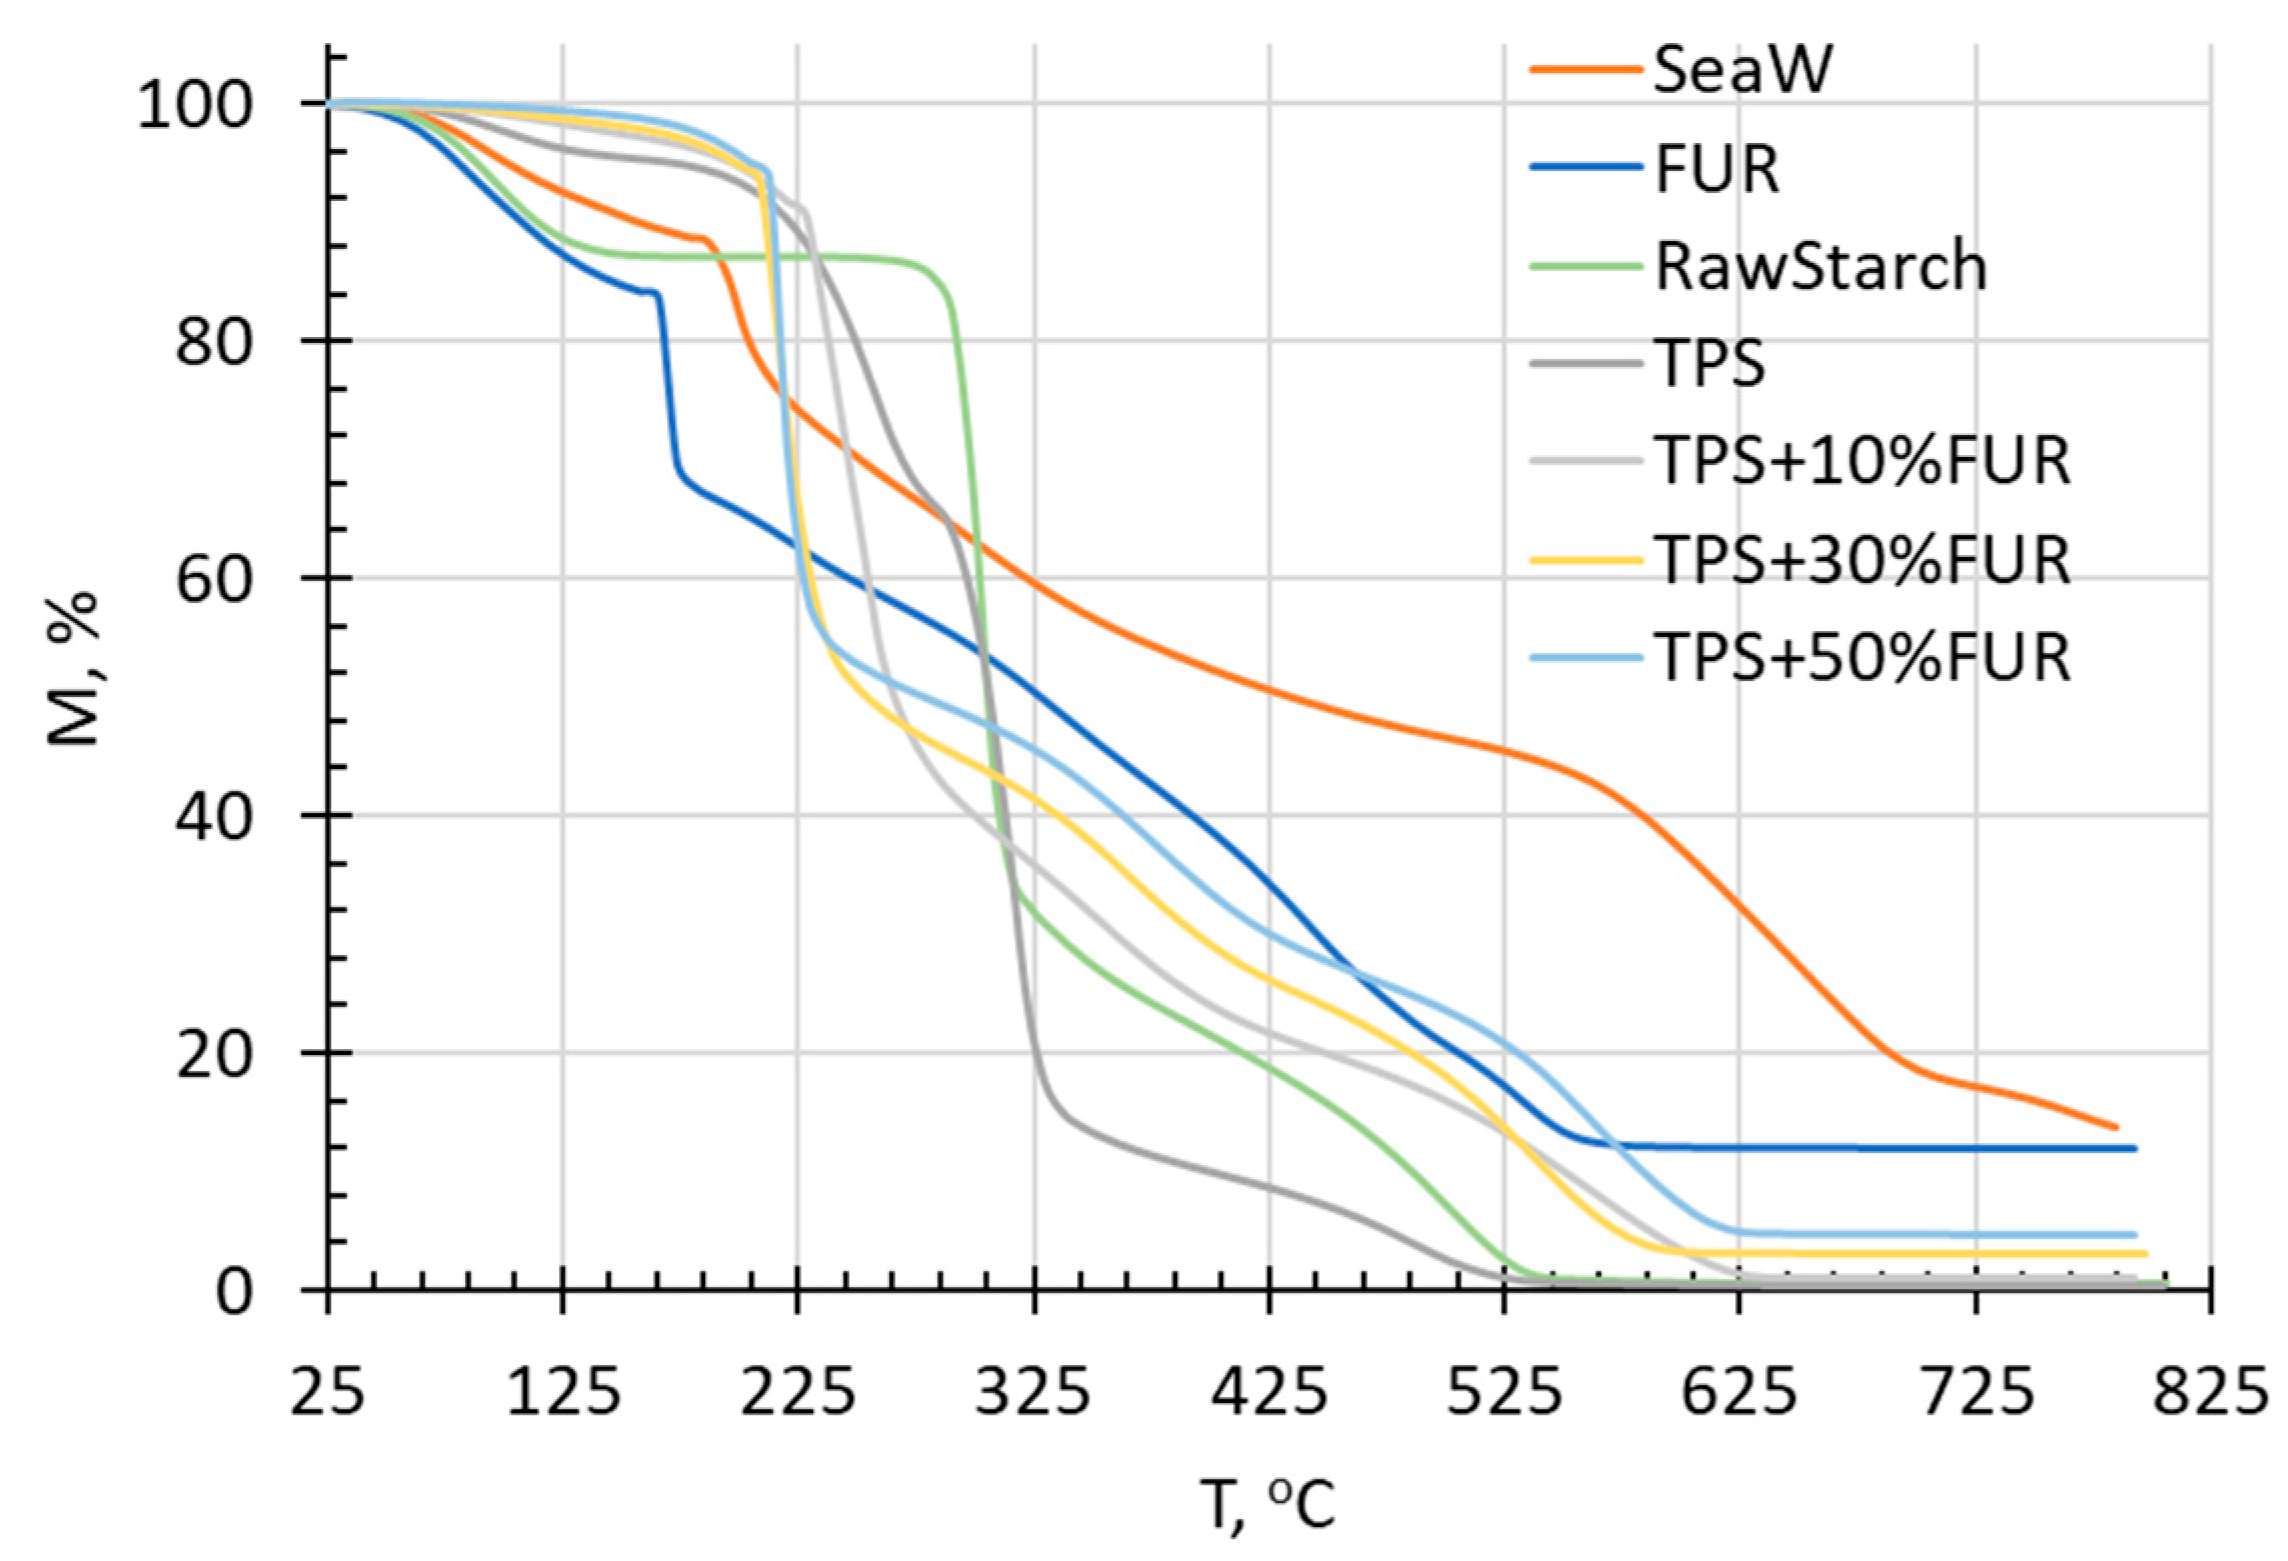
Figure 2.
DSC thermograms of waste seaweed, FUR, TPS and its composites with FUR: a) thermograms from 1st heating run; b) thermograms from cooling run; c) thermograms from 2nd heating run. .
Figure 2.
DSC thermograms of waste seaweed, FUR, TPS and its composites with FUR: a) thermograms from 1st heating run; b) thermograms from cooling run; c) thermograms from 2nd heating run. .
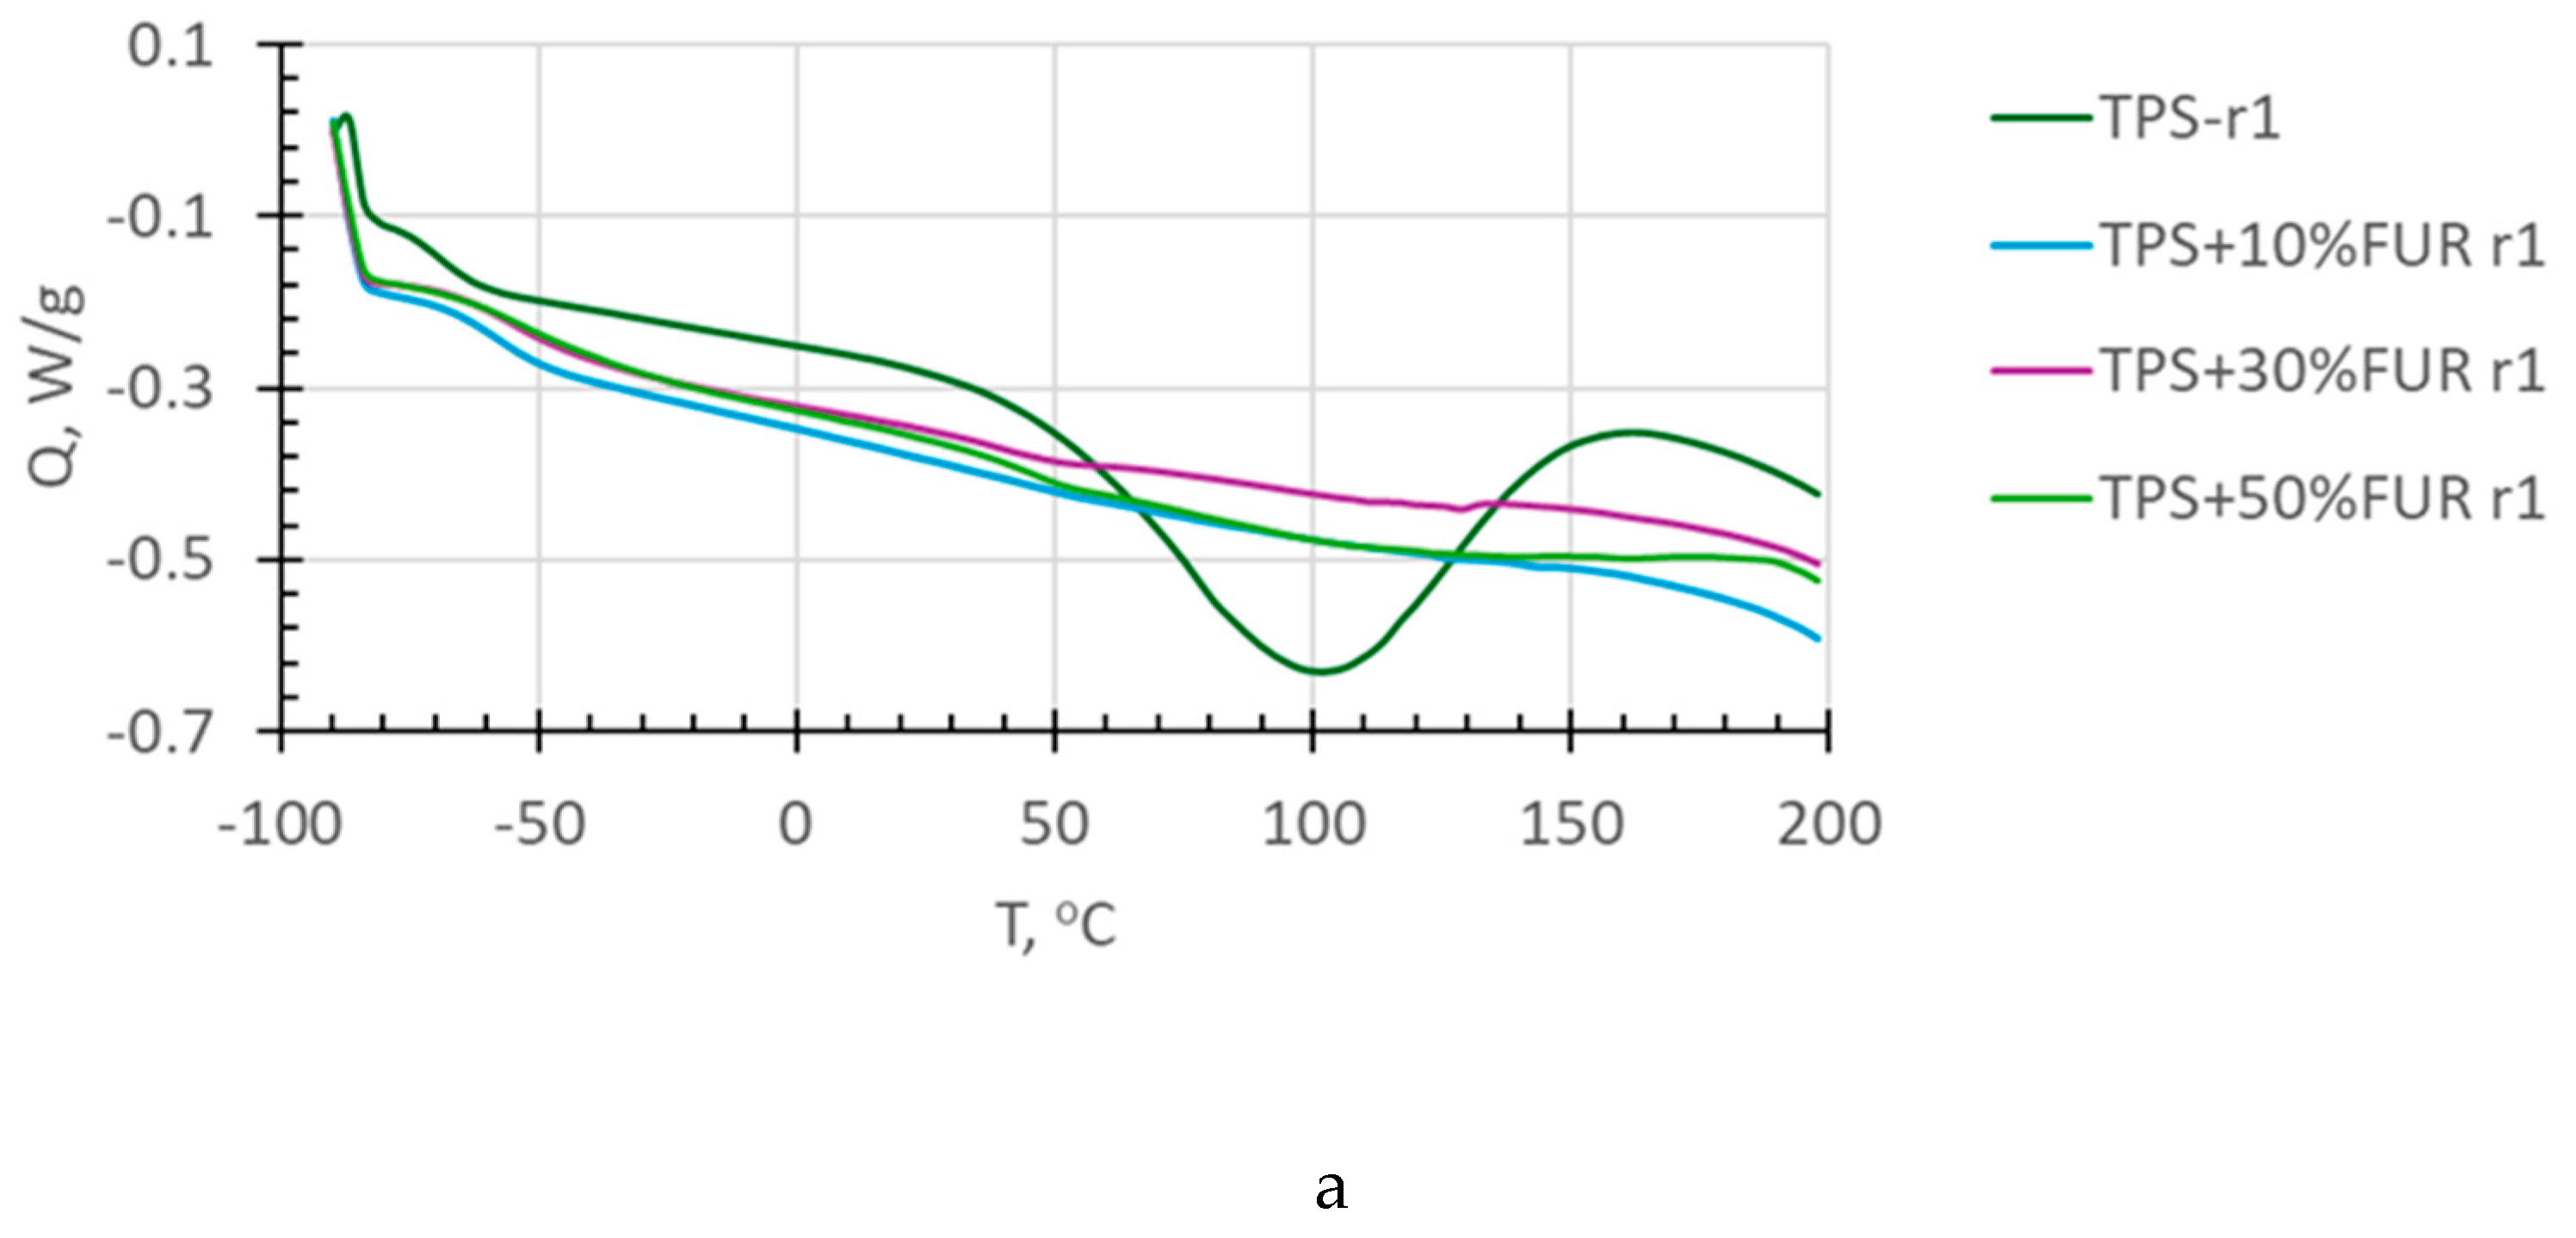
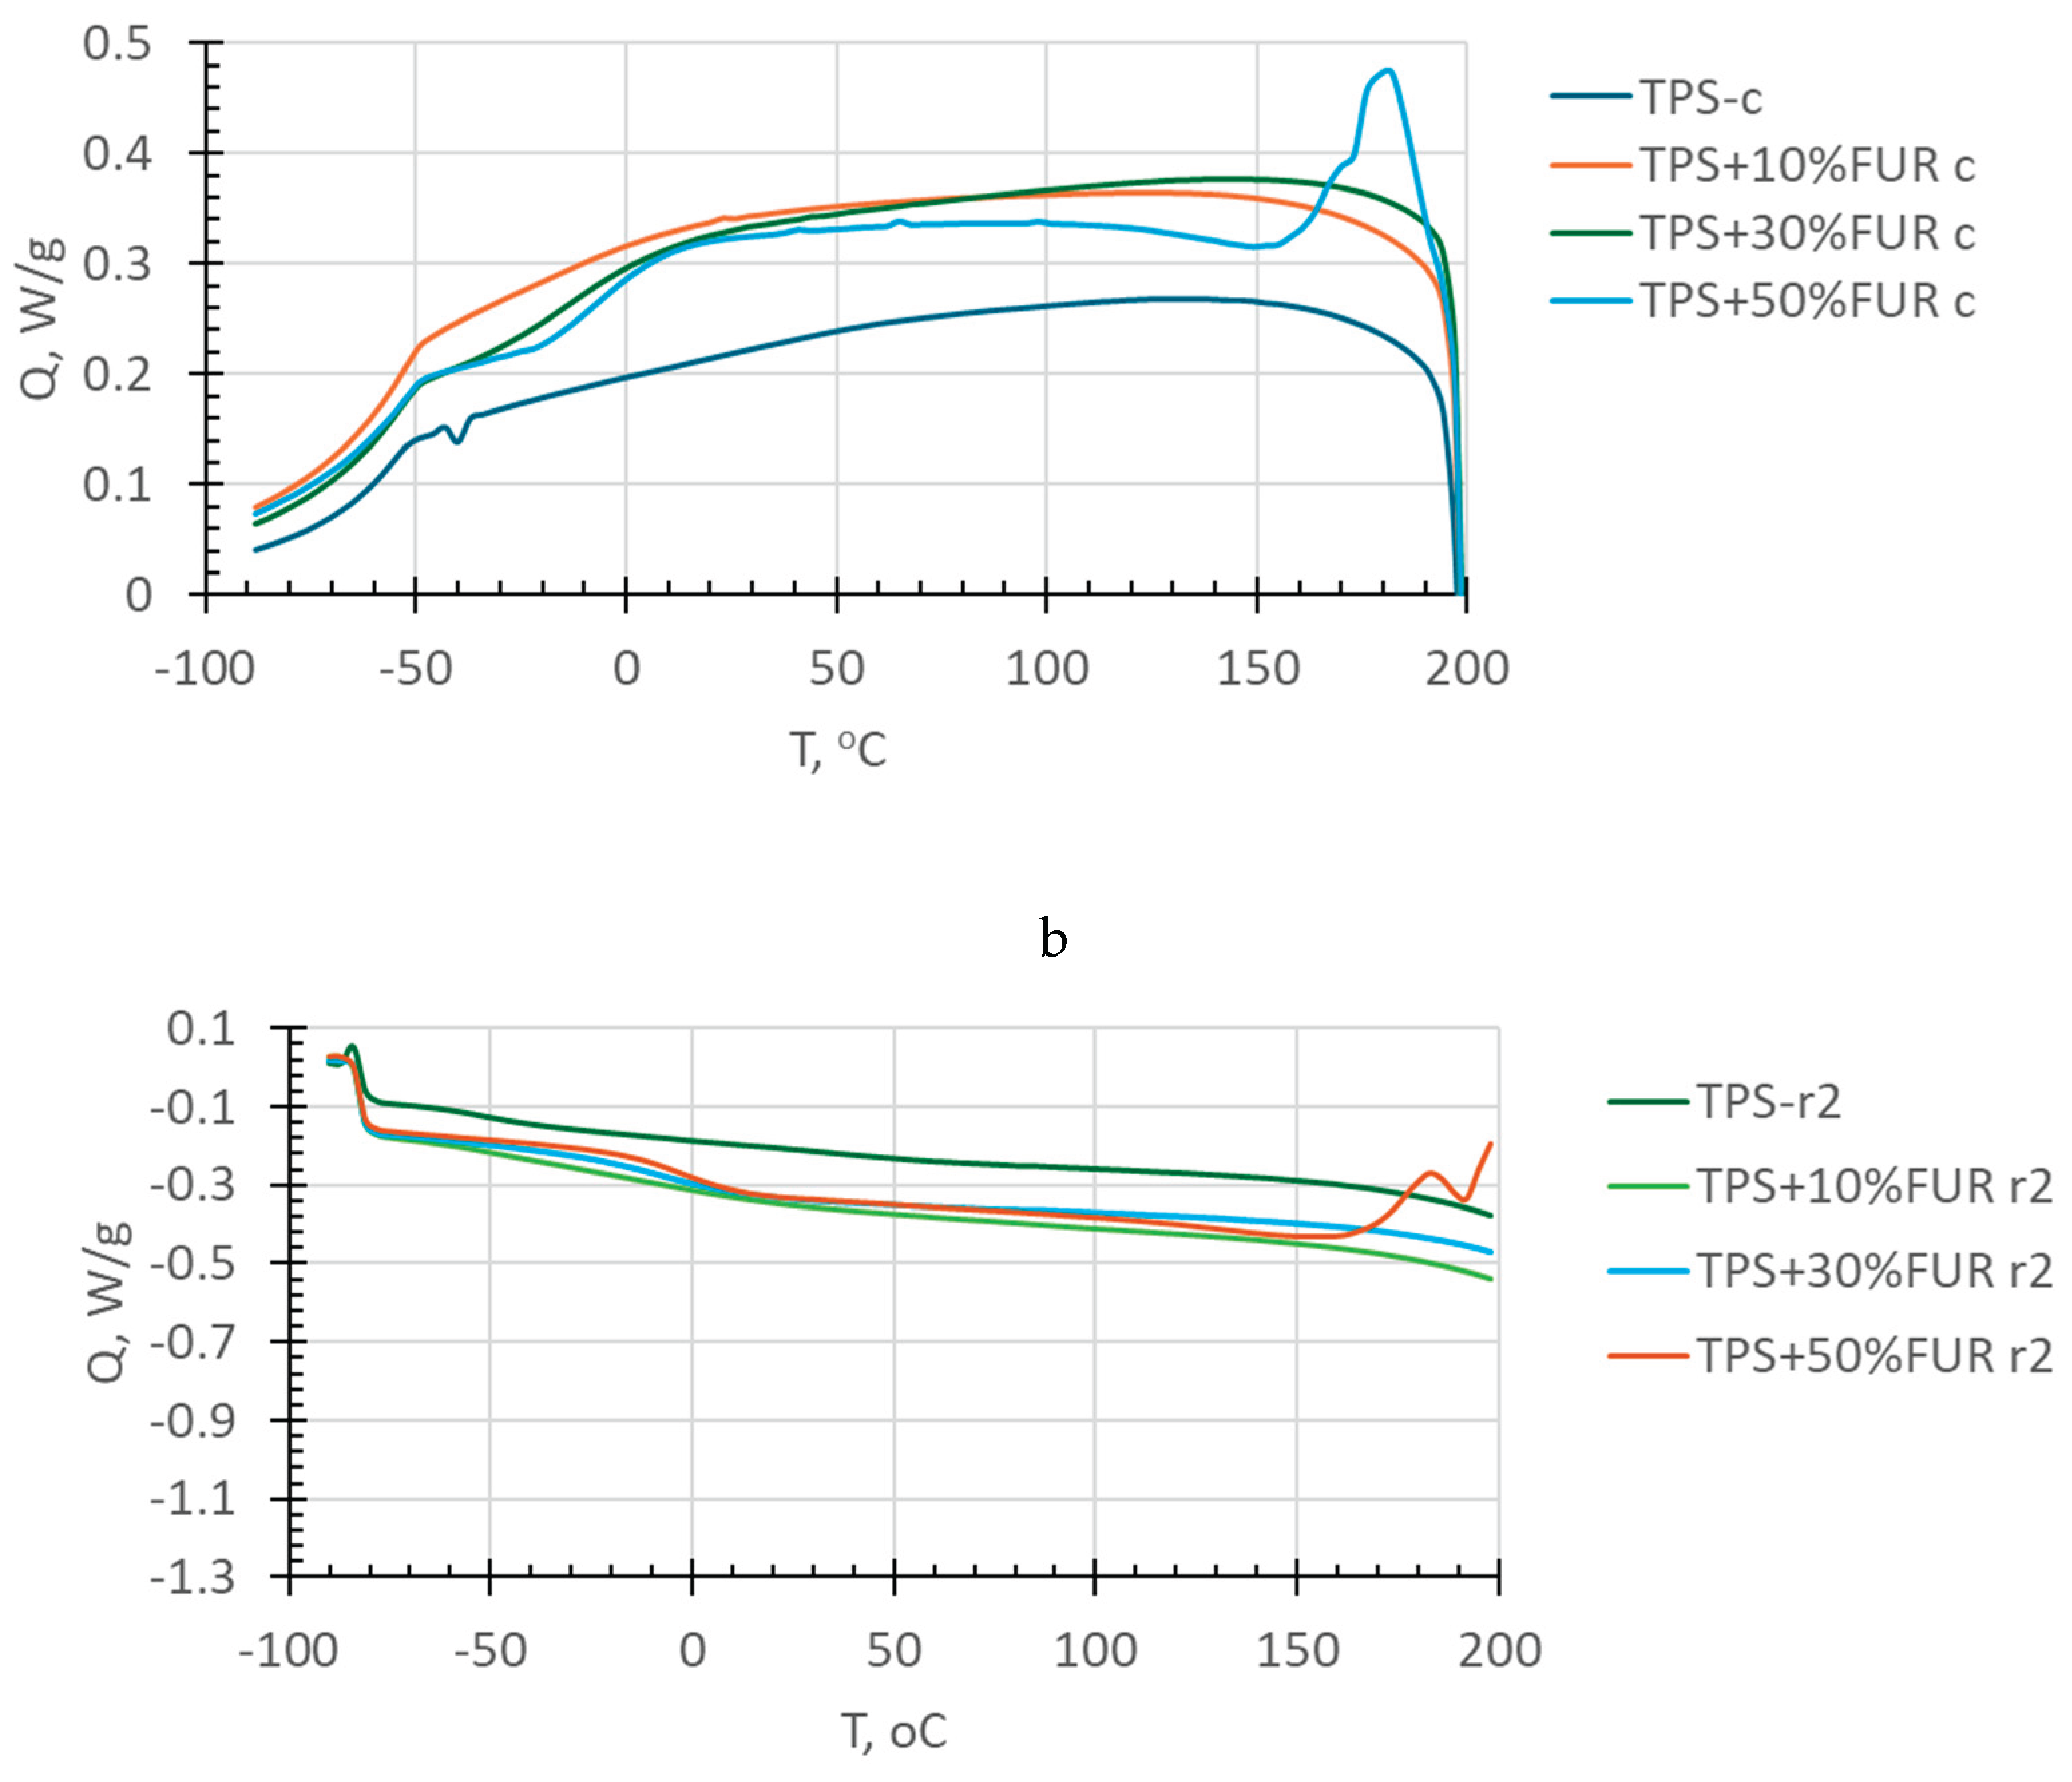
Figure 3.
Complex viscosity - strain amplitude sweep relationships for TPS/FUR composites before (closed symbols) and after (open sympols) frequency scan tests.
Figure 3.
Complex viscosity - strain amplitude sweep relationships for TPS/FUR composites before (closed symbols) and after (open sympols) frequency scan tests.
Figure 4.
Complex viscosity η* (a) and dynamic viscosity η (b) of various TPS/FUR compositions as a functions of shear rate.
Figure 4.
Complex viscosity η* (a) and dynamic viscosity η (b) of various TPS/FUR compositions as a functions of shear rate.
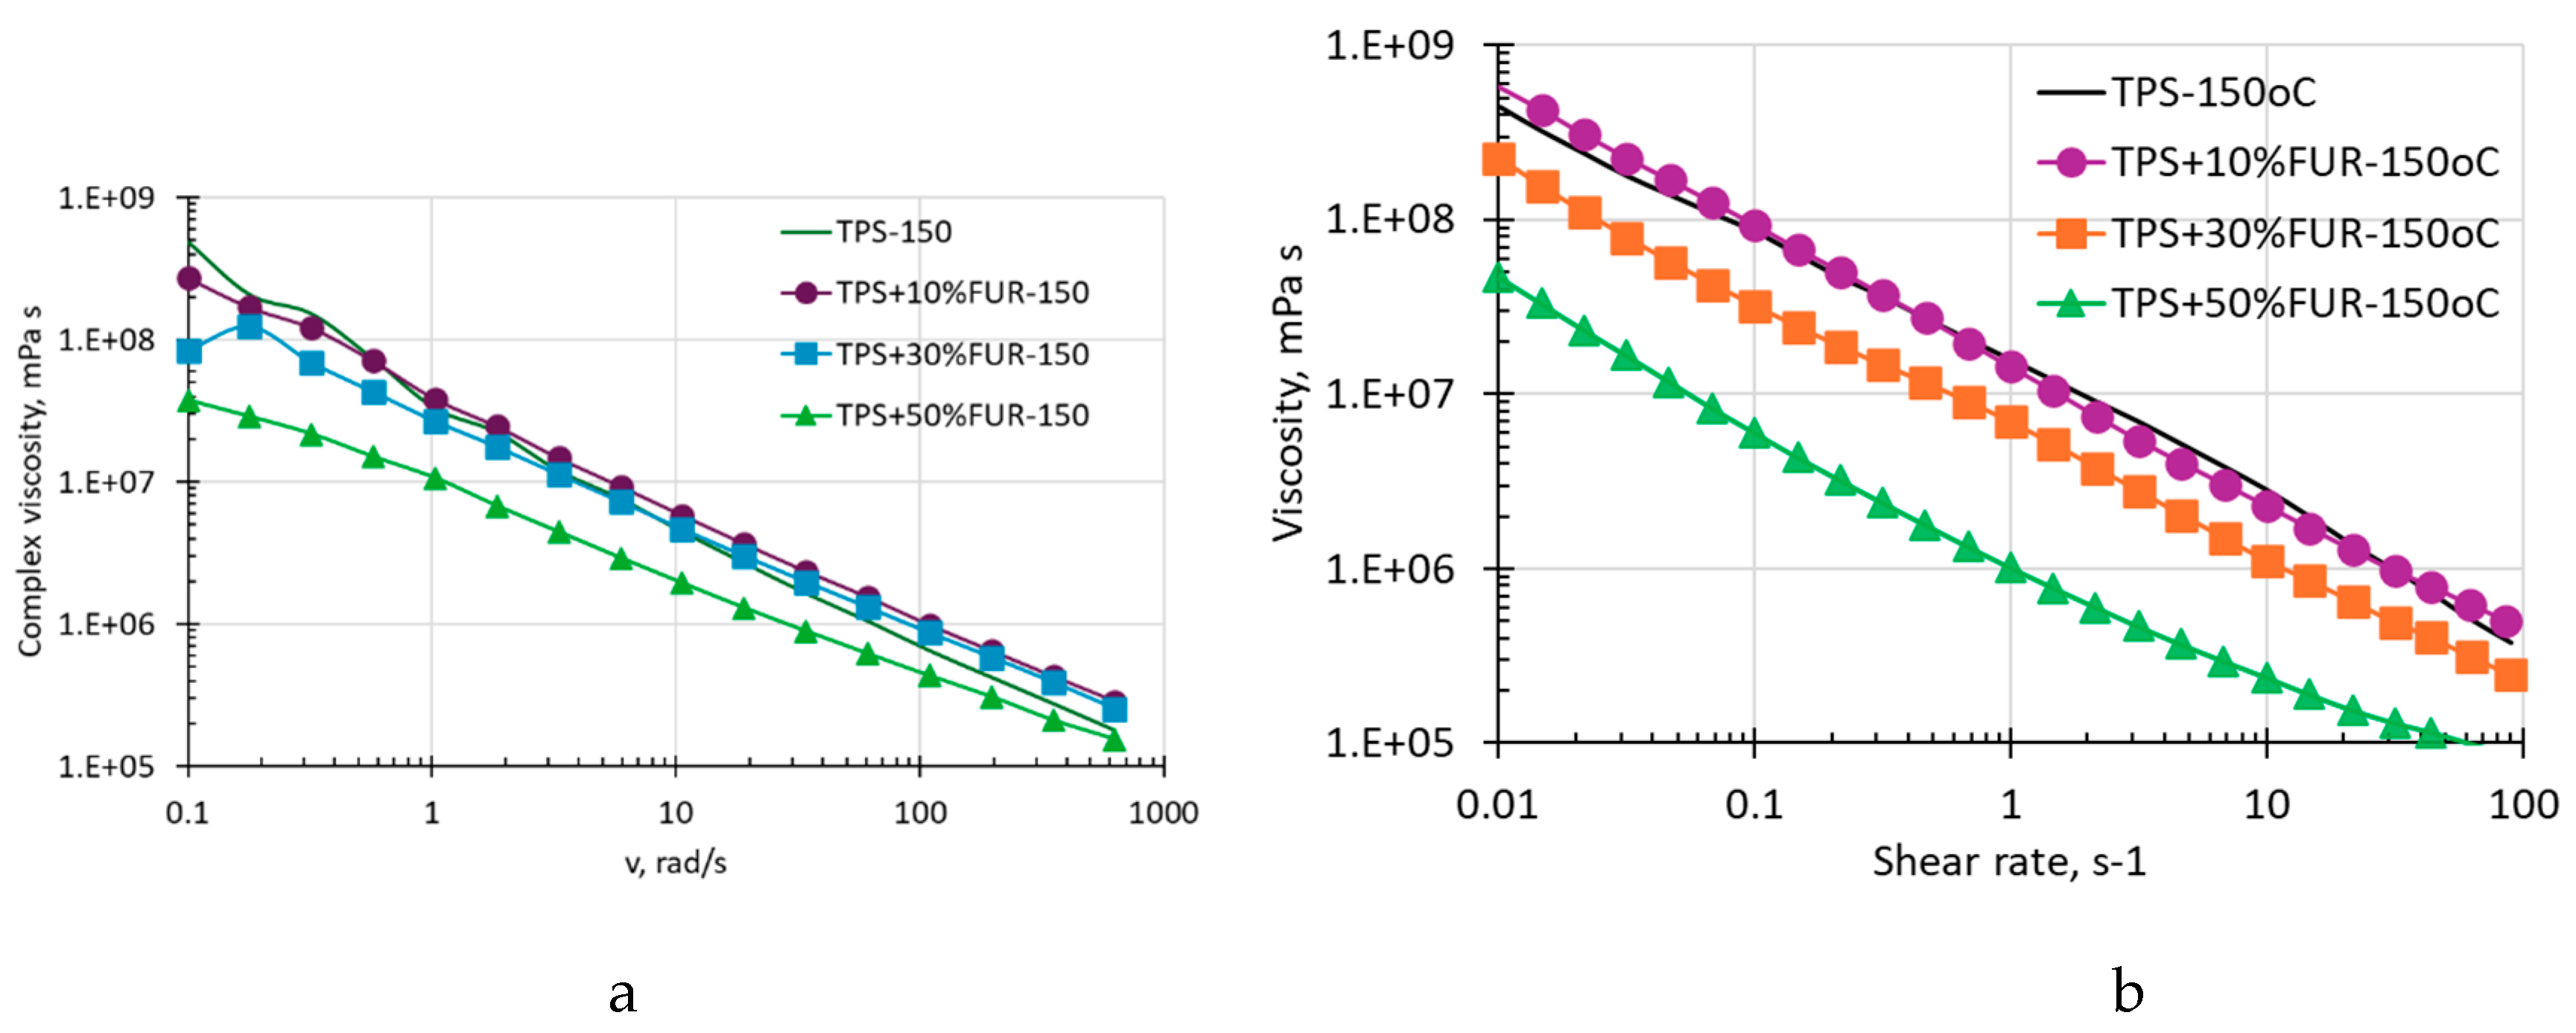
Figure 5.
Stress at break (a) and strain at break (b) of TPS/FUR composites as a function of FUR weight content.
Figure 5.
Stress at break (a) and strain at break (b) of TPS/FUR composites as a function of FUR weight content.
Disclaimer/Publisher’s Note: The statements, opinions and data contained in all publications are solely those of the individual author(s) and contributor(s) and not of MDPI and/or the editor(s). MDPI and/or the editor(s) disclaim responsibility for any injury to people or property resulting from any ideas, methods, instructions or products referred to in the content. |
© 2026 by the authors. Licensee MDPI, Basel, Switzerland. This article is an open access article distributed under the terms and conditions of the Creative Commons Attribution (CC BY) license (http://creativecommons.org/licenses/by/4.0/).
Copyright: This open access article is published under a Creative Commons CC BY 4.0 license, which permit the free download, distribution, and reuse, provided that the author and preprint are cited in any reuse.


