Submitted:
03 February 2026
Posted:
05 February 2026
You are already at the latest version
Abstract
Variation and comparison of annual cone and seed productions, and seed characteristics (number and percentage of filled seeds per cone) were examined for three consecutive years at three seed stand populations of Taurus cedar (Cedrus libani A. Rich.) with distinct structural characteristics. Fertility variation in cone and seed production was analyzed and discussed to inform for management practices of seed stands and for other silvicultural interventions. The analysis of variance showed the significant differences among populations and years, as well as among trees within a population and a year for both cone and seed production and seed characteristics. Population x year interactions were also significant (p<0.05), highlighting the importance of cone collecting stand and seed harvesting year. The parental balance curves showed that the cone production was much closer to equal contribution to the gamete gene pool than the production of filled seeds across years, suggesting that the number of cones is a better indicator of overall seed production. Fertility variation () in cones and filled seeds (1.10≤≤ 1.71 except 2.38 in a population and year) showed small deviation among seed stands and among years within a seed stand. Gene diversity of seed crops has increased through clustering populations and pooling years reaching values of 0.998 and 0.997, respectively.
Keywords:
afforestation
; fertility variation
; genetic diversity
; reproductive output
; stand structural characteristics
1. Introduction
Taurus cedar (Cedrus libani A. Rich.), also called as the cedar of Lebanon, is an important forest tree species in its native range and extant, such as in Bulgaria [1], Argentina [2], Italy [3], Iran [4], France [5,6]. It is valued and exotic for valuable timber, resin production from seed, cone and wood, landscape purposes and social-cultural importance (i.e., ethnobotany, symbol of Lebanon flag). Natural forests of the species are mainly at Taurus Mountains in southern Türkiye together with remain populations in Lebanon and Syria [7,8].
Taurus cedar has been used widely in afforestation, reforestation and restoration practices in Turkish forestry. Over the past decade, the distribution area increased from 463,521 ha to 580,515 ha (of which 42.8% was unproductive) through seeding and planting practices [9]. A total of 60 million seedlings from 20 tones seeds were produced from 21 seed stands (3,304.2 ha) [9,10] selected phenotypically from natural forests [11]. There are 7 seed orchards (46.4 ha) but they are not suitable for seed harvesting because of juvenile age [9,10]. This highlights the importance of selection and management of seed stands in C. libani (i.e., estimation of production variation and genetic parameters).
The species can grow up to 50 m height and 2.5 m diameter or more than that in old forests and monumental forest and trees by slender trunks and over 1000 years old at various ecological conditions natural such as mainly between 800 and 2100 m asl., and between 500 m and 2400 for local populations [7,8]. C. libani generally bears cones at about 30 years old in natural stands [8]. Male strobili appear in July and elongate 3-5 cm in August, while female strobili can be seen in September according to location and altitude in C. libani. The female strobili convert to mature cones by brown color, 8.46 cm length and 4.9 cm width [12,13].
Opening of the cone scales begins in October and seed dispersal occurs in 25-26 months after fertilization [8]. Seed dispersal starts at end of November and continues during the winter in natural stands of C. libani. However, seeds of 23-24 months old cones collected in August had also germination percentage in the species [12]. The frequency of good seed years in this species is two to three years and varies with altitude [13,14]. However, the occurrence of good seed years is also highly variable among locations, ranging from intervals of two years to three or even six years [8,12]. Characteristics of abundant cone and seed yields deviate among provenances in C. libani i.e., [12,15,16].
Fertility variation is defined as a difference in the ability to produce progeny (i.e., reproductive success) among individuals [17]. Fertility variation is commonly estimated based on pollen, strobili, flower, cone, fruit and seed production [18,19,20,21,22], and it approaches 1 when individuals contribute equally to the gamete gene pool of a population. It is used for various purposes in plant science such as genetic management, population breeding and species conservation [17,18,21,23,24,25,26,27]. Although cone and seed yields, as well as fertility variation, have been studied in natural populations of C. libani [28] using short-term data, annual variation in cone and seed yields and related parameters have not been examined in detail using long term data for this species.
This study aims to: i) assess annual variation of cone and seed yields and associated fertility variation among seed trees and gene diversity of seed crops in seed stands of Cedrus libani, ii) compare these patterns across three consecutive years and three seed stands that bare different silvicultural characteristics, and iii) provide recommendations on the management and the cone harvest strategy in these seed stands.
2. Materials and Methods
2.1. Cone and Seed Collection, and Parental Balance Curve
Collection of mature cones was carried out during October for three consecutive years (2023-2025) from three seed stands, also known seed collection areas, of Taurus cedar, where the species have optimal and the largest natural distribution at Mediterranean regions in Türkiye. Although the seed stands occur at the same altitude, they exhibit distinct structural characteristics, including differences in tree age and stem density per hectare. (Table 1) [10]. Thirty-five trees were selected phenotypically (i.e., tree height, diameter at breast height, stem straight) [11] from each seed stand. The trees were randomly selected at least 100 m distance and should have mature cones [28,29]. The total number of mature cones were counted from the selected trees.
All cones were thoroughly dissected to assess the number of seeds produced per cone. Average number and percentage of filled seeds per cone were calculated from four healthy cones harvested as much as possible from different directions of each tree. The cones were stored (at about 20 °C) indoor for seed extraction during two weeks. The cutting test method was used for assessing the seed characteristics (i.e., whether they are filled or empty/damaged) [30]. The average number of filled seeds per tree was estimated by the average number of filled seeds/cone multiplied by the bearing mature cones per tree.
The parental balance curve was plotted as the cumulative proportion of reproductive output (e.g., cones, seed) against the cumulative proportion of parental seed trees [20,31]. The curves are very useful to identify highly fertile, underperforming, or infertile trees and manage seed stands to ensure maximum genetic diversity, which is crucial for establishing resilient forests.
2.2. Data Analysis
The differences in cone number and seed production among populations and years were performed by following model of ANOVA [32]:
where Yijk is the observation from the kth tree of the jth stand in the ith year, μ is the overall mean of the characteristics, Fi is the effect of ith year, B(F)j(i) is the effect of the jth population in the ith year, and eijk is the random error.
Within a year, differences among seed trees in cone and seed yield per year in a stand were also compared by following model of one-way analysis of variance as:
where Yij is the observation from the ith tree of the jth stand, μ is the overall mean of the cone or seed yields, Pi is the yield of the ith tree and eij is the random error.
The fertility variation also known sibling coefficient (Ψ) among seed trees was estimated based on the proportions of cone and filled seed/tree (ΨC & ΨS) representing the total contribution as zygotic parents within the population for the years [33] as:
where Conei and Seedi represent the cone and seed fertility (relative proportion of cone and seed production in the seed stand) of the ith tree, and CVC and CVS stand for the coefficients of variation in cone and seed productions, respectively.
The effective number of parents for cone (NP(C)) and seed (NP(S)) productions were calculated based on the fertility variations (ΨC & ΨS) and the census number (N) of seed trees, respectively [26] as:
3. Results
3.1. Cone and Seed Productions, and Parental Balance Curve
Cone and seed productions and related seed characteristics showed a large difference among populations (seed stands) and years, and also among trees within a population and a year (Table 2). The reproductive output increased with increasing of stand age and showed a negative relationship with stand density. In particular, during the whole studied period, cone production per tree, filled seed number per cone, and total filled seed production per tree were highest in the P3 seed stands, characterized by older age (145 years) and lower tree density (450 trees/ha).
Cone production (NC) was also greatest in P3 in 2023, while the lowest was observed in P1 in 2024. Similarly, both the percentage of filled seed per cone (NSC%) and the total number of filled seeds per tree (NST) were also highest in P3 in 2023 (Table 2, Figure 1 and Figure 2). Cone and filled seed production in P3 in 2023 were 100% and 149% higher, respectively, than the lowest values recorded in P1 in 2025 (18 cones and 1165 filled seeds per tree). Besides, the percentage of filled seeds per cone (NSC%) ranged from 73% in the P1 in 2023 to 95% in P3 in 2024 (Table 2).
When pooled the three stands, in year 2023 the mean number of cones (29) and the filled seeds per tree (2094) were the highest, while the percentage of filled seeds per cone (NSC%) and number of filled seeds per cone (NSC) were the lowest i.e., 87% and 71%, respectively (Table 2, Figure 1 and Figure 2).
The seed stands (populations) showed significant differences (p<0.05) in cone production and seed yield, whereas the effect of year was significant only for the number of cones (NC) and the percentage of filled seeds per cone (NSC%) (Table 3). In addition, population x year interactions were significant (p<0.01 or p<0.05) for the reproductive potential (Table 3).
The parental balance curves in P1 showed more deviation from the ideal equal contribution for cone and seed characteristics compared to the stands of P2 and P3 (Figure 3). The observed parental balance curves for numbers of cone (NC) and filled seeds per tree (NST) were not deviated dramatically from equal production among individuals in the seed stands and years when pooled, while they showed different figures for the individual seed stands (Figure 3 and Figure 4). For instance, cone productions of the years of pooled population were much closer to equal contribution to the gamete gene pool than that of filled seeds (Figure 4).
3.2. Fertility Variation, Effective Number of Parents and Gene Diversity
Cone (ΨC) and filled seed (ΨS) fertility did not vary substantially among populations and years, nor among years within population (Table 4). For instance, pooled-year cone fertility (ΨS) in P2 was 1.46 (NP(S)= 72.0, 69% of census number in the population) ranging from 1.25 (28.0, 80% in year-23) to 1.38 (25.4, 73% in year-24). For pooled years and populations, ΨC values were 1.36 (231.5, 74% of census number), 1.32 (79.6, 76% in year-25) and 1.42 (74.0, 71% in year-24) for pooled year and populations of ΨC (Table 5).
Years, populations and years within population had different reflections to high and low crop years (Table 2) depend on fertility variation, effective number of parents and gene diversity (Table 4).
Effective number of parents was 18% higher in the highest crop year (year-24) to the poorest (year-25) for NP(C) in P2, while it was 7% opposite from the highest crop year (year-24) to poor year (year-23) for NP(S) in the population (Table 4). Similar results were also found for the years of the populations by 2% decreasing for NP(C) and 9% increasing for NP(S) in the polled populations of the years between the highest (year-23) and lowest (year-25) production years. The results indicated importance of seed harvesting year.
The highest gene diversity (GD) was estimated for pooled years of the populations (0.998 for GDC and 0.997 for GDS) and within population for both cone (GDC) and seed (GDS) than individual population and year (Table 4). As seen from the Table, the lowest gene diversity (GDC= 0.976 and GDS= 0.966) in year-23 of P1 increased to 0.993 (GDC) and 0.992 (GDS) in bulked years of the population. Loss of gene diversity was up to 0.013 in seeds of individual year to bulked seeds of years in P2 (Table 4).
4. Discussion
The present study demonstrates pronounced variation in cone and seed production among seed stands, years, and individual trees, highlighting the complex and heterogeneous nature of reproductive output. Such variability was evident not only at the population (seed stand) level but also within populations across years, indicating that reproductive potential is shaped by both stand-level characteristics and temporal factors. The reproductive characteristics of forest tree species are influenced by numerous biotic (e.g., tree growth, age, and crown closure) and abiotic factors (e.g., light, temperature, humidity, and site quality) i.e., [11,12,25,36,37,38]. In natural stands of C. libani, good seed years occur approximately every two to three years [7], and the position of individual trees within the population can also affect reproductive output [12]. It has been reported that even during good seed years, not all trees in a population are expected to produce abundant seed crops [12]. Similar variations in cone and seed productions were reported in C. libani by Bilir et al. [28] who reported higher values for two populations than the present study; numbers of cones and seeds were 90 and 33, and 5321 and 3115 per tree, respectively.
The reproductive output in this study was found increased with stand age and exhibited a clear negative relationship with stand density. The consistently higher cone production per tree, filled seed number per cone, and total filled seed production per tree observed in the P3 seed stand across the whole study period suggest that older seed stands with lower tree density provide more favorable conditions for reproductive development. Reduced competition for resources such as light, water, and nutrients in lower-density stands likely enhances individual tree vigor, thereby supporting increased reproductive investment. The superior reproductive performance of P3 seed stand, particularly during 2023, underscores the importance of stand structure in determining reproductive potential. Similarly, previous studies, were reported that tree size, age and provenance could impact on cone and seed yields [12,39] and their characteristics (i.e., germination percentage~ filled seeds) [12,15,16,40].
Interannual variation was also substantial, with 2023 emerging as the most productive year in terms of mean cone number and total filled seed production per tree when the three seed stands were pooled. However, this year was also characterized by lower values of filled seed percentage and filled seed number per cone, indicating a trade-off between cone quantity and seed quality.
The significant population × year interactions (p<0.05) observed for reproductive output (Table 3) underscore the importance of both the seed collection stands and the year of collection, indicating that environmental conditions prevailing in a forest stand and temporal variation can differentially affect reproductive performance among populations [26]. Given that a planting spacing 1.5 m x 3 m (~2222 seedlings/ha) or about 13 kg seeds/ha are required for seeding in reforestation, afforestation and restoration practices of C. libani [13], the abundant seed production of per tree (Table 2) indicates its representation rate in future generation. High seed production can provide a simple and cost-effective guide for seed harvesting and selection of mother trees, and management of seed collection areas.
Coefficients of variations of cone and seed productions (Table 2) were at acceptable level for an ideal natural population (CV<140% = Ψ<3) [27] in both population and years, while cone and seed productions varied for the productions in the population and year. However, cone productions of the years were much closer to equal contribution to the gamete gene pool than that of filled seeds (Figure 3 and Figure 4). Genetic contributions can be explained by parental balance curves, and the cumulative percentage curve is often used to quantify fertility variation in forest populations [18,31]. Unequally contributions of the parents to the gamete gene pool were not pronounced, indicating that they can be balanced through silvicultural practices such as tending or equal seed collection per tree.
The parental balance curve is a graphical tool primarily used in forest genetics to visualize the variation in reproductive success among individual parent trees within a seed-producing population (e.g., seed stands, seed orchards). It helps assess the gene diversity of the resulting seed crop. The sibling coefficient (Ψ) is a related measure that quantifies this variation in fertility; a value of 1 indicates equal contribution, while higher values indicate greater disparity. This study implied that the gene diversity of the seed crops could be improved when the cones (seeds) are pooled across seed stands and/or collection years (Figure 3 and Figure 4).
Variation in cone (ΨC) and filled seed (ΨS) fertility among populations and years, as well as among years within population (Table 4) remained within acceptable limits and below the threshold of Ψ<3 for natural stands [25]. However, the results indicated importance of seed harvesting year and population. Loss of gene diversity can be mitigated by pooling seeds from different populations and years supporting afforestation practices in adaptive areas and enhancing resistance to biotic and abiotic stresses. This approach relies on higher gene diversity in seed crops, which depends on the seed transfer region of the species [41]. However, we suggest that a trade-off between the effective number of parents (gene diversity) and the number of populations and/or years should be carefully considered to ensure a sustainable seed supply in the seed stands of Taurus cedar. The long term seed storage capacity of the species, up to 5-6 years [12,40] could be used for this purpose.
5. Conclusion
Author Contributions
NB conducted data collection. KSK, MT and NB conducted data validation. KSK and NB performed data analysis. MT, KSK and NB prepared draft paper, figures and tables. MT, KSK and NB conducted review & editing All authors participated in the discussion and approved the submitted version.
Institutional Review Board Statement
Not applicable.
Data Availability Statement
The data presented in this study are available on request from the corresponding author.
Acknowledgments
Authors would like to thank the anonymous reviewers who made valuable comments which helped to improve the manuscript. Authors also thank to the graduate students for their help during data collection and regional forest directorate in Türkiye.
Conflicts of Interest
The authors declare no conflicts of interest.
References
- Tsanov, T.S.; Naidenov, Y.; Kalmoukov, K. Le Cedre (Cedrus) en Bulgarie Etat et Perspectives. International Cedar Symposium. Ankara, 1990, pp. 308-324.
- Ottone, R.J.; Carloni, C. Aspects of cedar cultivation in the Argentine Republic. International Cedar Symposium. Ankara, 1990, pp. 260-265.
- Fusaro, E. Characteristics and distribution of cedar in Italy. International Cedar Symposium. Antalya, 1990, pp. 273-285.
- Assadullahi, F.; Hedayati, M.A. Cedrus plantation experiments in Iran. International Cedar Symposium. Ankara, 1990, pp. 266-273.
- Toth, J. Le Cedre Dissemination, Extaction, Qualite, Germination, Conservation. La Foret Privee, 1980, 131.
- Bariteau, M.; Pommery, J.; Vauthier, D. Adaptation of Cedrus provenances tested in France in comparative plantations. Conference of Adaptation and Selection of Mediterranean Pinus and Cedrus for Sustainable Afforestations of Marginal Lands, Thessaloniki, 2000, pp. 15-19.
- Boydak, M. Regeneration of Lebanon cedar (Cedrus libani A. Rich.) on karstic lands in Turkey. Forest Ecology and Management 2003, 178, 231–243. [Google Scholar] [CrossRef]
- Boydak, M.; Çalıkoğlu, M. Biology and silviculture of Cedar of Lebanon (Cedrus libani A. Rich.); Ministry of Forestry Publication: Ankara, 2008. [Google Scholar]
- OGM. Forest inventory of Türkiye. General Directorated of Forestry, 2025, Ankara. https://www.ogm.gov.tr.
- ORTOHUM. Seed production areas. Research Directorate of Forest Tree Seeds and Tree Breeding, 2025, Ankara. https://ortohum.ogm.gov.tr.
- Zobel, B.J.; Talbert, J. Applied forest tree improvement; John Wiley and Scons: NY, 2003. [Google Scholar]
- Odabaşı, T. Research on cone and seed characters of Cedrus libani; General Directorate of Forestry Press: Ankara, 1990. [Google Scholar]
- Boydak, M. Ecology and silviculture of Cedar of Lebanon (Cedrus libani A. Rich.) and conservation of its natural forest; Ministry of Forestry Publication: Ankara, 1996. [Google Scholar]
- Saatçioğlu, F. Silviculture-I. Forestry Faculty of Istanbul University press: Istanbul, 1976. https://cerrahpasa.iuc.edu.tr/.
- Dirik, H. Effect of osmotic water stress on germination of Lebanon Cedar (Cedrus libani A. Rich.) seeds from the provenances of Turkey. Annals of Forest Science 2000, 57, 361–367. [Google Scholar] [CrossRef]
- Ayrancı, A.; Öner, M.N. Effect of some pretreatments of seeds on germination of different Taurus cedar (Cedrus libani A. Rich.) origins. Anatolian Journal of Forest Research 2019, 5, 61–70. [Google Scholar]
- Bila, AD. Fertility variation and its effects on gene diversity in forest tree populations. Ph.D. Thesis. Swedish University of Agricultural Science, Acta Universitatis Agriculturae Sueciae, Silvestria 166, Umeå, Sweden, 2000. https://www.upsc.se.
- Griffin, A.R. Clonal variation in Radiata pine seed orchards. I. Some flowering, cone and seed production traits. Aust. For. Res. 1982, 12, 295–302. http://jkv.50megs.com/afr.html.
- Roeder, K.; Devlin, B.; Lindsay, B.G. Application of maximum likelihood methods to population genetic data for the estimation of individual fertilities. Biometrics 1989, 45, 363–379. [Google Scholar] [CrossRef]
- El-Kassaby, Y.A.; Reynolds, S. Reproductive phenology, parental balance and supplemental mass pollination in a Sitka spruce seed orchard. For. Ecol. Manag. 1990, 31, 45–54. [Google Scholar] [CrossRef]
- Xie, C.Y.; Knowles, P. Male fertility variation in an open-pollinated plantation of Norway spruce (Picea abies). Canadian Journal of Forest Research 1992, 22, 1463–1468. [Google Scholar] [CrossRef]
- El-Kassaby, Y.A.; Cook, C. Female reproductive energy and reproductive success in a Douglas-fir seed orchard and its impact on genetic diversity. Silvae Genetica 1994, 43, 243–246. [Google Scholar]
- El-Kassaby, Y. Evaluation of the tree-improvement delivery system: factors affecting genetic potential. Tree Physiology 1995, 15, 545–550. [Google Scholar] [CrossRef]
- Shea, K. L. Effects of population structure and cone production on out crossing rates in Engelmann spruce and Subalpine fir. Evolution 1987, 41, 124–136. [Google Scholar] [CrossRef]
- Kang, KS.; Bila, A.D.; Harju, A.M.; Lindgren, D. Fertility variation in forest tree populations. Forestry 2003, 76, 329–344. [Google Scholar] [CrossRef]
- Kamalakannan, R.; Varghese, M.; Park, J.M.; Kwon, S.H.; Song, J.H.; Kang, K.S. Fertility variation and its impact on effective population size in seed stands of Tamarindus indica and Azadirachta indica. Silvae Genetica 2015, 64, 91–99. [Google Scholar] [CrossRef]
- Kang, K.S.; Bilir, N.; Jeon, K.; Kim, Y.-J. Fertility variation and gene diversity in forest populations. Forests 2023, 14, 2172. [Google Scholar] [CrossRef]
- Bilir, N.; Novikova, T.P.; Novikov, A.I. Variation in cone and seed productions of Taurus cedar (Cedrus libani A. Rich.) Populations. Geography, Environment, Sustainability 2025, 18, 63–69. [Google Scholar] [CrossRef]
- Ganatsas, P.; Tsakaldimi, M.; Thanos, C. Seed and cone diversity and seed germination of Pinus pinea in Strofylia Site of the Natura 2000 Network. Biodiversity and Conservation 2008, 17(10), 2427–2439. [Google Scholar] [CrossRef]
- ISTA. International Seed Testing Association; The International Seed Testing Association (ISTA): Bassersdorf, 2005, Switzerland.
- Chaisurisri, K.; El-Kassaby, YA. Estimation of clonal contribution to cone and seed crops in a Stika spruce seed orchard. Ann. Sci. For. 1993, 50, 461–467. [Google Scholar] [CrossRef]
- SAS Inst. Inc., 1988. SAS/STAT User’s Guide, Release 6.03, edition, Cary, NC. https://www.sas.com.
- Kang, K.S.; Lindgren, D. Fertility variation among clones of Korean pine (Pinus koraiensis S. et Z.) and its implications on seed orchard management. For. Genet. 1999, 6, 191–200. [Google Scholar]
- Lindgren, D.; Gea, L.; Jefferson, P. Loss of genetic diversity monitored by status number. Silvae Genetica 1996, 45, 52–59. https://www.degruyter.com.
- Lindgren, D.; Mullin, T.J. Relatedness and status number in seed orchard crops. Canadian Journal of Forest Research 1998, 28, 276–283. [Google Scholar] [CrossRef]
- Eriksson, G.; Jonsson, A.; Lindgren, D. Flowering in a clonal trial of Picea abies (Karst.). Studia Forestalia Sueccica 1973, 110, 4–45. [Google Scholar]
- Hedegart, T. Breeding systems, variation and genetic improvement of teak. Tropical trees: Variation, Breeding and Conservation Linnean Society Symposium Series:2, 1976, New York.
- Eser, Y. Variation in cone production of Anatolian black pine [Pinus nigra Arnold. subsp. pallasiana (Lamb.) Holmboe] over habitat classes. Biol Bull Russ Acad Sci. 2024, 51(1), 121–127. [Google Scholar] [CrossRef]
- Bilir, N.; Çetinkaya, D. Cone production by age groups in Cedrus libani. 2nd International Mediterranean Conference, Beirut, February 2-3, 2023; pp. 38–43. [Google Scholar]
- Takos, I.; Merou, T. Effect of storage conditions and treatment on germination of Cedrus deodara Loud. and Cedrus libani A. Rich. Silvae Genetica 2001, 50, 5–6. [Google Scholar]
- Atalay, I. General ecological properties of natural occurrence areas of cedar (Cedrus libani A. Rich.) forests and regioning of seed transfer of cedar in Turkey. General Directorate of Forestry press: Ankara, 1987. https://www.ogm.gov.tr.com.
Figure 1.
Number of cones (NC) (a) and number of filled seeds per tree (NST) (b) for the studied period (2023-2025) in the seed stands of Taurus cedar.
Figure 1.
Number of cones (NC) (a) and number of filled seeds per tree (NST) (b) for the studied period (2023-2025) in the seed stands of Taurus cedar.
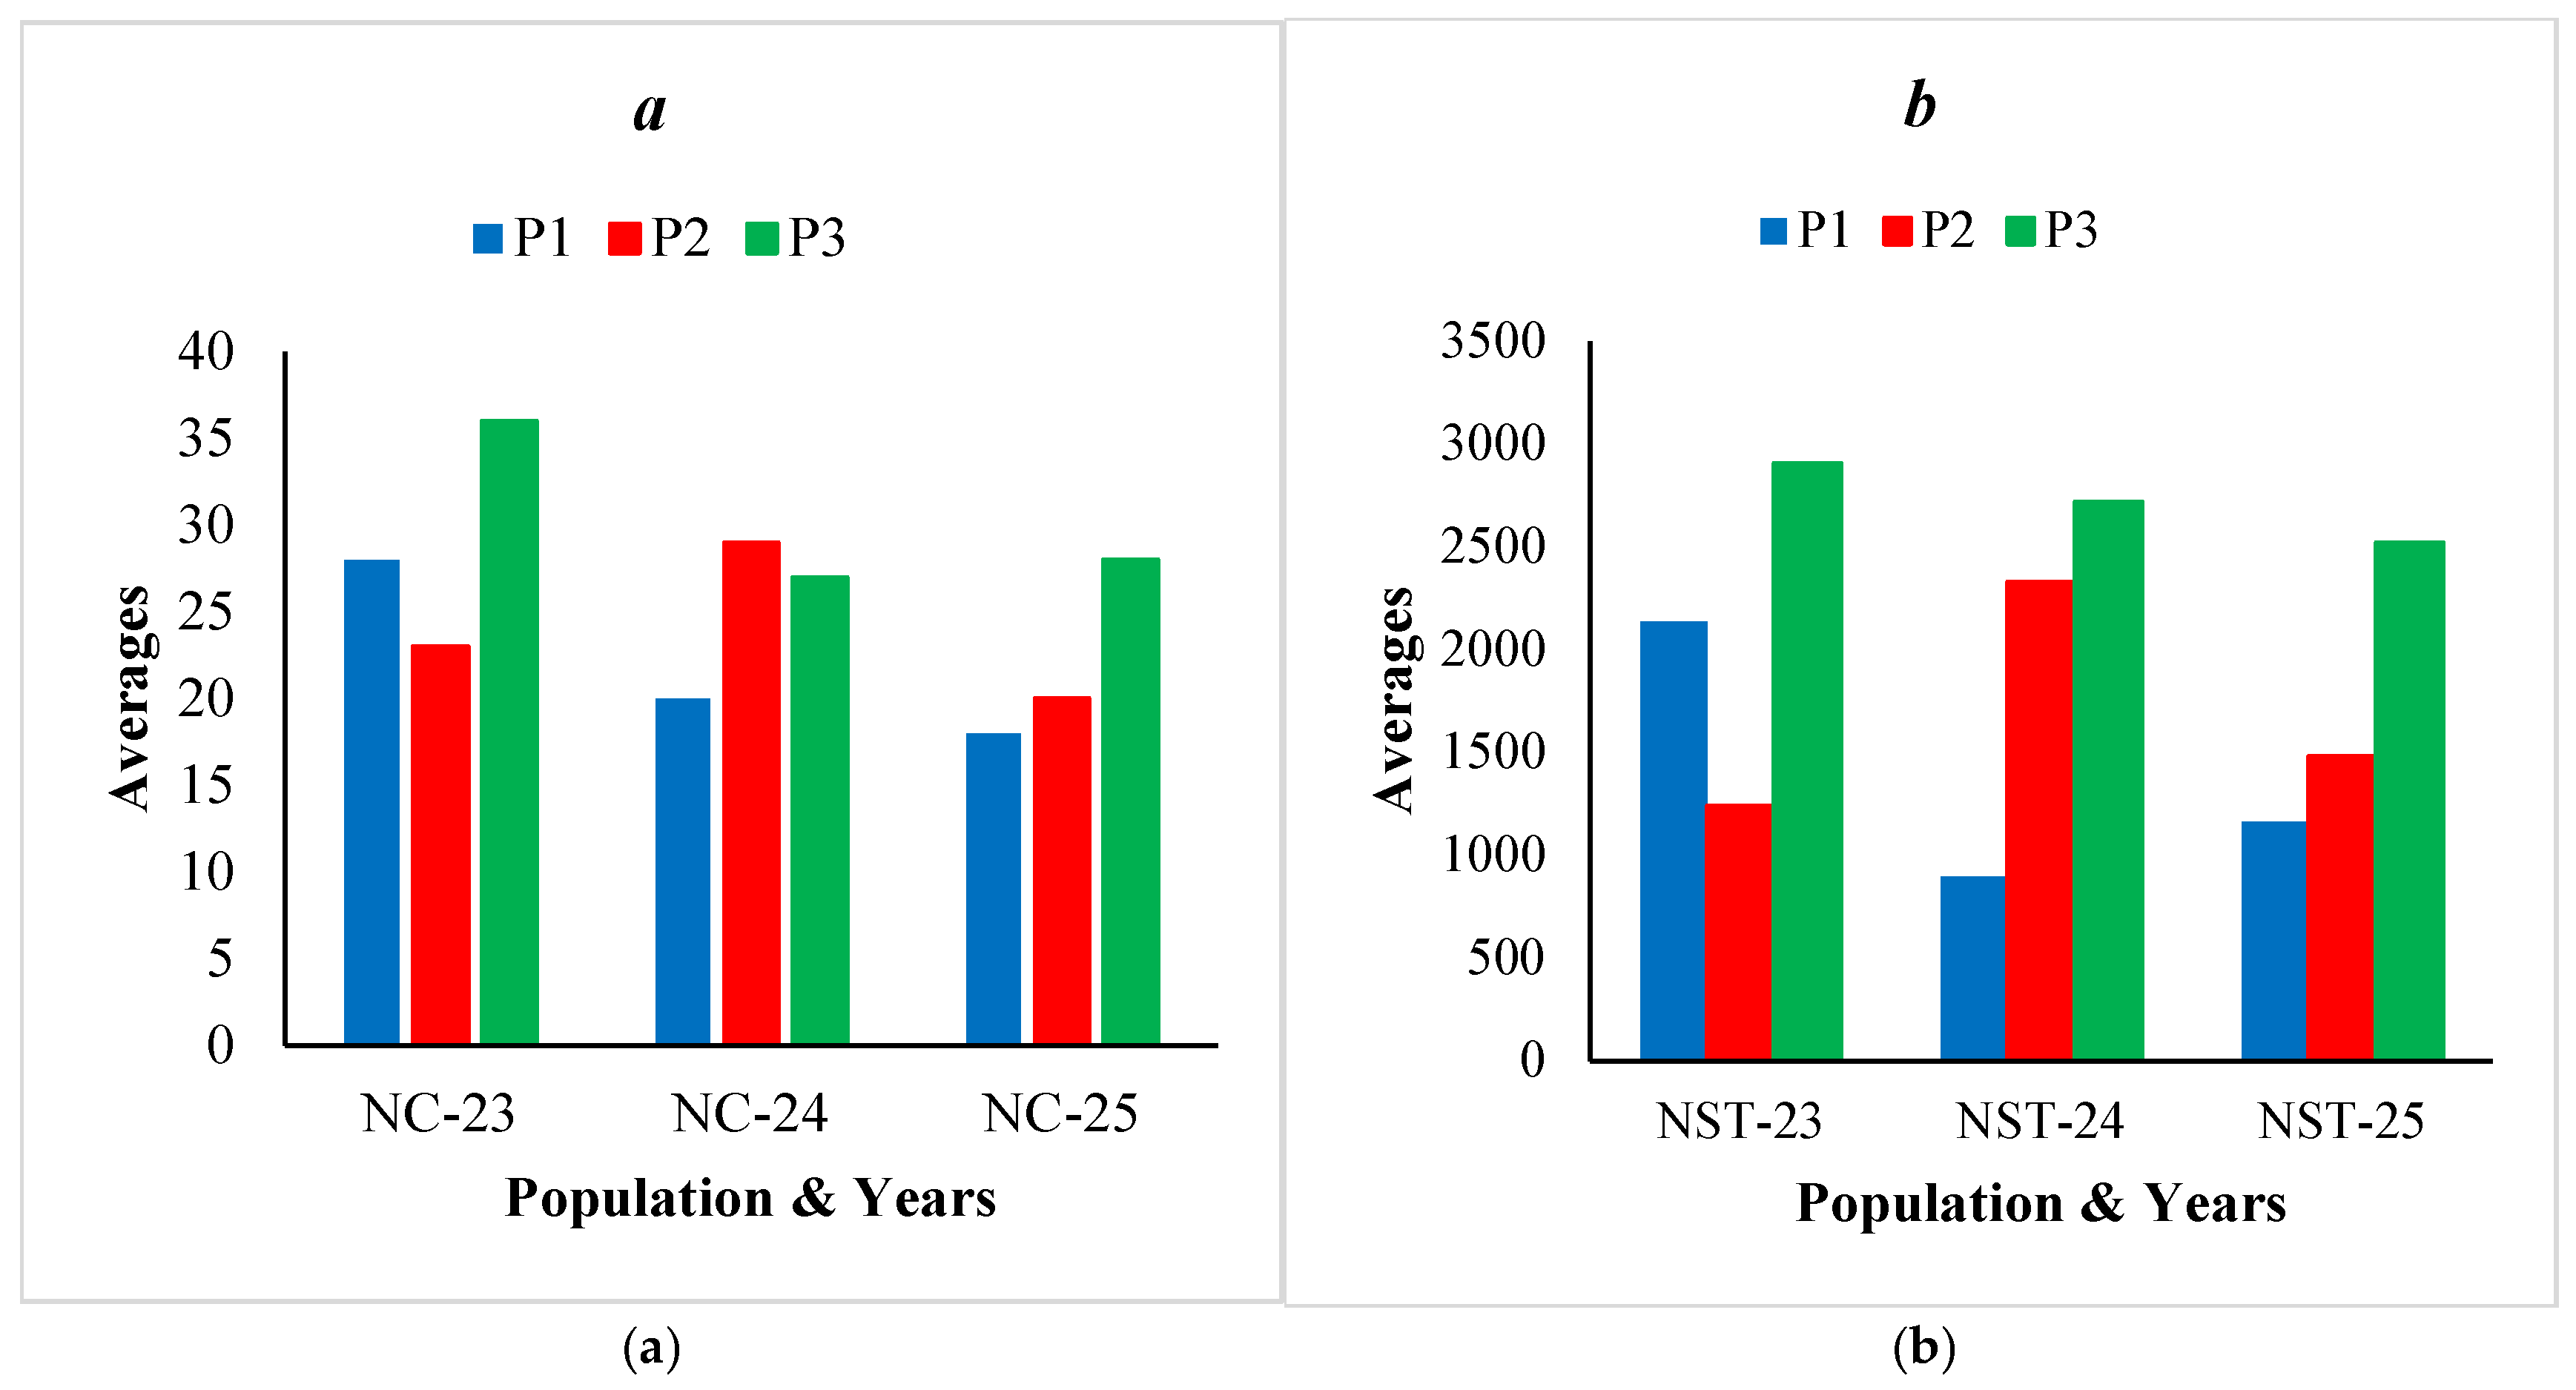
Figure 2.
The percentage of filled seeds per cone (NSC%) (a) and number of filled seeds per cone (NSC) (b) for the studied period (2023-2025) in the seed stands of Taurus cedar.
Figure 2.
The percentage of filled seeds per cone (NSC%) (a) and number of filled seeds per cone (NSC) (b) for the studied period (2023-2025) in the seed stands of Taurus cedar.
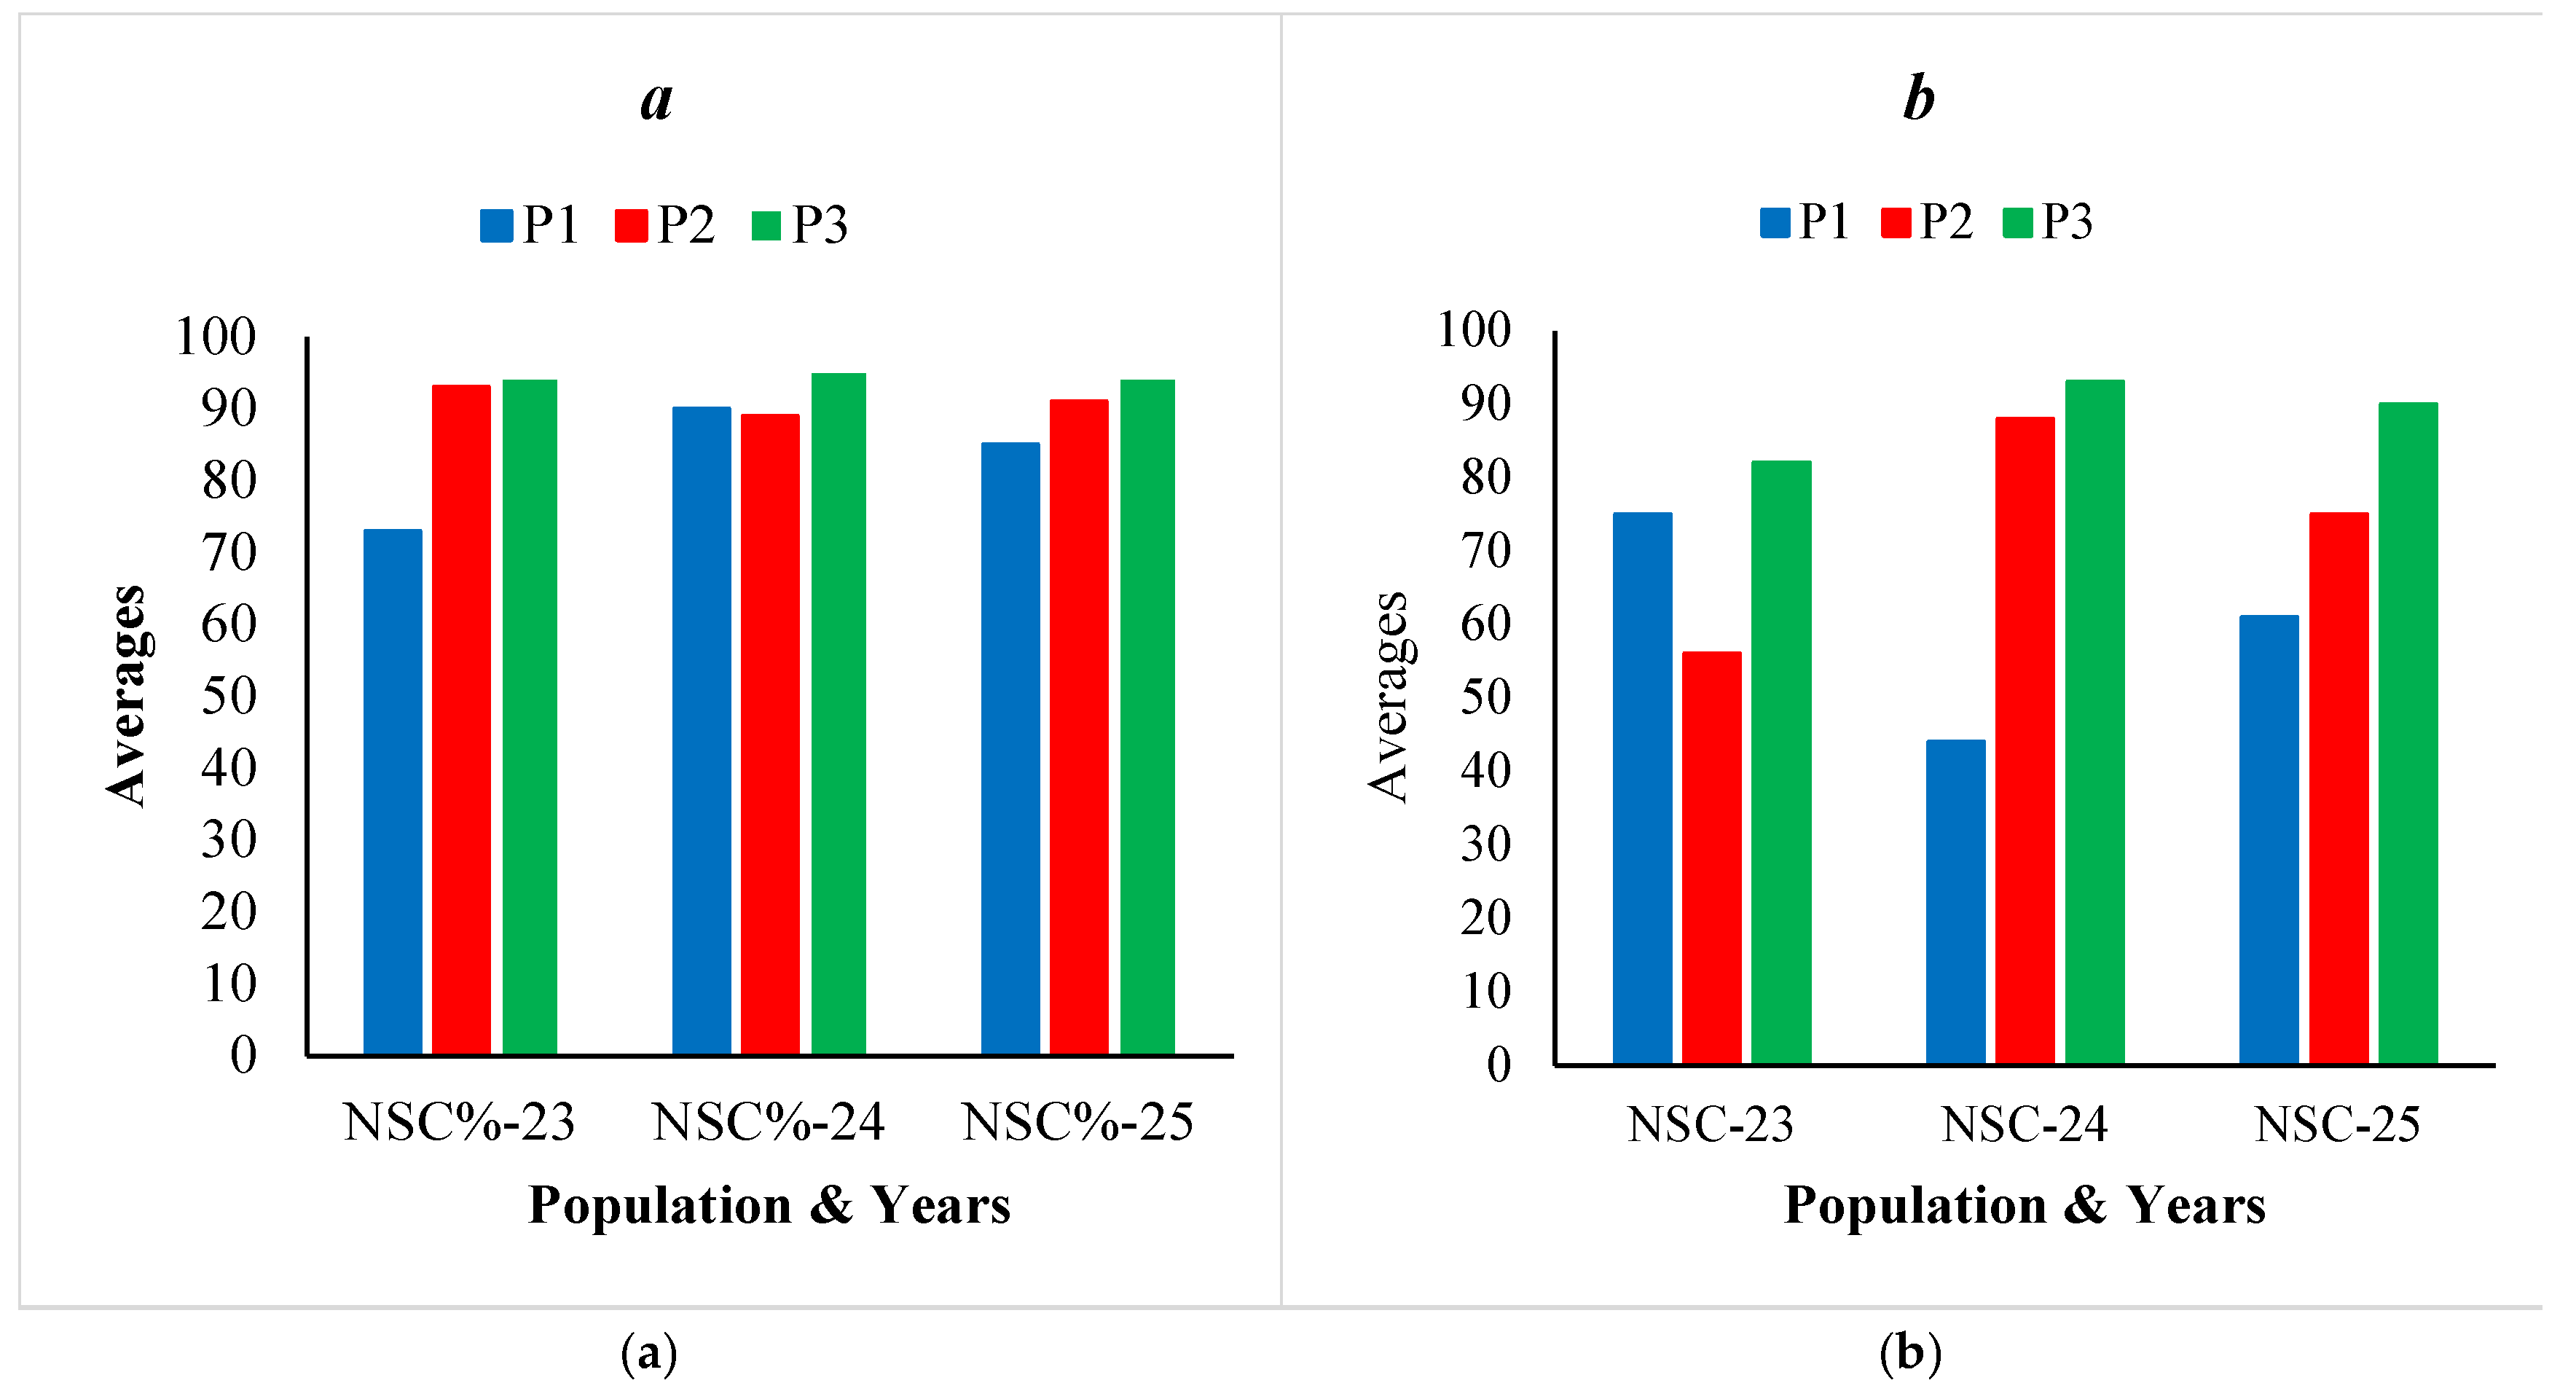
Figure 3.
Parental-balance curves for cone (NC) and seed production (number of filled seeds per tree: NST) during the studied years (2023-2025) in the seed stands P1, P2 and P3 of Taurus cedar.
Figure 3.
Parental-balance curves for cone (NC) and seed production (number of filled seeds per tree: NST) during the studied years (2023-2025) in the seed stands P1, P2 and P3 of Taurus cedar.
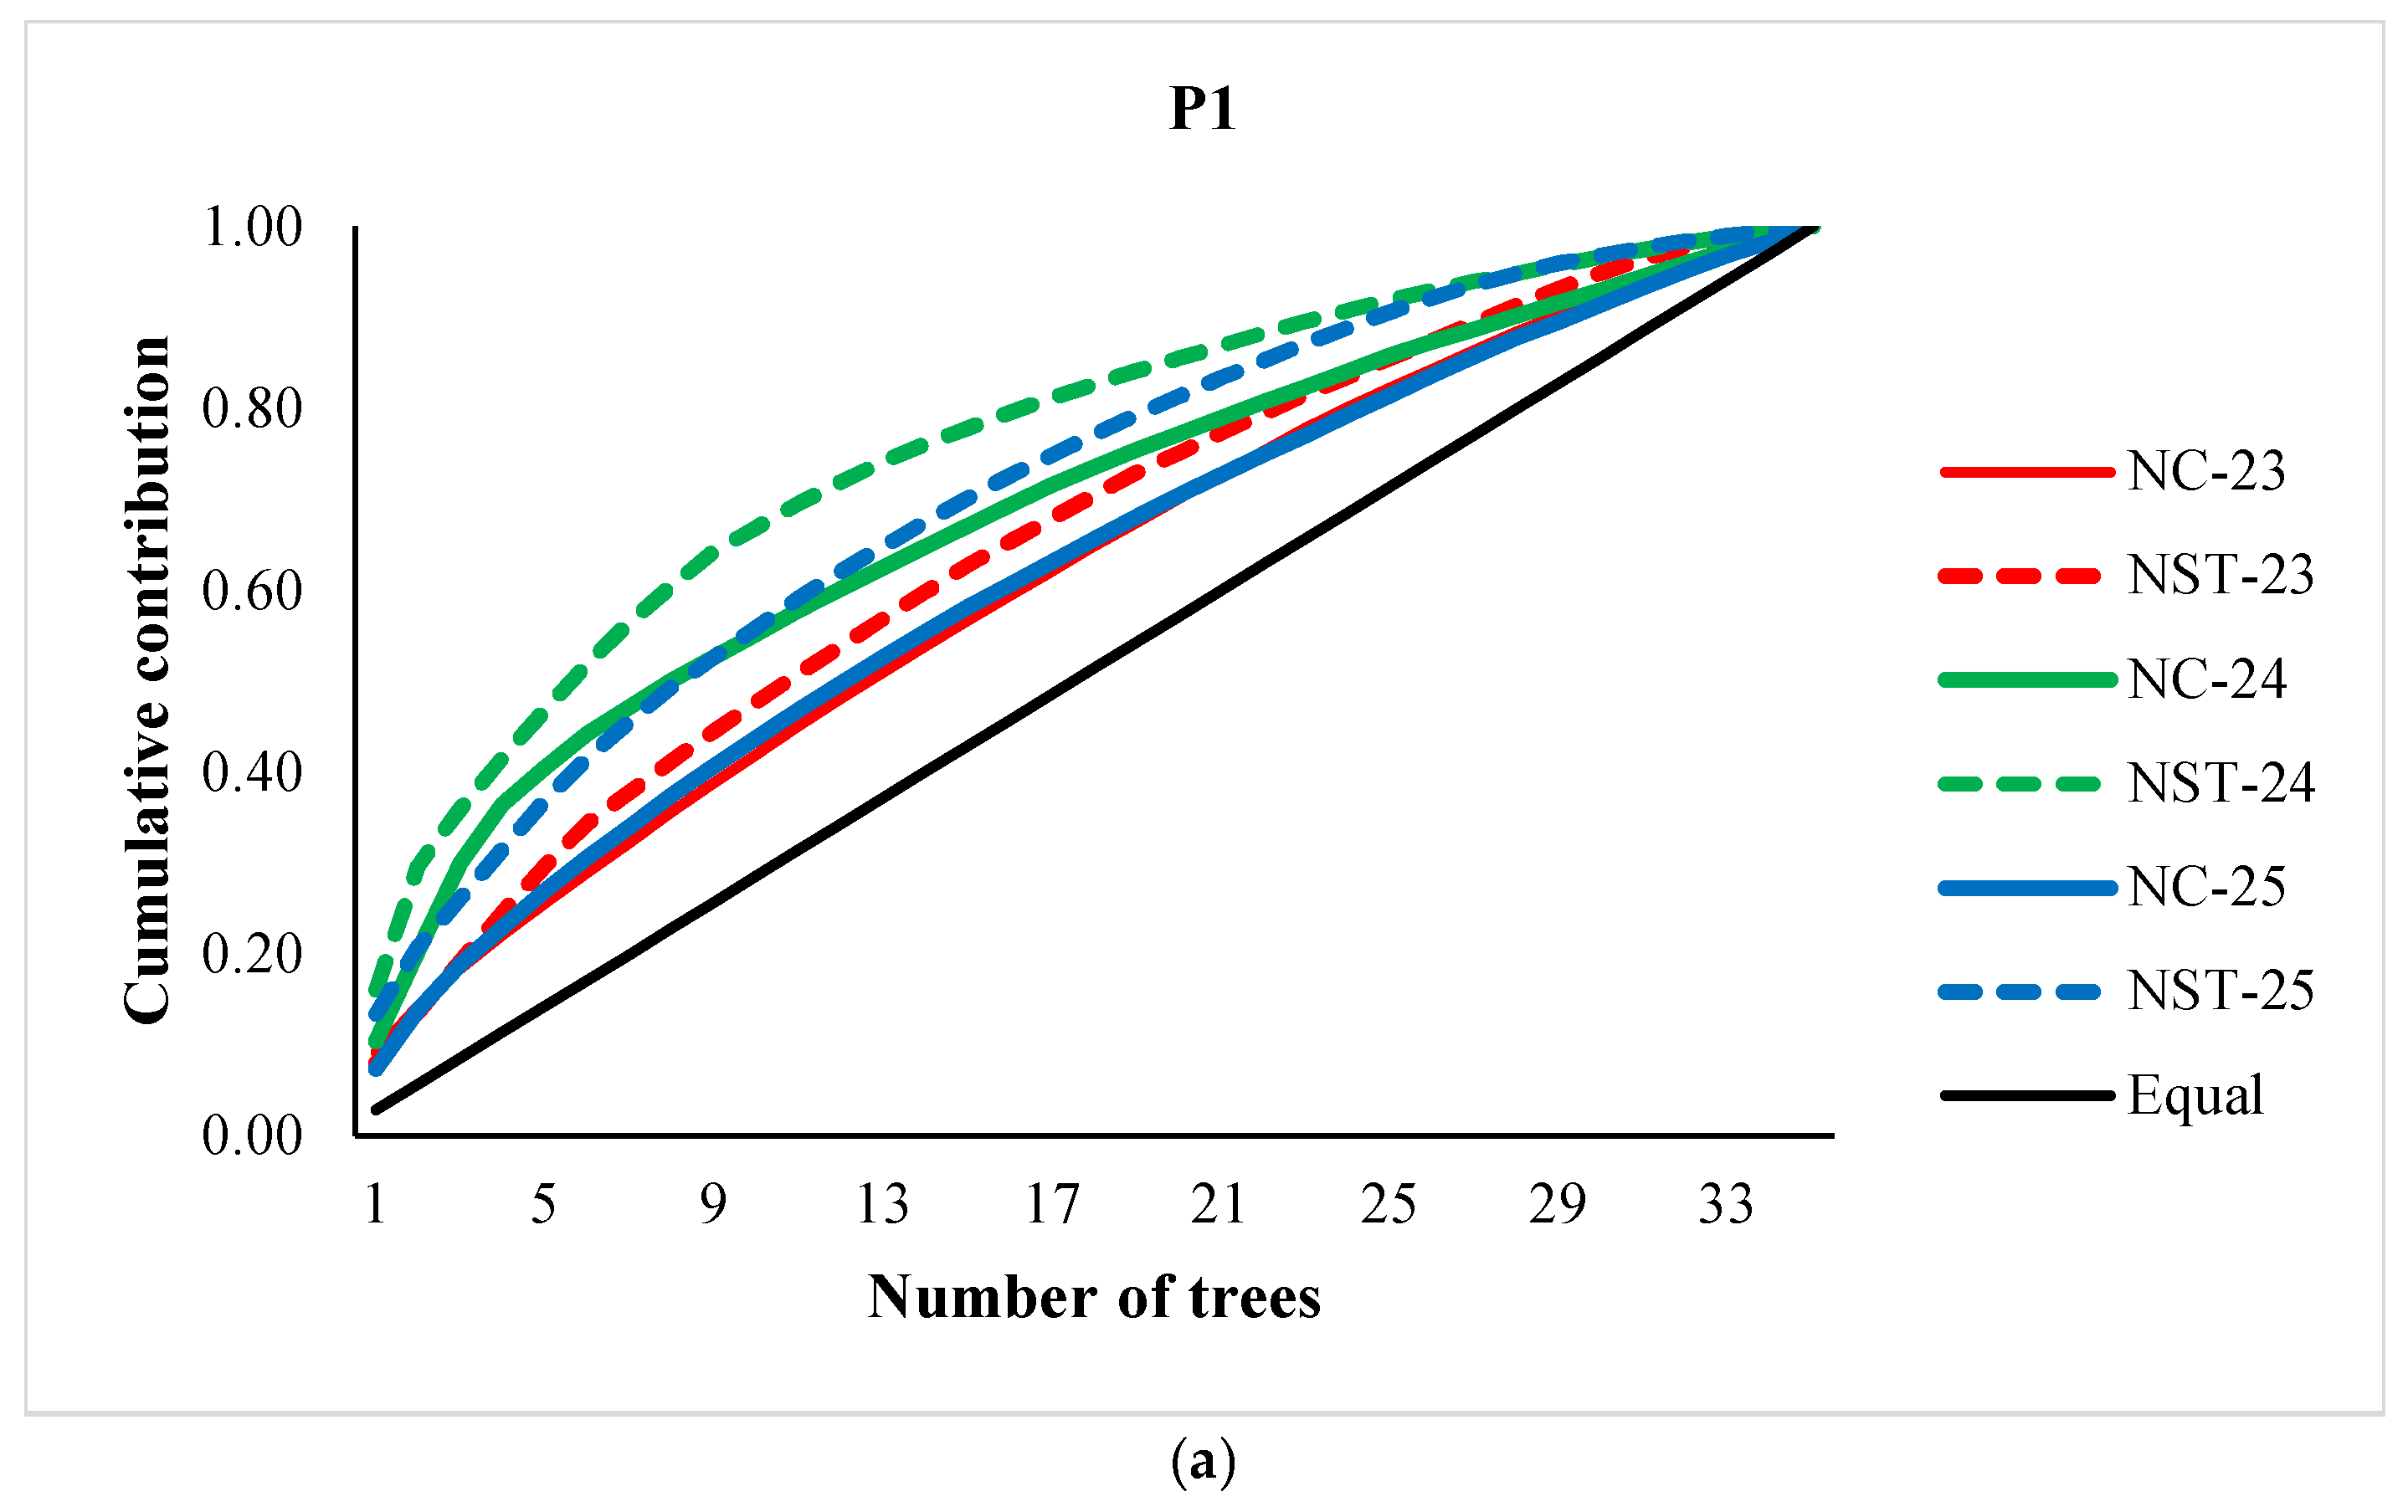
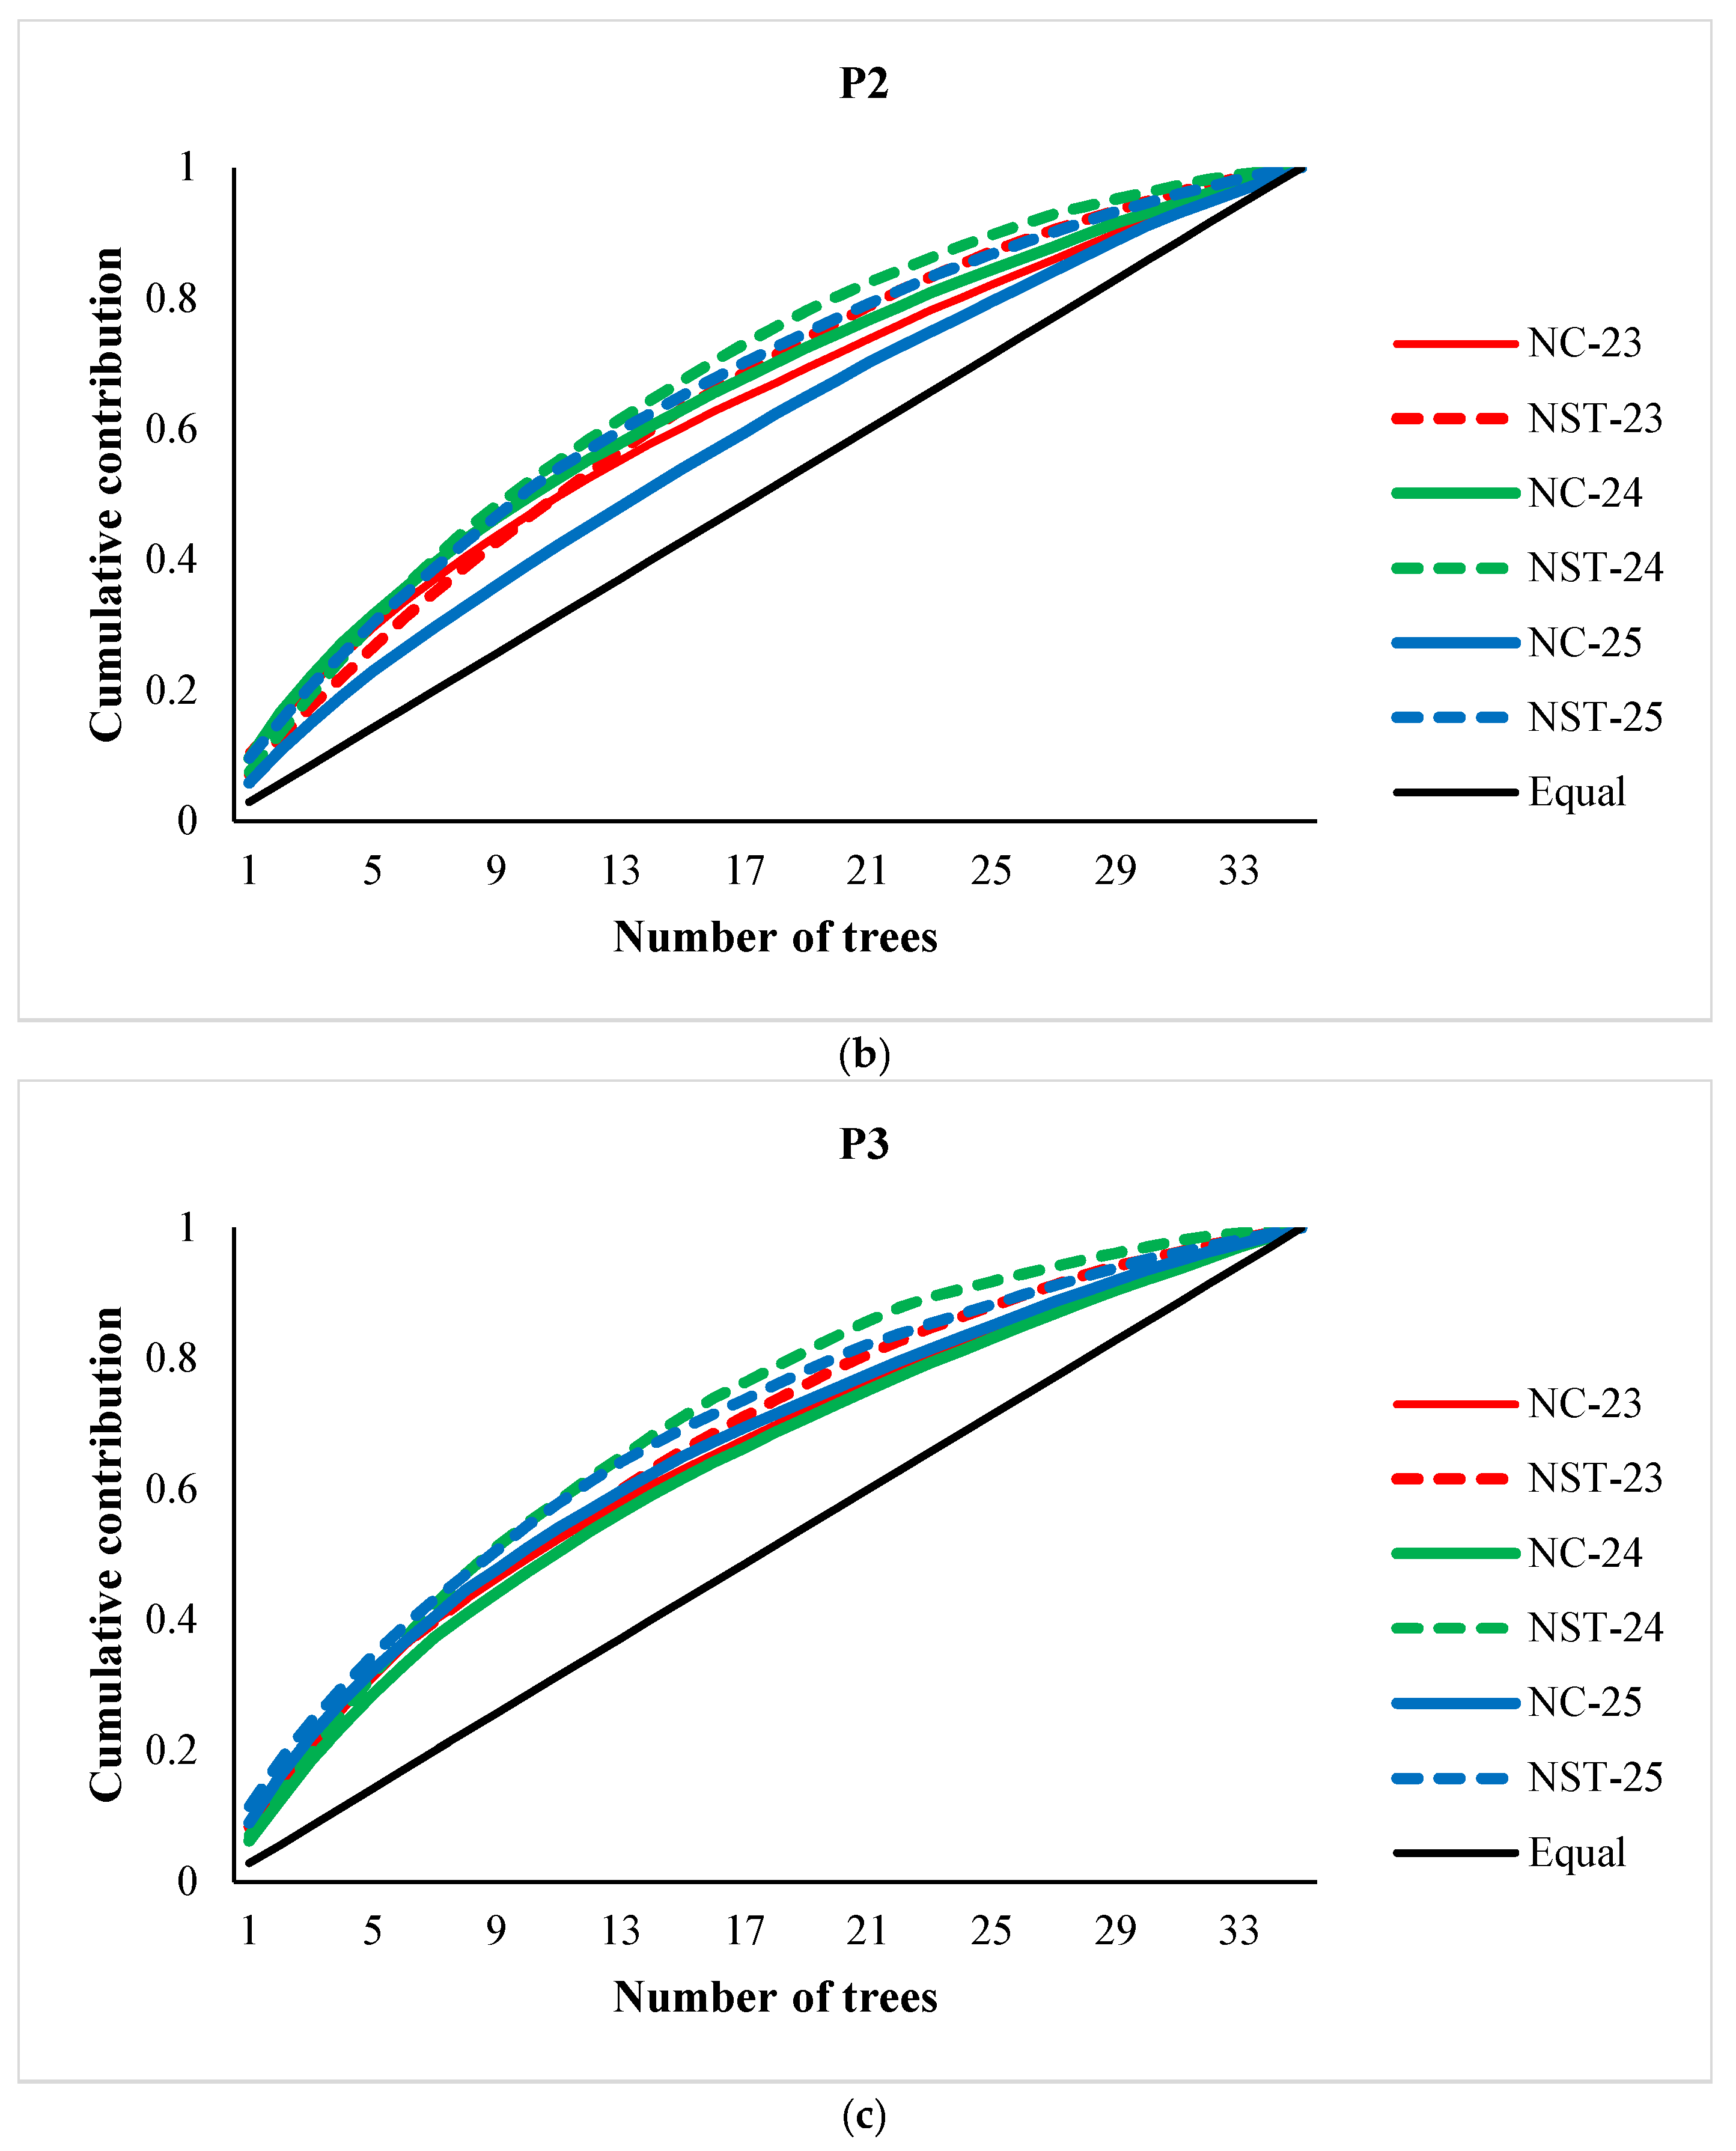
Figure 4.
Parental-balance curve in the bulked individuals and years of the three seed stands.
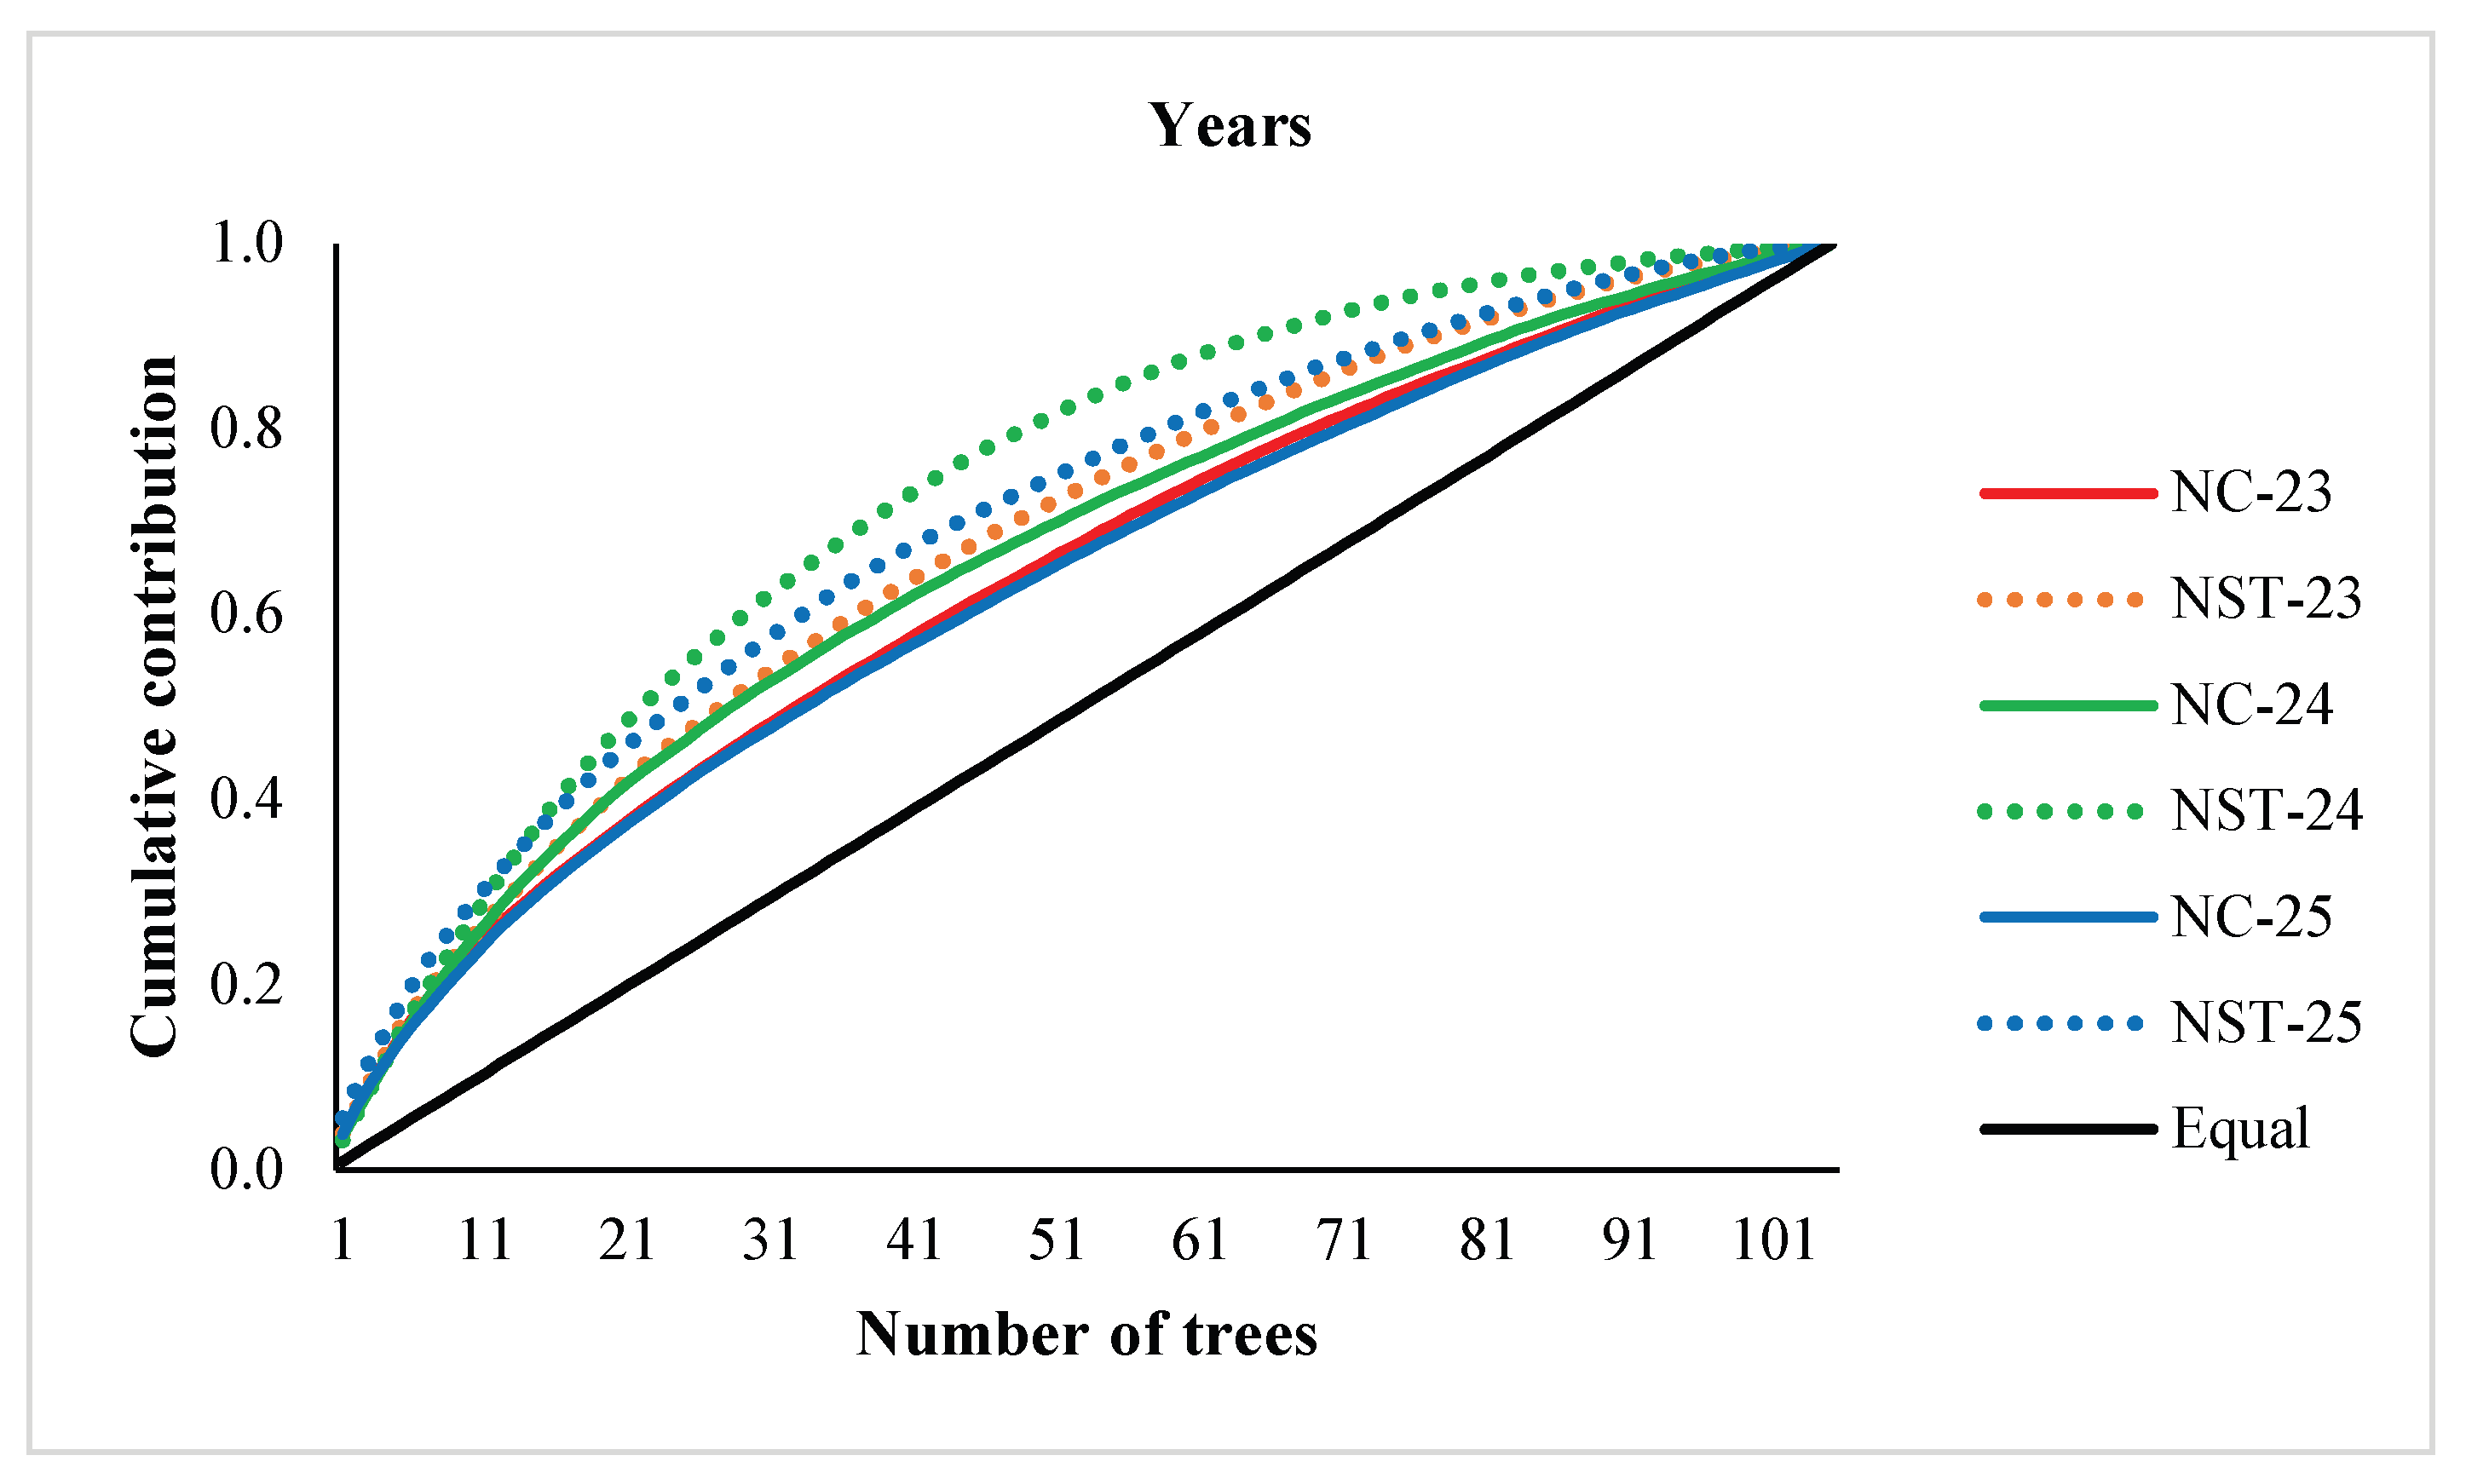

Table 1.
Geographic information (latitude, longitude, altitude), age, size and stand density of the seed stands (populations P1, P2 and P3 from now on) of Taurus cedar.
Table 1.
Geographic information (latitude, longitude, altitude), age, size and stand density of the seed stands (populations P1, P2 and P3 from now on) of Taurus cedar.
| Seed Stand code | Latitude (N) |
Longitude (E) | Altitude (m) |
Stand age (year) | Size (ha) |
Density (trees/ha) |
| P1 | 38°05′23′′ | 30°42′20′′ | 1,600 | 60 | 77.0 | 800 |
| P2 | 37°44′47′′ | 30°49′21′′ | 1,600 | 118 | 48.9 | 650 |
| P3 | 37°51′00′′ | 31°19′10′′ | 1,550 | 149 | 23.0 | 450 |
Table 2.
Mean, coefficient variation (CV) and range for the number of cones (NC), percentage (NSC%) and number (NSC) of filled seeds per cone, and total number of filled seeds (NST) per tree in the three seed stands (P1, P2 and P3) during three studied years (2023-2025).
Table 2.
Mean, coefficient variation (CV) and range for the number of cones (NC), percentage (NSC%) and number (NSC) of filled seeds per cone, and total number of filled seeds (NST) per tree in the three seed stands (P1, P2 and P3) during three studied years (2023-2025).
| P1 | P2 | P3 | Pooled | ||||||||
| Years | Mean | CV | Range | Mean | CV | Range | Mean | CV | Range | Mean | CV |
| 2023 | |||||||||||
| NC | 28 | 0.48 | 12-90 | 23 | 0.58 | 12-86 | 36 | 0.58 | 14-110 | 29 | 0.59 |
| NSC% | 73 | 0.17 | 37-95 | 93 | 0.04 | 83-100 | 94 | 0.04 | 80-98 | 87 | 0.14 |
| NSC | 75 | 0.30 | 22-120 | 56 | 0.44 | 12-140 | 82 | 0.32 | 19-131 | 71 | 0.38 |
| NST | 2135 | 0.55 | 374-5940 | 1240 | 0.51 | 192-3080 | 2906 | 0.62 | 742-8580 | 2094 | 0.70 |
| 2024 | |||||||||||
| NC | 20 | 0.85 | 8-72 | 29 | 0.61 | 12-98 | 27 | 0.50 | 14-60 | 25 | 0.65 |
| NSC% | 90 | 0.11 | 66-100 | 89 | 0.11 | 65-100 | 95 | 0.04 | 84-100 | 91 | 0.09 |
| NSC | 44 | 0.59 | 13-110 | 88 | 0.53 | 18-177 | 93 | 0.43 | 16-173 | 75 | 0.59 |
| NST | 895 | 1.19 | 156-5040 | 2325 | 0.62 | 396-6109 | 2715 | 0.69 | 320-6688 | 1978 | 0.85 |
| 2025 | |||||||||||
| NC | 18 | 0.45 | 10-48 | 20 | 0.31 | 12-40 | 28 | 0.63 | 12-90 | 22 | 0.57 |
| NSC% | 85 | 0.14 | 51-100 | 91 | 0.06 | 72-97 | 94 | 0.04 | 85-100 | 90 | 0.01 |
| NSC | 61 | 0.53 | 16-120 | 75 | 0.43 | 18-130 | 90 | 0.37 | 19-164 | 75 | 0.45 |
| NST | 1165 | 0.85 | 160-5472 | 1482 | 0.62 | 288-5000 | 2518 | 0.76 | 760-10152 | 1722 | 0.85 |
| Pooled | |||||||||||
| NC | 22 | 0.63 | 8-90 | 24 | 0.58 | 12-98 | 31 | 0.59 | 12-110 | 26 | 0.61 |
| NSC% | 83 | 0.16 | 37-100 | 91 | 0.07 | 65-100 | 94 | 0.04 | 80-100 | 89 | 0.11 |
| NSC | 60 | 0.50 | 13-120 | 73 | 0.51 | 12-177 | 88 | 0.38 | 16-173 | 74 | 0.48 |
| NST | 1399 | 0.86 | 156-5940 | 1682 | 0.68 | 192-6109 | 2713 | 0.68 | 320-10152 | 1931 | 0.80 |
Table 3.
Analysis of variance (ANOVA) for the number of cones (NC), percentage (NSC%) and number of filled seeds per cone (NSC) and number of filled seeds per tree (NST) among years and seed stands.
Table 3.
Analysis of variance (ANOVA) for the number of cones (NC), percentage (NSC%) and number of filled seeds per cone (NSC) and number of filled seeds per tree (NST) among years and seed stands.
| Source | Variable | d.f. | Mean square | F | P |
|---|---|---|---|---|---|
| Stand (S) | NC | 2 | 2103.581 | 9.427 | ** |
| NSC% | 2 | 3774.421 | 60.731 | ** | |
| NSC | 2 | 20765.343 | 19.774 | ** | |
| NST | 2 | 50229040.060 | 26.239 | ** | |
| Year (Y) | NC | 2 | 1287.114 | 5.768 | * |
| NSC% | 2 | 661.029 | 10.636 | ** | |
| NSC | 2 | 557.867 | .531 | NS | |
| NST | 2 | 3811994.994 | 1.991 | NS | |
| S x Y interaction | NC | 4 | 625.881 | 2.805 | * |
| NSC% | 4 | 1204.025 | 19.373 | ** | |
| NSC | 4 | 8862.324 | 8.439 | ** | |
| NST | 4 | 11881578.603 | 6.207 | ** | |
| Error | NC | 306 | 223.147 | ||
| NSC% | 306 | 62.150 | |||
| NSC | 306 | 1050.127 | |||
| NST | 306 | 1914322.016 |
**, *, and NS indicate statistically significant difference at the probability level 0.01, 0.05 and non-significant, respectively.
Table 4.
Fertility variation among seed trees in cone (ΨC) and filled seed (ΨS) fertility, and effective number of parents for cone (NP(C)) and filled seed (NP(S)), and gene diversity for cone (GDC) and seed (GDS) in the seed stand for the years of 2023, 2024 and 2025.
Table 4.
Fertility variation among seed trees in cone (ΨC) and filled seed (ΨS) fertility, and effective number of parents for cone (NP(C)) and filled seed (NP(S)), and gene diversity for cone (GDC) and seed (GDS) in the seed stand for the years of 2023, 2024 and 2025.
| P1 | P2 | P3 | Pooled | |||||||||||||
|---|---|---|---|---|---|---|---|---|---|---|---|---|---|---|---|---|
| Years | 23 | 24 | 25 | Total | 23 | 24 | 25 | Total | 23 | 24 | 25 | Total | 23 | 24 | 25 | Total |
| ΨC* | 1.22 | 1.71 | 1.20 | 1.40 | 1.33 | 1.36 | 1.10 | 1.33 | 1.33 | 1.24 | 1.38 | 1.34 | 1.34 | 1.42 | 1.32 | 1.36 |
| ΨS | 1.29 | 2.38 | 1.71 | 1.73 | 1.25 | 1.38 | 1.37 | 1.46 | 1.38 | 1.46 | 1.56 | 1.46 | 1.48 | 1.71 | 1.71 | 1.63 |
| NP(C) | 28.7 | 20.5 | 29.2 | 75.6 | 26.4 | 25.7 | 32.0 | 79.0 | 26.3 | 28.6 | 25.3 | 78.3 | 78.4 | 74.0 | 79.6 | 231.5 |
| Nr(C)** | 0.82 | 0.59 | 0.84 | 0.72 | 0.75 | 0.73 | 0.91 | 0.75 | 0.75 | 0.81 | 0.72 | 0.75 | 0.74 | 0.71 | 0.76 | 0.74 |
| NP(S) | 27.1 | 14.7 | 20.5 | 60.9 | 28.0 | 25.4 | 25.5 | 72.0 | 25.4 | 24.0 | 22.5 | 71.9 | 71.0 | 61.3 | 61.5 | 193.8 |
| Nr(S) | 0.77 | 0.42 | 0.59 | 0.58 | 0.80 | 0.73 | 0.73 | 0.69 | 0.73 | 0.69 | 0.64 | 0.69 | 0.68 | 0.58 | 0.59 | 0.62 |
| GDC | 0.983 | 0.976 | 0.983 | 0.993 | 0.981 | 0.981 | 0.984 | 0.994 | 0.981 | 0.982 | 0.980 | 0.994 | 0.994 | 0.993 | 0.994 | 0.998 |
| GDS | 0.982 | 0.966 | 0.976 | 0.992 | 0.982 | 0.980 | 0.980 | 0.993 | 0.980 | 0.979 | 0.978 | 0.993 | 0.993 | 0.992 | 0.992 | 0.997 |
*; C and S represent cone and filled seed productions, respectively, **; relative effective number Nr= Np/N.
Disclaimer/Publisher’s Note: The statements, opinions and data contained in all publications are solely those of the individual author(s) and contributor(s) and not of MDPI and/or the editor(s). MDPI and/or the editor(s) disclaim responsibility for any injury to people or property resulting from any ideas, methods, instructions or products referred to in the content. |
© 2026 by the authors. Licensee MDPI, Basel, Switzerland. This article is an open access article distributed under the terms and conditions of the Creative Commons Attribution (CC BY) license.
Copyright: This open access article is published under a Creative Commons CC BY 4.0 license, which permit the free download, distribution, and reuse, provided that the author and preprint are cited in any reuse.


