Submitted:
04 February 2026
Posted:
05 February 2026
You are already at the latest version
Abstract
The agriculture sector in Nepal is highly vulnerable to climate change due to its traditional practices, limited technological intervention, and low adaptive capacity. Owing to the country's complex topography, the impacts of climate change are spatially heterogeneous, making local-level climate change assessments highly relevant. This study focuses on the impact of climate change on three major crops (rice, wheat, and maize), in the Doti district of Nepal, based on meteorological records, crop yield data, questionnaire surveys, and focus group discussions. Climate records from 1982 to 2022 show a trend in annual rainfall at a rate of -3.28 mm per year, with a particularly pronounced decline during the monsoon season. Both maximum and minimum temperatures exhibit statistically significant increasing trends of 0.01°C and 0.03°C per year, respectively. The most significant warming for maximum temperature occurs during the monsoon season, while minimum temperature shows the highest increase during the pre-monsoon season. During the same period, annual yields of paddy, maize, and wheat show statistically significant increasing trends. These trends in climate variables and crop yields align with the perceptions of local communities. Linear correlation analysis indicates that maximum and minimum temperatures have a positive influence on crop yields, whereas precipitation and diurnal temperature range have negative effects. Among these, minimum temperature has the greatest impact on crop yields, followed by maximum temperature and rainfall. Multiple linear regression analysis reveals that climate variables better explain long-term trends in crop yields rather than year-to-year variability. The impact of climate is most pronounced in wheat where climate variables account for approximately 55% of the yield variability, followed by paddy (R² ~ 49%) and maize (R² ~ 20%). Despite the overall increase in crop yields, inter-annual variability has grown, consistent with increased variability in climate parameters. To cope with this uncertainty, local communities have adopted various adaptation strategies, including the use of improved seed varieties, green manure, and changes in crop types. Other key practices include the use of inorganic fertilizers, selection of short-duration crops, crop rotation, minimum tillage farming, and river conservation.
Keywords:
climate change
; agriculture production
; people’s perception
1. Introduction
Climate plays a crucial role in agricultural production (Keane et al., 2009; Lybbert & Sumner 2012). Hence, any variability and change in climate system therefore has significant impacts on agricultural productivity. Recent climate change, as evident by the unprecedented rise in global temperature, changing weather patterns, severe extreme events, and increasing frequency of climate induced hazards, has serious threat for agricultural productivity (IPCC 2021).
The impact of climate change on agriculture can be both direct and indirect. Direct impacts are due to modification of climatic variables such as temperature and precipitation and changes in the frequency of extreme events such as droughts, floods, and heatwaves can damage crops and alter growing seasons (Lobell et al., 2011; Zhao et al., 2017; Hultgren et al., 2025). Indirect impacts arise from the broader environmental shifts triggered by climate change, such as the spread of pests and diseases, changes in soil fertility, and water stress (Shrestha 2019; Luck et al., 2011). However, the nature and magnitude of these impacts vary considerably across different regions of the world (Keane et al., 2009).
Agriculture plays a crucial role in Nepal’s economy and social structure, with more than 60% of households directly dependent on farming activities (Mohon, 2020). The sector accounts nearly 25% of the national gross domestic product (Bocchiola et al., 2019). Regardless of this significance, Nepal’s agricultural sector is highly vulnerable to climate change because of limited adaptive capability, lack of latest technological interventions, and high dependency on climatic conditions (Selvaraju, 2014). For example, approximately 50% of agricultural lands in Nepal are still rain-fed, making crop production highly vulnerable to rainfall variability and other climate extremes (Pradhan & Belbase, 2018). Some of the key indicators of climate change in Nepal include unprecedented rise in air temperature, decreasing precipitation patterns, increasing frequency and intensity of extreme weather events such as floods, droughts, and heat waves (The World Bank Group, 2022). These climate-induced hazards are expected to intensify in future, putting tremendous pressure on predominantly rain-fed agricultural system (Dawadi et al., 2022).
Many studies have examined the impact of climate change on agriculture in Nepal, primarily focusing on farmer’s perception (Manandhar et al., 2011; Gartaula et al., 2012; Poudel et al., 2017; Khanal et al., 2018; Hussain et al., 2018; Shrestha et al., 2022). Other studies have investigated the trends in climatic variables and agricultural productions (Bhatt et al., 2014; Paudel et al., 2014; Dhakal et al., 2016; Shrestha et al., 2017; Dahal et al., 2018; Dawadi et al., 2022), while few studies have explored the quantitative relationship between climate variables and crop yield (Acharya & Bhatt 2013; Chalise et al., 2017; Bocchiola et al., 2019; Rayamajhee et al., 2021). However, the far-western region of Nepal, identified as highly vulnerable to climate change and very low adaptive capability, remains understudied (MoFE, 2021).
The far-western district of Doti was chosen for this study for two main reasons. First, it has been ranked as "very-high" in climate change vulnerability district by the Ministry of Forest and Environment of Nepal (MoFE, 2021). Second, the agricultural practices in Doti are still conventional and predominantly rain-fed with limited access to irrigation and very low adaptive capability (MoFE 2021). As a result, Doti becomes a critical case for examining highly vulnerable climate-agriculture interactions in Nepal`s far-western hills.
This study investigates the impact of climate change on three major cereal crops—paddy, wheat, and maize—in the Doti District, Nepal, using crop production and meteorological data spanning the period from 1982 to 2022, along with a social survey data. Specially, the study aims to (i) analyse trends and variability in key meteorological variables, (ii) examine change in crop production over the time (iii) assess the relationship between climatic variables and crop production, and (iv) evaluate farmers' perceptions of climate change and agricultural impacts and compares these perceptions with observed meteorological and agricultural production datasets.
2. Study Area, Data, and Methods
2.1. Study Area
This study was conducted in the Doti district, located in Sudurpaschim Province of far western region of Nepal (Figure 1). The district is situated between 28°54' - 29°28' latitude and 80° 30' - 81°14' longitudes covering a total area of 2,025 km2. Its elevation range between 600m to 4,000m above sea level, resulting in distinct agroecological and climatic conditions.
The climate of Doti is subtropical characterized by hot and humid summers and cold, dry winters (Figure 2). The district exhibits pronounced seasonal variability in precipitation (PCP) with high rainfall during the monsoon season (June to September) and considerably lower precipitation in winter (December to February). The Monsoon precipitation accounts for approximately 71% of the annual total, with average monthly values ranging between 150 and 240 mm. In contrast, winter precipitation contributes only 8% of the annual precipitation, with monthly values ranging between 17 and 50 mm. The mean annual rainfall of the district is approximately 1,600 mm.
Both maximum (TMAX) and minimum (TMIN) temperatures show a similar seasonal cycle, with higher temperatures during summer and lower in winter. TMAX peaks in June (36.6°C), while TMIN reaches its maximum in July (24.2°C). The diurnal temperature range (DTR) is lowest during the summer season (10–13°C) and considerably higher in winter as well as the pre- and post-monsoon seasons. The DTR values observed during the pre-monsoon season, typically ranging between 16 and 19°C.
2.2. Data Collection
The study utilises both primary and secondary data sources. The secondary data include monthly meteorological observations and annual crop yield records. Monthly meteorological data for Dipayal meteorological station were obtained from the Department of Hydrology and Meteorology (DHM), Government of Nepal. The variables used include maximum temperature, minimum temperature, and precipitation covering the period from 1982 to 2022. The diurnal temperature range (DTR)was derived as the difference between TMAX and TMIN. Annual crop production data for the same period were obtained from the Ministry of Agriculture and Livestock Development, Government of Nepal.
Primary data were collected through a questionnaire survey conducted in three municipalities of Doti district namely KI Singh Rural Municipality, Dipayal Silgadhi Municipality and Shikhar Municipality. There are nine municipalities in Doti district that ranges from low-to high land areas. To represent key climatic and geographical variations within the district, we selected three municipalities based upon time and resources available: one from low land area, one from mid, and one from high land area. Within these three municipalities,12 villages were randomly selected for household surveys (Table 1).
The households were surveyed through interviews conducted between 2 July to 29 July 2023, using a semi-structured questionnaire. The questionnaire focused on three key aspects:
i) socio-economic profile of households,
ii) people’s perception on climate change and agriculture practices and
iii) community-level climate change adaptation strategies.
The optimal sample size was determined using Slovin’s formaula (Tejada & Punzalan 2012):
where n is the sample size, N is the population size, and e is the margin of error or significance level. A 5% confidence level was assumed for the study.
n = N / (1 + Ne²)
Based on the above formula and calculations, the sample size was determined to be 367. In this study, a household survey was conducted, where one household represents one sample unit. Therefore, a sample size of 367 corresponds to 367 households.
Interviews were conducted with the head of household members to ensure reliable information. To complement the quantitative data, focus group discussions (FGDs) were organized in each municipality. Each FGD comprised 5-7 participants, comprising farmers, local representatives, members from community-based organizations etc. The aim of these FGDs is to explore broader socio-economic and community-level dynamics, especially those influencing climate adaptation and agricultural practices.
2.3. Methods
Long-term trends in annual climatic variables (TMAX, TMIN, PCP, DTR) and crop yields were analysed using the non-parametric trend analysis techniques. The Sen’s slope method was used to estimate magnitude of linear trends (Sen 1968), while the Mann-Kendall test was applied to detect statistical significance (Mann 1945; Kendall 1975). These methods are widely used against non-normal data distribution and outliers.
To establish a relationship between climate variables and crop yields, Pearson’s correlation coefficient was calculated followed by a significance test based on the t-distribution (Obilor & Amadi 2018). The variability in climatic variables was determined using the coefficient of variation (CV), computed by dividing the standard deviation by the mean values.
To quantify the impact of climate variables on crop yield, a multiple linear regression model was employed (Uyanik & Güler 2013). The multiple regression model relates dependent variables (Y) to multiple independent variables (X) as follows:
where Y represent crop yield, β0 is the intercept, β1–β4 are the regression coefficients, and ɛ is the residual. Y in our case is annual crop yields. The independent variables X1, X2, X3 and X4 correspond to the annual mean TMAX, TMIN, PCP and DTR, respectively.
Y = βo + β1 X1 + β2 X2 + β3 X3 + β4 X4 + ɛ
3. Results and Discussion
3.1. Socio-Economic Background
The household survey covered 367 respondents aged 18 to 82 years, with majority being adults. The majority of respondents were between 35 and 55 years, highlighting a predominance of middle-aged household heads actively engaged in livelihood activities. The ethnic composition was 63.8% Chhetri 23.1% Brahmin, and 13% Dalit.
Literacy levels were high, with 96% of households having at least one literate family member. However, educational attainment remains limited: 39.6% had completed only primary education, 26.8% secondary education, and just 5.0% had attained a graduate degree, while post-graduate education was almost negligible (0.2%). This limited higher education may act as barrier for farmers to acquire climate information and adopt sustainable farming practice.
Agriculture was the dominant livelihood activity for over 80% of household, often combined with other income sources highlighting livelihood diversity. A substantial proportion of household (39%) had at least one member engaged in foreign employment, and 21% relied on non-agricultural labour, underscoring the importance of both migration and informal work. Only11% had employed in private or government sector jobs. Very few were engaged in their own businesses (3%).
Regarding farming system, 61.4% of households practised a combination of rain-fed and irrigated farming, while 28.7% relied solely on rain-fed farming. The majority of respondents (78.7%) reported that the existing irrigation systems were insufficient to meet crop water requirement. The high dependence on rainfall and limited access to irrigation, households are more vulnerable to climate fluctuation and extreme weather.
3.2. Climate Change Trends and Variability
To assess the long-term change in climatic pattern, the trends of annual PCP, TMAX, TMIN, and DTR were analysed for the period of 1982 – 2022(Figure 3). Both TMIN and TMAX show increasing trends whereas PCP and DTR exhibit negative trends. The annual PCP shows a gradual decreasing trend at the rate of -3.28 mm year-1, however the trend is not statistically significant (Figure 3a). Similar declining precipitation trends were obtained for western Nepal in the period between 1980 and 2007 using APHRODITE gridded database (Pokharel et al., 2020). Similarly, at national level, Luo et al. (2024) reported decreasing annual precipitation trend of –1.17 mm year⁻¹ using meteorological station data. The notable decreasing trend observed in the Doti district, nearly three times the national average, highlights how large-scale changes in rainfall patterns manifest heterogeneously at the local level.
The annual TMAX increased over time at a rate of 0.01°C year-1 (Figure 3b) while TMIN increased more rapidly at a rate of 0.03 °C year-1 (Figure 3c). These results are consistent with the overall temperature trends observed across Nepal, though the magnitude of change differ. At national scale, the increasing trend in TMAX (0.045 °C year⁻¹, p < .001) is much higher than that in TMIN (0.009 °C year⁻¹, p < .05)(Thakuri et al., 2019). In contrast, Doti shows a more rapid rise in TMIN than TMAX , suggesting opposite relation compared to the national pattern. This indicates that local-scale warming can differ substantially from large-scale trends, likely due to topographic influences (You et al., 2010) and microclimatic factors (Kattel & Yao, 2013).
The asymmetry trends of warming rates result in statistically significant decreasing trend in DTR of -0.03oC year-1 (Figure 3d). The decreasing trend in DTR indicates that the difference between daily TMAX and TMIN is becoming smaller over time. Hamal et al. (2021) reported a similar decreasing DTR trend for Nepal, with an annual rate of –0.009 °C year⁻¹, based on reanalysis and CMIP6 model datasets. The stronger decline in DTR in Doti indicates that night-time warming is pronounced in the far-western region (Xu et al., 2025).
Among four climatic variables, PCP shows the largest interannual variability, with a coefficient of variation of 19%. Precipitation typically exhibits the highest interannual variability because of its strong sensitivity to large-scale atmospheric circulation patterns and monsoon dynamics (Dai, 2013). In Nepal, variations in monsoon rainfall are strongly influenced by major modes of climate variability such as the El Niño–Southern Oscillation (ENSO) and the Indian Ocean Dipole (IOD), which affect both the intensity and spatial distribution of precipitation (Sharma et al., 2020; Sigdel & Ikeda, 2012). Consequently, this high interannual variability often obscures long-term precipitation trends, leading to statistically insignificant results even when underlying changes are present (Zhang et al., 2007; Trenberth, 2011). This characteristic helps to explain why the annual precipitation trend for the Doti district is not statistically significant.
Both TMIN and TMAX show considerably lower variability compared to PCP, with TMAX exhibiting the lowest variability. Notably, the coefficient of variation for TMIN (~ 4%) is approximately double than that of TMAX (CV~ 2%). Previous studies have shown that night-time minimum temperatures are sensitivity to local atmospheric and surface conditions, such as cloud cover, humidity, and boundary-layer dynamics because of which they fluctuate more than daytime maximum temperatures (Vose et al., 2005). In contrast, TMAX is more directly influenced by solar radiation, which exhibits relatively lower interannual variability (Karl et al., 1993; Easterling et al., 1997). Accordingly, the lower coefficients of variation for TMAX and TMIN compared to PCP are consistent with previous studies across Nepal and the broader Himalayan region, which have reported gradual warming accompanied by relatively low year-to-year fluctuations (Shrestha et al., 1999; Kattel et al., 2013).
Interesting, the variability for DTR is higher (CV~ 6%) than either TMIN and TMAX. The variability of DTR is primarily driven by fluctuations in TMAX as evidenced by the similarity between interannual variability patterns of DTR as and TMAX. This suggests that change in daytime temperatures exert a dominant influence on DTR variability. A similar pattern also observed in other mountainous regions, where local radiative and surface processes strongly modulate temperature dynamics (Kattel et al., 2013; Shen et al., 2014; Davy et al., 2017).
To demonstrate seasonal differences, the climatic trends and variability were analysed for four seasons: pre-monsoon (March–May), monsoon (June–September), post-monsoon (October–November), and winter (December–February) (Table 2). The seasonal trend analysis reveals notable changes in climate variables throughout the year.
PCP shows a declining trend in all seasons except the post-monsoon, where no statistically significant change is observed. The most prominent and statistically significant decline occurs during the monsoon season (-2.53 mm year⁻¹) followed by notable decline during in the pre-monsoon (-1.36 mm year⁻¹), while the winter season shows a modest negative trend of -0.86 mm year⁻¹. The winter precipitation in Nepal has exhibited a statistically significant decreasing trend. These findings aligns with recent studies, showing a long-term decrease in winter rainfall from 1977 (Bagale et al., 2024). However, the decline is not spatially uniform; rather, it shows considerable regional variability, with some areas—particularly in western hills —experiencing more pronounced drying trends (Karki et al., 2017; Sigdel & Ma, 2017).
Seasonal variability in precipitation is seen across the year. PCP is most variable during the post-monsoon season (CV ~ 178%), whereas the monsoon season exhibits the lowest variability (CV ~ 21%). The elevated variability during post-monsoon season is due to the withdrawal of the summer monsoon and the gradual onset of the dry winter season which reflects the transitional shift from monsoon to winter circulation contributes to an irregular moisture supply, resulting in high variability (Karki et al., 2017; Luo et al., 2024).
TMAX shows increasing trends in all seasons except the post-monsoon (-0.01 °C year⁻¹). The warming trend is strongest and statistically significant during the pre-monsoon season (0.09 °C year⁻¹), while changes in other seasons are relatively small. TMIN exhibits a consistent and statistically significant warming trend in all four seasons, with the strongest increases during the pre-monsoon (0.10 °C year⁻¹) and monsoon (0.09 °C year⁻¹) seasons. The weakest positive trend is observed in winter (0.03 °C year⁻¹). The pronounced and statistically significant warming of both TMAX and TMIN during the pre-monsoon season aligns with studies across the Himalayan region, which highlight enhanced warming during this transitional period driven by increased atmospheric loading of absorbing aerosols that amplify solar heating (Gautam et al., 2009). DTR trends are generally negative across all seasons, although none are statistically significant. The greatest decrease occurs during the monsoon (-0.07 °C year⁻¹) and post-monsoon seasons, while the smallest decline is seen in the pre-monsoon season (-0.01 °C year⁻¹). This decline is primarily attributed to the significantly higher warming rate of TMIN compared to TMAX during these seasons. The locally observed decrease in DTR contrasts with the overall national trend for Nepal. For instance, Hamal et al. (2021) reported the largest decline in DTR during the pre-monsoon season based on gridded Climate Research Unit datasets, which they linked to a stronger warming in TMIN relative to TMAX. These differences underscore the spatial heterogeneity of warming trends across the country.
The variability in TMAX remains low across all seasons, ranging from 2% to 5%. In contrast, the seasonal variability in TMIN is highest during winter (CV ~ 16%) and lowest during the monsoon (CV ~ 3%). The larger variability in winter could be linked to transient synoptic weather systems associated with western disturbances (Dimri et al., 2015). Interannual variability in DTR is relatively similar across seasons, with slightly higher variation during the post-monsoon (CV ~ 10%) and monsoon (CV ~ 9%) periods. This comparable variability across seasons arises because DTR fluctuations are primarily driven by variations in TMAX. Consistent with this, Hamal et al. (2021) found that seasonal DTR in Nepal is negatively correlated with cloud cover across all four seasons, with comparable magnitudes.
The key findings based on climate data suggests that there is an increasing trend for temperature and a decreasing pattern for precipitation. It is interesting to compare these results with what people of Doti district have experienced about changing climatic conditions. Figure 4 summarises people’s perception towards climate change. The majority of respondents (~86%) are well aware of climate change (Figure 4a). About 87% of respondents believe that the weather pattern is changing over time (Figure 4a).
In terms of temperature, 91% of respondents perceive an increase in summer temperatures (Figure 4b). For winter, 57% of respondents believe that the temperature has increased (Figure 4b). About 60% and 86% of respondents have experienced a decrease in summer and winter precipitation, respectively (Figure 4b). This is consistent with a clear decreasing pattern in both summer and winter precipitation demonstrated by climate data. Many studies in Nepal have assessed climate change from people’s perception (Poudel et al., 2017; Hussain et al., 2018; Shrestha et al., 2022) and only a few studies have attempted to compare meteorological data with local perceptions (e.g., Chaudhary & Bawa 2011). Our results suggest that people’s perception can be a promising source of information in local climate change assessment.
3.2. Trends in Agricultural Production
The annual yield time series for three major crops—paddy, maize, and wheat—from 1982 to 2022 is presented in Figure 5. All three crops exhibit increasing yield trends over the period, albeit with varying magnitudes and degrees of variability. Among them, maize shows the highest and statistically significant long-term linear trend, with an increase of 14.02 kg ha⁻¹ year⁻¹, while paddy shows the smallest increase, at 2.68 kg ha⁻¹ year⁻¹. The nationwide trends for these key crops show positive trends between 1961 to 2010 (Poudel & Chen, 2012) and between 1990 to 2018 (Joshi et al., 2021), consistent with our analysis for Doti district.
Despite the overall upward trend, the rate of yield change varies noticeably across different sub-periods. Notably, yield growth for all three crops plateaued between 2001 and 2010, followed by a marked increase after 2010. To analyse these temporal differences more rigorously, we computed the mean, coefficient of variation (CV), and Sen’s slope estimator for three distinct periods: period 1 (P1, 1982-2000), period 2 (P2, 2001 to 2010) and period 3 (P3, 2011-2022) (Table 3).
For all three crops, the positive trend and interannual variability are highest during P1. For paddy, the mean yield shows a significant increase in both P1 and P3, with a considerably slower positive trend during P2. The coefficient of variation for paddy is highest in P1 and gradually declines over time, indicating a reduction in interannual yield variability. For wheat, the linear trend is positive and statistically significant in P1 but shifts to a negative trend in the subsequent periods (P2 and P3), suggesting a decline in productivity growth. The interannual variability for wheat also declines steadily from P1 to P3. For maize, the linear trend is positive and significant in both P1 and P3, while a declining (negative) trend is observed during P2. The lowest interannual variability for both paddy and maize occurs during P2, implying relatively stable yields in that decade.
Figure 6 illustrates people's perceptions of how crop yields have changed over time, based on their farming experience. For all three crops, a substantial proportion of respondents (~42% to 55%) reported an overall increase in crop production. This aligns with observations from the crop yield datasets. However, a notable share (~13% to 21%) of respondents believe that crop yields have declined. Similarly, a comparable proportion (~11% to 29%) indicated that there has been no change in crop yield over time.
3.3. Impact of Climate Change on Agriculture
To assess the impact of climate change on crop yields, we establish the relationship between crop yield and key climate variables. We begin by computing the linear correlation coefficients, followed by tests for statistical significance. Given that long-term climate change is a slow-evolving phenomenon, we apply a time-averaging technique to remove high-frequency interannual variability and focus on long-term trends. Specifically, we apply a three-year running mean to smooth the raw time series. Figure 7 presents the annual time series of paddy yield alongside the relevant climate variables. Similar figures for maize and wheat are provided in the supplementary materials. The results of the correlation analysis for all three crops are summarised in Table 4.
Both TMIN and TMAX have a positive impact on paddy yield, whereas PCP and DTR tend to have a negative effect. Out of four climate variables, TMIN shows the highest correlation with paddy yield. The correlation for raw and smoothed datasets are 0.56 and 0.61 and both are statistically significant at 95% confidence level (Figure 7b). There is a positive and statistically significant relationship between TMAX and paddy yield of 0.35 which improved marginally to 0.43 for smoothed datasets (Figure 7c). PCP shows a weak and statistically insignificant negative correlation with paddy yield (r_raw = -0.13), which improves a little after smoothing (r_smooth ~ -0.23) (Figure 7a). DTR doesn't seem to be influencing paddy yield as the correlation coefficients for both raw and smoothed datasets are rather small (Figure 7d).
The relationship for maize and wheat are quite similar: positive association with TMAX and TMIN and negative with PCP and DTR; however, the magnitude differs. The correlation between climate variables and maize yield is consistently weak and none of the correlation coefficients are statistically significant. While in the case of wheat, TMIN seems to have the largest effect (r_raw ~ 20.51, r_smooth ~ 0.62). Besides, PCP show a good correspondence for smoothed data with statistically significant correlation of -0.40.
We further examine the association between crop yield and climate variables across the four seasons to understand potential seasonal dependencies (Table 5). For paddy, the seasonal correlations show that temperature, particularly TMIN, consistently exhibits the strongest positive association with yield. The highest correlation occurs during the monsoon season (r_raw ~ 0.49; r_smooth ~ 0.65), followed by the pre-monsoon and post-monsoon seasons, which are comparable to the annual correlation coefficients. TMAX, in contrast, shows its strongest association during the pre-monsoon period (r_raw ~ 0.37; r_smooth ~ 0.55), with values slightly higher than the annual correlations. PCP generally exhibits negative correlations across seasons, with the strongest negative correlation occurring in the pre-monsoon period (r_raw ~ –0.24; r_smooth ~ –0.46). These values are larger in magnitude than the annual correlations, particularly for the smoothed time series. Correlations with DTR remain weak in all seasons.
The correlations between climate parameters and maize yield show greater variability across seasons. Similar to paddy, maize exhibits the strongest positive correlation with TMIN during the monsoon season (r_raw ~ 0.30; r_smooth ~ 0.43). PCP displays its largest negative correlation in the monsoon (r_raw ~ –0.21; r_smooth ~ –0.50), with values slightly larger in magnitude than the annual correlations, particularly for the smoothed series. The correlation with TMAX remains weak across all seasons, consistent with its near-zero annual association. DTR also shows negative but relatively weak correlations throughout all seasons.
For wheat, the highest seasonal correlations occur with TMIN during the monsoon season for both raw and smoothed time series (r_raw ~ 0.58; r_smooth ~ 0.77), slightly exceeding the annual correlations (r_raw ~ 0.51; r_smooth ~ 0.62). PCP shows its strongest negative seasonal association in the pre-monsoon period (r_raw ~ –0.19; r_smooth ~ –0.50). DTR reaches its largest negative seasonal values during the monsoon (r_raw ~ –0.40; r_smooth ~ –0.50), with these seasonal correlations being somewhat stronger in magnitude compared to the annual values.
The results presented above provides interesting insights on how different climate variables influence crop yield. However, it would be more meaningful to quantify the impact of all climate variables in combination, such that we can assess how climate dictates long-term trend and variability of crop yield. To do so, we fit a multiple regression model and estimate the regression coefficient as described in equation 2. Once the regression coefficients are known, we can use the climate variables to predict the crop yields. Note that the multiple regression model is fitted using annual yield and the annual mean of climate variables. We selected the annual time series because the correlation between crop yield and seasonal mean climate parameters does not differ substantially from the correlation obtained using annual mean climate parameters.
Figure 8 presents scatter plots comparing predicted and actual yields for paddy, maize, and wheat using both raw and smoothed data. The black diagonal line represents the 1:1 reference line indicating perfect agreement. Among the three crops, the multiple linear regression model performs best for paddy, where climate variables explain 39% of yield variability in the raw data and 49% in the smoothed data. Wheat yields are also reasonably well predicted, with R² values of 32% and 55% for raw and smoothed data, respectively. In contrast, the model is least effective for maize, with relatively low R² values of 12% (raw) and 20% (smoothed). Notably, predictability improves considerably for all crops when smoothed data are used, highlighting the importance of filtering out short-term variability to better capture climate-driven yield patterns.
Interestingly, there is a systematic difference in predictability across the yield spectrum, with notably better model performance for higher yields compared to lower ones. For all three crops, predicted values align more closely with the 1:1 line in the upper quantile range, suggesting a stronger influence of climate on high-yield outcomes. In contrast, lower quantiles exhibit greater dispersion and a tendency toward underestimation, particularly when using raw data. The application of smoothing improves the relationship in the lower quantile range, indicating that short-term yield variability tends to involve smaller deviations, while broader, slow-varying trends are more predictive of overall yield patterns.
Short-term year-to-year yield variability is often less predictable because it is influenced by numerous non-climatic factors, such as pests, diseases, use of fertilizers, crop management, and localised weather extremes. These factors fluctuate irregularly and are typically not captured by seasonal or annual mean climate variables, making them difficult for statistical models to explain. In contrast, long-term or slow-varying trends in yield tend to reflect more systematic, climate-driven processes, such as gradual warming and persistent shifts in weather patterns.
3.4. Local Adaptation Practices
The increasing unpredictability of the climatic factor and the associated production risks have compelled local farmer communities in Doti District to adopt a range of adoptive practices aimed at sustaining crop production and enhancing resilience climatic stressors (Figure 9). These practices reflect experienced-based response where farmers gradually adopt better farming techniques observing the change in rainfall pattern, temperature and other extreme events.
More than 60% of respondents reported using improved seed varieties, green manure, and changes in crop types as key adaptation measures. The extensive use of improved seeds is the most common strategies to deal with changing rainfall pattern, rising temperature and pest outbreak. These varieties offer shorter growing periods, higher yield potential and stress tolerance. Similar findings have been observed across different regions of Nepal highlighting the increasing use of improved or hybrid seeds to cope drought and heat stress (Chhetri et al., 2012; Ghimire et al., 2018; Aryal et al., 2020).
The use of green manures and inorganic fertilizers represents an important soil-based adaptation strategy. Green manure improves soil structure and water retention capacity thereby restoring soil fertility while use of inorganic fertilizers is for immediate coping response to soil degradation and nutrient loss. The studies on adaptation strategies by Lipper et al., 2014; Paudel et al., 2020, highlighted that soil fertility management is crucial in rain-feed agricultural system. These practices play crucial role in sustaining productivity where irrigation access remains limited.
The selection of short-duration crop varieties by the farmers is another important climatic adaptation response. This allows the farmers to complete the crop cycle with in the shorter favourable weather window and reduces the exposure to late season drought or delayed monsoon. Similar adaptive responses have been identified in the mid-hills and far western regions of Nepal (Manandhar et al., 2011; Dawadi et al., 2022).
Changes in crop types is long-term resilience adjustments adopted in Doti District. This includes shifting from traditional crop to more climate resilient crops or low water demanding crops. This strategy is crucial to reduce the risk of crop failure and make their production system better even at extreme weather. Crops diversification helps farmer to cope climate change vulnerability in Nepal and across South Asia (Lin 2011; Shrestha et al., 2019)
Crop rotation and minimum tillage farming practices further enhance the climate resilience by improving soil organic matter, promoting nutrient cycling, reducing erosion, and conserving soil moistures, contributing to long-term agroecosystem strategies. River conservation practice, though a less common strategy, play an important role in maintaining local water availability, reducing the effect of floods and supporting enough water for irrigation during dry periods of crops grown, such as switching from traditional crops to crops that can handle climate change or need less water, are an important way to adapt to changes in temperature and precipitation patterns. This plan helps farmers lower the chances of their crops failing and make their production systems more varied when the weather is unpredictable. A significant number of respondents also indicated the utilization of inorganic fertilizers to mitigate diminishing soil fertility and to sustain crop yields during abbreviated or interrupted growing seasons. Choosing short-duration crop varieties has also become an important way to adapt. This lets crops finish their life cycle in shorter windows of good weather, which lowers their risk of droughts or changes in rainfall later in the season.
5. Conclusions
This study investigated the impact of climate change on crop production in Doti District using meteorological observations, agricultural records, and household surveys. The findings provide valuable insights for formulating effective adaptation strategies to address future climate challenges.
The climate change pattern in Doti is characterized by rising annual TMIN and TMAX, alongside declining PCP and DTR. Notably, TMIN is increasing three times faster than TMAX, a typical signature of global warming observed worldwide. This asymmetric warming is largely due to faster increases in nighttime temperatures, which drive the reduction in DTR.
TMAX and TMIN are rising across all seasons, with the strongest warming occurring in the pre-monsoon season. Precipitation is decreasing in all seasons, with the most pronounced decline during the monsoon, while no clear trend is observed in the post-monsoon due to high year-to-year variability. Among the four climate variables, precipitation exhibits the greatest interannual variability, especially in the post-monsoon season, while TMAX shows the least variability. TMIN varies almost twice as much as TMAX, with the largest fluctuations in winter.
Importantly, people’s perceptions of changes in temperature and precipitation are broadly consistent with the observed climatic records. This suggests that local perceptions can serve as an alternative tool for climate change assessment in rural Nepal, especially in areas where weather station data are sparse, incomplete, or short-term.
Agricultural records reveal that the annual yields of paddy, maize, and wheat increased significantly between 1982 and 2000, with maize showing the most consistent growth and paddy the slowest. However, yield growth stagnated between 2000 and 2010, consistent with climatic trends in this period. TMIN and TMAX have positive impacts on crop yields, whereas PCP and DTR exert negative effects. By far, TMIN has the strongest influence on crop yield, followed by TMAX, PCP, and DTR. The combined effect of all four variables is greatest for paddy, followed by wheat and maize. These findings suggest that long-term climatic trends, rather than short-term variability, dictate slow-moving trends in crop yields, while year-to-year variations are more likely influenced by other factors such as soil fertility, seed quality, and extreme weather events.
In response to these changes, local communities have adopted a range of adaptation strategies, including the use of improved seed varieties, green manure and inorganic fertilizers, crop rotation, and the cultivation of short-duration crops. Farmers reported that these strategies have been effective in mitigating the challenges posed by changing climatic conditions. Hence, information on long-term climatic trends and farmers’ perceptions is essential for shaping public policy and promoting effective agricultural adaptation strategies. The findings of this study might be highly relevant for guiding the development of local adaptation plans. Furthermore, the regression model presented here can be extended to project future crop yield scenarios under climate model simulations, providing a valuable tool for climate-resilient agricultural planning in Nepal.
Author Contributions
Jitendra Bikram Shahi: Conceptualisation, methodology, Data collection and analysis, writing original manuscript Bed Mani Dahal: Conceptualisation, methodology, review and editing Nani Raut: Conceptualisation, methodology, review and editing Nabin Aryal: Review and editing Sunil Pariyar: Review and editing.
Funding
The author received no financial support for the research and was self-funded by the author.
Data Availability Statement
The meteorological data is available at the Department of Hydrology and Meteorology, Government of Nepal. The agricultural data is available at the Ministry of Agriculture and Livestock Development, Government of Nepal. The social data is available upon request.
Acknowledgments
We would like to thank the Department of Hydrology and Meteorology, Government of Nepal, for providing the meteorological data. Likewise, we extend our sincere gratitude to the Ministry of Agriculture and Livestock Development, Government of Nepal, for providing the agricultural yield data. We also wish to express our appreciation to all the individuals who participated in the questionnaire survey and focus group discussions.
Conflicts of Interest
The authors declare no conflicts of interest.
Abbreviations
| CMIP | Coupled Model Intercomparison Project |
| CV | Coefficient of variation |
| DTR | Diurnal temperature range |
| ENSO | El Niño–Southern Oscillation |
| FGD | Focus group discussion |
| IOD | Indian Ocean Dipole |
| IPCC | Intergovernmental Panel on Climate Change |
| MoFE | Ministry of Forest and Environment |
| PCP | Precipitation |
| TMAX | Maximum temperature |
| TMIN | Minimum temperature |
References
- Keane, J.; Page, S.; Kergna, A.; Kennan, J. Climate Change and Developing Country Agriculture: An Overview of Expected Impacts, Adaptation and Mitigation Challenges, and Funding Requirements. 2009. [Google Scholar]
- Lybbert, T. J.; Sumner, D. A. Agricultural technologies for climate change in developing countries: Policy options for innovation and technology diffusion. Food Policy 2012, 37(1), 114–123. [Google Scholar] [CrossRef]
- IPCC. Climate Change 2021 – The Physical Science Basis: Working Group I Contribution to the Sixth Assessment Report of the Intergovernmental Panel on Climate Change, 1st ed.; Cambridge University Press, 2021. [Google Scholar]
- Lobell, D. B.; Schlenker, W.; Costa-Roberts, J. Climate trends and global crop production since 1980. Science 2011, 333(602), 616–620. [Google Scholar] [CrossRef] [PubMed]
- Zhao, C.; Liu, B.; Piao, S.; Wang, X.; Lobell, D. B.; Huang, Y.; Asseng, S. Temperature increase reduces global yields of major crops in four independent estimates. Proceedings of the National Academy of sciences 2017, 114(35), 9326–9331. [Google Scholar] [CrossRef] [PubMed]
- Hultgren, A.; Carleton, T.; Delgado, M.; Gergel, D. R.; Greenstone, M.; Houser, T.; Yuan, J. Impacts of climate change on global agriculture accounting for adaptation. Nature 2025, 642(8068), 644–652. [Google Scholar] [CrossRef]
- Shrestha, S. Effects of climate change in agricultural insect pest. Acta Scientific Agriculture 2019, 3, 74–80. [Google Scholar] [CrossRef]
- Luck, J.; Spackman, M.; Freeman, A.; Tre˛bicki, P.; Griffiths, W.; Finlay, K. Climate change and diseases of food crops. Plant Pathology 2011, 60, 113–121. [Google Scholar] [CrossRef]
- Mohan, B. S.; Nambiar, V. COVID-19: an insight into SARS-CoV-2 pandemic originated at Wuhan City in Hubei Province of China. J Infect Dis Epidemiol 2020, 6(4), 146. [Google Scholar] [CrossRef]
- Bocchiola, D.; Brunetti, L.; Soncini, A.; Polinelli, F.; Gianinetto, M. Impact of climate change on agricultural productivity and food security in the Himalayas: A case study in Nepal. Agricultural systems 2019, 171, 113–125. [Google Scholar] [CrossRef]
- Selvaraju, R. Managing climate risks and adapting to climate change in the agriculture sector in Nepal. 2014. [Google Scholar]
- Pradhan, P.; Belbase, M. Institutional reforms in irrigation sector for sustainable agriculture water management including water users associations in Nepal. Hydro Nepal: Journal of Water, Energy and Environment 2018, 23, 58–70. [Google Scholar] [CrossRef]
- The World Bank Group. Nepal Country Climate and Development Report. 2022. [Google Scholar] [CrossRef]
- Dawadi, B.; Shrestha, A.; Acharya, R. H.; Dhital, Y. P.; Devkota, R. Impact of climate change on agricultural production: A case of Rasuwa District, Nepal. Regional Sustainability 2022, 3(2), 122–132. [Google Scholar] [CrossRef]
- Manandhar, S.; Vogt, D. S.; Perret, S. R.; Kazama, F. Adapting cropping systems to climate change in Nepal: a cross-regional study of farmers’ perception and practices. Regional Environmental Change 2011, 11, 335–348. [Google Scholar] [CrossRef]
- Gartaula, H.; Niehof, A.; Visser, L. Shifting perceptions of food security and land in the context of labour out-migration in rural Nepal. Food Security 2012, 4, 181–194. [Google Scholar] [CrossRef]
- Poudel, S.; Funakawa, S.; Shinjo, H. Household perceptions about the impacts of climate change on food security in the mountainous region of Nepal. Sustainability 2017, 9(4), 641. [Google Scholar] [CrossRef]
- Khanal, U.; Wilson, C.; Shankar, S.; Hoang, V. N.; Lee, B. Farm performance analysis: Technical efficiencies and technology gapsof Nepalese farmers in different agro-ecological regions. Land usepolicy 2018, 76, 645–653. [Google Scholar] [CrossRef]
- Hussain, A.; Rasul, G.; Mahapatra, B.; Wahid, S.; Tuladhar, S. Climate change-induced hazards and local adaptations in agriculture: a study from Koshi River Basin, Nepal. Natural Hazards 2018, 91, 1365–1383. [Google Scholar] [CrossRef]
- Shrestha, R.; Rakhal, B.; Adhikari, T. R.; Ghimire, G. R.; Talchabhadel, R.; Tamang, D.; Sharma, S. Farmers’ perception of climate change and its impacts on agriculture. Hydrology 2022, 9(12), 212. [Google Scholar] [CrossRef]
- Bhatt, D.; Maskey, S.; Babel, M. S.; Uhlenbrook, S.; Prasad, K. C. Climate trends and impacts on crop production in the Koshi River basin of Nepal. Regional Environmental Change 2014, 14, 1291–1301. [Google Scholar] [CrossRef]
- Paudel, B.; Acharya, B. S.; Ghimire, R.; Dahal, K. R.; Bista, P. Adapting agriculture to climate change and variability in Chitwan: Long-term trends and farmers’ perceptions. Agricultural Research 2014, 3, 165–174. [Google Scholar] [CrossRef]
- Dhakal, S.; Sedhain, G. K.; Dhakal, S. C. Climate change impact and adaptation practices in agriculture: A case study of Rautahat District, Nepal. Climate 2016, 4(4), 63. [Google Scholar] [CrossRef]
- Shrestha, G.; Baral, B. R.; Shrestha, S.; Malla, G.; Rai, S. K. Climate change and rice yield trends in Banke, Nepal. Nepalese Journal of Agricultural Sciences 2017, 15(3), 19–32. [Google Scholar]
- Dahal, B. M.; Raut, N.; Gurung, S.; Sharma, C. M.; Kayastha, R.; Shrestha, A.; Gautam, B. Changing trends in cultivation practices and adoption of climate adaptive farming in Eastern Nepal. Sustainable Agriculture Research 2018, 7(3), 52–62. [Google Scholar] [CrossRef]
- Acharya, S. P.; Bhatta, G. R. Impact of climate change on agricultural growth in Nepal. NRB Economic Review 2013, 25(2), 1–16. [Google Scholar] [CrossRef]
- Chalise, S.; Naranpanawa, A.; Bandara, J. S.; Sarker, T. A general equilibrium assessment of climate change–induced loss of agricultural productivity in Nepal. Economic Modelling 2017, 62, 43–50. [Google Scholar] [CrossRef]
- Rayamajhee, V.; Guo, W.; Bohara, A. K. The impact of climate change on rice production in Nepal. Economics of Disasters and Climate Change 2021, 5, 111–134. [Google Scholar] [CrossRef]
- MoFE. Vulnerability and Risk Assessment and Identifying Adaptation Options in GESI, Livelihood and Socio-Economic Sector in Nepal; Ministry of Forests and Environment, Government of Nepal: Kathmandu, Nepal, 2021. [Google Scholar]
- Tejada, J. J.; Punzalan, J. R. B. On the misuse of Slovin’s formula. The philippine statistician 2012, 61(1), 129–136. [Google Scholar]
- Sen, P. K. Estimates of the regression coefficient based on Kendall's tau. Journal of the American statistical association 1968, 63(324), 1379–1389. [Google Scholar] [CrossRef]
- Mann, H. B. Nonparametric tests against trend. Econometrica: Journal of the econometric society 1945, 245–259. [Google Scholar] [CrossRef]
- Kendall, M. G. Rank correlation methods; Griffin, 1975. [Google Scholar]
- Obilor, E. I.; Amadi, E. C. Test for significance of Pearson’s correlation coefficient. International Journal of Innovative Mathematics, Statistics & Energy Policies 2018, 6(1), 11–23. [Google Scholar]
- Uyanık, G. K.; Güler, N. A study on multiple linear regression analysis. Procedia-Social and Behavioral Sciences 2013, 106, 234–240. [Google Scholar] [CrossRef]
- Pokharel, B.; Wang, S. Y. S.; Meyer, J.; Marahatta, S.; Nepal, B.; Chikamoto, Y.; Gillies, R. The east–west division of changing precipitation in Nepal. International Journal of Climatology 2020, 40(7), 3348–3359. [Google Scholar] [CrossRef]
- Luo, Y.; Wang, L.; Hu, C.; Hao, L.; Sun, G. Changing extreme precipitation patterns in Nepal over 1971–2015. Earth and Space Science 2024, 11(12), e2024EA003563. [Google Scholar] [CrossRef]
- Thakuri, S.; Dahal, S.; Shrestha, D.; Guyennon, N.; Romano, E.; Colombo, N.; Salerno, F. Elevation-dependent warming of maximum air temperature in Nepal during 1976–2015. Atmospheric Research 2019, 228, 261–269. [Google Scholar] [CrossRef]
- You, Q.; Kang, S.; Pepin, N.; Flügel, W. A.; Yan, Y.; Behrawan, H.; Huang, J. Relationship between temperature trend magnitude, elevation and mean temperature in the Tibetan Plateau from homogenized surface stations and reanalysis data. Global and Planetary Change 2010, 71(1-2), 124–133. [Google Scholar] [CrossRef]
- Kattel, D. B.; Yao, T. Recent temperature trends at mountain stations on the southern slope of the central Himalayas. Journal of earth system science 2013, 122, 215–227. [Google Scholar] [CrossRef]
- Hamal, K.; Sharma, S.; Talchabhadel, R.; Ali, M.; Dhital, Y. P.; Xu, T.; Dawadi, B. Trends in the diurnal temperature range over the Southern Slope of Central Himalaya: retrospective and prospective evaluation. Atmosphere 2021, 12(12), 1683. [Google Scholar] [CrossRef]
- Xu, Q.; Wei, S.; Li, Z.; Li, Q. A new evaluation of observed changes in diurnal temperature range. Geophysical Research Letters 2025, 52(2). [Google Scholar] [CrossRef]
- Dai, A. Increasing drought under global warming in observations and models. Nature climate change 2013, 3(1), 52–58. [Google Scholar] [CrossRef]
- Sharma, S.; Hamal, K.; Khadka, N.; Joshi, B. B. Dominant pattern of year-to-year variability of summer precipitation in Nepal during 1987–2015. Theoretical and applied climatology 2020, 142(3), 1071–1084. [Google Scholar] [CrossRef]
- Sigdel, M.; Ikeda, M. Summer monsoon rainfall over Nepal related with large-scale atmospheric circulations. J Earth Sci Clim Change 2012, 3, 112. [Google Scholar] [CrossRef]
- Zhang, X.; Zwiers, F. W.; Hegerl, G. C.; Lambert, F. H.; Gillett, N. P.; Solomon, S.; Nozawa, T. Detection of human influence on twentieth-century precipitation trends. Nature 2007, 448(7152), 461–465. [Google Scholar] [CrossRef] [PubMed]
- Trenberth, K. E. Changes in precipitation with climate change. Climate research 2011, 47(1-2), 123–138. [Google Scholar] [CrossRef]
- Vose, R. S.; Easterling, D. R.; Gleason, B. Maximum and minimum temperature trends for the globe: An update through 2004. Geophysical Research Letters 2005, 32(23). [Google Scholar] [CrossRef]
- Karl, T. R.; Jones, P. D.; Knight, R. W.; Kukla, G.; Plummer, N.; Razuvayev, V.; Peterson, T. C. A new perspective on recent global warming: asymmetric trends of daily maximum and minimum temperature. Bulletin of the American Meteorological Society 1993, 74(6), 1007–1024. [Google Scholar] [CrossRef]
- Easterling, D. R.; Horton, B.; Jones, P. D.; Peterson, T. C.; Karl, T. R.; Parker, D. E.; Folland, C. K. Maximum and minimum temperature trends for the globe. Science 1997, 277(5324), 364–367. [Google Scholar] [CrossRef]
- Shrestha, A. B.; Wake, C. P.; Mayewski, P. A.; Dibb, J. E. Maximum temperature trends in the Himalaya and its vicinity: an analysis based on temperature records from Nepal for the period 1971–94. Journal of climate 1999, 12(9), 2775–2786. [Google Scholar] [CrossRef]
- Kattel, D. B.; Yao, T.; Yang, K.; Tian, L.; Yang, G.; Joswiak, D. Temperature lapse rate in complex mountain terrain on the southern slope of the central Himalayas. Theoretical and applied climatology 2013, 113(3), 671–682. [Google Scholar] [CrossRef]
- Shen, X.; Liu, B.; Li, G.; Wu, Z.; Jin, Y.; Yu, P.; Zhou, D. Spatiotemporal change of diurnal temperature range and its relationship with sunshine duration and precipitation in China. Journal of Geophysical Research: Atmospheres 2014, 119(23), 13–163. [Google Scholar] [CrossRef]
- Davy, R.; Esau, I.; Chernokulsky, A.; Outten, S.; Zilitinkevich, S. Diurnal asymmetry to the observed global warming. International Journal of Climatology 2017, 37(1), 79–93. [Google Scholar] [CrossRef]
- Bagale, D.; Sigdel, M.; Aryal, D. Winter drought monitoring using standard precipitation index over Nepal. Natural Hazards 2024, 120(2), 975–988. [Google Scholar] [CrossRef]
- Karki, R.; Hasson, S. u.; Schickhoff, U.; Scholten, T.; Böhner, J. Rising Precipitation Extremes across Nepal. Climate 2017, 5(1), 4. [Google Scholar] [CrossRef]
- Gautam, R.; Hsu, N. C.; Lau, K. M.; Tsay, S. C.; Kafatos, M. Enhanced pre-monsoon warming over the Himalayan-Gangetic region from 1979 to 2007. Geophysical Research Letters 2009, 36(7). [Google Scholar] [CrossRef]
- Dimri, A. P.; Niyogi, D.; Barros, A. P.; Ridley, J.; Mohanty, U. C.; Yasunari, T.; Sikka, D. R. Western disturbances: a review. Reviews of Geophysics 2015, 53(2), 225–246. [Google Scholar] [CrossRef]
- Chaudhary, P.; Bawa, K. S. Local perceptions of climate change validated by scientific evidence in the Himalayas. Biology Letters 2011, 7(5), 767–770. [Google Scholar] [CrossRef]
- Poudel, M. P.; Chen, S. E. Trends and variability of rice, maize, and wheat yields in South Asian countries: A challenge for food security. Asian Journal of Agriculture and Rural Development 2012, 2(4), 584–597. [Google Scholar]
- Joshi, P.; Gautam, P.; Wagle, P. Growth and instability analysis of major crops in Nepal. Journal of Agriculture and Food Research 2021, 6, 100236. [Google Scholar] [CrossRef]
- Zarzy´ nska, K.; Trawczy´ nski, C.; Pietraszko, M. Environmental and Agronomical Factors Limiting Differences in Potato Yielding between Organic and Conventional Production System. Agriculture 2023, 13, 901. [Google Scholar] [CrossRef]
- Okupska, E.; Gozdowski, D.; Pudełko, R.; Wójcik-Gront, E. Cereal and Rapeseed Yield Forecast in Poland at Regional Level Using Machine Learning and Classical Statistical Models. Agriculture 2025, 15(9), 984. [Google Scholar] [CrossRef]
- Qader, S.H.; Utazi, C.E.; Priyatikanto, R.; Najmaddin, P.; Hama-Ali, E.O.; Khwarahm, N.R.; Dash, J. Exploring the use of Sentinel-2 datasets and environmental variables to model wheat crop yield in smallholder arid and semi-arid farming systems. Sci. Total Environ. 2023, 869, 161716. [Google Scholar] [CrossRef]
- Tandzi, L.N.; Shelton, C.M. Factors affecting yield of crops. Agronomy-Climate Change & Food Security 2020, 9. [Google Scholar]
- Rempelos, L.; Bara´ nski, M.; Sufar, E.K.; Gilroy, J.; Shotton, P.; Leifert, H.; ´Srednicka-Tober, D.; Hasanaliyeva, G.; Rosa, E.A.S.; Hajslova, J.; et al. Effect of Climatic Conditions, and Agronomic Practices Used in Organic and Conventional.
- De Santis, M. A.; Giuzio, L.; Tozzi, D.; Soccio, M.; Flagella, Z. Impact of no tillage and low emission N fertilization on durum wheat sustainability, profitability and quality. Agronomy 2024, 14(12), 2794. [Google Scholar] [CrossRef]
- Tomich, TP; Kilby; Johnson, B. Transforming Agrarian Economies: Opportunities Seized; Opportunities missed; Cornell University Press: Ithaca, NY, 1995. [Google Scholar]
- Umina, P; Baker, G; Edwards, O. Russian Wheat Aphid: Tactics for Future Control; Grains Research and Development Corporation, 2017. 40 p. Project code: ACO00020-B. [Google Scholar]
Figure 1.
Map of study area.
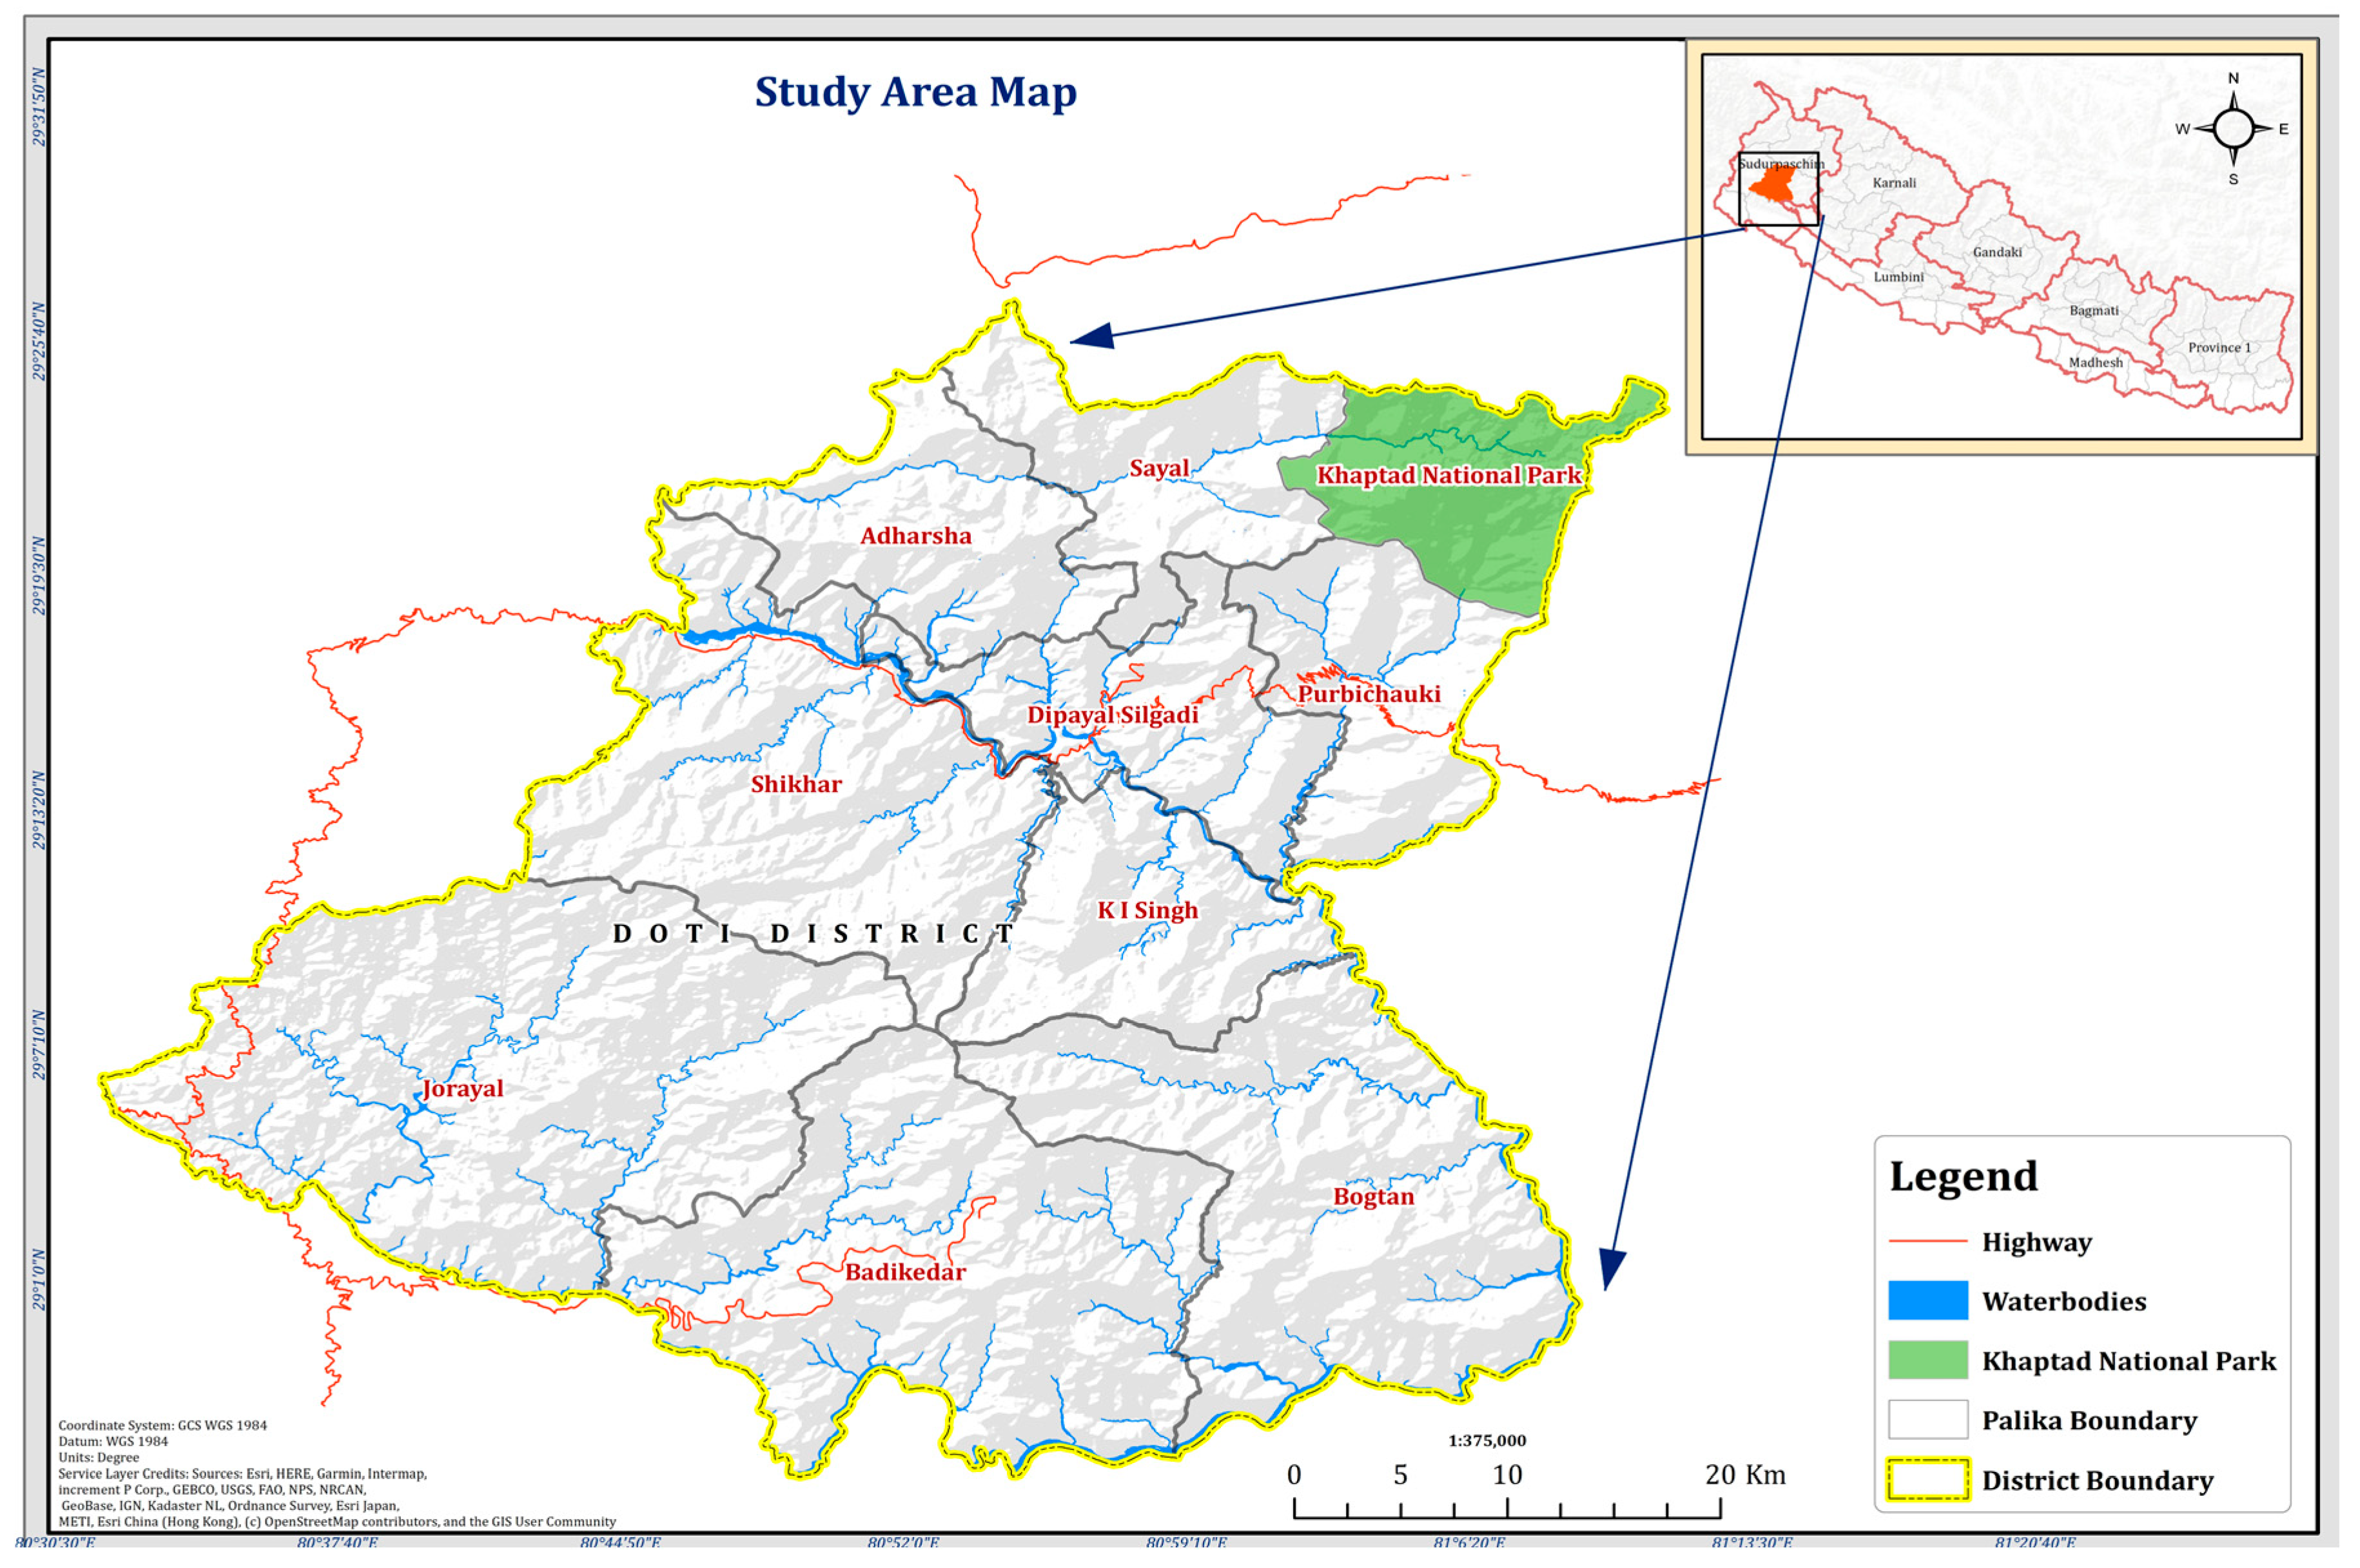
Figure 2.
Monthly climatology of temperature (maximum & minimum), diurnal temperature range and precipitation from 1982 to 2022.
Figure 2.
Monthly climatology of temperature (maximum & minimum), diurnal temperature range and precipitation from 1982 to 2022.
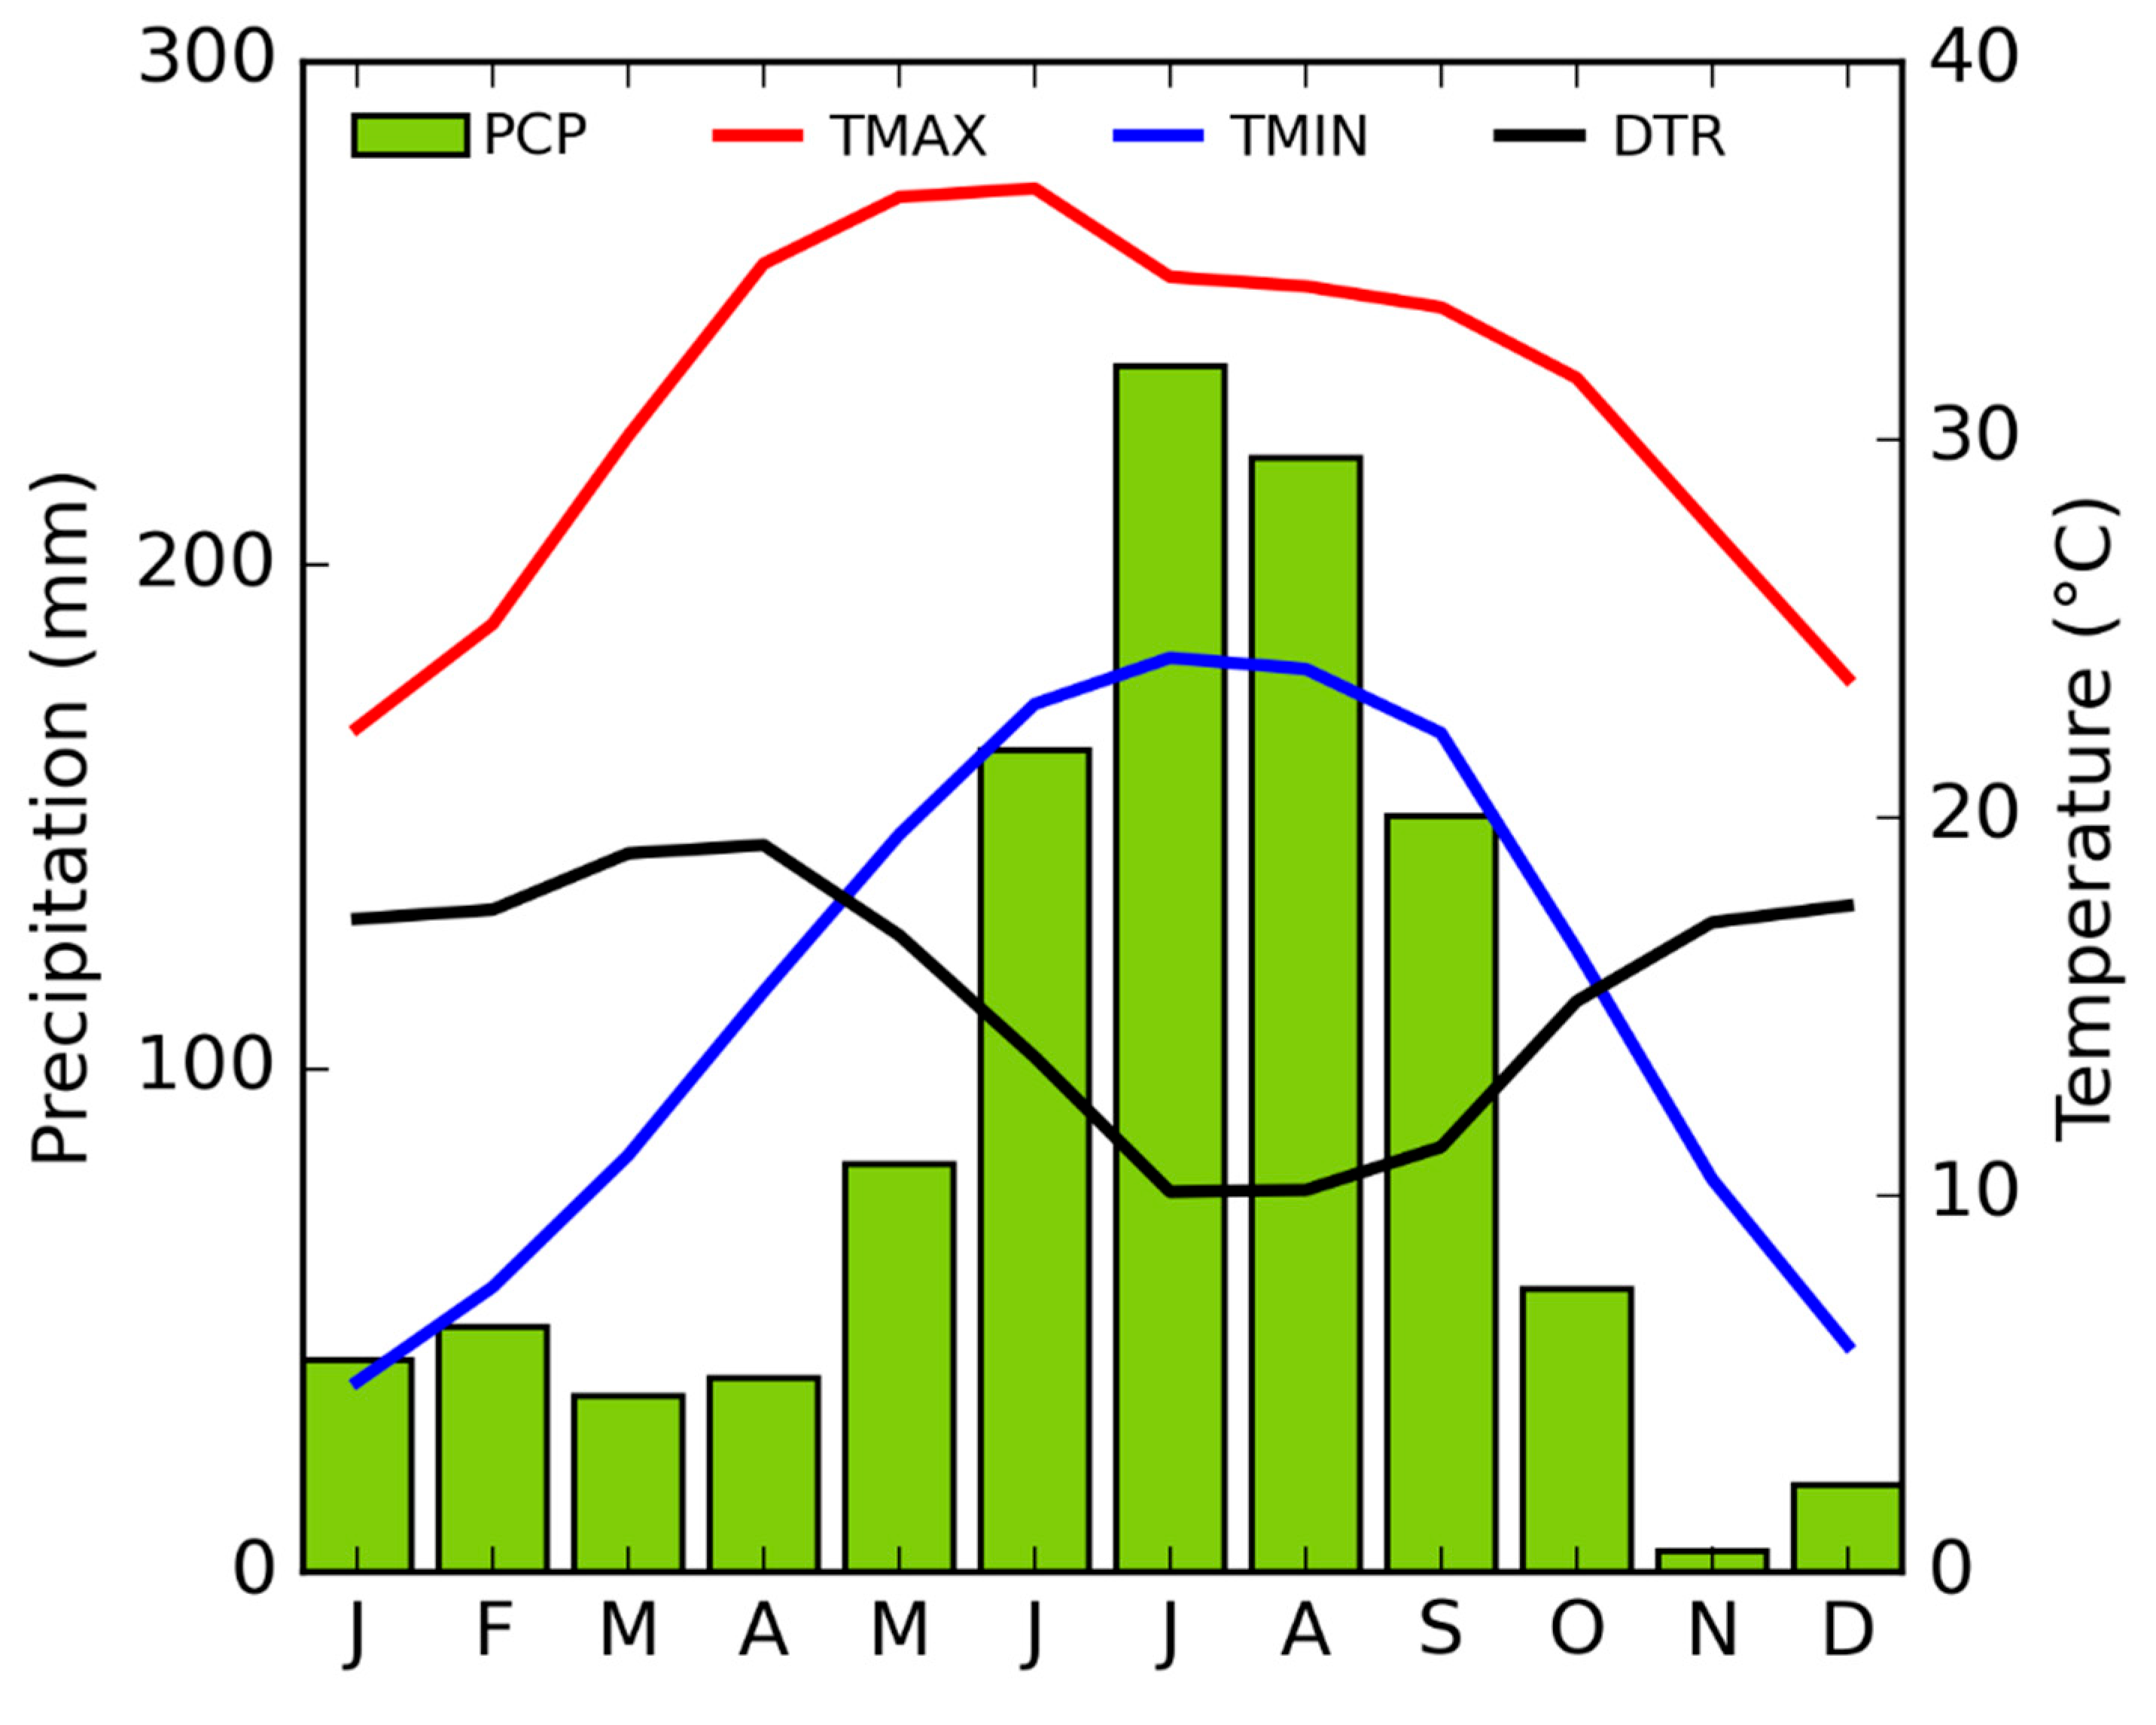
Figure 3.
Time series of annual precipitation and temperature (maximum & minimum) from 1982 to 2022.
Figure 3.
Time series of annual precipitation and temperature (maximum & minimum) from 1982 to 2022.
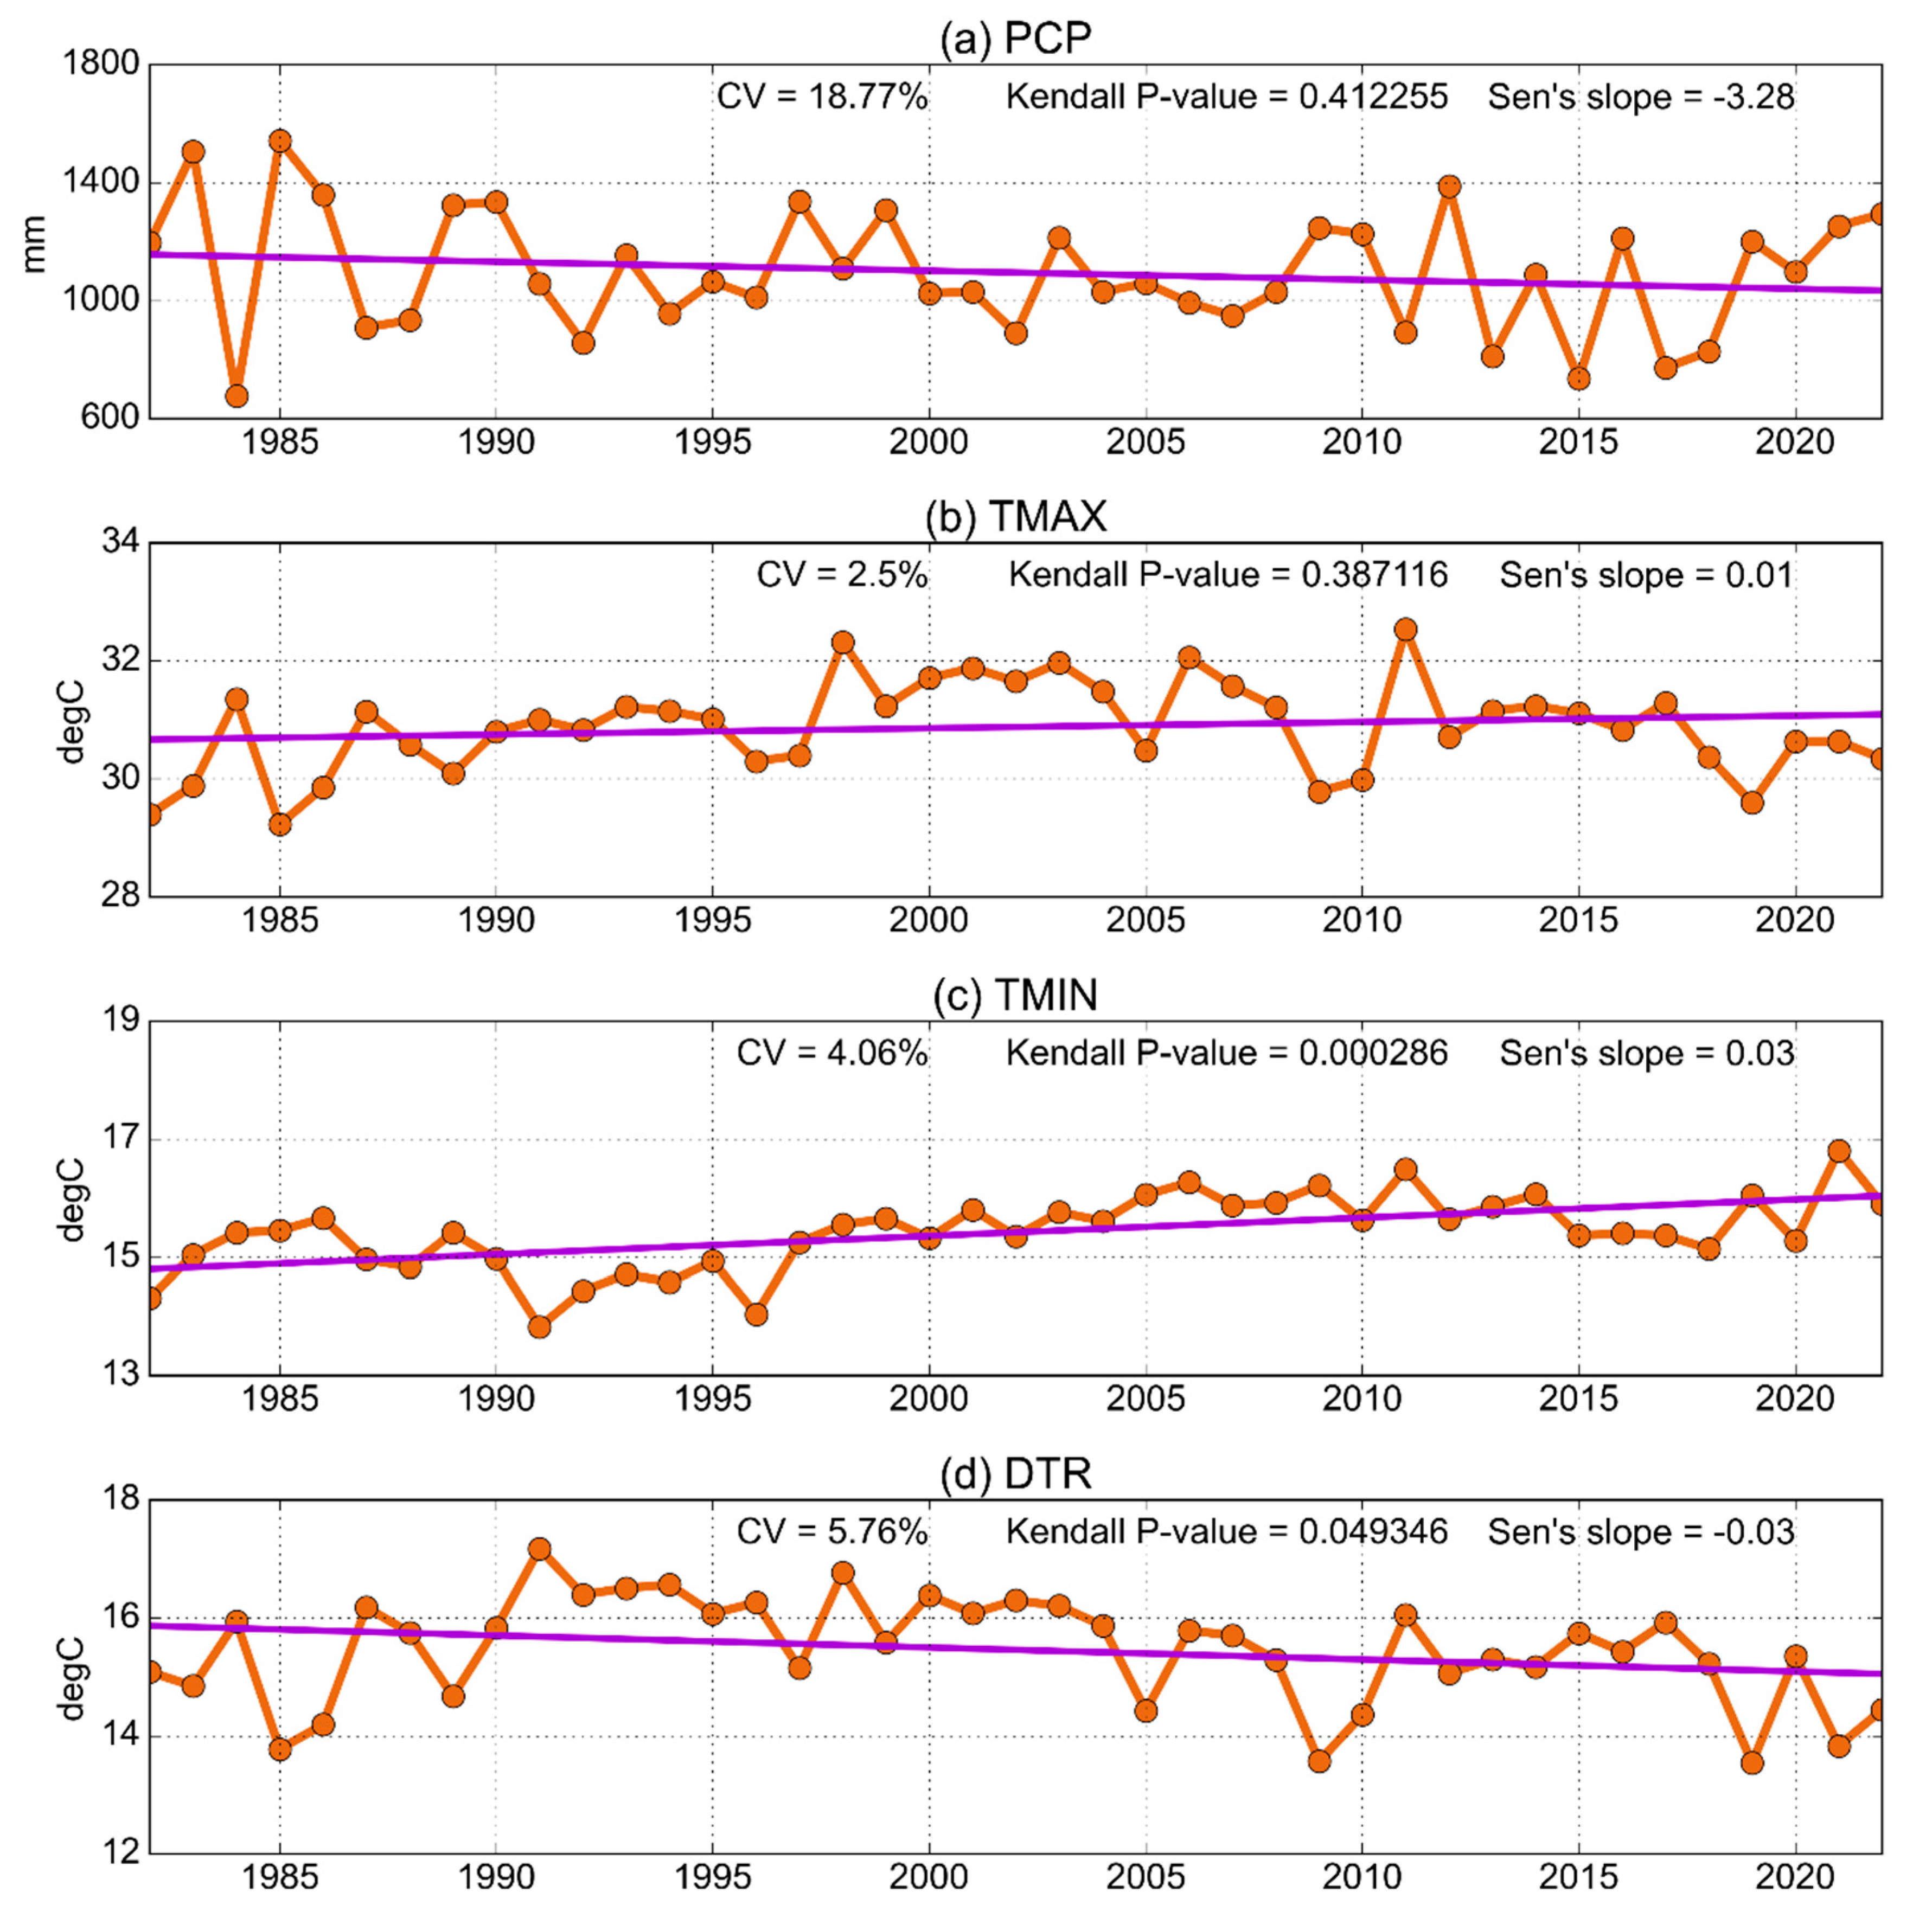
Figure 4.
People’s perception on climate change.
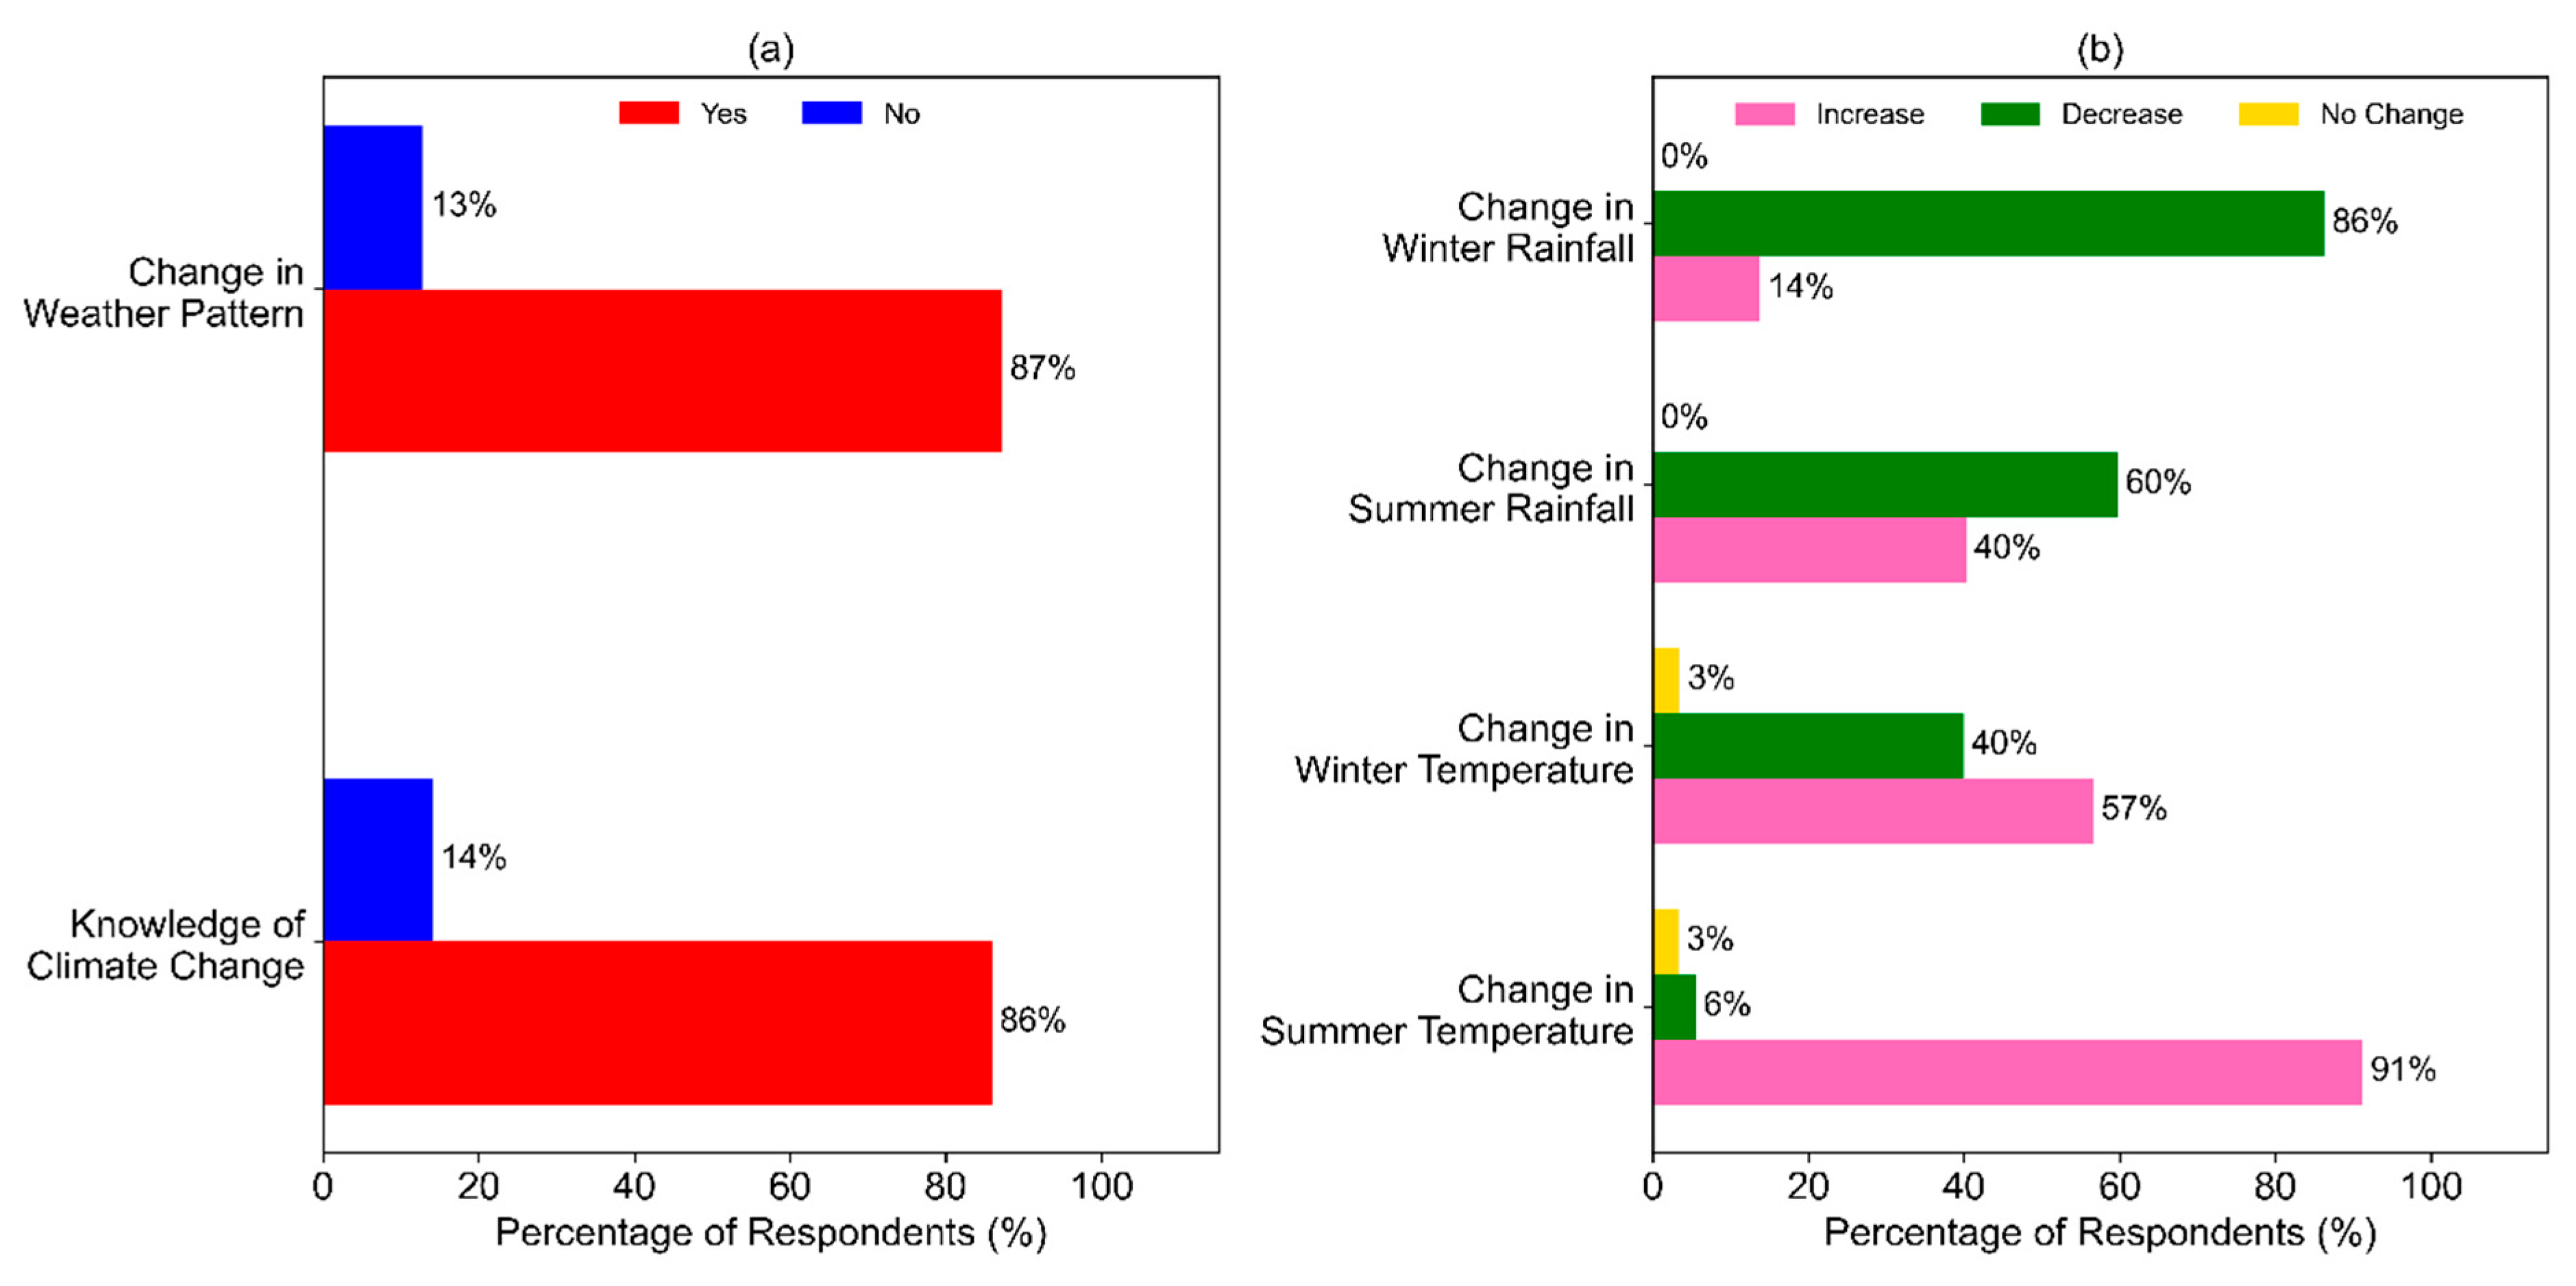
Figure 5.
Annual time series of crop production between 1982 and 2022.
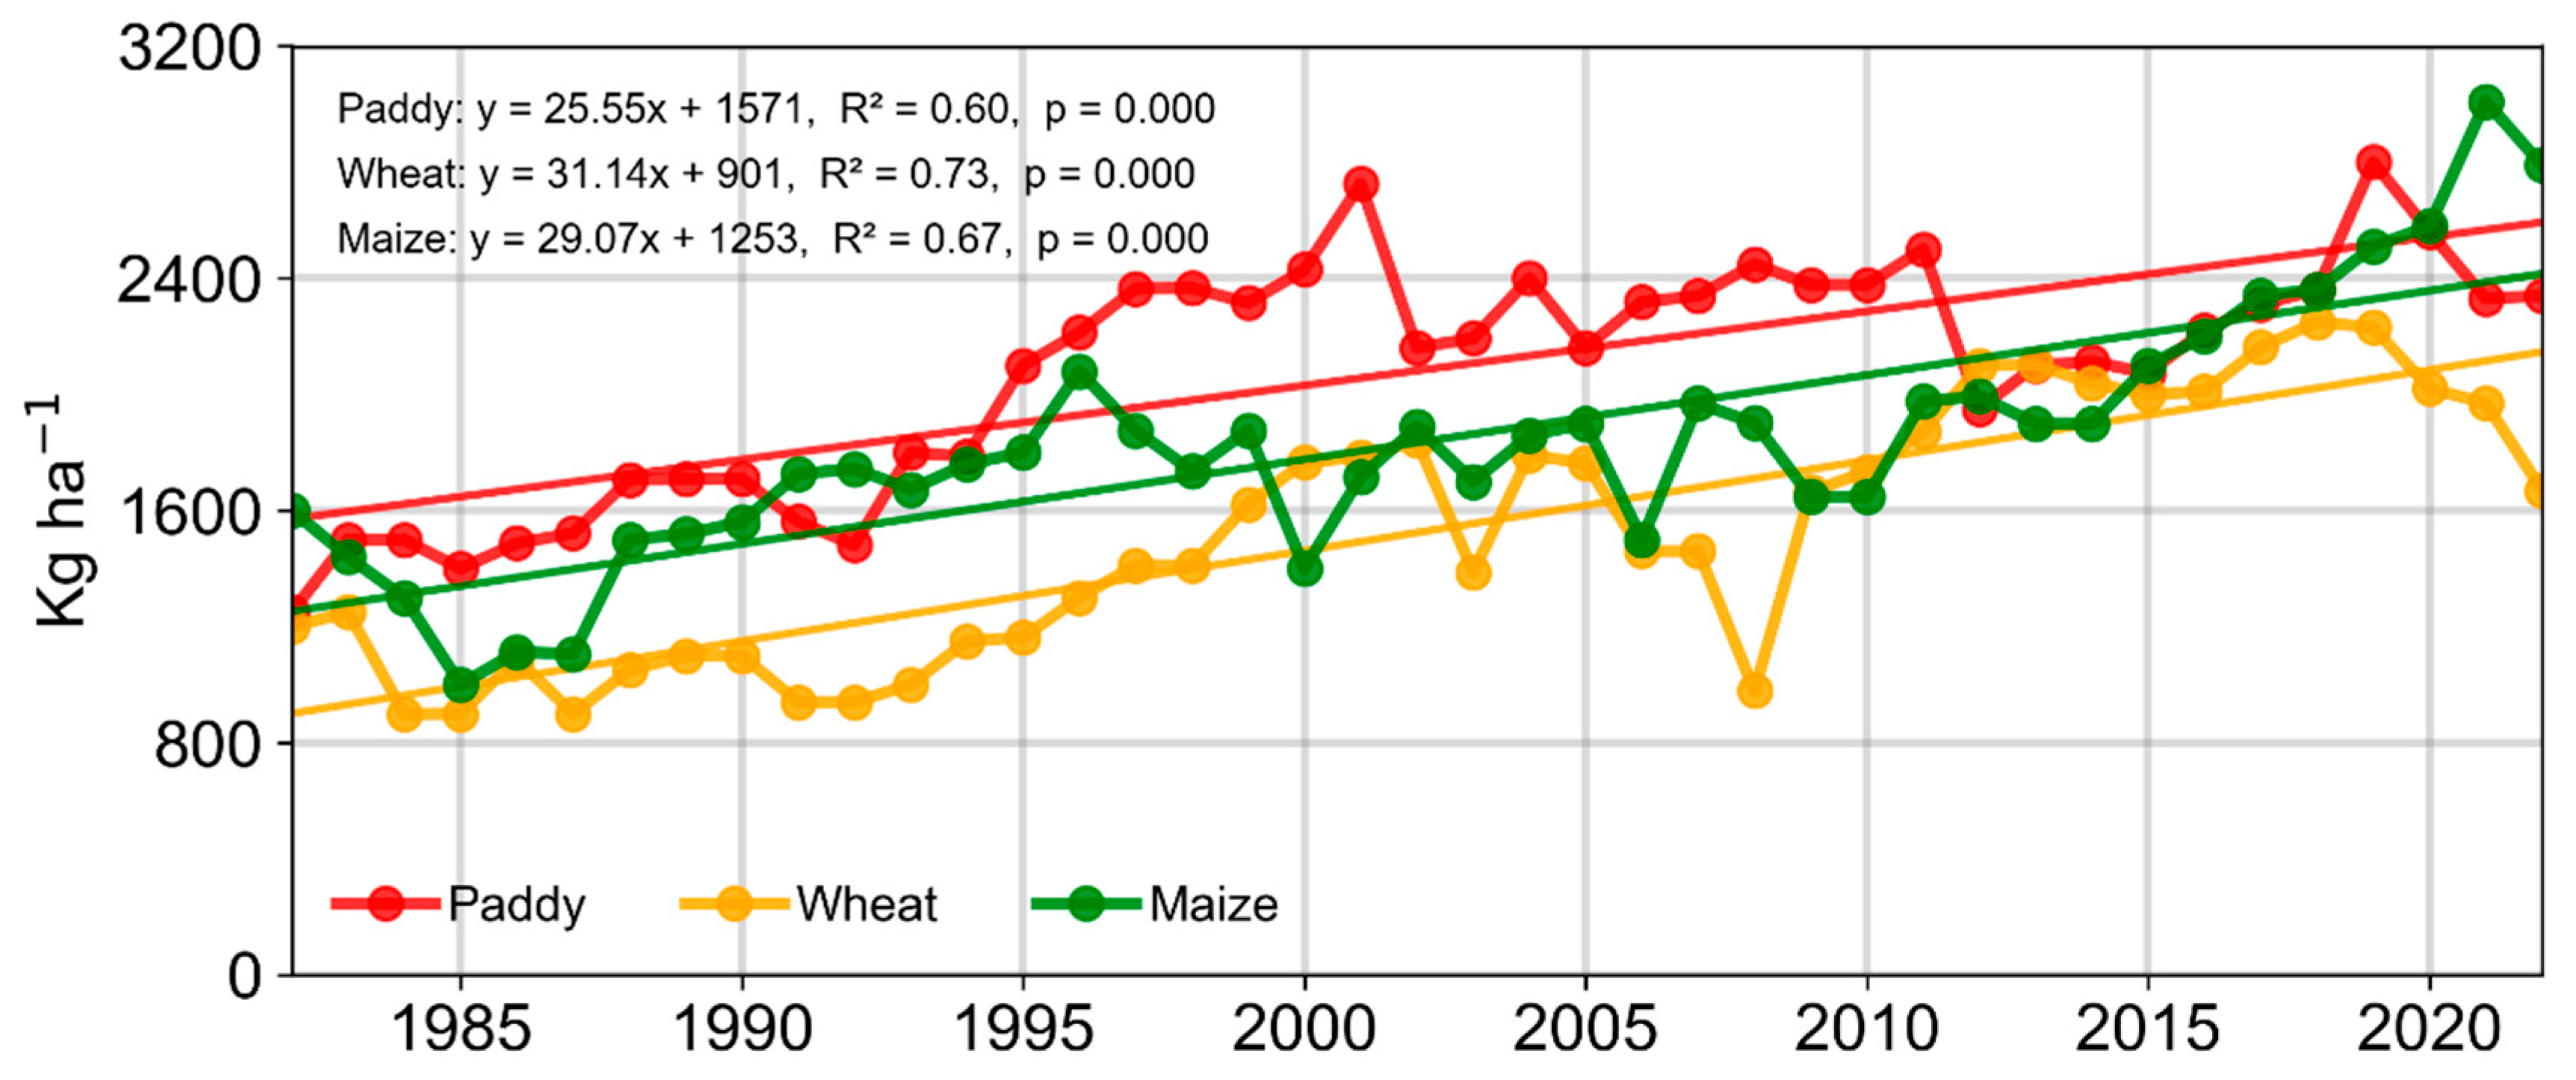
Figure 6.
People’s perception on trends in crop yield.
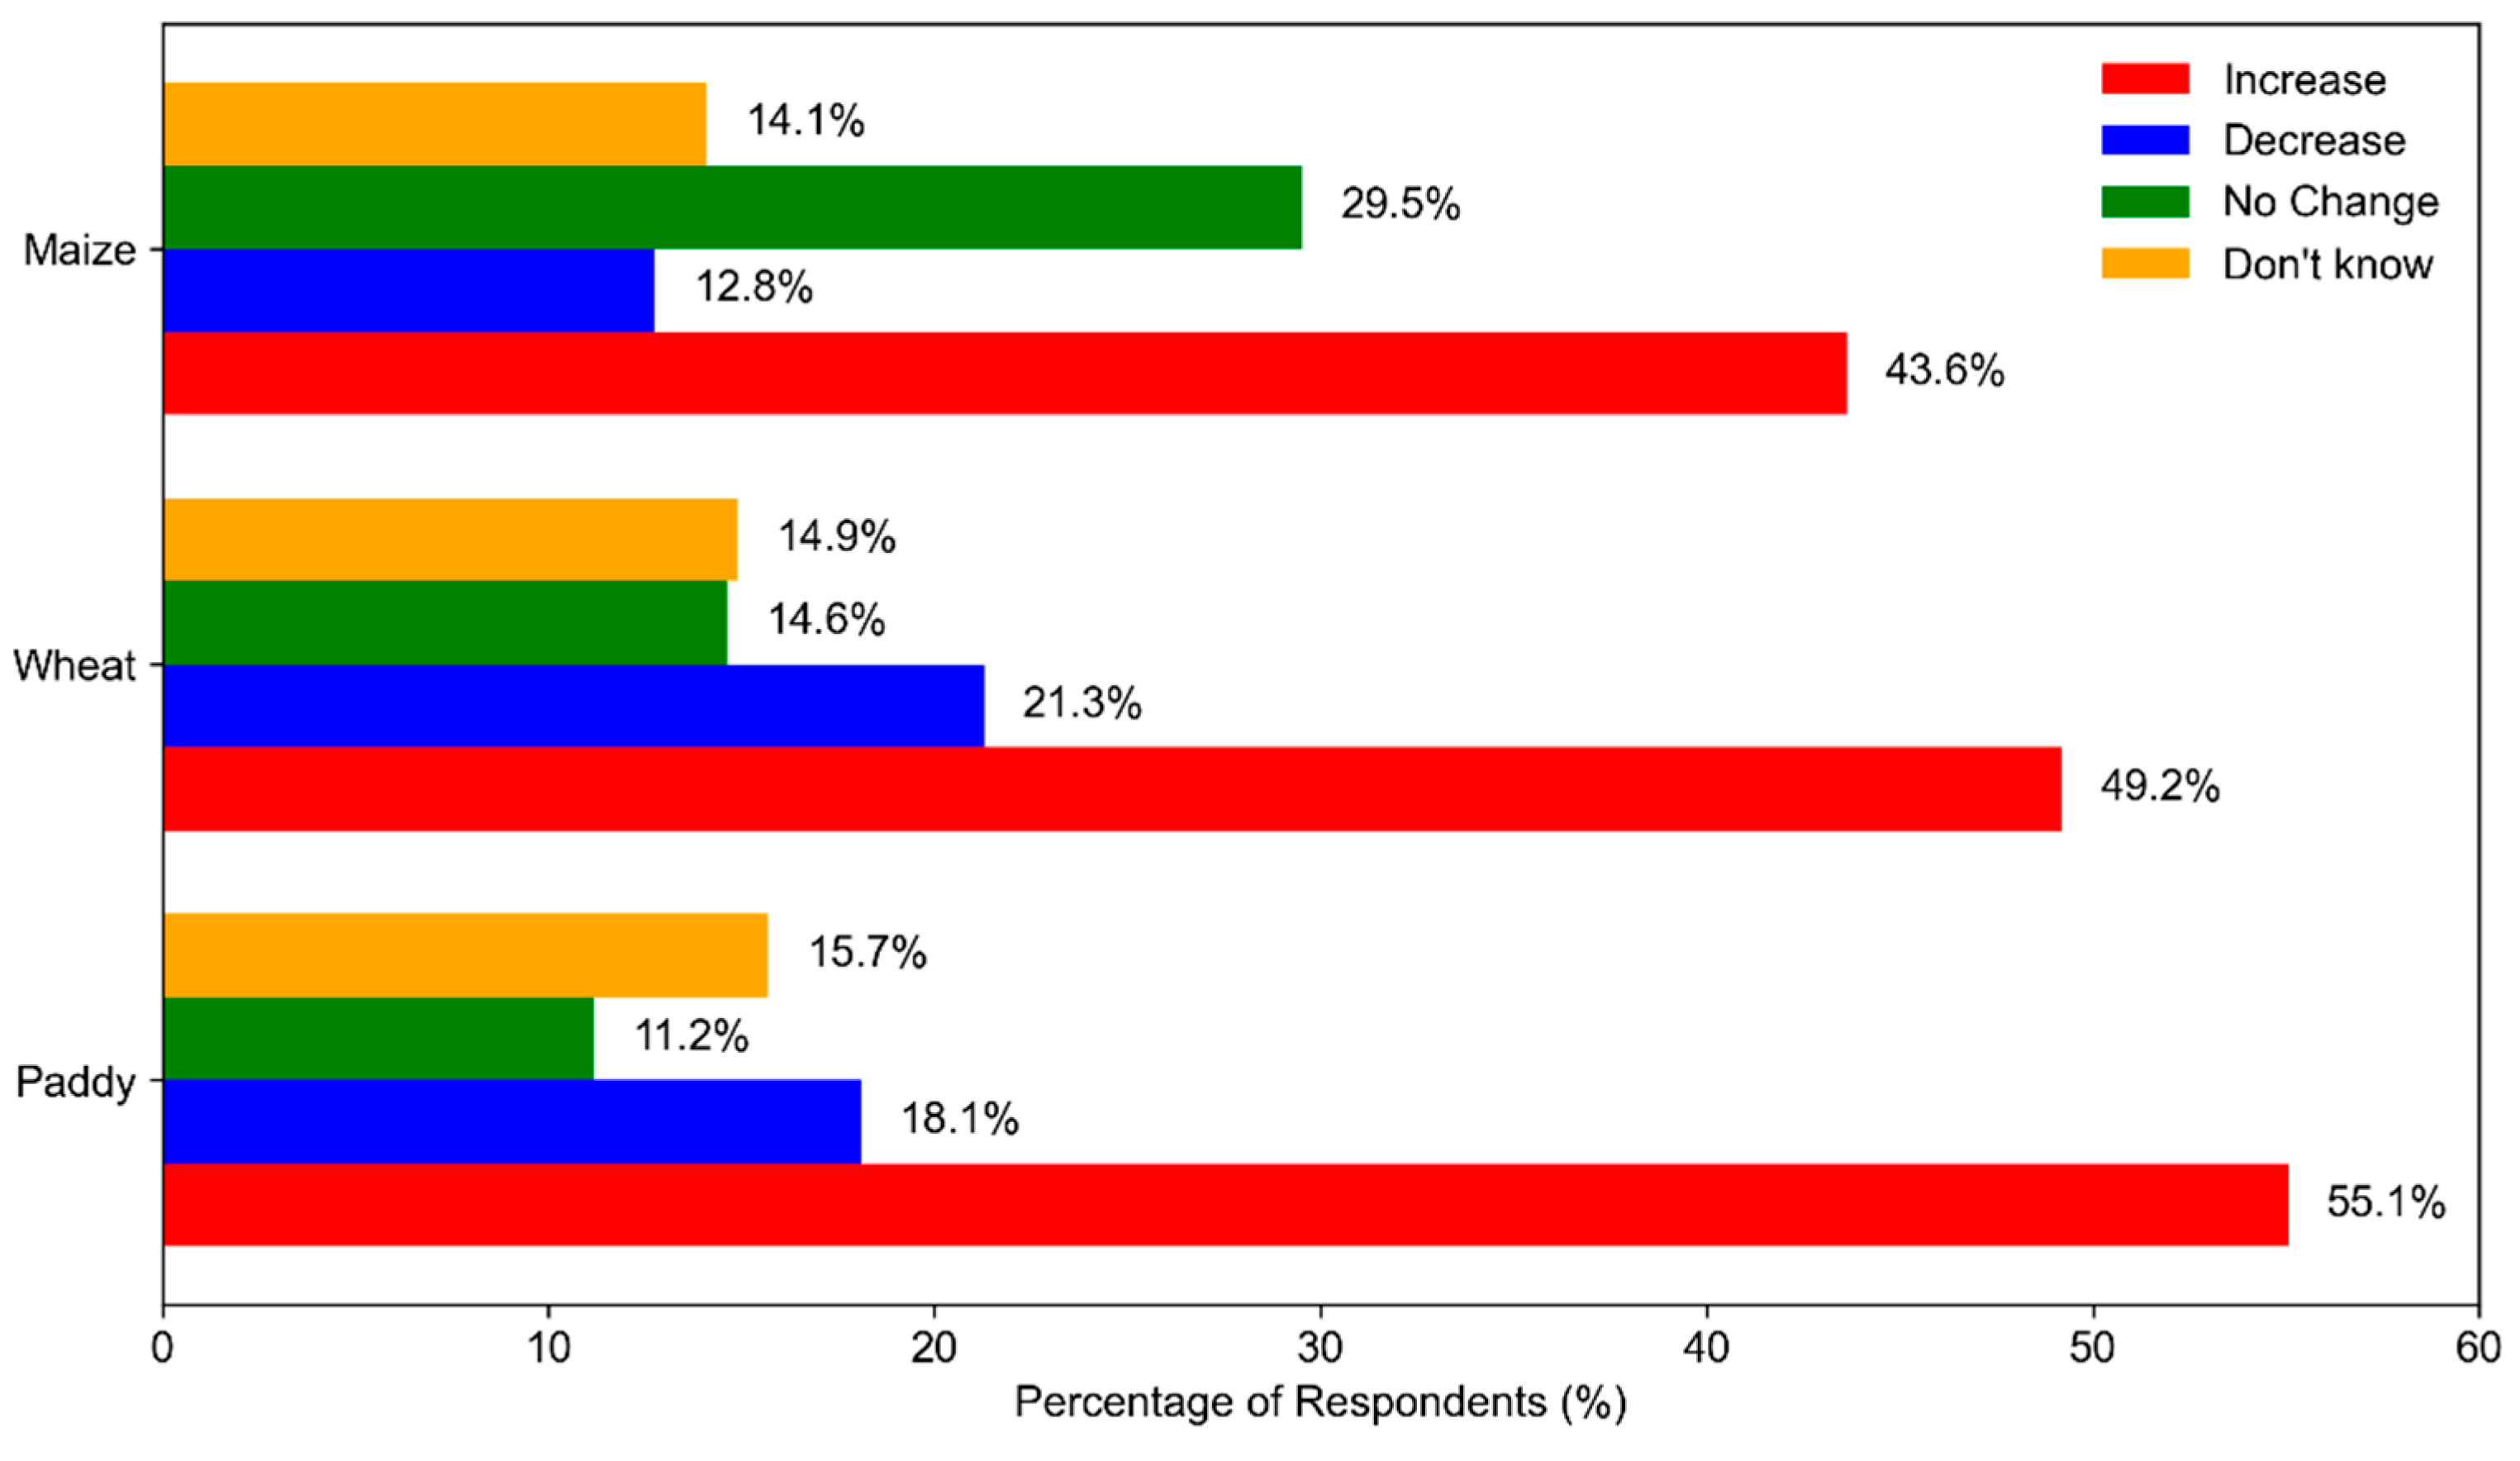
Figure 7.
Annual (light lines) and three years running mean (dark lines) time series of paddy (green) and climate variables (blue).
Figure 7.
Annual (light lines) and three years running mean (dark lines) time series of paddy (green) and climate variables (blue).
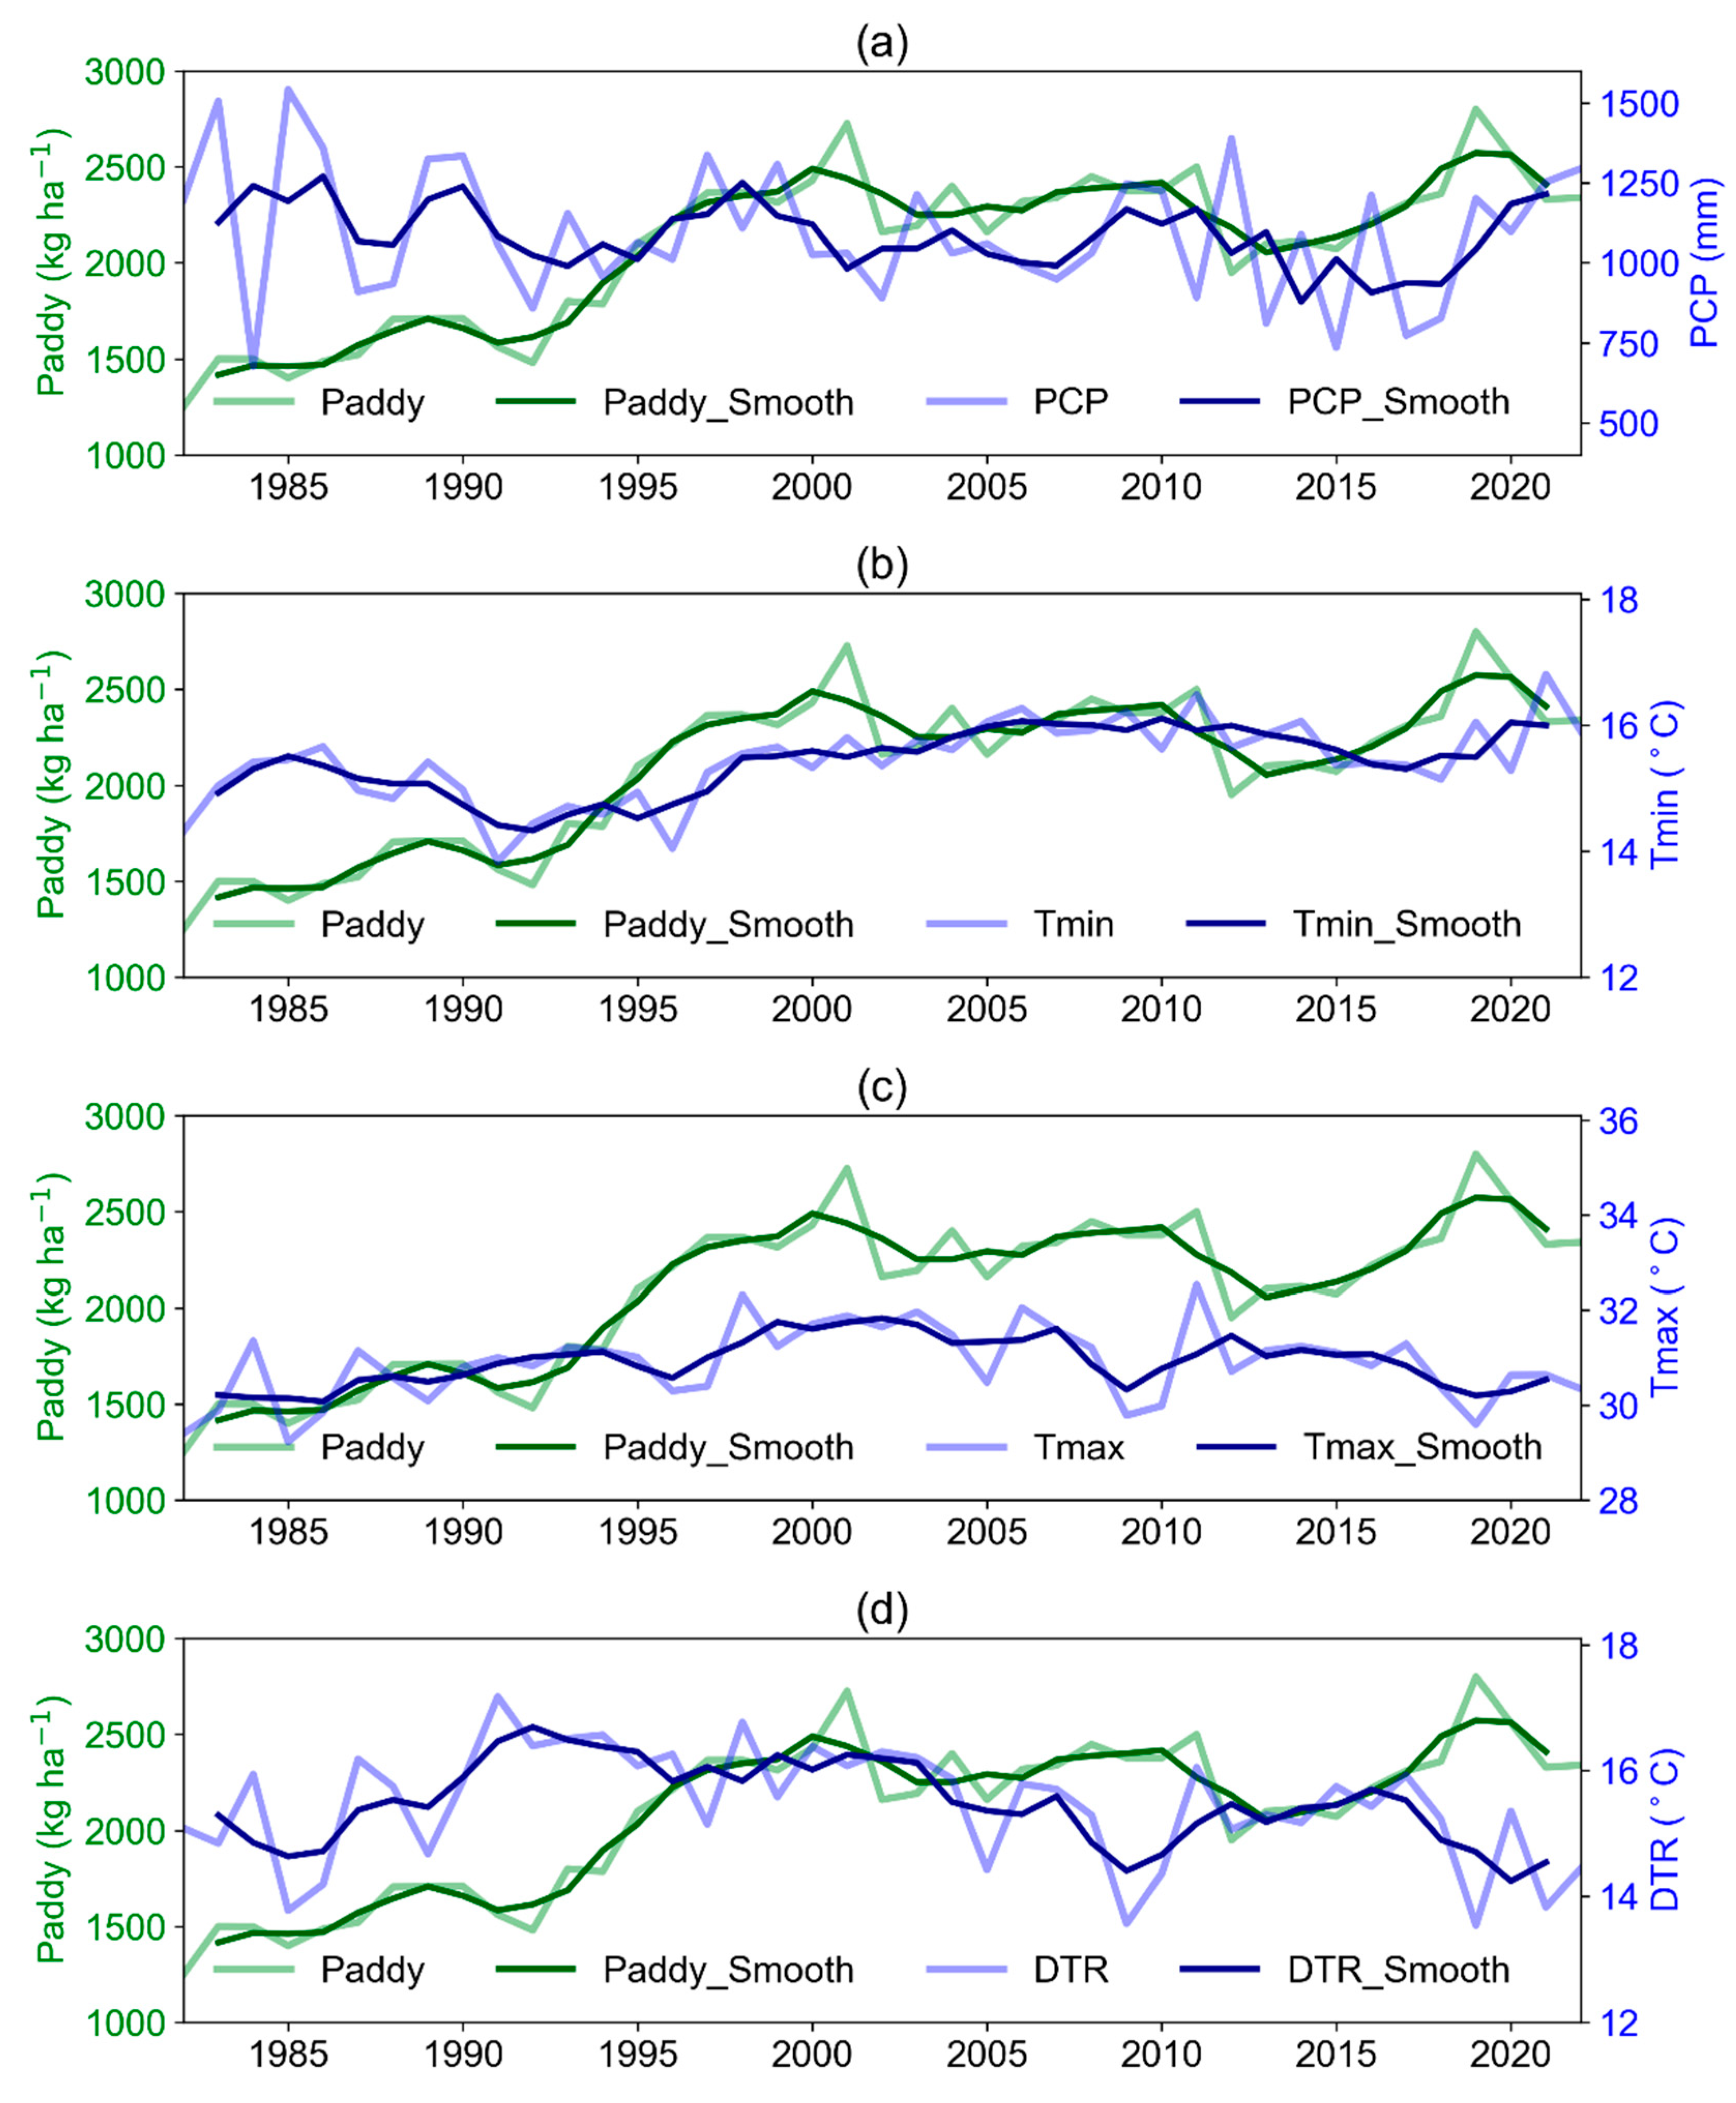
Figure 8.
Actual vs predicted crop yield based on multiple regression model.
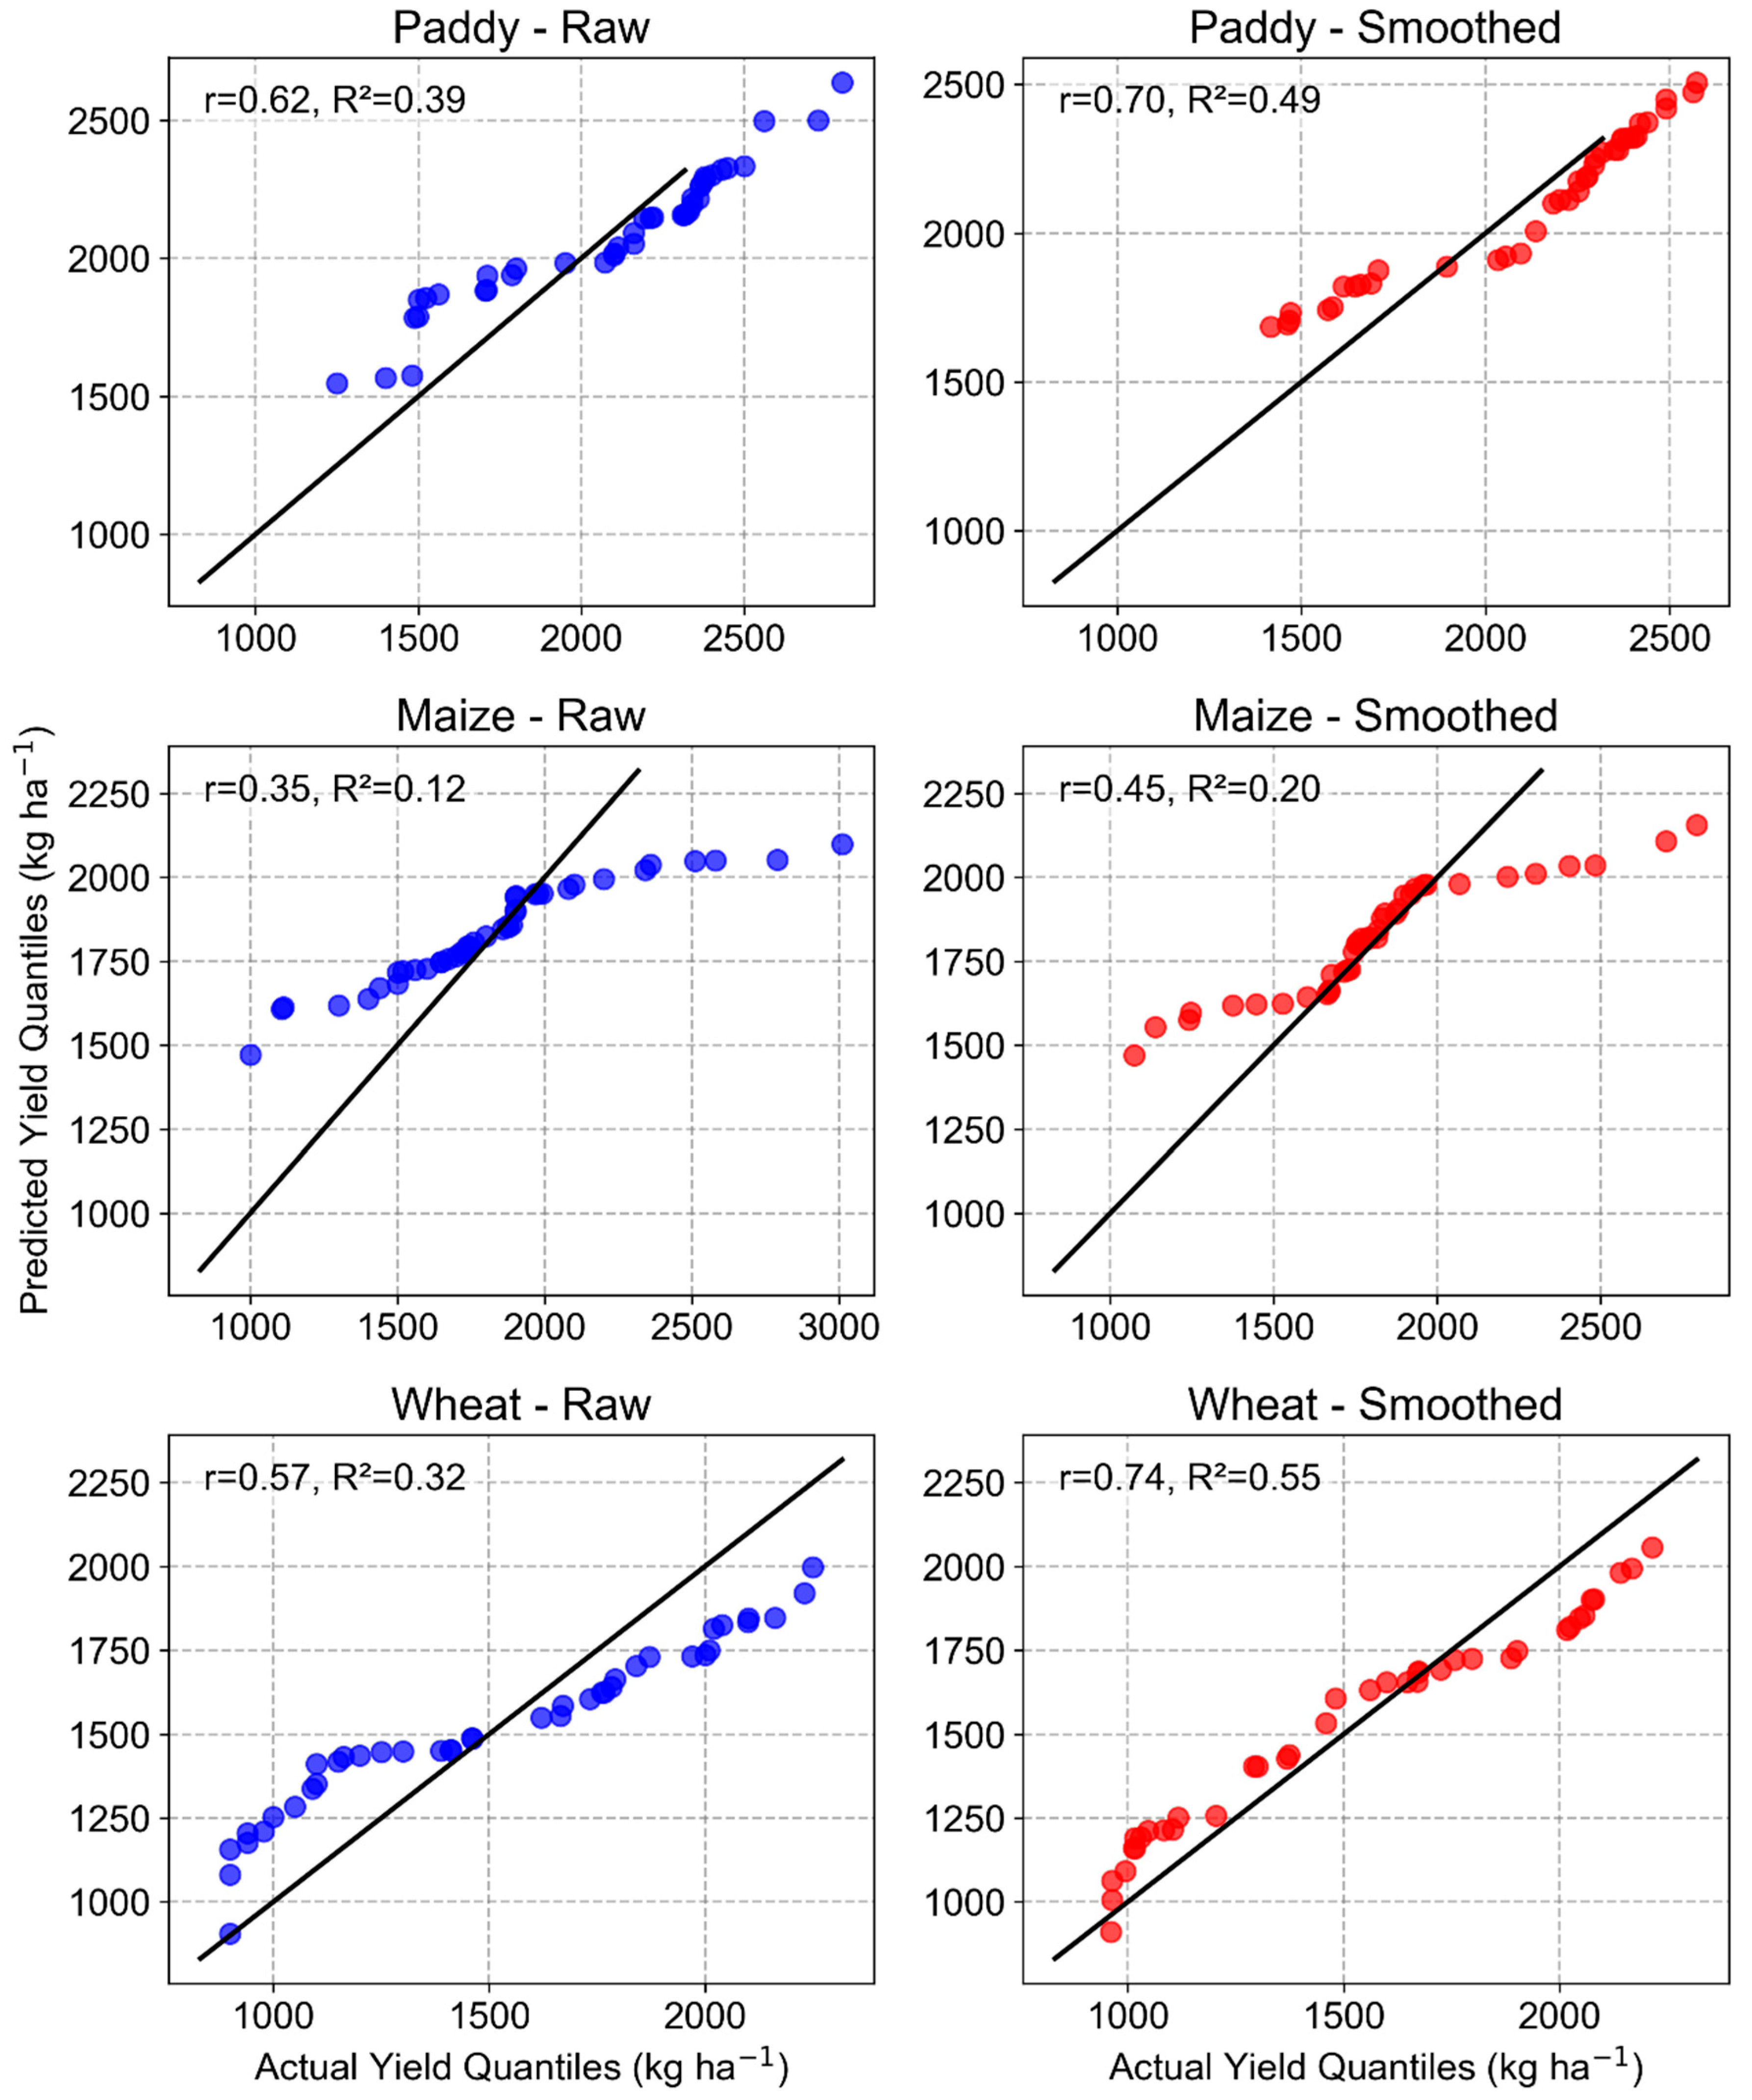
Figure 9.
Climate change adaptation practices by local farmers.
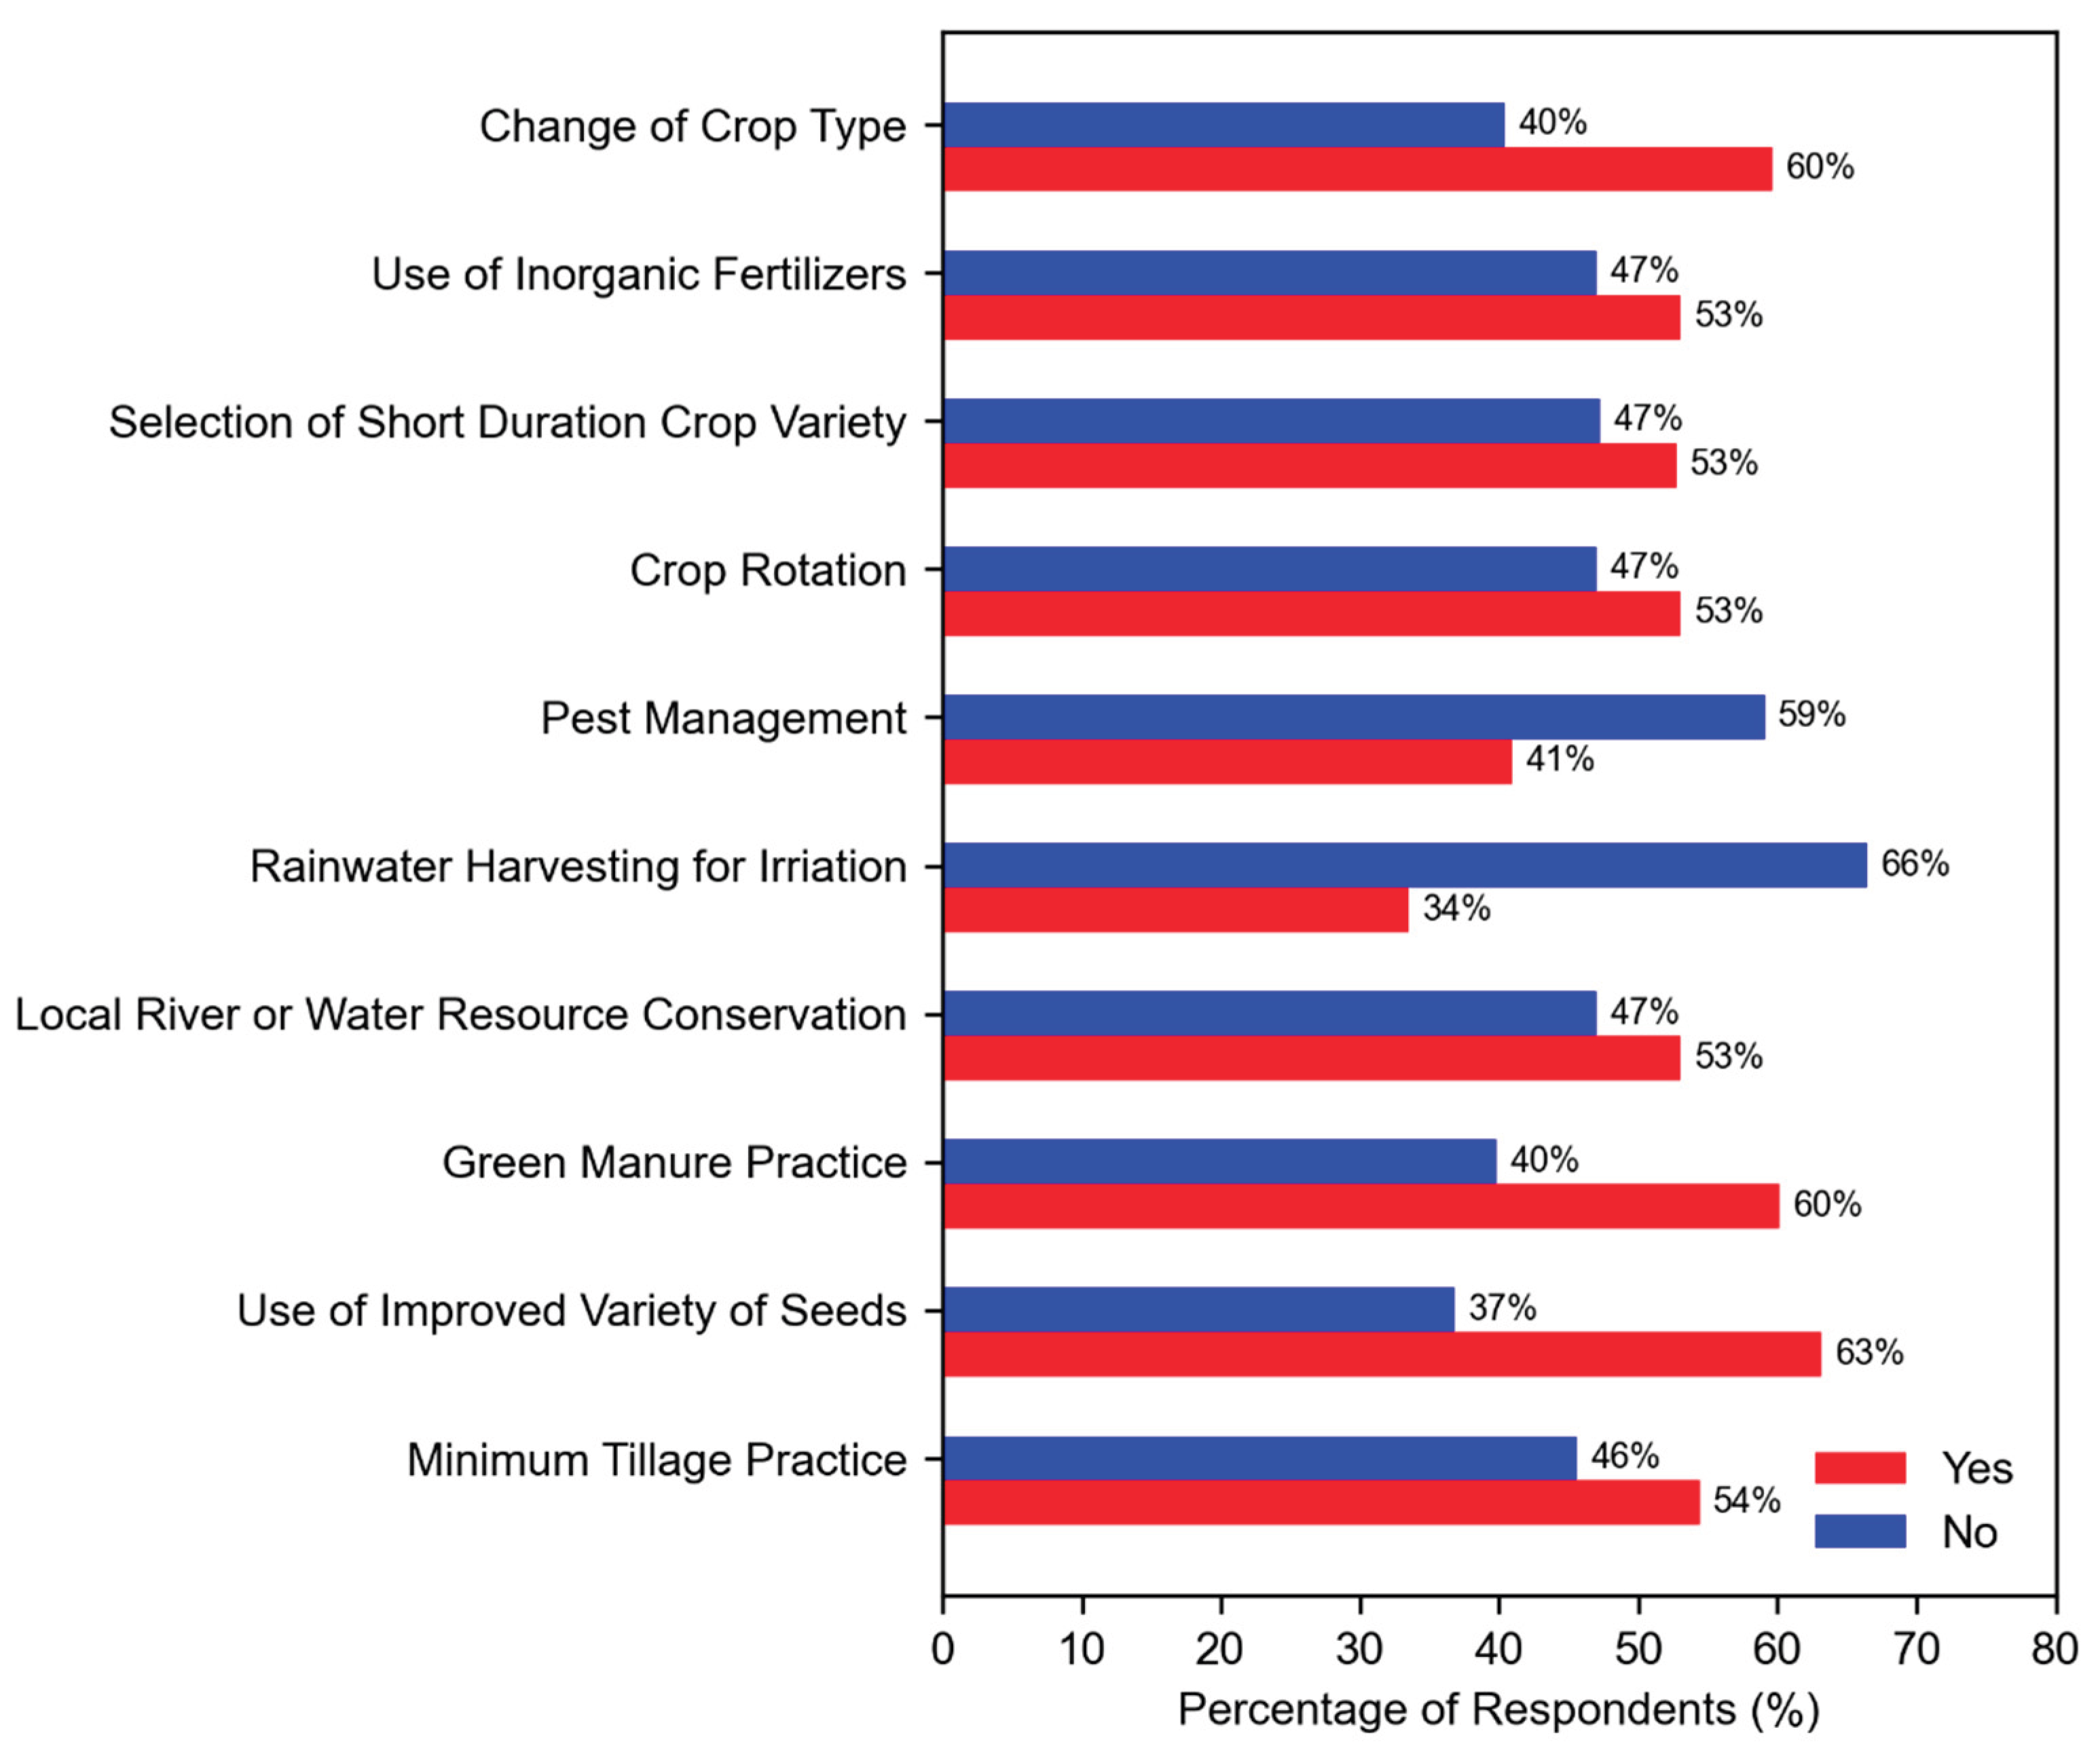

Table 1.
Detailed information of total household and sample size for questionnaire survey.
| Municipulaty | ward | Village | Total population | Percentage of Population | Sampling size | |
|---|---|---|---|---|---|---|
| K.I. Singh | 5 | Buhargoun | 593 | 13.29 | 49 | |
| 5 | Jamalkatte Tallo | 229 | 5.1 | 19 | ||
| 6 | Lidesain/Phaledi | 592 | 13.27 | 49 | ||
| 6 | Bhatigoun | 292 | 6.54 | 24 | ||
| Dipayal silgadhi | 5 | Bajagau | 251 | 5.62 | 21 | |
| 5 | Gholtada | 453 | 10.15 | 37 | ||
| 3 | Kailada | 382 | 8.56 | 31 | ||
| 3 | Mathatar | 459 | 10.28 | 38 | ||
| Sikhar | 5 | Airi goun | 164 | 3.67 | 13 | |
| 5 | Dhamigoun | 557 | 12.48 | 46 | ||
| 4 | Arsu | 315 | 7.06 | 26 | ||
| 4 | Markartte | 174 | 3.90 | 14 | ||
| Total | 4461 | 367 |
Table 2.
Linear trends (Sen’s slope, mm year-1/oC year-1) and variability (coefficient of variation, %) for four seasons.
Table 2.
Linear trends (Sen’s slope, mm year-1/oC year-1) and variability (coefficient of variation, %) for four seasons.
| Climate Variables | Season | |||
|---|---|---|---|---|
| Pre-Monsoon | Monsoon | Post-Monsoon | Winter | |
| Linear Trend (Sen’s Slope) | ||||
| PCP | -1.36 | -2.53** | 0.0 | -0.86 |
| TMAX | 0.09** | 0.02 | -0.01 | 0.02 |
| TMIN | 0.1* | 0.09* | 0.06* | 0.03* |
| DTR | -0.01 | -0.07 | -0.05 | -0.02 |
| Variability (Coefficient of Variation) | ||||
| PCP | 49 | 21 | 178 | 54 |
| TMAX | 4 | 2 | 5 | 5 |
| TMIN | 7 | 3 | 7 | 16 |
| DTR | 7 | 9 | 10 | 9 |
Table 3.
Summary of agricultural production trends and variability for three periods.
| Crop | Period | Mean | CV (%) | Sen's Slope | P-Value |
|---|---|---|---|---|---|
| Paddy | 1982–2000 | 1800 | 20.4 | 62.6* | 0.0001 |
| 2001–2010 | 2350 | 6.8 | 19.3 | 0.4707 | |
| 2011–2022 | 2304 | 9.9 | 40.5* | 0.0467 | |
| Wheat | 1982–2000 | 1168 | 20.5 | 32.9* | 0.0018 |
| 2001–2010 | 1586 | 16.0 | -24.1 | 0.243 | |
| 2011–2022 | 2035 | 7.4 | -6.5 | 0.837 | |
|
Maize |
1982–2000 | 1568 | 17.9 | 35.1* | 0.0014 |
| 2001–2010 | 1772 | 8.1 | -7.5 | 0.9284 | |
| 2011–2022 | 2305 | 15.0 | 97.7* | 0.0002 |
Table 4.
Linear relationship between annual and three years running mean time series of crop yield and climate variables expressed as correlation coefficients. Correlation that are significant at 95% confidence level are indicated by asterisk (*).
Table 4.
Linear relationship between annual and three years running mean time series of crop yield and climate variables expressed as correlation coefficients. Correlation that are significant at 95% confidence level are indicated by asterisk (*).
| Paddy | Maize | Wheat | ||||
|---|---|---|---|---|---|---|
| Raw | Smooth | Raw | Smooth | Raw | Smooth | |
| PCP | -0.13 | -0.23 | -0.11 | -0.3 | -0.14 | -0.40* |
| TMAX | 0.35* | 0.43* | 0.02 | 0.05 | 0.11 | 0.26 |
| TMIN | 0.56* | 0.61* | 0.28 | 0.30 | 0.51* | 0.62* |
| DTR | -0.09 | -0.15 | -0.18 | -0.19 | -0.26 | -0.30 |
Table 5.
Linear relationship between seasonal and three years running mean time series of crop yield and climate variables expressed as correlation coefficients. Correlation that are significant at 95% confidence level are indicated by asterisk (*).
Table 5.
Linear relationship between seasonal and three years running mean time series of crop yield and climate variables expressed as correlation coefficients. Correlation that are significant at 95% confidence level are indicated by asterisk (*).
| Season | Climate Variable |
Paddy Raw |
Paddy Smooth |
Maize Raw |
Maize Smooth | Wheat Raw | Wheat Smooth |
|---|---|---|---|---|---|---|---|
| Pre- Monsoon |
PCP | -0.24 | -0.46* | -0.16 | -0.29 | -0.19 | -0.50* |
| TMAX | 0.37* | 0.55* | 0.11 | 0.07 | 0.20 | 0.39* | |
| TMIN | 0.40* | 0.47* | 0.09 | 0.11 | 0.33* | 0.46* | |
| DTR | 0.09 | 0.10 | 0.05 | -0.04 | -0.04 | -0.05 | |
| Monsoon | PCP | -0.06 | -0.22 | -0.21 | -0.50* | -0.19 | -0.35* |
| TMAX | 0.17 | 0.20 | 0.01 | 0.01 | -0.06 | -0.03 | |
| TMIN | 0.49* | 0.65* | 0.30 | 0.43* | 0.58* | 0.77* | |
| DTR | -0.17 | -0.27 | -0.18 | -0.26 | -0.40* | -0.50* | |
| Post-Monsoon | PCP | 0.05 | 0.11 | 0.18 | 0.12 | 0.08 | 0.04 |
| TMAX | 0.20 | 0.19 | 0.02 | 0.11 | 0.04 | 0.14 | |
| TMIN | 0.41* | 0.59* | 0.29 | 0.37* | 0.28 | 0.49* | |
| DTR | -0.08 | -0.13 | -0.15 | -0.08 | -0.13 | -0.12 | |
| Winter | PCP | -0.00 | -0.14 | 0.03 | 0.01 | 0.02 | -0.14 |
| TMAX | 0.28 | 0.36* | -0.04 | 0.02 | 0.14 | 0.34* | |
| TMIN | 0.34* | 0.34* | 0.17 | 0.16 | 0.26 | 0.39* | |
| DTR | 0.00 | 0.03 | -0.14 | -0.09 | -0.06 | -0.01 |
Disclaimer/Publisher’s Note: The statements, opinions and data contained in all publications are solely those of the individual author(s) and contributor(s) and not of MDPI and/or the editor(s). MDPI and/or the editor(s) disclaim responsibility for any injury to people or property resulting from any ideas, methods, instructions or products referred to in the content. |
© 2026 by the authors. Licensee MDPI, Basel, Switzerland. This article is an open access article distributed under the terms and conditions of the Creative Commons Attribution (CC BY) license.
Copyright: This open access article is published under a Creative Commons CC BY 4.0 license, which permit the free download, distribution, and reuse, provided that the author and preprint are cited in any reuse.


