
Submitted:
03 February 2026
Posted:
04 February 2026
You are already at the latest version
Abstract
Transverse shear deformation plays a non-negligible role in lightweight periodic-core structures and motivates the use of shear-corrected reduced-order plate and beam models. However, the shear correction factor ks is often treated as a constant despite its strong dependence on cross-sectional heterogeneity and geometry. This work quantifies the global sensitivity of ks in corrugated paperboard by combining an energy-consistent pixel-based identification of the effective shear stiffness GA)eff with a space-filling exploration of the parameter domain. Representative 3-ply (single-wall) and 5-ply (double-wall) configurations are generated directly in the pixel domain using sinusoidal fluting descriptions and non-overlapping liner bands. The effective shear stiffness is obtained from a heterogeneous shear-energy equivalence, where a normalized two-dimensional shear-stress shape function is computed from pixel-based sectional descriptors and integrated with spatially varying shear moduli. Latin Hypercube Sampling is employed to explore wide ranges of flute period, height, and thickness, liner thicknesses, and liner–flute shear-modulus contrasts. Global sensitivity is reported using unit-free normalized indices, including log-elasticities (based on the slope of lnks versus lnx) and partial rank correlation coefficients. The results demonstrate that flute geometry is the primary driver of ks variability, while material contrast significantly modulates shear-energy localization, particularly in double-wall boards with two distinct flutings. The proposed framework enables high-throughput shear correction assessment and supports robust parameterized reduced-order models for corrugated structures.
Keywords:
corrugated board
; shear correction factor
; transverse shear deformation
; pixel-based modeling
; global sensitivity analysis
; latin hypercube sampling
1. Introduction
Lightweight layered and cellular structures are widely used in engineering whenever high stiffness-to-weight and controllable mechanical response are required. Typical examples include sandwich panels, rib-stiffened shells, corrugated cores, honeycomb configurations, and architected metamaterials. In many applications, the global structural response is governed not only by material properties but also by geometry-driven mechanisms such as local bending of webs, shear deformation within compliant cores, and stress redistribution around voids. As a result, accurate analysis and design require modelling frameworks that can connect microstructural geometry to macroscopic stiffness and strength while remaining computationally efficient for parametric studies and optimization tasks. [1,2,3,4,5]
A common strategy in this context is to replace a detailed heterogeneous configuration with a homogenized or equivalent continuum model. For layered and periodic structures this often takes the form of an equivalent orthotropic plate or beam, typically derived using energy-based homogenization or computational representative volume elements (RVE). [6,7,8,9,10,11,12,13] While such reduced-order models offer major computational advantages, their accuracy depends critically on how they represent the internal deformation mechanisms of the original structure. Among these mechanisms, transverse shear is particularly challenging: it is negligible for thin homogeneous plates but becomes decisive for thick laminates, soft-core sandwich structures, and periodic cores with voids or inclined webs. [14,15,16,17,18,19,20]
In classical plate theory, shear deformation is neglected (Kirchhoff–Love model), leading to good predictions for slender plates dominated by bending. In contrast, in the Timoshenko–Mindlin family of models, transverse shear is included and a key parameter appears: the shear correction factor . This factor compensates for the fact that the assumed through-thickness shear strain (often constant) does not match the true shear stress distribution, which depends on cross-sectional geometry and material heterogeneity. In homogeneous rectangular beams and plates, reference values of are available (e.g., the well-known factors for rectangular cross-sections). However, for strongly heterogeneous, perforated, or architected cross-sections, cannot be assumed universal and must be identified consistently. [21,22,23,24,25,26]
The need for reliable shear correction is especially evident in periodic cores and multi-layered configurations. For corrugated or honeycomb-like microstructures, shear stresses may localize in thin load paths, bypass void regions, and be redistributed by stiff faces. In such systems, the effective shear response is governed by an interplay of geometry (period, height, thickness, topology) and phase stiffness contrast. Consequently, inaccurate shear correction can lead to systematic errors in predicted deflections, stress resultants, and even in derived design conclusions when simplified plate models are used for parametric design. [27,28,29]
A second challenge is that shear correction factors are frequently introduced in reduced-order models in a way that is not energy-consistent, especially when one attempts to reuse simple textbook factors for cross-sections with complex heterogeneity. Energy-consistent identification is crucial because the effective shear stiffness must reproduce not only the global deflection but also the correct shear energy stored in the structure under transverse loading. For heterogeneous layered systems, energy-based equivalence provides a robust path to define the effective shear stiffness and to derive relative to an explicit reference model. [10,26]
A practical difficulty remains: even if an energy-consistent definition is adopted, computing repeatedly for many design variants can be expensive, particularly if full-scale finite element simulations are required for each geometric configuration. This becomes a bottleneck when the goal is not a single calibration but a systematic assessment of how sensitive is to changes in geometry and material properties across a realistic design space. Such sensitivity knowledge is important in at least three contexts: (i) robust design under manufacturing tolerances and paper variability, (ii) development of fast surrogate models for design optimization, and (iii) deciding which parameters must be measured and controlled to ensure predictive reliability of reduced-order models. [30,31,32]
Corrugated board is a representative and industrially relevant example of such a geometry-dominated, heterogeneous structure. It consists of flat paper liners bonded to one or more sinusoidally shaped fluting layers, forming 3-ply (single-wall) and 5-ply (double-wall) assemblies commonly used in packaging. Corrugated board is simultaneously lightweight, recyclable, and mechanically efficient, yet its response is strongly influenced by flute geometry, paper anisotropy, and moisture-dependent stiffness. Because its internal architecture contains voids and inclined webs, transverse shear deformation may contribute significantly in certain test configurations and structural applications, especially at short spans and under out-of-plane loading. [33,34,35,36,37]
A substantial body of research addresses bending stiffness, edge crush strength, and constitutive modelling of corrugated board under various loading conditions. Reduced-order modelling approaches, including homogenized orthotropic plates, are widely used to predict global stiffness and to support package design. [38,39] Nevertheless, compared to bending-dominated metrics, the identification and systematic characterization of shear correction remains less developed, particularly for multi-wall boards and for broad variations in geometry and material stiffness that arise across flute families and paper grades.
In addition, sensitivity studies reported in the literature often focus on local effects (small perturbations around a baseline configuration) or on a limited set of parameters. While such analyses can be informative, they do not necessarily capture the full range of coupled effects present in corrugated structures. When a response is governed by nonlinear geometric interactions, void topology, and stiffness contrast, the ranking of influential parameters may change across the domain. In this case, global sensitivity analysis, based on space-filling sampling strategies such as Latin Hypercube Sampling (LHS), provides a more appropriate framework to evaluate parameter influence, detect interactions, and identify robust trends [31,40].
Motivated by these gaps, the present work investigates the sensitivity of the shear correction factor for corrugated board across a broad multi-parameter space, focusing on both 3-ply and 5-ply configurations. The study adopts a pixel-based, energy-consistent procedure for computing directly from the cross-sectional geometry and spatially varying shear modulus fields, avoiding ad-hoc assumptions and enabling high-throughput evaluation [41,42,43,44,45,46,47]. The parameter space is explored using LHS, and sensitivity is quantified in a normalized, unit-free manner using measures that directly express percentage-to-percentage influence, enabling an interpretable ranking of drivers across variables with different physical dimensions [10,35].
The main contributions of this paper are: (a) a global (nonlocal) sensitivity assessment of for corrugated paperboard performed over a wide admissible parameter space, rather than relying on local perturbations around a single reference design. This reveals dominant drivers and interactions relevant for real product families and manufacturing variability; (b) a unified framework for 3-ply and 5-ply boards, explicitly allowing distinct geometries and stiffnesses of two flutings in the double-wall case, which is essential for capturing multi-layer coupling effects that cannot be inferred from single-wall trends; (c) energy-consistent, pixel-based evaluation of enabling high-throughput computation of across thousands of sampled designs, offering a practical route toward surrogate modelling, robust design, and reliable shear-corrected reduced-order models; (d) Normalized, unit-free sensitivity indices (%/%), based on log-elasticities and complementary global measures, providing directly interpretable statements such as “a 1% change in parameter produces an average % change in ” across the explored domain.
These outcomes are important because they help transform from a loosely chosen tuning factor into a geometry- and material-dependent quantity with quantified uncertainty and sensitivity, improving the reliability of reduced-order models used in packaging mechanics and other periodic-core structural applications.
2. Materials and Methods
2.1. Scope of the Study and Investigated Configurations
This study quantifies the sensitivity of the transverse shear correction factor to the key geometric and material parameters of corrugated paperboard. Two structural families are considered: (i) 3-ply (single-wall): top liner + sinusoidal fluting + bottom liner; (ii) 5-ply (double-wall): top liner + fluting 1 + middle liner + fluting 2 + bottom liner.
For the double-wall configuration, the two flutings may exhibit different periods, heights and thicknesses, enabling a systematic evaluation of geometric interactions. The analysis is conducted over a wide admissible parameter space using global sampling (Latin Hypercube), which allows identification of dominant parameters and parameter couplings beyond local perturbations around a single reference design.
2.2. Definition of the Shear Correction Factor
The shear correction factor is defined by comparing the effective transverse shear stiffness of the heterogeneous cross-section with the shear stiffness of a flat reference model:
The reference area is taken as
where denotes the out-of-plane width (unit width is adopted in computations) and is the adopted reference height corresponding to the total thickness of the considered corrugated board configuration.
To ensure a stable normalization across broad geometric and material variations, a thickness-weighted reference shear modulus is used:
where and are the thickness and shear modulus of the -th layer (liners and flutings). This definition avoids imposing a priori that only one phase carries shear and ensures consistent comparison between 3-ply and 5-ply configurations.
2.3. Parametric Geometry and Pixel-Based Representation
2.3.1. Sinusoidal Fluting Geometry
The fluting centerline is defined by:
with period , height (peak-to-peak), vertical offset , and phase shift . Finite thickness is introduced by constructing a constant-thickness band around the centerline.
For 5-ply boards, two flutings are described independently by and and are placed into two non-overlapping core bands between (top, middle) and (middle, bottom) liners, respectively.
2.3.2. Pixel Image Generation and Phase Encoding
The cross-section is represented by a grayscale pixel image generated in MATLAB. The following encoding is used:
- background (void): intensity ,
- liners: intensity ,
- fluting(s): intensity .
The physical pixel size (mm/pixel) controls geometric resolution. To prevent loss of thin layers and boundary artefacts, the admissible domain is constrained such that:
where is the minimum thickness among all considered liners and flutings. The same generator is employed both for methodological figures and for the numerical evaluation of , ensuring full consistency between geometry visualization and computation.
2.4. Pixel-Based Identification of
2.4.1. Energy-Consistent Formulation
The effective transverse shear stiffness is identified by enforcing equivalence between the shear strain energy of a flat Timoshenko model and the heterogeneous cross-section under the same shear resultant . For a representative segment of length , the flat-model energy reads:
For a heterogeneous cross-section, the shear energy may be expressed using a normalized 2D shear-stress shape function defined such that:
which guarantees that integration of over the cross-section yields the shear resultant . Under linear elasticity, the heterogeneous shear energy becomes:
By imposing , the effective shear stiffness is obtained as:
Finally, follows from Eq. (1).
2.4.2. Pixel Discretization and Material Mapping
The cross-section is discretized into pixels (or subpixels) of area . Void pixels are excluded from the mechanical domain. Each material pixel is assigned a shear modulus based on its phase label (liner vs fluting; in 5-ply cases, fluting 1 and fluting 2 may have different ). This yields a discrete material field and a corresponding set of integration weights .
2.4.3. Construction of the 2D Shear-Stress Shape Function
To avoid introducing additional modelling assumptions beyond geometry and material phase distribution, the shear-stress shape function is constructed directly from the pixelized cross-section using a geometry-consistent 2D formulation. The approach relies on the classical relationship between shear stresses and the first moment of area (static moment) while retaining full 2D resolution required by corrugated geometries.
First, the area and centroid of the material domain are computed from pixel quadrature:
Next, the second moment of area about the centroidal axis is evaluated:
To define the shear-stress distribution across the cross-section, a 2D static-moment field is introduced. For a point in the material domain, represents the first moment of area of the portion of the cross-section located above that point (with respect to the centroidal axis). In discrete form, for every material pixel at coordinates , we define:
The local thickness measure entering the shear-stress relation is defined from the pixel domain as an effective local width , computed as the material measure in the horizontal direction associated with the given pixel row. In the discretized setting, this can be expressed as:
which corresponds to the length of material present at the level (for unit out-of-plane width). This definition naturally captures the fact that corrugated sections may be discontinuous along at a given height due to void regions.
With these ingredients, the unnormalized shear-stress shape field is computed as:
Finally, the field is normalized to satisfy the resultant condition in Eq. (7):
Equations (12)–(15) define a fully 2D, geometry-consistent shape function computed directly from the pixel representation. This construction avoids prescribing shear localization a priori and allows the subsequent energy evaluation to reflect both geometric complexity (corrugation) and spatially varying shear modulus .
2.4.4. Discrete Evaluation of and
With and defined on material pixels, Eq. (9) becomes:
The shear correction factor is then computed from Eq (1):
All computations are performed for a unit width , and the reported values of are therefore independent of scaling in the out-of-plane direction.
2.5. Global Sensitivity Analysis Using Latin Hypercube Sampling
2.5.1. Parameter Vectors
For the 3-ply configuration, the parameter vector is:
For the 5-ply configuration:
This parametrization enables separation of geometric and material influences and explicitly allows different flute families in the double-wall board.
2.5.2. Parameter Ranges and Feasibility Constraints
The admissible ranges are selected to cover representative corrugated geometries and material variability while ensuring stable discretization:
3-ply:
- mm,
- mm,
- mm,
- mm,
- GPa,
- GPa.
5-ply:
- mm,
- mm,
- mm,
- mm,
- GPa,
- GPa.
All samples must satisfy: (i) no overlap of phases (enforced by construction in the image generator), and (ii) the resolution condition in Eq. (5).
2.5.3. LHS Sampling Strategy
A Latin Hypercube Sampling (LHS) design of size is generated for each configuration family. Geometric variables are sampled from uniform distributions within their bounds. To represent multiplicative uncertainty in stiffness, shear moduli are sampled from a log-uniform distribution:
For each sampled vector , the computational pipeline is:
- 1.
- generate pixel geometry,
- 2.
- assign shear modulus field ,
- 3.
- compute the 2D shape function using Eqs. (12)–(15),
- 4.
- evaluate by Eq. (16),
- 5.
- compute by Eq. (1).
This produces the dataset used in subsequent analysis.
2.5.4. Normalized global sensitivity metrics
To quantify sensitivity in a unit-free and comparable manner across variables, two complementary normalized indices are adopted. First, we use log-elasticities, defined as
which directly represent the percentage change of per percentage change of the input variable . In practice, is estimated by fitting a linear model in logarithmic space,
so that . Second, we compute partial rank correlation coefficients (PRCC), which quantify the influence of each variable while controlling for the remaining inputs and are robust to monotonic nonlinearities. Both indices are evaluated on the dataset generated by Latin Hypercube Sampling and are reported as normalized, dimensionless sensitivity measures.
2.6. Computational Implementation and Reproducibility
All calculations are performed in MATLAB. Geometry generation and pixel-based integration are fully automated to enable high-throughput evaluation of across LHS samples. For stochastic designs, a fixed pseudo-random seed is used to ensure reproducibility. A mesh-resolution robustness check is conducted on a representative subset of samples to confirm that the computed values and sensitivity trends are not affected by pixel discretization artefacts.
3. Results
3.1. Dataset Overview and Numerical Stability
Global datasets for 3-ply and 5-ply corrugated boards were generated using Latin Hypercube Sampling (LHS) within the prescribed geometric and material parameter ranges summarized in Table 1. For each LHS realization, the corresponding geometry was constructed directly in the pixel domain, and the shear correction factor was computed using the pixel-based energy-consistent method described in Section 2. After enforcing feasibility and minimum-resolution constraints, the final datasets consisted of valid samples for the 3-ply configuration and samples for the 5-ply configuration.
Representative examples of the pixel-based geometries generated within these ranges are shown in Figure 1, illustrating the fundamental structural differences between the single-flute 3-ply board and the double-flute 5-ply configuration.
To verify the numerical robustness of the pixel discretization, a resolution sensitivity study was performed on a representative subset of samples by repeating the computations using a refined pixel size. The relative changes in the shear correction factor, , are summarized in Table 2.
The limited magnitude of these variations confirms that the global trends discussed in the following sections are not governed by discretization artefacts but reflect genuine geometric and material effects.
3.2. Distribution of the Shear Correction Factor
Across the investigated parameter space, the computed shear correction factors exhibit a pronounced spread, reflecting the strong dependence of transverse shear behavior on both geometry and material contrast. The empirical distributions obtained from the LHS datasets for the 3-ply and 5-ply configurations are shown in Figure 2.
3.3. Global Sensitivity: Normalized Effects (%/%)
To quantify parameter influence in a unit-free and directly interpretable manner, two complementary global sensitivity measures were employed: (i) log-elasticities (Eq. (20)) and (ii) Partial Rank Correlation Coefficients (PRCC).
The resulting normalized sensitivity indices for the 3-ply and 5-ply configurations are reported in Table 4 and Table 5, respectively.
For a concise visual ranking of the dominant drivers, the log-elasticities are displayed in the tornado plots shown in Figure 3.
3.4. Response Surfaces for the Dominant Geometric Drivers
For the 3-ply configuration, the response surface evaluated at median values of the remaining parameters is shown in Figure 4.
Analogous response surfaces for the 5-ply configuration are presented in Figure 5, where each fluting family is examined separately.
3.5. Material Contrast Effects and Key Interactions
Material contrast between liners and fluting layers, typically expressed via shear-modulus ratios, significantly affects the shear correction factor. The dependence of on modulus contrast is illustrated in Figure 6.
Interaction effects between material contrast and geometry are further examined using binned plots shown in Figure 7.
3.6. Comparison Between 3-ply and 5-ply Sensitivity Patterns
A direct comparison of normalized sensitivities for the 3-ply and 5-ply configurations is presented in Figure 8, allowing universal and configuration-specific drivers of to be identified.
4. Discussion
The present study provides a comprehensive, global assessment of the shear correction factor for multiwall corrugated structures, combining large-scale parametric sampling with an energy-consistent, pixel-based formulation. By systematically analyzing both 3-ply and 5-ply configurations, the results allow clear identification of universal drivers, configuration-specific effects, and key geometric–material interactions governing transverse shear behavior.
4.1. Reliability of the Dataset and Numerical Robustness
A prerequisite for meaningful sensitivity analysis is numerical robustness. The adopted parameter ranges and sampling strategy, summarized in Table 1, ensure broad coverage of realistic corrugated-board configurations while maintaining physical feasibility. The pixel-based geometries illustrated in Figure 1 confirm that the discretization captures essential geometric features for both single- and double-flute systems.
The resolution sensitivity study reported in Table 2 demonstrates that the computed shear correction factors are only weakly affected by pixel refinement. The small median and upper-percentile deviations indicate that the global trends identified in subsequent analyses are intrinsic to the structural parameters rather than artefacts of discretization. This robustness is particularly important for the 5-ply case, where increased geometric complexity could otherwise amplify numerical sensitivity.
4.2. Global Variability of the Shear Correction Factor
The distributions of obtained from Latin Hypercube Sampling, shown in Figure 2, reveal substantial variability across the investigated parameter space. The statistical descriptors provided in Table 3 confirm that this variability is significantly larger for 5-ply boards than for 3-ply boards. This finding reflects the additional deformation mechanisms introduced by the second fluting and the middle liner, which increase both geometric freedom and interaction effects.
The broader dispersion and heavier tails observed in Figure 2(b) indicate that extreme combinations of geometry and material contrast can lead to shear correction factors far from classical reference values. This result directly challenges the common practice of adopting a single, constant shear correction factor for corrugated structures, especially for multiwall configurations.
4.3. Dominant Parameters and Normalized Sensitivity Patterns
The normalized sensitivity analysis provides a quantitative ranking of parameter influence in a unit-free form. The results reported in Table 4 (3-ply) and Table 5 (5-ply) show that geometric parameters associated with fluting shape consistently dominate the response. This conclusion is reinforced by the tornado plots in Figure 3, where flute height and period emerge as the primary drivers of across the global parameter space.
While log-elasticities and PRCC largely agree in their ranking, discrepancies for selected parameters suggest the presence of nonlinear or non-monotonic effects. Such behavior is expected in corrugated structures, where local changes in geometry can alter load paths and energy distribution in a non-proportional manner. Importantly, the sensitivity patterns differ between 3-ply and 5-ply boards, indicating that conclusions drawn from single-wall systems cannot be directly transferred to multiwall configurations.
4.4. Physical Interpretation via Response Surfaces
For the 3-ply configuration, the response surface shown in Figure 4 reveals strong nonlinear coupling between flute period and height. Regions of high correspond to geometries that promote more uniform shear strain distribution across the cross-section, whereas low values are associated with slender or widely spaced flutes that concentrate shear deformation.
The 5-ply response surfaces in Figure 5 further demonstrate that each fluting family contributes distinctly to the global shear response. Fixing one flute while varying the other reveals asymmetric influence patterns, highlighting the role of inter-layer interactions. These results confirm that the effective shear correction factor in multiwall boards cannot be interpreted as a simple superposition of individual flute contributions.
4.5. Role of Material Contrast and Interaction Effects
Beyond geometry, material contrast between liners and fluting layers plays a critical role in shaping transverse shear behavior. The scatter plots in Figure 6 show that varies systematically with shear-modulus ratios such as , but the relationship is strongly modulated by geometry. This observation underscores that material contrast alone is insufficient to predict shear correction behavior without considering geometric context.
The interaction plots in Figure 7 provide further insight by demonstrating how stiffness contrast amplifies or suppresses geometric effects. For certain modulus ratios, changes in flute height lead to pronounced variations in , while for others the response becomes comparatively insensitive. Such interactions explain the partial discrepancies observed between log-elasticities and PRCC in Table 4 and Table 5, and they emphasize the need for multidimensional analysis when assessing corrugated-board shear behavior.
4.6. Comparison Between 3-ply and 5-ply Systems
A direct comparison of normalized sensitivities, presented in Figure 8, highlights both universal and configuration-specific drivers of the shear correction factor. Flute geometry emerges as a universal determinant of across both systems, confirming its fundamental role in transverse shear deformation.
However, the 5-ply configuration exhibits additional influential parameters associated with the middle liner and the second fluting layer. These configuration-specific effects lead to higher variability and more complex interaction patterns, as already suggested by the broader distributions in Figure 2 and the response surfaces in Figure 5. Consequently, design rules or simplified models calibrated for 3-ply boards may be inadequate or even misleading when applied to multiwall corrugated structures.
4.7. Implications for Modeling and Design
Taken together, the results presented in Figure 1, Figure 2, Figure 3, Figure 4, Figure 5, Figure 6, Figure 7 and Figure 8 and Table 1, Table 2, Table 3, Table 4 and Table 5 demonstrate that the shear correction factor for corrugated boards is not a fixed material constant but a highly configuration-dependent quantity. The strong sensitivity to geometry, material contrast, and their interactions implies that simplified assumptions, such as adopting a universal shear correction factor, can lead to significant modeling errors, particularly for multiwall systems.
The proposed energy-consistent, pixel-based framework provides a systematic means of quantifying these effects and can serve as a foundation for reduced-order models or design-oriented correlations. Importantly, the distinction between universal and configuration-specific drivers identified in Figure 8 offers guidance for developing simplified yet physically grounded design rules for corrugated structures of varying complexity.
5. Conclusions
This study presented a comprehensive global sensitivity analysis of the shear correction factor for 3-ply and 5-ply corrugated board structures using a pixel-based, energy-consistent numerical framework combined with Latin Hypercube Sampling. Based on the results reported in Table 1, Table 2, Table 3, Table 4 and Table 5 and Figure 1, Figure 2, Figure 3, Figure 4, Figure 5, Figure 6, Figure 7 and Figure 8, the following conclusions can be drawn:
- 1.
- The resolution sensitivity study confirmed that the computed shear correction factors are only weakly affected by pixel refinement. The small relative variations observed for both 3-ply and 5-ply configurations demonstrate that the identified trends are intrinsic to the structural parameters rather than discretization artefacts, supporting the reliability of the proposed methodology.
- 2.
- The distributions of reveal substantial variability across the investigated parameter space, with significantly broader ranges for 5-ply boards compared to 3-ply boards. This increased dispersion reflects the additional deformation mechanisms and interaction effects introduced by multiple flutings and intermediate liners, indicating that cannot be treated as a universal constant.
- 3.
- Normalized sensitivity indices consistently identify fluting geometry—particularly flute height and period—as the primary drivers of the shear correction factor in both configurations. These parameters exert a stronger influence on than material properties alone, underscoring the central role of geometric design in governing transverse shear behavior.
- 4.
- Response surfaces and interaction plots demonstrate pronounced nonlinear coupling between geometric parameters as well as between geometry and material contrast. In multiwall configurations, the contribution of each fluting family is not additive, and interactions between layers play a decisive role in shaping the effective shear response.
- 5.
- While shear-modulus ratios between fluting and liners significantly affect , their influence is strongly dependent on the underlying geometry. Material contrast can either amplify or suppress geometric effects, explaining observed differences between sensitivity measures and reinforcing the need for multidimensional analysis.
- 6.
- Although certain drivers of , such as fluting geometry, are universal, multiwall (5-ply) boards exhibit additional configuration-specific sensitivities associated with the middle liner and the second fluting layer. Consequently, conclusions drawn from single-wall systems cannot be directly extrapolated to more complex corrugated structures.
- 7.
- The results demonstrate that adopting a single, fixed shear correction factor—commonly used in simplified beam and plate models—may lead to significant inaccuracies, particularly for multiwall corrugated boards. The presented framework provides a physically grounded basis for developing configuration-dependent shear correction factors suitable for advanced numerical modeling and design-oriented reduced-order formulations.
Overall, this work establishes a systematic methodology for quantifying the sensitivity of shear correction factors in corrugated structures and provides new insight into the interplay between geometry and material contrast. The findings offer a foundation for improved mechanical modeling of multiwall corrugated boards and motivate the development of refined design rules that account explicitly for structural configuration.
Author Contributions
Conceptualization, J.G. and T.G.; methodology, J.G. and T.G.; software, T.G.; validation, J.G., J.T. and T.G.; formal analysis, J.G.; investigation, J.G.; resources, J.T.; data curation, J.T.; writing—original draft preparation, J.G. and T.G.; writing—review and editing, J.T.; visualization, J.G. and T.G.; supervision, T.G.; project administration, T.G.; funding acquisition, T.G. All authors have read and agreed to the published version of the manuscript.
Funding
The work uses the results of research carried out as part of the project implemented by the company WERNER KENKEL Bochnia Spółka z o. o. The project was funded within the grant of The National Centre for Research and Development under the number POIR.01.01.01-00-0002/21.
Institutional Review Board Statement
Not applicable.
Informed Consent Statement
Not applicable.
Data Availability Statement
The data supporting the findings of this study are available from the corresponding author upon reasonable request.
Acknowledgments
The authors thank WERNER KENKEL Bochnia Sp. z o.o. for providing technical support and help in data interpretation.
Conflicts of Interest
The authors declare no conflicts of interest.
References
References
- Gibson, L.J.; Ashby, M.F. Cellular Solids: Structure and Properties, 2nd ed.; Cambridge University Press: Cambridge, UK, 1997. [Google Scholar]
- Fleck, N.A.; Deshpande, V.S.; Ashby, M.F. Micro-architectured materials: Past, present and future. Proc. R. Soc. A, 2010; 466. [Google Scholar]
- Wadley, H.N.G. Multifunctional periodic cellular metals. Philos. Trans. R. Soc. A 2006, 364. [Google Scholar] [CrossRef]
- Schaedler, T.A.; Carter, W.B. Architected Cellular Materials. Annu. Rev. Mater. Res. 2016, 46. [Google Scholar] [CrossRef]
- Nemat-Nasser, S.; Hori, M. Micromechanics: Overall Properties of Heterogeneous Materials; Elsevier: Amsterdam, The Netherlands, 1993. [Google Scholar]
- Biancolini, M.E. Evaluation of equivalent stiffness properties of corrugated board. Compos. Struct. 2005, 69. [Google Scholar] [CrossRef]
- Talbi, N.; Batti, A.; Ayad, R.; Guo, Y.Q. An analytical homogenization model for finite element modelling of corrugated cardboard. Compos. Struct. 2009, 88. [Google Scholar] [CrossRef]
- Buannic, N.; Cartraud, P.; Quesnel, T. Homogenization of corrugated core sandwich panels. Compos. Struct. 2003, 59. [Google Scholar] [CrossRef]
- Suquet, P. Elements of homogenization for inelastic solid mechanics. In Homogenization Techniques for Composite Media; Sanchez-Palencia, E., Zaoui, A., Eds.; Springer: Berlin/Heidelberg, Germany, 1987. [Google Scholar]
- Garbowski, T.; Gajewski, T. Determination of transverse shear stiffness of sandwich panels with a corrugated core by numerical homogenization. Materials 2021, 14. [Google Scholar] [CrossRef]
- Maouche, M.-F.; Hecini, M. Analytical Homogenization Approach for Double-Wall Corrugated Cardboard Incorporating Constituent Layer Characterization. Appl. Mech. 2026, 7, 4. [Google Scholar] [CrossRef]
- Beck, M.; Fischerauer, G. Modeling Warp in Corrugated Cardboard Based on Homogenization Techniques for In-Process Measurement Applications. Appl. Sci. 2022, 12, 1684. [Google Scholar] [CrossRef]
- Aduke, R.N.; Venter, M.P.; Coetzee, C.J. An Analysis of Numerical Homogenisation Methods Applied on Corrugated Paperboard. Math. Comput. Appl. 2023, 28, 46. [Google Scholar] [CrossRef]
- Reissner, E. The effect of transverse shear deformation on the bending of elastic plates. J. Appl. Mech. 1945, 12. [Google Scholar] [CrossRef]
- Mindlin, R.D. Influence of rotatory inertia and shear on flexural motions of isotropic, elastic plates. J. Appl. Mech. 1951, 18. [Google Scholar] [CrossRef]
- Reddy, J.N. A simple higher-order theory for laminated composite plates. J. Appl. Mech. 1984, 51. [Google Scholar] [CrossRef]
- Touratier, M. An efficient standard plate theory. Int. J. Eng. Sci. 1991, 29. [Google Scholar] [CrossRef]
- Shimpi, R.P. Refined plate theory and its variants. AIAA J. 2002, 40. [Google Scholar] [CrossRef]
- Thai, H.T.; Choi, D.H. A refined shear deformation theory for free vibration of functionally graded plates. Compos. Part B Eng. 2012, 43. [Google Scholar] [CrossRef]
- Sayyad, A.S.; Ghugal, Y.M. On the free vibration of angle-ply laminated composite and soft core sandwich plates. J. Sandwich Struct. Mater. 2017, 19. [Google Scholar] [CrossRef]
- Cowper, G.R. The shear coefficient in Timoshenko’s beam theory. J. Appl. Mech. 1966, 33. [Google Scholar] [CrossRef]
- Gruttmann, F.; Wagner, W. Shear correction factors in Timoshenko’s beam theory for arbitrary shaped cross-sections. Comput. Mech. 2001, 27. [Google Scholar] [CrossRef]
- Pai, P.F. A new look at shear correction factors and warping functions of anisotropic laminates. Int. J. Solids Struct. 1995, 32. [Google Scholar] [CrossRef]
- Nguyen, T.-K.; Vo, T.P.; Thai, H.-T. Vibration and buckling analysis of functionally graded sandwich plates with improved transverse shear stiffness based on the first-order shear deformation theory. Proc. Inst. Mech. Eng. Part C J. Mech. Eng. Sci., 2014; 228. [Google Scholar]
- Vinson, J.R. The Behavior of Sandwich Structures of Isotropic and Composite Materials; CRC Press: Boca Raton, FL, USA, 1999. [Google Scholar]
- Zenkert, D. The Handbook of Sandwich Construction; EMAS: West Midlands, UK, 1997. [Google Scholar]
- Nordstrand, T.; Carlsson, L.A. Evaluation of transverse shear stiffness of structural core sandwich plates. Compos. Struct. 1997, 37. [Google Scholar] [CrossRef]
- Östlund, S.; Niskanen, K. (Eds.) Mechanics of Paper Products, 2nd ed.; Walter de Gruyter: Berlin, Germany, 2021. [Google Scholar]
- Hägglund, R.; Isaksson, P. A mechanical model for paper and other planar fiber networks. Mech. Mater. 2006, 38. [Google Scholar]
- Saltelli, A.; Ratto, M.; Andres, T.; Campolongo, F.; Cariboni, J.; Gatelli, D.; Saisana, M.; Tarantola, S. Global Sensitivity Analysis: The Primer; Wiley: Chichester, UK, 2008. [Google Scholar]
- Helton, J.C.; Davis, F.J. Latin hypercube sampling and the propagation of uncertainty in analyses of complex systems. Reliab. Eng. Syst. Saf. 2003, 81. [Google Scholar] [CrossRef]
- Sudret, B. Global sensitivity analysis using polynomial chaos expansions. Reliab. Eng. Syst. Saf. 2008, 93. [Google Scholar] [CrossRef]
- Mrówczyński, D.; Gajewski, T.; Garbowski, T. Sensitivity Analysis of Creasing Parameters in Corrugated Board. Materials 2023, 16. [Google Scholar]
- Suarez, B.; Muneta, L.M.; Romero, G.; Sanz-Bobi, J.D. Efficient Design of Thin Wall Seating Made of a Single Piece of Heavy-Duty Corrugated Cardboard. Materials 2021, 14, 6645. [Google Scholar] [CrossRef]
- Rogalka, M.; Grabski, J.K.; Garbowski, T. Identification of Geometric Features of the Corrugated Board Using Images and Genetic Algorithm. Sensors 2023, 23. [Google Scholar] [CrossRef]
- Rogalka, M.; Grabski, J.K.; Garbowski, T. Deciphering Double-Walled Corrugated Board Geometry Using Image Analysis and Genetic Algorithms. Sensors 2024, 24. [Google Scholar] [CrossRef]
- Rogalka, M.; Grabski, J.K.; Garbowski, T. In-Situ Classification of Highly Deformed Corrugated Board Using Convolution Neural Networks. Sensors 2024, 24. [Google Scholar] [CrossRef] [PubMed]
- Aduke, R.N.; Venter, M.P.; Coetzee, C.J. Numerical Modelling of Corrugated Paperboard Boxes. Math. Comput. Appl. 2024, 29, 70. [Google Scholar] [CrossRef]
- Staszak, N.; Garbowski, T.; Szymczak-Graczyk, A. Solid Truss to Shell Numerical Homogenization of Prefabricated Composite Slabs. Materials 2021, 14, 4120. [Google Scholar] [CrossRef]
- Vu-Bac, N.; Rafiee, R.; Zhuang, X.; Lahmer, T.; Rabczuk, T. Uncertainty quantification for multiscale modeling of polymer nanocomposites with correlated parameters. Compos. Part B Eng. 2015, 68. [Google Scholar] [CrossRef]
- Garbowski, T.; Graczyk, J. Shear correction factor in corrugated board layered plates. Polish Paper Rev. 2025, 81, 686–690. [Google Scholar] [CrossRef]
- Graczyk, J.; Gajewski, T.; Garbowski, T. Shear Correction Factor for Porous Eco-Materials: Mechanical Characterization of a Heterogeneous Medium. Preprints 2026, 2026011251. [Google Scholar] [CrossRef]
- Graczyk, J.; Gajewski, T.; Garbowski, T. Numerical Determination of the Shear Correction Factor for Thin-Walled Steel Sections Using Shell-Based Finite Element Modeling. SSRN 2026. [Google Scholar] [CrossRef]
- Szymczak-Graczyk, A.; Guri, Z.; Canaj, I.; Garbowski, T. Generalized Shear Correction Factor for Non-Homogeneous Beam Cross-Sections with an Embedded Steel Core. Preprints 2026, xxx. [Google Scholar] [CrossRef]
- Loja, M.A.R.; Barbosa, J.I. Exponentially Graded Auxetic Structures: An Assessment of the Shear Correction Factor and Static Deflection. Appl. Sci. 2024, 14, 9356. [Google Scholar] [CrossRef]
- Mota, A.F.; Loja, M.A.R.; Barbosa, J.I.; Rodrigues, J.A. Porous Functionally Graded Plates: An Assessment of the Influence of Shear Correction Factor on Static Behavior. Math. Comput. Appl. 2020, 25, 25. [Google Scholar] [CrossRef]
- Staszak, N.; Szymczak-Graczyk, A.; Garbowski, T. Elastic Analysis of Three-Layer Concrete Slab Based on Numerical Homogenization with an Analytical Shear Correction Factor. Appl. Sci. 2022, 12, 9918. [Google Scholar] [CrossRef]
Figure 1.
Pixel-based geometry examples generated for the sensitivity study: (a) 3-ply reference geometry and (b) 5-ply example with two distinct flutings. Liners are shown in gray (0.5), fluting(s) in black (0), and background in white (1).
Figure 1.
Pixel-based geometry examples generated for the sensitivity study: (a) 3-ply reference geometry and (b) 5-ply example with two distinct flutings. Liners are shown in gray (0.5), fluting(s) in black (0), and background in white (1).
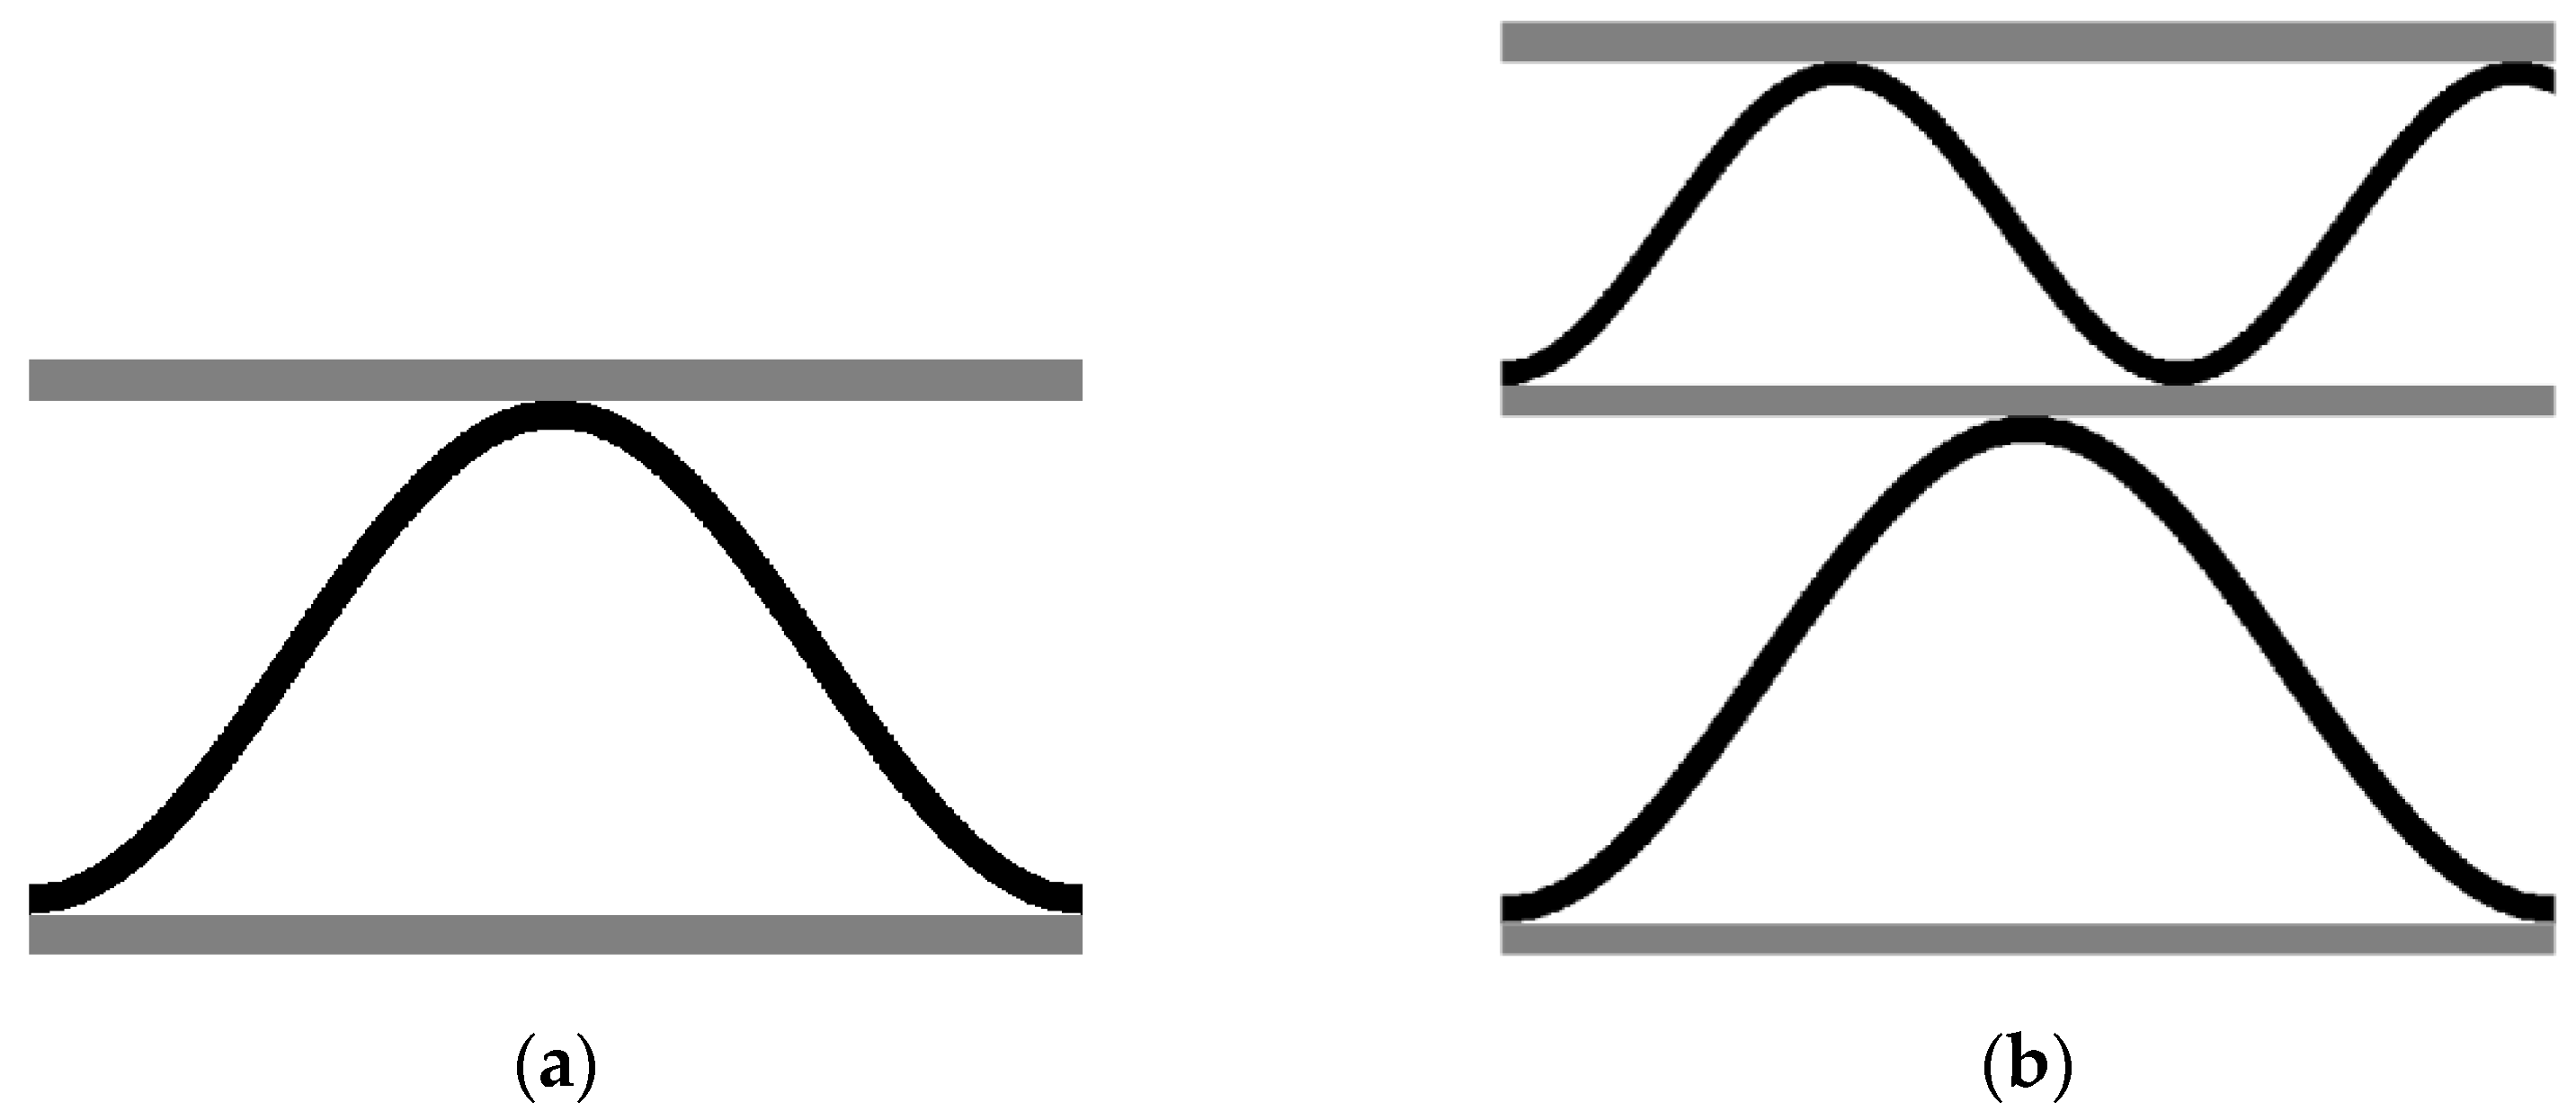
Figure 2.
Distribution of obtained from LHS: 3-ply and 5-ply. The histogram/violin representation highlights the spread, skewness, and presence of tails corresponding to extreme geometries or stiffness contrasts.
Figure 2.
Distribution of obtained from LHS: 3-ply and 5-ply. The histogram/violin representation highlights the spread, skewness, and presence of tails corresponding to extreme geometries or stiffness contrasts.
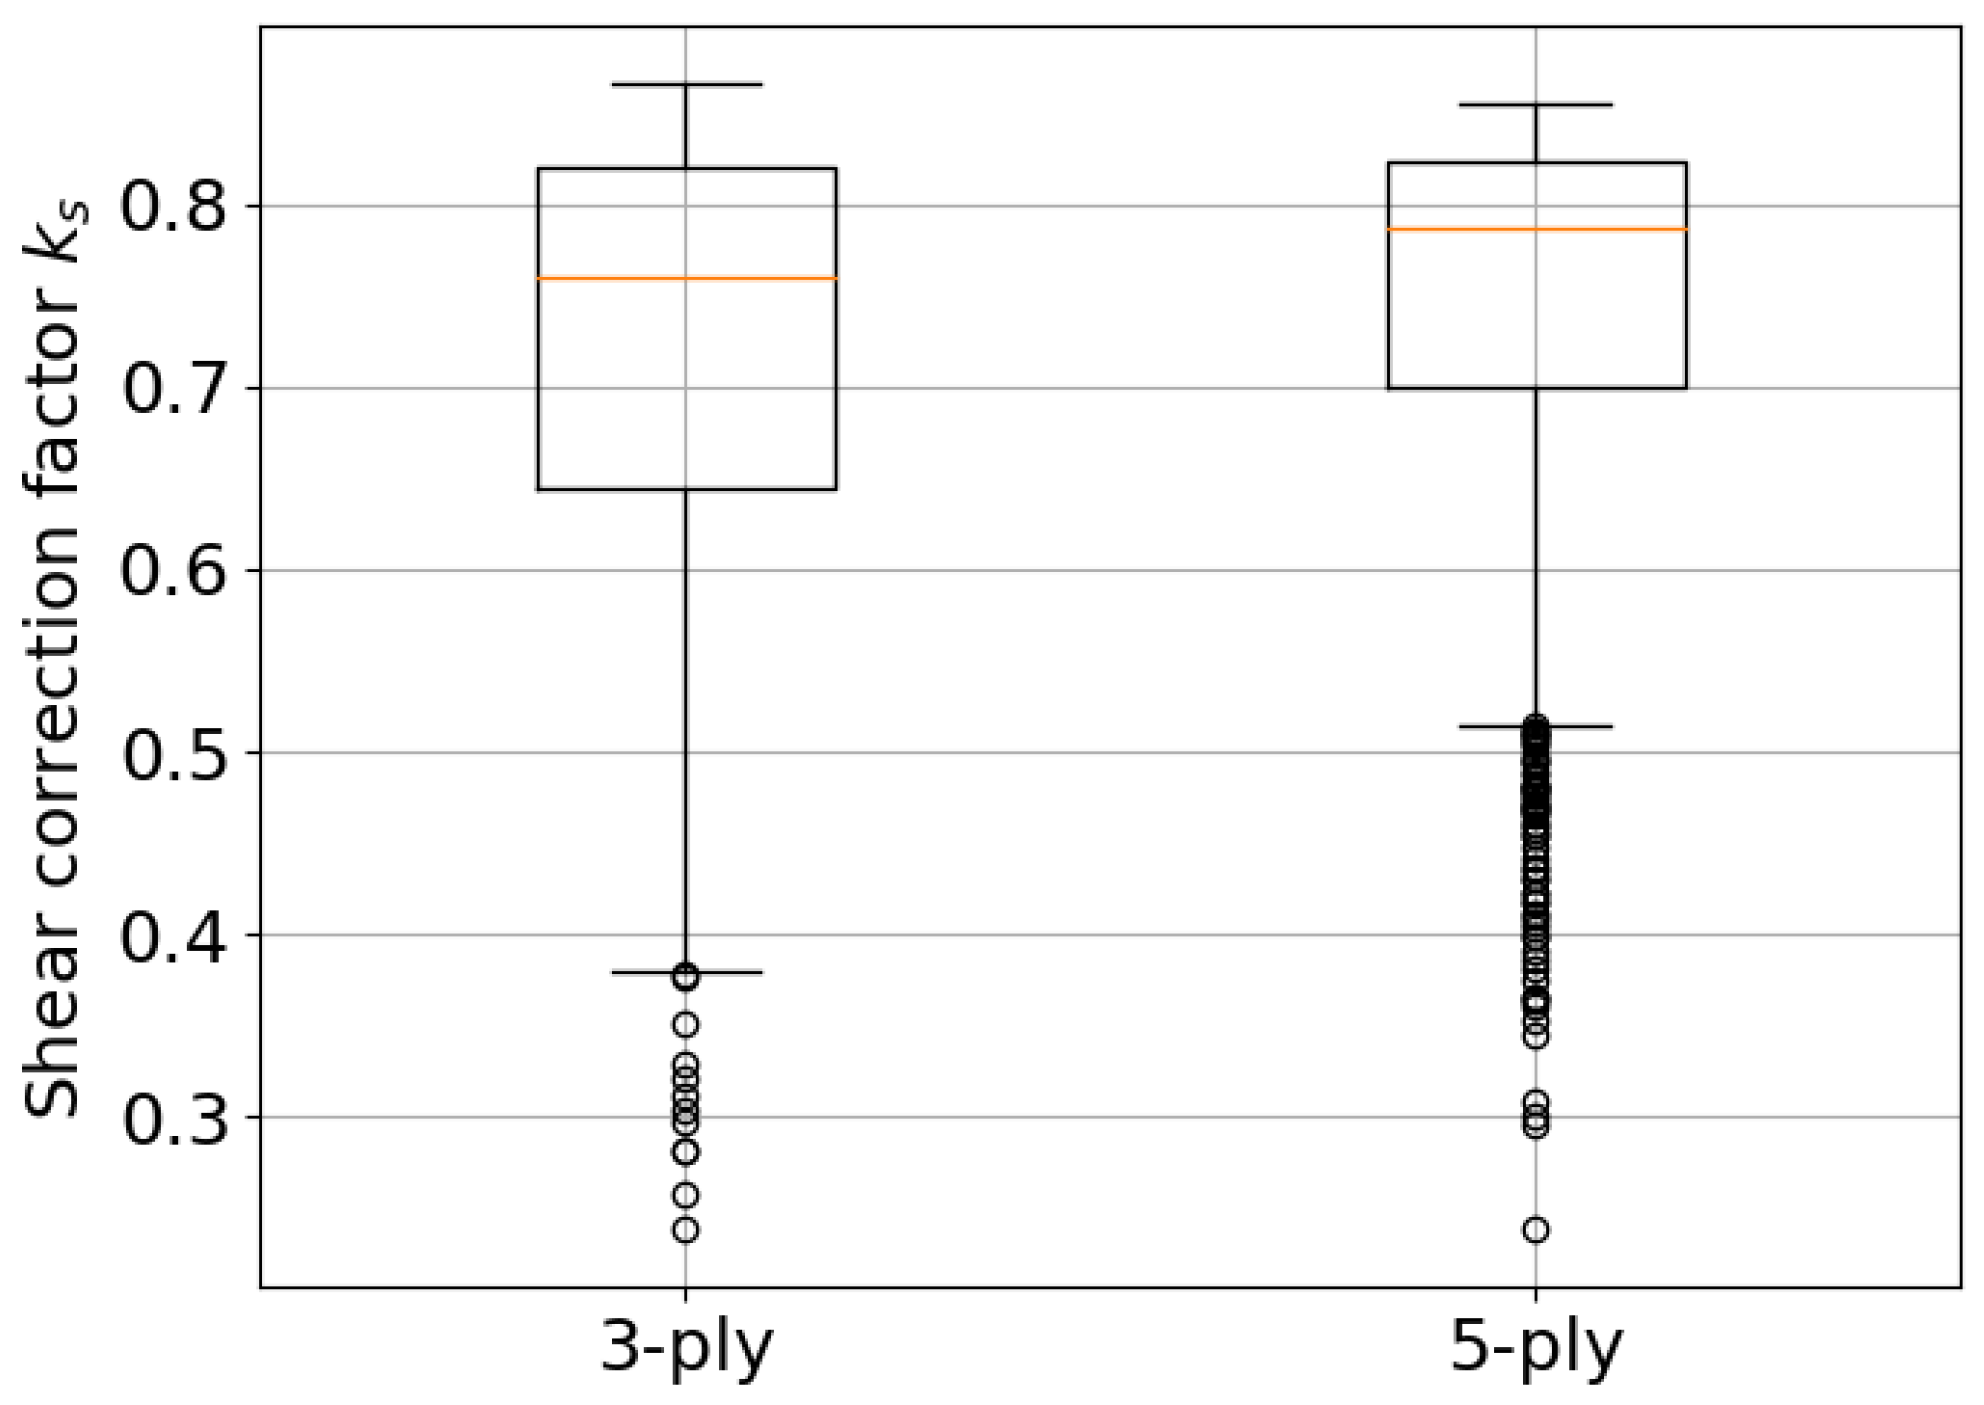
Figure 3.
Tornado plots of normalized sensitivities (log-elasticities) ranked by absolute magnitude: (a) 3-ply and (b) 5-ply. This figure provides an immediate ranking of the dominant drivers of across the global parameter space.
Figure 3.
Tornado plots of normalized sensitivities (log-elasticities) ranked by absolute magnitude: (a) 3-ply and (b) 5-ply. This figure provides an immediate ranking of the dominant drivers of across the global parameter space.
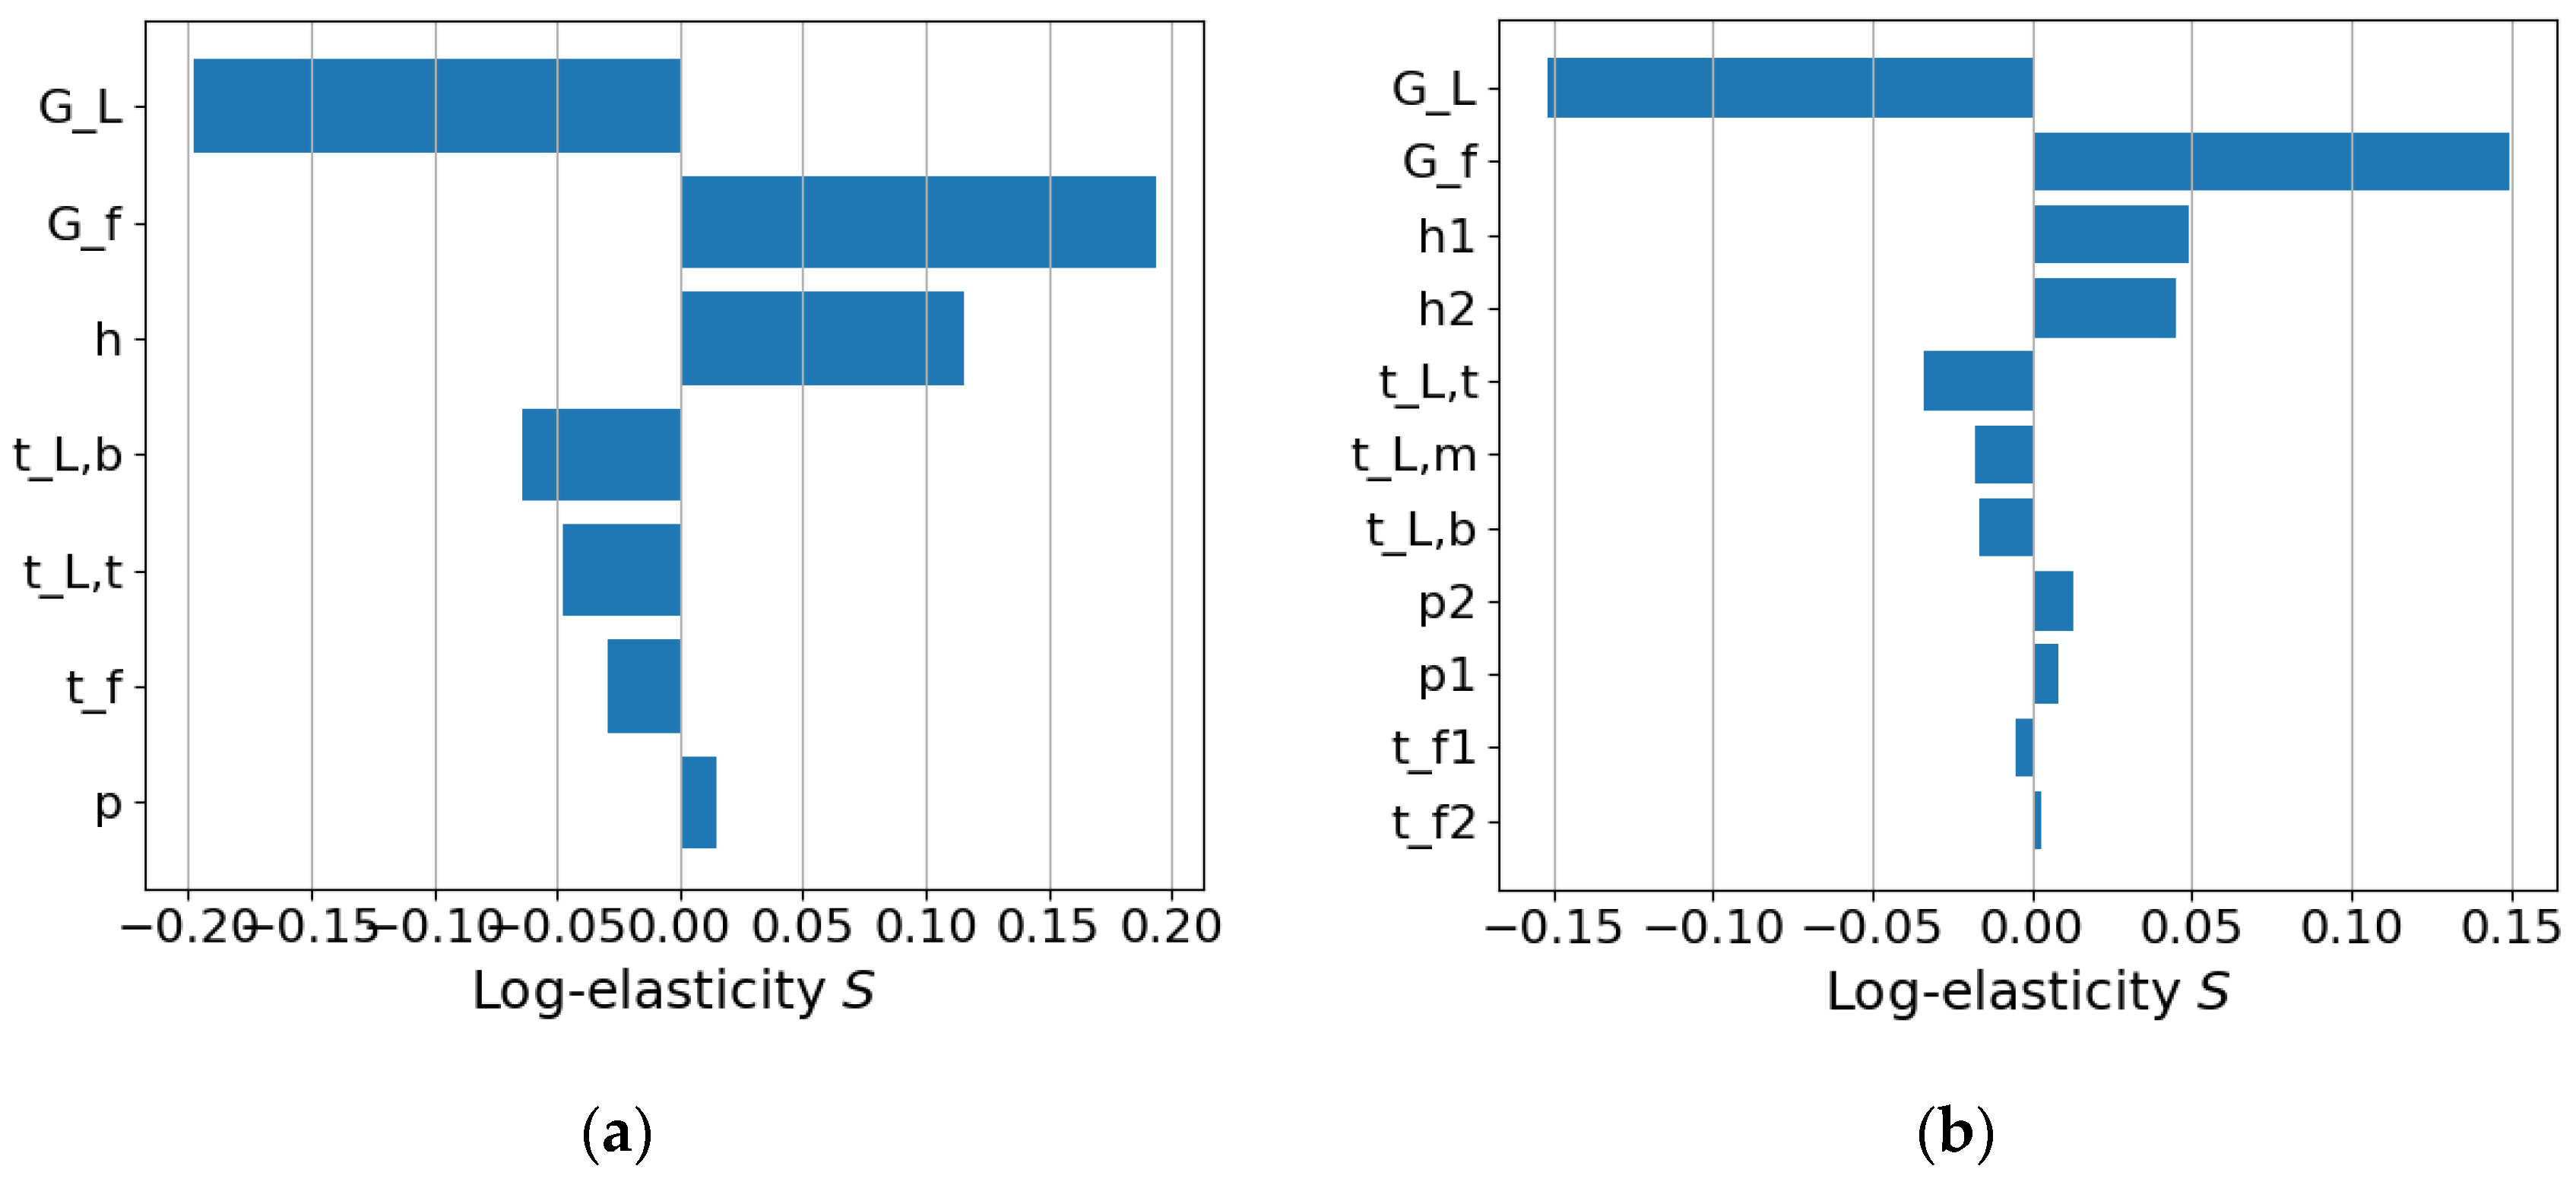
Figure 4.
2D response surface for 3-ply: at median values of . Contours indicate regions of high and low .
Figure 4.
2D response surface for 3-ply: at median values of . Contours indicate regions of high and low .
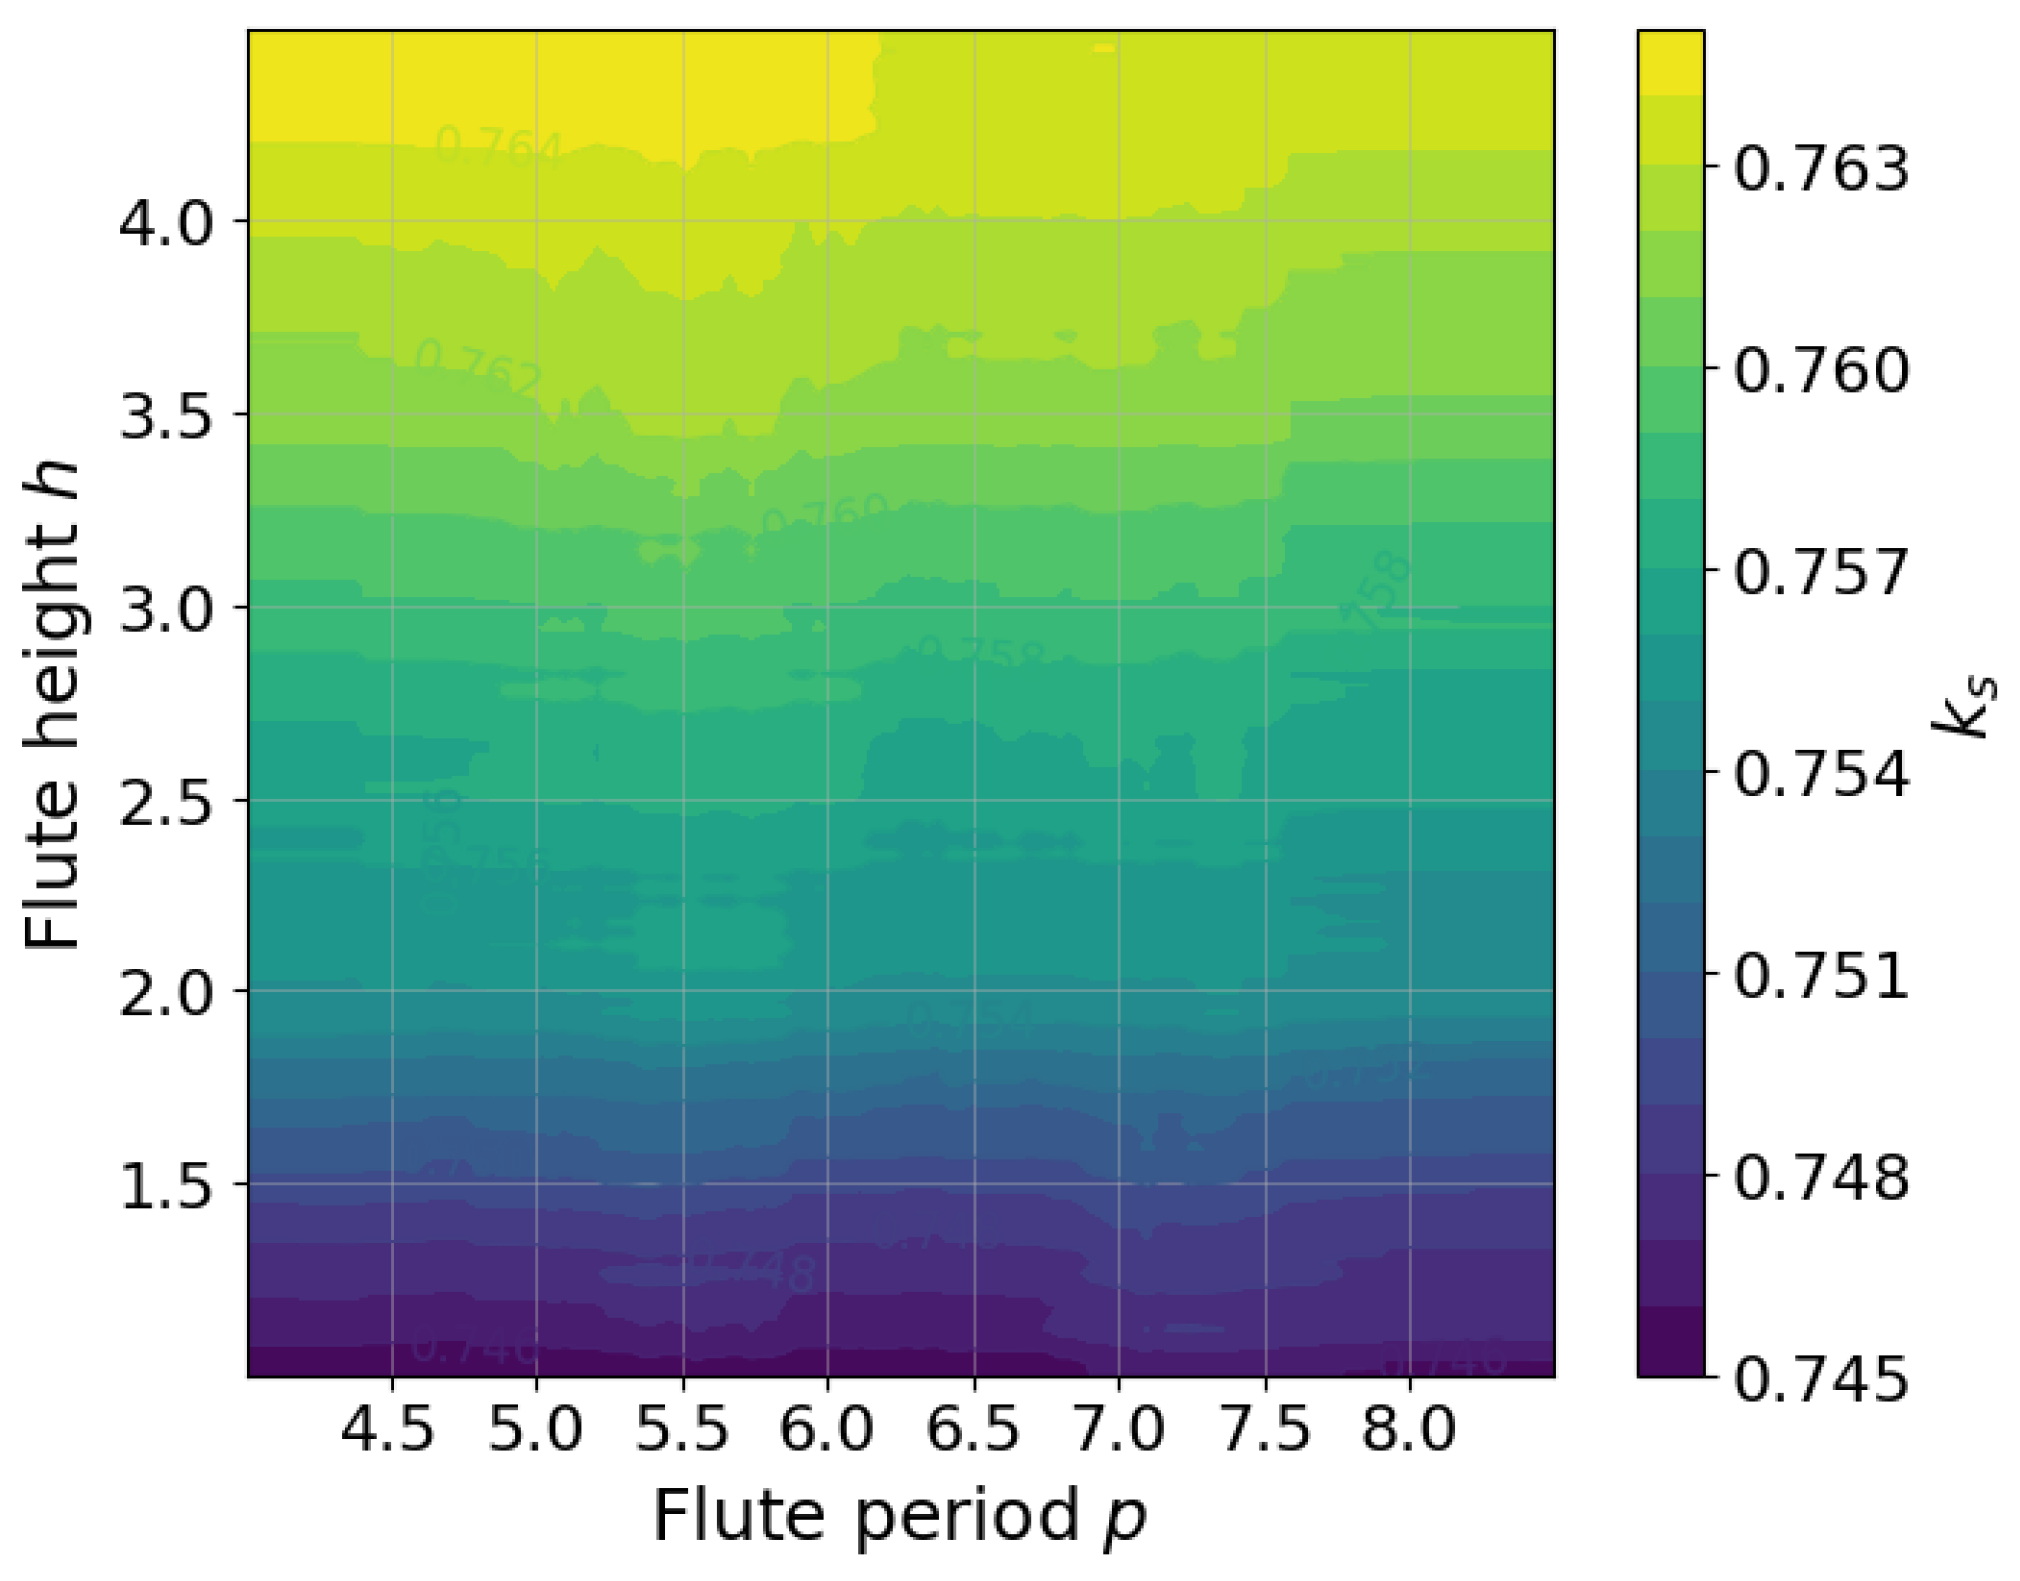
Figure 5.
2D response surfaces for 5-ply: (a) with the second flute fixed at median parameters; (b) with the first flute fixed. These maps highlight how each flute family contributes to the global shear correction behavior.
Figure 5.
2D response surfaces for 5-ply: (a) with the second flute fixed at median parameters; (b) with the first flute fixed. These maps highlight how each flute family contributes to the global shear correction behavior.
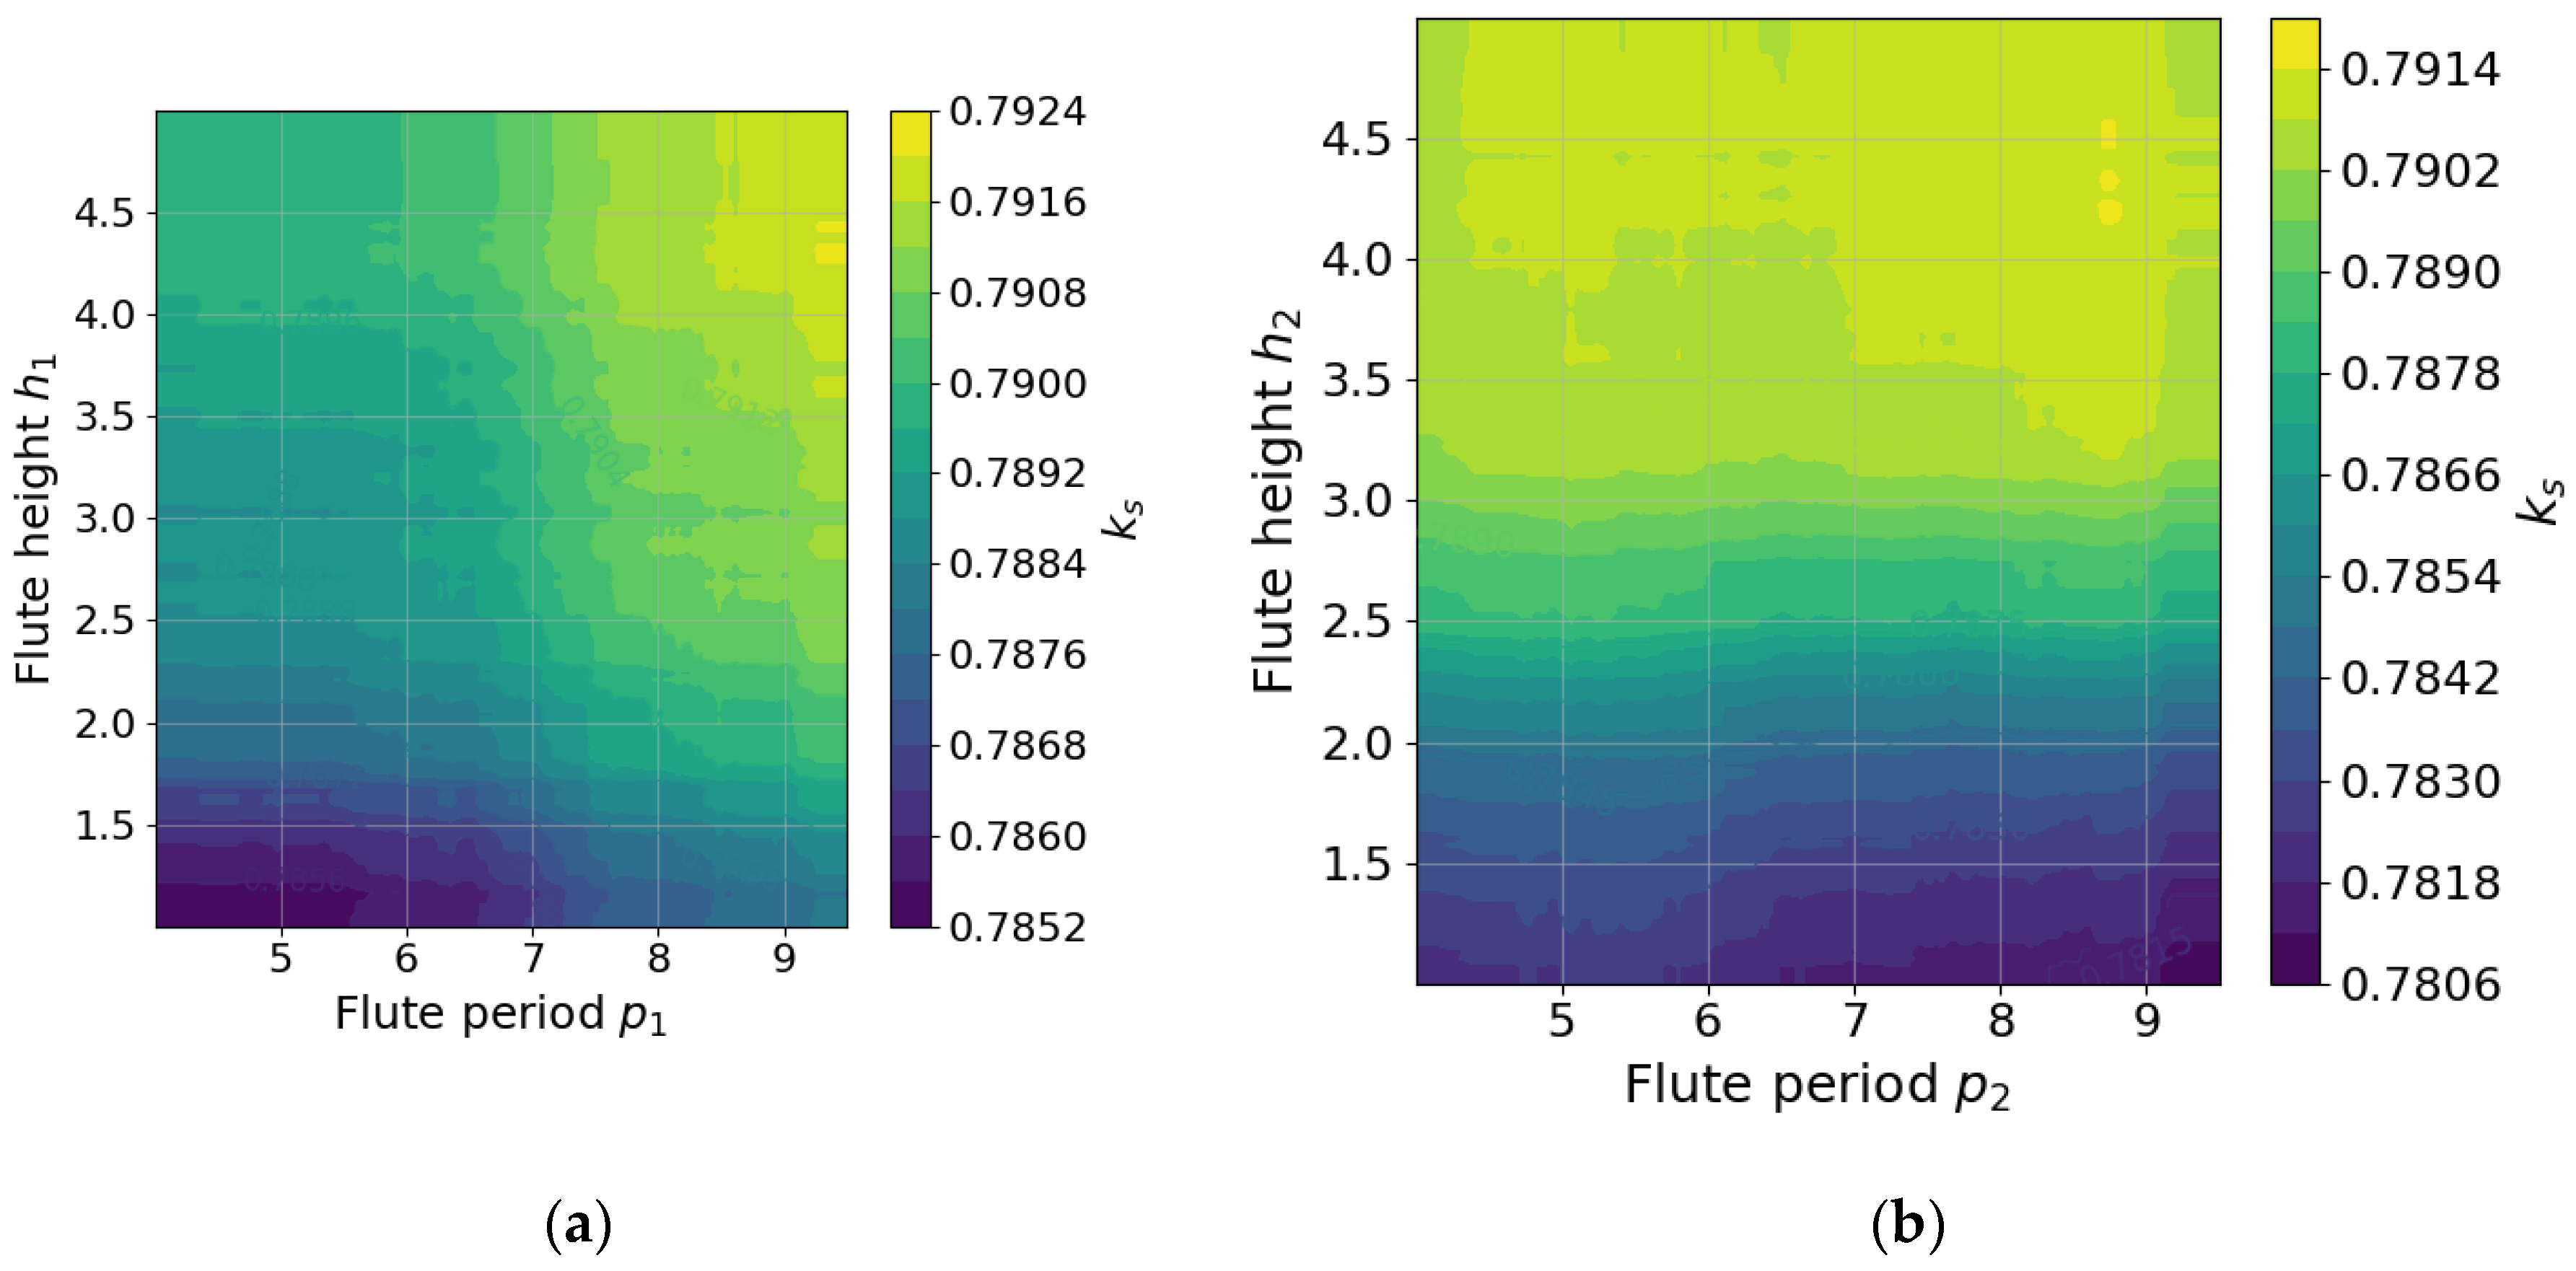
Figure 6.
Effect of shear-modulus contrast: scatter of versus (3-ply) and versus (5-ply), with points colored by a dominant geometric variable (e.g., flute height). The plot reveals coupling between stiffness contrast and geometry.
Figure 6.
Effect of shear-modulus contrast: scatter of versus (3-ply) and versus (5-ply), with points colored by a dominant geometric variable (e.g., flute height). The plot reveals coupling between stiffness contrast and geometry.
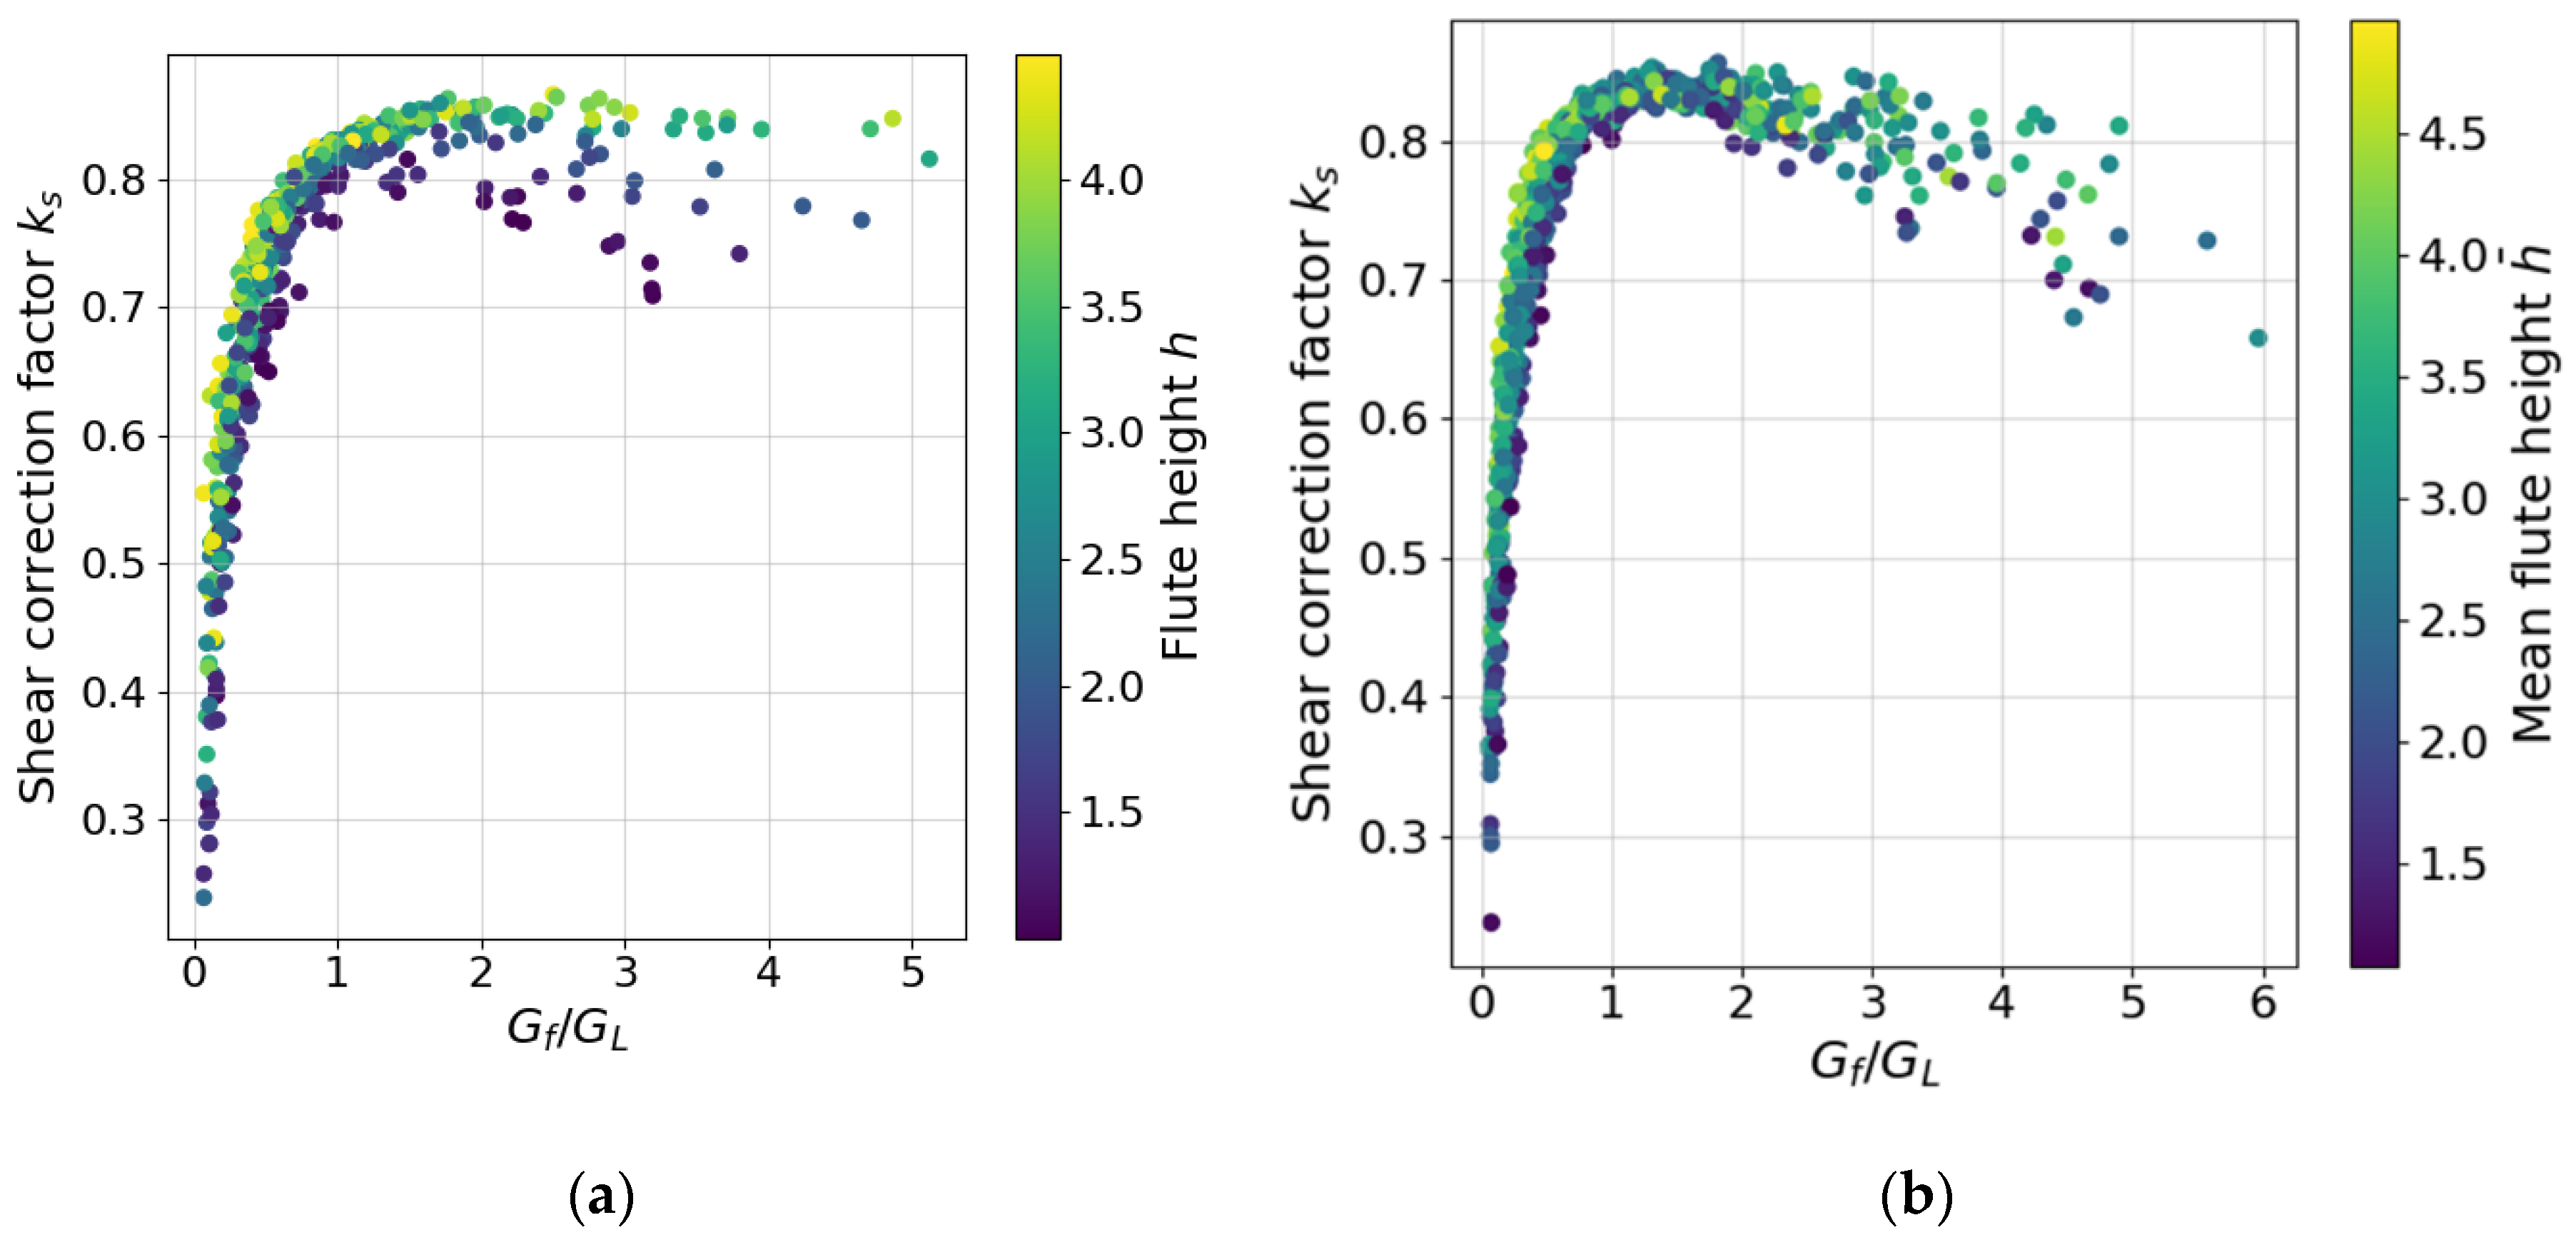
Figure 7.
Interaction plot: versus flute height for several bins of for (a) 3-ply and (b) analogous binned plots for 5-ply. The figure illustrates whether stiffness contrast amplifies or suppresses the geometric influence.
Figure 7.
Interaction plot: versus flute height for several bins of for (a) 3-ply and (b) analogous binned plots for 5-ply. The figure illustrates whether stiffness contrast amplifies or suppresses the geometric influence.
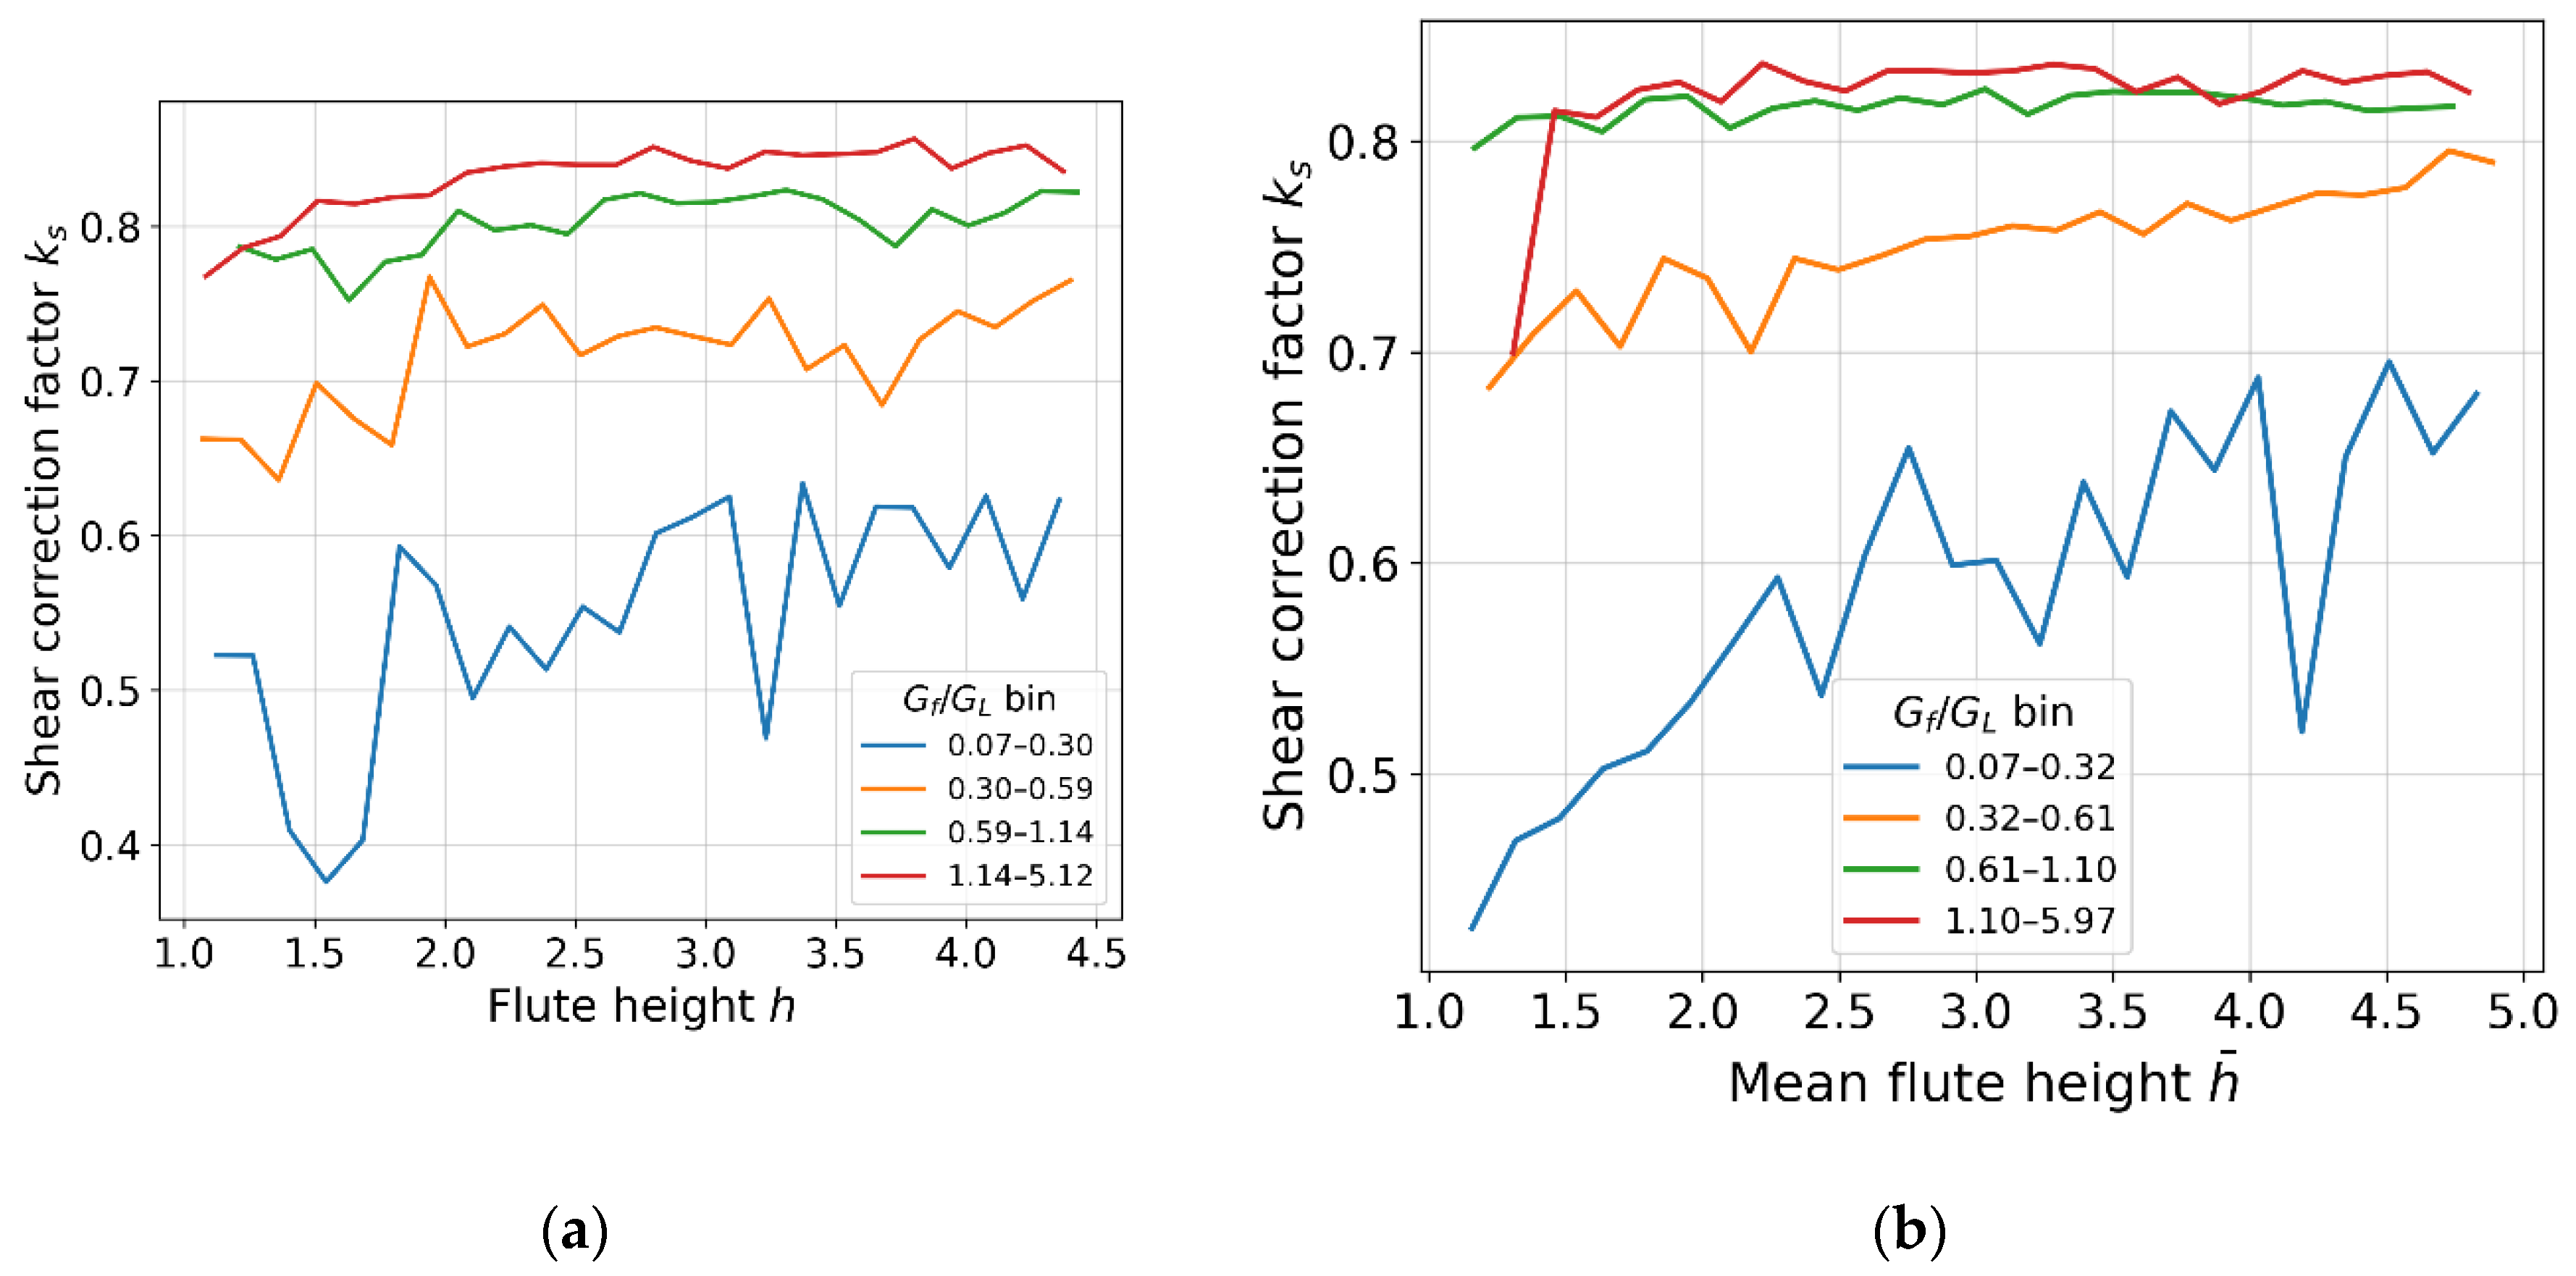
Figure 8.
Side-by-side comparison of normalized sensitivities (log-elasticities) for 3-ply and 5-ply. Shared dominant drivers are highlighted, and configuration-specific drivers are identified.
Figure 8.
Side-by-side comparison of normalized sensitivities (log-elasticities) for 3-ply and 5-ply. Shared dominant drivers are highlighted, and configuration-specific drivers are identified.
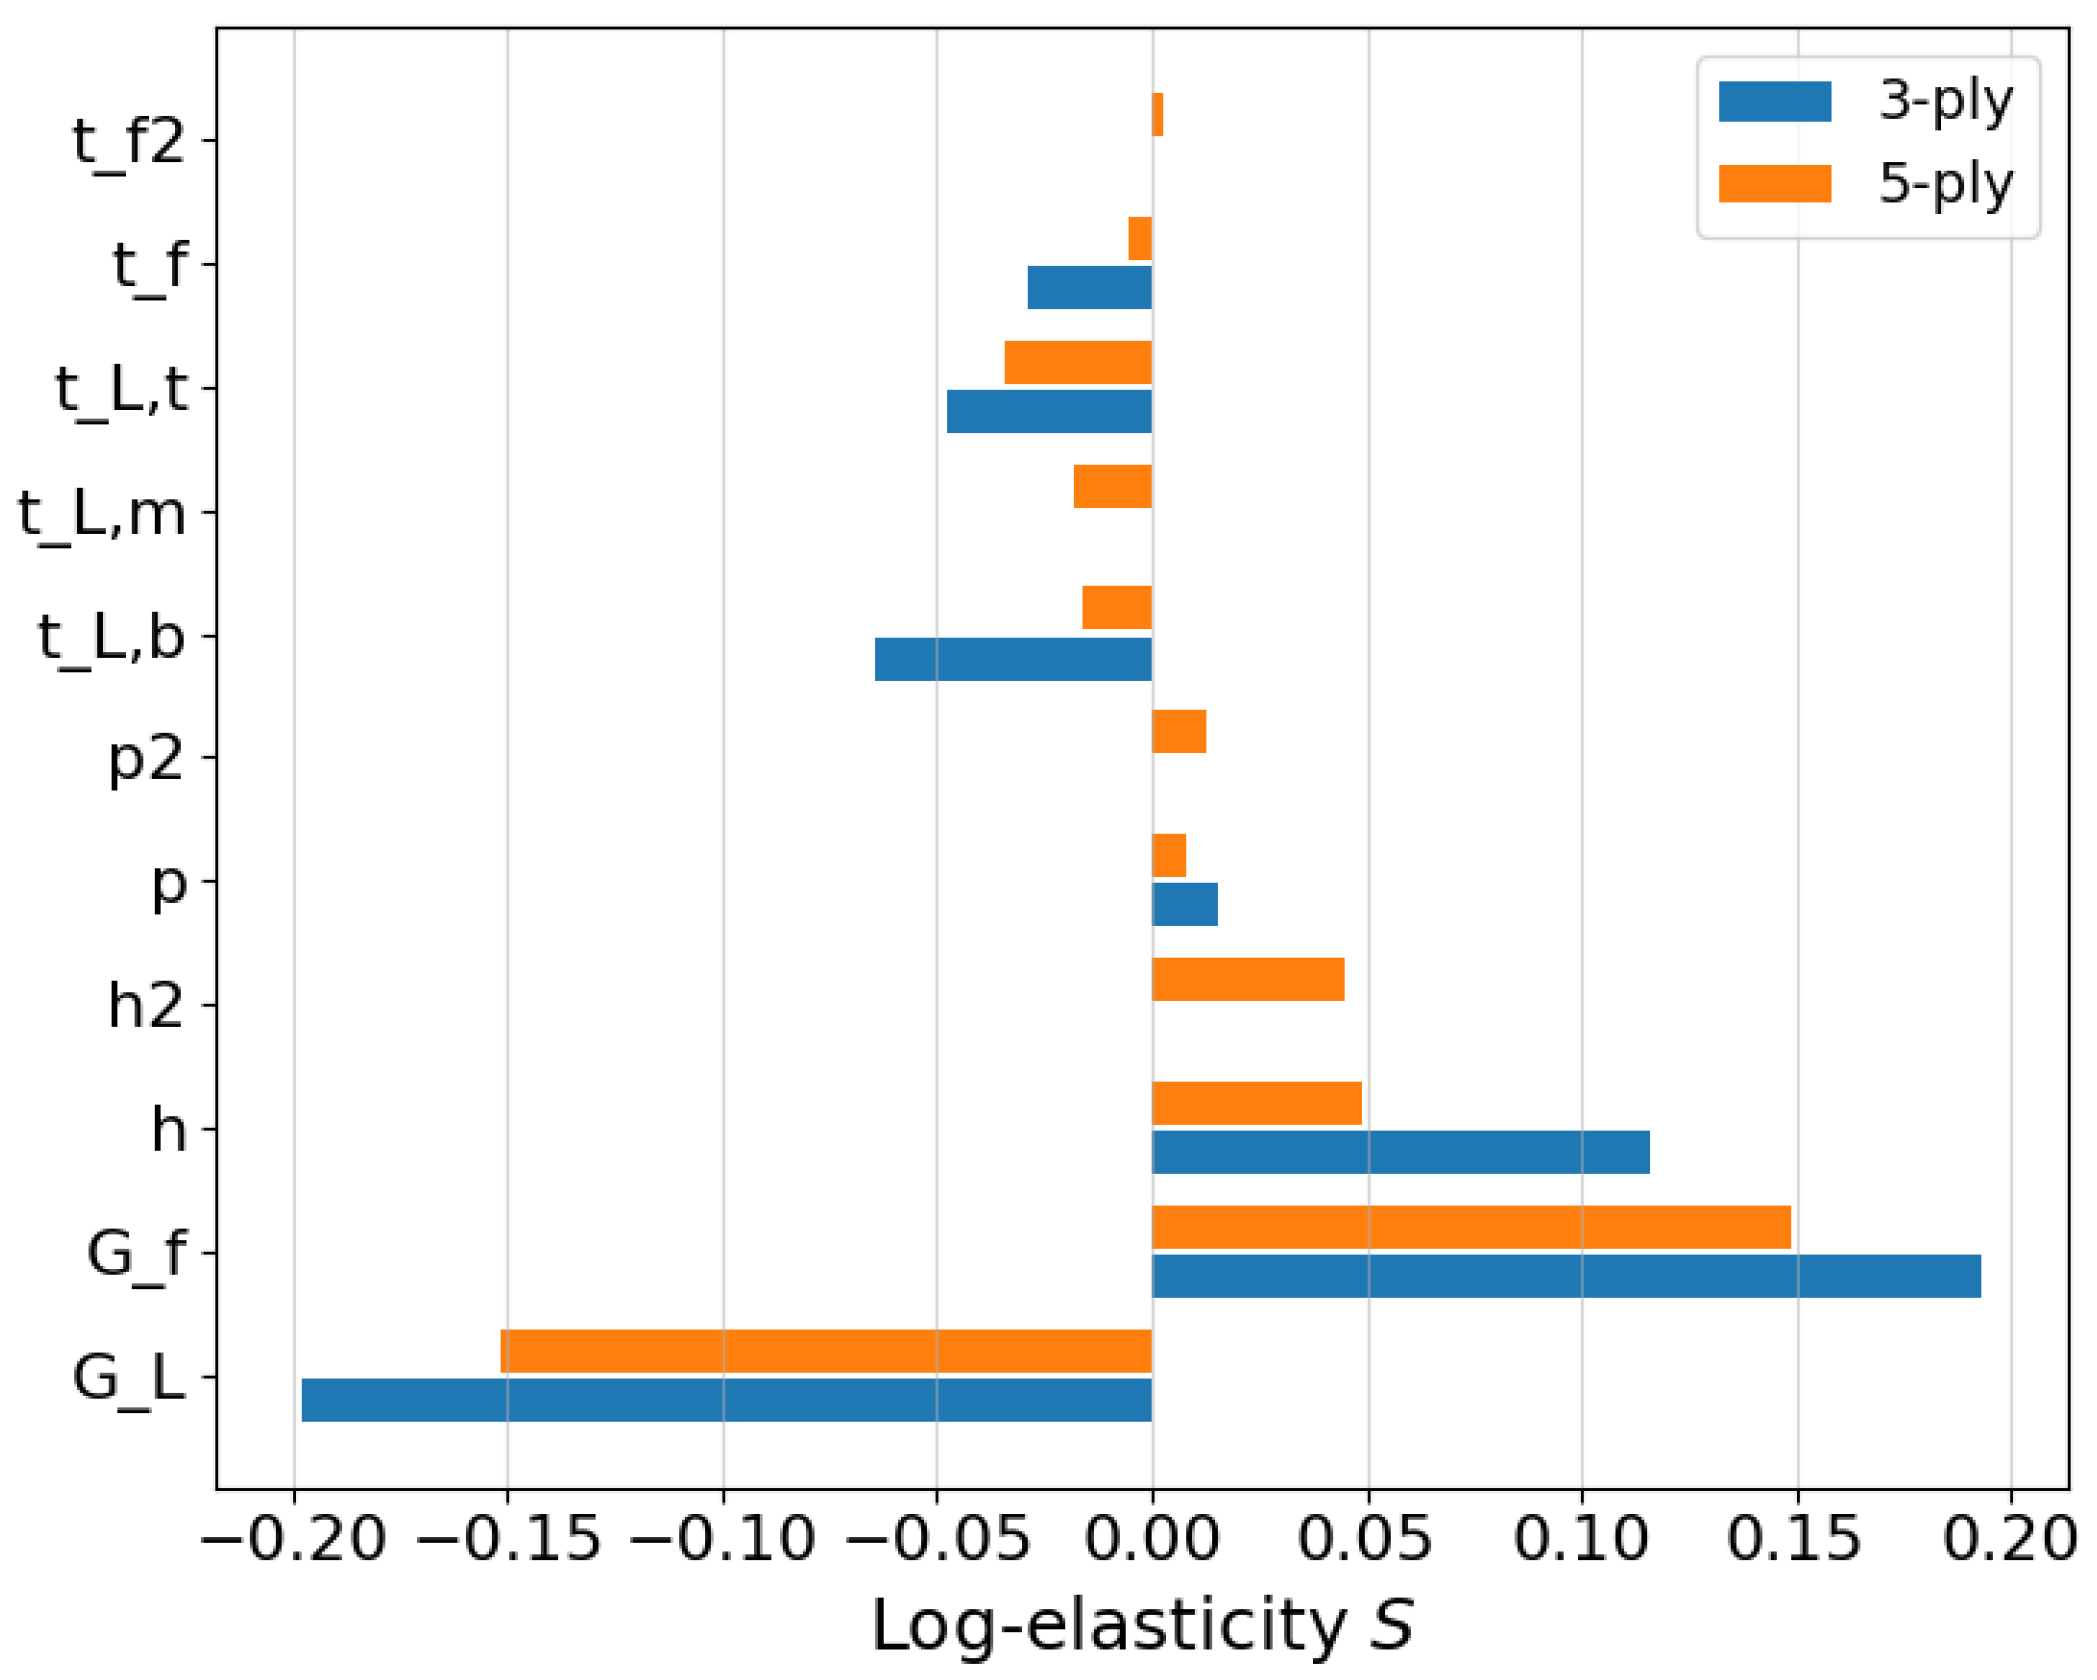

Table 1.
Parameter ranges used in the LHS sensitivity study for 3-ply and 5-ply corrugated board. All moduli are sampled log-uniformly; geometric parameters are sampled uniformly. The minimum thickness constraint pix is enforced.
Table 1.
Parameter ranges used in the LHS sensitivity study for 3-ply and 5-ply corrugated board. All moduli are sampled log-uniformly; geometric parameters are sampled uniformly. The minimum thickness constraint pix is enforced.
| Parameter | 3-ply | 5-ply | ||
|---|---|---|---|---|
| Min | Max | Min | Max | |
| [mm] | 4.000258 | 8.499252 | 4.002924 | 9.494775 |
| [mm] | 1.001079 | 4.497692 | 1.001209 | 4.998968 |
| [mm] | 0.100412 | 0.349547 | 0.100012 | 0.349896 |
| [mm] | - | - | 4.001369 | 9.498377 |
| [mm] | - | - | 1.000964 | 4.997345 |
| [mm] | - | - | 0.100056 | 0.349870 |
| [mm] | 0.100053 | 0.399727 | 0.100234 | 0.399820 |
| [mm] | - | - | 0.100245 | 0.399957 |
| [mm] | 0.100311 | 0.399791 | 0.100196 | 0.399823 |
| [MPa] | 0.150515 | 1.493291 | 0.150255 | 1.496948 |
| [MPa] | 0.250567 | 2.498199 | 0.250230 | 2.499512 |
Table 2.
Resolution robustness check: summary statistics of (in %) when refining pixel size for a subset of randomly selected samples. Reported are median, 90th percentile, and maximum relative changes.
Table 2.
Resolution robustness check: summary statistics of (in %) when refining pixel size for a subset of randomly selected samples. Reported are median, 90th percentile, and maximum relative changes.
| Dataset | Median [%] | 90th percentile [%] | Max [%] |
|---|---|---|---|
| 3-ply | 0.165672 | 1.853076 | 7.497941 |
| 5-ply | 0.023637 | 1.082396 | 7.299894 |
Table 3.
Summary statistics of : mean, standard deviation, median, interquartile range (IQR), and selected quantiles (5%, 50%, 95%) for 3-ply and 5-ply datasets.
Table 3.
Summary statistics of : mean, standard deviation, median, interquartile range (IQR), and selected quantiles (5%, 50%, 95%) for 3-ply and 5-ply datasets.
| Dataset | mean | std | median | IQR | q5 | q50 | q95 |
|---|---|---|---|---|---|---|---|
| 3-ply | 0.718413 | 0.128947 | 0.760203 | 0.176524 | 0.466396 | 0.760203 | 0.849355 |
| 5-ply | 0.741803 | 0.112452 | 0.787480 | 0.123227 | 0.482342 | 0.787480 | 0.838569 |
Table 4.
Normalized global sensitivity indices for 3-ply: log-elasticities and PRCC for each input parameter. Positive values indicate an increase of with increasing parameter, negative values indicate a decrease.
Table 4.
Normalized global sensitivity indices for 3-ply: log-elasticities and PRCC for each input parameter. Positive values indicate an increase of with increasing parameter, negative values indicate a decrease.
| Parameter | Log-elasticity | PRCC |
|---|---|---|
| 0.015330 | 0.074295 | |
| 0.115772 | 0.530662 | |
| -0.029048 | -0.171102 | |
| -0.047826 | -0.142491 | |
| -0.064391 | -0.195491 | |
| 0.023640 | 0.093608 | |
| -0.010947 | -0.056239 |
Table 5.
Normalized global sensitivity indices for 5-ply: log-elasticities and PRCC for each input parameter.
Table 5.
Normalized global sensitivity indices for 5-ply: log-elasticities and PRCC for each input parameter.
| Parameter | Log-elasticity | PRCC |
| 0.008090 | 0.019066 | |
| 0.049138 | 0.157244 | |
| -0.005123 | 0.063589 | |
| 0.012620 | 0.003505 | |
| 0.044675 | 0.144208 | |
| -0.009513 | 0.061353 | |
| -0.018829 | -0.080112 | |
| -0.031460 | -0.125244 | |
| -0.021187 | -0.091543 | |
| 0.019820 | 0.072902 | |
| -0.006341 | -0.031775 |
Disclaimer/Publisher’s Note: The statements, opinions and data contained in all publications are solely those of the individual author(s) and contributor(s) and not of MDPI and/or the editor(s). MDPI and/or the editor(s) disclaim responsibility for any injury to people or property resulting from any ideas, methods, instructions or products referred to in the content. |
© 2026 by the authors. Licensee MDPI, Basel, Switzerland. This article is an open access article distributed under the terms and conditions of the Creative Commons Attribution (CC BY) license (http://creativecommons.org/licenses/by/4.0/).
Copyright: This open access article is published under a Creative Commons CC BY 4.0 license, which permit the free download, distribution, and reuse, provided that the author and preprint are cited in any reuse.


