Submitted:
03 February 2026
Posted:
04 February 2026
You are already at the latest version
Abstract
This study systematically investigates the influence of annealing time on the microstructure and mechanical properties of a (CoCrNi)₉₃.₅Al₃Ti₃C₀.₅ medium-entropy alloy. Following hot rolling, the alloy was subjected to annealing treatments at 900°C for 10 min (HA900-10) and 60 min (HA900-60). Microstructural characterization revealed that both alloys contained three types of precipitates: intergranular M₂₃C₆ and MC-type carbides, as well as γ′ phase. The HA900-10 specimen exhibited a low degree of recrystallization, whereas prolonged annealing promoted partial recrystallization, leading to the formation of a slightly heterogeneous structure (HA900-60). Additionally, the extended annealing facilitated the intragranular precipitation of nanoscale γ′ phase. Room-temperature tensile tests demonstrated the HA900-10 and HA900-60 specimens achieving yield strengths of 1276 MPa and 1202 MPa, with total elongations reaching 26% and 28%, respectively. Quantitative strengthening analysis indicated that the strength of HA900-10 primarily originated from dislocation and grain boundary strengthening. For HA900-60, an additional significant contribution arose from the dislocation shearing mechanism induced by the intragranular γ′ precipitates. Analysis of the deformation mechanisms revealed that planar slip, assisted by the formation of stacking faults, dominated the room-temperature deformation, thereby ensuring sustained work-hardening capacity. This research provides a theoretical foundation for tailoring the microstructure and properties of multi-phase medium-entropy alloys through annealing process control.
Keywords:
medium-entropy alloy
; annealing time
; strengthening mechanism
; deformation mechanism
1. Introduction
The pursuit of advanced metallic materials with superior mechanical properties represents a fundamental and ongoing objective in materials science, fueled by the stringent requirements of modern engineering [1,2,3]. In this endeavor, high- and medium-entropy alloys (H/MEAs), or multi-principal element alloys, have introduced a transformative alloy design strategy that departs from conventional single-principal-element frameworks [4,5,6]. These alloys are distinguished by their high configurational entropy and the incorporation of multiple principal elements, which often stabilize simple solid-solution phases like face-centered cubic (FCC) structures and can lead to an exceptional blend of fracture toughness, corrosion resistance, and thermal stability [7,8].
Within this class of materials, the equiatomic CoCrNi MEA has been extensively studied as a model system due to its remarkable combination of damage tolerance and ductility [9,10]. This performance stems from a hierarchical deformation response, where mechanisms such as dislocation glide and nano-twinning are sequentially activated with increasing strain [11]. A persistent limitation, however, is its relatively moderate yield strength, typically around 300-500 MPa in the annealed state, restricting its use in structural applications [12]. Enhancing the yield strength of the CoCrNi system without severe compromise to its ductility therefore remains a critical goal.
The introduction of nano-scale precipitates offers a potent pathway to strength enhancement. Alloying the CoCrNi matrix with elements like Al and Ti can promote the formation of L1₂-ordered γ′ precipitates, which effectively strengthen the alloy by interacting with dislocations [13,14,15]. Concurrently, the addition of interstitial carbon (C) contributes to solid solution strengthening and can facilitate the precipitation of various carbides, providing an additional strengthening mechanism. The interplay between the precipitation and recrystallization behavior during thermomechanical processing renders the final microstructure and properties [16]. This is highly sensitive to heat treatment parameters. Specifically, annealing time is a pivotal variable that directly governs dislocation recovery, recrystallization fraction, grain size, and the morphology, size, and distribution of precipitates, thereby dictating the ultimate strength-ductility balance [17,18].
Recent research has often focused on employing complex multi-step heat treatments to engineer microstructures for property enhancement [19,20]. In contrast, we systematically investigated the influence of the annealing time on the microstructural evolution and mechanical properties of the CoCrNi-base alloy. Such a time-centric study minimizes confounding factors, providing more direct insight into the competition and synergy between recrystallization and precipitation kinetics [21]. This approach can yield fundamental guidance for tailoring the microstructure of such multi-component alloys.
Motivated by this rationale, the present study investigates a (CoCrNi)₉₃.₅Al₃Ti₃C₀.5 (at.%) alloy subjected to hot-rolling followed by annealing at 900 °C for two different durations: a short period (10 min) and a medium period (60 min). We systematically compare the microstructural features—including recrystallization completeness, grain structure, and the precipitation behavior between the two conditions. The correlation between these microstructural differences and the resulting room-temperature tensile properties is established. Furthermore, the dominant strengthening mechanisms are quantitatively assessed, and the underlying deformation mechanisms are elucidated through detailed post-mortem microscopy. This work aims to provide theoretical and practical insights for optimizing the performance of such multi-phase MEAs through precise control of annealing treatment.
2. Experimental Methodology
A medium-entropy alloy with a nominal composition of (CoCrNi)₉₃.₅Al₃Ti₃C₀.₅ (at.%) was produced in this study. High-purity constituent elements (>99.9%) were melted under a protective atmosphere using a vacuum induction furnace. The molten alloy was drop-cast and subsequently cooled within the furnace chamber. The resulting ingot underwent a homogenization treatment at 1200 °C for 4 hours, followed by hot rolling at 1100 °C to achieve a thickness reduction of approximately 95%. The rolled sheets were then subjected to isothermal annealing at 900 °C for durations of 10 min and 60 min, respectively. All thermomechanical processes were carried out in air and terminated by water quenching. The annealed conditions are hereafter designated as HA900-10 and HA900-60 for brevity.
Quasi-static uniaxial tensile tests were conducted at both ambient temperature (298 K) using an AG-X PLUS universal testing machine. Dog-bone-shaped specimens with a gauge section of 25 mm in length and 6 × 3 mm² in cross-sectional area were machined. The gauge surfaces were ground with SiC paper prior to testing. A minimum of three tests were performed for each condition to ensure reliability. Tensile loading was applied parallel to the rolling direction at a constant strain rate of 1 × 10⁻³ s⁻¹.
Phase identification was performed via X-ray diffraction (XRD) using a SmartLab-3 KW diffractometer with Cu Kα radiation. Scans were acquired over a 2θ range from 30° to 80° with a step size of 0.02°. Microstructural characterization was carried out using a SIGMA500 field-emission scanning electron microscope (SEM) equipped with an Oxford Nordlys Max3 detector for electron backscatter diffraction (EBSD) analysis. Further examination was performed with a Tecnai G2 F30 S-TWIN transmission electron microscope (TEM) fitted with an energy-dispersive X-ray spectroscopy system (EDS). EBSD maps were acquired with a step size of 0.05 µm on samples sectioned parallel to the rolling direction. Specimens for SEM and EBSD were prepared by electro-phishing in a solution of 90% ethanol and 10% perchloric acid (by volume) at 15 V and 273 K. TEM foils were prepared by mechanically thinning to approximately 50 µm, punching 3 mm discs, and final thinning via ion milling at room temperature.
3. Results and Discussion
3.1. Microstructural Evolution
Figure 1a presents the XRD patterns of the HA900-10 and HA900-60 specimens. Both of them exhibit characteristic peaks of a face-centered cubic (FCC) structure, confirming the γ matrix after annealing. Notably, all matrix diffraction peaks for the HA900-60 specimen display pronounced asymmetry. This typically indicates the presence of a secondary phase with a crystal structure similar to the matrix [88]. Peak deconvolution of the (200) diffraction peak for HA900-60 (Figure 1b) successfully identifies both the γ matrix and the γ′ precipitate phase. The calculated lattice parameters for the γ and γ′ phases are 0.3581 nm and 0.3575 nm, respectively. In contrast, no peak asymmetry is observed for the HA900-10 specimen, suggesting that the γ′ phase did not precipitate or its content was below the detection limit of XRD after the short-time annealing. Furthermore, no characteristic peaks corresponding to other precipitated phases are detected, likely due to their low volume fractions, necessitating more sensitive characterization techniques for confirmation.
The grain structures were further investigated using EBSD. As shown in the inverse pole figure map (IPF, Figure 2a1), the HA900-10 specimen consists of relatively fine grains with a uniform size distribution. A strong <111> and <001> texture is evident, inherited from the prior hot-rolling deformation. The corresponding kernel average misorientation (KAM) map (Figure 2a2) and grain boundary map (Figure 2a3) reveal a high density of geometrically necessary dislocations (GNDs) and a significant fraction of low-angle grain boundaries (LAGBs), respectively, within the grains. This typically indicates a low degree of recrystallization. Upon extending the annealing time to 60 min (HA900-60 specimen), the preferential texture is essentially eliminated, giving way to a random grain orientation (Figure 2b1). The microstructure evolves into a blend of partially coarsened grains and refined grains, demonstrating a certain level of heterogeneity. The KAM map (Figure 2b2) and grain boundary map (Figure 2b3) show a slightly lower density of GNDs and LAGBs in the HA900-60 specimen compared to HA900-10. Statistical analysis of grain size distributions (Figure 3a and b) yields average grain sizes of 4.03 ± 1.1 μm and 4.39 ± 1.2 μm for the HA900-10 and HA900-60 specimens, respectively.
Microstructural morphology was examined using backscattered electron (BSE) imaging. Figure 4a shows that the grains in the HA900-10 specimen contain abundant deformation structures that are not fully recovered, consistent with the low recrystallization degree indicated by EBSD. In contrast, some grains in the HA900-60 specimen (Figure 4b) exhibit a "clean" appearance free of deformation features, signifying completion of recrystallization. A key observation is the presence of finely dispersed precipitates within the incompletely recrystallized regions of the HA900-60 specimen. This is absent in HA900-10, likely due to insufficient time for precipitation during the shorter annealing. Enlarged insets in both figures clearly show three types of particles with black, gray, and white contrasts distributed along grain boundaries. Comparison reveals a slight coarsening of these precipitates in the HA900-60 specimen. EDS point analysis at the marked locations in Figure 4b indicates that the black particles are enriched in Ti, while the gray and white particles are rich in Cr, and Ni (Figure S1), respectively. Given the concurrence of recrystallization and precipitation in this study, it can be deduced that the absence of significant grain coarsening in the HA900-60 specimen is primarily attributed to the Zener pinning effect exerted by the intergranular precipitates, which effectively hinders grain boundary migration and grain growth.
TEM was employed to resolve the fine-scale microstructure of the HA900-60 specimen. The bright-field (BF) image in Figure 5a shows a fully recrystallized grain (outlined by green dashes), whose corresponding selected-area electron diffraction (SAED) pattern (Figure 5b) is indexed to the γ matrix. The region enclosed by the cyan rectangle represents an incompletely recrystallized area, where residual dislocations are visible at higher magnification (Figure 5d). SAED analysis of this region (Figure 5c) reveals superlattice spots, confirming the presence of the γ′ phase. A dark-field (DF) image taken using the g = (001) superlattice spot (Figure 5e) vividly displays these γ′ nanoparticles. The high-resolution TEM (HRTEM) image and its Fast Fourier transform (FFT) pattern in Figure 5f further verify the γ′ phase. The lattice parameters calculated by directly measuring interplanar spacings are 0.3581 nm and 0.3574 nm for the γ and γ′ phases, respectively, in excellent agreement with the XRD results.
A detailed examination of the area (Figure 6a1) within the blue dashed box in Figure 5a, combined with EDS mapping (Figure 6b), identifies two types of precipitates at a grain boundary. The precipitate marked by the pink dashed line is enriched in Cr, while that within the blue dashed line is rich in Ni, Ti, and Al. Correlated SAED indexing (Figure 6a2) confirms them as M₂₃C₆-type carbide and γ′ phase, respectively. They maintain a clear crystallographic orientation relationship: (111)M23C6 // (111)γ′ and [110]M23C6 // [110]γ′. Furthermore, a relatively large precipitation is observed in the BF image (Figure 7a). The EDS mapping (Figure 7b) shows this particle is enriched in Ti and depleted in Co, Cr, Ni, and Al. The SAED analysis identifies it as an MC-type carbide. Thus, the gray, white, and black particles observed in BSE images are conclusively determined to be M₂₃C₆ carbide, γ′ phase, and MC carbide, respectively.
3.2. Room-Temperature Mechanical Properties
Figure 8a displays the engineering stress-strain curves of both specimens at room temperature. The HA900-10 specimen exhibits a yield strength of 1276 MPa, an ultimate tensile strength of 1434 MPa, and a total elongation of 26%. When the annealing time is extended to 60 min (HA900-60), the yield strength slightly decreases to 1202 MPa, while both the ultimate tensile strength (1436 MPa) and total elongation (28%) remain at excellent levels. The work-hardening rate curves shown in Figure 8b elucidate the underlying reason for this retained performance: the HA900-60 specimen demonstrates a higher work-hardening capacity during the mid-to-late stages of plastic deformation, effectively compensating for the potential strength loss caused by reduced dislocation density and partial grain coarsening. Additionally, the finely dispersed intragranular nano-sized γ′ precipitates in the HA900-60 specimen contribute significantly to maintaining the high yield strength.
3.3. Quantitative Analysis of Strengthening Mechanisms
Although the HA900-10 and HA900-60 specimens exhibit comparable room-temperature yield strengths, their distinct microstructures suggest potentially different dominant strengthening mechanisms. Therefore, a quantitative assessment of the individual contributions to the yield strength was performed for both of them.
For the HA900-60 specimen, the yield strength()can be expressed as the sum of the intrinsic matrix strength (), solid solution strengthening (), dislocation strengthening (), grain boundary strengthening (), Orowan strengthening from intergranular MC and M₂₃C₆ carbides as well as γ′ phase ()and strengthening due to the shearing of intragranular γ′ precipitates (), as shown in Equation (1). The last term is omitted for the HA900-10 specimen, which lacks intragranular γ′ precipitates.
The intrinsic strength of the CoCrNi matrix, , is taken as 216 MPa [22]. Considering that solid solution strengthening is not the primary mechanism in this alloy system, 86 MPa is adopted from reports on alloys with similar compositions for simplification [22,23].
The KAM maps indicate a considerable population of residual dislocations in both specimens. These dislocations interact with newly generated dislocations during the initial stage of deformation, leading to tangles that impede slip. The dislocation strengthening contribution ()is calculated using the Bailey-Hirsch relationship (Equation 2) [24].
Where is the Taylor factor (3.06), is a constant (0.2), is the shear modulus (87 GPa [25]), and is the Burgers vector (, with 0.3581 nm). The dislocation density is determined from XRD data using the Williamson-Hall method (Equations 3, 4).
Where denotes the micro-strain of the material, is the average grain size, indicates the peak broadening. is a coefficient (taken as 0.9), is the wavelength of Cu Kα radiation (0.15405 nm), and is the Bragg angle corresponding to the XRD diffraction peak. By substituting the XRD data into Equation (4), a linear fitting of versus was performed, with the results presented in Figure 9. The micro-strain () values obtained for specimens HA900-10 and HA900-60 were 0.45692 and 0.32415, respectively. Substituting these into Equation (3) yields dislocation densities of 1.5 × 10¹⁵ m⁻² and 1.0 × 10¹⁵ m⁻². These values were then used in Equation (2), giving dislocation strengthening contributions of 532 MPa and 435 MPa, respectively.
Grain boundaries act as barriers to dislocation motion, and their strengthening contribution follows the Hall-Petch relationship (Equation 5).
Where is the Hall-Petch coefficient (taken as 568 MPa·μm1/2 [26]) and is the average grain size. Using the grain sizes from EBSD statistics, is calculated to be 283 MPa and 271 MPa for HA900-10 and HA900-60, respectively.
Based on the precipitate size and volume fraction data summarized in Table 1 and Table 2, and neglecting the contribution from micron-sized MC carbides, the Orowan strengthening contribution from nano-sized M₂₃C₆/γ′ clusters and submicron MC carbides is calculated using Equation 6. The values are 39 MPa and 61 MPa for the HA900-10 and HA900-60, respectively
Where and denote the volume fraction and average particle diameter of the precipitates, respectively.
For the intragranular nano-sized γ′ precipitates in the HA900-60 specimen, the dominant interaction with dislocations is shearing. The resulting strengthening is determined by the maximum value among coherent strengthening , modulus mismatch strengthening , and order strengthening .
Calculations using Equations 7-9 [27] with parameters from Table 2 and known constants (lattice misfit , shear modulus difference 10 GPa [25], anti-phase boundary energy =200 mJ/m² [28], constant =0.85. The of HA900-60 specimen was calculated to be 180 MPa.
The distribution of individual strengthening contributions to the yield strength is summarized in Figure 10. The calculated values show good agreement with the experimental measurements. The analysis reveals that the strength of the HA900-10 specimen originates primarily from dislocation and grain boundary strengthening. For the HA900-60 specimen, in addition to these two mechanisms, the shearing of coherent intragranular γ′ precipitates emerge as a crucial third strengthening source.
3.4. Deformation Mechanisms
To elucidate the deformation mechanisms, TEM observations were conducted on the HA900-10 specimen after tensile fracture. In the low-strain region away from the fracture surface (Figure 11a), two sets of {111} slip bands intersecting at approximately 70° (marked by white dashed lines) are visible, characteristic of planar slip in low stacking fault energy FCC alloys. The low SFE promotes planar glide of full dislocations or their dissociation into Shockley partials, thereby suppressing cross-slip. Furthermore, the solid-solution C atoms increase the lattice friction stress, further enhancing planar slip [29]. In the high-strain region near the fracture (Figure 11b), the {111} slip bands refine, forming high-density dislocation walls with spacings of about 10-100 nm (white arrows). This significantly reduces the mean free path of dislocations, contributing to enhanced work hardening. Figure 11c shows the deformed microstructure in the fracture region, and its corresponding diffraction pattern exhibits streaks, confirming the presence of deformation-induced stacking faults. The dark-field image in Figure 11d reveals the morphology of SFs. The HRTEM inset shows that SFs pile up on adjacent {111} planes, forming stacking fault bundles about 5 nm thick. SFs on {111} planes are typically generated by the dissociation of perfect dislocations with a Burgers vector of 1/2<110> into 30° and 90° Shockley partials [30]. SFs play a dual role in plastic deformation: on one hand, the glide of partials at SF termini accommodates plastic strain; on the other hand, the unique atomic arrangement within SFs increases the resistance to dislocation passage, thereby contributing to work hardening. In summary, the room-temperature deformation of the HA900-10 specimen is dominated by planar dislocation slip, assisted by stacking faults. In the early stages of deformation, work hardening arises mainly from dislocation-dislocation interactions. During the mid-to-late stages, the dynamically refined slip bands and the complex interactions among dislocations, dislocation walls, and stacking faults become the primary work-hardening mechanisms.
4. Conclusions
This study compares the microstructure and properties of the (CoCrNi)₉₃.₅Al₃Ti₃C₀.₅ medium-entropy alloy under different annealing durations, clarifying the crucial role of annealing time in recrystallization behavior, precipitate formation, and the strength–ductility balance.
(1) After short-time annealing (10 min), the microstructure exhibits incomplete recrystallization with retained high dislocation density and fine grains. In contrast, prolonged annealing (60 min) promotes partial recrystallization and stimulates the precipitation of nano-sized γ′ phase within the grains. Both of the specimens show the presence of M₂₃C₆, MC-type carbides and γ′ phase distributed along grain boundaries.
(2) The strength of the HA900-10 alloy primarily originates from dislocation strengthening and grain refinement. For HA900-60, in addition to these mechanisms, strengthening via shearing of the γ′ precipitates is introduced, compensating for the potential strength loss due to reduced dislocation density, thereby maintaining a high yield strength (1202 MPa) while retaining excellent elongation (28%).
(3) During deformation, planar slip combined with stacking faults jointly governs the work-hardening behavior of the alloy. This research demonstrates that by controlling annealing time, the coordination between recrystallization and precipitation processes in multi-phase medium-entropy alloys can be achieved, offering important guidance for designing novel structural materials with both high strength and high ductility.
Author Contributions
Conceptualization, P.Z. and Y.C.; Methodology, Y.L.; Investigation, C.Z. and R.W.; Writing—original draft preparation, P.Z.; Writing—review and editing, Y.C.; Supervision, Y.C. All authors have read and agreed to the published version of the manuscript.
Funding
This research was funded by the National Natural Science Foundation of China (Nos. 52505440), the Fundamental Research Program of Shanxi Province (CN) (No. 202503021212134), and Opening Foundation of Shanxi Key Laboratory of Advanced Metal Materials for Special Environments (No. AMMSE-2025-004).
Institutional Review Board Statement
Not applicable.
Informed Consent Statement
Not applicable.
Data Availability Statement
Data will be made available upon request.
Conflicts of Interest
The authors declare that they have no known competing financial interests or personal relationships that could have appeared to influence the work reported in this paper.
References
- Gludovatz, B.; Hohenwarter, A.; Catoor, D.; Chang, E.H.; George, E.P.; Ritchie, R.O. A Fracture-Resistant High-Entropy Alloy for Cryogenic Applications. Science 2014, 345, 1153–1158. [Google Scholar] [CrossRef] [PubMed]
- Ritchie, R.O. The Conflicts between Strength and Toughness. Nat. Mater. 2011, 10, 817–822. [Google Scholar] [CrossRef] [PubMed]
- Bai, S.; Chen, Y.; Sheng, J.; Li, D.; Lu, H.; Bai, P.; Huang, Z.; Li, J.; Zhao, C. A Comprehensive Overview of High Strength and Toughness Steels for Automobile Based on QP Process. J. Mater. Res. Technol. 2023, 27, 2216–2236. [Google Scholar] [CrossRef]
- Yeh, J.W.; Chen, S.K.; Lin, S.J.; Gan, J.Y.; Chin, T.S.; Shun, T.T.; Tsau, C.H.; Chang, S.Y. Nanostructured High-Entropy Alloys with Multiple Principal Elements: Novel Alloy Design Concepts and Outcomes. Adv. Eng. Mater. 2004, 6, 299‒303. [Google Scholar] [CrossRef]
- George, E.P.; Raabe, D.; Ritchie, R.O. High-Entropy Alloys. Nat. Rev. Mater. 2019, 4, 515–534. [Google Scholar] [CrossRef]
- Cantor, B.; Chang, I.T.H.; Knight, P.; Vincent, A.J.B. Microstructural Development in Equiatomic Multicomponent Alloys. Mater. Sci. Eng. A 2004, 375‒377, 213‒218. [Google Scholar] [CrossRef]
- George, E.P.; Curtin, W.A.; Tasan, C.C. High Entropy Alloys: A Focused Review of Mechanical Properties and Deformation Mechanisms. Acta Mater. 2020, 188, 435‒474. [Google Scholar] [CrossRef]
- Li, Z.; Pradeep, K.G.; Deng, Y.; Raabe, D.; Tasan, C.C. Metastable High-Entropy Dual-Phase Alloys Overcome the Strength–Ductility Trade-off. Nature 2016, 534, 227‒230. [Google Scholar] [CrossRef]
- Laplanche, G.; Kostka, A.; Reinhart, C.; Hunfeld, J.; Eggeler, G.; George, E.P. Reasons for the Superior Mechanical Properties of Medium-Entropy CrCoNi Compared to High-Entropy CrMnFeCoNi. Acta Mater. 2017, 128, 292–303. [Google Scholar] [CrossRef]
- Rackwitz, J.; Yu, Q.; Yang, Y.; Laplanche, G.; George, E.P.; Minor, A.M.; Ritchie, R.O. Effects of Cryogenic Temperature and Grain Size on Fatigue-Crack Propagation in the Medium-Entropy CrCoNi Alloy. Acta Mater. 2020, 200, 351‒365. [Google Scholar] [CrossRef]
- Miao, J.; Slone, C.E.; Smith, T.M.; Niu, C.; Bei, H.; Ghazisaeidi, M.; Pharr, G.M.; Mills, M.J. The Evolution of the Deformation Substructure in a Ni-Co-Cr Equiatomic Solid Solution Alloy. Acta Mater. 2017, 132, 35–48. [Google Scholar] [CrossRef]
- Zhang, Z.H.; Jiang, P.; Yuan, F.P.; Wu, X.L. Enhanced Tensile Properties by Heterogeneous Grain Structures and Coherent Precipitates in a CoCrNi-Based Medium Entropy Alloy. Mater. Sci. Eng. A 2022, 832, 142440. [Google Scholar] [CrossRef]
- Chang, R.; Fang, W.; Yan, J.; Yu, H.; Bai, X.; Li, J.; Wang, S.; Zheng, S.; Yin, F. Microstructure and Mechanical Properties of CoCrNi-Mo Medium Entropy Alloys: Experiments and First-Principle Calculations. J. Mater. Sci. Technol. 2021, 62, 25–33. [Google Scholar] [CrossRef]
- Wang, J.Y.; Zou, J.P.; Yang, H.L.; Dong, X.X.; Cao, P.; Liao, X.Z.; Liu, Z.L.; Ji, S.X. Ultrastrong and Ductile (CoCrNi)94Ti3Al3 Medium-Entropy Alloys via Introducing Multi-Scale Heterogeneous Structures. J. Mater. Sci. Technol. 2023, 135, 241‒249. [Google Scholar] [CrossRef]
- Yang, T.; Zhao, Y.L.; Tong, Y.; Jiao, Z.B.; Wei, J.; Cai, J.X.; Han, X.D.; Chen, D.; Hu, A.; Kai, J.J.; Liu, C.T. Multicomponent Intermetallic Nanoparticles and Superb Mechanical Behaviors of Complex Alloys. Science 2018, 362, 933–937. [Google Scholar] [CrossRef]
- Bai, S.; Li, D.; Li, L.; Lu, H.; Xing, J.; Bai, P.; Li, J.; Yan, Z.; Huang, Z. Realizing the Strength-Ductility Balance of a Warm-Rolled 10 Mn Steel via Preparing Dual Nano-Sized Precipitates. J. Mater. Res. Technol. 2024, 32, 3210–3222. [Google Scholar] [CrossRef]
- Hu, G.W.; Zeng, L.C.; Du, H.; Wang, Q.; Fan, Z.T.; Liu, X.W. Combined Effects of Solute Drag and Zener Pinning on Grain Growth of a NiCoCr Medium-Entropy Alloy. Intermetallics 2021, 136, 107271. [Google Scholar] [CrossRef]
- Chen, Y.; Li, D.; Yan, Z.; Bai, S.; Xie, R.; Sheng, J.; Zhang, J.; Li, S.; Zhang, J. Exceptional Strength–Ductility Combinations of a CoCrNi-Based Medium-Entropy Alloy via Short/Medium-Time Annealing after Hot-Rolling. Materials 2024, 17, 4835. [Google Scholar] [CrossRef]
- Qin, S.; Yang, M.X.; Jiang, P.; Wang, J.; Wu, X.L.; Zhou, H.; Yuan, F.P. Designing Structures with Combined Gradients of Grain Size and Precipitation in High Entropy Alloys for Simultaneous Improvement of Strength and Ductility. Acta Mater. 2022, 230, 117847. [Google Scholar] [CrossRef]
- Wu, Z.; Guo, W.; Jin, K.; Poplawsky, J.D.; Gao, Y.; Bei, H. Enhanced Strength and Ductility of a Tungsten-Doped CoCrNi Medium-Entropy Alloy. J. Mater. Res. 2018, 33, 3301–3309. [Google Scholar] [CrossRef]
- Chen, Y.A.; Li, D.Z.; Xie, R.F.; Lu, H.T. Dual Precipitates and Heterogeneous Fine-Grain Structure Induced Strength-Ductility Synergy in a CoCrNi-Based Medium-Entropy Alloy. Mater. Sci. Eng. A 2023, 867, 144504. [Google Scholar] [CrossRef]
- Zhao, Y.L.; Yang, T.; Tong, Y.; Wang, J.; Luan, J.H.; Jiao, Z.B.; Chen, D.; Yang, Y.; Hu, A.; Liu, C.T. Heterogeneous Precipitation Behavior and Stacking-Fault-Mediated Deformation in a CoCrNi-Based Medium-Entropy Alloy. Acta Mater. 2017, 138, 72–82. [Google Scholar] [CrossRef]
- Moravcik, I.; Hornik, V.; Minárik, P.; Li, L.L.; Dlouhy, I.; Janovska, M.; Raabe, D.; Li, Z.M. Interstitial Doping Enhances the Strength-Ductility Synergy in a CoCrNi Medium Entropy Alloy. Mater. Sci. Eng. A 2020, 781, 139242. [Google Scholar] [CrossRef]
- Lin, D.Y.; Xu, L.Y.; Han, Y.D.; Jing, H.Y.; Zhao, L.; Min, X. Structure and Mechanical Properties of a FeCoCrNi High-Entropy Alloy Fabricated via Selective Laser Melting. Intermetallics 2020, 127, 106963. [Google Scholar] [CrossRef]
- Pollock, T.M.; Argon, A.S. Creep Resistance of CMSX-3 Nickel Base Superalloy Single Crystals. Acta Metall. Mater. 1992, 40, 1–30. [Google Scholar] [CrossRef]
- Chevenard, P. Traitement Thermique des Ferronickels Complexes à Deux Constituents. C. R. Acad. Sci. 1929, 189, 846‒849. [Google Scholar]
- Ardell, A.J. Precipitation Hardening. Metall. Trans. A 1985, 16, 2131–2165. [Google Scholar] [CrossRef]
- Kozar, R.W.; Suzuki, A.; Milligan, W.W.; Schirra, J.J.; Savage, M.F.; Pollock, T.M. Strengthening Mechanisms in Polycrystalline Multimodal Nickel-Base Superalloys. Metall. Mater. Trans. A 2009, 40, 1588–1603. [Google Scholar] [CrossRef]
- Li, Z.M. Interstitial Equiatomic CoCrFeMnNi High-Entropy Alloys: Carbon Content, Microstructure, and Compositional Homogeneity Effects on Deformation Behavior. Acta Mater. 2019, 164, 400–412. [Google Scholar] [CrossRef]
- Kim, J.G.; Park, J.M.; Seol, J.B.; Choe, H.S.; Kim, H.S. Nano-Scale Solute Heterogeneities in the Ultrastrong Selectively Laser Melted Carbon-Doped CoCrFeMnNi Alloy. Mater. Sci. Eng. A 2020, 773, 138726. [Google Scholar] [CrossRef]
Figure 1.
(a) XRD patterns of the HA900-10 and HA900-60 specimens; (b) Peak deconvolution of the (200) diffraction peak for the HA900-60 specimen, identifying the γ and γ′ phases.
Figure 1.
(a) XRD patterns of the HA900-10 and HA900-60 specimens; (b) Peak deconvolution of the (200) diffraction peak for the HA900-60 specimen, identifying the γ and γ′ phases.
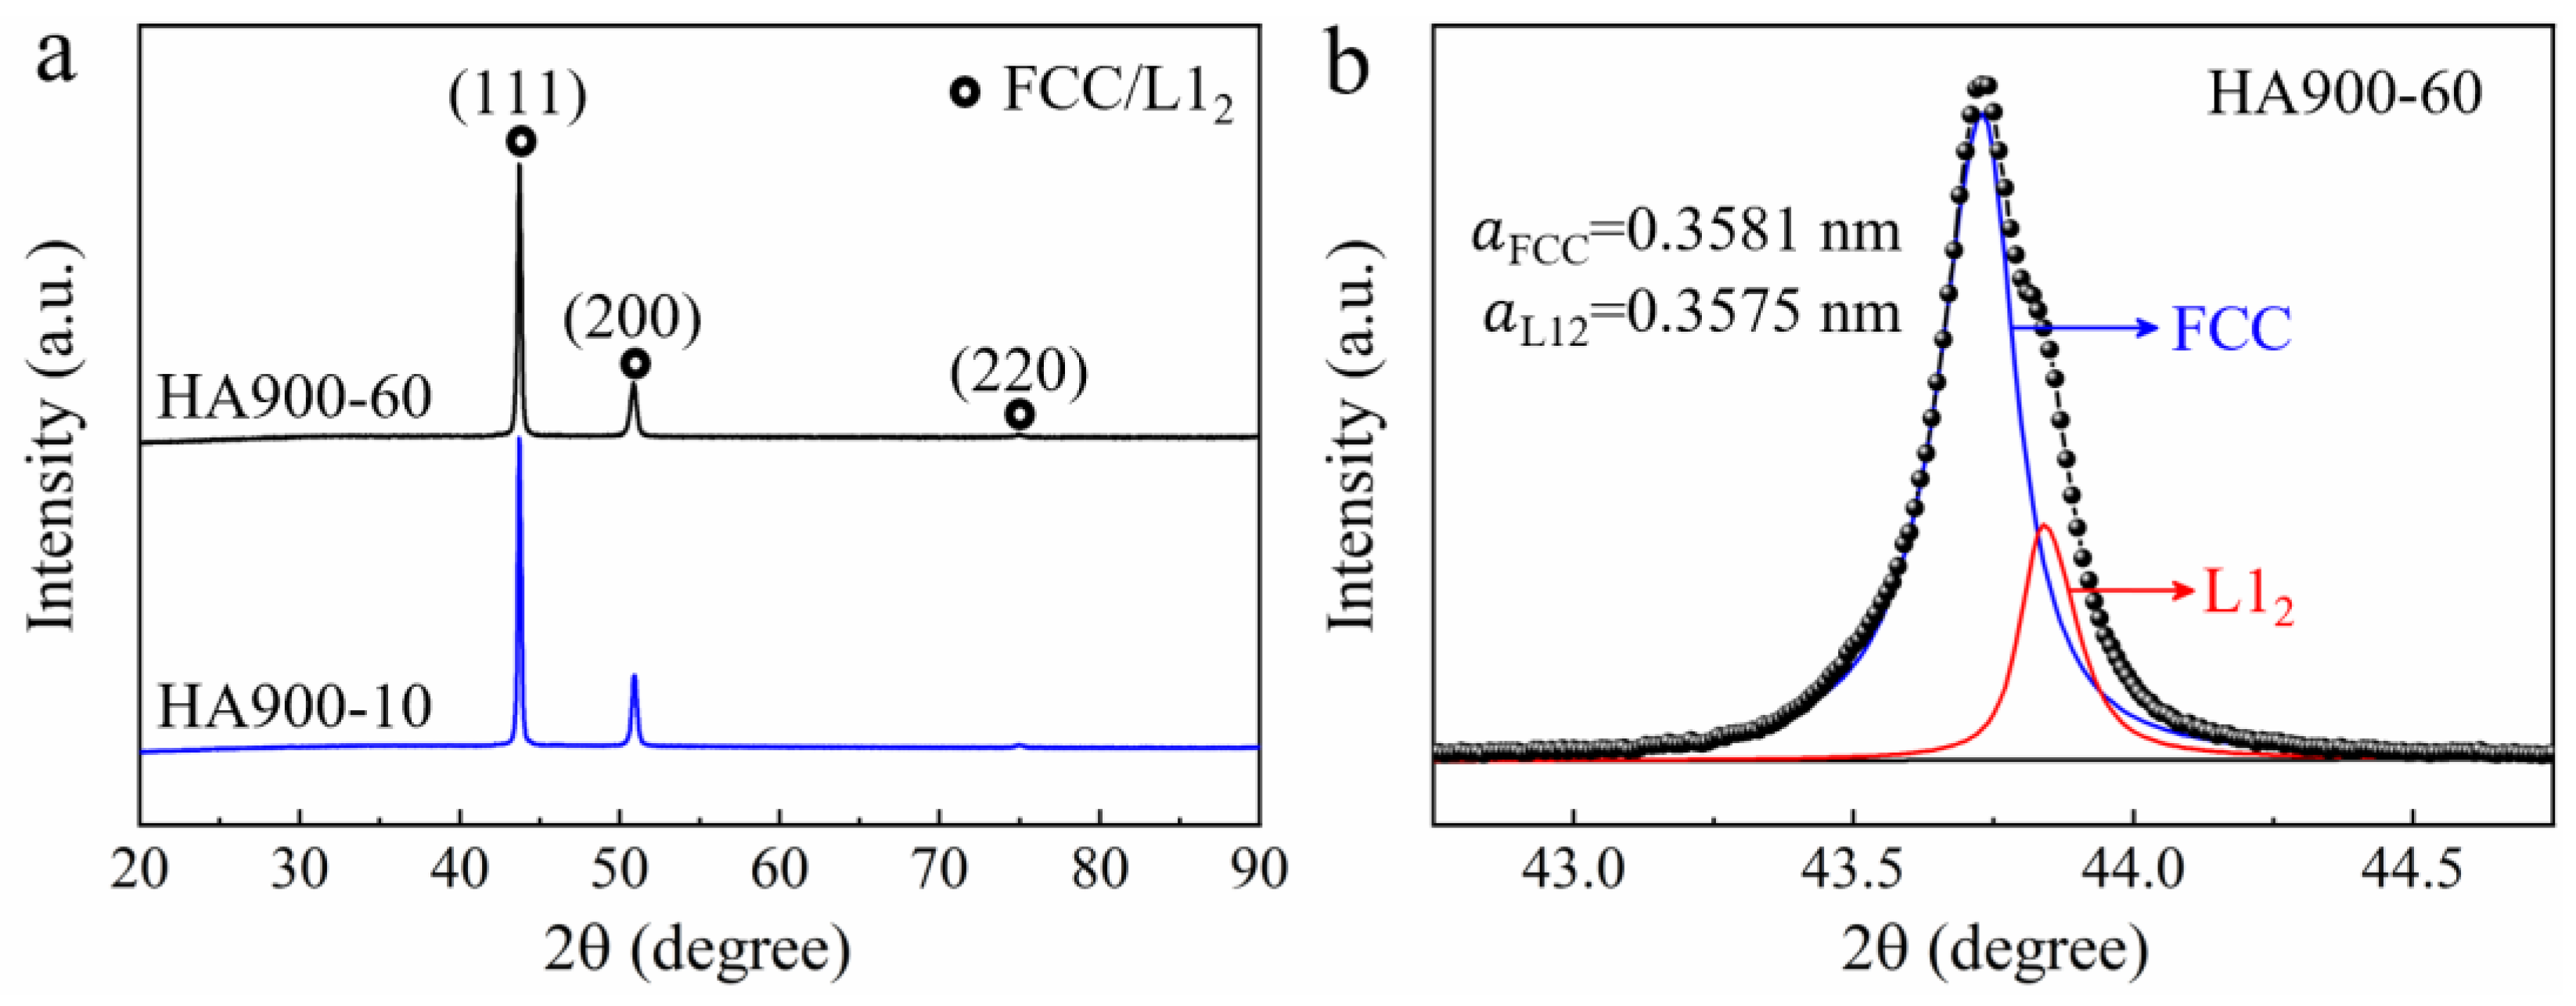
Figure 2.
EBSD analysis of the HA900-10 (a1-a3) and HA900-60 (b1-b3) specimens: (a1, b1) Inverse pole figure maps; (a2, b2) Kernel average misorientation maps; (a3, b3) Grain boundary maps (green and black lines represent low-angle and high-angle grain boundaries, respectively).
Figure 2.
EBSD analysis of the HA900-10 (a1-a3) and HA900-60 (b1-b3) specimens: (a1, b1) Inverse pole figure maps; (a2, b2) Kernel average misorientation maps; (a3, b3) Grain boundary maps (green and black lines represent low-angle and high-angle grain boundaries, respectively).
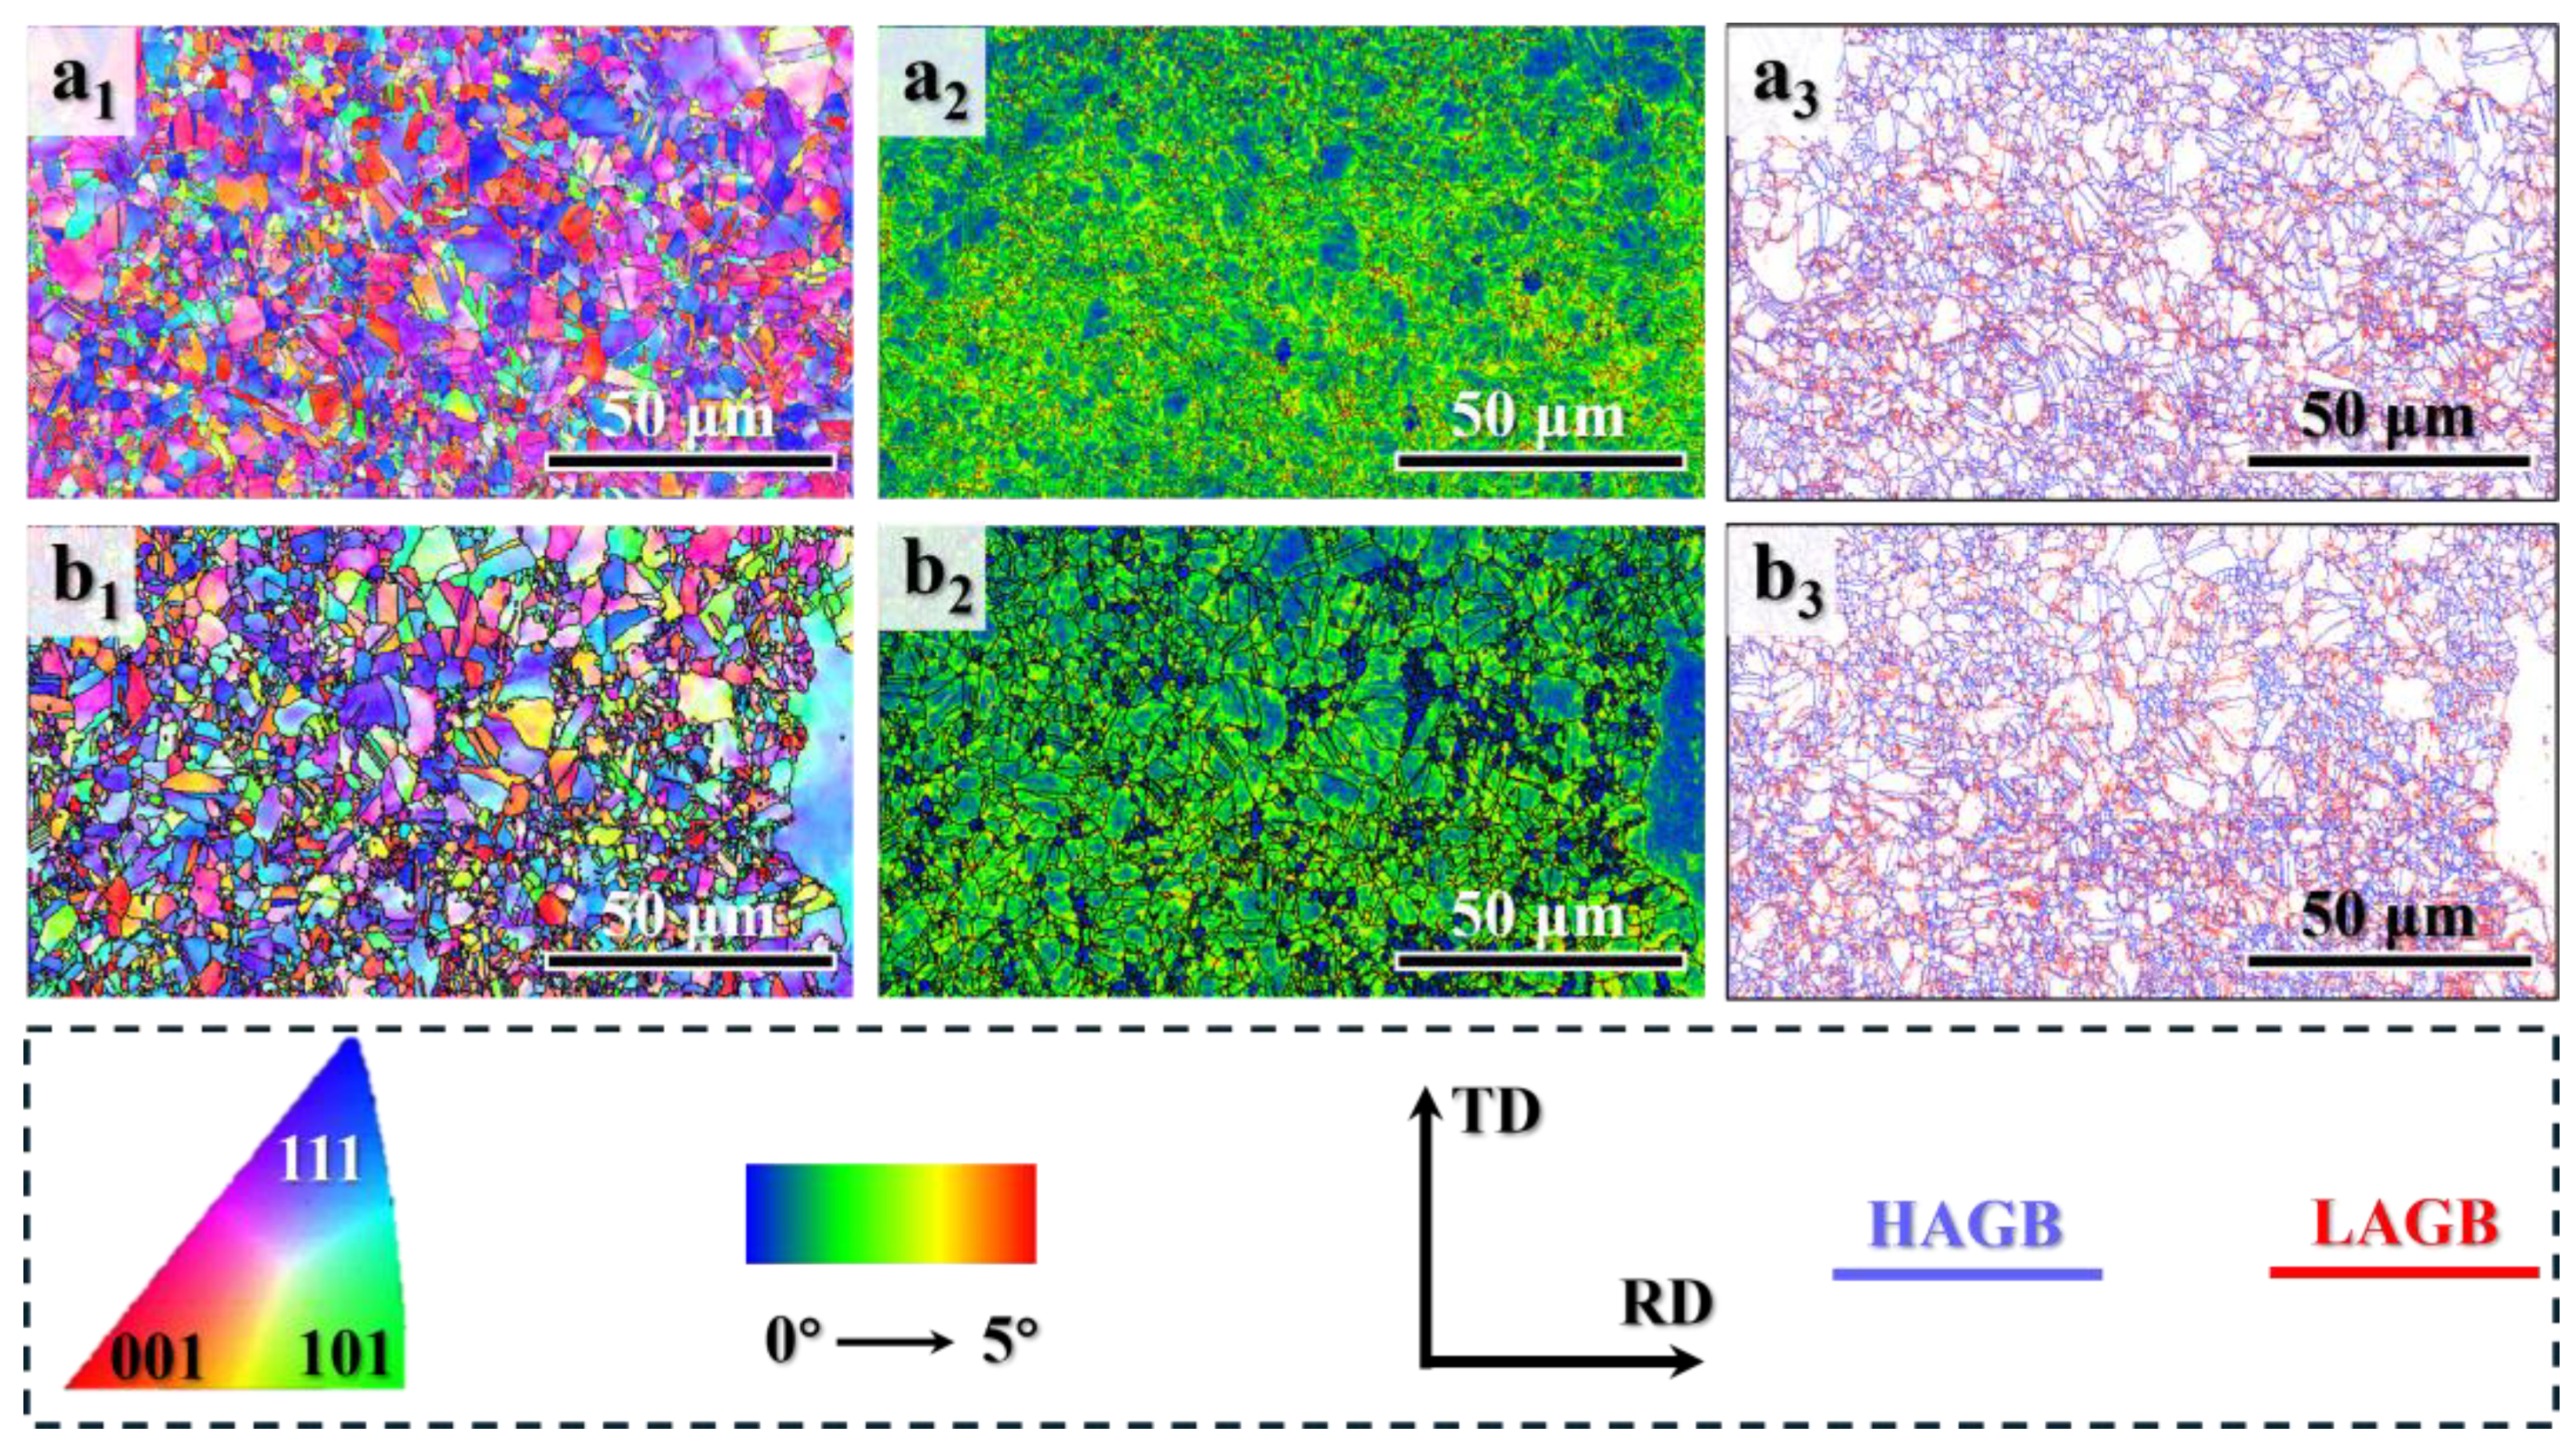
Figure 3.
Statistical grain size distribution histograms for the (a) HA900-10 and (b) HA900-60 specimens.
Figure 3.
Statistical grain size distribution histograms for the (a) HA900-10 and (b) HA900-60 specimens.
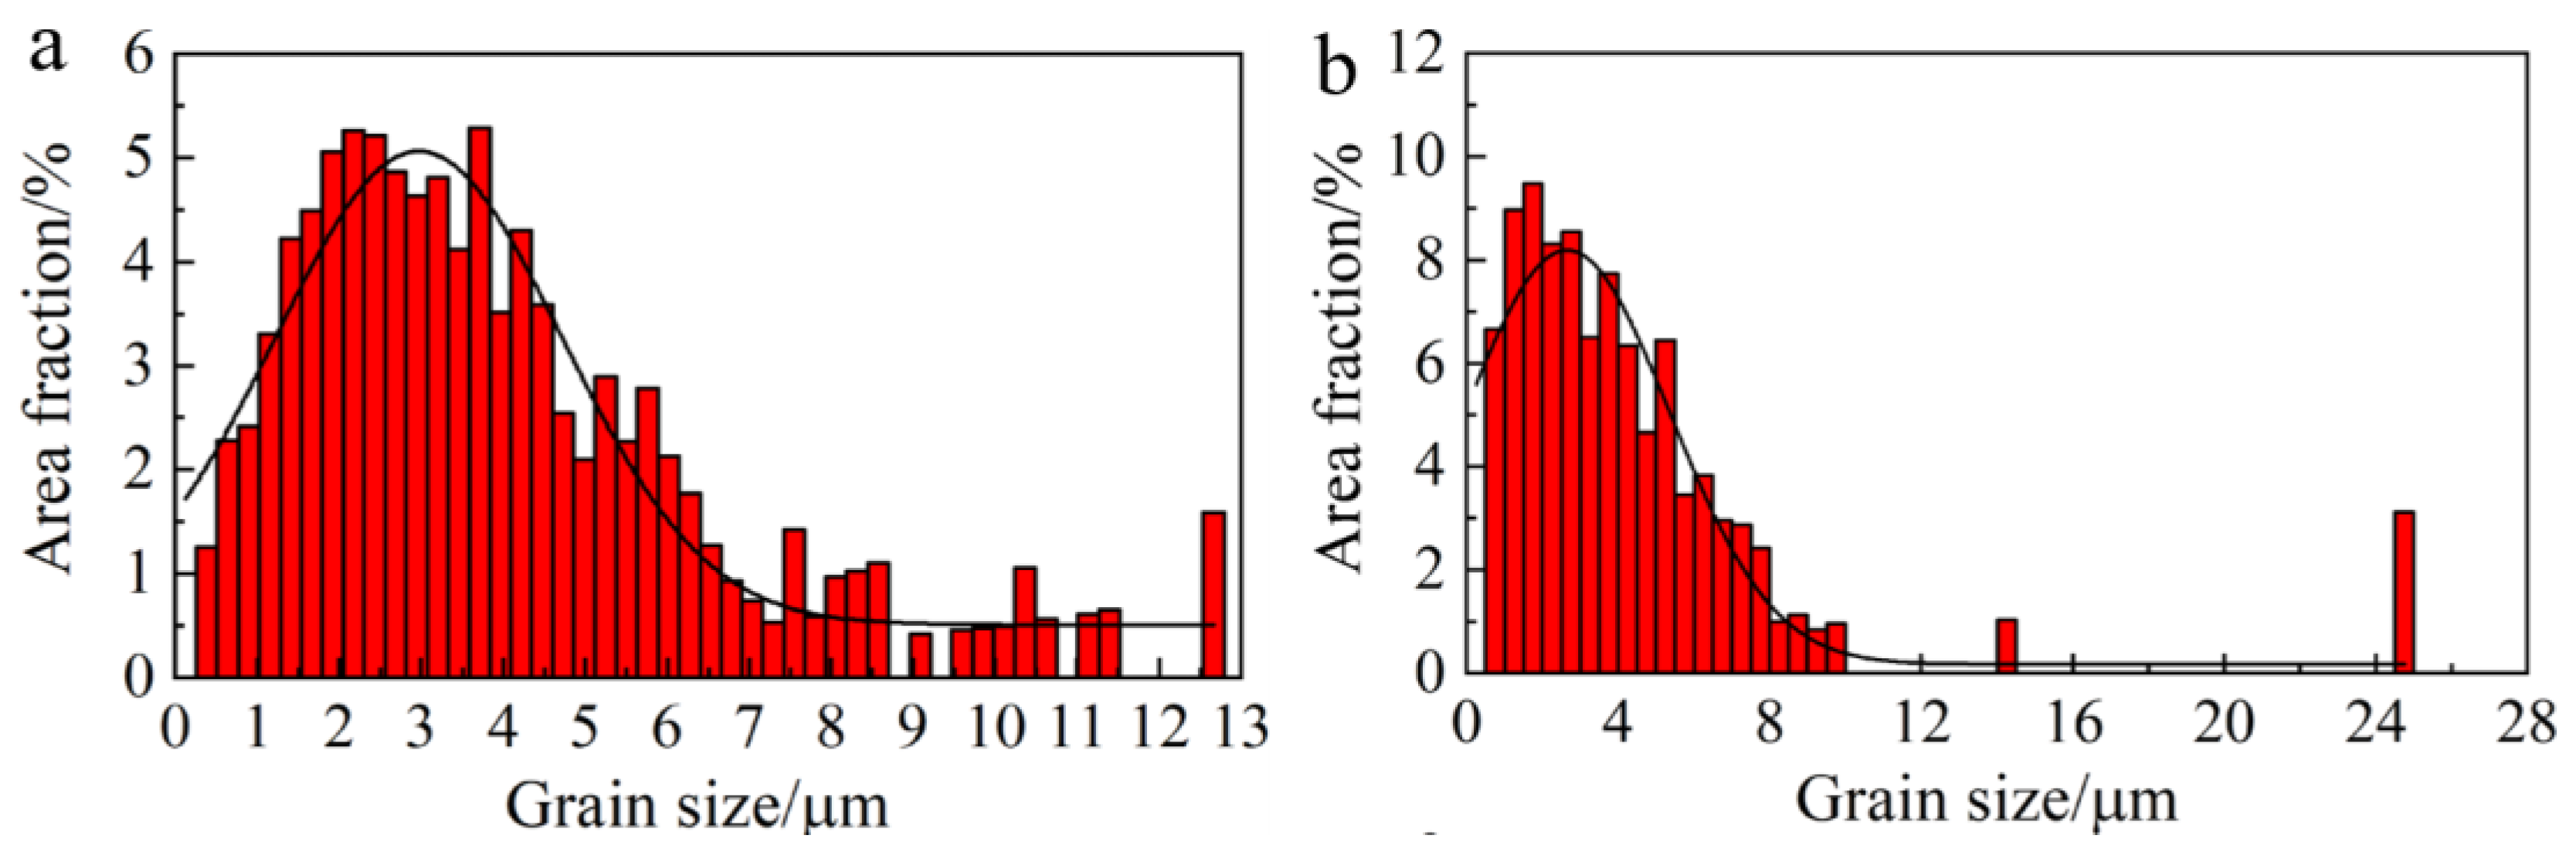
Figure 4.
BSE micrographs of the (a) HA900-10 and (b) HA900-60 specimens. Insets are higher-magnification views showing precipitates distributed along grain boundaries.
Figure 4.
BSE micrographs of the (a) HA900-10 and (b) HA900-60 specimens. Insets are higher-magnification views showing precipitates distributed along grain boundaries.
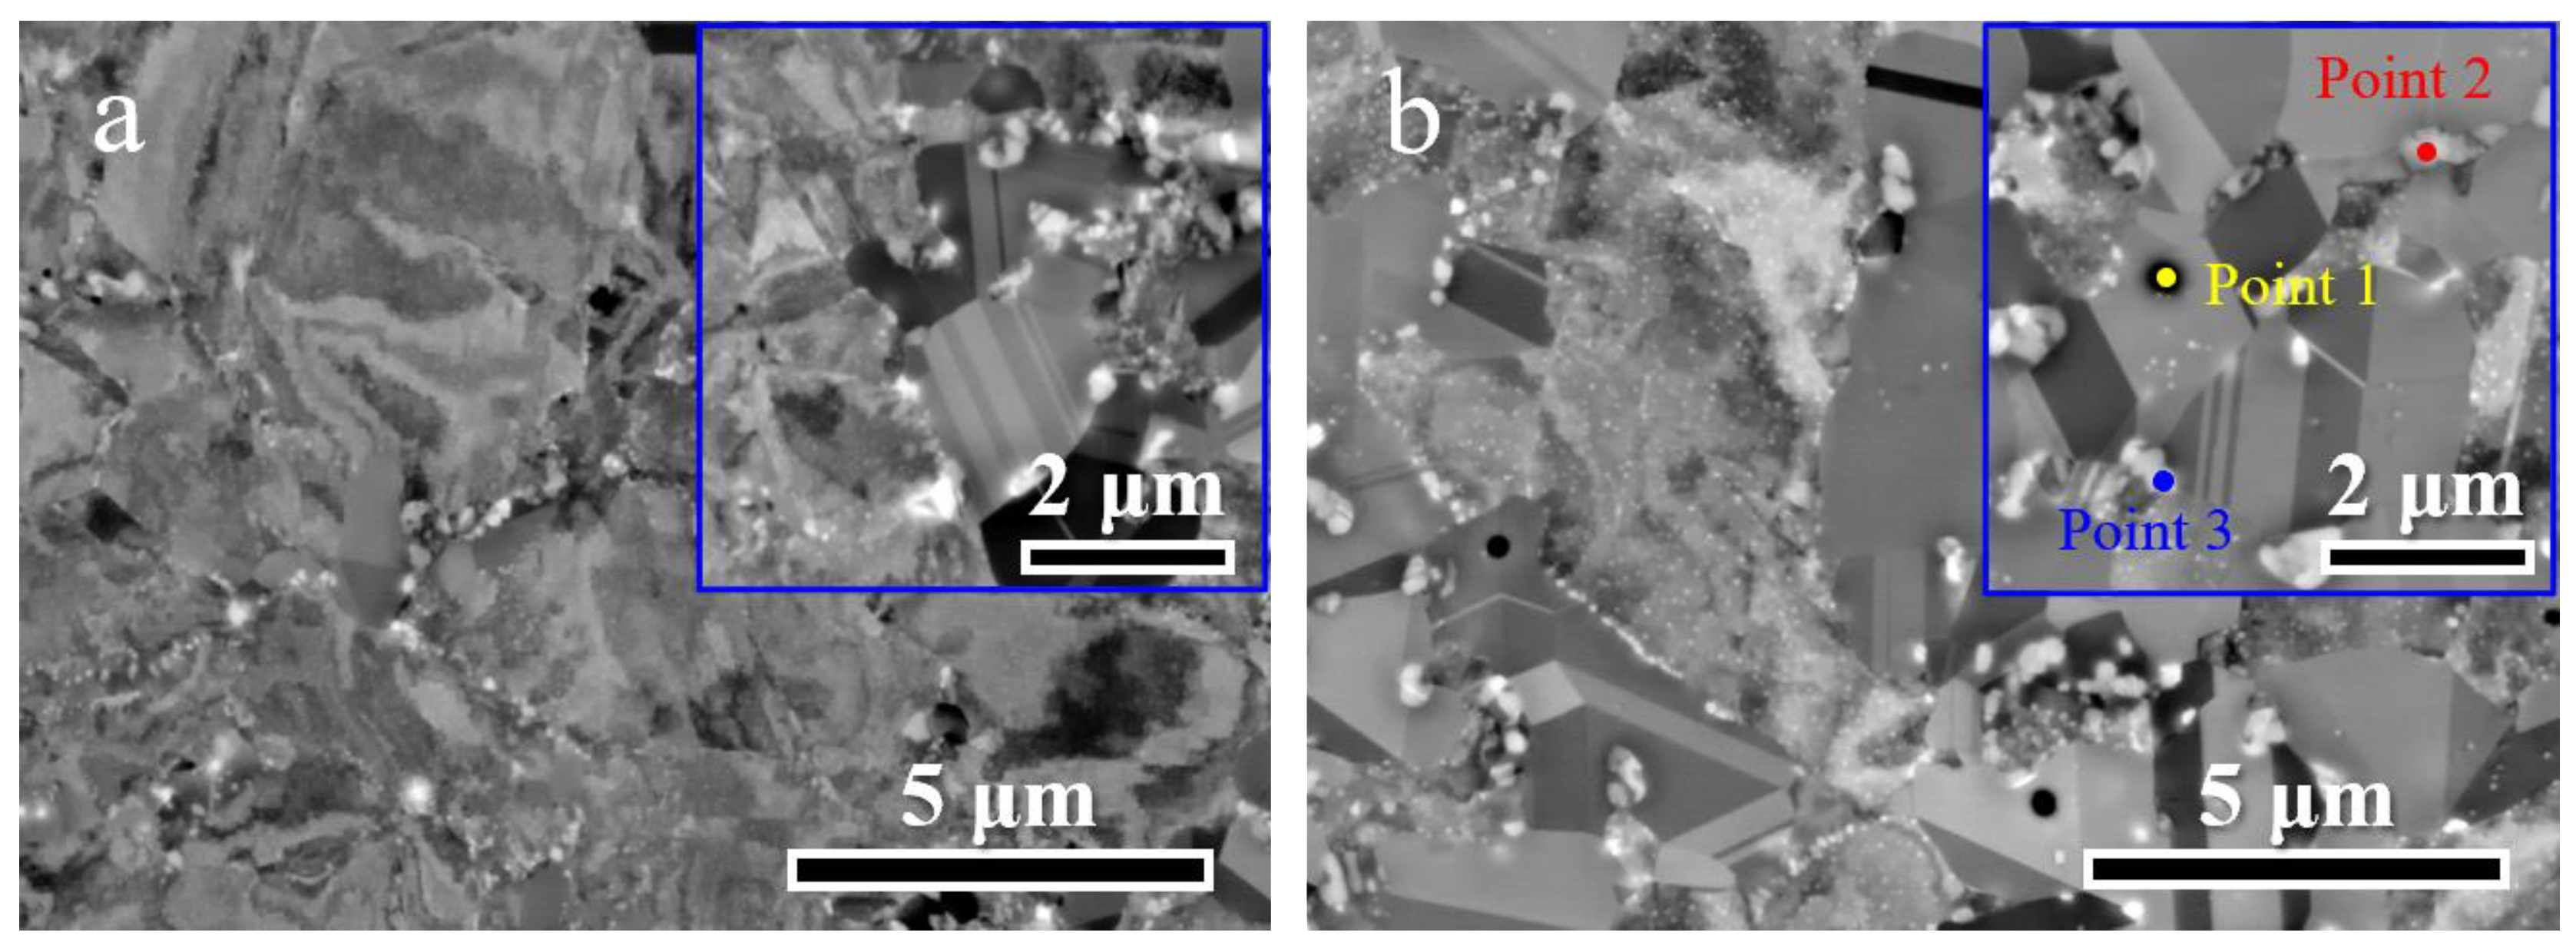
Figure 5.
TEM analysis of the HA900-60 specimen: (a) BF image showing a fully recrystallized region (green dashes) and an incompletely recrystallized region (cyan rectangle); (b, c) SAED patterns corresponding to the regions in (a); (d) High-magnification view of the incompletely recrystallized area showing dislocations; (e) DF image taken using the g = (001) superlattice spot, highlighting the γ′ phase; (f) HRTEM and FFT images showing the γ/γ′ interface.
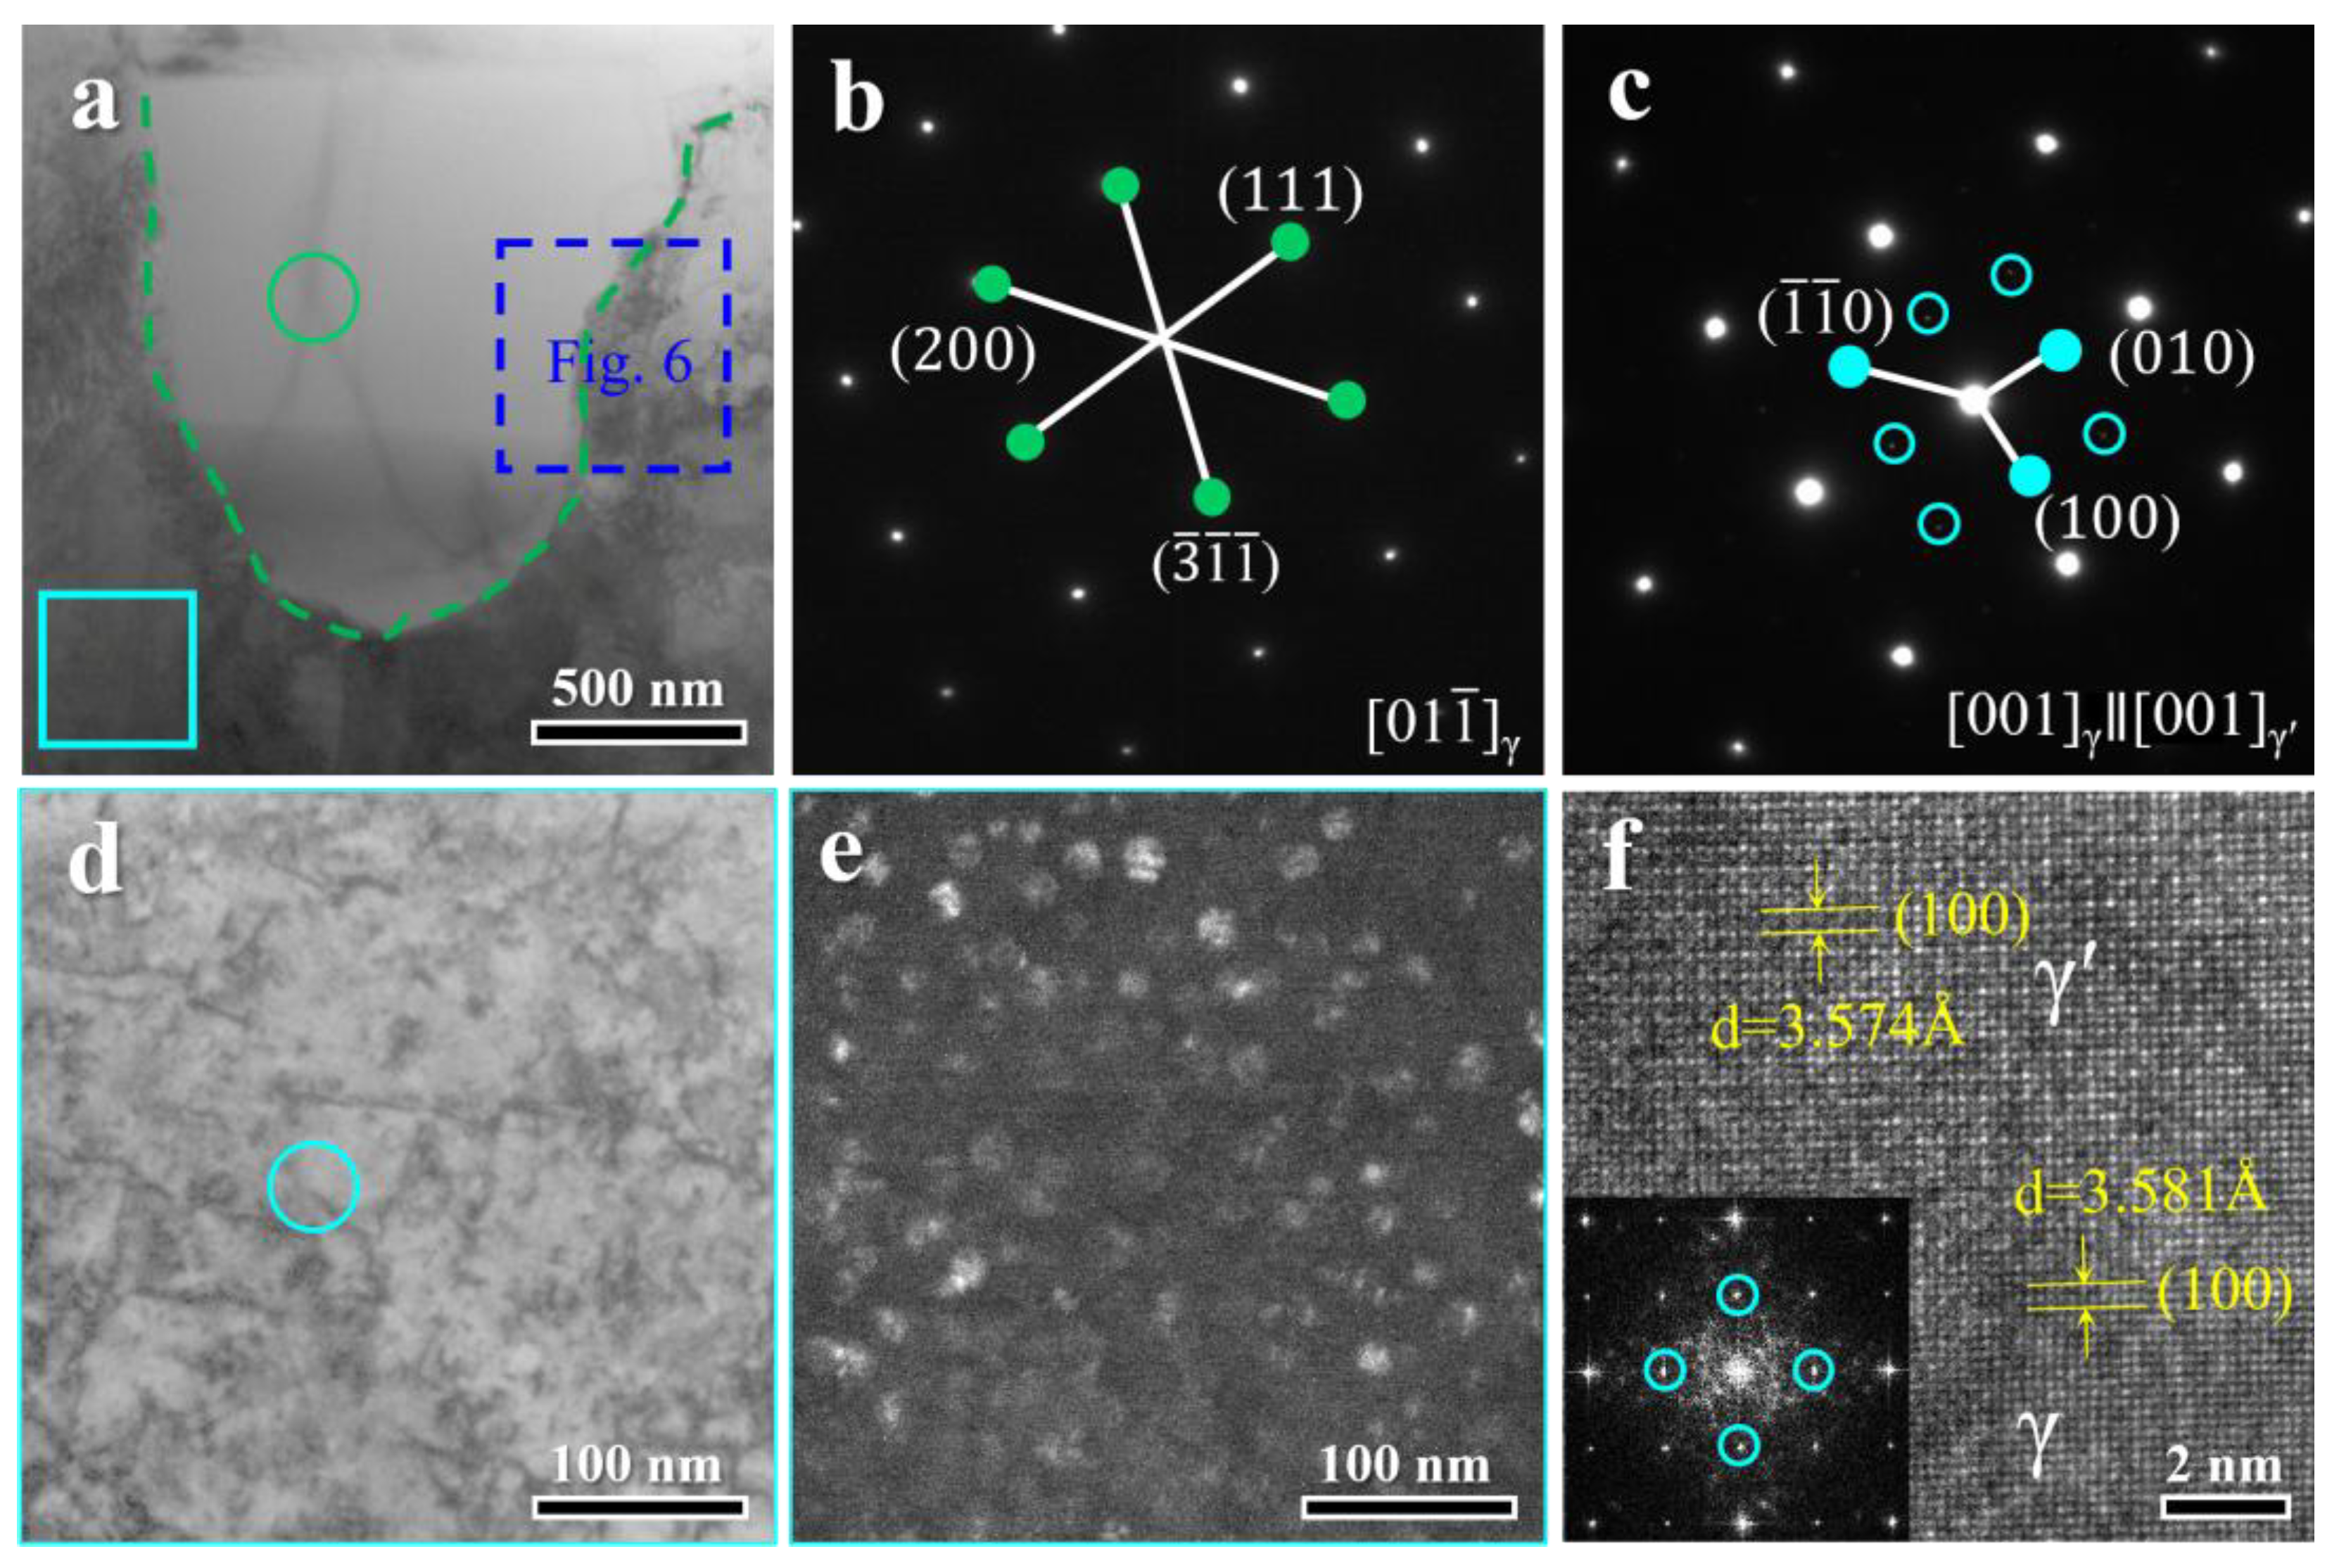
Figure 6.
Detailed analysis of intergranular precipitates in the HA900-60 specimen: (a1) High-magnification BF image of a grain boundary region; (a2) Indexed SAED pattern; (b) EDS maps showing the distribution of constituent elements.
Figure 6.
Detailed analysis of intergranular precipitates in the HA900-60 specimen: (a1) High-magnification BF image of a grain boundary region; (a2) Indexed SAED pattern; (b) EDS maps showing the distribution of constituent elements.
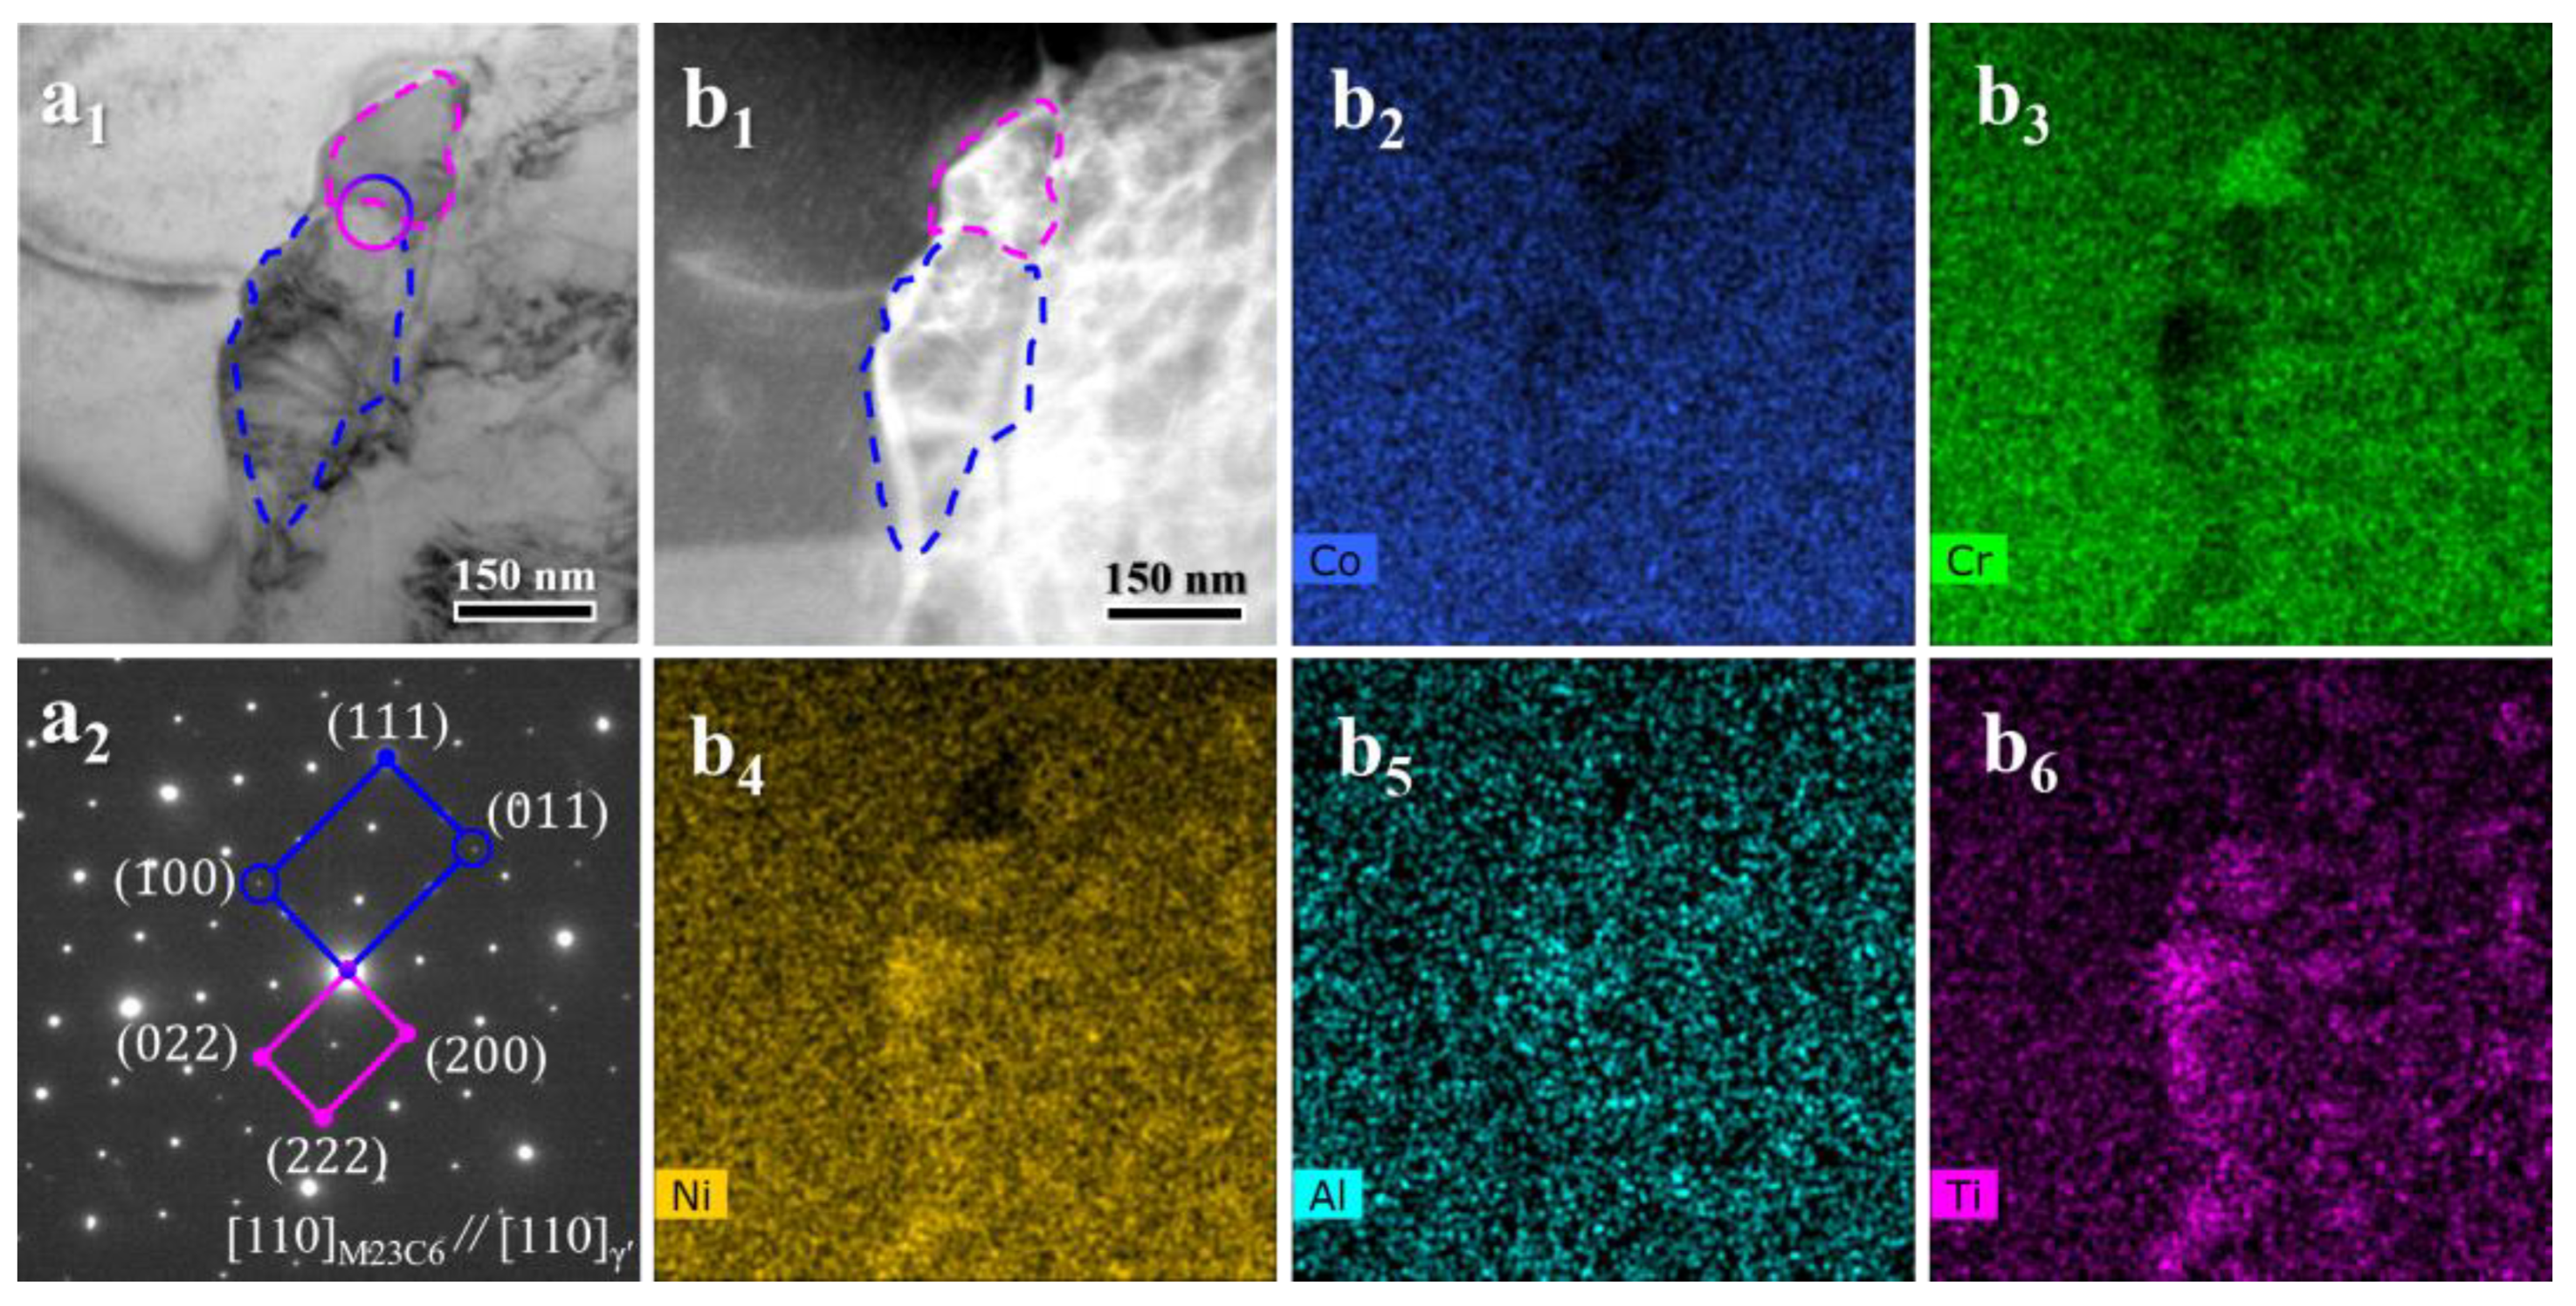
Figure 7.
Characterization of an MC-type carbide in the HA900-60 specimen: (a) BF image and SAED pattern; (b) EDS maps showing the distribution of constituent elements.
Figure 7.
Characterization of an MC-type carbide in the HA900-60 specimen: (a) BF image and SAED pattern; (b) EDS maps showing the distribution of constituent elements.
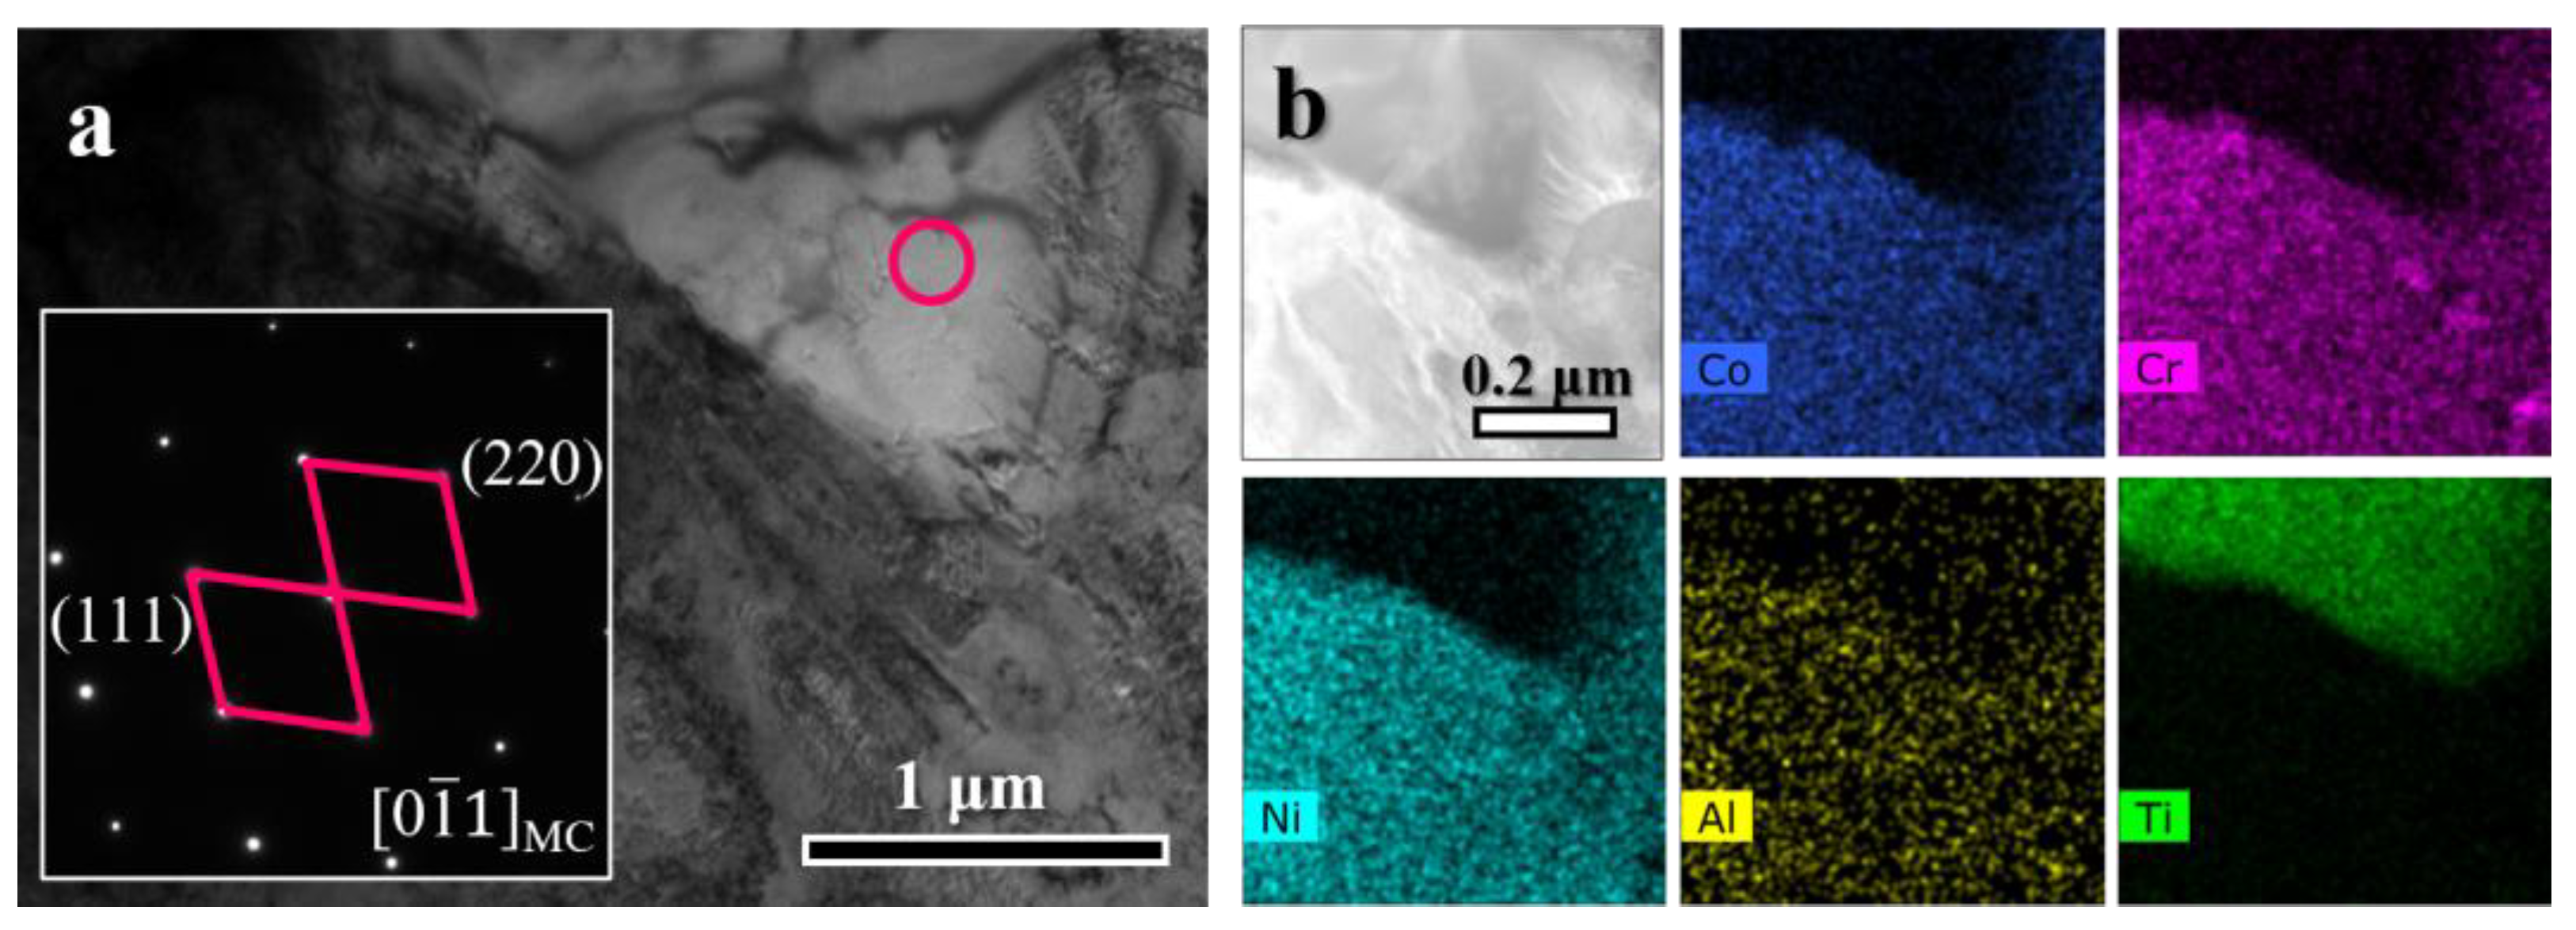
Figure 8.
(a) Room-temperature engineering stress-strain curves of the HA900-10 and HA900-60 specimens; (b) Corresponding true stress-strain curves and work-hardening rate curves.
Figure 8.
(a) Room-temperature engineering stress-strain curves of the HA900-10 and HA900-60 specimens; (b) Corresponding true stress-strain curves and work-hardening rate curves.
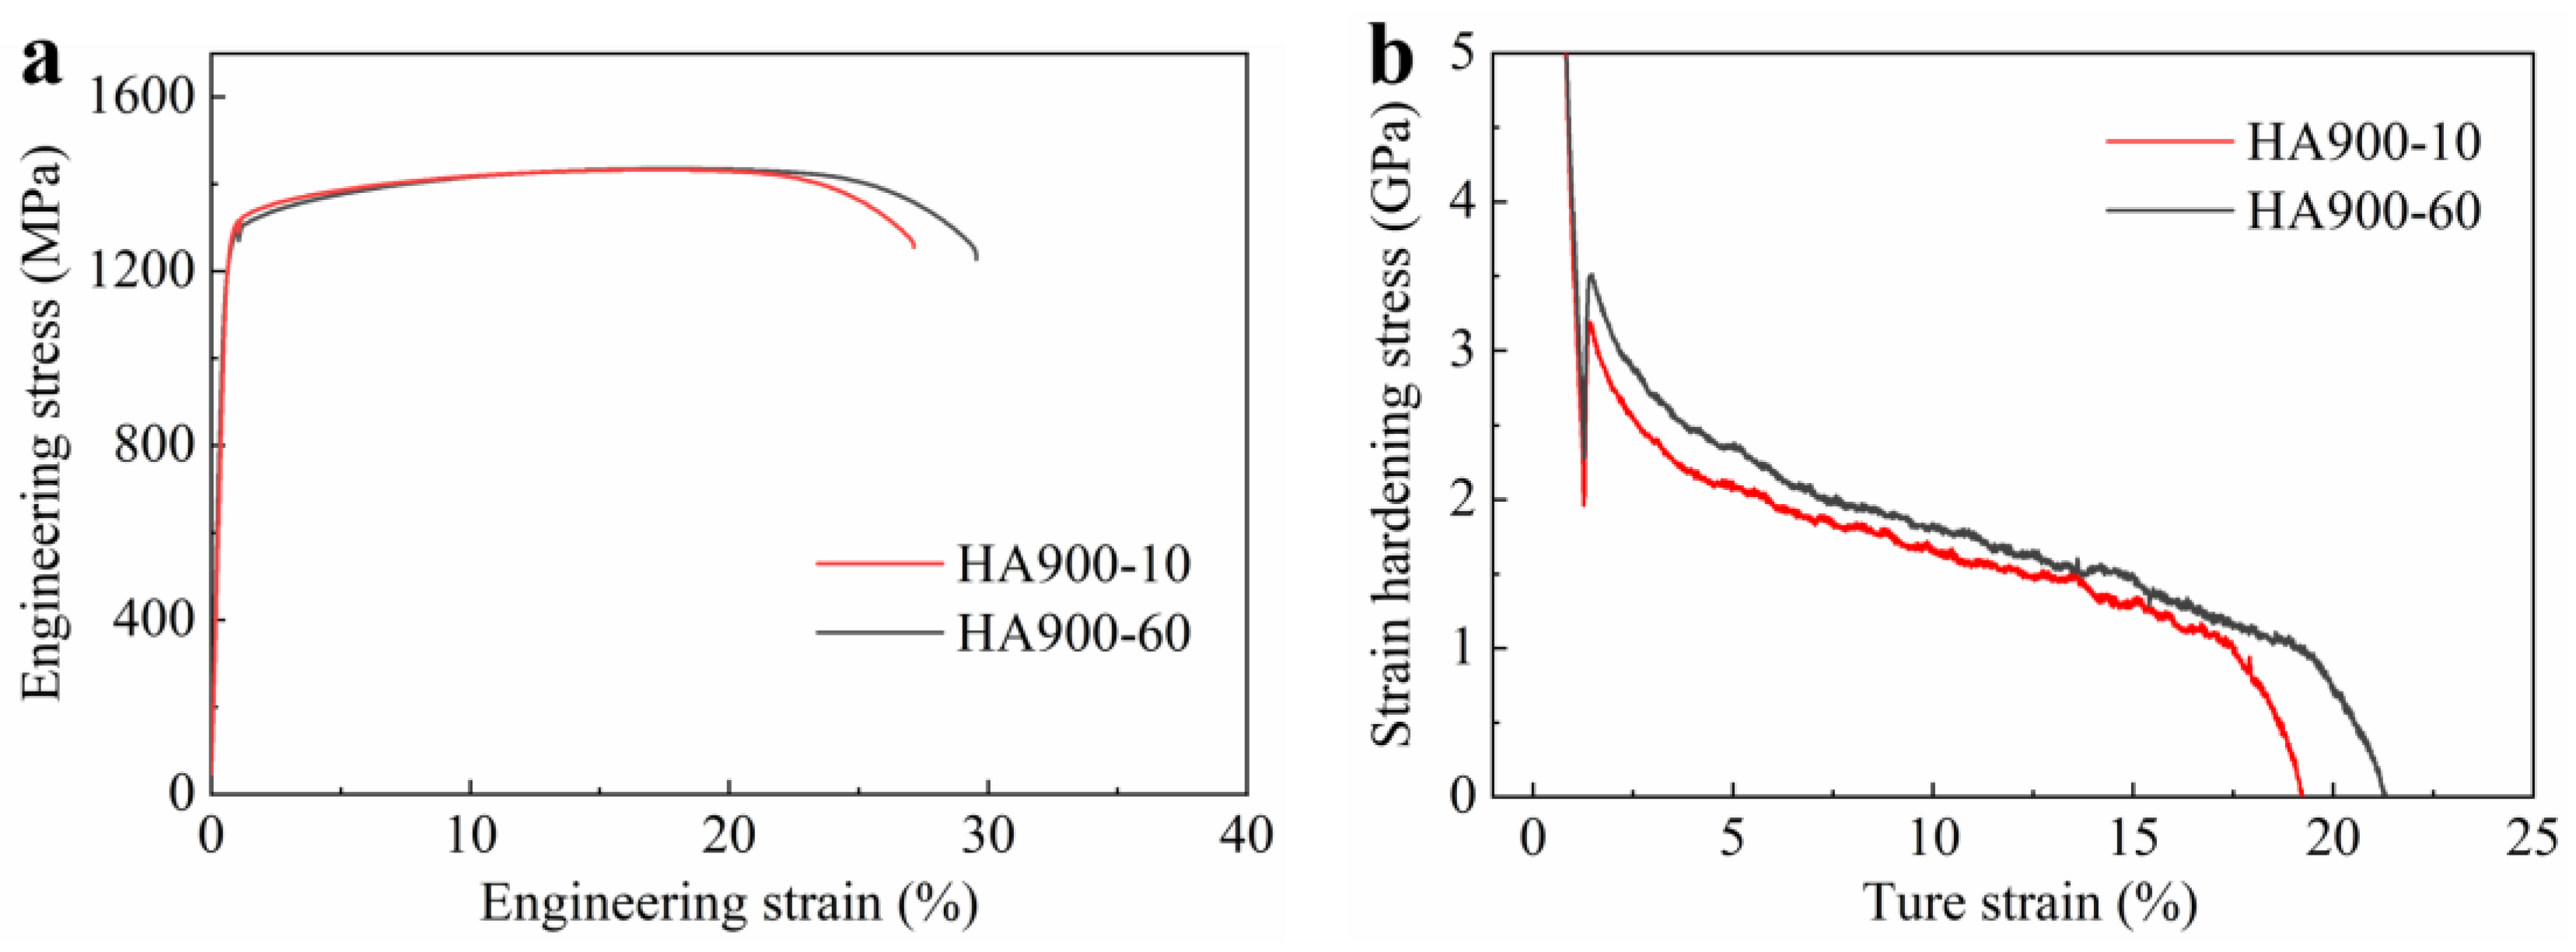
Figure 9.
Linear fitting of XRD data based on the Williamson-Hall method for calculating micro-strain and dislocation density.
Figure 9.
Linear fitting of XRD data based on the Williamson-Hall method for calculating micro-strain and dislocation density.
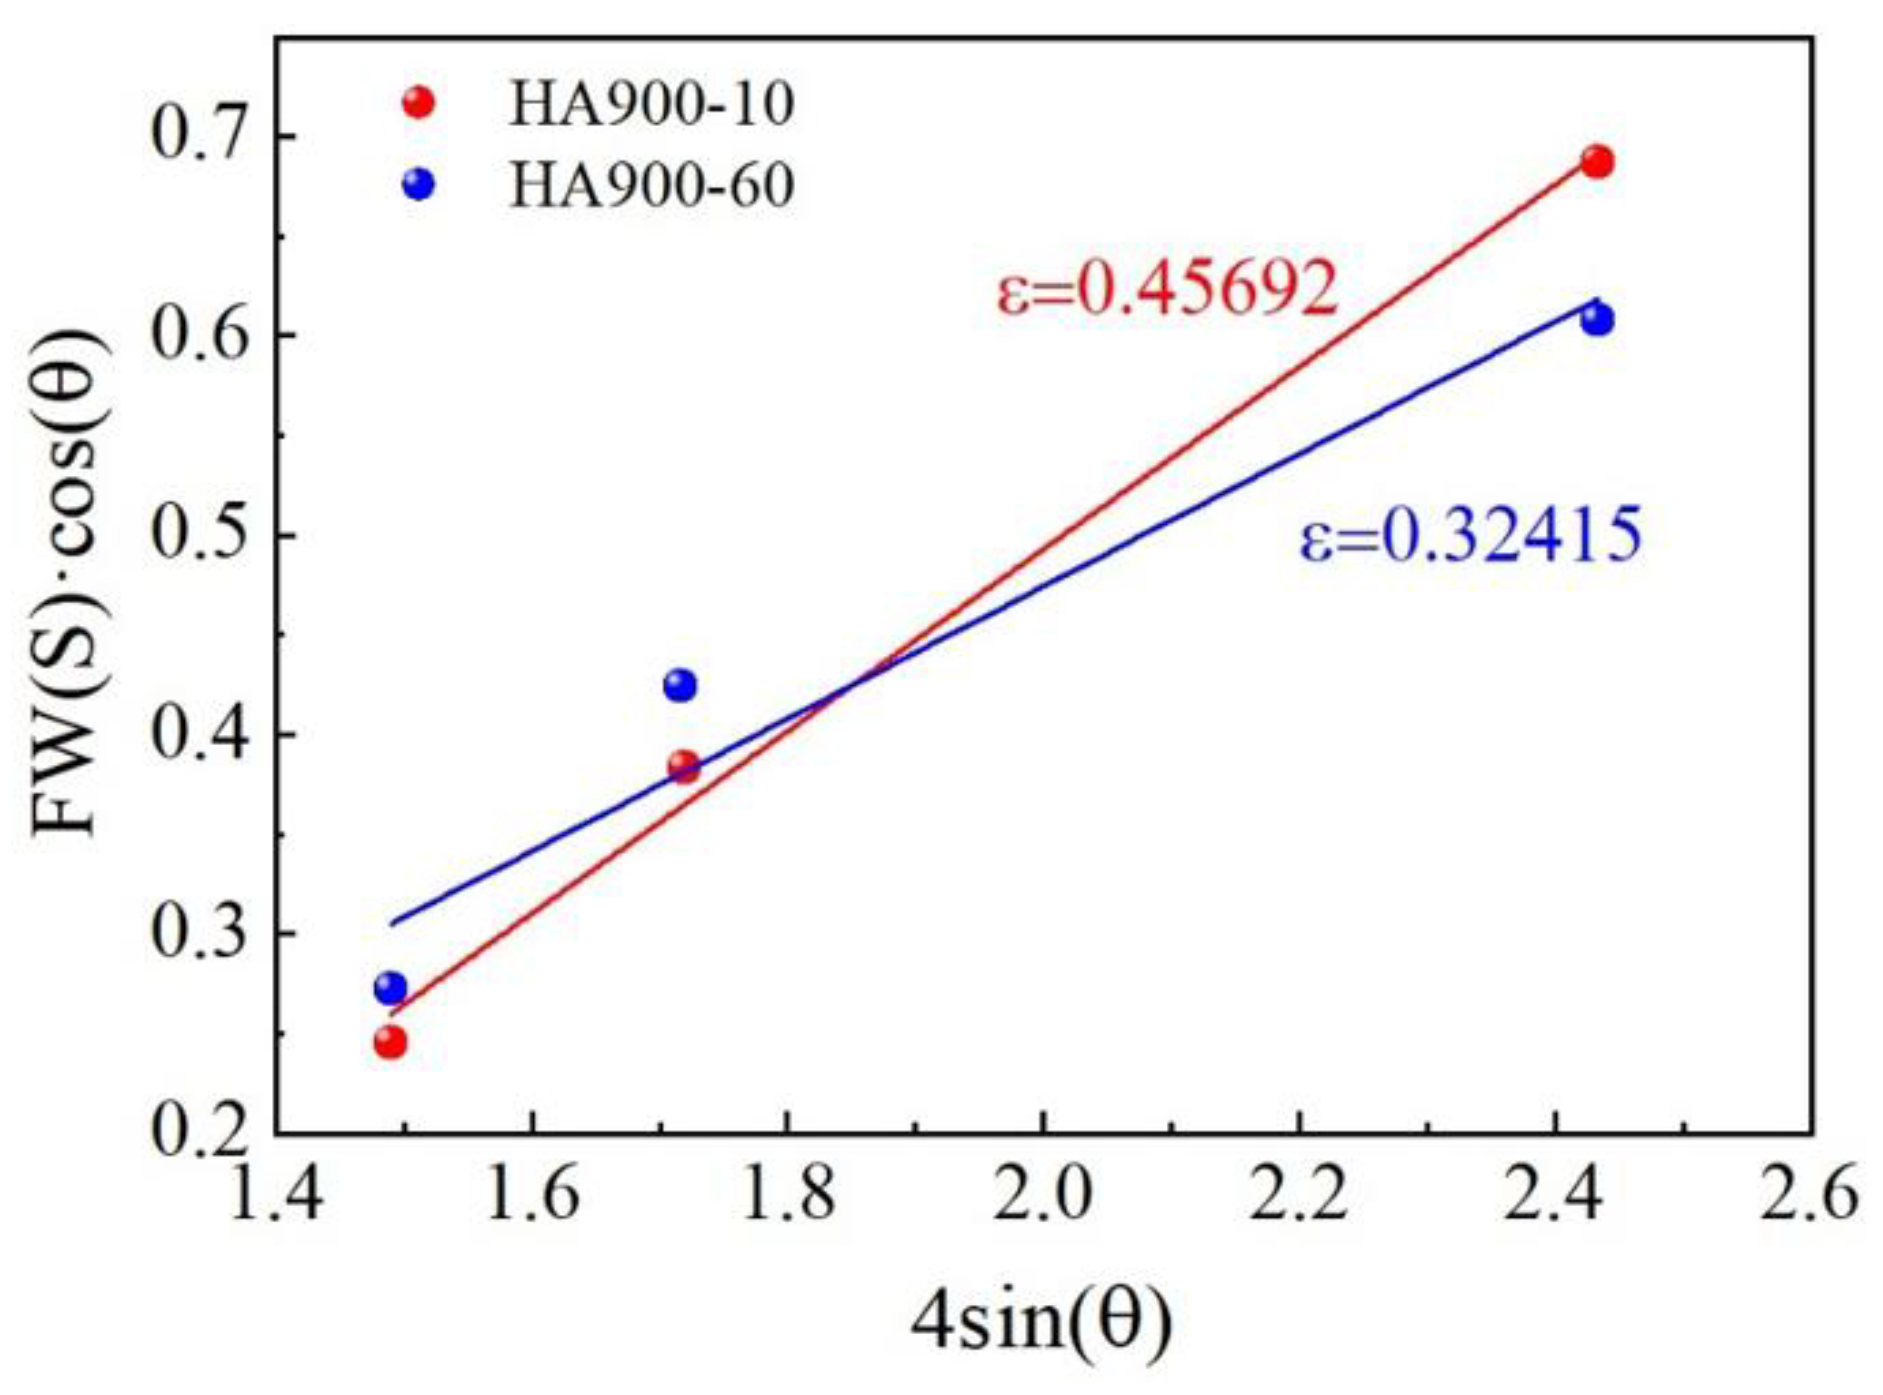
Figure 10.
Decomposition of room-temperature yield strength contributions for the HA900-10 and HA900-60 specimens.
Figure 10.
Decomposition of room-temperature yield strength contributions for the HA900-10 and HA900-60 specimens.
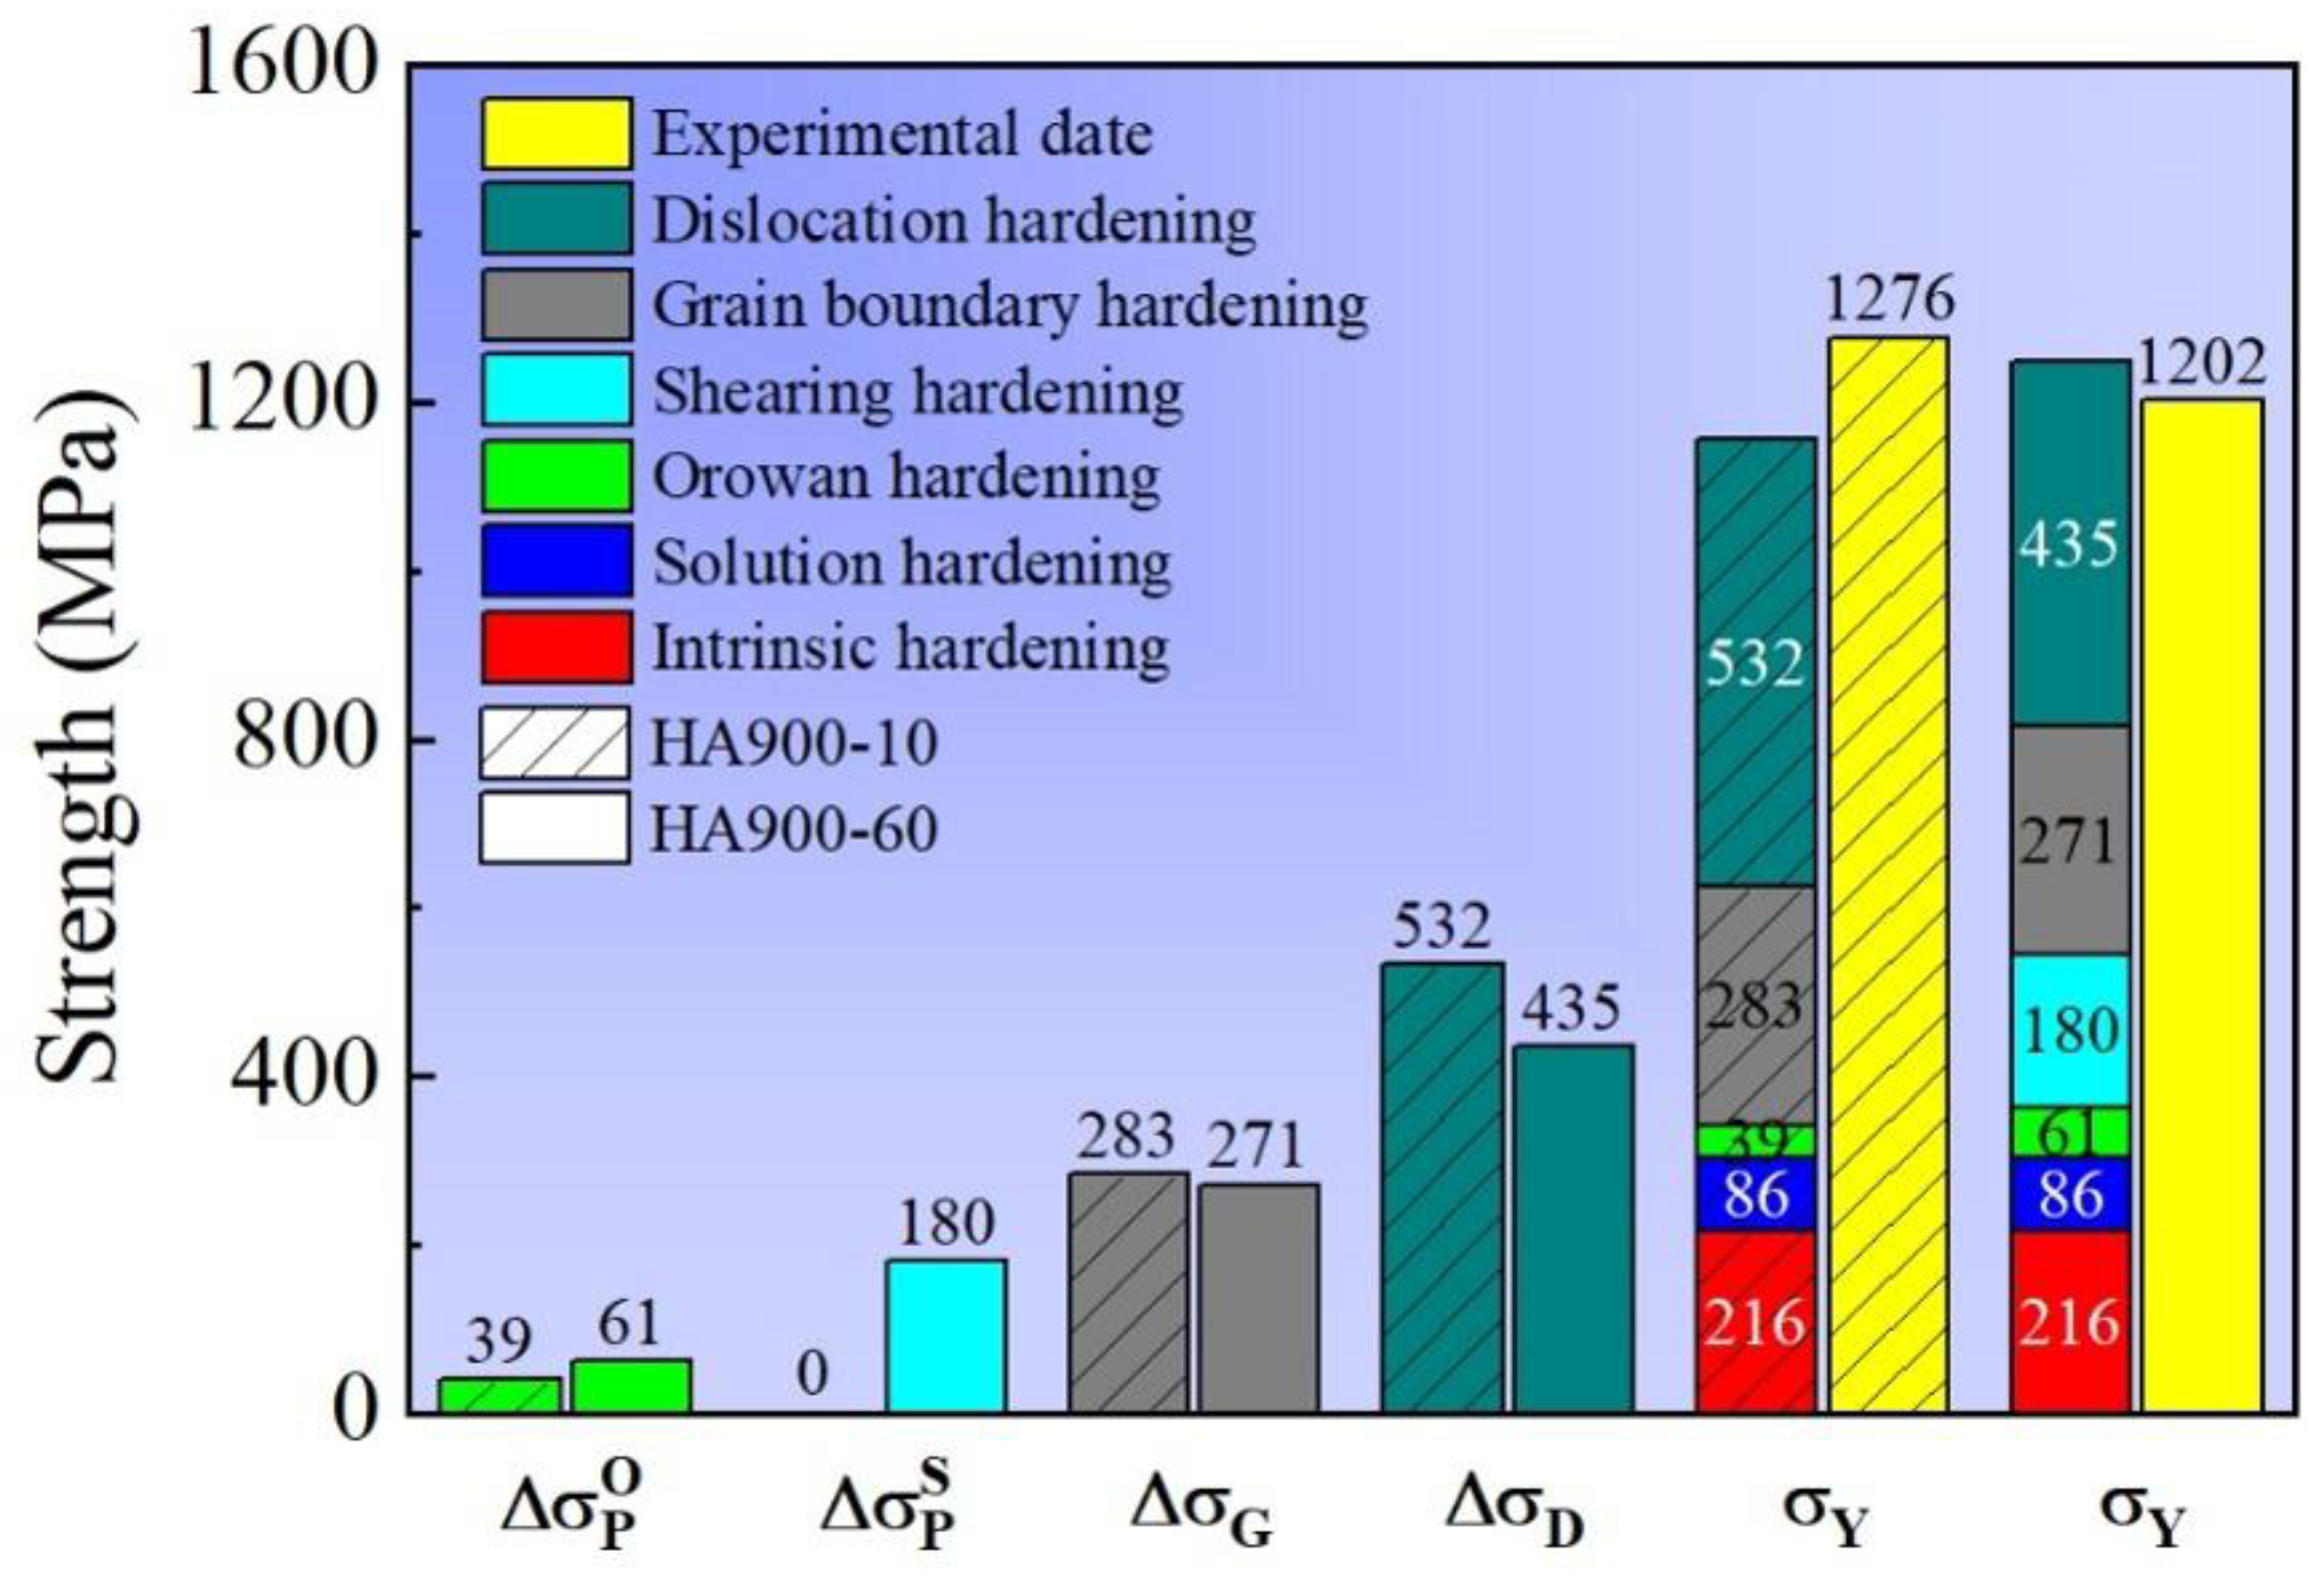
Figure 11.
TEM micrographs of the HA900-10 specimen after room-temperature tensile deformation: (a) Planar slip features in a low-strain region; (b) High-density dislocation walls in a high-strain region; (c) Bright-field image showing deformation-induced stacking faults and the corresponding diffraction pattern; (d) Dark-field image of a stacking fault region and an HRTEM image showing stacking fault bundles.
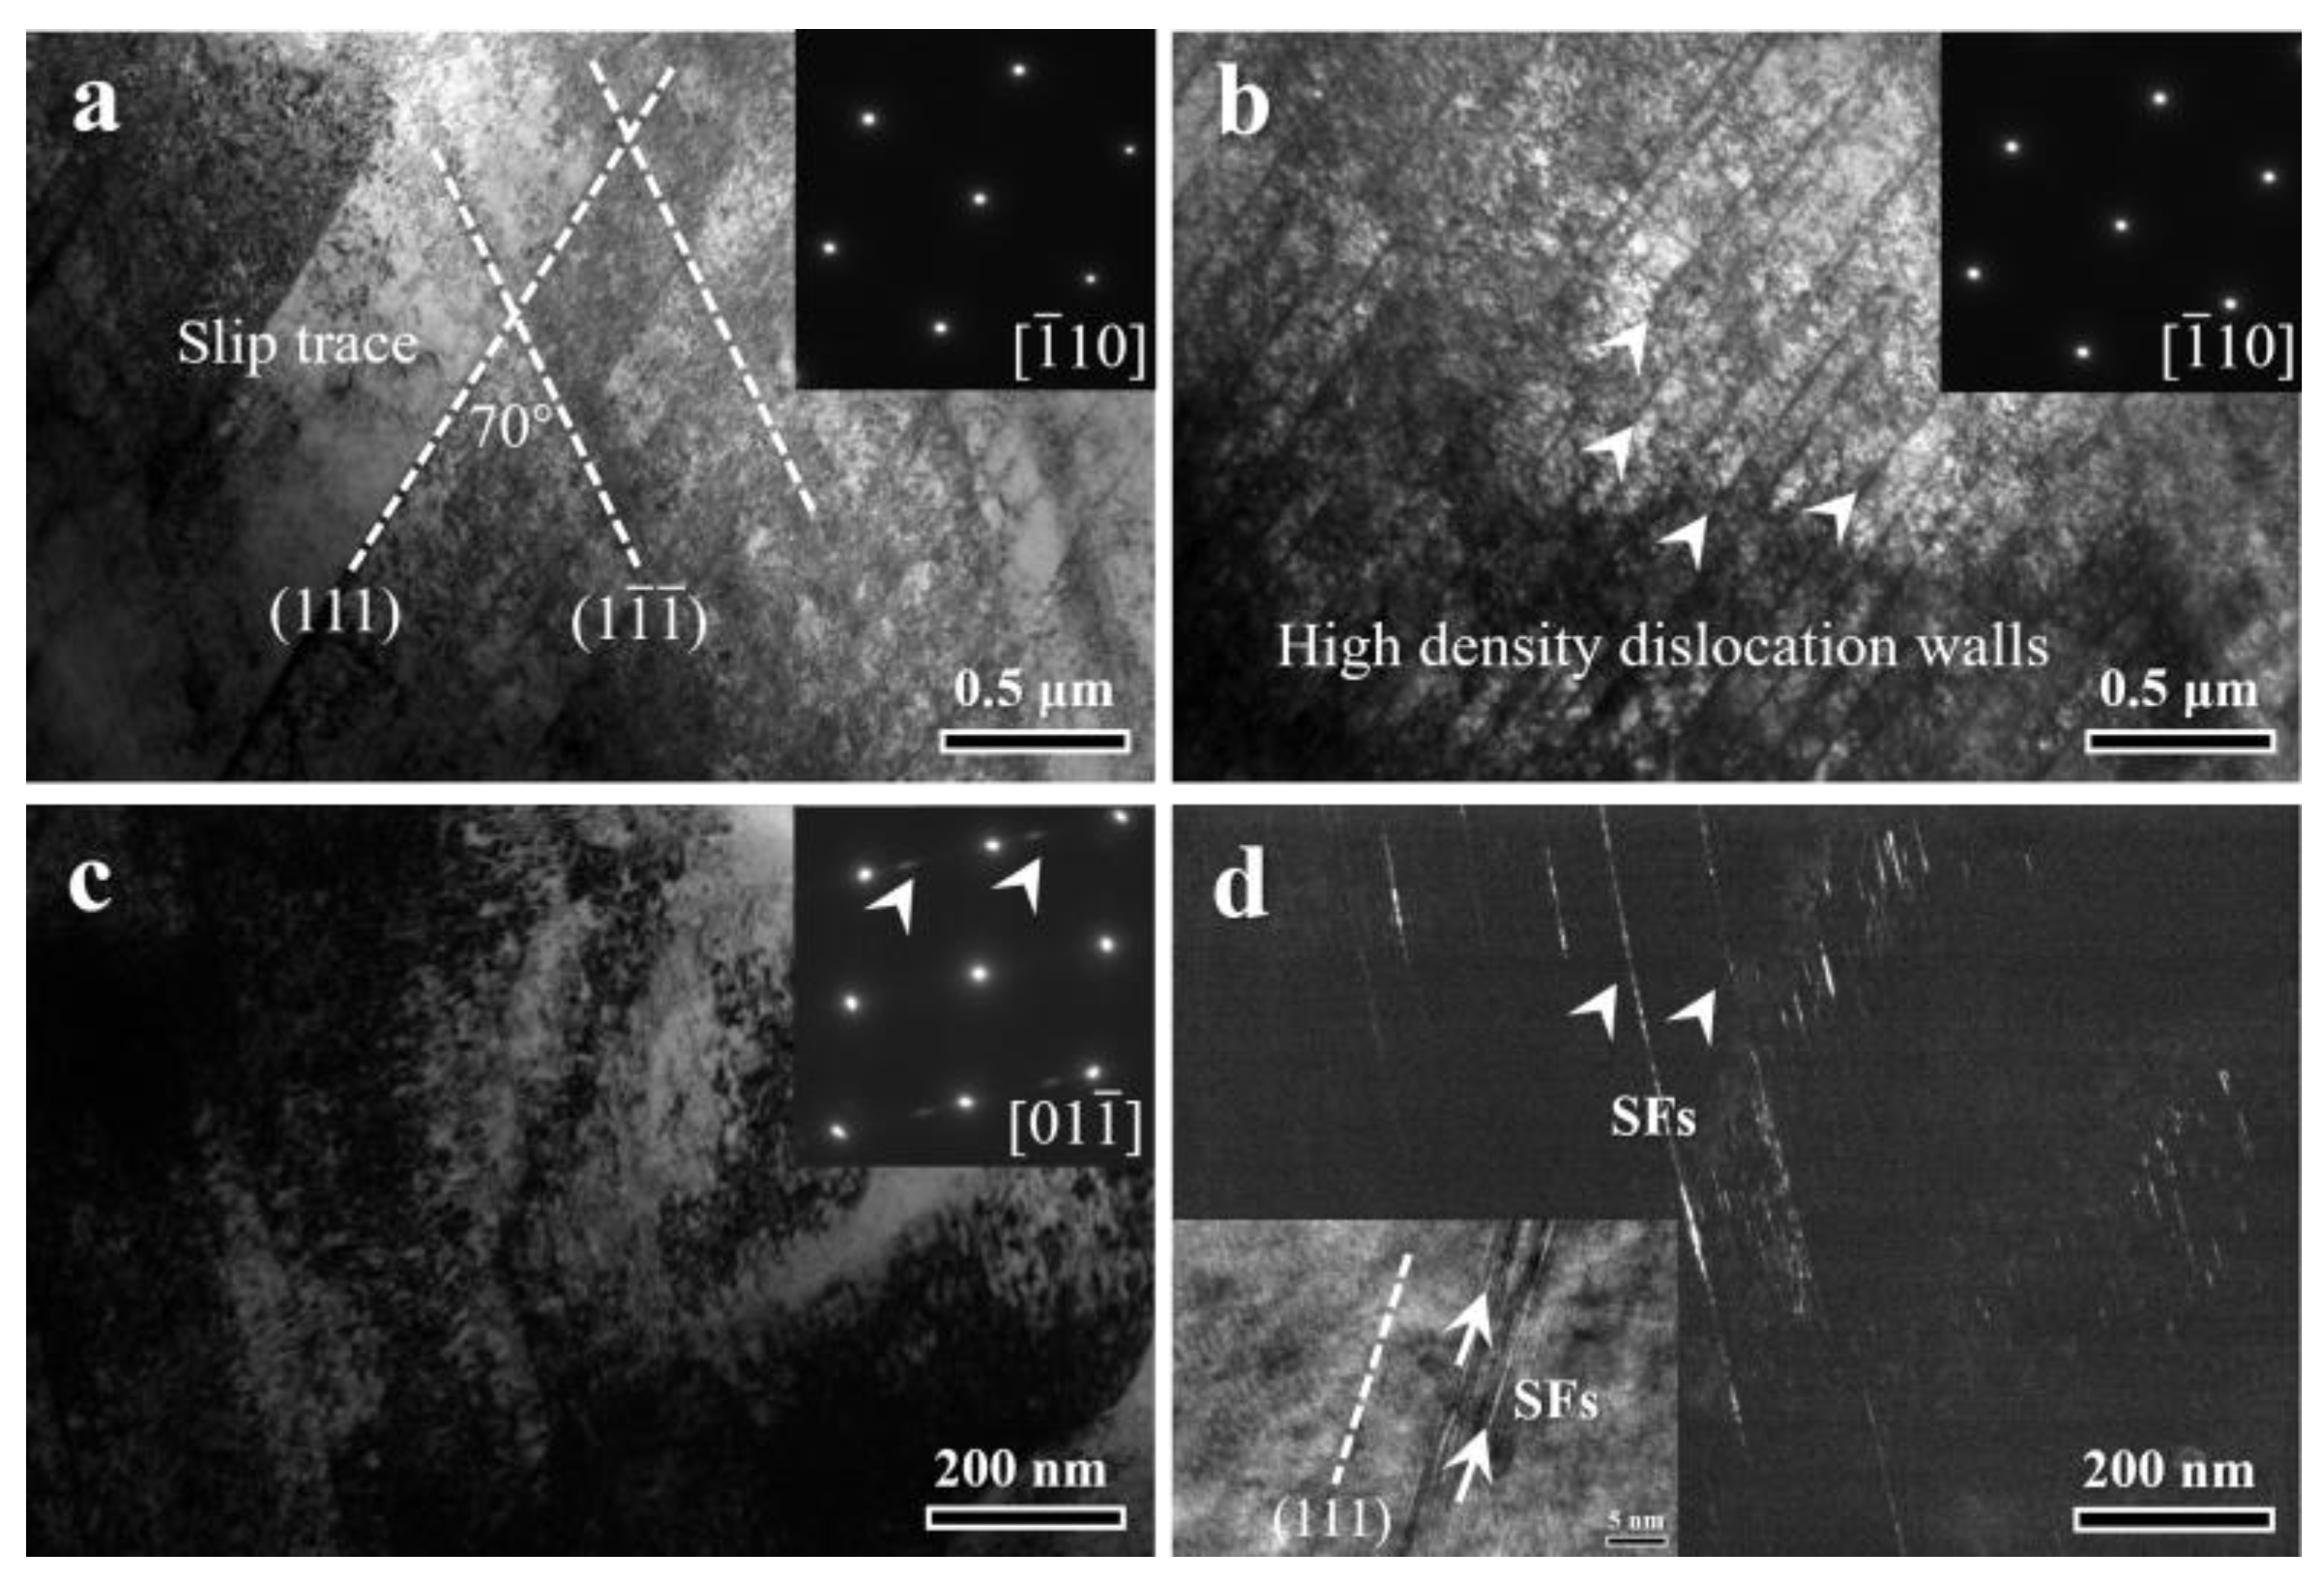

Table 1.
Volume fractions and average particle sizes of precipitates in the HA900-10 sample.
| Precipitates | Volume fraction (%) | Average particle size (nm) |
| M23C6+Intergranular γ′ | 0.21±0.02 | 101±2.68 |
| MC | 0.17±0.01 | 313±4.11 |
Table 2.
Volume fractions and average particle sizes of precipitates in the HA900-60 sample.
| Precipitates | Volume fraction (%) | Average particle size (nm) |
| M23C6+Intergranular γ′ | 1.14±0.09 | 148±2.94 |
| MC | 0.24±0.02 | 316±4.25 |
| Intragranular γ′ | 3.8±0.7 | 18±0.5 |
Disclaimer/Publisher’s Note: The statements, opinions and data contained in all publications are solely those of the individual author(s) and contributor(s) and not of MDPI and/or the editor(s). MDPI and/or the editor(s) disclaim responsibility for any injury to people or property resulting from any ideas, methods, instructions or products referred to in the content. |
© 2026 by the authors. Licensee MDPI, Basel, Switzerland. This article is an open access article distributed under the terms and conditions of the Creative Commons Attribution (CC BY) license.
Copyright: This open access article is published under a Creative Commons CC BY 4.0 license, which permit the free download, distribution, and reuse, provided that the author and preprint are cited in any reuse.


