
Submitted:
03 February 2026
Posted:
04 February 2026
You are already at the latest version
Abstract
Topic modeling plays an essential role in extracting latent structures from large text corpora. The choice of model and the number of topics which can strongly influence the performance and interpretability of the outcomes. In this work, I compare three widely used models in topic modeling: Latent Dirichlet Allocation, Non-Negative Matrix Factorization, and Bidirectional Encoder Representations from Transformers. The outcomes of the models are studied using Entropy, Jaccard similarity, Coherence, and Silhouette over a wide number of topics. The results show that NMF consistently produces the most interpretable and distinct topics, achieving the highest coherence score, with optimal performance observed at k = 15. LDA yields broader and less coherent topics. In contrast, BERT-based clustering shows low Silhouette scores, indicating weak cluster separation.
Keywords:
NMF
; LDA
; BERT-based topic modeling
; coherence
; entropy
; jaccard similarity
; silhouette scores
I. Introduction
Natural language processing (NLP) provides many useful applications for humankind and its world-wide applications are undeniable. The methods of NLP are used in many industries to improve the efficiency as well as reducing production costs.
Text summarization is a well-known application of NLP. The final product contains important information from the whole documents and does not lose the crucial messages. Number of documents is from one up to millions of millions of documents and reading the whole batch of documents is very time consuming. With the help of NLP, readers can easily grasp the whole messages of the documents without going into every detail of the text. This can significantly replace the manual text summarization process.
To start this process, different strategies have been taken and one strategy in NLP is to break down documents into smaller pieces and convert them into numbers. The collection of documents which is commonly the source of information is called a corpus. Each document has many sentences, which each sentence includes N number of words. The word itself is the basic unit of discrete data. The computer language is through the numbers therefore, texts are converted into numbers.
Often the documents don’t fall into the same categories or the same domain of knowledge. A common approach to classify the documents is topic modeling. This approach is an unsupervised learning technique, and it does not require training (Sandhiya, Boopika et al. 2022). There are different models used in topic modeling, such as Latent Dirichlet Allocation (LDA) model, Bidirectional Encoder Representations from Transformers (BERT) and Non-Negative Matrix Factorization (NMF). In this work, the models’ performance is compared via Jaccard similarity, Silhouette score, Entropy score, and Coherence score, and analyzed to understand which one has better interpretability over different topics the documents.
II. LDA Model
Latent Dirichlet Allocation (LDA) considers the distribution of words in latent topics over the documents. In this model the sparsity of the topic and the word distributions are controlled by the two parameters, α and β, given the fact that high α value is the indication of wide range of topics and high value of β presents the wide distribution of words. For example, low α value means there are fewer topics within the documents. A simple representation of LDA model is shown in Figure 1.
In Figure 1, Theta is a K-dimensional Dirichlet vector which presents the topic distribution for a document. w presents a word in the document in the assigned topic Z. The important assumption in the LDA model is the exchangeability of documents such that the order of each document doesn’t affect the joint probability distribution in the process, which is written as,
where d presents the document and n the document number. In the equation above the order of nth and the first document doesn’t change the probability distribution thus equation 1 is written in a general format as,
Words themselves don’t carry any meaning unless they are used to create a sentence and eventually topics. It is essential to know if the suggested topic carries meaning or in the other words they can be interpreted as human language. To validate the meaning of topics, we need to measure the coherence of each topic. The coherence score can tell us how important the topics are. Also, the coherence score can tell us whether the chosen words by the model can deliver the context of the data. To measure the coherence, the frequency of words in a topic should be measured within a defined window of words in the text, and even the likelihood of two words appearing together.
Pointwise mutual information (PMI) is introduced to measure the likelihood of appearing pair of words. The PMI can be measure using equation below
where are the probability of w i and w j words, respectively, and P(w i, w j) is the joint probability of both words occurring together (Newman, Bonilla et al. 2011).
The PMI can have high values for low joint probabilities because those words do not carry meanings together, therefore it is essential to normalize the PMI value and subsequently it is calculated by
where NPMI (w i, w j) is the normalized PMI. NPMI helps to interpret the PMI scores reliably and eases the comparisons for different topic (Syed and Spruit 2017). This score is computed over the pairs of words for all words w 1, w 2, ..., w n, the average coherence score is computed, and it is called coherence. Coherence for all pairs of words in the topic is
In the equation above N t is the number of words in a topic and the two sums go over all the pairs of words (w i, w j). To evaluate model performance in predicting the words (or the sequence of words), we need to measure the perplexity (P) as
which gives the total number of words in the document and is the probability of word wi given the previous words wi-1, ..., wi-n+1 (Chebil, Jallouli et al. 2021). Although, perplexity score helps us to measure the probability of finding the next word but itself alone is not enough to evaluate the model and other metrics such as entropy is essential to validate the interpretability of generated topics.
Documents have a single topic or multiple topics. If a topic is well oriented around a specific subject this implies that this topic has a lower entropy, whereas one that has a mixture of words is less focused on a specific matter. Predicting the words in the document has uncertainty, and entropy is the measure of that uncertainty. We can define the entropy of each word within each topic as
In equation (7) w is the word in set of words (W) and Z is the topic. Higher (lower) the entropy means more (less) words have the similar probabilities. Entropy is smaller in higher concentration of distributions, which is an indication of fewer words in a topic.
III. NMF Model
Non-Negative Matrix Factorization (NMF) is a matrix composition technique, which is widely used in NLP for topic modeling, text clustering, dimensionality reduction, etc. NMF is also used in facial recognition (Lee and Seung 1999), and in complex network analysis to understand public opinion to interactions between protein molecules (Fortunato 2010).
NMF is explained by the matrix structure V WH, where V is the non-negative matrix, W is non-negative matrix factors, and H contains the coefficients that reconstruct (V). The V matrix has n×m dimensions, which n is the n-dimensional data vectors, and m is the number of examples in the data set (Lee and Seung 2000). Using appropriate algorithms such as cost function, the values of W or H are calculated and updated in each of iterations.
IV. BERT Model
Bidirectional Encoder Representations from Transformers (BERT) was introduced by Jacob Delvlin and et all in 2019. The foundation of this model benefits from masked language model (MLM) pretraining objective, and benefiting from the left-to-right, a right-to-left language models (Devlin, Chang et al. 2019). There are two main steps in BERT model: pre-training and fine-tuning. In Pre-training the model uses unlabeled data over pre-training tasks and in fine-tunning, computes over pre-trained parameters, and all the parameters are fine-tuned using labeled data.
Given that documents have different topics, and each topic carries information and shares similar words, word distribution within topics tells us how similar or dissimilar the topics are. To measure this similarity, there are two common approaches that one can take to find the similarities between the topics: Jaccard Similarity score and Silhouette score which are discussed in the following sections.
V. Jaccard Similarity
Jaccard similarity is calculated by Equation 8. It is measured between two topics Z 1 and Z2,
where in this equation repsentes the intersection of the two topics, while Z1 Z2 shows the union of the two topics, meaning the set of all unique elements that are in Z1 or Z2 (Hajiveiseh, Seyedi et al. 2024).
VI. Silhouette Score
The Silhouette score is measured based on document topic distributions, and their distances within the topic space. The higher the Silhouette score, the more it indicates that documents are clustered and more cohesive. This score is calculated by taking the average similarities of any term-document pair in the topics. For pair topics (Zi, Zj), the average similarities are defined as a(i) and b(j) and by using
which Silhouette score s (i) is calculated. The value of s(i) lies between –1 to +1; if s (i) = –1, it means the topic distribution is misclassified, and +1 is classified appropriately (Rousseeuw 1987).
So far, different metrics in evaluating the models are discussed. It is also crucial to know how well the model fits the data. The Log-Likelihood is an approach for this purpose. Higher values of log-likelihood indicate the better the model fits the data. In NLP, this metric can be defined as calculating the probability of observed words (w1, ..., wN) in a distribution of a topic (Zi) and its word distribution . In this equation L is the log-likelihood (Blei, Ng et al. 2003). The used metrics are defined within LDA model above. In this work the LDA, NMF, and BERT models are compared by different metrics such as Jaccard similarity and Silhouette scores, which are discussed in the subsequent sections.
VII. Dataset
To validate the models’ performance, the fetch_20newsgroups from Scikit-learn library is used. This dataset has twenty distinct newsgroups topics for text classification and it is suitable for text classification and topic-modeling studies. The document distribution per topic in this dataset is shown in in Figure 2-a. The top four document distribution corresponds to hocky, and baseball in the sports category; Christianity in the religion category, and finally motorcycle in the recreation category. The number of words per documents are mostly below 1000 words (Figure 2-b)
VIII. Experimental Setup
A. Data Process
The used dataset is discussed in Section Dataset. To incorporate the dataset into the models, the data must first be processed. The text content of documents is extracted, converted to lowercase, and tokenized by splitting the words. All the tokens are checked to ensure they are alphabetic and that characters are not a stopwords. After this cleaning process, the resulting tokens are stored as a list. As the clean texts are obtained, they are implemented in models to evaluate their performances. This process is demonstrated in Figure 3.
Two vector presentations are utilized for the topic modeling. The term frequency-inverse document frequency (TF-IDF) weighting in the Non-negative Matrix Factorization (NMF) is adopted and for Latent Dirichlet Allocation (LDA), the bag of words count is presented. In both vector presentations, vocabularies are restricted to 5000 most frequent unigrams in the corpus.
B. Setup of the Models
In all models the number of topics is set as , and the random seed is fixed to forty-two to ensure the reproducibility. The NMF model, and LDA model rely on TF-IDF, and bag-of-words document term matrices, respectively, with LDA using batch variational inference to extract latent topics. In the NMF model, the NNDSVa method to improve the model convergence stability, and optimize them for maximum 500 iterations. For The BERT model, the embedded documents are generated using the pretrained Sentence-BERT model all-MiniLM-L6-v2, which produces three hundred and eighty-four dimensional sentence embeddings. I cluster the embeddings using the K-Means using the k-means++ and run it with ten random initializations.
IX. Evaluation Metrics
To understand the topic quality of NMF and LDA, the topic coherence is measured using the c_v coherence in Gensim. Topic concentration within document is computed through the average topic entropy. Topic overlap is measured using the average pairwise Jaccard similarity between the top ten words to compute the topic distinctiveness. Silhouette score is evaluated in the embedding space with Euclidean distance in the BERT-based clustering to assess clustering quality. The Silhouette score is discussed in section 6.
X. Results
I evaluate the three topic modeling approaches: NMF, LDA, and BERT-based clustering over the range topic numbers on the fetch_20newsgroups dataset. My analysis considers multiple metrics to evaluate the performances of models, including topic coherence, entropy, topic overlap, and Silhouette score.
Figure 4 illustrates the coherence score variation changing the number of topics, measured for NMF and LDA models. NMF model consistently produces the most coherent topics across the k values and it peaks at k = 15 with a value of 0.733. The peak indicates the semantically formation of clusters and each topic strongly co-occur. The coherence gradually declines above k >15 which shows the topic separation.
Measured entropy values are shown in Figure 5. Entropy increases with k, which is expected since topic probabilities distributed over larger number of topics. The topic overlap is low, particularly in NMF model, which indicates non-redundant topics. The LDA model has a L-bow shaped graph, where the topic overlap significantly decreases from 0.21 to 0.12 (k=15), as it is illustrated in Figure 6.
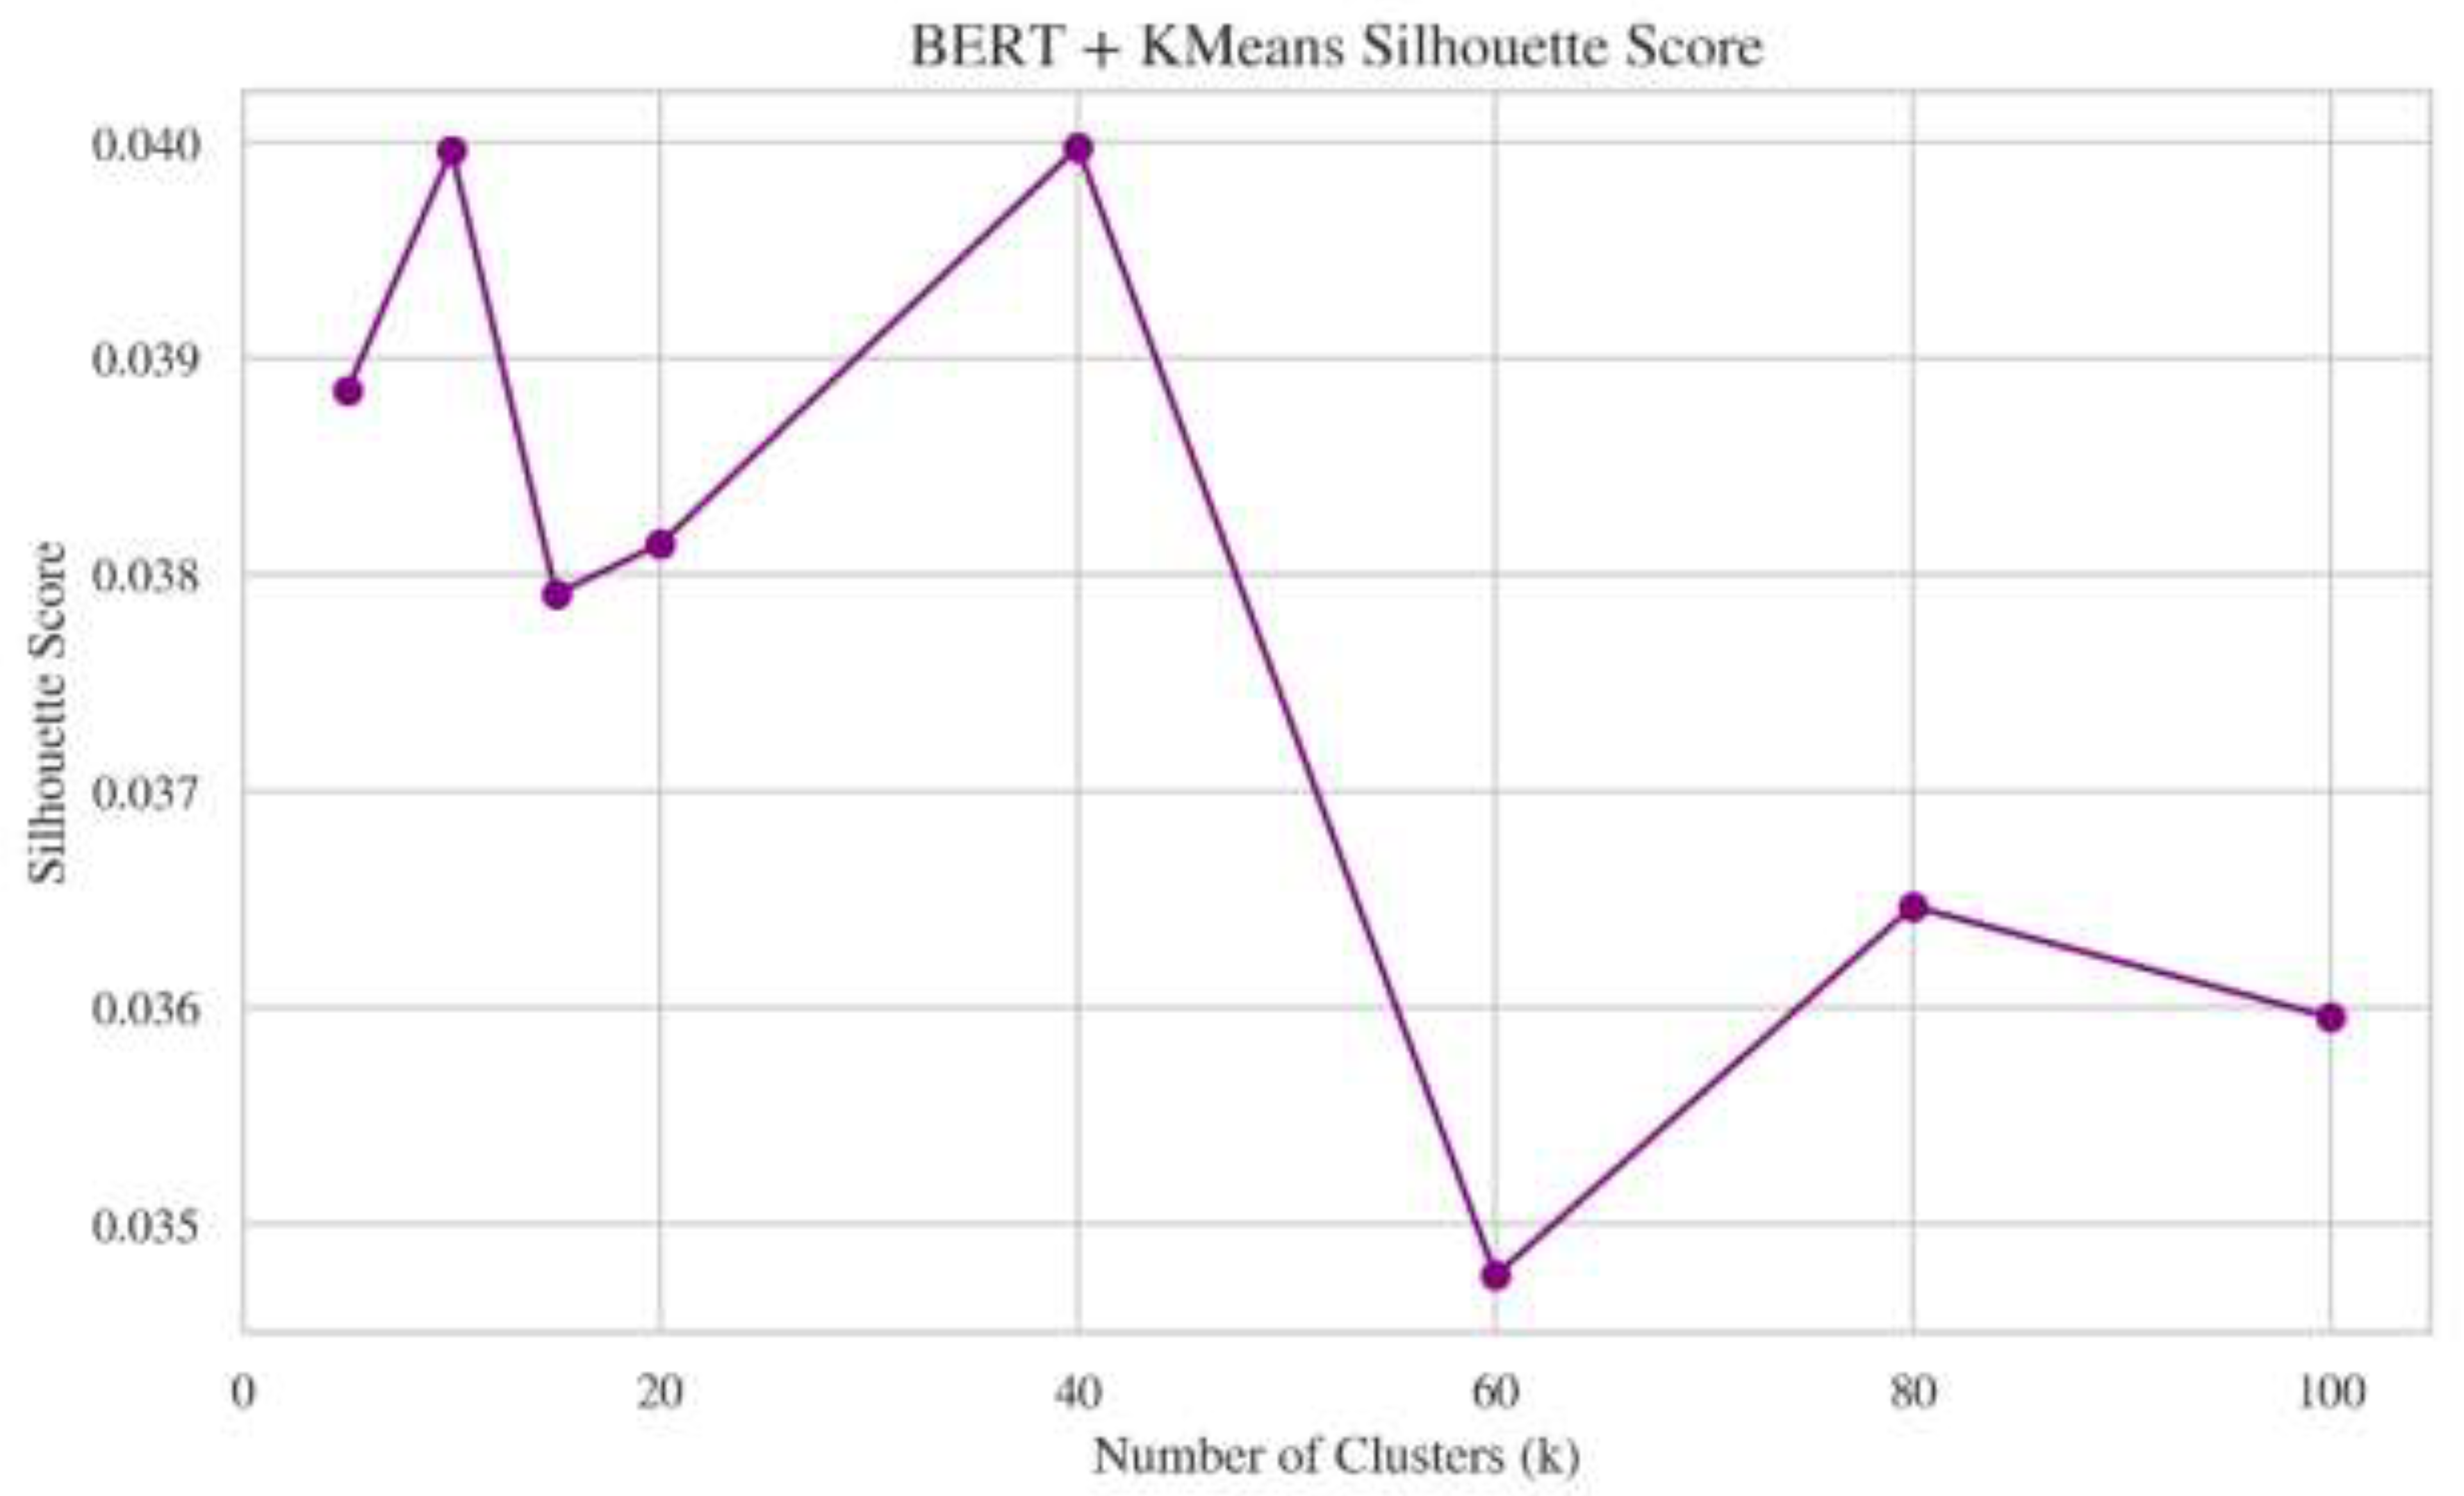
BERT embeddings clustered with K-Means display low silhouette scores, ranging from 0.036 to 0.040 across all values of k as shown in Figure 7. A low Silhouette score is the indication of the jammed or poorly separated clusters in the embedding space, although such representation may still be suitable for sematic similarity tasks rather than discrete topic discovery.
XI. Conclusion
In this work, three famous models in topic modeling are studied: NMF, LDA, and BERT modeling. Among these models the NMF with 15 number of topics, has the most effective topic modeling approach, balancing high coherence, low topic overlap, and moderate entropy. LDA provides acceptable but less effective model, particularly at higher k values, while BERT-based clustering does not yield interpretable topics.
References
- Blei, D. M.; et al. Latent dirichlet allocation. Journal of machine Learning research 2003, 3(Jan), 993–1022. [Google Scholar]
- Chebil, M.; et al. Topic modeling of marketing scientific papers: an experimental survey. In International Conference on Digital Economy; Springer, 2021. [Google Scholar]
- Devlin, J.; et al. Bert: Pre-training of deep bidirectional transformers for language understanding. In Proceedings of the 2019 conference of the North American chapter of the association for computational linguistics: human language technologies, 2019; volume 1. [Google Scholar]
- Fortunato, S. Community detection in graphs. Physics reports 2010, 486(3-5), 75–174. [Google Scholar] [CrossRef]
- Hajiveiseh, A.; et al. Deep asymmetric nonnegative matrix factorization for graph clustering. Pattern Recognition 2024, 148, 110179. [Google Scholar] [CrossRef]
- Lee, D.; Seung, H. S. Algorithms for non-negative matrix factorization. In Advances in neural information processing systems; 2000; p. 13. [Google Scholar]
- Lee, D. D.; Seung, H. S. Learning the parts of objects by non-negative matrix factorization. nature 1999, 401(6755), 788–791. [Google Scholar] [CrossRef] [PubMed]
- Newman, D.; et al. Improving topic coherence with regularized topic models. In Advances in neural information processing systems; 2011; p. 24. [Google Scholar]
- Rousseeuw, P. J. Silhouettes: a graphical aid to the interpretation and validation of cluster analysis. Journal of computational and applied mathematics 1987, 20, 53–65. [Google Scholar] [CrossRef]
- Sandhiya, R.; et al. A review of topic modeling and its application. In Handbook of Intelligent Computing and Optimization for Sustainable Development; 2022; pp. 305–322. [Google Scholar]
- Syed, S.; Spruit, M. Full-text or abstract? examining topic coherence scores using latent dirichlet allocation. 2017 IEEE International conference on data science and advanced analytics (DSAA), Ieee, 2017. [Google Scholar]
Figure 1.
Graphical model presentation of LDA model (Blei, Ng et al. 2003).
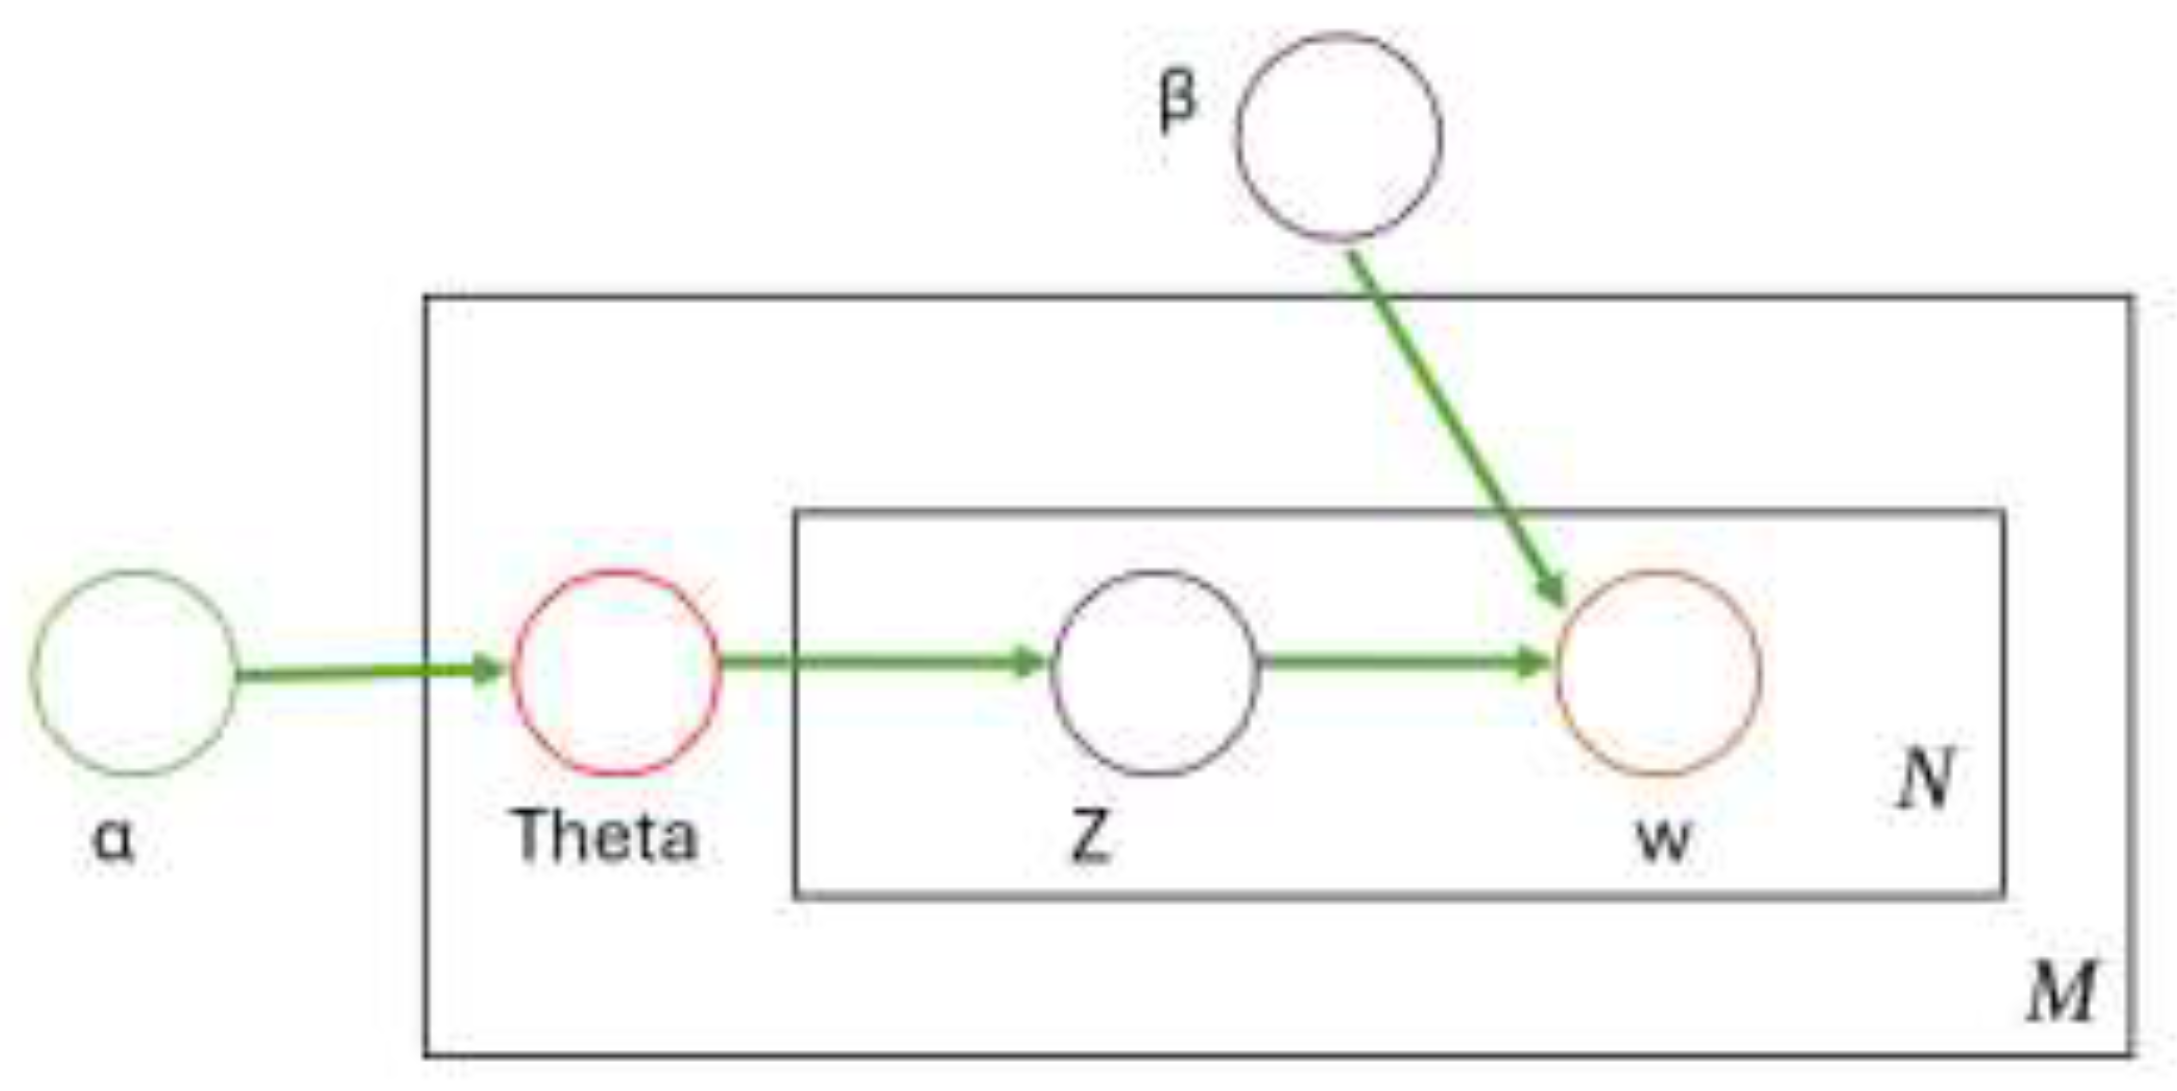
Figure 2.
(a) Number of documents per topics. (b) Distribution of words.
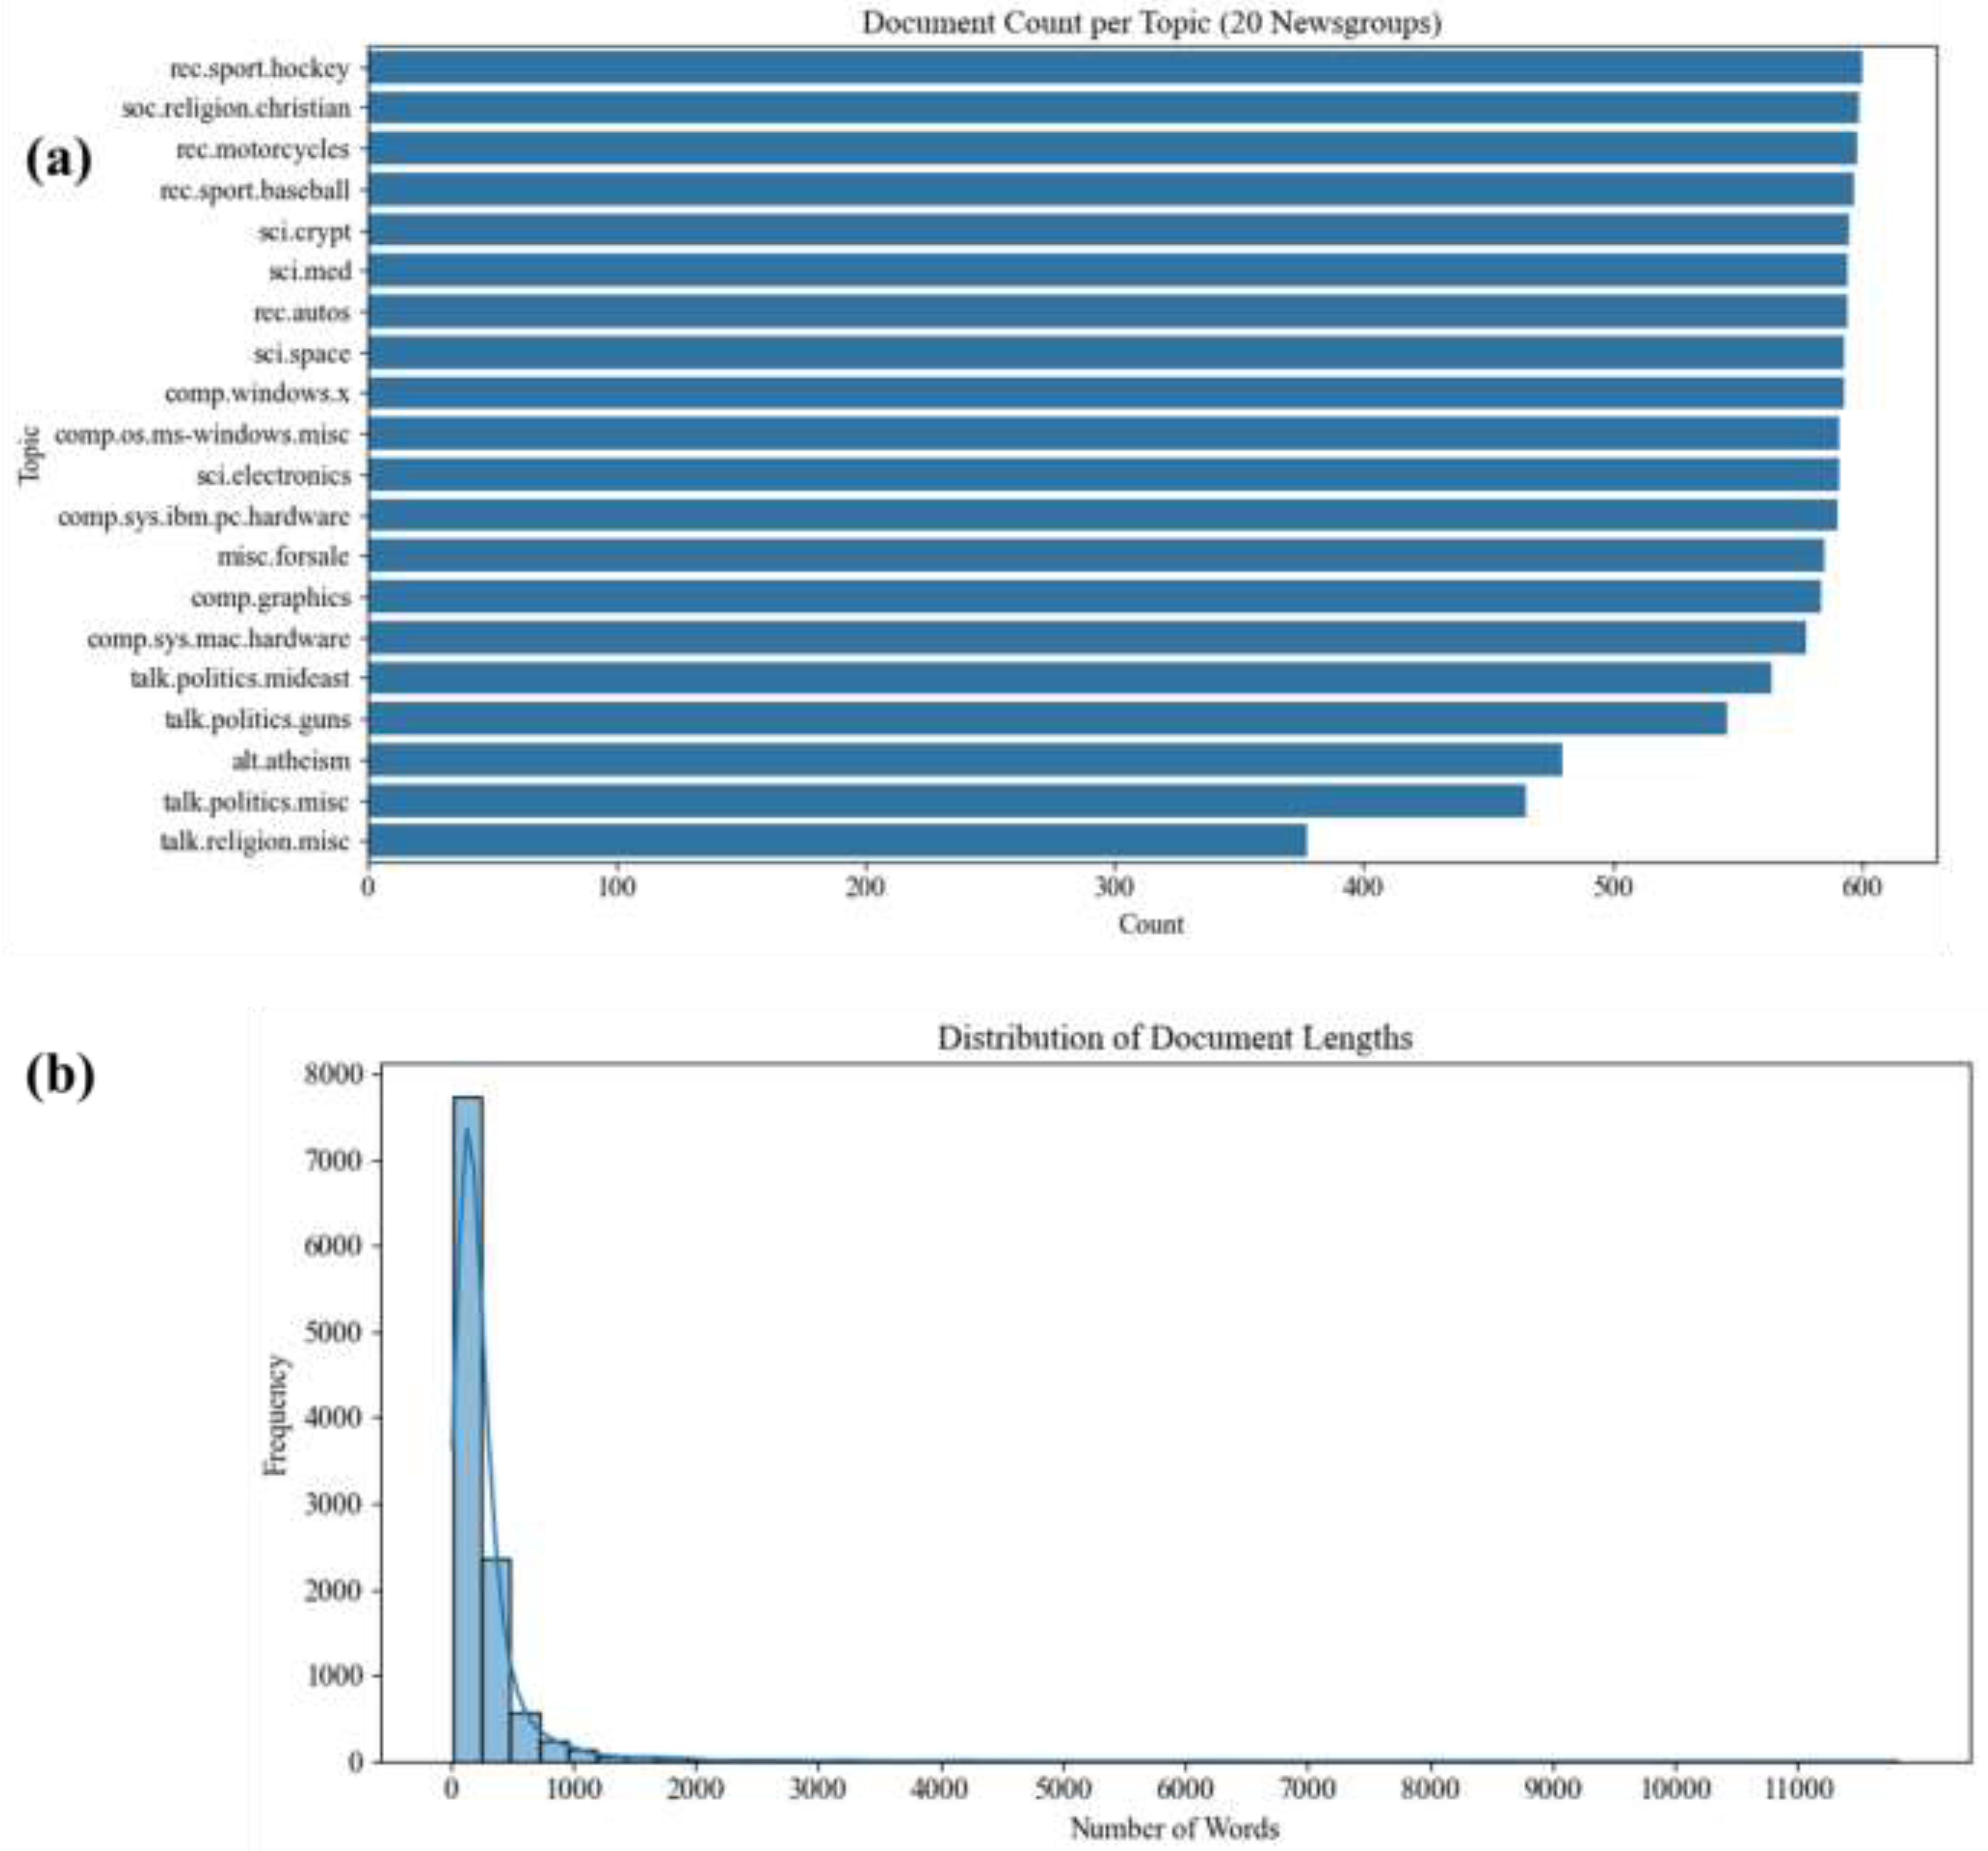
Figure 3.
Data pipeline.
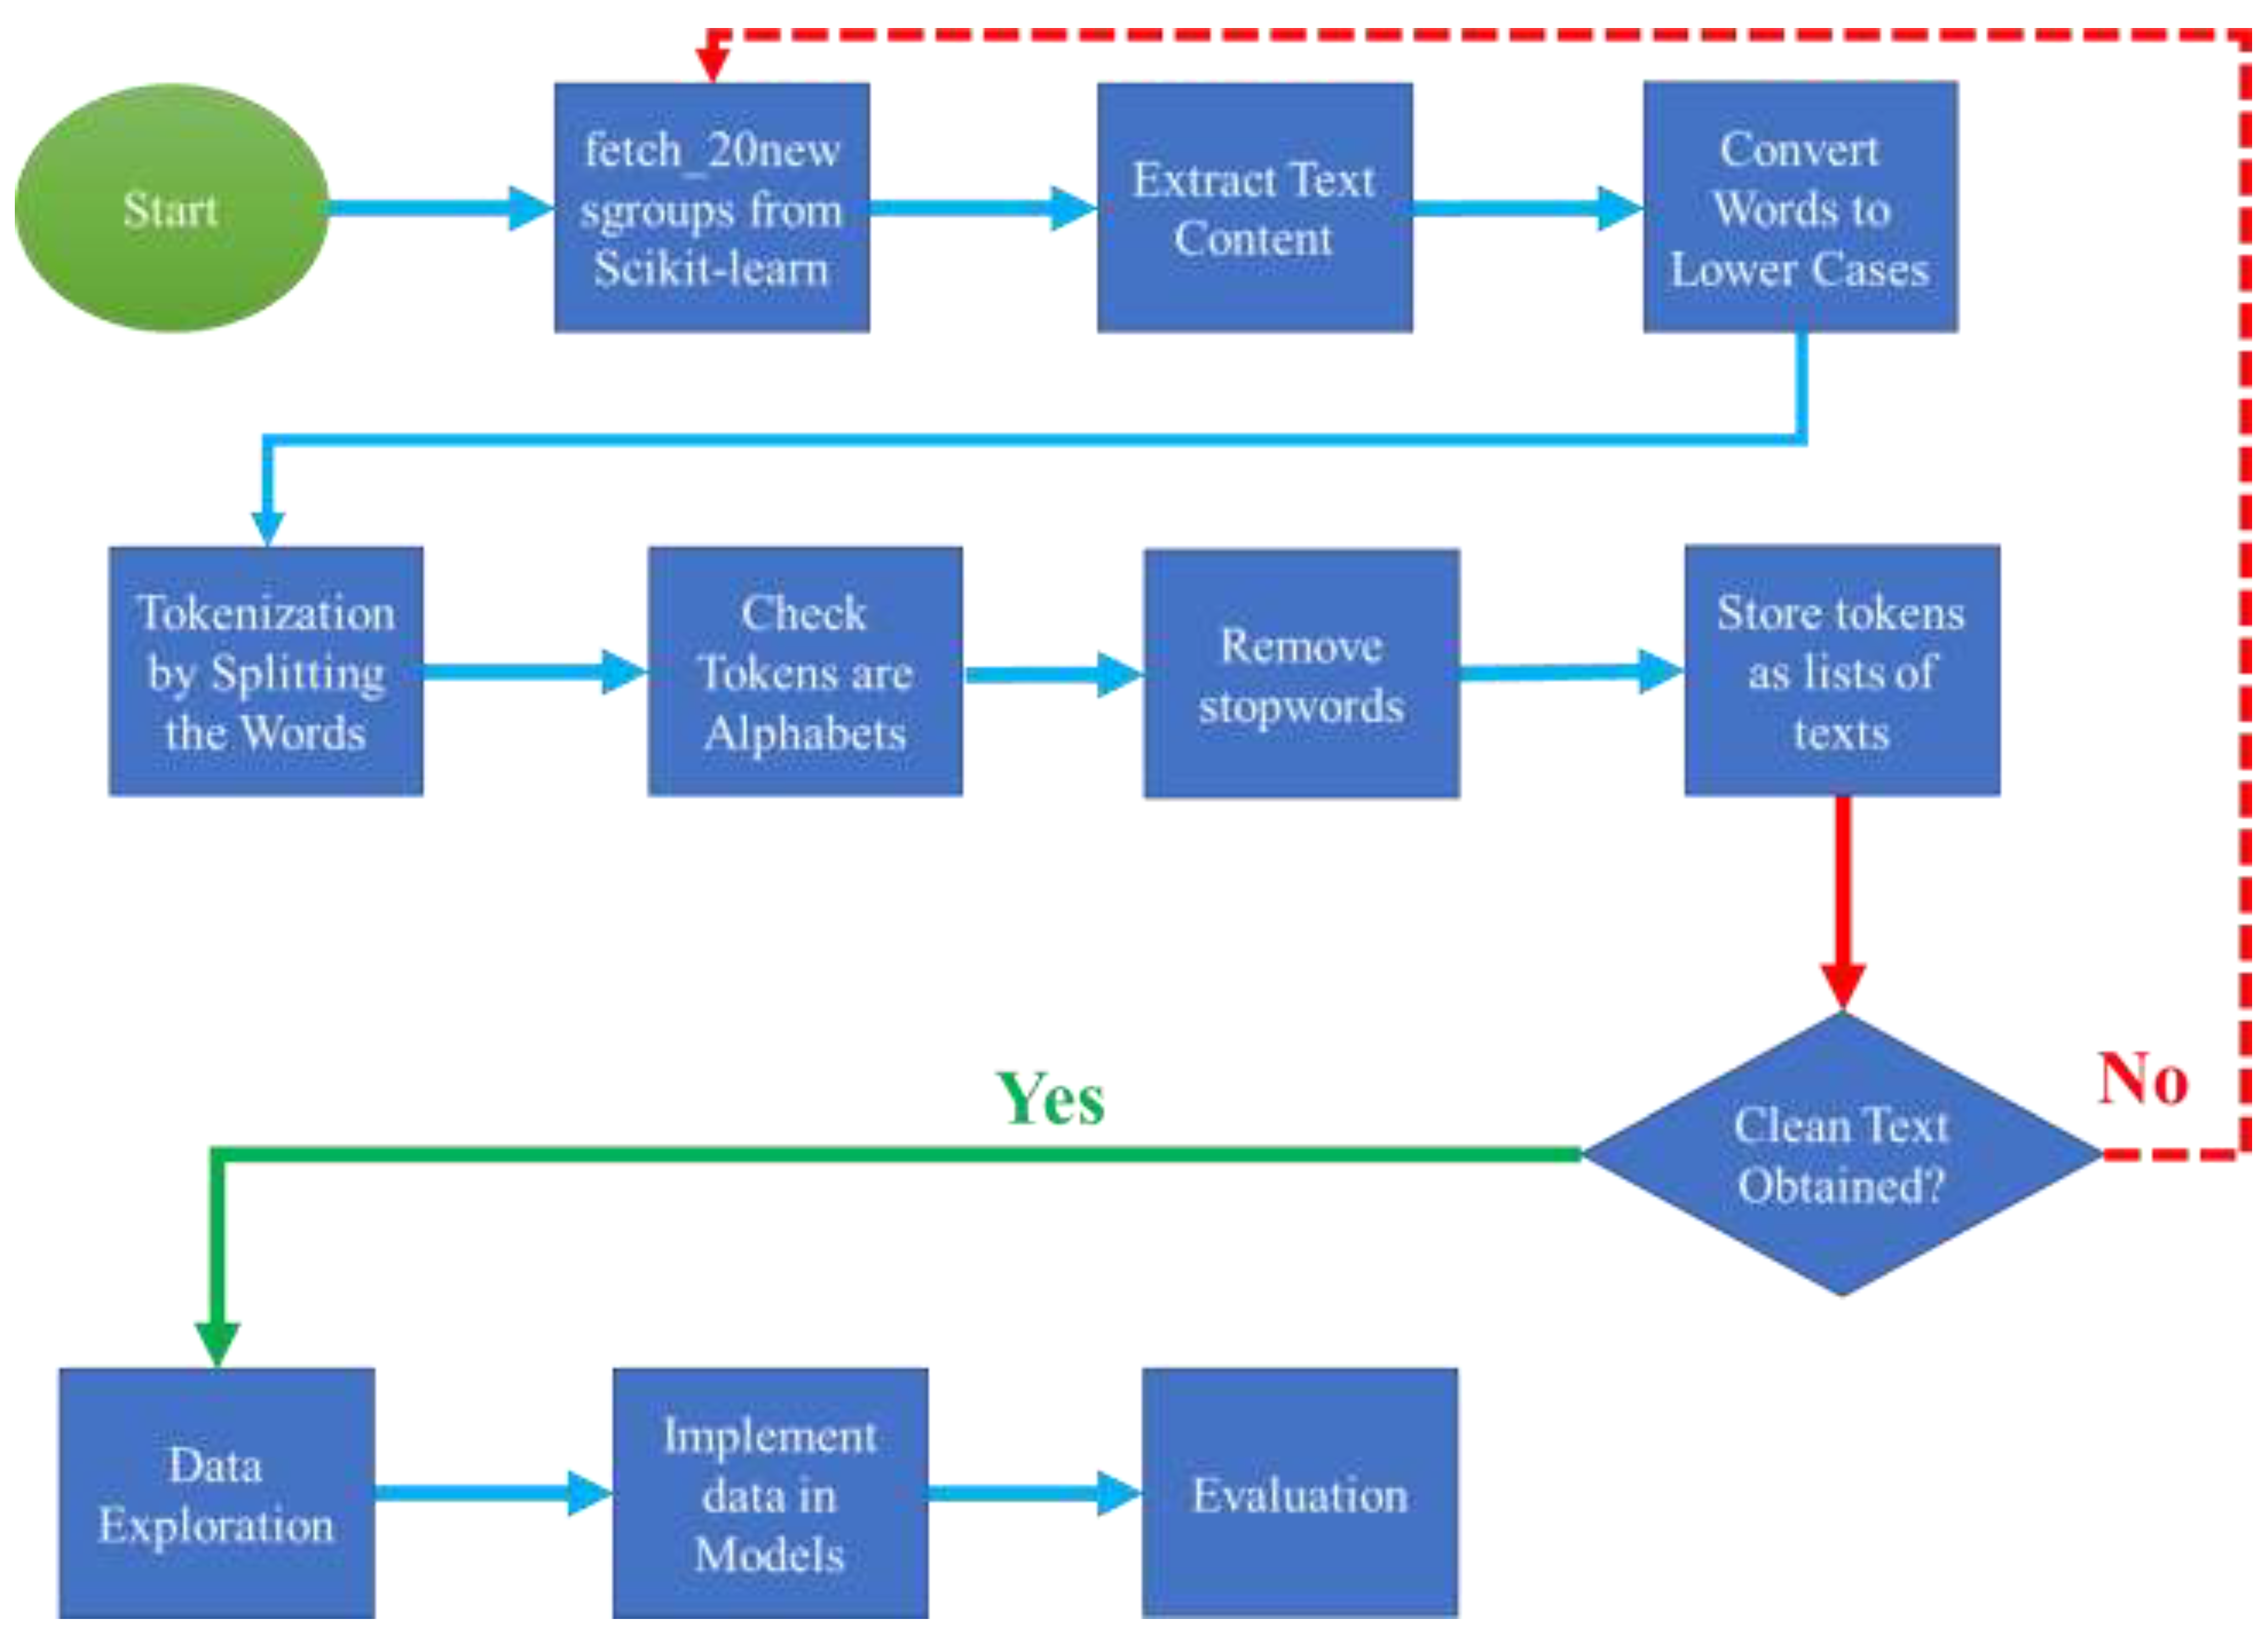
Figure 4.
Coherence vs. Number of Topics measured for NMF and LDA models.
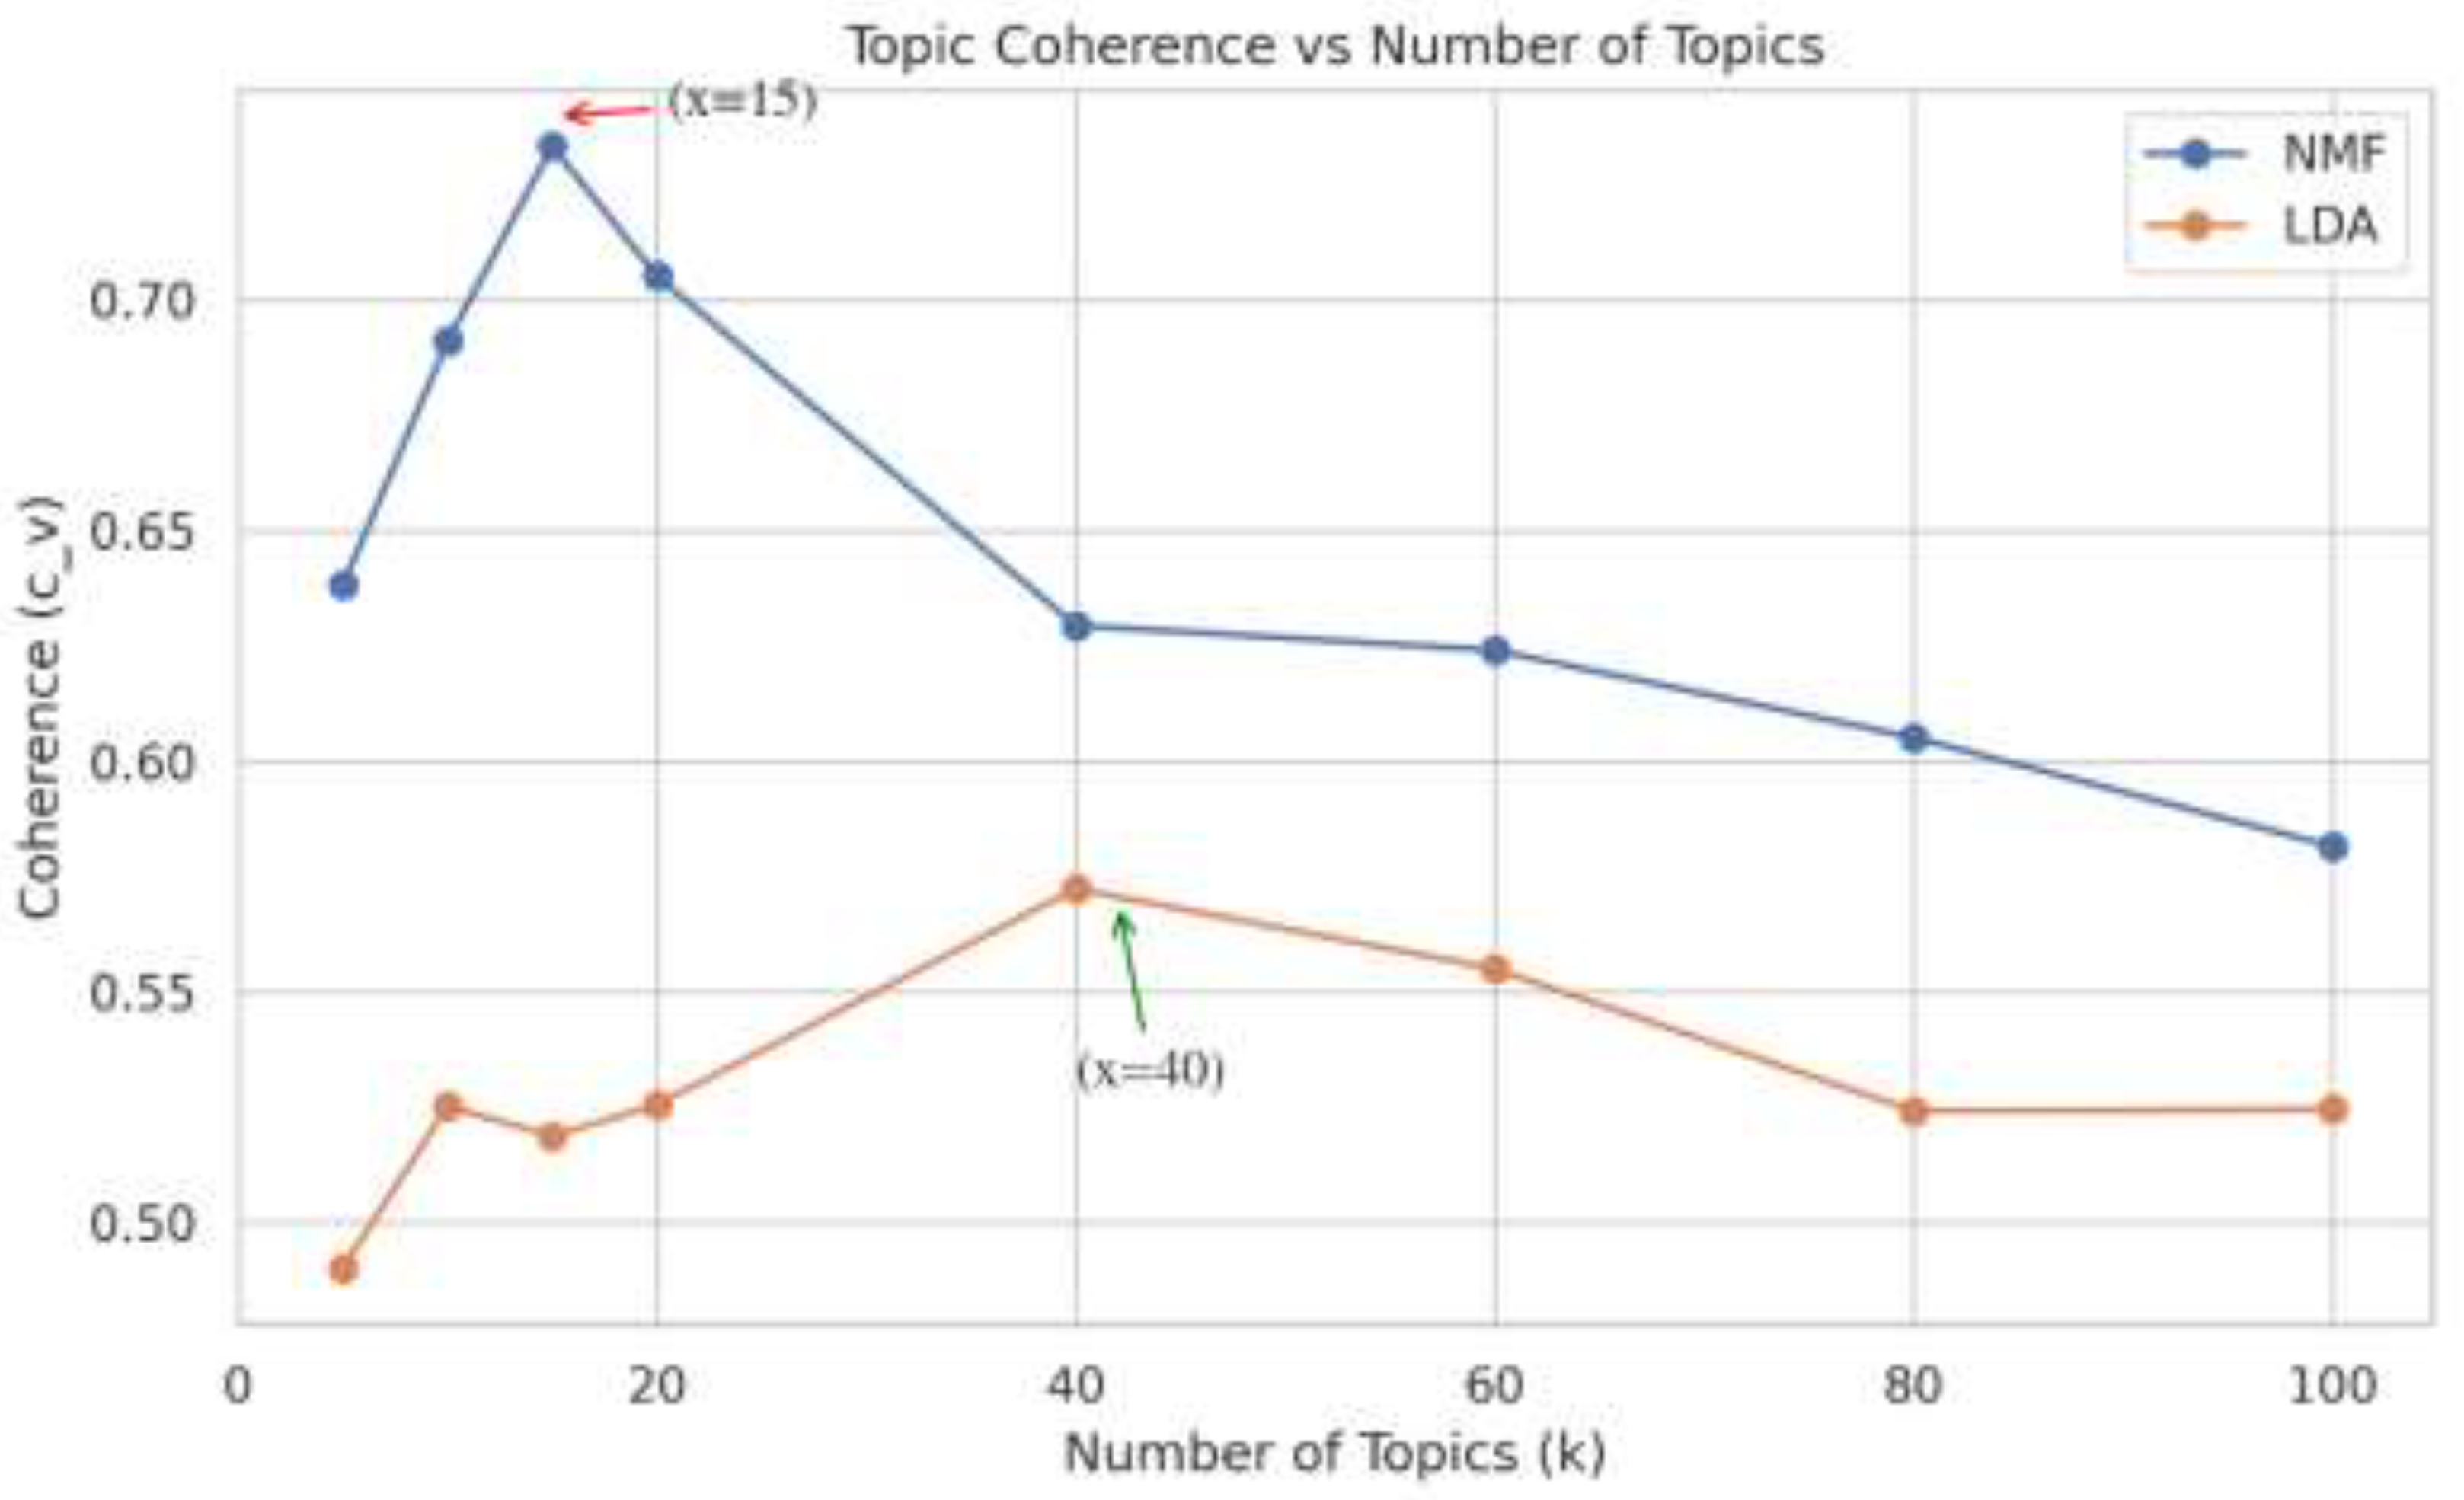
Figure 5.
Entropy vs. Number of Topics (k) measured for NMF and LDA models.
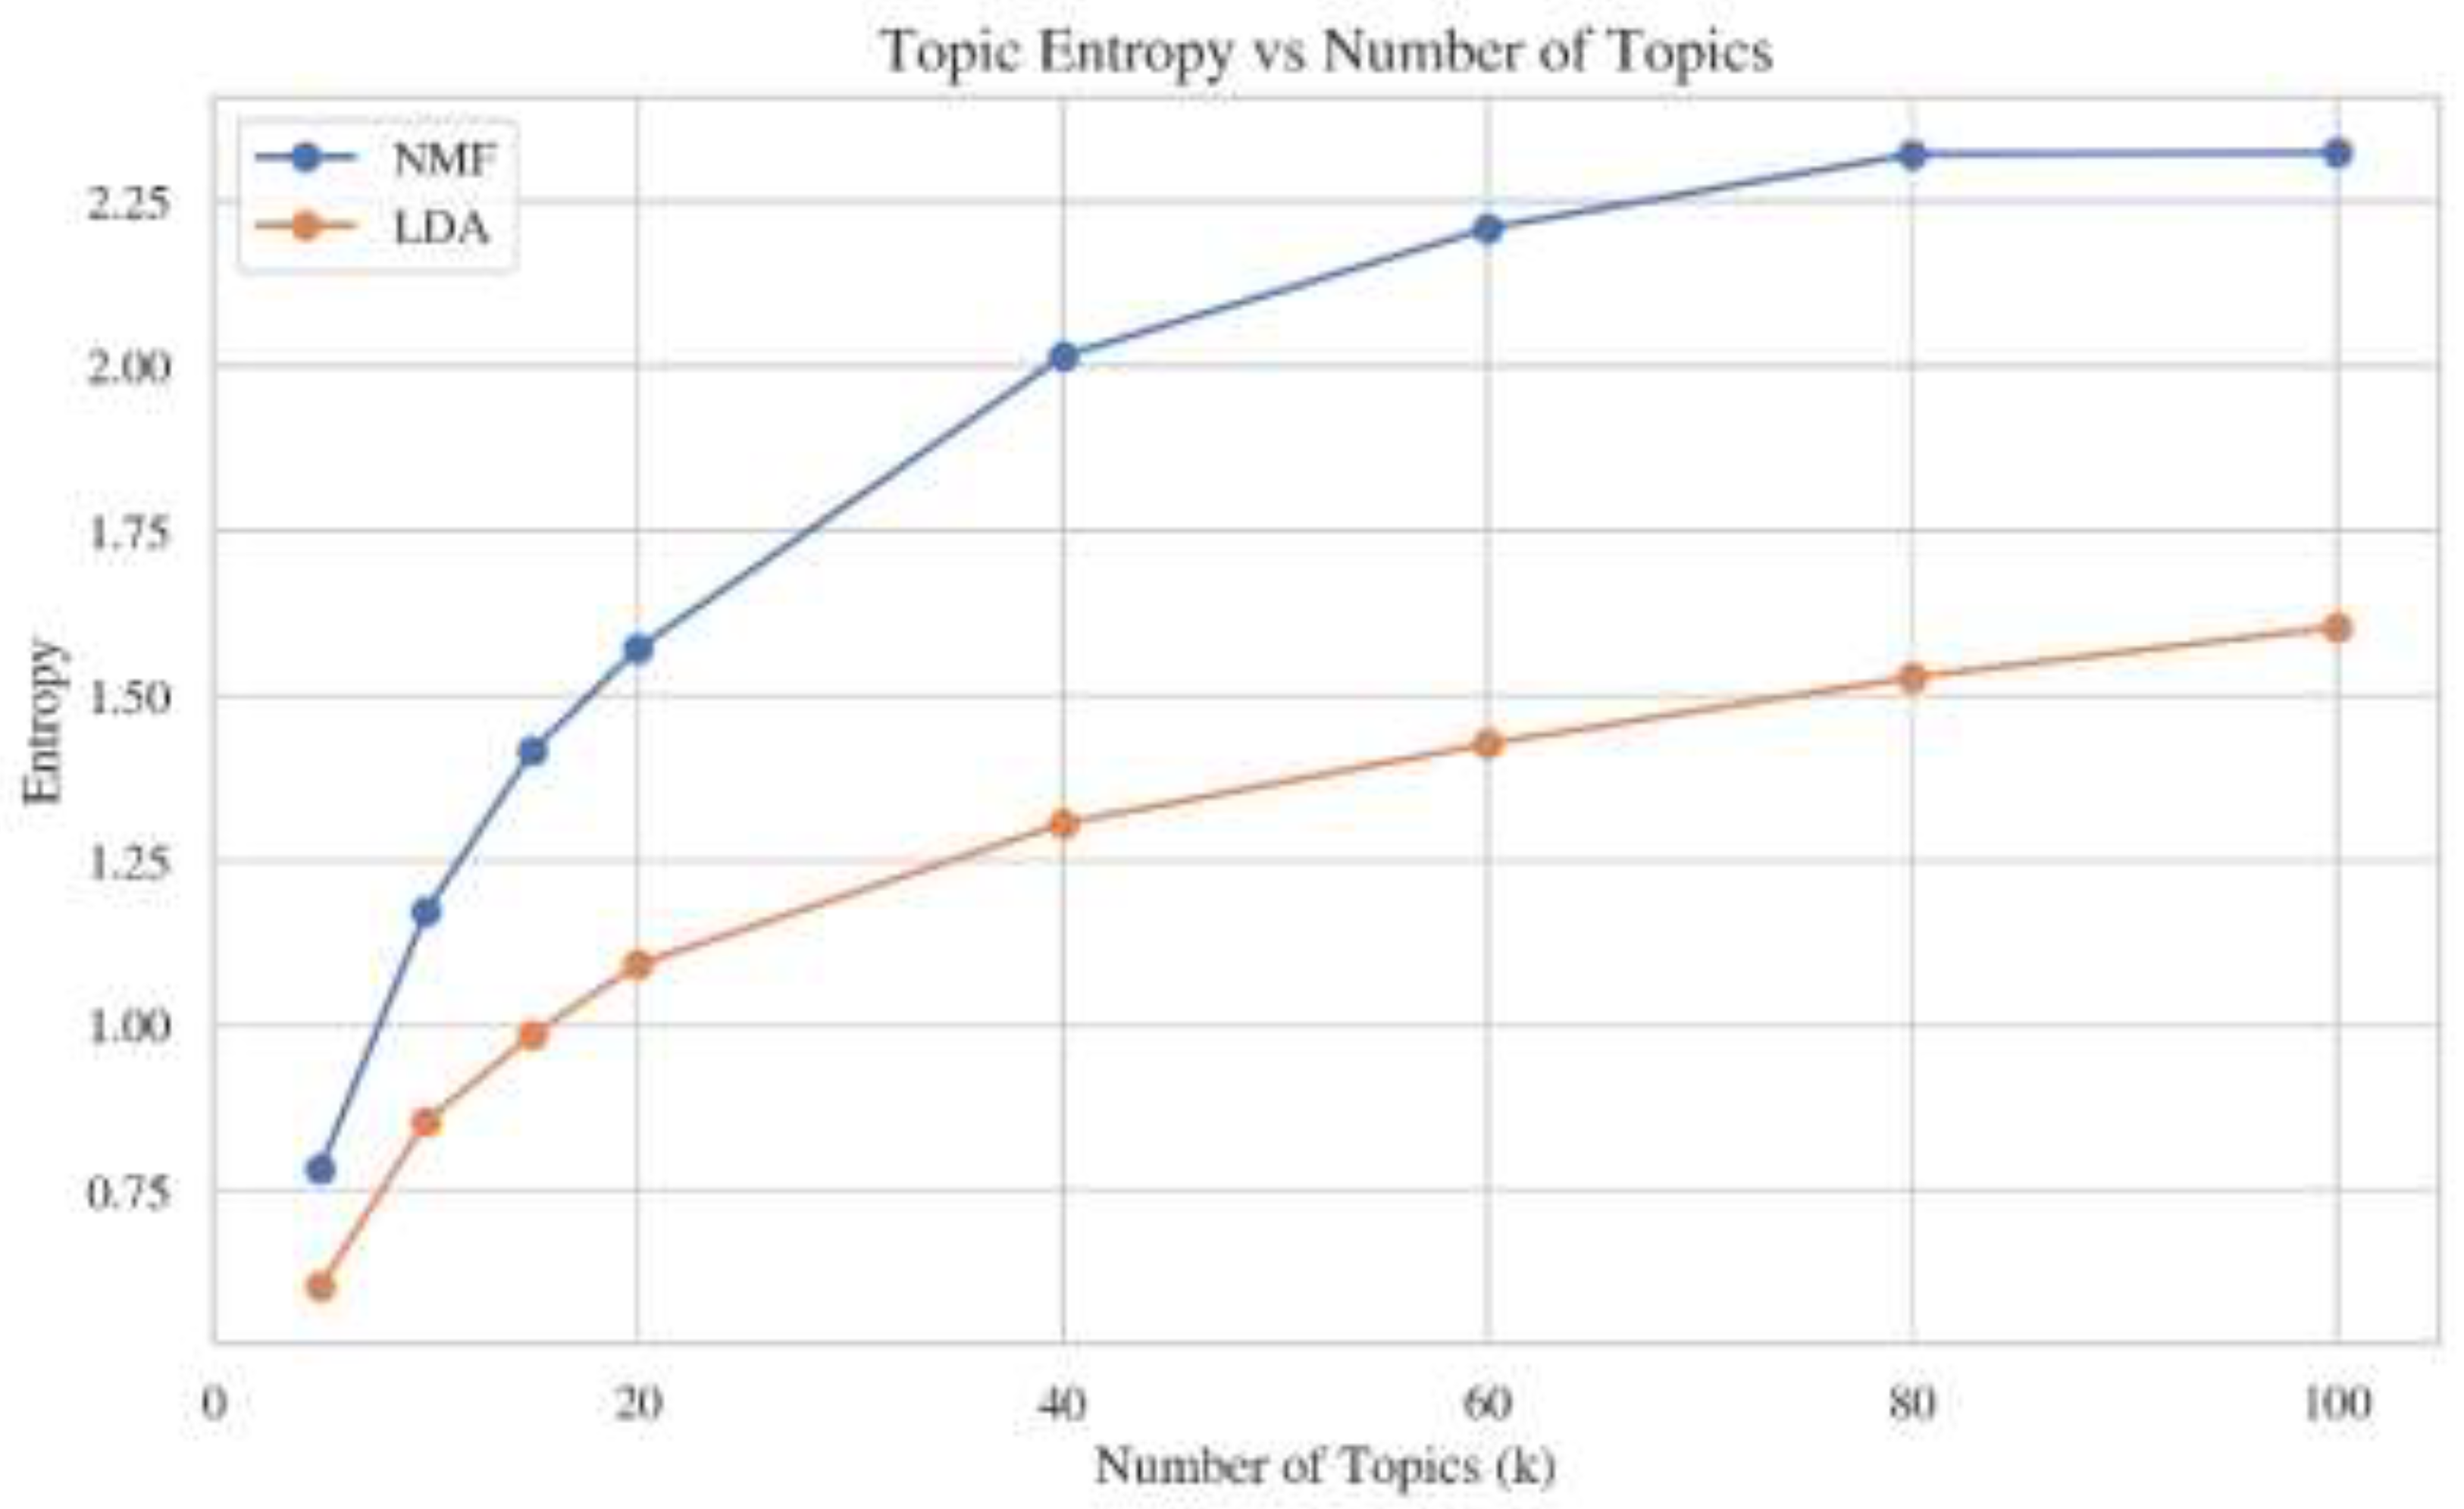
Figure 6.
Topic overlap vs. Number of Topics (k) measured for NMF and LDA models.
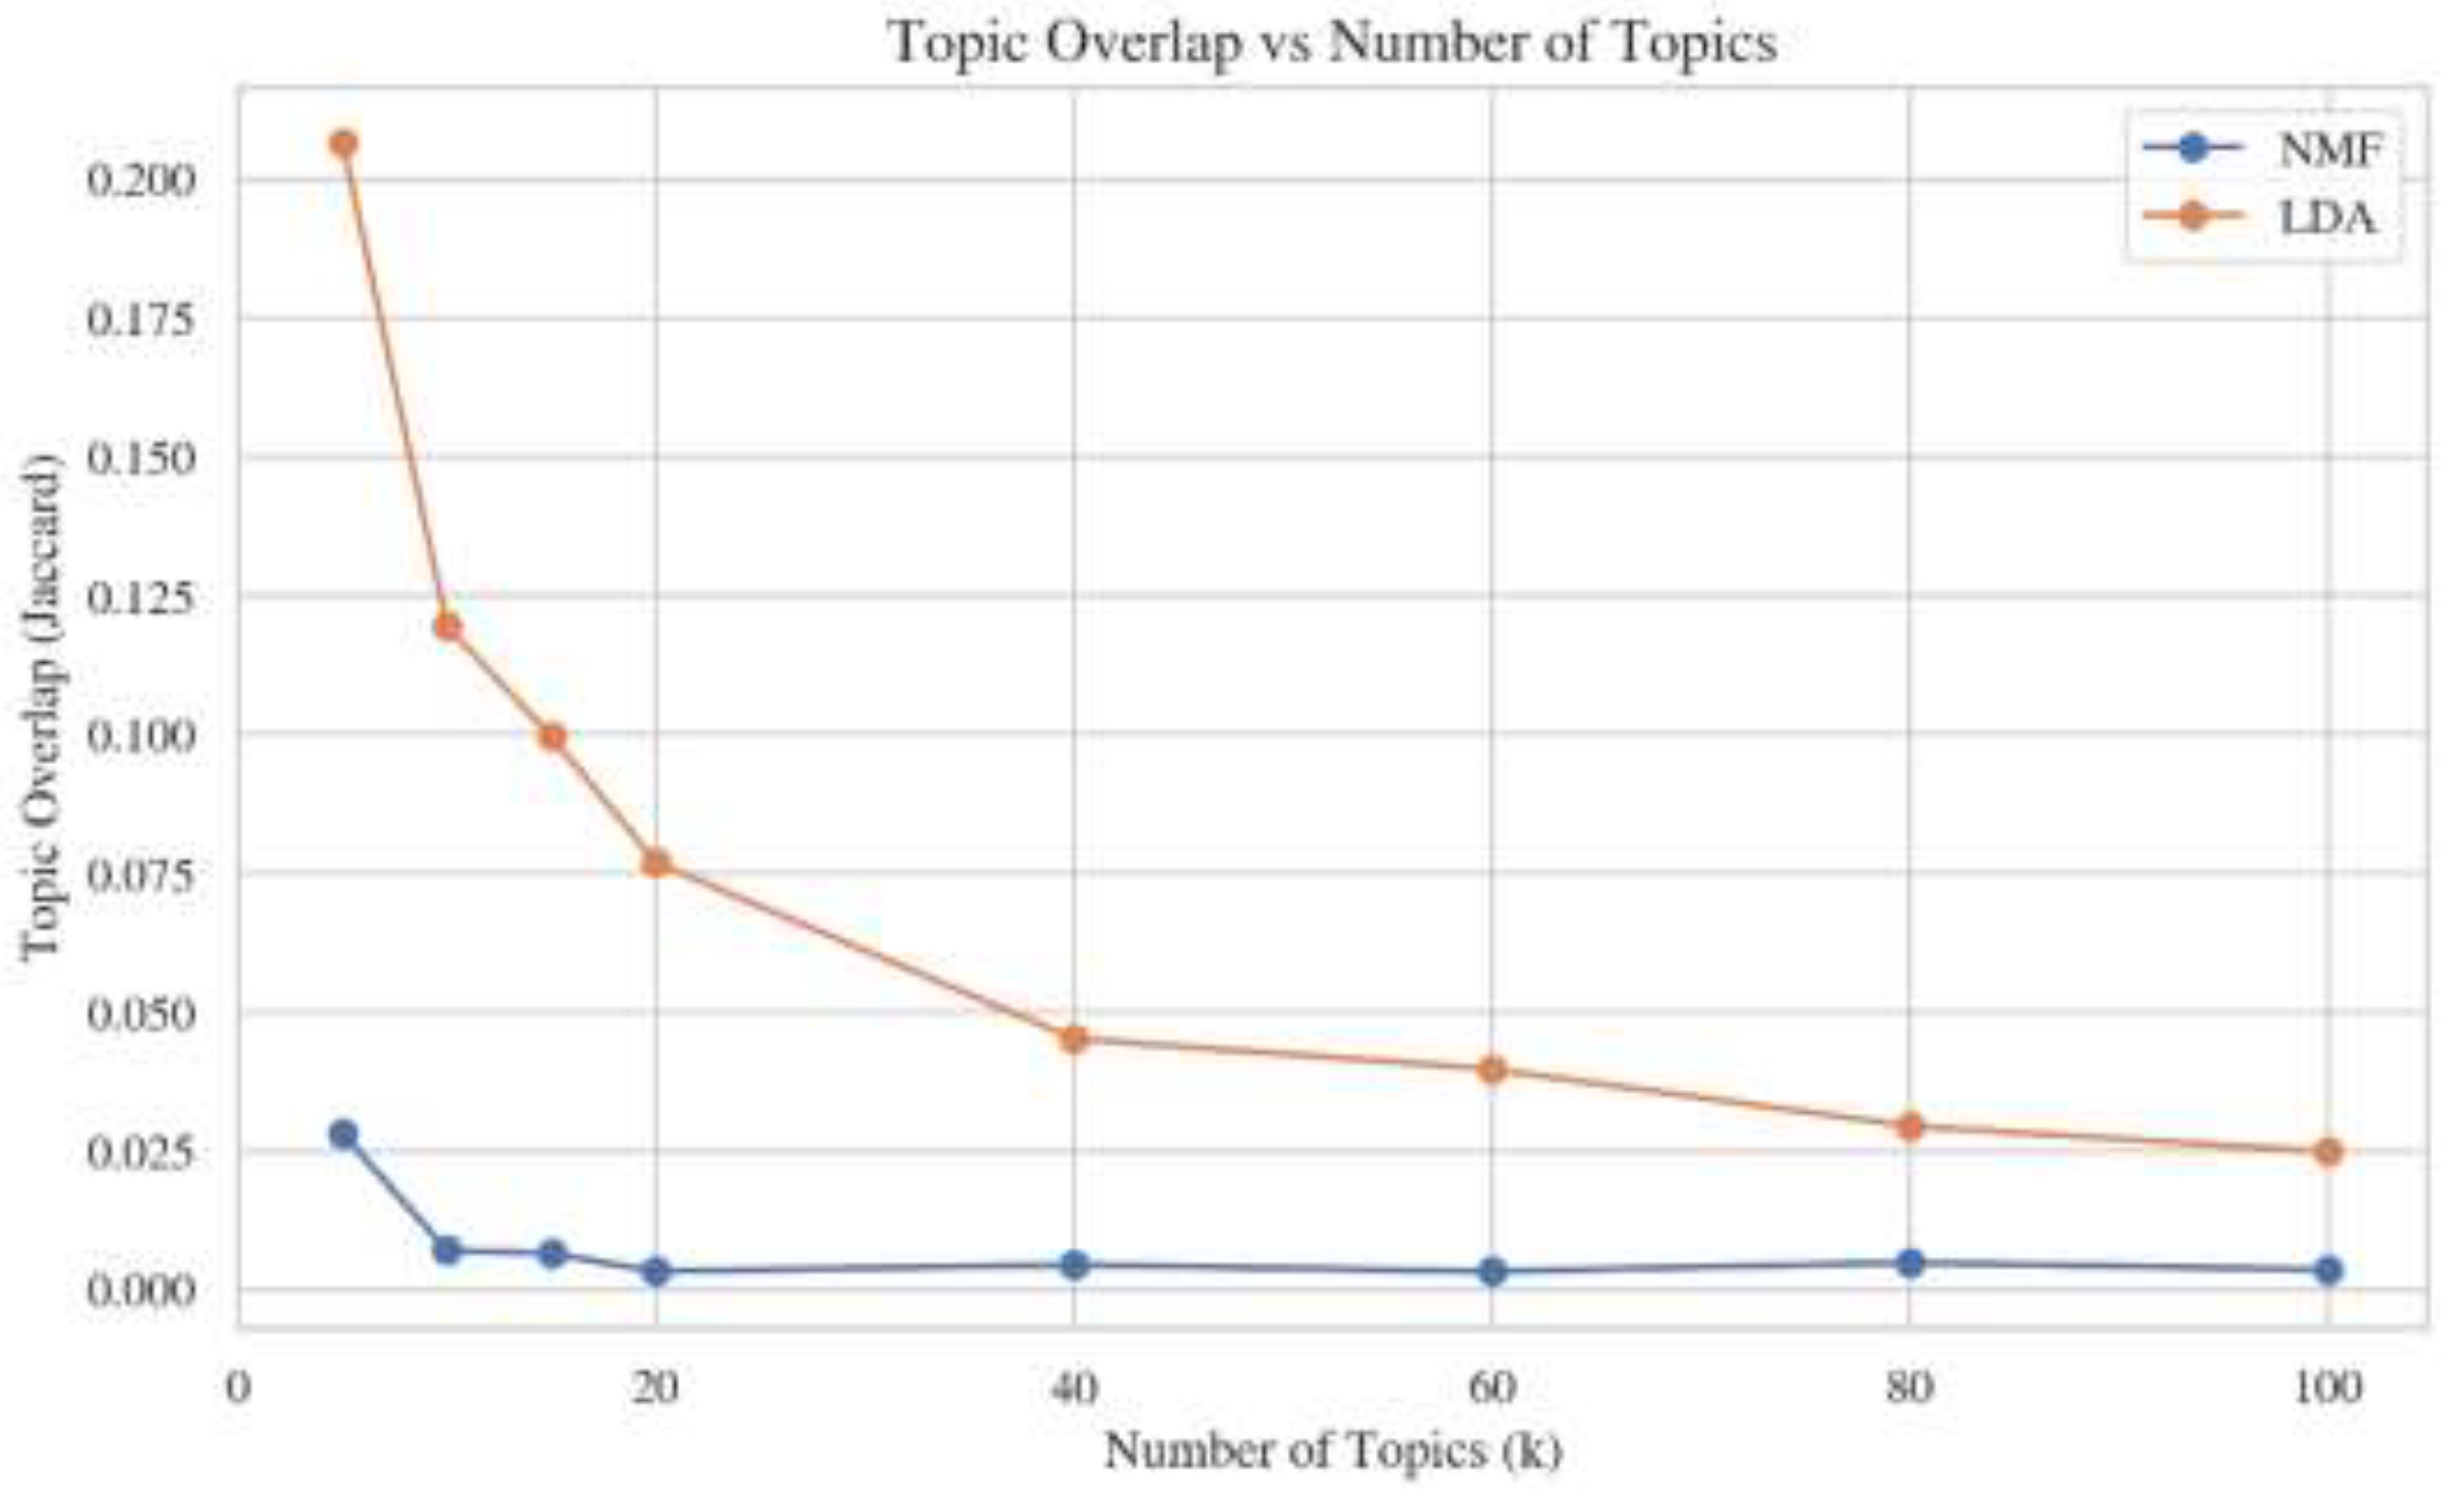
Figure 7.
Calculated Silhouette Score vs. Number of Clusters (k) in BERT model.
Disclaimer/Publisher’s Note: The statements, opinions and data contained in all publications are solely those of the individual author(s) and contributor(s) and not of MDPI and/or the editor(s). MDPI and/or the editor(s) disclaim responsibility for any injury to people or property resulting from any ideas, methods, instructions or products referred to in the content. |
© 2026 by the authors. Licensee MDPI, Basel, Switzerland. This article is an open access article distributed under the terms and conditions of the Creative Commons Attribution (CC BY) license (http://creativecommons.org/licenses/by/4.0/).
Copyright: This open access article is published under a Creative Commons CC BY 4.0 license, which permit the free download, distribution, and reuse, provided that the author and preprint are cited in any reuse.


