Submitted:
03 February 2026
Posted:
04 February 2026
You are already at the latest version
Abstract
The study evaluated the drinking water quality of Rouxville (RX) in Mohokare Local Municipality in the Free State, using chemical, physical, and microbiological parameters in comparison with South African National Standard 241 (SANS 241:2015). Drinking water samples were collected monthly from 5 sample sites, including the water treatment plant (WTP) and four end-user points, over a period of three years (2021–2023). Microbiological parameters revealed persistent non-compliance, with total coliforms and Escherichia coli (E. coli) frequently exceeding recommended limits by SANS 241 at multiple sites. The highest total coliform concentration of 201 CFU was recorded at the Rouxville Water Treatment Plant during the third year (2023) of sampling, while E. coli reached a maximum of 11 CFU at an end-user point, indicating the presence of possible pathogens in the water system. Colour exceeded the recommended limit (15 Pt-Co mg/L) at all sampling sites, with the highest value of 133 Pt-Co mg/L recorded at Rolelethunya Library. Chemical parameters mostly complied with SANS 241 limits, elevated values of total alkalinity and aluminium were observed at certain sites, particularly during the third year (2023) of sampling. The Canadian Council of Ministers of the Environment Water Quality Index (CCME-WQI) was also used to determine the overall water quality of the sample sites. The findings revealed that several sample sites had non-compliant parameters. The CCME-WQI revealed that the drinking water quality of Rouxville was either in the marginal or fair category, indicating that the water quality may be occasionally or frequently threatened, posing public health risks. These findings highlight the urgent need to ensure regular maintenance of WTP and ensuring continuous microbial monitoring.
Keywords:
drinking water
; water treatment plant
; water quality index
; total coliform
; E. coli
1. Introduction
Water is an essential natural resource without which humans and animals cannot survive [1,2,3]. Safe and adequate supply of water is crucial for good health, recreation, welfare, wildlife, and aquatic life [4,5]. However, various environmental and anthropogenic factors, such as erosion and sedimentation, industrial effluents and agricultural runoff have a significant impact on surface water, which in turn influences drinking water quality [6].
In South Africa, the quality of available drinking water sources are often compromised due to financial burden of running and maintaining water infrastructures, ineffective municipal wastewater management systems which often result in direct discharge into rivers causing large scale pollution, sewage from informal settlements that lack adequate sanitation facilities, and waste from intensive animal production systems, industries, hospitals or the mining sector [7,8].
Due to the negative cases of poor water quality, the Department of Water and Sanitation (DWS, formerly known as the Department of Water Affairs) introduced a program called the Blue Drop Certification in 2008 [9]. The Blue Drop certification program measures and compares Water Services Authorities (WSAs) and their providers (Water Services Providers) based on the results of the performance according to the minimum requirements that must be met to effectively manage water within the municipality. Rouxville, located within Mohokare Local Municipality, Blue Drop scores have consistently declined in comparison to previous years, including 2011, 2012, and 2014, culminating in the worst recorded performance in 2023, with a low score of 27.58% and failing to achieve the minimum target of 95% required for Blue Drop certificate [9].
Management of water quality requires the collection and analysis of large water quality datasets that can be very difficult to evaluate. Water Quality Index (WQI) was first developed by Horton [10], it uses aggregation techniques that convert large water quality data sets into a single value or index [11]. Water quality indices that are commonly used globally include the Canadian Council of Ministers of the Environment Water Quality Index (CCME-WQI). This study therefore aimed to assess the drinking water quality of the selected sampling sites of Rouxville, Free State using chemical, physical and microbial parameters and CCME-WQI to determine the overall water quality status.
2. Materials and Methods
2.1. Study area
The study area was in Rouxville, Free State within Mohokare Local Municipality. A total of 5 sampling sites were identified at Rouxville (RX1: Rouxville Water Treatment Plant, RX2: Rouxville Municipality, RX3: NG Kerk Rouxville, RX4: Rouxville Police Station, RX5: Rolelethunya Library) (Figure 1).
2.2. Data Collection
The water samples were collected monthly during both dry and wet seasons from 5 sample sites over a period of three years (2021-2023), the water samples collected at each sampling site were conveyed to Institute for Groundwater Studies (IGS) laboratory in Bloemfontein for water quality assessment. The water quality properties assessed included 7 chemical properties, two microbiological properties, and one physical property. The chemical properties selected were alkalinity, fluoride, nitrite, nitrate, sulphate, aluminium, and total organic carbon. The microbiological properties selected were total coliform, and E. coli. The physical property selected was colour. Secondary water quality data in the form of data sheets containing chemical, physical, and microbiological properties of drinking water samples analysed at the Institute were then collected from the Mohokare Local Municipality’s Environmental Health Practitioner (EHP).
2.4. Calculation of Water Quality Index
The Canadian Council of Ministers of the Environmental Water Quality Index (CCME-WQl) was calculated to offer a convenient method for summarising the measurements of various water quality parameters used to assess the drinking water quality of Mohokare Local Municipality. CCME-WQI calculation consists of three measures of variance from selected water quality objectives which are: scope (F1), frequency (F2) and amplitude (F3). F1 represents the number of parameters not meeting water quality guidelines; F2 represents the number of times these guidelines were not met; and F3 represents the amount by which the guidelines were not met. These three factors combine to produce a value between 0 and 100 that represents the overall water quality [12]. Below are the formulas used to calculate CCME- WQI:
- Calculation of the scope F1, which represents the number of parameters that exceeded the standard limit:
- 2.
- Calculation of the frequency F2, which represents the percentage of measurements that exceeded the standard limit:
- 3.
- Calculation of the amplitude F3, which measures the extent by which failed test values exceed the guideline:
- a.
- An excursion for each failed measurement is calculated in the following manner:
- Where the measurement must not exceed the guideline
- Where the measurement must not fall below the guideline
- b.
- The normalised sum of excursion (nse) is calculated as follows:
- c.
- Calculation of F3, which represents the amplitude:
After the above 3 elements were obtained, the CCME-WQI was then calculated in the following manner:
The CCME-WQI value was then calculated. The values were then converted into rankings by using the index categorization schema presented in Table 1.
2.5. Measurement of Chemical, Physical and Microbiological Properties
2.5.1. Measurements of Chemical Properties
The equipment used to measure aluminium and sulphate was Teledyne Leeman Prodigy 7 and the method used was ICP-OES. Using Teledyne Leeman Prodigy 7 with ICP-OES method, the samples were first filtered so that the particulates could be removed, standard solutions of aluminium and sulphate were prepared and used for calibration, and lastly the samples were put through the ICP-OES instrument for detection of aluminium and sulphate concentrations. The equipment used to measure fluoride was Hach DR 3900 and the method used was spectrophotometric. For the measurement alkalinity, nitrite and nitrate, the equipment used was Systea easychem 200 and the method used was spectrophotometric. The equipment used for TOC measurement was Analytik Jena multi N/C and the method used was low temp UV. Low temperature UV was used as a pre-treatment step to break down organic compounds into a form that was easily detected and quantified by Analytik Jena multi N/C.
2.5.2. Measurements of Physical Properties
In this study, the physical water quality property measured at IGS was colour. To measure colour, Hach DR 3900 and spectrophotometric method were used. To measure colour in water using a spectrophotometric method with the Hach DR 3900, the first step was to prepare the water samples of 10ml; the samples were then placed into the spectrophotometer cuvettes and inserted into the instrument after calibration; the intensity of the light transmitted through the water samples at various wavelengths was then measured, and the Hach DR 3900 with its software was then able to analyse spectral data and determine the colour of water samples.
2.5.3. Measurements of Microbiological Properties
The microbiological analysis of E. coli and total coliforms was executed at IGS using the IDEXX (Colilert 18) Quanti-TrayTM method. This is a biotechnological detection approach which uses the most probable number (MPN) method. It integrates a defined substrate medium which contains O-nitrophenyl-β-D-galactopyranoside (ONPG) and 4-methylumbelliferyl-β-D-glucuronide (MUG). Total coliform produces a yellow colour caused by the production of β-galactosidase and E. coli uses the enzyme called β-glucuronidase to metabolise MUG and produce blue fluorescence. Samples are incubated at 37oC for 18-22 hours. The number of positive wells helps to calculate the MPN.
2.3. Data Analysis
The water quality data that was obtained from the Mohokare Local Municipality was captured on an Excel spreadsheet for analysis. Water quality index (WQI) was used to combine water quality parameters data into one numerical value so that comparison could be made to the standard limits for compliance.
3. Results
3.1. Water Quality Parameters
The study was conducted to assess the quality of drinking water at Rouxville (RX) in Mohokare Local Municipality in the Free State. The sites analysed in RX included various locations. The drinking water quality of the identified sites in RX was analysed in terms of microbiological, chemical and physical parameters. The microbiological parameters that were analysed included total coliform (TC) and E. coli. The chemical parameters that were analysed included total alkalinity (TA), nitrite, nitrate, fluoride, sulphate, aluminium and total organic carbon (TOC). The physical parameter analysed was colour. To summarise and analyse the data, descriptive statistics were calculated over the three sampling years. Parameters that frequently exceeded SANS (2015) limits, were total coliforms (Table 2), E. coli (Table 3), total alkalinity (Table 4), aluminium (Table 5) and colour (Table 6). Nitrite, nitrate, fluoride, sulphate and total organic carbon complied with SANS 241 (2015) limits and were therefore not included in the results.
3.1.1. Microbiological Parameters
Total coliform(TC)
Table 2 summarises TC measurement results from 5 sampling sites in 2021-2023. Total coliform values were compared against the SANS 241 recommended limit of ≤ 10 CFU. Across the three-year (2021-2023) sampling, total coliform values varied considerably among sampling sites and years (Table 2). Minimum values of 0 CFU were recorded at all sampling sites during sampling. The highest value of 201 CFU was recorded at the Rouxville Water Treatment Plant (RX1) in 2023. High values were also observed at RX4 (145 CFU) and RX5 (83 CFU) in 2023. None of the sampling sites achieved full compliance across all three years (2021-2023), with overall compliance percentages ranging from 76% to 89%.
E. coli
Table 3 summarises E. coli measurement results from 5 sampling sites in 2021-2023. During the three sampling years, only one sampling sites achieved 100% compliance when compared to SANS 241 (2015). The highest number of E. coli non-compliances occurred in the third year of monitoring (Table 3). The highest value of 11 CFU was recorded at RX4 in 2023 (Table 3), which exceeded the recommended limit (0 CFU) outlined by SANS 241 (2015). The poor overall compliance performance of four out of five sampling sites was a major concern (Table 3).
3.1.2. Chemical Parameters
Total Alkalinity (TA)
Table 4 summarises TA measurement results from 5 sampling sites in 2021-2023. Total alkalinity concentrations were assessed against the SANS 241 recommended limit of ≤200 mg/L (Table 4). In 2021, all sampling sites recorded values within the recommended limit. Across the three-year (2021-2022) period, minimum alkalinity values ranged from 51.20 mg/L to 68.26 mg/L. Non-compliant values were observed in 2023, with the highest total alkalinity value of 274.14 mg/L recorded at RX5. Non-compliant values were also observed at RX4 in the same year. Overall compliance across all sampling sites ranged from 96% to 100%.
Aluminium
Aluminium values were compared against the SANS 241 limit of ≤0.3 mg/L (Table 5). Minimum aluminium concentrations of 0.00 mg/L were recorded at all sampling sites. In 2021 and 2022, aluminium values remained within recommended limits at all sampling sites. In 2023, elevated maximum values were recorded at RX2 (0.91 mg/L), RX4 (0.82 mg/L), and RX5 (0.66 mg/L), exceeding the recommended limit. Overall compliance across sampling sites ranged from 96% to 100%.
3.1.3. Phyisical Parameters
3.1.3.1. Colour
Colour was assessed against the SANS 241 recommended limit of ≤15 Pt-Co mg/L (Table 6). Colour values ranged from 2 to 7 Pt-Co mg/L across all sampling sites. Maximum colour values exceeded the recommended limit at all sampling sites during each year (2021-2023). The highest recorded colour value was 133 Pt-Co mg/L at RX2 in 2022. Overall compliance percentages ranged from 64% to 79%, indicating frequent exceedances across the sampling sites.
3.2. CCME-WQI Analysis of Drinking Water Quality
The CCME-WQI was calculated to analyse the drinking water quality of 5 sample sites in Rouxville. Out of 5 sample sites, one was a water treatment plant (RX1), and the rest were end-user points. The CCME-WQI value revealed that RX1 was not in a good and excellent category (95-100), indicating poor performance. Furthermore, it revealed that none of the end-user points were also in the good or excellent category. RX3 was most concerning sampling site. The highest CCME-WQI value of 71.27 was recorded at RX3 and the lowest CCME-WQI value of 59.10 was recorded at RX4 (Table 7).
4. Discussion
This study was conducted to assess the water quality of Rouxville (RX) in Mohokare Local Municipality in the Free State. The findings revealed that out of 10 parameters assessed, total coliform, E. coli, total alkalinity, aluminium and colour were the most concerning. The remaining parameters complied with SANS 241 (2015) recommended limits and were not discussed. The CCME-WQI findings revealed that none of the sample sites recorded values in the good or excellent categories.
Total coliform and E. coli were the only microbiological parameters assessed in this study and they both exceeded recommended limit at multiple sampling sites. Total coliform is an indicator of the presence of pathogens in drinking water [13]. Total coliforms are a group of bacteria that are commonly found in the aquatic environment in soil and vegetation, and in the intestines of mammals, including humans [14]. Coliform in drinking water indicates the presence of possible pathogens in the water system [15]. Similar findings have been reported that drinking water distribution systems are increasingly vulnerable to sewage intrusion due to aging water infrastructure [16,17]. This vulnerability mirrors broader challenges in South African municipalities, where limited access to social and infrastructure services remains a challenge [8,18].
E. coli is regarded as an indicator of recent faecal contamination as they are found exclusively in the gastrointestinal tract of humans and animals [19,20]. The primary sources of E. coli include open field defecation, animal wastes, economic activities such as agricultural, and wastes from residential areas [21]. Potential contributors of high E. coli values may include inadequate waste management, leaking sewer systems, and ageing water infrastructure [22,23]. This is relevant to Rouxville in Mohokare Local Municipality, where the Integrated Development Plan (IDP) outlines significant challenges in sanitation infrastructure (sewer backlogs), waste management (non-compliant landfill sites), and water purification capacity (overloaded water facilities), which may lead to the risk of untreated water entering the water supply system [24].
The chemical parameters mostly revealed compliant values, with only two parameters exceeding the recommended limit. The chemical parameters that exceeded the recommended limit by SANS 241 were total alkalinity and aluminium.
Alkalinity refers to the ability to neutralize water acids [25]. In this study, the alkalinity values for sample site RX5 exceeded the recommended limit (Table 4). This may be due to natural geochemical characteristics of the source water, particularly the dissolution of carbonate-rich geological formations, which is common in the Free State Province, South Africa [26]. RX2 had the lowest value of alkalinity and water with low alkalinity is more likely to be corrosive, which could cause deterioration of plumbing [27].
Aluminium salts are commonly used in water treatment as coagulants to reduce organic matter, colour, turbidity, and microorganism levels [28]. The use of aluminium salts as coagulants in water treatment increases the concentration of aluminium in drinking water [29,30]. Furthermore, leaching and corrosion of aluminium in storage tanks, pipes, and household utensils in the distribution system can increase its concentrations [31]. The IDP highlighted that ageing infrastructure and overloaded water facilities remains a challenge in Rouxville [24], suggesting that the distribution systems may be vulnerable to corrosion and leaching processes, increasing aluminium concentrations in the drinking water supply system [32,33].
The physical parameter assessed in this study revealed multiple non-compliant values. Colour was the only physical parameter assessed in this study, and it exhibited values outside the norm. The colour of the water is a function of water appearance and it is primarily caused by dissolved substances [34]. Although the colour of water may be affected due to the corrosion of iron pipes and standpipes in the distribution system [35] ,the results in this study suggest that the colour issue is more likely linked to water treatment plants (WTPs) running beyond their design capacity that does not allow sufficient time for the flocculate to interact with the water due to fast flowing/movement of the water through the system.
5. Conclusions and Recommendations
In accordance with the WQI, the study indicates that none of the sample sites recorded values in the good or excellent categories (see Table 7). This further indicates that the people of Mohokare Local Municipality are exposed to potentially contracting waterborne diseases, which is contravening the bill of rights and the obligation of municipalities in terms of section 152 of the constitution to ensure a safe and healthy environment to its citizens.
Mohokare Local Municipality’s Blue Drop scores have consistently declined over the years, with the worst recorded performance in 2023. The observed non-compliant values when compared to SANS 241 (2015), therefore contributes to understanding the low Blue Drop score achieved by the Municipality. This indicates that the overall water treatment is not consistent. The irregular treatment compliance could be an indication of a deeper management issue. The effectiveness of water treatment facilities in rural and semi-urban regions is significantly influenced by the type of technology implemented, the competency of operational staff, and is often compromised by poorly maintained equipment and a shortage of skilled personnel [36,37,38].
Drinking water containing unsafe levels of contaminants can affect health [39]. It is therefore important to improve water supply and sanitation and manage the water resources better to prevent adverse health-related issues associated with poor water quality [40]. Addressing drinking water quality issues requires strategies to prevent, treat and remediate water pollution [41].
Recommendations
Based on the findings of the study, the following recommendations are proposed:
- Ensuring regular maintenance of the water treatment plants (WTPs) and providing training for the WTPs operators;
- Infrastructure maintenance of the distribution network;
- Reporting leaks or damaged water pipes to curb contamination of treated water supplies; and
- Ensuring continuous microbial monitoring and implementation of a stricter disinfection protocol to address persistent non-compliant total coliform values;
- Educating the community about safe water practices and the potential health risks of consuming polluted water;
- Conducting a review of the current water safety plan of the municipality, updating the current risk assessment to address the challenges identified in the Blue drop report, and incorporating the findings and recommendations of this study, ensuring implementation of a monthly microbial monitoring programme and weekly chlorine monitoring programme
Author Contributions
Conceptualization, K.M and L.E.; methodology, K.M; software, K.M; validation, K.M, L.E. and I.M.; formal analysis, K.M; investigation, K.M; resources, K.M; data curation, K.M; writing—original draft preparation, K.M; writing—review and editing, L.E, J.N, I.M; visualization, K.M.; supervision, L.E.; project administration, K.M; funding acquisition, N/A All authors have read and agreed to the published version of the manuscript.
Funding
This research received no external funding.
Data Availability Statement
The data used in the study can be provided upon request by contacting the corresponding author kmaqeba@cut.ac.za.
Acknowledgments
The authors acknowledge Mohokare Local Municipality for providing the data used in this study.
Conflicts of Interest
The authors declare no conflicts of interest.
Abbreviations
The following abbreviations are used in this manuscript:
| CCMEWQI | Canadian Council of Ministers of the Environment Water Quality Index |
| CFU | Colony Forming Units |
| E. coli | Escherichia coli |
| EHP | Environmental Health Practitioner |
| ICP-OES | Inductively Coupled Plasma Optical Emission Spectrometry |
| IDP | Integrated Development Plan |
| IGS | Institute for Groundwater Studies |
| MPN | Most Probable Number |
| Nse | Normalized sum of excursion |
| RX | Rouxville |
| SANS | South African National Standard |
| SD | Standard Deviation |
| TA | Total Alkalinity |
| TC | Total Coliform |
| TOC | Total Organic Carbon |
| UV | Ultraviolet |
| WQI | Water Quality Index |
| WSA | Water Services Authority |
| WSP | Water Services Provider |
| WTP | Water Treatment Plant |
References
- Halder, J.N.; Islam, N. Water Pollution and Its Impact on the Human Health. Journal of Environment and Human. 2015, 2, 36–46. [Google Scholar] [CrossRef]
- Abdel-Satar, A.M.; Ali, M.H.; Goher, M.E. Indices of Water Quality and Metal Pollution of Nile River, Egypt. Egypt. J. Aquat. Res. 2017, 43, 21–29. [Google Scholar] [CrossRef]
- Gupta, N.; Pandey, P.; Hussain, J. Effect of Physicochemical and Biological Parameters on the Quality of River Water of Narmada, Madhya Pradesh, India. Water Science. 2017, 31, 11–23. [Google Scholar] [CrossRef]
- Omran, A. Factors Influencing Water Treatment Management Performance in Malaysia: A Case Study in Pulau Pinang. Annals of Faculty Engineering Hunedoara-International Journal of Engineering. 2011, 9, 53. [Google Scholar]
- Stats SA The State of Basic Service Delivery in South Africa: In-Depth Analysis of the Community Survey 2016 Data; Statistics South Africa: Pretoria, South Africa, 2016; ISBN 978-0-621-45302-7.
- Anh, N.T.; Can, L.D.; Nhan, N.T.; Schmalz, B.; Luu, L.T. Influences of Key Factors on River Water Quality in Urban and Rural Areas: A Review. Case Studies in Chemical and Environmental Engineering. 2023, 8, 100424. [Google Scholar] [CrossRef]
- Ruiters, C.; Amadi-Echendu, J. Economic Costs and Investment Challenges of Water Infrastructure in South Africa. Infrastructure Asset Management. 2022, 9, 194–206. [Google Scholar] [CrossRef]
- Tshona, S.S.; Lungisa, S.; Mgweba, L. Thirsting for Solutions: Unpacking Inadequate Water Provision in Rural Communities. Africa’s Public Service Delivery and Performance Review. 2025, 13, 873. [Google Scholar] [CrossRef]
- Department of Water and Sanitation Blue Drop National Report 2023; Department of Water and Sanitation: Pretoria, 2023.
- Chidiac, S.; El Najjar, P.; Ouaini, N.; El Rayess, Y.; El Azzi, D. A Comprehensive Review of Water Quality Indices (WQIs): History, Models, Attempts and Perspectives. Rev. Environ. Sci. Biotechnol. 2023, 22, 349–395. [Google Scholar] [CrossRef]
- Uddin, M.G.; Nash, S.; Olbert, A.I. A Review of Water Quality Index Models and Their Use for Assessing Surface Water Quality. Ecol. Indic. 2021, 122, 107218. [Google Scholar] [CrossRef]
- CCME Calculation of the Drinking Water Quality Index. 2001, 1, 1–2.
- Kothari, V.; Vij, S.; Sharma, S.K.; Gupta, N. Correlation of Various Water Quality Parameters and Water Quality Index of Districts of Uttarakhand. Environmental and Sustainability Indicators. 2021, 9, 100093. [Google Scholar] [CrossRef]
- Maheux, A.F.; Boudreau, D.K.; Bisson, M.A.; Dion-Dupont, V.; Bouchard, S.; Nkuranga, M.; Bergeron, M.G.; Rodriguez, M.J. Molecular Method for Detection of Total Coliforms in Drinking Water Samples. Appl. Environ. Microbiol. 2014, 80, 4074–4084. [Google Scholar] [CrossRef]
- Volf, G.; Čule, S.I.; Atanasova, N.; Zorko, S.; Ožanić, N. Explaining and Predicting Microbiological Water Quality for Sustainable Management of Drinking Water Treatment Facilities. Sustainability (Switzerland). 2025, 17, 6659. [Google Scholar] [CrossRef]
- Fan, M.; Ren, A.; Yao, M.; Li, X.; van der Meer, W.; Yu, G.; Medema, G.; Rose, J.; Liu, G. Disruptive Effects of Sewage Intrusion into Drinking Water: Microbial Succession and Organic Transformation at Molecular Level. Water Res. 2024, 266, 122281. [Google Scholar] [CrossRef]
- Mohammed, J.N.; Swalaha, F.M. Sewage Intrusion into Drinking Water Distribution Systems: Implications for Water Resource Management. Environ. Monit. Assess. 2025, 197, 1150. [Google Scholar] [CrossRef] [PubMed]
- Mamokhere, J.; Meyer, D.F. Barriers to Effective E-Participation in the Context of Municipal Planning in South African Rural Regions. Administratio Publica. 2025, 33, 137–158. [Google Scholar] [CrossRef]
- Petculescu, I.; Hynds, P.; Brown, R.S.; McDermott, K.; Majury, A. An Assessment of Total Coliforms and Associated Thresholds as Water Quality Indicators Using a Large Ontario Private Drinking Water Well Dataset. Science of the Total Environment. 2022, 846, 157478. [Google Scholar] [CrossRef]
- Nowicki, S.; DeLaurent, Z.R.; De Villiers, E.P.; Githinji, G.; Charles, K.J. The Utility of Escherichia Coli as a Contamination Indicator for Rural Drinking Water: Evidence from Whole Genome Sequencing. PLoS One. 2021, 16, e0245910. [Google Scholar] [CrossRef]
- Luvhimbi, N.; Tshitangano, T.G.; Mabunda, J.T.; Olaniyi, F.C.; Edokpayi, J.N. Water Quality Assessment and Evaluation of Human Health Risk of Drinking Water from Source to Point of Use at Thulamela Municipality, Limpopo Province. Sci. Rep. 2022, 12, 1–17. [Google Scholar] [CrossRef]
- Kabiswa, W.; Kungu, J.M.; Kalule, J.B.; Ayorekire, J.; Nakalembe, I.; Majalija, S. The Role of Sanitation Behavior as a Driver for Antimicrobial Resistance in Escherichia Coli among Lakeshore Residents around Lake Victoria, Uganda. Discover public health. 2025, 22, 485. [Google Scholar] [CrossRef]
- Mohammed, J.N.; Swalaha, F.M. Sewage Intrusion into Drinking Water Distribution Systems: Implications for Water Resource Management. Environ. Monit. Assess. 2025, 197, 1150. [Google Scholar] [CrossRef] [PubMed]
- Mohokare Local Municipality FINAL IDP DOCUMENT FOR 2025-2026 FINANCIAL YEAR. Mohokare Local Municipality, 2025.
- Naseem, F.; Zobia Zia, H.; Ishtiaq Tariq, M.; Amjad Bashir, M.; Amber Hameed, S.; Samiullah, K.; Qayyoom, A.; Farooq, H.; Mehroz Afzal, R.; Hashem, M.; et al. Role of Chemical Composition of Drinking Water in Human Health of the Community. J. King Saud Univ. Sci. 2022, 34, 102232. [Google Scholar] [CrossRef]
- Leketa, K.; Abiye, T. Using Environmental Tracers to Characterize Groundwater Flow Mechanisms in the Fractured Crystalline and Karst Aquifers in Upper Crocodile River Basin, Johannesburg, South Africa. Hydrology. 2021, 8, 50. [Google Scholar] [CrossRef]
- Hussein Farh, H.M.; Ben Seghier, M.E.A.; Taiwo, R.; Zayed, T. Analysis and Ranking of Corrosion Causes for Water Pipelines: A Critical Review. NPJ Clean Water. 2023, 6, 65. [Google Scholar] [CrossRef]
- Tahraoui, H.; Toumi, S.; Boudoukhani, M.; Touzout, N.; Sid, A.N.E.H.; Amrane, A.; Belhadj, A.E.; Hadjadj, M.; Laichi, Y.; Aboumustapha, M.; et al. Evaluating the Effectiveness of Coagulation–Flocculation Treatment Using Aluminum Sulfate on a Polluted Surface Water Source: A Year-Long Study. Water (Switzerland). 2024, 16, 400. [Google Scholar] [CrossRef]
- Krupińska, I. Aluminium Drinking Water Treatment Residuals and Their Toxic Impact on Human Health. Molecules. 2020, 25, 641. [Google Scholar] [CrossRef]
- Kuzin, E. Synthesis and Use of Complex Titanium-Containing Coagulant in Water Purification Processes. Inorganics (Basel). 2025, 13, 9. [Google Scholar] [CrossRef]
- García-Ávila, F.; Encalada-Alvear, T.; Alvarez-Altamirano, L.M.; Avilés-Añazco, A.; Valdiviezo-Gonzalez, L.; Alfaro-Paredes, E. Human Health Risk Assessment of Aluminium in Water Treated with Aluminium-Based Coagulants in a Rural Area. Results in Engineering. 2025, 25, 104200. [Google Scholar] [CrossRef]
- Kimbell, L.; Wang, Y.; Mcnamara, P.J. The Impact of Metal Pipe Materials, Corrosion Products, and The Impact of Metal Pipe Materials, Corrosion Products, and Corrosion Inhibitors on Antibiotic Resistance in Drinking Water Corrosion Inhibitors on Antibiotic Resistance in Drinking Water Distribution Systems Distribution Systems. Appl. Microbiol. Biotechnol. 2020, 104, 7673–7688. [Google Scholar]
- Stefan, D.S.; Bosomoiu, M.; Teodorescu, G. The Behavior of Polymeric Pipes in Drinking Water Distribution System—Comparison with Other Pipe Materials. Polymers (Basel). 2023, 15, 3872. [Google Scholar] [CrossRef]
- Adjovu, G.E.; Stephen, H.; Ahmad, S.; James, D. Overview of the Application of Remote Sensing in Effective Monitoring of Water Quality Parameters. Remote Sens. (Basel). 2023, 15, 1938. [Google Scholar] [CrossRef]
- Addisie, M.B. Evaluating Drinking Water Quality Using Water Quality Parameters and Esthetic Attributes. Air, Soil and Water Research. 2022, 15, 11786221221075004. [Google Scholar] [CrossRef]
- Aoyi, O.; Seodigeng, T.; Modiba, E.; Otieno, B.; Mabuza, J.; Masedisho, B. Analysis of the Skills Required for Green Economy: The Local Government Sector Perspective.; The Local Government Sector Education and Training (LGSETA), 2016. [Google Scholar]
- Fanteso, B.; Yessoufou, K. Diversity and Determinants of Traditional Water Conservation Technologies in the Eastern Cape Province, South Africa. Environ. Monit. Assess. 2022, 194, 161. [Google Scholar] [CrossRef]
- Adom, R.K.; Simatele, M.D. Overcoming Systemic and Institutional Challenges in Policy Implementation in South Africa’s Water Sector. Sustain. Water Resour. Manag. 2024, 10, 69. [Google Scholar] [CrossRef]
- Latif, M.; Nasim, I.; Ahmad, M.; Nawaz, R.; Tahir, A.; Irshad, M.A.; Al-Mutairi, A.A.; Irfan, A.; Al-Hussain, S.A.; Zaki, M.E.A. Human Health Risk Assessment of Drinking Water Using Heavy Metal Pollution Index: A GIS-Based Investigation in Mega City. Appl. Water Sci. 2025, 15, 12. [Google Scholar] [CrossRef]
- Bolatova, Z.; Sharapatova, R.; Kabiyev, Y.; Berndtsson, R.; Tussupova, K. Towards Sustainable Solutions: Assessing Rural Access to Safe Drinking Water and Sanitation in Atyrau, Kazakhstan. Water (Switzerland). 2025, 17, 664. [Google Scholar] [CrossRef]
- Ngcongo, M.T. Drinking Water Quality in Towns of Alfred Nzo District Municipality in the Eastern Cape Province; Central university of Technology: Bloemfontein, 2020. [Google Scholar]
Figure 1.
Map of Rouxville, Free State, South Africa showing various sampling sites.
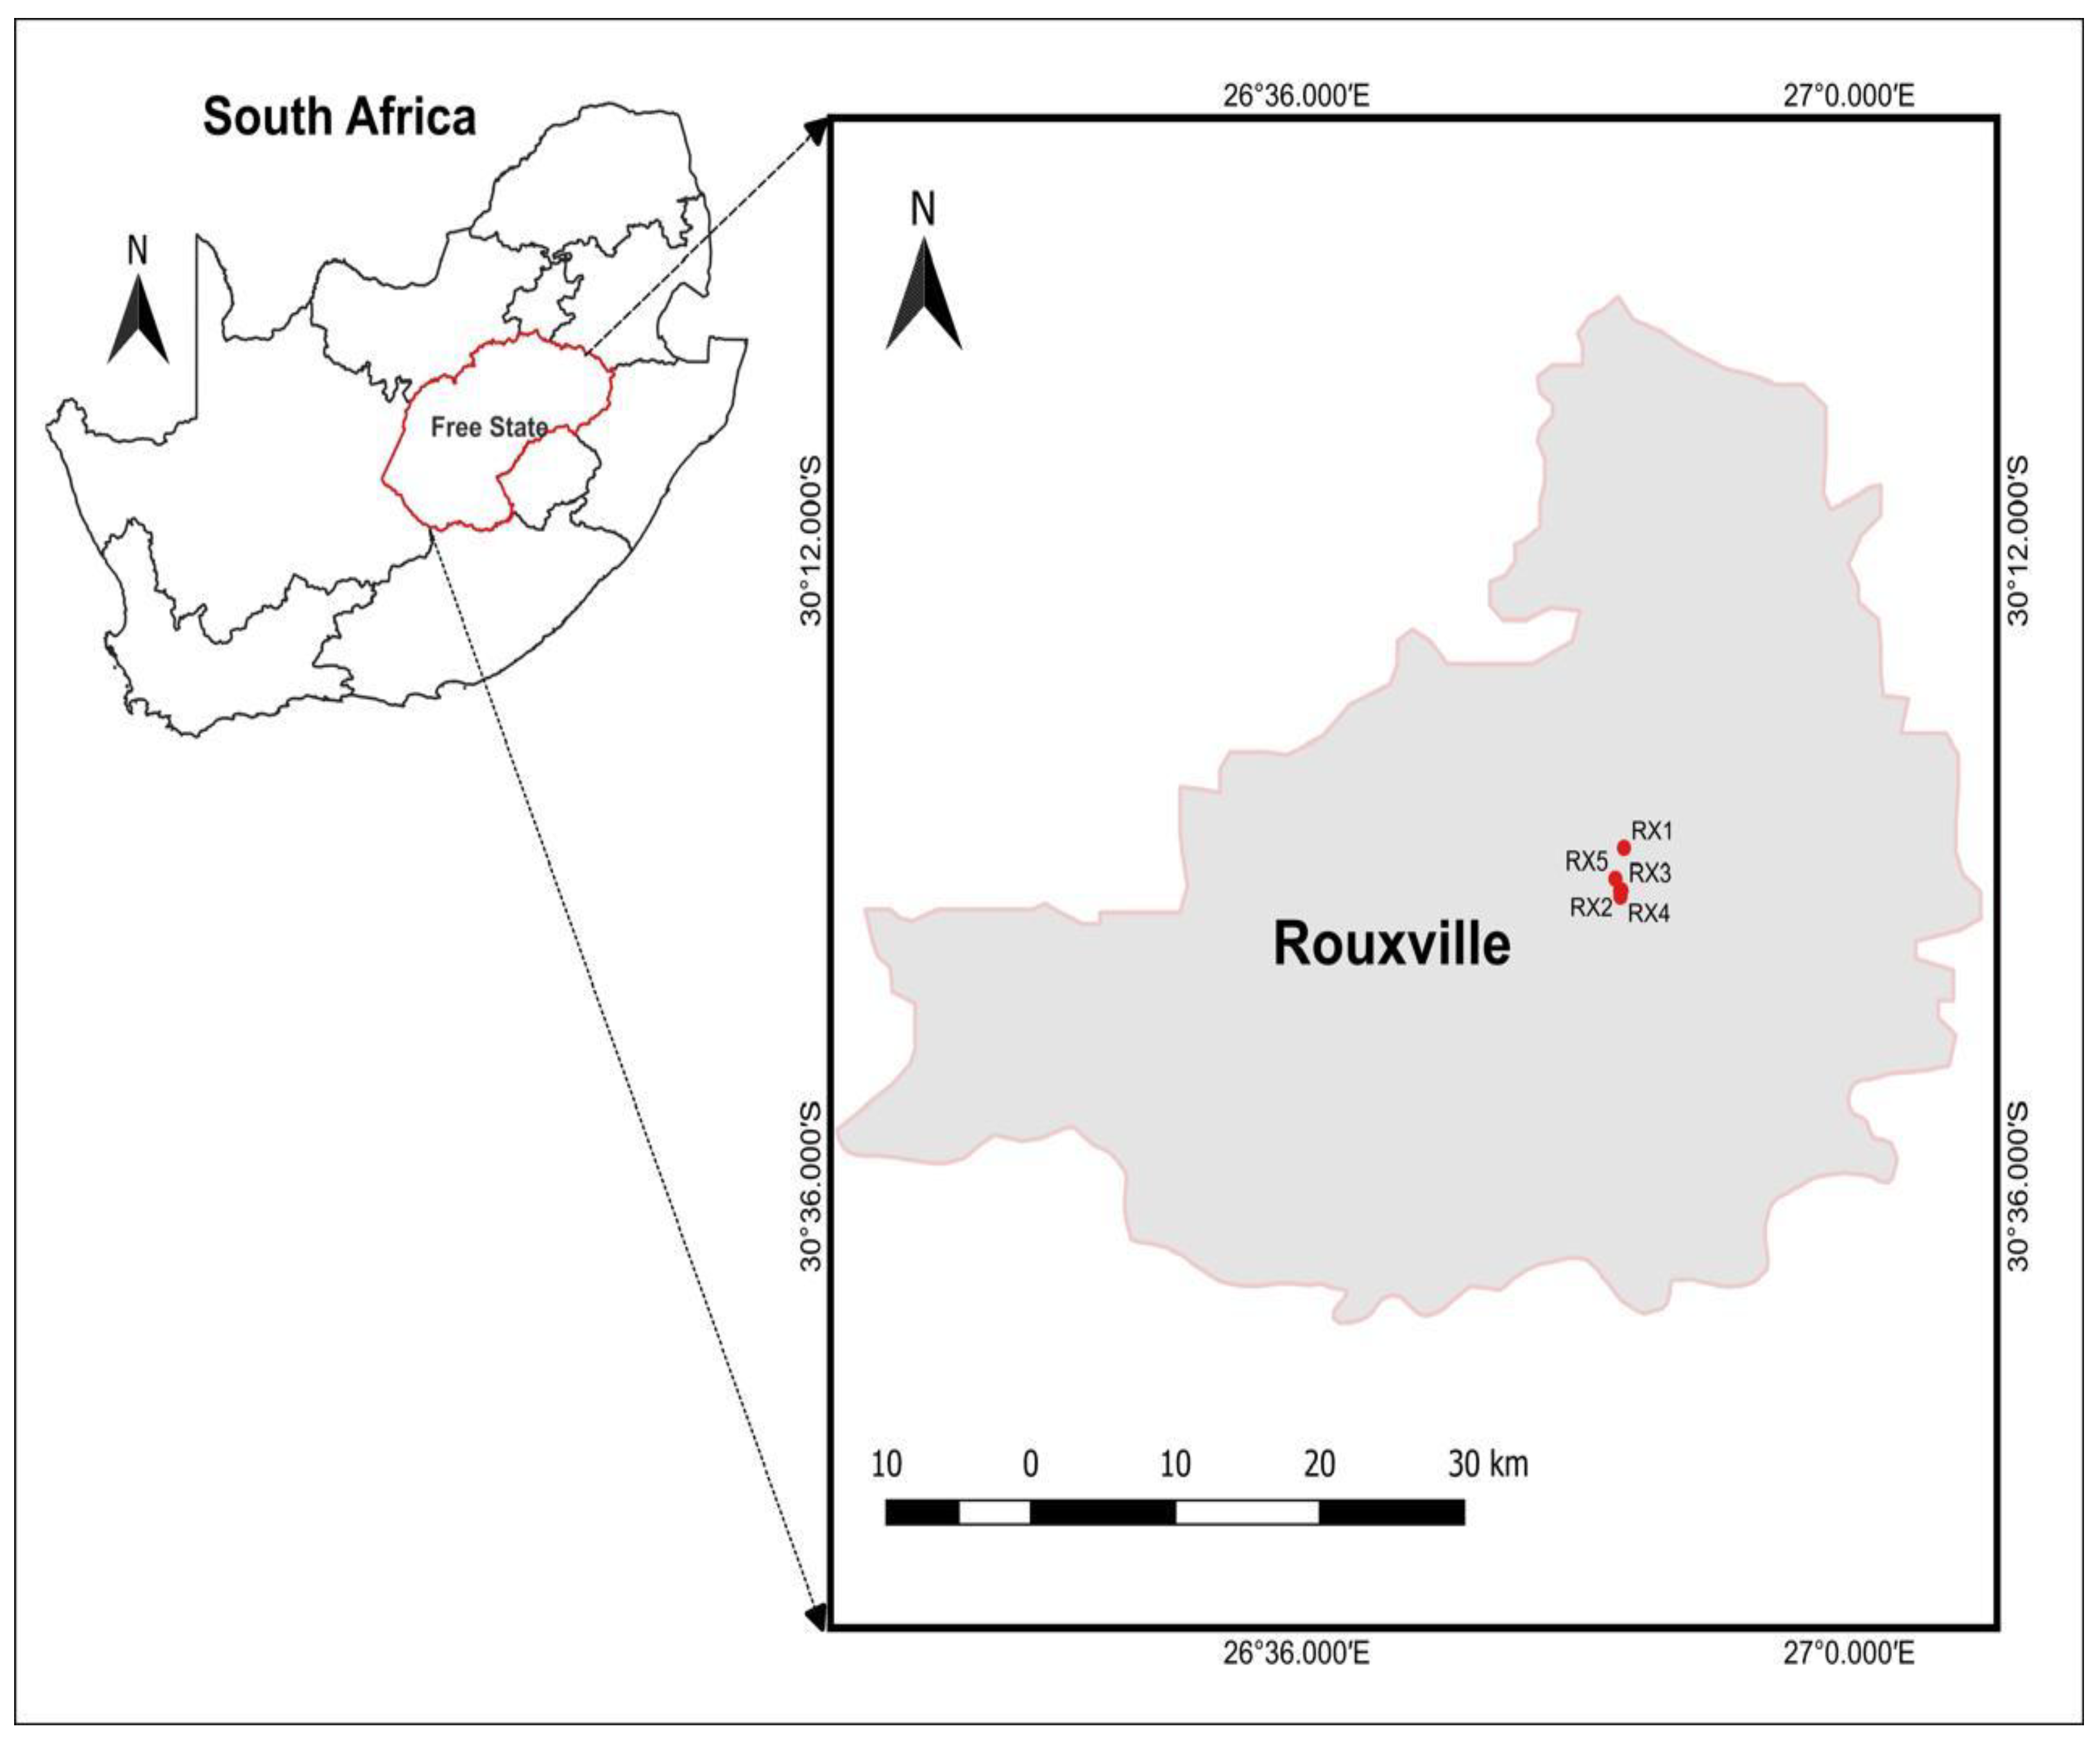

Table 1.
CCME WQI categorisation schema.
| Rank | WQI Value | Description |
|---|---|---|
| Excellent | 95-100 | Water quality is protected with a virtual absence of threat or impairment; conditions very close to natural or pristine levels; these index values can only be obtained if all measurements are within objectives virtually all of the time |
| Good | 80-94 | Water quality is protected with only a minor degree of threat or impairment; conditions rarely depart from natural or desirable levels |
| Fair | 65-79 | Water quality is usually protected but occasionally threatened or impaired; conditions sometimes depart from natural or desirable levels |
| Marginal | 45-64 | Water quality is frequently threatened or impaired; conditions often depart from natural or desirable levels |
| Poor | 0-44 | Water quality is almost always threatened or impaired; conditions usually depart from natural or desirable levels |
Table 2.
Descriptive statistics of total coliform (2021 - 2023).
| 2021 Total coliform (Limit ≤ 10 CFU) |
2022 Total coliform (Limit ≤ 10 CFU) |
2023 Total coliform (Limit ≤ 10 CFU) |
Compliance | ||||||||||
| Sample site | Min | Max | Mean | SD | Min | Max | Mean | SD | Min | Max | Mean | SD | C Overall (%) |
| RX1 | 0,00 | 1,00 | 0,20 | 0,45 | 0,00 | 25,00 | 2,00 | 6,92 | 0,00 | 201,00 | 32,88 | 70,64 | 89,00 |
| RX2 | 0,00 | 6,00 | 1,40 | 2,61 | 0,00 | 19,00 | 2,38 | 5,22 | 0,00 | 59,00 | 14,25 | 21,21 | 89,00 |
| RX3 | 0,00 | 3,00 | 1,00 | 1,41 | 0,00 | 62,00 | 6,00 | 16,97 | 0,00 | 83,00 | 21,63 | 27,77 | 77,00 |
| RX4 | 0,00 | 2,00 | 0,40 | 0,89 | 0,00 | 38,00 | 3,77 | 10,43 | 0,00 | 145,00 | 26,25 | 50,65 | 85,00 |
| RX5 | 0,00 | 0,00 | 0,00 | 0,00 | 0,00 | 11,00 | 2,85 | 4,69 | 0,00 | 83,00 | 22,13 | 29,24 | 76,00 |
Key: Min = minimum; Max = maximum; SD = Standard Deviation; C overall (%) = Compliance overall percentage; RX1 = Rouxville Water Treatment Plant; RX2 = Rouxville Municipality; RX3 = NG Kerk Rouxville; RX4 = Rouxville Police Station; RX5 = Roleleathunya Library.
Table 3.
Descriptive statistics of E. coli (2021 – 2023).
| 2021 E. coli (Limit = 0 CFU) |
2022 E. coli (Limit = 0 CFU) |
2023 E. coli (Limit = 0 CFU) |
Compliance | ||||||||||
| Sample site | Min | Max | Mean | SD | Min | Max | Mean | SD | Min | Max | Mean | SD | C Overall (%) |
| RX1 | 0,00 | 1,00 | 0,20 | 0,45 | 0,00 | 0,00 | 0,00 | 0,00 | 0,00 | 9,00 | 1,38 | 31,1 | 81,00 |
| RX2 | 0,00 | 0,00 | 0,00 | 0,00 | 0,00 | 0,00 | 0,00 | 0,00 | 0,00 | 0,00 | 0,00 | 0,00 | 100,00 |
| RX3 | 0,00 | 0,00 | 0,00 | 0,00 | 0,00 | 0,00 | 0,00 | 0,00 | 0,00 | 2,00 | 0,63 | 0,92 | 87,00 |
| RX4 | 0,00 | 0,00 | 0,00 | 0,00 | 0,00 | 0,00 | 0,00 | 0,00 | 0,00 | 11,00 | 1,75 | 3,77 | 83,00 |
| RX5 | 0,00 | 0,00 | 0,00 | 0,00 | 0,00 | 0,00 | 0,00 | 0,00 | 0,00 | 1,00 | 0,13 | 0,35 | 96,00 |
Key: Min = minimum; Max = maximum; SD = Standard Deviation; C overall (%) = Compliance overall percentage; RX1 = Rouxville Water Treatment Plant; RX2 = Rouxville Municipality; RX3 = NG Kerk Rouxville; RX4 = Rouxville Police Station; RX5 = Roleleathunya Library.
Table 4.
Descriptive statistics of total alkalinity (2021 – 2023).
| 2021 Total Alkalinity (Limit ≤ 200 mg/L) |
2022 Total Alkalinity (Limit ≤ 200mg/L) |
2023 Total Alkalinity (Limit ≤ 200 mg/L) |
Compliance | |||||||||||
| Sample site |
Min |
Max |
Mean |
SD |
Min |
Max |
Mean |
SD |
Min |
Max |
Mean |
SD |
C 0verall (%) |
|
| RX1 | 68,26 | 151,5 | 94,24 | 38,50 | 54,04 | 165,94 | 77,31 | 28,02 | 98,36 | 112,01 | 105,28 | 4,57 | 100,00 | |
| RX2 | 59,75 | 79,21 | 72,49 | 7,85 | 52,05 | 83,65 | 67,84 | 8,07 | 5,00 | 197,51 | 114,72 | 35,12 | 100,00 | |
| RX3 | 61,19 | 80,98 | 72,96 | 8,33 | 52,64 | 81,64 | 67,54 | 8,20 | 97,20 | 107,70 | 105,21 | 3,95 | 100,00 | |
| RX4 | 67,42 | 79,27 | 75,40 | 5,39 | 51,46 | 84,45 | 67,80 | 8,76 | 100,50 | 219,75 | 119,83 | 40,51 | 96,00 | |
| RX5 | 59,66 | 81,19 | 72,31 | 8,30 | 51,20 | 82,41 | 67,46 | 8,91 | 101,06 | 274,14 | 126,48 | 59,75 | 96,00 | |
Key: Min = minimum; Max = maximum; SD = Standard Deviation; C overall (%) = Compliance overall percentage; RX1 = Rouxville Water Treatment Plant; RX2 = Rouxville Municipality; RX3 = NG Kerk Rouxville; RX4 = Rouxville Police Station; RX5 = Roleleathunya.
Table 5.
Descriptive statistics of aluminium (2021 – 2023).
| 2021 Aluminium (Limit ≤ 0.3 mg/L) |
2022 Aluminium (Limit ≤ 0.3 mg/L) |
2023 Aluminium (Limit ≤ 0.3 mg/L) |
Compliance | ||||||||||
| Sample site | Min | Max | Mean | SD | Min | Max | Mean | SD | Min | Max | Mean | SD | C Overall (%) |
| RX1 | 0,00 | 0,03 | 0,01 | 0,01 | 0,00 | 0,12 | 0,03 | 0,04 | 0,0 | 0,07 | 0,04 | 0,02 | 100,00 |
| RX2 | 0,00 | 0,00 | 0,00 | 0,00 | 0,00 | 0,15 | 0,03 | 0,04 | 0,02 | 0,91 | 0,14 | 0,31 | 96,00 |
| RX3 | 0,00 | 0,03 | 0,01 | 0,01 | 0,00 | 0,07 | 0,02 | 0,03 | 0,00 | 0,08 | 0,04 | 0,03 | 100,00 |
| RX4 | 0,00 | 0,00 | 0,00 | 0,00 | 0,00 | 0,11 | 0,02 | 0,04 | 0,00 | 0,82 | 0,12 | 0,28 | 96,00 |
| RX5 | 0,00 | 0,03 | 0,01 | 0,01 | 0,00 | 0,08 | 0,02 | 0,03 | 0,00 | 0,66 | 0,10 | 0,22 | 96,00 |
Key: Min = minimum; Max = maximum; SD = Standard Deviation; C overall (%) = Compliance overall percentage; RX1 = Rouxville Water Treatment Plant; RX2 = Rouxville Municipality; RX3 = NG Kerk Rouxville; RX4 = Rouxville Police Station; RX5 = Roleleathunya Library.
Table 6.
Descriptive statistics of colour (2021 – 2023).
| 2021 Colour (Limit ≤ 15 Pt-Co mg/L) |
2022 Colour (Limit ≤15 Pt-Co mg/L) |
2023 Colour (Limit ≤ 15 Pt-Co mg/L) |
Compliance | |||||||||||
| Sample site | Min | Max | Mean | SD | Min | Max | Mean | SD | Min | Max | Mean | SD | C Overall (%) |
|
| RX1 | 2,00 | 21,00 | 10,40 | 7,67 | 4,00 | 25,00 | 13,23 | 6,88 | 4,00 | 22,00 | 11,50 | 5,50 | 79,00 | |
| RX2 | 6,00 | 26,00 | 12,80 | 7,98 | 7,00 | 133,00 | 30,08 | 35,23 | 3,00 | 29,00 | 12,13 | 7,75 | 71,00 | |
| RX3 | 6,00 | 19,00 | 9,60 | 5,41 | 3,00 | 90,00 | 21,77 | 23,43 | 4,00 | 23,00 | 11,00 | 6,05 | 79,00 | |
| RX4 | 6,00 | 22,00 | 12,80 | 6,06 | 7,00 | 106,00 | 28,46 | 27,91 | 6,00 | 28,00 | 13,38 | 6,80 | 64,00 | |
| RX5 | 5,00 | 20,00 | 8,33 | 6,95 | 3,00 | 59,00 | 20,62 | 18,11 | 5,00 | 26,00 | 12,38 | 6,44 | 74,00 | |
Key: Min = minimum; Max = maximum; SD = Standard Deviation; C overall (%) = Compliance overall percentage; RX1 = Rouxville Water Treatment Plant; RX2 = Rouxville Municipality; RX3 = NG Kerk Rouxville; RX4 = Rouxville Police Station; RX5 = Roleleathunya Library.
Table 7.
CCME-WQI values and WQI ranking.
| Sample Site | CCME-WQI | WQI Ranking |
| RX1 | 69.09 | Fair |
| RX2 | 67.71 | Fair |
| RX3 | 71.27 | Fair |
| RX4 | 59.10 | Marginal |
| RX5 | 64.88 | Marginal |
Note: WQI categories, Excellent (95-100), Good (80-94), Fair (65-79), Marginal (45-64), and Poor (0-44).
Disclaimer/Publisher’s Note: The statements, opinions and data contained in all publications are solely those of the individual author(s) and contributor(s) and not of MDPI and/or the editor(s). MDPI and/or the editor(s) disclaim responsibility for any injury to people or property resulting from any ideas, methods, instructions or products referred to in the content. |
© 2026 by the authors. Licensee MDPI, Basel, Switzerland. This article is an open access article distributed under the terms and conditions of the Creative Commons Attribution (CC BY) license (http://creativecommons.org/licenses/by/4.0/).
Copyright: This open access article is published under a Creative Commons CC BY 4.0 license, which permit the free download, distribution, and reuse, provided that the author and preprint are cited in any reuse.


