Submitted:
03 February 2026
Posted:
04 February 2026
You are already at the latest version
Abstract
Objective: This study aimed to investigate the potential mechanisms by which moderate-intensity aerobic exercise improves cardiovascular dysfunction in high-fat diet-induced obese rats through integrated multi-omics analysis. Methods: Rats were divided into a normal diet group, a high-fat diet group, and a high-fat diet with exercise group. Cardiovascular function was assessed by echocardiography and vascular tension measurement. Gut microbiota, serum metabolites, and protein expression were analyzed using 16S rRNA sequencing, untargeted metabolomics, and proteomics, respectively. Integrated multi-omics analysis was performed using Mantel tests and mediation effect analysis. Results: Eight weeks of aerobic exercise significantly improved cardiovascular function in obese rats, including enhanced acetylcholine-induced vasodilation and increased left ventricular ejection fraction. Furthermore, exercise remodeled the gut microbiota structure, such as altering the abundance of Lactobacillus and Ruminiclostridium_9. Metabolomics revealed that exercise shifted the metabolic phenotype from high-fat diet-induced basal metabolic disorder toward beneficial pathways, including fatty acid biosynthesis and ubiquinone biosynthesis. Proteomics identified key differentially expressed proteins such as APOE, FN1, and Lap3. Integrated multi-omics analysis for the first time revealed a core regulatory axis: exercise may influence Lap3 expression, modulate the abundance of intestinal Lactobacillus, and thereby systematically regulate the level of palmitoyllysophosphatidylcholine, ultimately improving cardiovascular function. Conclusion: Aerobic exercise improves high-fat diet-induced cardiovascular dysfunction by systematically remodeling the gut microbiota–host metabolism–protein expression network. The discovery of the Lap3–Lactobacillus–palmitoyllysophosphatidylcholine axis provides new molecular insights into the exercise-mediated protective mechanisms of the gut–cardiovascular system axis.
Keywords:
obesity
; exercise
; cardiovascular function
; multi-omics analysis
; microbiome
1. Introduction
Cardiovascular diseases (CVDs) stand as a pervasive global health challenge, contributing significantly to morbidity and mortality rates. Amidst the myriad of risk factors, obesity, usually exacerbated by sedentary lifestyles and high-fat diets (HFD), has emerged as a substantial contributor to the escalating burden of CVDs [1]. The intricate relationship between obesity and cardiovascular health has prompted a growing interest in interventions capable of mitigating these risks.
As obesity rates continue to rise globally, exploring effective strategies to alleviate the cardiovascular burden of associated with obesity becomes imperative. Among the interventions under scrutiny, aerobic exercise has gained prominence for its potential to counteract the deleterious effects of HFD on cardiovascular health. A robust body of evidence supports the notion that exercise serves as a potent intervention in ameliorating CVDs, showcasing its multifaceted impact on core physiological processes [2]. These encompass the modulation of gut microbiota, alterations in serum metabolites, and the regulation of key target proteins [3,4,5], collectively contributing to a holistic strategy for cardiovascular health. Understanding the intricate interplay between exercise, the enterohepatic axis, and metabolic pathways becomes crucial in deciphering the systemic influence that exercise exerts.
This study seeks to extend our understanding of exercise's impact on cardiovascular health by unraveling the complex interactions within the gut microbiota, metabolic pathways, and protein regulation. By focusing on these interconnected elements, we aim to provide valuable insights into the mediating effects of aerobic exercise on cardiovascular dysfunction induced by HFD. Through this research, we aspire to contribute not only to the scientific understanding of exercise's role but also to the development of targeted interventions that can alleviate the cardiovascular burden associated with obesity and HFD.
2. Materials and Methods
2.1. Experimental Animals
Male Sprague Dawley (SD) rats were purchased from the VitonLihua Ltd (Beijing, China). All procedures were approved by the Ethics Review Committee of Guangzhou Sport University and followed the NIH Guide for the Care and Use of Laboratory Animals. Rats were housed in the Animal Facility of the Scientific Research Center at Guangzhou Sport University with a 12-hour light/dark cycle, temperature (22 ± 2°C), humidity (50% ± 5%) and free access to chow and water. All animals were acclimatized for a week and thereafter allocated randomly to 3 groups: the normal diet with sedentary group (NC), the high-fat diet with sedentary group (HC), and the high-fat diet with exercise group (HE). To establish a high-fat diet-induced obesity rat model, 6-week-old male SD rats were fed a high-fat diet (20.2% protein, 45.4% fat and 34.5% carbohydrate) for 20 weeks. Rats fed a standard maintenance diet (20.6% protein, 12% fat and 67.4% carbohydrate) served as the control group. Body weight and body length were recorded every week to calculate body mass index (BMI) and LEE’s index. BMI was calculated according to the formula: BMI=weight (kg)/height (m2). LEE’s index was calculated according to the formula: LEE’s index=body weight (g)1/3×1000/body length (cm). After confirming the successful obesity model construction (high-fat diet-fed rats weighing more than 10% of the body weight of standard diet-fed rats and with LEE’s index higher than 1.5%), rats conducted 8-week exercise training using a motor-driven treadmill.
2.2. Aerobic Exercise Training
Rats were subjected to a motor-driven treadmill training as previously described [6].The training period lasted for 8 weeks including one week of adaptive training. Treadmill conditions were as follows: after warming up at 5 m/min for 5 min, running at 5-15 m/min for 50 min to achieve the target intensity in the first week, and the speed has changed to 15m/min for the next 7 weeks, eventually the rats relaxed at 8m/min for 5 min. Training was conducted 5 times a week.
2.3. Echocardiography
Echocardiography was performed in anesthetized (2% isoflurane) rats using a VINNO6VET system (Visual Sonic, North American). Vascular wall thickness, vascular diameter, left ventricular posterior wall (LVPW), LV fractional shortening (FS), LV ejection fraction (EF), maximum flow velocity, and stroke volume were calculated [7]. All measurements were performed for 5 consecutive cardiac cycles.
2.4. In Vitro Arterial Tension Measurement
Vessel tension measurement was performed as previously reported [8]. Briefly, we dissected vessel segments of the rat mesenteric arteries in a petri dish, which was filled with ice-cold Krebs solution (118 mmol/L NaCl, 4.7 mmol/L KCl, 2.5 mmol/L CaCl2, 1.2 mmol/L KH2PO4, 1.2 mmol/L MgSO4 • 7 H2O, 25.2 mmol/L NaHCO3, and 11.1 mmol/L glucose, pH 7.4) that was continuously bubbled with 95% oxygen (O2) and 5% carbon dioxide (CO2) mixed gas. The vessel segments were cut into approximately 2 mm rings and were then transferred to a myograph chamber, the isometric tension was recorded and analyzed using LabChart 8.0 (DMT, 620M, Denmark). Arterial rings were contracted with phenylephrine (1 μmol/L). Once a steady state tension was obtained, ACh was added to the bath in a cumulative fashion to obtain concentration-response curves.
2.5. Cecal Sample Collection and 16s rRNA Sequencing
Cecal samples were collected and snap frozen in liquid nitrogen. The methods of total bacterial DNA extraction and sequencing of the V3-V4 region of the 16S rRNA genes as well as the construction of the sequencing library were illustrated in previous publications [9,10]. The 16S rRNA gene amplicon was sequenced on the Illumina MiSeq platform with the manufacturer's instructions. The resulting data was concatenated and filtered using Trimmomatic(version 0.35) to obtain a set of high-quality sequence for downstream analysis [11]. The qualified reads were clustered into operational taxonomic units (OTUs) with the USEARCH (version 10.0) based on a 97% sequence similarity cut-off value [12]. Next, alpha diversities including the Chao, ACE, Shannon, and Simpson were performed using R software v4.2.3 (vegan package), beta diversity calculated using Bray-Curtis dissimilarity matrix were performed using Quantitative Insights into Microbial (QIIME) (version 1.9.1). Rarefaction curves were generated using usearch -alpha_div_rare. Furthermore, differences in relative abundance of the microbial features were determined by linear discriminant analysis (LDA) effect size (LEfSe) [13]. Finally, species taxonomy was acquired by annotating feature sequences with a naive Bayes classifier based on the reference database provided by Silva (http://www.arb-silva.de).
2.6. Metagenomic Pathway Prediction by PICRUSt2
PICRUSt2 was utilized to predict the metagenomic functional compositions [14]. Pathways that were different in abundance between the HC VS NC and HE VS NC were obtained using Student's t-test, and the Storey FDR was used to correct for multiple tests. STAMP software (v2.1.3) was utilized for statistical analyses and visualization of the identified pathways.
2.7. Non-Targeted Serum Metabolomics Analysis
Blood samples were collected in tubes without anticoagulant for serum preparation. Serum samples were separated by centrifugation (1500 g for 15 min at 22℃) and stored at -80℃. The metabolite profiles of liver were detected by a UPLC-MS/MS system (Thermo Fisher Scientific, Waltham, MA, USA) via Novogene (Novogene, Beijing, China). Sample preparation for metabolomic analysis has been described previously [15]. The chromatographic and mass spectrometry settings established in the work refer to the device parameters of Yu et al. [16]. Subsequently, the raw data were preprocessed for further multivariate analysis. Detailed procedures for data processing and analysis included de-noising based on the relative standard deviation (RSD), quality evaluation, missing value imputation, normalization, transformation,and scaling. The final dataset contained the information of peak number, sample name, and normalized peak area and was imported to SIMCA16.0.2 software package (Sartorius Stedim Data Analytics AB, Umea, Västerbotten, Sweden). The precursor molecule passed the combined criteria: VIP > 1 and coarse P value < 0.05 were considered significantly changed between any two groups. For clustering heat maps, the data were normalized using z-scores of the intensity areas of differential metabolites and were plotted by Pheatmap package in R language. Further, after scanning for the differential metabolite features, the fragment information obtained was then further matched with the annotations in HMDB, Metlin, LipidMaps, and in-house standards database (PPM < 20) to accurately identify metabolite information. The Small Molecule Pathway Database (SMPDB) (https://smpdb.ca) was used to identify and interpret the change patterns of metabolites in important biological pathways for different metabolites identified.
2.8. Sample Preparation for Label-Free Proteomics and Analysis
The total proteins were extracted from perfused serum by homogenizing in RIPA lysis buffer (Thermo scientific, Waltham, USA) and protein amounts were measured by BCA protein assay. Protein lysates (250 μg) were trypsinized using the modified filter-aided sample preparation method [17]. Protein samples were first reduced by dithiothreitol, denatured with 10 mol / L urea and alkylated with iodoacetamide, and then centrifuged through a high molecular weight cut-off centrifugal filter (Millipore Sigma, 10 k MWCO). Next, the digested peptides were collected after overnight digestion with sequencing-grade trypsin (Promega, Madison, Wisconsin, USA) at 37°C and cleaned with a C18 ProtoTM 300 Å ultramicrocentrifugal column. Digested peptide samples (60 μg) were labeled with a tandem mass tag (TMT) TMT10plex TM isomeric labeling reagent group (ThermoFisher Scientific). Finally, the Oasis HLB extraction column (Waters Corporation, Milford, MA, USA) was used for concentration and desalination, and the digested peptides were extracted [18]. The peptides were analyzed using LC-MS/MS on Q ExactiveTM HF-X (Thermo Fisher Scientific) coupled to an EASY-nLC 1000 UPLC system (Thermo Fisher Scientific). The raw data from the mass spectrometer were analyzed by Proteome Discoverer v2.2.0.388.
Statistical analysis for the proteomic data was carried out with R packages. First, the raw data were transformed by taking logarithmic base 2 followed by quantile normalization. Next, differential proteins (P < 0.05) were further filtered by fold-change (FC) criteria (−0.6 < log2FC < 0.6) yielding the significant results for the differential proteins. Moreover, the search tool for recurring instances of neighbouring genes (STRING) (https://cn.string-db.org/) was used to analyze protein-protein interactions. Finally, the Gene Ontology (GO) (http://geneontology.org/) was used for pathway enrichment analysis. P value < 0.05 was considered to be statistically significant.
2.9. Integrative Analysis of Multi-Omic Data
Correlation was analyzed using the Pearson statistical method between the differentially expressed metabolites and differentially expressed proteins, and between the DEMs and differential microbiota, the correlation coefficient R and p value were calculated. Correlations between differentially expressed metabolites and differential microbiota were visualized using the pheatmap package. Additionally, we used Cytoscape (version 3.9.1) [19] to visualize the correlation relationships between the DEMs and differential microbiota. Finally, to investigate the causal role of gut bacteria in contributing to the key proteins through key metabolites, mediation analysis was conducted using the "mediate" function from the R package "mediation".
2.10. Statistical Analysis
The present study adhered to rigorous statistical methods to ensure the validity and reliability of the results. All continuous parameters were first examined for normality using the Shapiro-Wilk test. Specifically, the standard error of means ± SD was used to represent error bars. Baseline differences between the 2 groups were analyzed using a 2-tailed independent t test. The paired t test was used to compare the means within each group. The false discovery rate (FDR) was calculated in multiple testing, considering FDR-corrected P value of less than 0.05 as statistically significant. Statistical significance was assigned at P values of less than 0.05, which were computed using R software.
3. Results
3.1. Exercise Ameliorated Obesity-Induced Cardiovascular Dysfunction
From Week 1 to Week 20, a high-fat diet was used to induce an obesity model, during which the body weights of the HC and HE groups increased rapidly and were significantly higher than that of the NC group. From Week 20 to Week 28, rats in the HE group was conducted with the exercise training while continuously fed the high-fat diet. The body weight of the HE group tended to stabilize, while that of the HC group continued to increase (Figure 1A). To avoid the impact of individual differences in body weight data due to size differences on the modeling effect, we recorded and analyzed the body weight and length data of rats at Week 20 and Week 28 to calculate the Lee's index (Figure 1B) and BMI (Figure 1C). Our results showed that compared to the NC group, the Lee's index and BMI of the HC and HE groups at Week 20 significantly increased. However, at Week 28, the Lee's index and BMI of the HE group was significantly lower than that of the HC group. These results indicated that the animal model of obesity was successfully established and exercise training significantly reduced the body weight and BMI of obese rats.
As shown in Figure 1D, ACh-induced vasorelaxation was markedly attenuated in the HC group compared to that in the NC group; however, this attenuation was significantly reversed in the HE group. Similarly, compared to rats in the NC group, rats in the HC group exhibited higher half maximal effective concentration (EC50) values for ACh, and this enhancement was significantly inhibited in the HE group (Figure 1D). Furthermore, compared to rats in the NC group, rats in the HC group showed significant decrease in vascular wall thickness, vascular diameter, and maximum flow velocity, and these reductions were significantly reversed in the HE group. These results indicated that long-term aerobic exercise protected against vascular dysfunction especially endothelial dysfunction in rats with obesity (Figure 1E-G).
In addition, left ventricular ejection fraction (LVEF), fractional shortening (FS), and left ventricular posterior wall (LVPW) were markedly attenuated in the HC group compared to that in the NC group; however, these reductions were significantly reversed in the HE group. Meanwhile, compared to the HC group, stroke volume (SV) in HE group also increased after exercise training (P = 0.07). These results suggested that long-term exercise training can restore obesity-induced cardiac insufficiency in rats (Figure 1H-K).
3.2. Exercise Restored the Gut Microbiota Imbalance Caused by HFD
To evaluate intestinal microbial composition, Illumina MiSeq/NovaSeq high-throughput sequencing was performed with rat fecal samples from all three groups. The rarefaction curves (Figure S1A) of all samples supported the adequacy of the sequencing depth. The OTUs Flower Venn diagram showed 214 OTUs commonly shared by the NC, HC, and HE groups (Figure 2A). We first analyzed the differential changes in gut microbiota among the three groups using α diversity. Although no significant differences were observed in α-diversity values among the groups (Figure 2B), we noted a gradually increasing trend in species richness across the three groups, demonstrating that HFD can alter the composition of the rat gut microbiota. Next, we Performed Principal Coordinate analysis (PCoA) on the three sample groups (Figure 2C) and simultaneously assessed differences among them using Adonis analysis. Results indicated significant alterations in bacterial community structure among NC, HC, and HE group (p < 0.001). To investigate the specific mechanisms underlying gut microbiota differences among the three groups, we performed Linear discriminant analysis Effect Size (LEfSe) analysis at the genus and species levels for the NC, HC, and HE groups. As shown in Figure 2F, we found that g_Lactobacillus had the highest LDA score in the NC group, g__Ruminiclostridium_9 had the highest score in the HC group, and g_Blautia had the highest score in the HE group. Additionally, we conducted a depth analysis of the relative abundance changes in microbial phylum and genera across groups. The Firmicutes was the most dominant phylum, with a relative abundance of 68.5% in the NC group, 73.3% in the HC group, and 75.5% in the HE group (Figure 2E, Table S1). The second most dominant phylum was Bacteroidetes (NC: 23.9%, HC: 15.6%, HE: 15.4%). Interestingly, we observed a significant decrease in probiotics (such as g__Lactobacillus) in the HC group, demonstrating that HFD markedly disrupts the gut microbiota in rats (Figure 2F and Table S2). Through Lefse analysis (Figure 2D), we identified three sets of potential gut microbiota biomarkers: the relative abundance of g_Lactobacillus was significantly elevated in the NC group (P<0.01), g__Ruminiclostridium_9 showed significantly increased relative abundance in the HC group (P<0.01), and the relative abundance of g__Blautia was significantly increased in both the HC and HE groups (P < 0.05). (Figure 2G). Finally, the functional information of the differential gut microbiota in each group was predicted based on the Phylogenetic Investigation of Communities by Reconstruction of Unobserved States 2 (PICRUSt2), which illustrated that compared to the NC group, the HC and HE groups were significantly enriched in the bile acid metabolic pathway to varying degrees (Supplementary Figure S1B-C). Based on the above results, we found that HFD significantly disrupted the gut microbiota of rats, leading to a decrease in the abundance of probiotic bacteria such as g_Lactobacillus and an increase in the abundance of pathogenic bacteria like g__Ruminiclostridium_9. Additionally, we identified the beneficial bacterium g_Blautia as a significantly differential genus in the HE group, suggesting its potential as an obesity biomarker for cardiovascular and metabolic disease risk [20].
3.3. Analyses of Serum Metabolites
To explore the difference in metabolites, untargeted metabolomics that based on ultra-performance liquid chromatography/tandem mass spectrometry (UPLC-MS/MS) with positive mode acquisition (POS) was used to analyze rat serum samples from all three groups. To better evaluate the differential metabolites among three groups, we constructed volcano plots to visualize p-values and fold change values (Figure 3A-C). We examined the p-value, variable importance of projection (VIP) value, and fold change value from the volcano plots, which showed remarkably differential metabolites among groups, with red dots representing significantly upregulated metabolites, green dots representing significantly downregulated metabolites, and gray dots representing metabolites without significant change. Among them, a total of 49, 83, and 6 different expressed metabolites (DEMs) were identified between the HC and NC groups, the HE and NC groups, and the HE and HC groups, respectively (Table S3-S5). Subsequently, we conducted metabolism correlation analysis to evaluate changes of metabolites in different groups. The results revealed the top 50 differential metabolites in the NC, HC, and HE groups had marked correlations (Supplementary Figure S2A-B). Notably, we found 3 DEMs that associated with the NC, HC, and HE groups, and 5 unique DEMs in the HC group vs. the NC groups, 1 unique DEM in the HE group vs. the HC group, and 39 DEMs in the HE group vs. the NC group (Figure 3D). Next, the heatmapss showed the expression of differential metabolites among three groups (Figure 3E). Finally, our enrichment analysis indicated that pathways mainly enriched in the NC group vs. the HC group were methylhistidine metabolism, vitamin B6 metabolism, phospholipid biosynthesis, beta-alanine metabolism, and histidine metabolism, and pathways enriched in the HC group vs. the HE group included fatty acid biosynthesis, thiamine metabolism, ubiquinone and other terpenoid-quinone biosynthesis, caffeine metabolism, and phenylalanine metabolism (Figure 3F-G).
3.4. Identification of Different Expressed Proteins (DEPs)
We further performed proteomic analysis of rat serum in the NC, HC, and HE groups to identify DEPs and their functions. Firstly, we identified DEPs in the HC group vs. the NC group, the HE group vs. the HC group, and the HE group vs. the NC group with a |log2 (fold change) |≥ 0.6 and a p-value < 0.05. Significantly up-regulated and down-regulated DEPs in the indicated groups were labeled in Figure 4A-C and Table S6-S8. Among them, there are 35 DEPs in the HC group vs. the NC group, 28 DEPs in the HE group vs. the HC group, and 18 DEPs in the HE group vs the NC group (Figure 4D). Subsequently, we showed the expression of three groups of DEPs in the form of heatmaps (Figure 4E). Interestingly, compared to HC group, 11 proteins were significantly down-regulated while 7 proteins were significantly up-regulated after exercise. Furthermore, the GO enrichment analysis of DEPs in the HC group vs. the NC group revealed several enriched pathways, including peptide cross-linking, immune system process, positive regulation of B cell activation, immunoglobulin complex, cornified envelope, immunoglobulin receptor binding, antigen binding (Figure 4F). DEPs in the HE group vs the NC group mainly enriched in the retinol metabolic process, low-density lipoprotein particle remodeling, extracellular space, heparin binding, receptor binding, and peptide hormone binding (Figure 4G). To fully understand the functional enrichment of DEPs in the HE group vs. the HC group, we selected the TOP 7 GO enrichment pathway to be shown in Figure 4H, which included the enrichment of innate immune response, retinol metabolism, complement activation, extracellular space , calcium binding and calcium ion binding.
3.5. Integrated DEMs and Differential Gut Microbiota
Next, we correlated the differentially abundant gut microbiota with the differential metabolites. As shown in the Figure 5A, a total of 47 metabolites were correlated with 22 genera in the HC group vs. the NC group. Interestingly, 35 out of 47 metabolites were negatively correlated with genera. However, 45 out of 47 metabolites were positively correlated with genera (Table S9). Notably, we observed g__Bacteroides was remarkably negatively correlated with 1-Palmitoyllysophosphatidylcholine (M538T184) and g__Lactobacillus was remarkably negatively correlated with Quinolin-2-ol (M146T60). Meanwhile, correlations between the genera and differential metabolites in the HE group vs. the NC group are shown in Figure 5B. 40 out of 82 metabolites were negatively correlated with genera and 74 out of 82 metabolites were positively correlated with genera (Table S10). Interestingly, we observed g__Yersinia was remarkably positively correlated with Ectoine (M143T324), 2-piperidinecarboxylic acid, and Acetamide (M497T114_1). Oleoyl-l-carnitine (M426T167) was remarkably negatively correlated with g__Aureimonas. Furthermore, in consistent with previous results, only 6 metabolites were correlated with 6 genera in the HE group vs. the HC group (Figure 5C, Table S11). We observed g__Peptoclostridium, g__Marvinbryantia, and g__Blautia were correlated with Oxandrolone (M613T112). In addition, an unidentified genus was significantly associated with N-alpha-acetyl-l-lysine (M171T264), L-propionylcarnitine (M218T278), 1h-indazole-4-carboxamide (M570T183), and 2-oleoyl-1-palmitoyl-sn-glycero-3-phosphocholine (M783T140).
3.6. Integrated DEPs and Differential Metabolites
We conducted Pearson correlation analysis using network diagrams of expression correlations between DEPs and differential metabolites (Supplementary Figure S3A-C). In total, we identified 41 significant correlations between DEPs and differential metabolites in the HC group vs. the NC group (Figure 6A). Among them, LBP, Igh-6, Lap3, and Fetub had cross-sectional relationships with 1h-indazole-4-carboxamide (M570T183), Leucine (M132T266), Quinolin-2-ol (M146T60), 2-epahpa (M628T188), and Stachydrine (M144T272). In the HE group vs. the NC group (Figure 6B), the DEPs, such as Mpo, Serpina4, Mbl2, and Gucy2c had cross relationships with the differential metabolites, such as Leucine, Quinolin-2-ol, N-Docosanoyl-4-sphingenyl-1-O-phosphorylcholine (M810T168), N-(octadecanoyl)-sphing-4-enine-1-phosphocholine (M732T173), N-stearoylsphinganine (M569T40), and N-oleoyl-d-erythro-sphingosylphosphorylcholine (M730T172). Besides, In the HE group vs. the HC group (Figure 6C), we observed that there have closely relationships between DEPs such as Mbl2, LOC367586, Ghr, Osox1, Tifa, Fetub, Tll1, Rbp4, Igh-6, Kr15, LOC100360095, Ifhx4, Ces2c, Hyal1, and Adgre5 and metabolites such as 1h-indazole-4-carboxamide (M570T183), Oxandrolone (M613T112), L-propionylcarnitine (M218T278), 2-oleoyl-1-palmitoyl-sn-glycero-3-phosphocholine (M783T140), 1-palmitoyl-sn-glycero-3-phosphocholine (M496T189_7), and N-alpha-acetyl-l-lysine (M171T264).
3.7. Multi-Omics Integration Analysis Revealed the Crosstalk Among Differential Gut Microbiota, Serum Metabolites, and Proteins
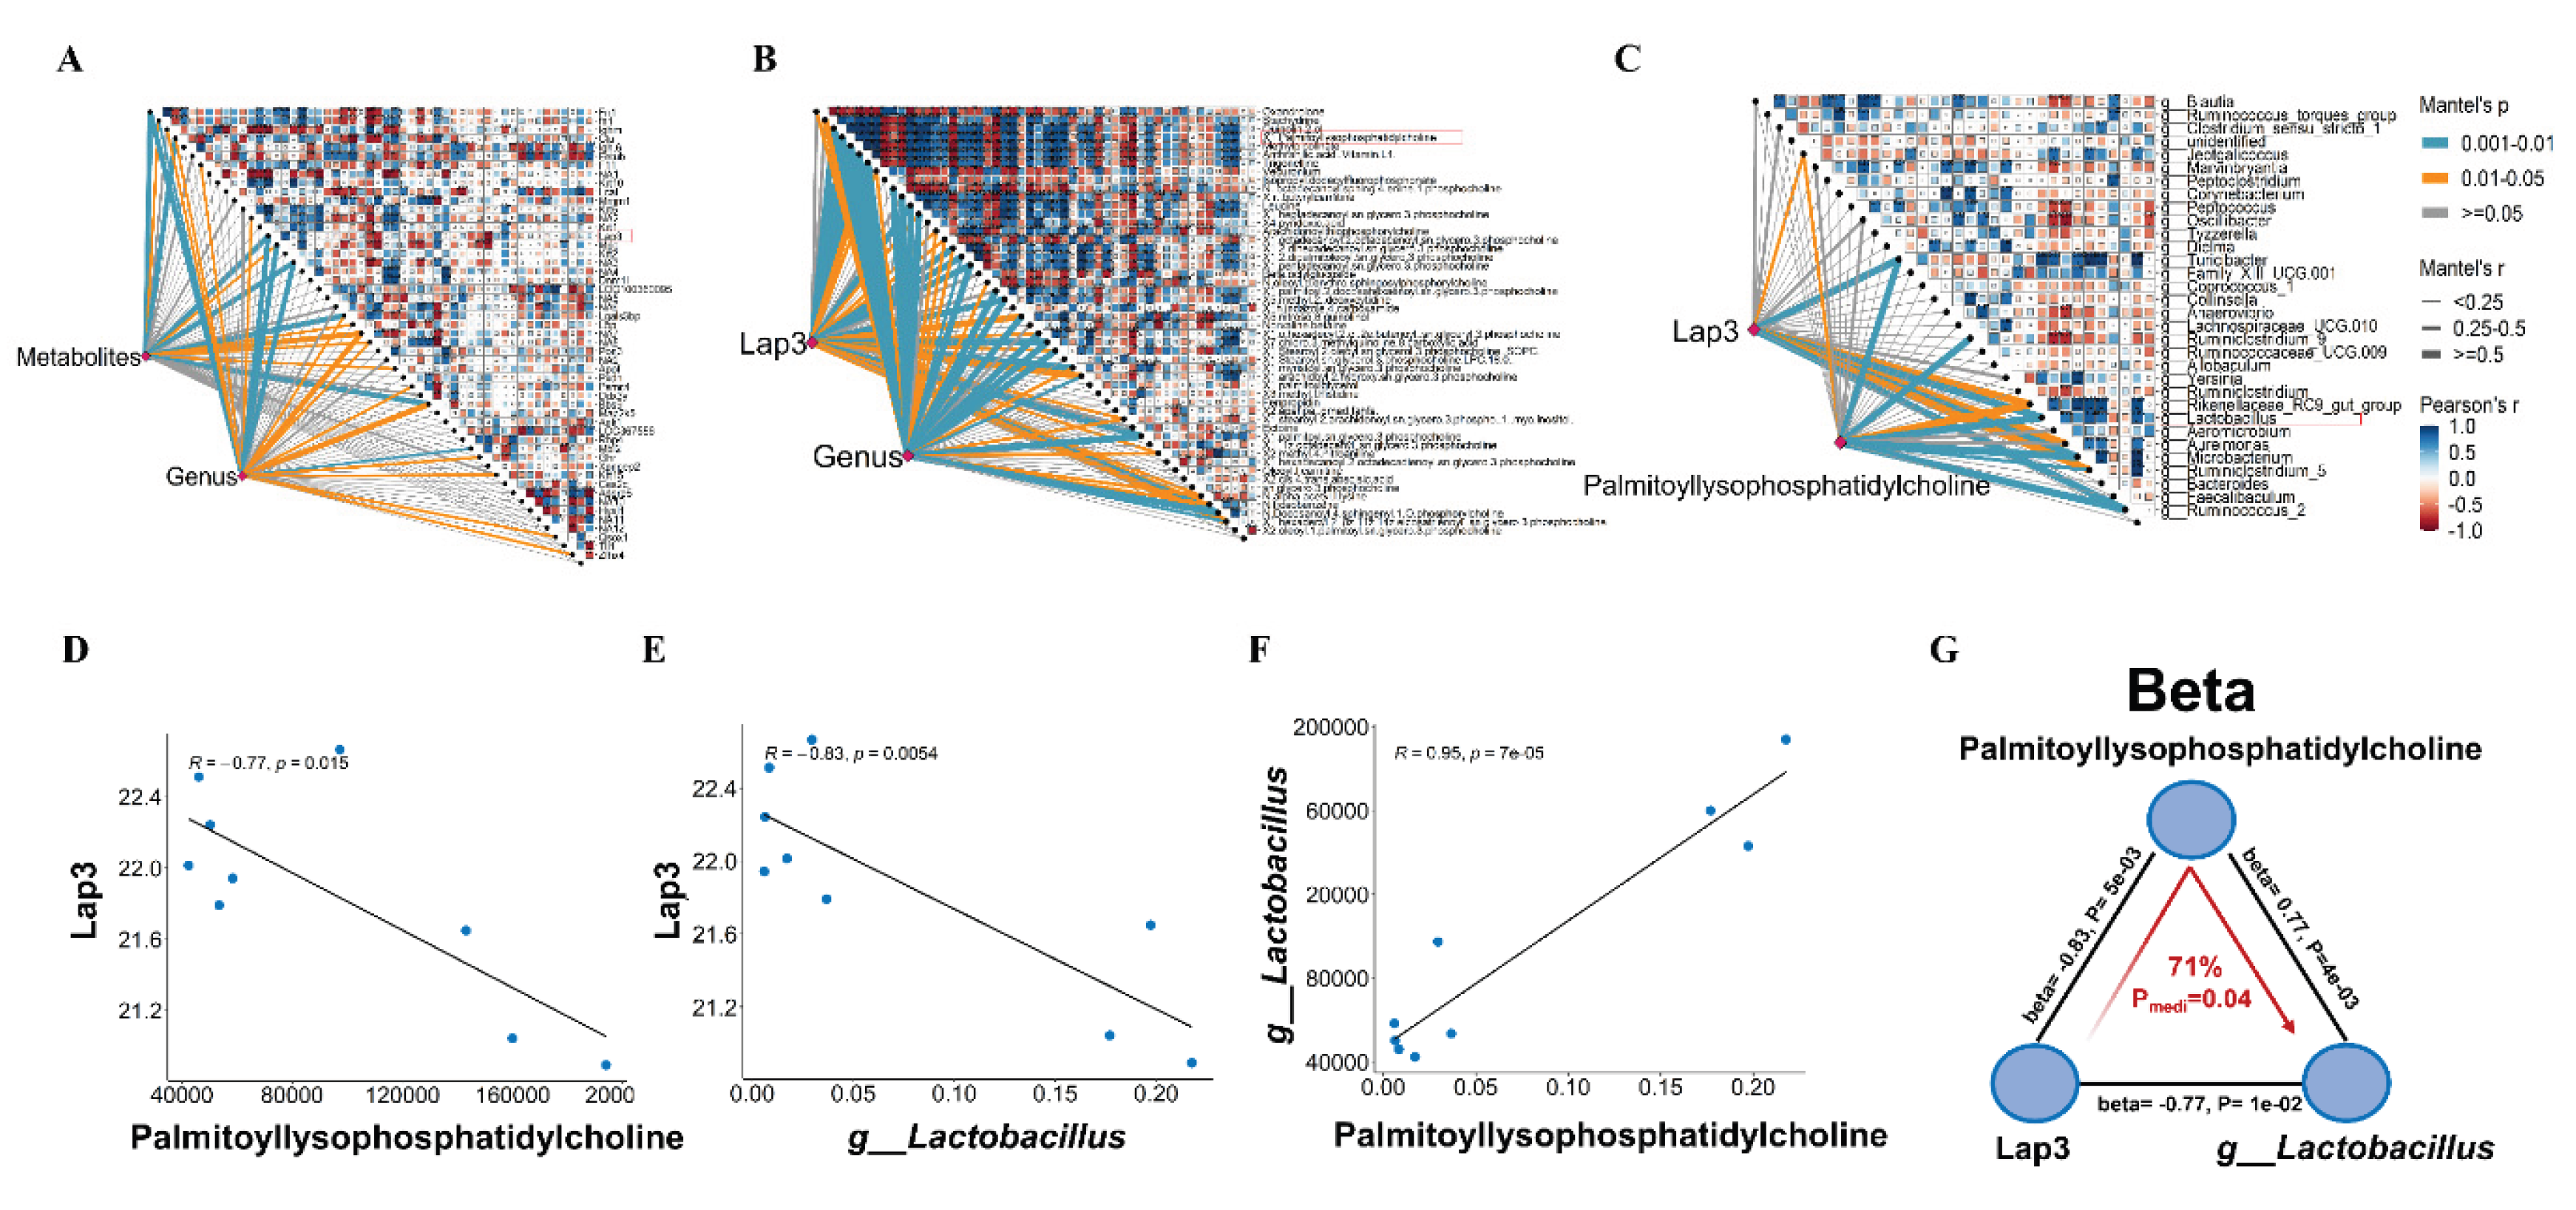
We further utilized Mantel Test to explore the potential correlations among DEPs, DEMs, and differential genera. We firstly correlated distance-corrected dissimilarities of metabolites and genera with those of proteins. As shown in Figure 7A, Fn1, Mpo, and Lap3 were the strongest correlates of these metabolites and genera. A previous study had shown that cholesterol-induced upregulation of Lap3 inhibited autophagy in the pathogenesis of NAFLD [21]. Subsequently, hub metabolites were identified according to Lap3 and genera (Figure 7B). We found that Palmitoyllysophosphatidylcholine and Leucine had significant correlations with Lap3 and genera. Palmitoyllysophosphatidylcholine has been widely reported as a novel lipid biomarker for cardiovascular dysfunction [22]. Leucine, a branched amino acid, has anti-obesity effects on glucose tolerance, lipid metabolism, and insulin sensitivity [23]. We next used Lap3 and Palmitoyllysophosphatidylcholine to further reveal the key microbiota and surprisingly found g__Lactobacillus had potentially important link with both Lap3 and Palmitoyllysophosphatidylcholine (Figure 7C). In addition, a negative association between Lap3 and Palmitoyllysophosphatidylcholine was revealed (R = -0.77, P = 0.015) (Figure 7D). Particularly, there was also a negative correlation between Lap3 and g__Lactobacillus (R = -0.83, P = 0.0054) (Figure 7E). Besides, the positive correlation between g__Lactobacillus and Palmitoyllysophosphatidylcholine was observed (R = 0.95, P = 7e-05) (Figure 7F). Our mediation analysis showed Lap3 causally contributed to Palmitoyllysophosphatidylcholine accumulation through promoting g__Lactobacillus (Pmediation = 0.04, 71%) (Figure 7G). In summary, these results suggest that exercise may improve obesity-induced cardiovascular dysfunction through regulating the crosstalk among Lap3, Palmitoyllysophosphatidylcholine, and g__Lactobacillus.
4. Discussion
This study employed integrated multi-omics analysis in high-fat diet (HFD)-induced obese rats to elucidate the potential mechanisms by which moderate-intensity aerobic exercise improves cardiovascular dysfunction. Our findings demonstrate that exercise not only directly enhanced vascular endothelial function and cardiac pumping capacity—evidenced by improved acetylcholine-induced vasodilation, left ventricular ejection fraction (LVEF), and fractional shortening (FS)—but also systematically remodeled the gut microbiota structure, regulated the serum metabolome (e.g., palmitoyl-lysophosphatidylcholine and leucine), and modulated the expression of key proteins such as Lap3 and APOE. These alterations, through complex microbiota-metabolite-protein interactions, collectively constitute the cardiovascular protective effects of exercise. The integrated multi-omics approach provides a comprehensive, multi-tiered perspective on how exercise improves cardiovascular health, highlighting its innovative value in deciphering complex physiological mechanisms.
Extensive evidence establishes exercise as an effective intervention for enhancing cardiovascular function [24,25]. Obesity, frequently accompanied by cardiovascular and metabolic risks, accelerates atherosclerosis and hypertension through mechanisms including visceral fat accumulation-induced dyslipidemia and increased vascular resistance. Consistent with this, our study confirmed that 8 weeks of moderate-intensity aerobic exercise significantly reduced body weight, body mass index (BMI), and Lee's index in HFD-fed rats, while improving endothelial function and cardiac parameters (e.g., LVEF and FS). These benefits align with the known capacity of exercise to restore nitric oxide (NO) balance and attenuate pathological vasoconstriction [26], supporting the established role of regular aerobic activity in counteracting obesity-related adverse effects and improving a spectrum of cardiovascular metrics [27].
The intricate relationship between obesity and cardiovascular disease (CVD) is well-documented, driving considerable research into exercise's potential to mitigate these conditions [28]. Our results further show that exercise remodeled the disrupted gut microecology: the HFD-induced decrease in beneficial bacteria (e.g., Lactobacillus) and increase in conditionally pathogenic bacteria (e.g., Ruminiclostridium_9) were partially reversed after exercise, consistent with previous reports [29,30]. Probiotics like Lactobacillus produce short-chain fatty acids (SCFAs) through fermentation, which exert anti-inflammatory and immunomodulatory effects, influence obesity-related pathways, and directly or indirectly impact CVD. Conversely, Ruminiclostridium_9 is an inflammatory biomarker; its elevated abundance may compromise intestinal barrier function, increase gut permeability, and thereby promote endotoxin translocation and chronic inflammation [31,32]—a key driver of both obesity and CVD. Exercise likely helps maintain intestinal integrity by suppressing its overgrowth. Functional prediction of differential microbiota across groups indicated significant enrichment in bile acid metabolic pathways in both the HC and HE groups. This may stem from gut microbial dysbiosis, where reduced diversity diminishes SCFA synthesis and its consequent health benefits. Studies report an expanded bile acid pool and increased total circulating bile acid concentration in obese individuals [33]. Bile acids, primary products of cholesterol metabolism, play crucial roles in lipid homeostasis and regulate other gut microbiota-derived metabolites (e.g., SCFAs and TMAO), some of which modulate immunity and atherosclerosis. The bile acid pathway is a key component of the gut-liver axis, whose balance is vital for systemic health; its disruption is closely linked to various hepatic, intestinal, and metabolic disorders, including obesity, type 2 diabetes, and metabolic syndrome [34]. This finding underscores the systemic impact of exercise on metabolic pathways and offers a valuable direction for future research.
Multi-omics analysis further revealed exercise's influence on metabolic and protein networks. HFD and exercise affected metabolites through distinct pathways. In our study, HFD likely disrupted fundamental energy metabolism processes, with significant enrichment in pathways related to methylhistidine, vitamin B6, and phospholipid biosynthesis. Altered methylhistidine metabolism may reflect abnormal skeletal muscle protein function [35], while dysregulated vitamin B6 metabolism is closely associated with oxidative stress and inflammation—core drivers of atherosclerosis [36,37]. In contrast, the metabolic profile of the exercise group shifted fundamentally, showing enrichment in pathways such as fatty acid biosynthesis, thiamine metabolism, and ubiquinone biosynthesis. Fatty acids serve as fuel for energy supply; the onset of exercise markedly increases the uptake and oxidation of long-chain fatty acids in skeletal muscle, and the energy demands of aerobic activity can upregulate fatty acid synthesis to meet this demand [38]. Thiamine is essential for myocardial energy metabolism and has shown potential to improve LVEF in heart failure patients [39]—a finding paralleled by the significantly increased ejection fraction in HE group (Figure 1). Moreover, exercise stimulates metabolism dependent on thiamine, riboflavin, and vitamin B6, potentially increasing the requirement for these vitamins in athletes and active individuals [40]. Ubiquinone deficiency is linked to various diseases, including heart failure, and its supplementation may improve myocardial mitochondrial function and reduce oxidative damage [41,42,43]. The enrichment of these pathways likely represents classic adaptive responses to exercise, supporting the concept that exercise counteracts HFD-induced cardiovascular injury by optimizing energy metabolism, enhancing mitochondrial antioxidant capacity, and regulating the metabolism of vasoactive substances.
At the protein level, key differentially expressed proteins—including MBL2, APOE, FN1, CLU, and Lap3—were implicated in pathways governing immune-inflammatory regulation, apolipoprotein synthesis, anti-inflammatory actions, and promotion of vascular endothelial cell synthesis. APOE is a central regulator of lipid transport and metabolism, playing a core role in atherogenesis [44]. FN1 is an important modulator of tissue remodeling, processes implicated in atherosclerosis; higher plasma FN1 levels are associated with a reduced risk of coronary artery disease [45]. CLU, considered cardioprotective against damage from myocardial infarction or myocarditis, has a complex role in CVD [46]. MBL is a key component of the innate immune system and may be involved in the pathogenesis of atherosclerosis [47,48]. Collectively, these proteins and pathways suggest that exercise improves cardiovascular function by modulating systemic immune responses and maintaining lipid metabolic homeostasis.
Using Mantel tests and mediation effect analysis to integrate gut microbiome, serum metabolome, and proteomics data, we identified for the first time a regulatory axis linking a protein, gut microbiota, and a metabolite: Lap3–Lactobacillus–palmitoyl-lysophosphatidylcholine. Mediation analysis indicated that the physiological environment shaped by exercise allows changes in Lap3 expression to modulate the abundance of intestinal Lactobacillus, thereby influencing the levels of this lipid metabolite (mediation P-value = 0.04, explanatory proportion: 71%). This highlights the utility of exercise in regulating specific interactions and systematically reveals the multi-dimensional remodeling mechanisms through which aerobic exercise alleviates HFD-induced cardiovascular dysfunction. Previous research on Lap3 has focused on its role in cancer or in the pathogenesis of non-alcoholic fatty liver disease (NAFLD), where cholesterol-induced Lap3 upregulation inhibits autophagy, and its expression is significantly higher in severe NAFLD but decreases post-treatment [21,49,50]. Our study proposes that Lap3 may act as a factor conveying exercise-induced metabolic signals to the gut. Furthermore, while the cardiovascular benefits of Lactobacillus are often attributed to local effects like improving gut barrier function and producing SCFAs, our findings connect its abundance to a specific exercise-mediated proteomic change [51]. Finally, palmitoyl-lysophosphatidylcholine is widely reported as a novel lipid biomarker for cardiovascular dysfunction. This axis provides new molecular evidence for elucidating the "gut-heart axis" mechanism by which aerobic exercise improves HFD-induced cardiovascular dysfunction.
The benefits of aerobic exercise extend beyond the regulation of single targets to encompass the remodeling of entire biomolecular interaction networks. We have partially elucidated how exercise contributes to cardiovascular protection by restoring gut microbiota composition, enhancing beneficial metabolites, and regulating immune-related proteins. However, this study acknowledges the current limitations in fully understanding exercise's impact on cardiovascular health. Therefore, while highlighting the complementary, multi-faceted strategy offered by exercise, we emphasize the paramount role of dietary control in preventing the onset and progression of CVD. Future research should employ tools such as Lap3 conditional knockout animal models combined with fecal microbiota transplantation to directly verify the necessity of each component within this axis. Finally, the application of multi-omics methodologies provides a novel perspective and toolkit for dissecting these complex relationships, effectively showcasing the efficacy of aerobic exercise against HFD-induced cardiovascular dysfunction in rats. By integrating diverse data from genomics, proteomics, and metabolomics, researchers can achieve a more holistic understanding of the interactions between different biological systems and the relationships among key molecules.
In conclusion, our study illuminates the promising role of aerobic exercise in mitigating obesity-induced cardiovascular dysfunction by modulating gut microbiota, serum metabolites, and key proteins. These findings underscore exercise as a comprehensive strategy for cardiovascular health, highlighting its potential to influence systemic metabolism and immune responses. This understanding opens avenues for targeted interventions and emphasizes the importance of incorporating exercise into holistic approaches for preventing and managing CVDs.
Supplementary Materials
The following supporting information can be downloaded at the website of this paper posted on Preprints.org.
Author Contributions
WD performed the experiments and wrote the manuscript; XL analyzed the data and wrote the manuscript; MH supervised the study; GD performed the experiments. JH conceived and supervised the study, drafted the manuscript, and performed the experiments and analyzed the data; All authors have read and approved the final version of the manuscript, and agree with the order of presentation of the author.
Acknowledgments
This study are supported by the Guangdong Scientific Research Platform and Projects for the Higher-educational Institution (2023ZDZX2033, 2025WCXTD012, 2025KQNCX035) and the Open Fund of Dr. Neher’s Biophysics Laboratory for Innovative Drug Discovery, Macau University of Science and Technology.
Conflicts of Interest
The authors declare that they have no competing interests.
References
- Li, JJ; Liu, HH; Li, S. Landscape of cardiometabolic risk factors in Chinese population: a narrative review. Cardiovasc Diabetol 2022, 21, 113. [Google Scholar] [CrossRef] [PubMed]
- Jin, L; Diaz-Canestro, C; Wang, Y; Tse, MA; Xu, A. Exerkines and cardiometabolic benefits of exercise: from bench to clinic. EMBO Mol Med 2024, 16, 432–444. [Google Scholar] [CrossRef] [PubMed]
- Cerdá, B; Pérez, M; Pérez-Santiago, JD; Tornero-Aguilera, JF; González-Soltero, R; Larrosa, M. Gut Microbiota Modification: Another Piece in the Puzzle of the Benefits of Physical Exercise in Health? Front Physiol 2016, 7, 51. [Google Scholar] [CrossRef]
- Pérez-Prieto, I; Plaza-Florido, A; Ubago-Guisado, E; Ortega, FB; Altmäe, S. Physical activity, sedentary behavior and microbiome: A systematic review and meta-analysis. J Sci Med Sport 2024, 27, 793–804. [Google Scholar] [CrossRef]
- Moholdt, T; Parr, EB; Devlin, BL; Debik, J; Giskeødegård, G; Hawley, JA. The effect of morning vs evening exercise training on glycaemic control and serum metabolites in overweight/obese men: a randomised trial. Diabetologia 2021, 64, 2061–2076. [Google Scholar] [CrossRef]
- Huang, J; Li, P; Shen, B; Gao, H; Wang, S; Wang, P; Deng, W; Gao, D; Hu, M. Long-term aerobic exercise enhances circulating exosomal miR-214-3p to promote endothelial progenitor cell-mediated repair of endothelial damage induced by obesity. J Sport Health Sci 2025, 101094. [CrossRef]
- Li, G; Shao, Y; Guo, HC; Zhi, Y; Qiao, B; Ma, K; Du, J; Lai, YQ; Li, Y. MicroRNA-27b-3p down-regulates FGF1 and aggravates pathological cardiac remodelling. Cardiovascular research 2022, 118, 2139–2151. [Google Scholar] [CrossRef]
- Huang, J; Zhang, H; Tan, X; Hu, M; Shen, B. Exercise restores impaired endothelium-derived hyperpolarizing factor-mediated vasodilation in aged rat aortic arteries via the TRPV4-K(Ca)2.3 signaling complex. Clin Interv Aging 2019, 14, 1579–1587. [Google Scholar] [CrossRef]
- Zhang, J; Feng, D; Law, HK; Wu, Y; Zhu, GH; Huang, WY; Kang, Y. Integrative Analysis of Gut Microbiota and Fecal Metabolites in Rats after Prednisone Treatment. Microbiology spectrum 2021, 9, e0065021. [Google Scholar] [CrossRef]
- Yin, H; Huang, J; Hu, M. Moderate-Intensity Exercise Improves Endothelial Function by Altering Gut Microbiome Composition in Rats Fed a High-Fat Diet. J Nippon Med Sch 2022, 89, 316–327. [Google Scholar] [CrossRef] [PubMed]
- Bolger, AM; Lohse, M; Usadel, B. Trimmomatic: a flexible trimmer for Illumina sequence data. Bioinformatics (Oxford, England) 2014, 30, 2114–2120. [Google Scholar] [CrossRef]
- Edgar, RC. Search and clustering orders of magnitude faster than BLAST. Bioinformatics (Oxford, England) 2010, 26, 2460–2461. [Google Scholar] [CrossRef]
- Segata, N; Izard, J; Waldron, L; Gevers, D; Miropolsky, L; Garrett, WS; Huttenhower, C. Metagenomic biomarker discovery and explanation. Genome biology 2011, 12, R60. [Google Scholar] [CrossRef] [PubMed]
- Douglas, GM; Maffei, VJ; Zaneveld, JR; Yurgel, SN; Brown, JR; Taylor, CM; Huttenhower, C; Langille. MGI: PICRUSt2 for prediction of metagenome functions. Nature biotechnology 2020, 38, 685–688. [Google Scholar] [CrossRef]
- Yang, WY; Wang, J; Li, XH; Xu, B; Yang, YW; Yu, L; Zhang, B; Feng, JF. : Analysis of non-targeted serum metabolomics in patients with chronic kidney disease and hyperuricemia. Biotechnology & genetic engineering reviews 2023, 1–27. [Google Scholar]
- Yu, L; Lai, Q; Feng, Q; Li, Y; Feng, J; Xu, B. : Serum Metabolic Profiling Analysis of Chronic Gastritis and Gastric Cancer by Untargeted Metabolomics. Frontiers in oncology 2021, 11, 636917. [Google Scholar] [CrossRef] [PubMed]
- Wiśniewski, JR; Zougman, A; Nagaraj, N; Mann, M. Universal sample preparation method for proteome analysis. Nature methods 2009, 6, 359–362. [Google Scholar] [CrossRef] [PubMed]
- Keshishian, H; Burgess, MW; Gillette, MA; Mertins, P; Clauser, KR; Mani, DR; Kuhn, EW; Farrell, LA; Gerszten, RE; Carr, SA. Multiplexed, Quantitative Workflow for Sensitive Biomarker Discovery in Plasma Yields Novel Candidates for Early Myocardial Injury. Molecular & cellular proteomics: MCP 2015, 14, 2375–2393. [Google Scholar]
- Shannon, P; Markiel, A; Ozier, O; Baliga, NS; Wang, JT; Ramage, D; Amin, N; Schwikowski, B; Ideker, T. Cytoscape: a software environment for integrated models of biomolecular interaction networks. Genome research 2003, 13, 2498–2504. [Google Scholar] [CrossRef]
- Ozato, N; Saito, S; Yamaguchi, T; Katashima, M; Tokuda, I; Sawada, K; Katsuragi, Y; Kakuta, M; Imoto, S; Ihara, K. Blautia genus associated with visceral fat accumulation in adults 20-76 years of age. NPJ Biofilms Microbiomes 2019, 5, 28. [Google Scholar] [CrossRef]
- Feng, L; Chen, Y; Xu, K; Li, Y; Riaz, F; Lu, K; Chen, Q; Du, X; Wu, L; Cao, D. Cholesterol-induced leucine aminopeptidase 3 (LAP3) upregulation inhibits cell autophagy in pathogenesis of NAFLD. Aging 2022, 14, 3259–3275. [Google Scholar] [CrossRef]
- Rai, S; Bhatnagar, S. Novel Lipidomic Biomarkers in Hyperlipidemia and Cardiovascular Diseases: An Integrative Biology Analysis. Omics: a journal of integrative biology 2017, 21, 132–142. [Google Scholar] [CrossRef]
- Zhang, L; Li, F; Guo, Q; Duan, Y; Wang, W; Zhong, Y; Yang, Y; Yin, Y. Leucine Supplementation: A Novel Strategy for Modulating Lipid Metabolism and Energy Homeostasis. Nutrients 2020, 12. [Google Scholar] [CrossRef]
- Lavie, CJ; Ozemek, C; Carbone, S; Katzmarzyk, PT; Blair, SN. Sedentary Behavior, Exercise, and Cardiovascular Health. Circ Res 2019, 124, 799–815. [Google Scholar] [CrossRef]
- Fiuza-Luces, C; Santos-Lozano, A; Joyner, M; Carrera-Bastos, P; Picazo, O; Zugaza, JL; Izquierdo, M; Ruilope, LM; Lucia, A. Exercise benefits in cardiovascular disease: beyond attenuation of traditional risk factors. Nat Rev Cardiol 2018, 15, 731–743. [Google Scholar] [CrossRef]
- Sakellariou, XM; Papafaklis, MI; Domouzoglou, EM; Katsouras, CS; Michalis, LK; Naka, KK. Exercise-mediated adaptations in vascular function and structure: Beneficial effects in coronary artery disease. World J Cardiol 2021, 13, 399–415. [Google Scholar] [CrossRef] [PubMed]
- Lavie, CJ; Arena, R; Swift, DL; Johannsen, NM; Sui, X; Lee, DC; Earnest, CP; Church, TS; O'Keefe, JH; Milani, RV. Exercise and the cardiovascular system: clinical science and cardiovascular outcomes. Circ Res 2015, 117, 207–219. [Google Scholar] [CrossRef]
- Csige, I; Ujvárosy, D; Szabó, Z; Lőrincz, I; Paragh, G; Harangi, M; Somodi, S. The Impact of Obesity on the Cardiovascular System. Journal of diabetes research 2018, 2018, 3407306. [Google Scholar] [CrossRef] [PubMed]
- Li, SN; Zhang, DL; Wang, ZH; Song, WT; Chen, WB; Hu, GL; Han, LY; Zhou, JC. Anti-obesity effects exerted by Dioscorea opposita Thunb. polysaccharides in diet-induced obese mice. Food Sci Nutr 2023, 11, 6459–6469. [Google Scholar] [CrossRef]
- Fackelmann, G; Manghi, P; Carlino, N; Heidrich, V; Piccinno, G; Ricci, L; Piperni, E; Arrè, A; Bakker, E; Creedon, AC. Gut microbiome signatures of vegan, vegetarian and omnivore diets and associated health outcomes across 21,561 individuals. Nat Microbiol 2025, 10, 41–52. [Google Scholar] [CrossRef] [PubMed]
- Schaus, SR; Vasconcelos Pereira, G; Luis, AS; Madlambayan, E; Terrapon, N; Ostrowski, MP; Jin, C; Henrissat, B; Hansson, GC; Martens, EC. Ruminococcus torques is a keystone degrader of intestinal mucin glycoprotein, releasing oligosaccharides used by Bacteroides thetaiotaomicron. mBio 2024, 15, e0003924. [Google Scholar] [CrossRef]
- Haedge, F; Reuken, PA; Reißing, J; Große, K; Frissen, M; El-Hassani, M; Aschenbach, R; Teichgräber, U; Stallmach, A; Bruns, T. Surrogate Markers of Intestinal Permeability, Bacterial Translocation and Gut-Vascular Barrier Damage Across Stages of Cirrhosis. Liver Int 2025, 45, e70119. [Google Scholar] [CrossRef]
- Molinaro, A; Wahlström, A; Marschall. HU: Role of Bile Acids in Metabolic Control. Trends Endocrinol Metab 2018, 29, 31–41. [Google Scholar] [CrossRef] [PubMed]
- Guan, B; Tong, J; Hao, H; Yang, Z; Chen, K; Xu, H; Wang, A. Bile acid coordinates microbiota homeostasis and systemic immunometabolism in cardiometabolic diseases. Acta pharmaceutica Sinica B 2022, 12, 2129–2149. [Google Scholar] [CrossRef] [PubMed]
- Young, VR; Havenberg, LN; Bilmazes, C; Munro, HN. Potential use of 3-methylhistidine excretion as an index of progressive reduction in muscle protein catabolism during starvation. Metabolism 1973, 23, 1429–1436. [Google Scholar] [CrossRef]
- Stach, K; Stach, W; Augoff, K. Vitamin B6 in Health and Disease. Nutrients 2021, 13. [Google Scholar] [CrossRef] [PubMed]
- Ueland, PM; McCann, A; Midttun, Ø; Ulvik, A. Inflammation, vitamin B6 and related pathways. Mol Aspects Med 2017, 53, 10–27. [Google Scholar] [CrossRef] [PubMed]
- Kiens B: Skeletal muscle lipid metabolism in exercise and insulin resistance. Physiol Rev 2006, 86, 205–243. [CrossRef]
- DiNicolantonio, JJ; Niazi, AK; Lavie, CJ; O'Keefe, JH; Ventura, HO. Thiamine supplementation for the treatment of heart failure: a review of the literature. Congest Heart Fail 2013, 19, 214–222. [Google Scholar] [CrossRef]
- Manore, MM. Effect of physical activity on thiamine, riboflavin, and vitamin B-6 requirements. Am J Clin Nutr 2000, 72, 598s–606s. [Google Scholar] [CrossRef]
- Al Saadi, T; Assaf, Y; Farwati, M; Turkmani, K; Al-Mouakeh, A; Shebli, B; Khoja, M; Essali, A; Madmani, ME. Coenzyme Q10 for heart failure. Cochrane Database Syst Rev 2021, Cd008684. [Google Scholar]
- Hargreaves, I; Heaton, RA. Mantle D: Disorders of Human Coenzyme Q10 Metabolism: An Overview. Int J Mol Sci 2020, 21. [Google Scholar] [CrossRef]
- Drobnic, F; Lizarraga, MA; Caballero-García, A; Cordova, A. Coenzyme Q(10) Supplementation and Its Impact on Exercise and Sport Performance in Humans: A Recovery or a Performance-Enhancing Molecule? Nutrients 2022, 14. [Google Scholar] [CrossRef] [PubMed]
- Huang, Y; Mahley, RW. Apolipoprotein E: structure and function in lipid metabolism, neurobiology, and Alzheimer's diseases. Neurobiol Dis 2014, 72, 3–12. [Google Scholar] [CrossRef]
- Soubeyrand, S; Lau, P; Nikpay, M; Dang, AT; McPherson, R. Common Polymorphism That Protects From Cardiovascular Disease Increases Fibronectin Processing and Secretion. Circ Genom Precis Med 2022, 15, e003428. [Google Scholar] [CrossRef]
- Pereira, RM; Mekary, RA; da Cruz Rodrigues, KC; Anaruma, CP; Ropelle, ER; da Silva, ASR; Cintra, DE; Pauli, JR; de Moura, LP. Protective molecular mechanisms of clusterin against apoptosis in cardiomyocytes. Heart Fail Rev 2018, 23, 123–129. [Google Scholar] [CrossRef]
- Montellano, FA; Ungethüm, K; Ramiro, L; Nacu, A; Hellwig, S; Fluri, F; Whiteley, WN; Bustamante, A; Montaner, J; Heuschmann. PU: Role of Blood-Based Biomarkers in Ischemic Stroke Prognosis: A Systematic Review. Stroke 2021, 52, 543–551. [Google Scholar] [CrossRef]
- Pągowska-Klimek, I; Cedzyński, M. Mannan-binding lectin in cardiovascular disease. Biomed Res Int 2014, 2014, 616817. [Google Scholar] [CrossRef] [PubMed]
- Niu, L; Geyer, PE; Wewer Albrechtsen, NJ; Gluud, LL; Santos, A; Doll, S; Treit, PV; Holst, JJ; Knop, FK; Vilsbøll, T. Plasma proteome profiling discovers novel proteins associated with non-alcoholic fatty liver disease. Mol Syst Biol 2019, 15, e8793. [Google Scholar] [CrossRef] [PubMed]
- He, X; Huang, Q; Qiu, X; Liu, X; Sun, G; Guo, J; Ding, Z; Yang, L; Ban, N; Tao, T. LAP3 promotes glioma progression by regulating proliferation, migration and invasion of glioma cells. Int J Biol Macromol 2015, 72, 1081–1089. [Google Scholar] [CrossRef]
- Qian, X; Guo, Y; Sun, P. Mechanisms of exercise in preventing cardiovascular diseases: Insights from gut microbiota characteristics in pathological states of cardiovascular diseases. Rev Endocr Metab Disord 2025, 26, 693–718. [Google Scholar] [CrossRef] [PubMed]
Figure 1.
Exercise restored obesity-induced cardiovascular dysfunction. (A-C) Box line chart showing body weight (A), LEE’S index (B) and BMI (C) of the NC (n=8), NE (n=10), HC (n=8), and HE (n=10) rats. D: Line chart showing mesenteric artery vasodilatory capacity after Ach stimulation in the indicated groups. (E-G) Maximum flow velocity (G), vascular wall thickness (E) and vascular diameter (F) in the indicated groups. (H-I) The content of cardiac function left ventricular ejection fraction (LVEF) (H), fractional shortening (FS) (I), left ventricular posterior wall (LVPW) (J), stroke volume (SV) (K) in the indicated groups. *P < 0.05, **P < 0.01, #: compare to HC, +: same group before and after comparison. All data were shown as the mean ± SD. NC, normal control; HC, high diet control; HE, high diet excise.
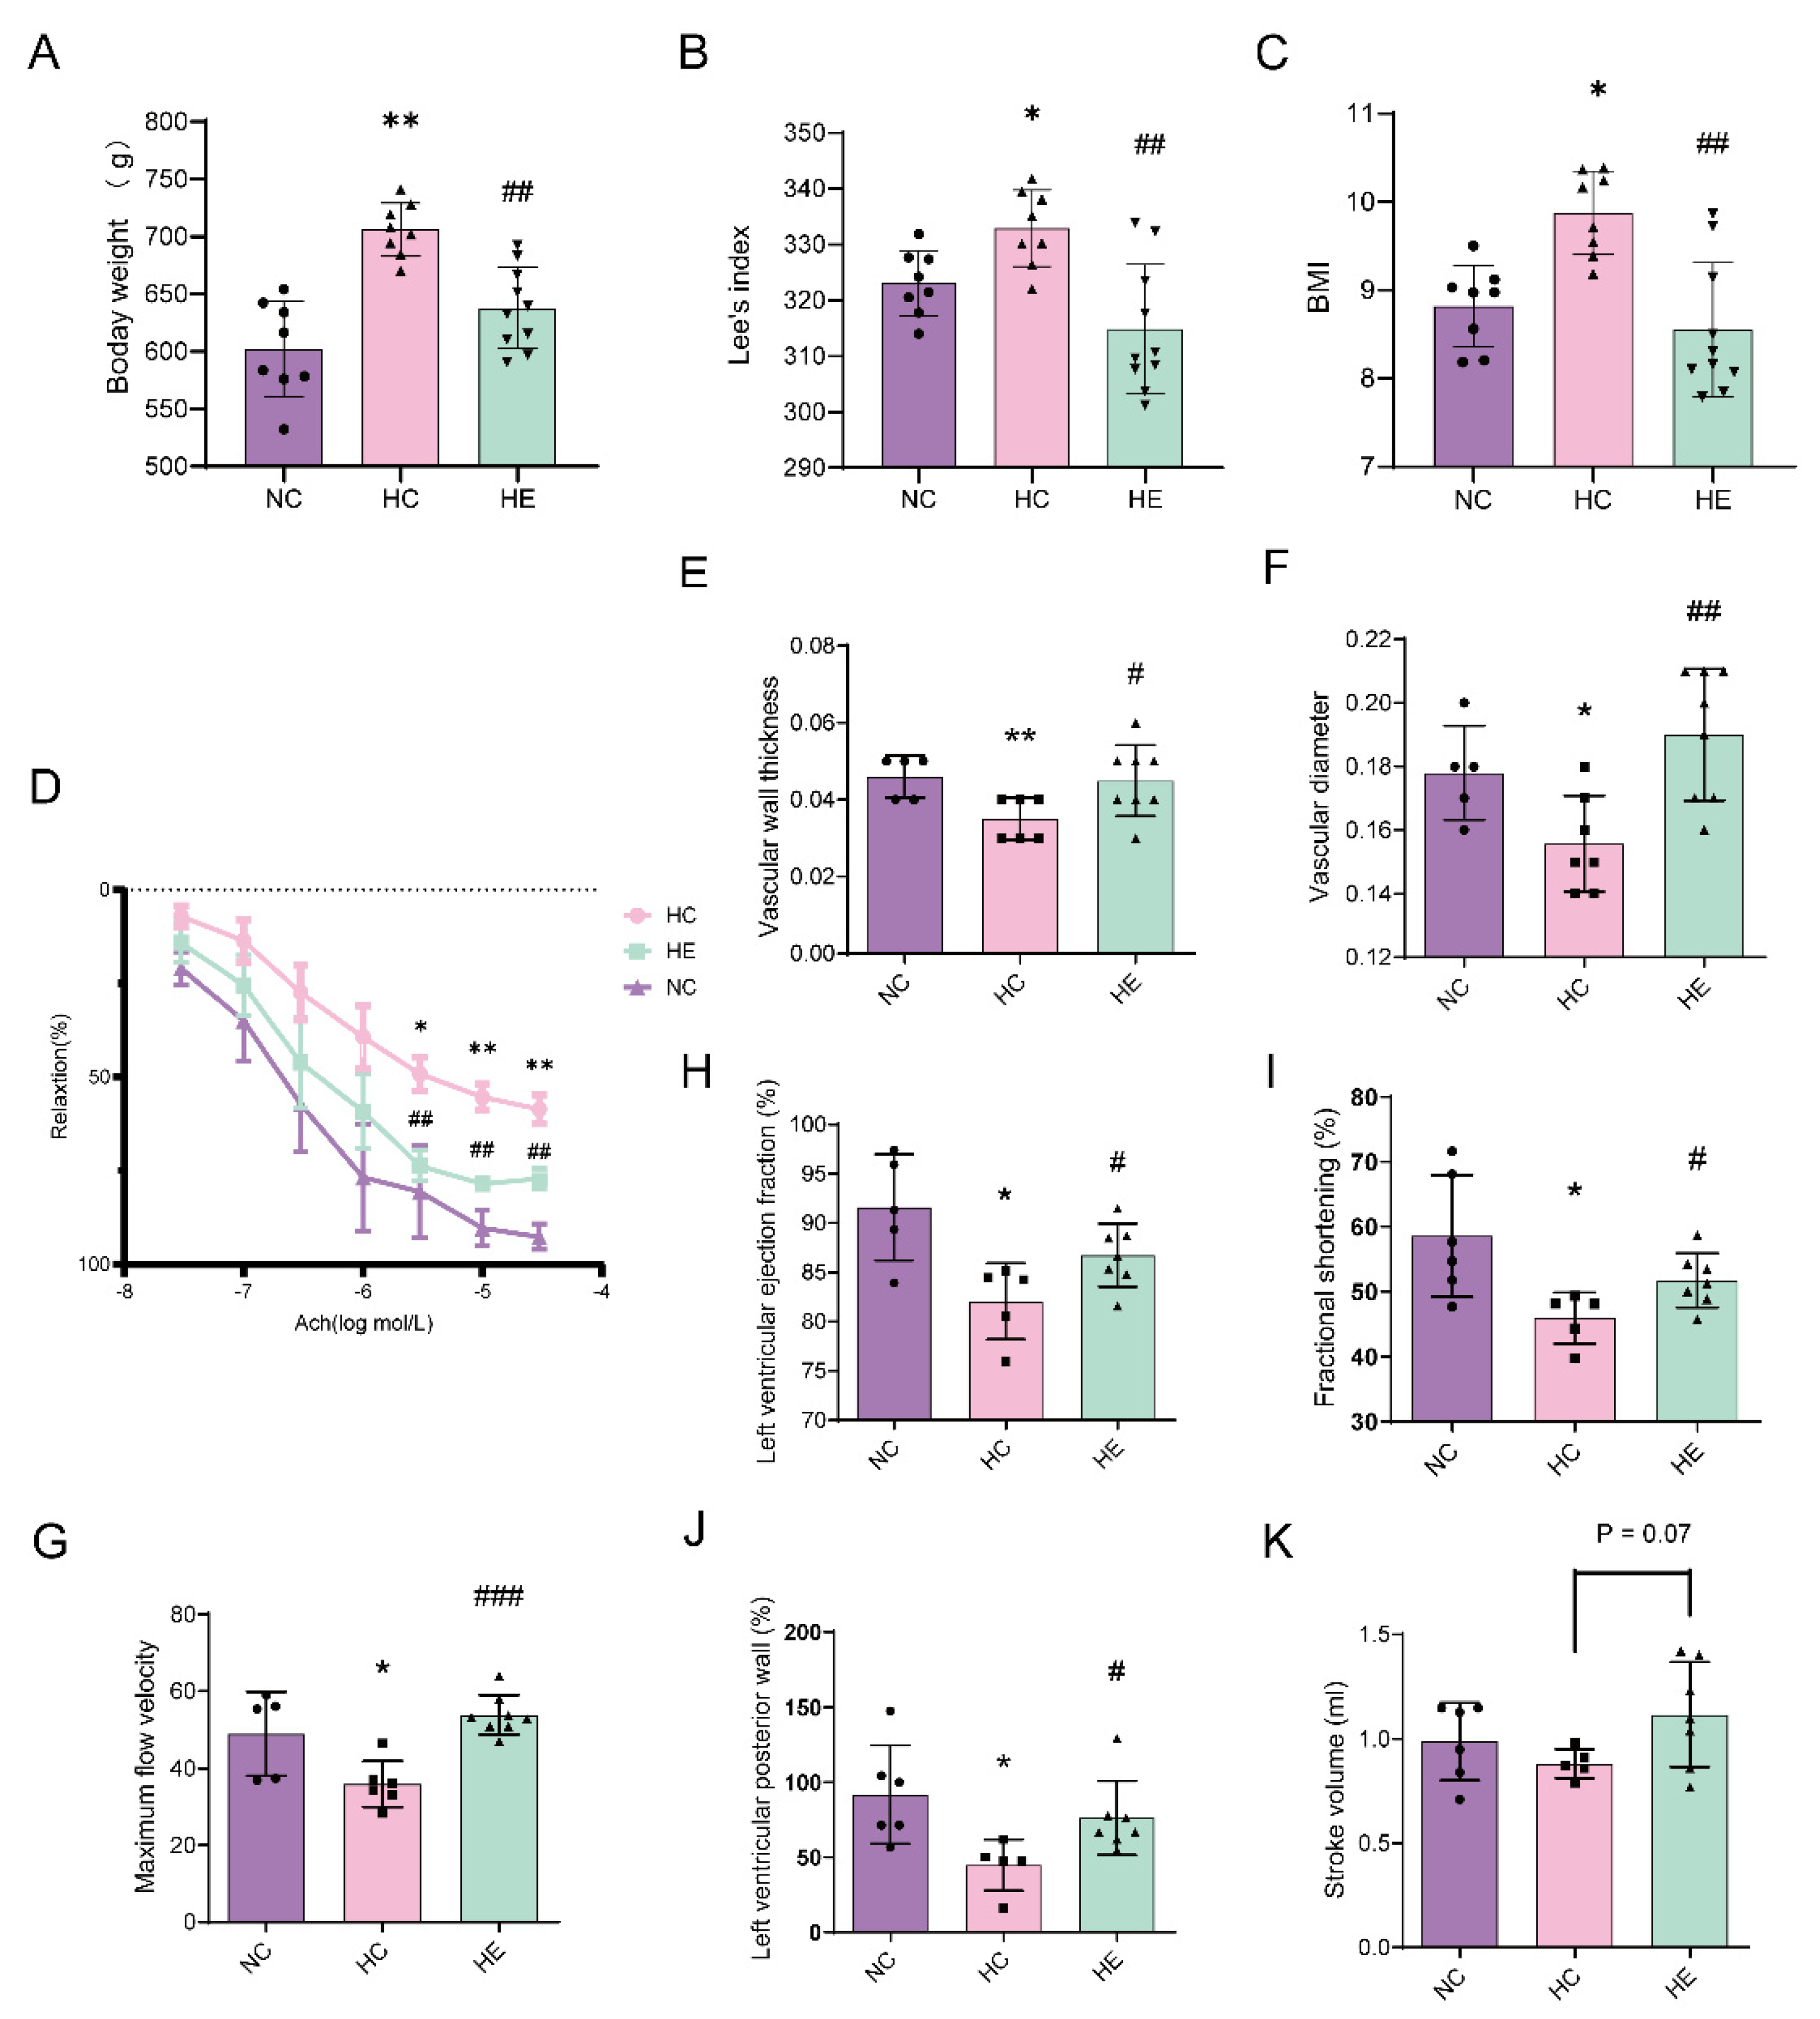
Figure 2.
Microbial analysis using rat colonic flora. (A) Flower Venn diagram showing the distribution of operational taxonomic units (OTUs). The numbers in the center represent the OTUs common to all samples (i.e., Core OTUs), and the number on the petals represents the total OTUs of each sample. (B) The alpha diversity was analyzed using the observed Shannon, Simpson,Invsimpson indices. (C) Principal Coordinates Analysis (PCoA) based on β-diversity distances. Each point represents one sample (NC: circles; HC: triangles; HE: squares), and colored ellipses indicate 95% confidence intervals for each group. Density plots along the top and right margins illustrate the distribution of samples along each coordinate axis. (D) Linear discriminant analysis Effect Size (LEfSe) analysis of gut microbiota differences among groups at the genus level. The horizontal axis represents the LDA score, indicating the effect size and contribution of each genus to group discrimination. The vertical axis lists the genera with significant differences. Different colors correspond to different groups (NC, HC, and HE). Asterisks indicate statistical significance levels (P < 0.05, P < 0.01, P < 0.001) (E) Relative abundance of gut microbiota at the phylum level among different groups. (F) Relative abundance of gut microbiota at the genus level among different groups. (G) The relative abundance of g__Lactobacillus, g__Ruminiclostridium_9, and g__Anaerofilum among different groups. LDA, Linear discriminant analysis. NC, normal control; HC, high diet control; HE, high diet excise. *P < 0.05, **P < 0.01, **P < 0.001.
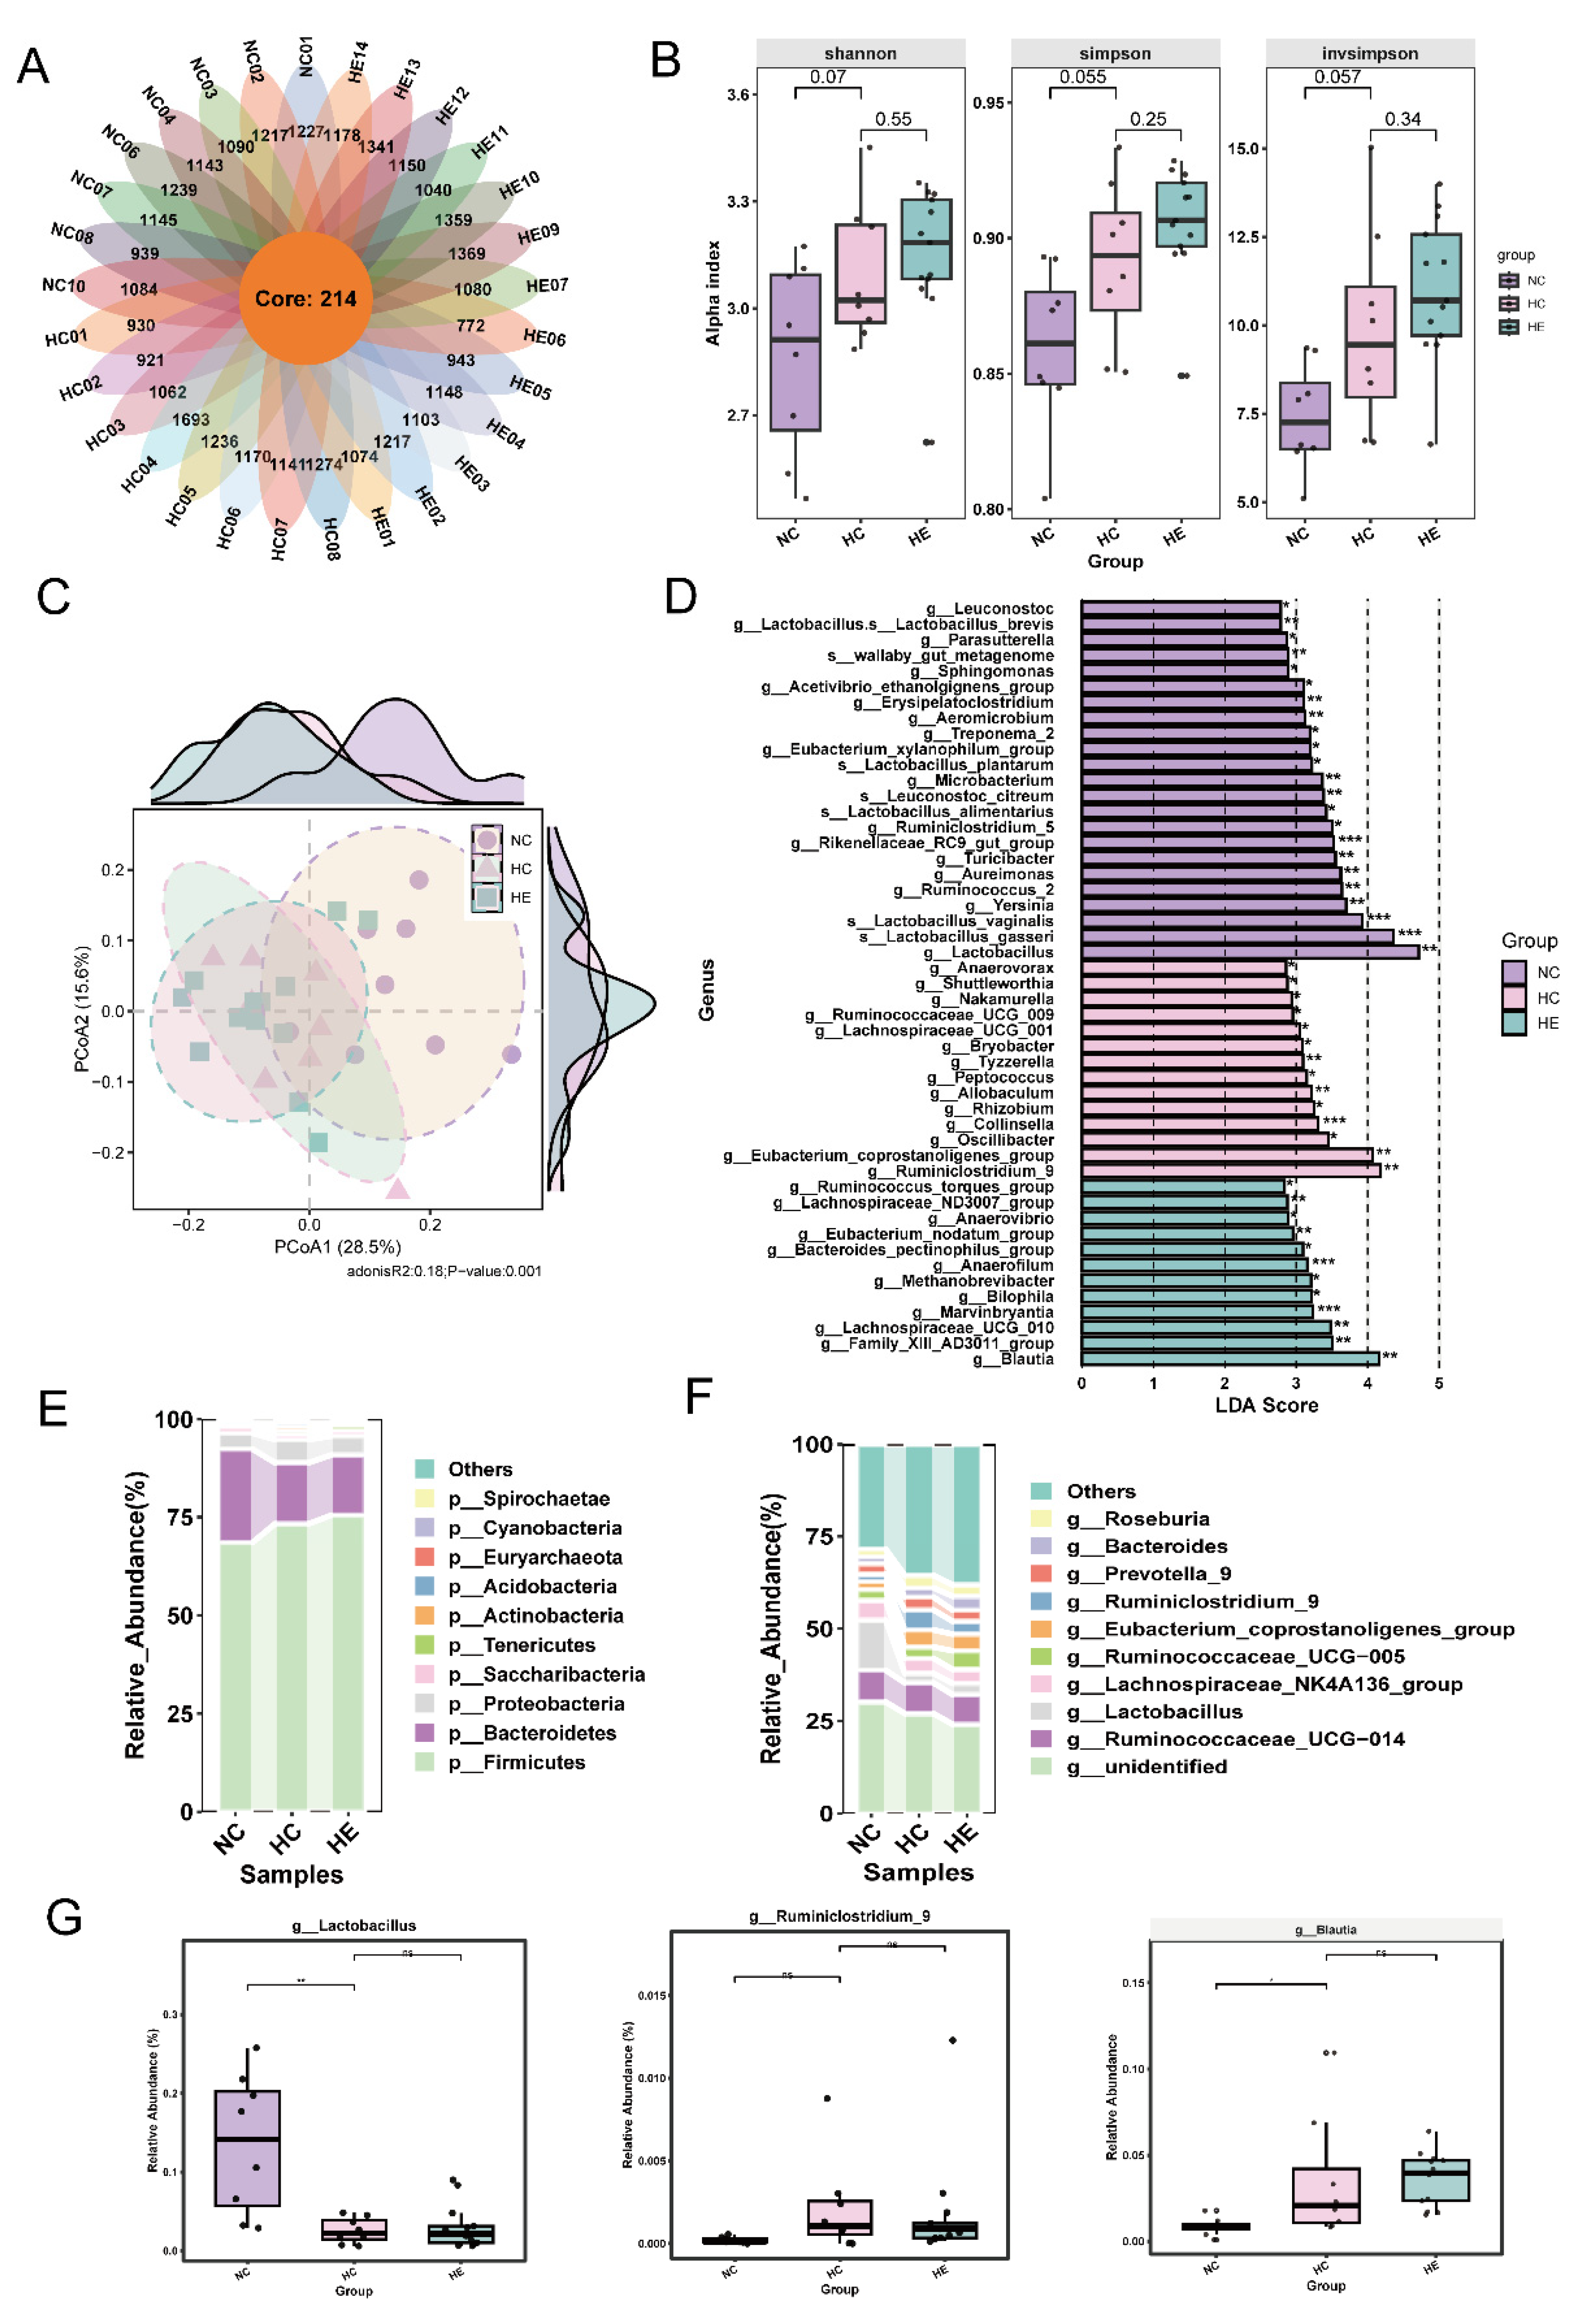
Figure 3.
The serum metabolites of rats were determined by metabolomics analysis method. (A-C) Volcano plot of DEMs between HC with NC, NC with HE and HC with HE groups. (D) Comparative analysis of DEMs among three groups. (E) Heatmap plot showed that 64 metabolites with significantly higher abundance in NC group, 26 metabolites with significantly higher abundance in the HC and HE groups. (F) SMPDB analysis indicated the top 25 enriched metabolite sets between NC and HC groups. (G) SMPDB analysis indicated the top 25 enriched metabolite sets between HC and HE groups. NC, normal control; HC, high diet control; HE, high diet excise; DEMs, Different Expressed Metabolites.
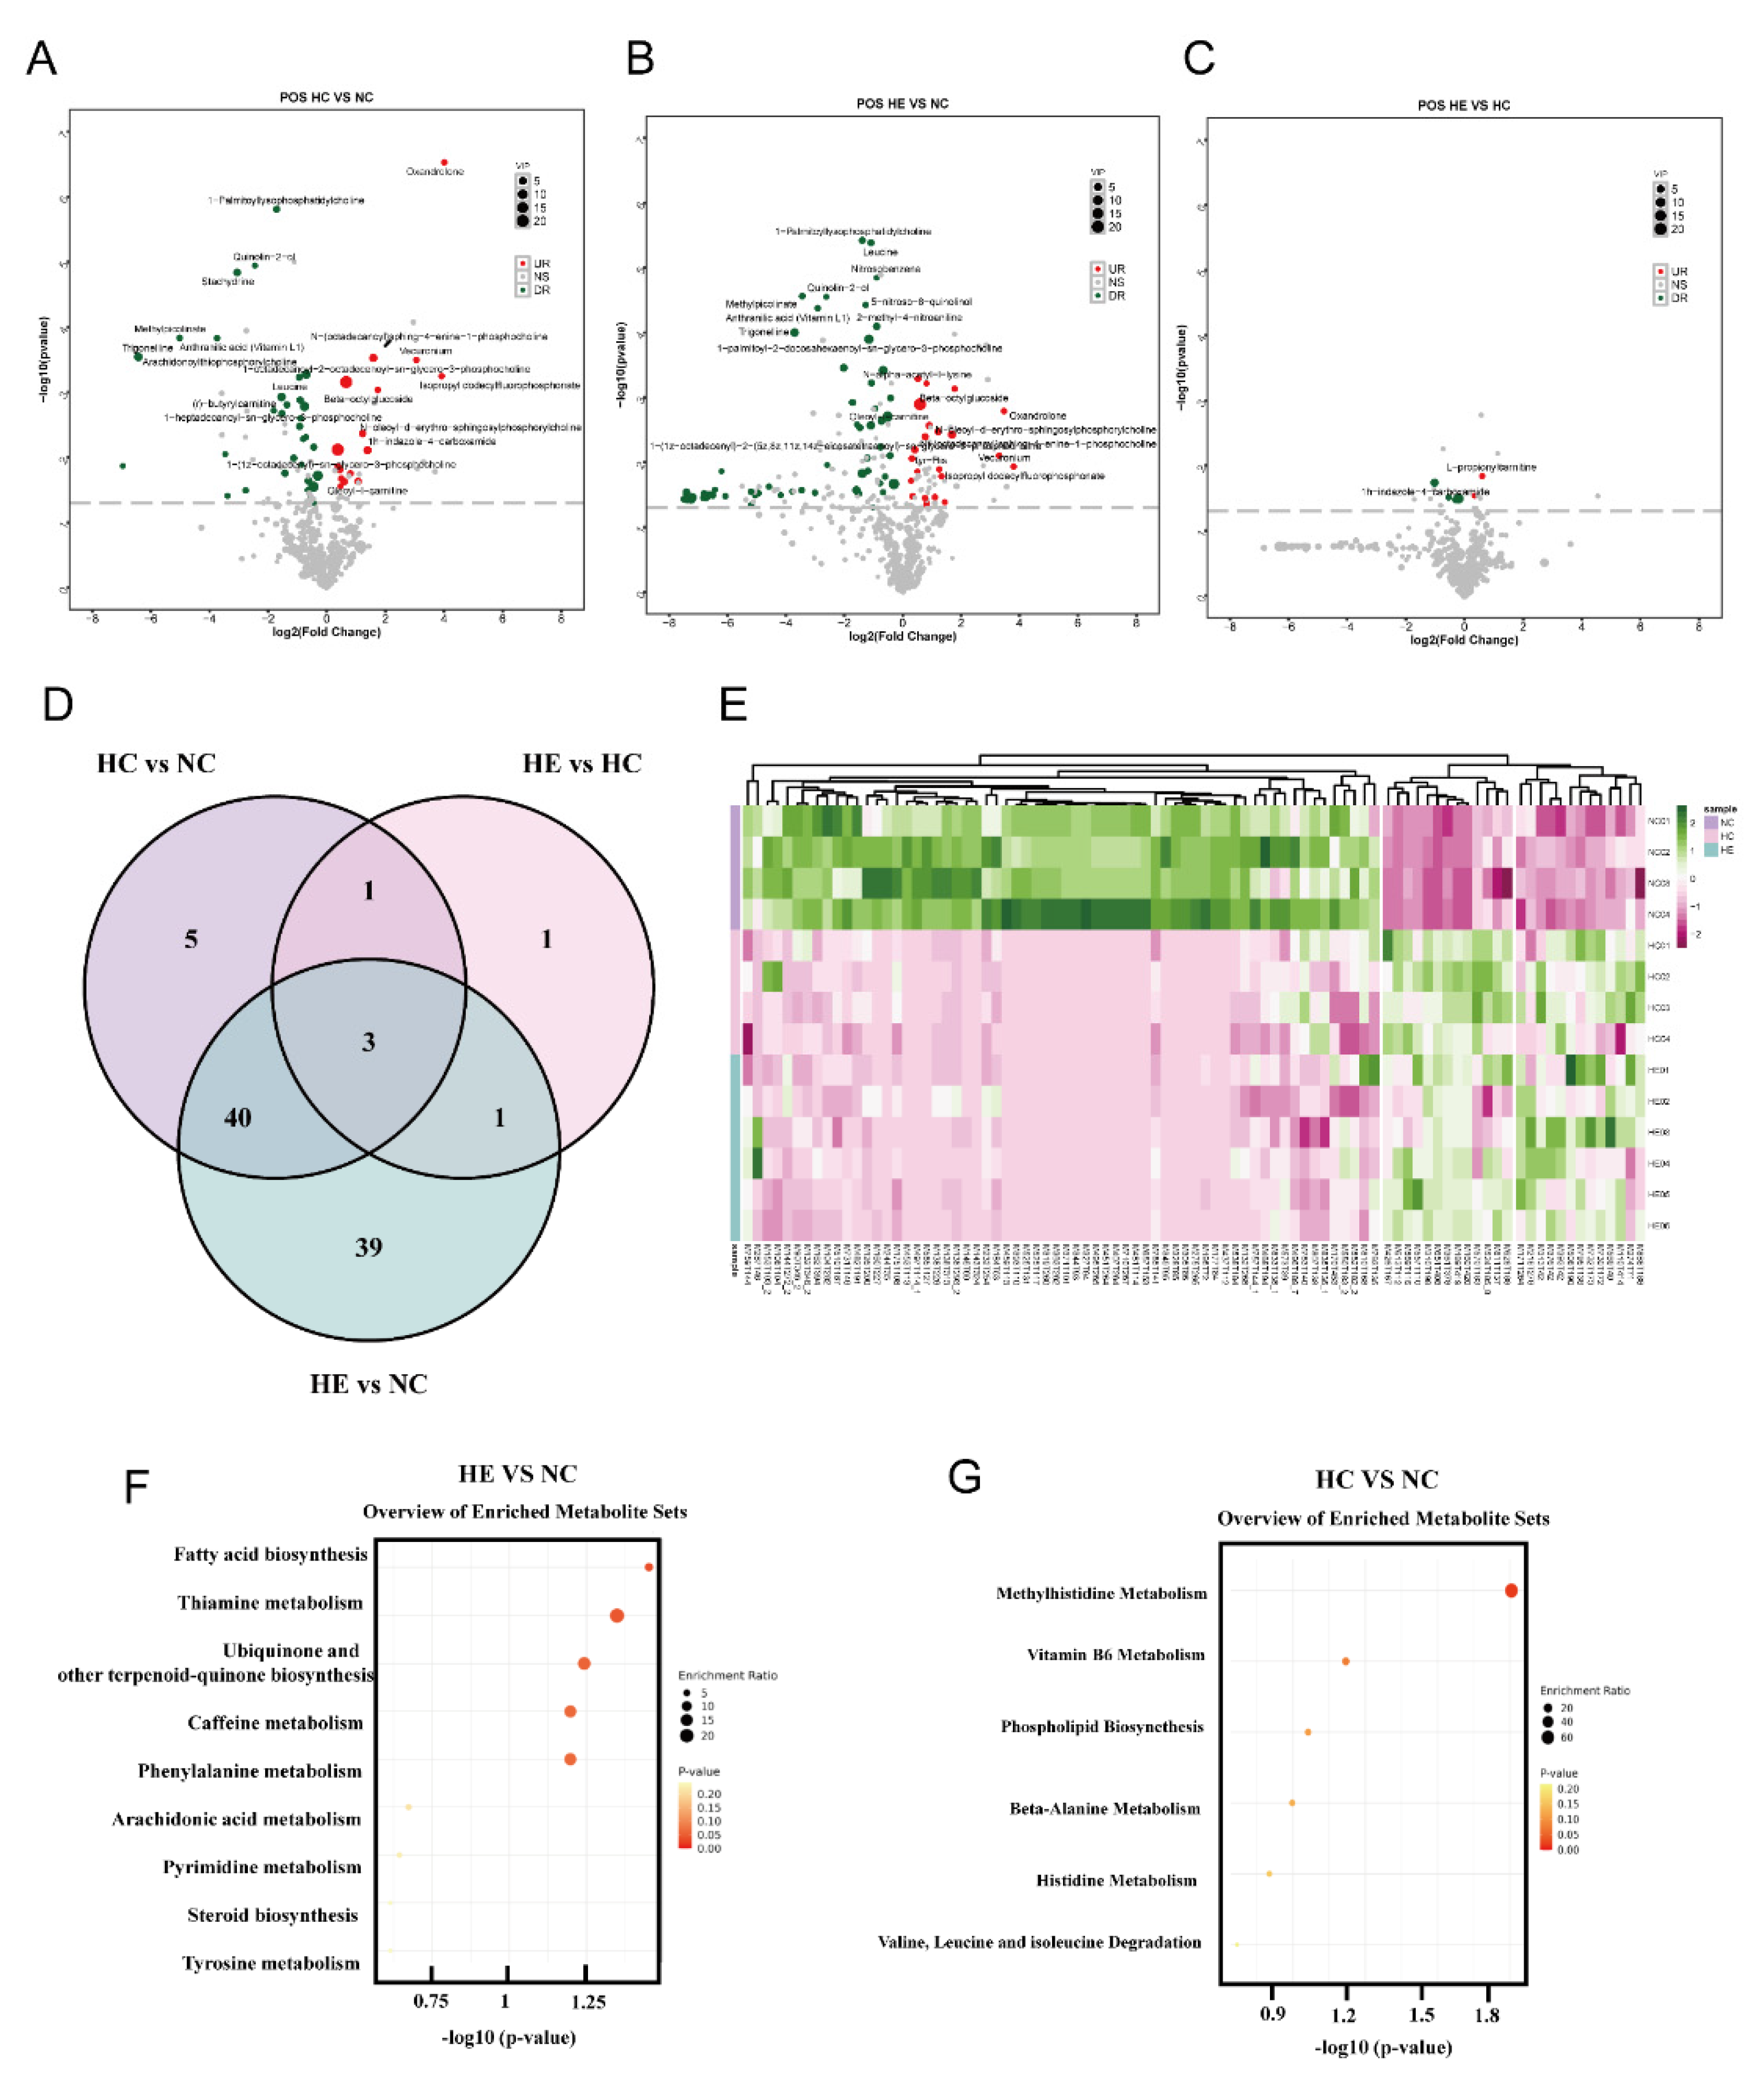
Figure 4.
Exercise changed the overall protein composition. (A-C) Volcano plot of DEPs between HC with NC, HE with NC and HE with HC groups. (D) Comparative analysis of DEPs among three groups. (E) Compared HE with HC groups, heatmap plot showed that 7 proteins with significantly higher abundance in the HE group, while the 11 proteins with significantly higher abundance in HC group. (F) PPI network was used to show the interaction of DEPs. (G) The top 12 significantly enriched GO annotations between HC and NC rats. (H) The top 12 significantly enriched GO annotations between HE and NC rats. (I) The top 7 significantly enriched GO annotations between HE and HC rats. DEPs, Different Expressed Proteins; NC, normal control; HC, high diet control; HE, high diet excise; PPI, protein protein interaction; GO, gene ontology.
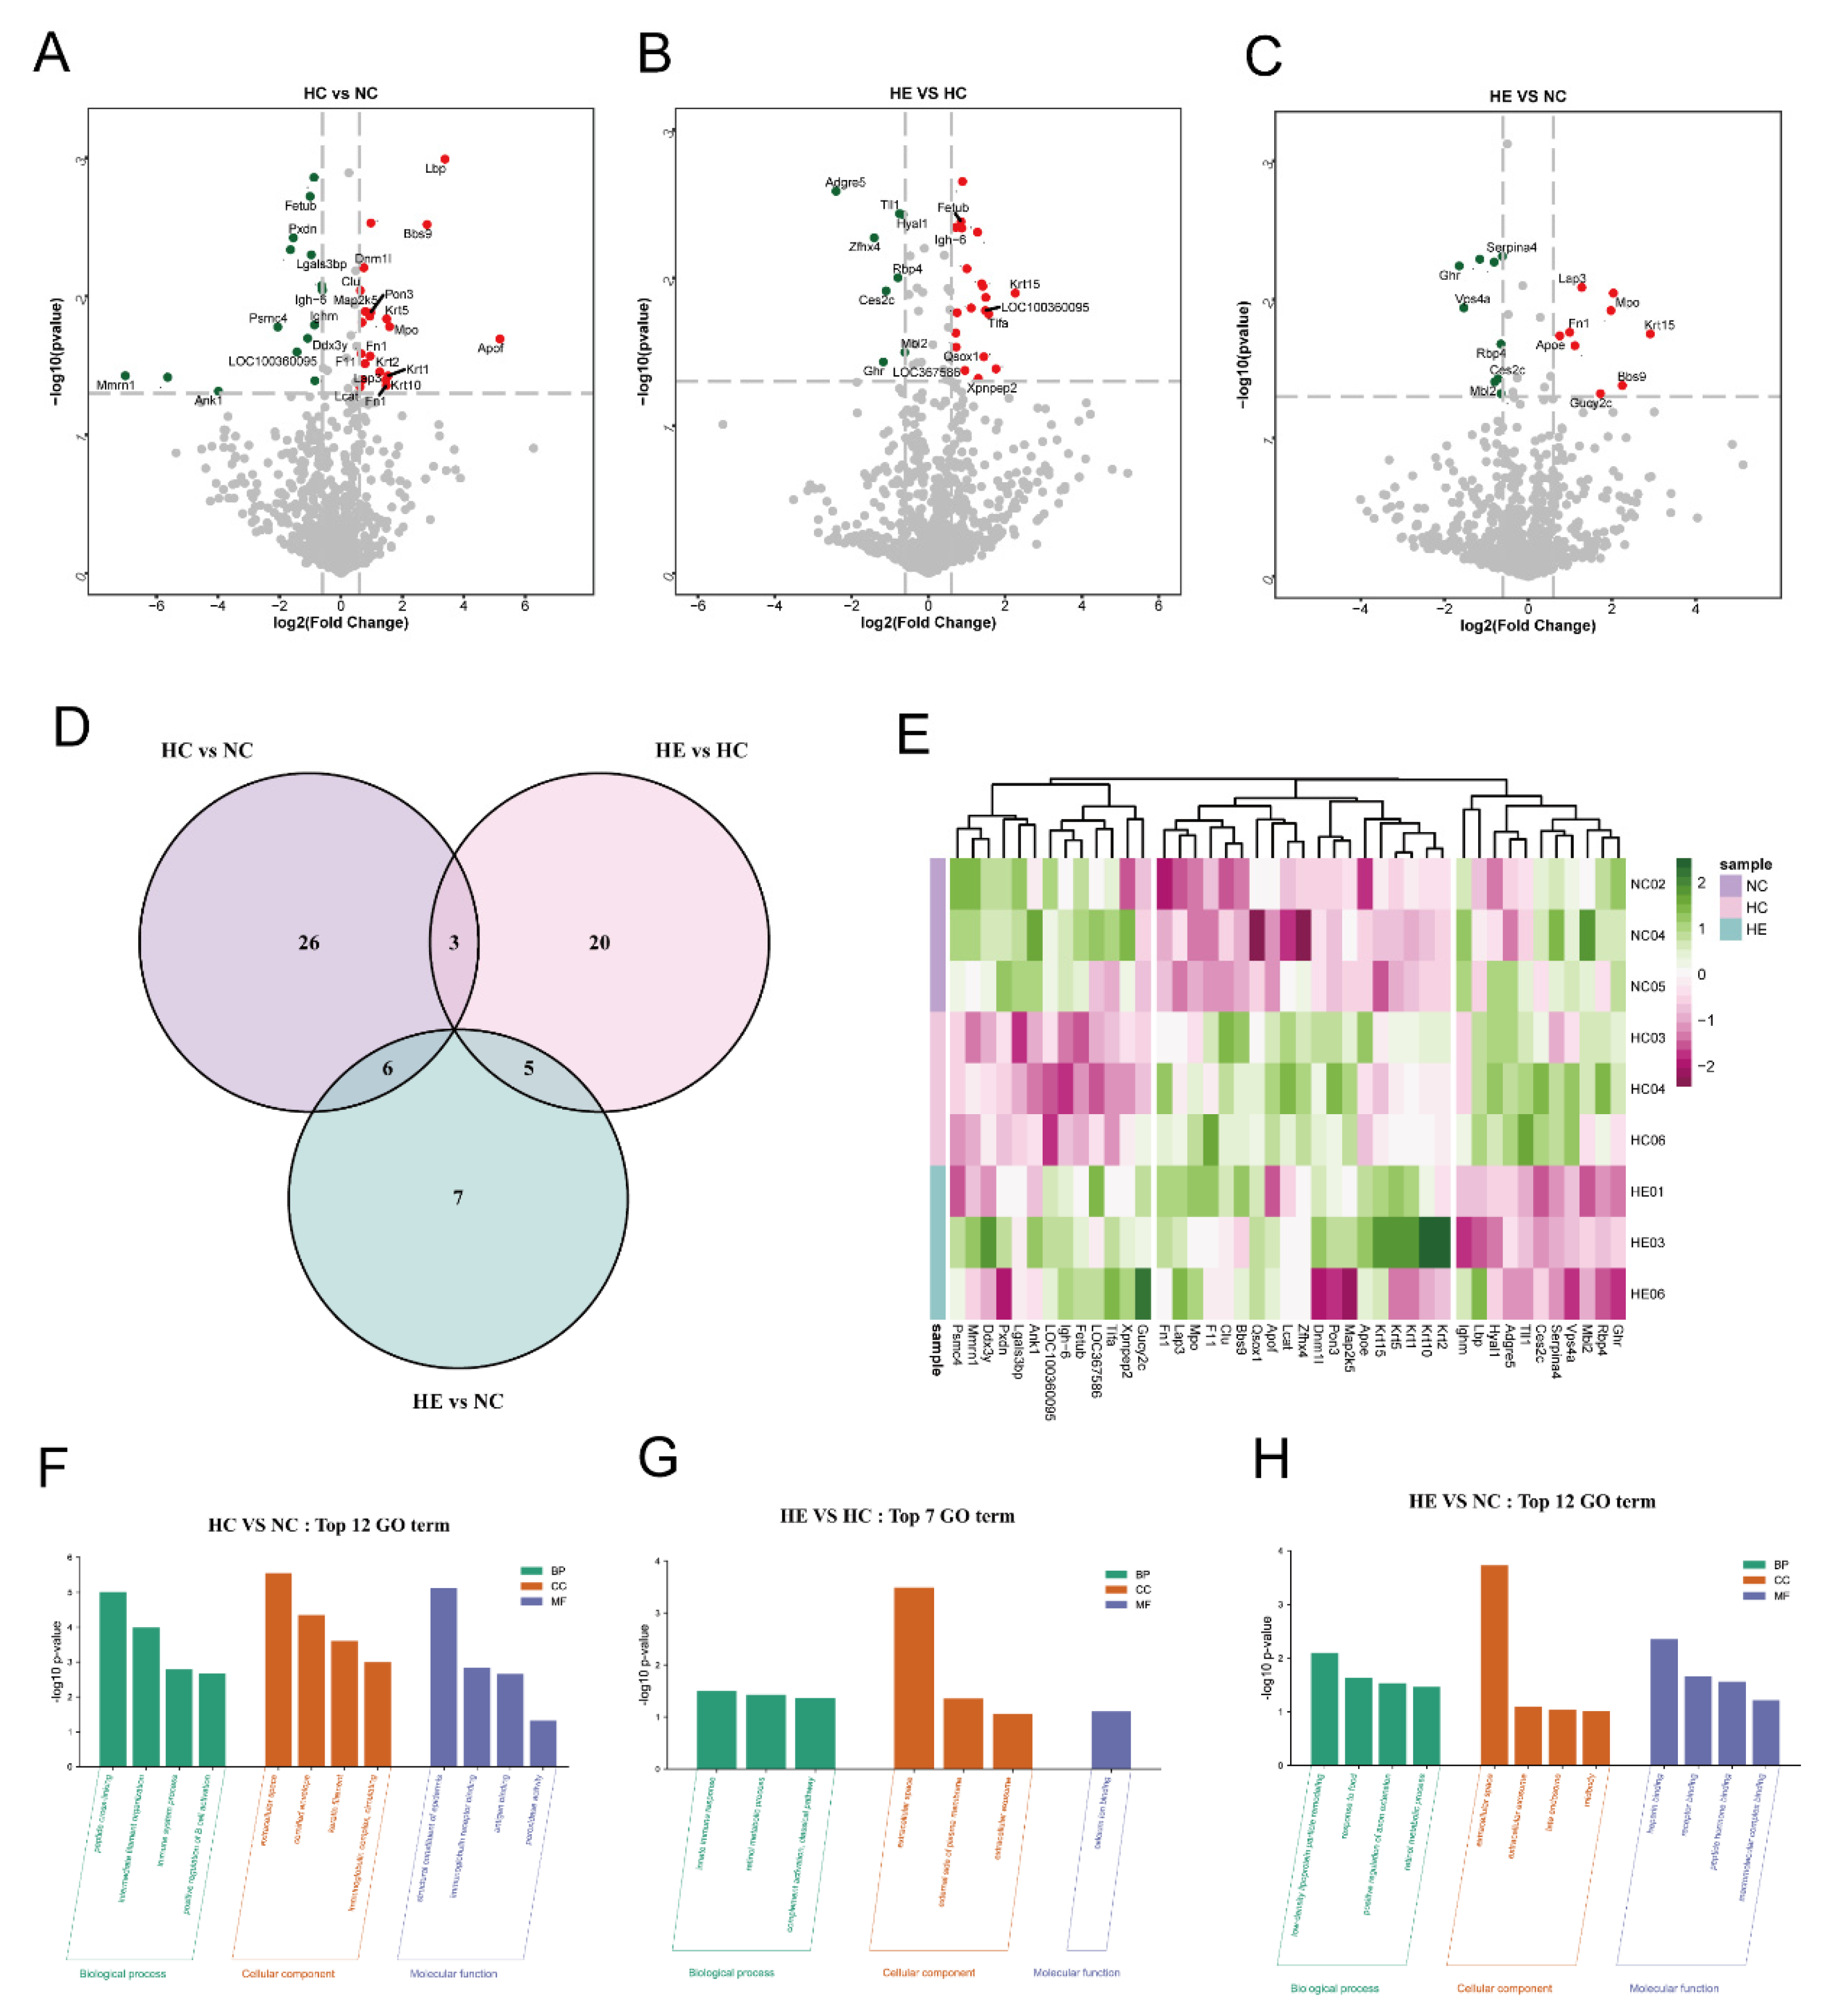
Figure 5.
The correlation of metabolites with the gut microbiota. (A-C) Pearson correlations between the metabolites of interest and the bacteriophage. NC and HC groups (A), NC and HE groups (B), HC and HE groups (C), correlations are highlighted in blue (positive) and red (negative). Horizontal coordinates are metabolites, vertical coordinates are microbiotas. NC, normal control; HC, high diet control; HE, high diet excise.
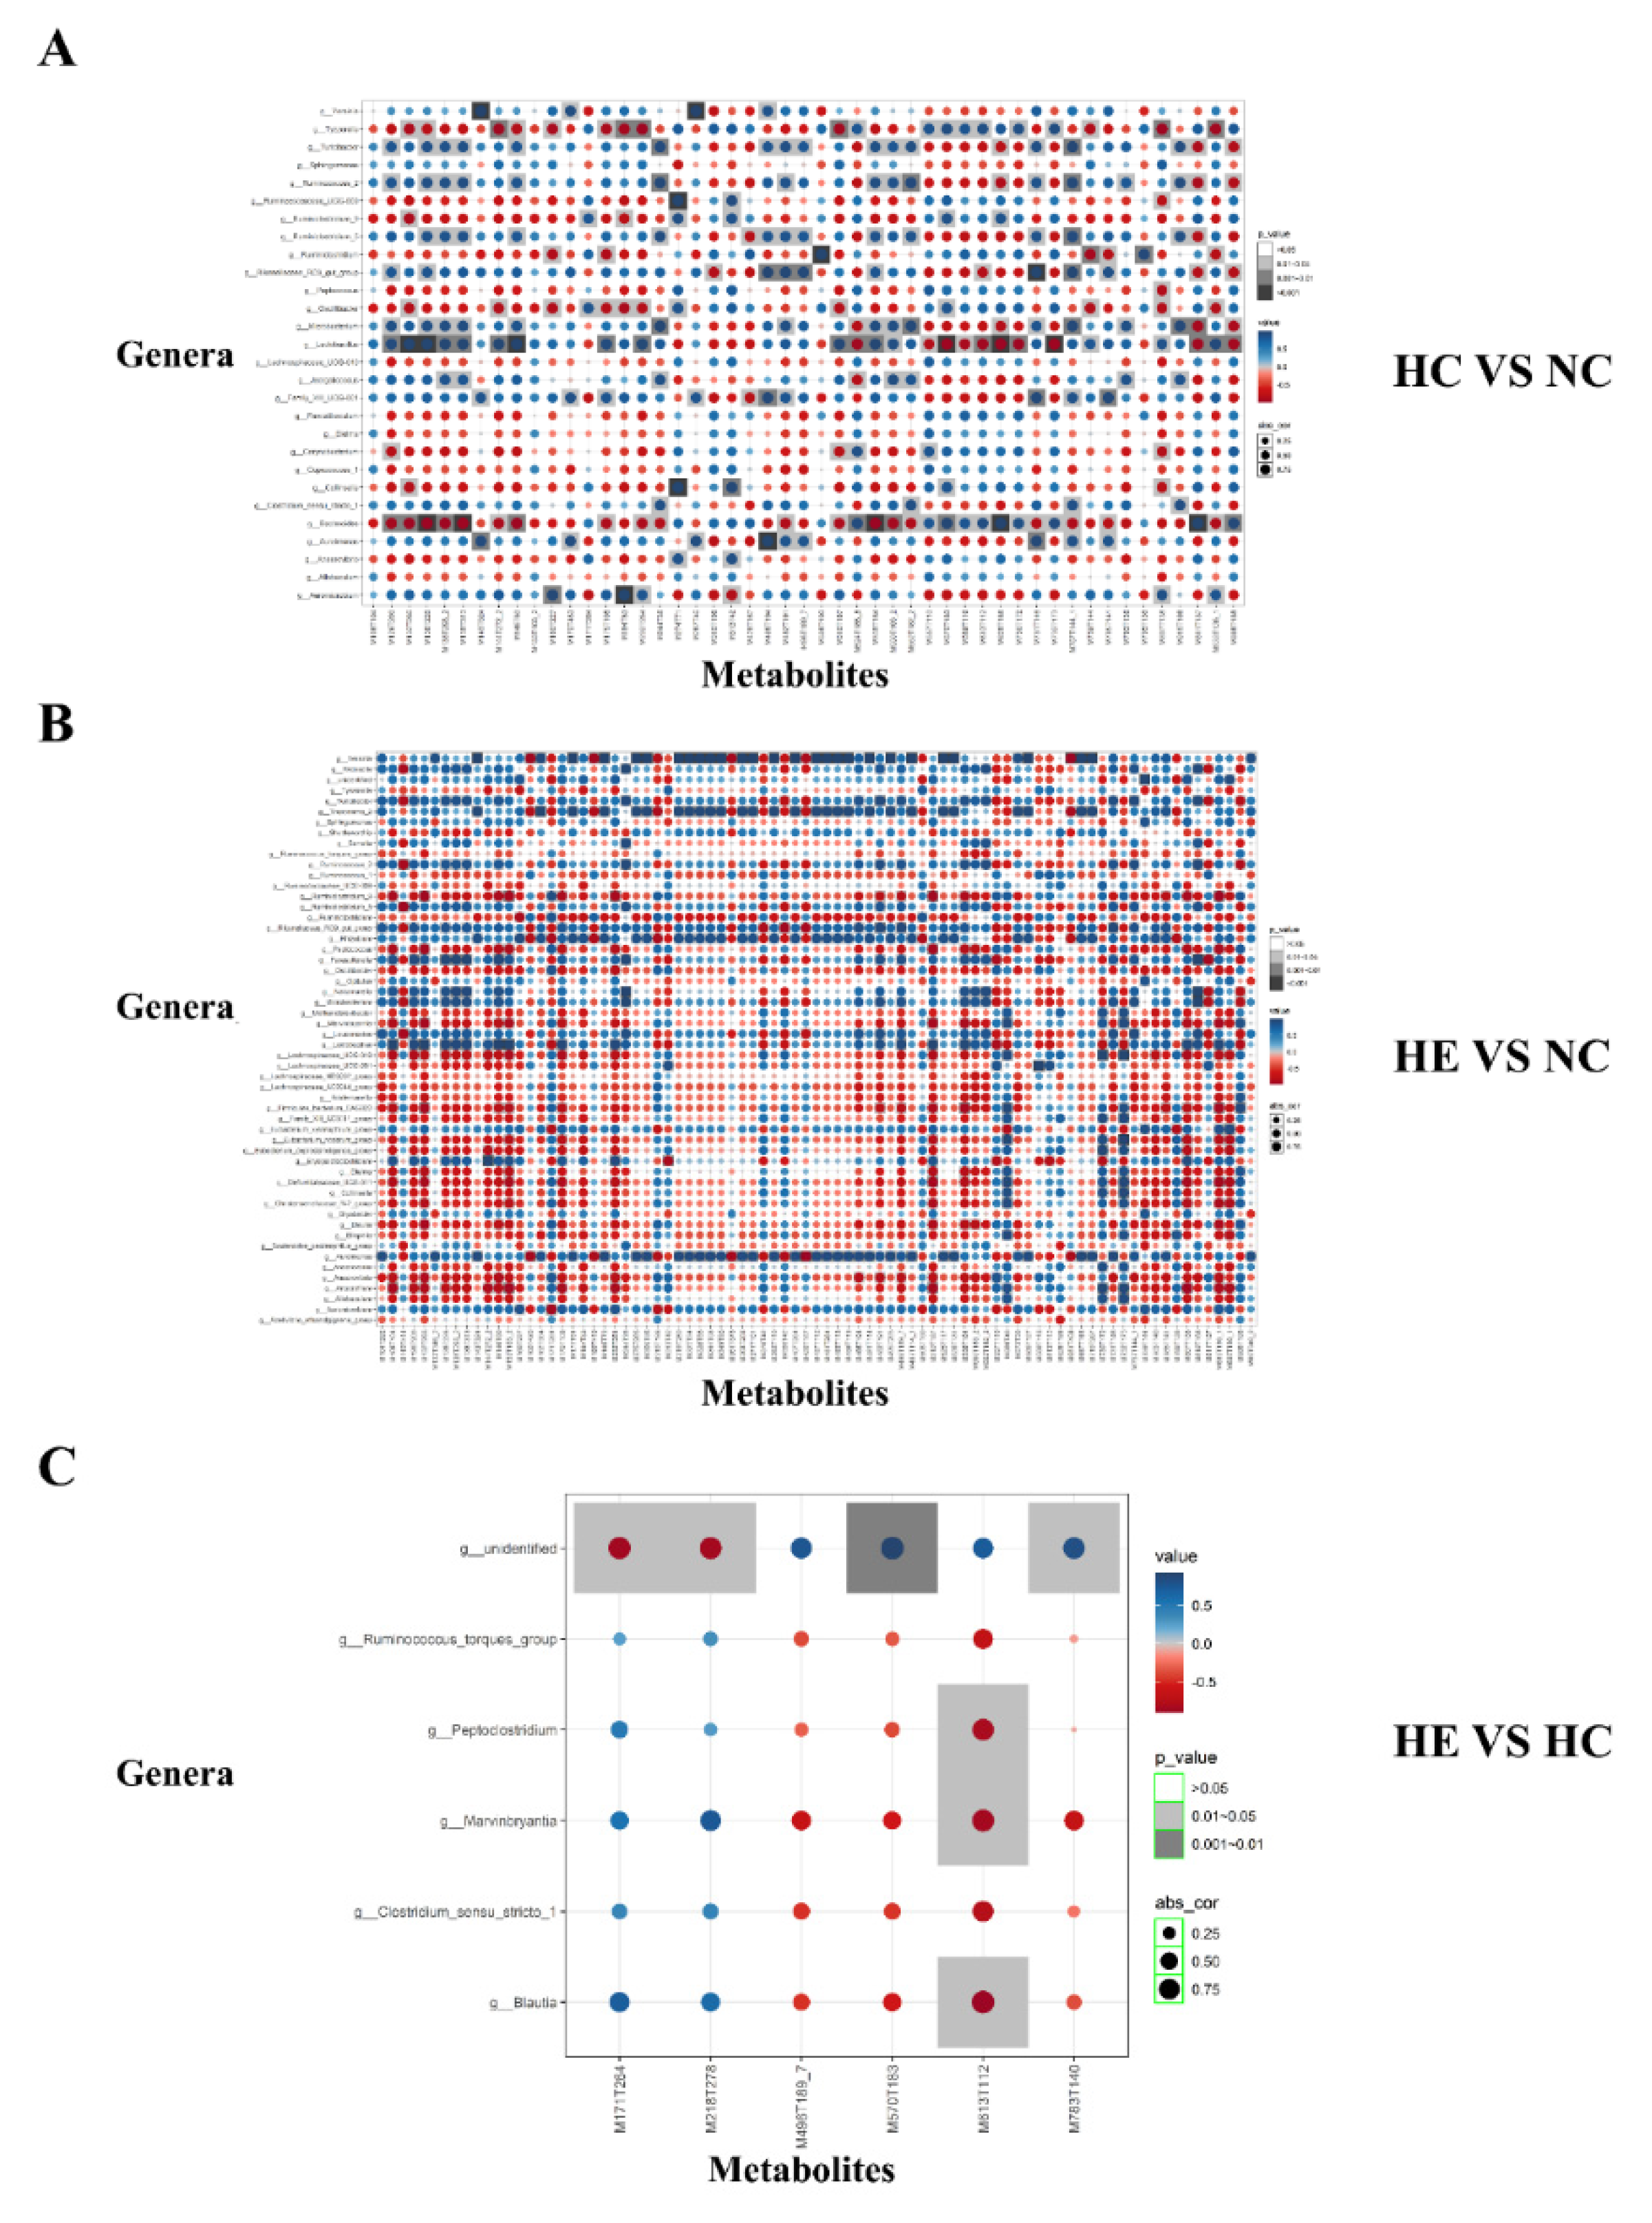
Figure 6.
The differential metabolites and genus were integrated by network diagram. (A) Network diagram of expression correlations between differentially proteins and differential metabolites in NC and HC groups. (B) Network diagram of expression correlation between differentially proteins and differential metabolites in NC and HE groups. (C) Network diagram of expression correlation between differential proteins and differential metabolites in HC and HE groups. Figure shows network plots of correlations between proteins and metabolite response intensity data calculated based on Pearson correlation analysis, with pairs of relationships selected for P < 0.05 and P < 0.001. Red indicates proteins, blue and green represent metabolites with P < 0.05 and P < 0.001, respectively. NC, normal control; HC, high diet control; HE, high diet excise.
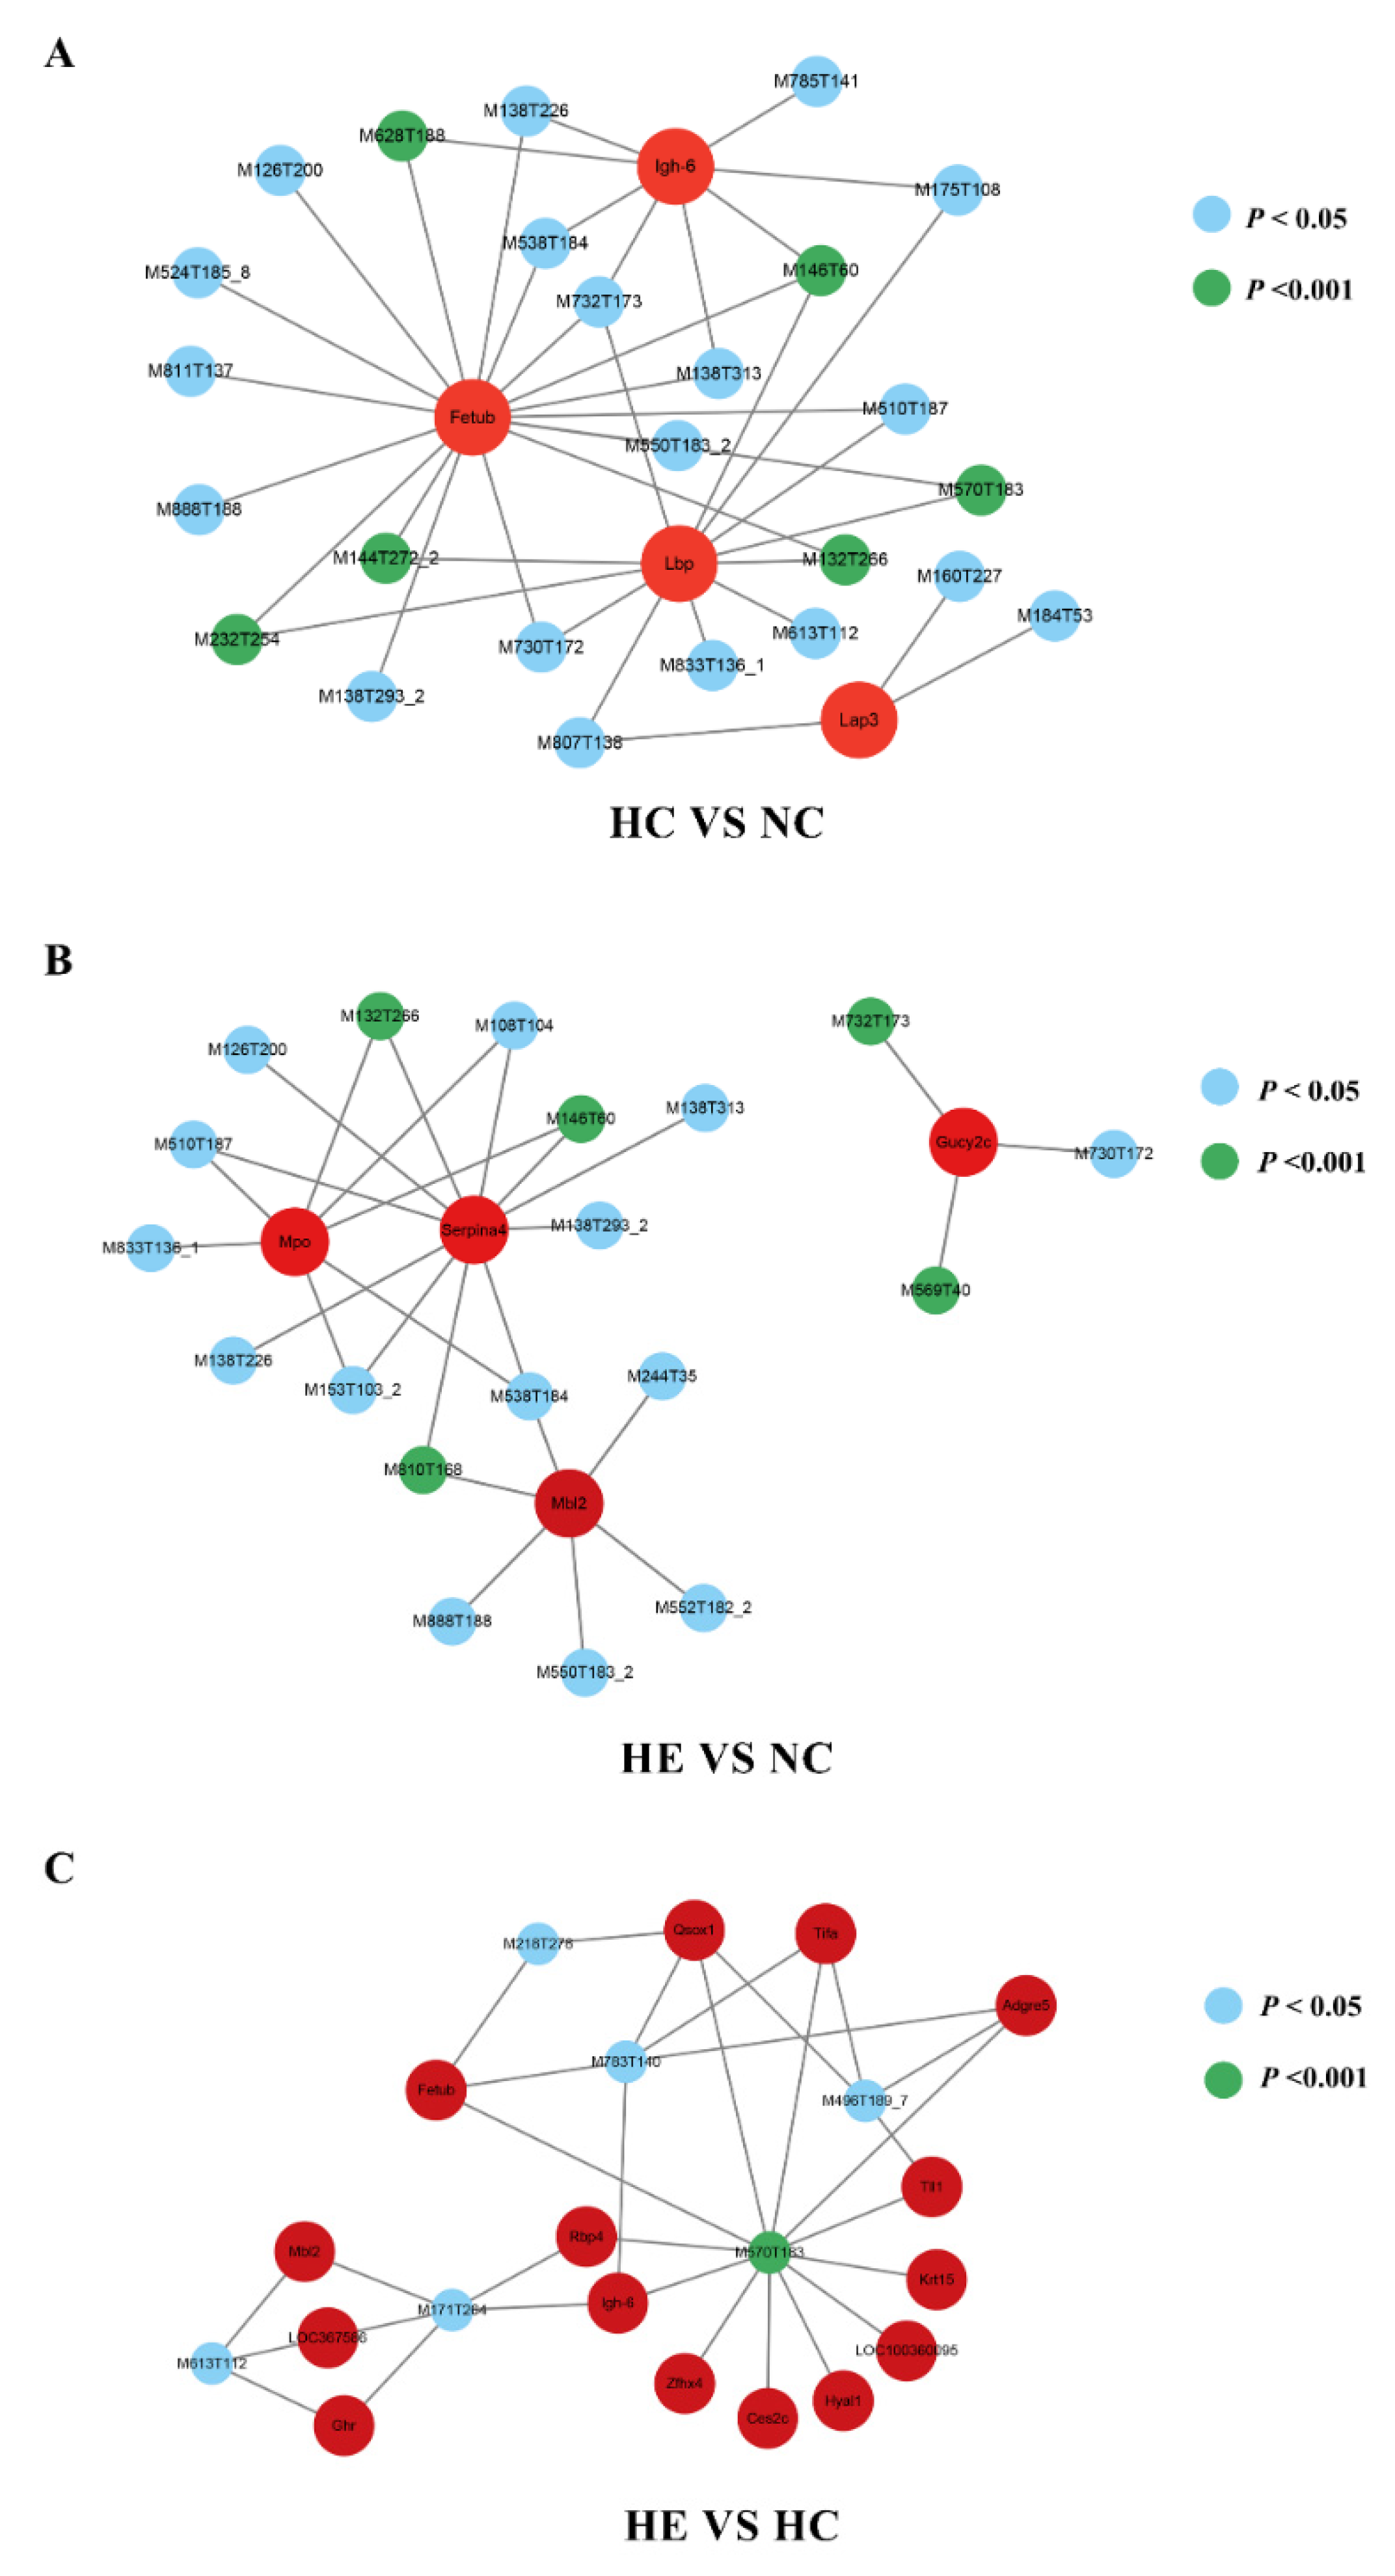
Figure 7.
Differences between NC, HC, and HE groups crosstalk between differential colon genera, various serum metabolites, and key proteins. (A-C) Pairwise comparisons of proteins (A), metabolites (B) and microbes (C) were shown, with a color gradient denoting Pearson’s correlation coefficient. Metabolites and genera (A); Lap3 and genera (B); and Lap3 and Palmitoyllysophosphatidylcholine (C) was related to each pairwise comparisons of components by partial (geographic distance–corrected) Mantel tests. Edge width corresponds to the Mantel’s r statistic for the corresponding distance correlations, and edge color denotes the statistical significance based on permutations. (D-F) The scatter plot showed the Pearson’s test correlation between Lap3, Palmitoyllysophosphatidylcholine and g__Lactobacillus. (G) Lap3 causally contributed to g__Lactobacillus enrichment through inhibiting Palmitoyllysophosphatidylcholine accumulation (Pmediation= 0.04, 71%). NC, normal control; HC, high diet control; HE, high diet excise; Lap3, leucine aminopeptidase 3.
Disclaimer/Publisher’s Note: The statements, opinions and data contained in all publications are solely those of the individual author(s) and contributor(s) and not of MDPI and/or the editor(s). MDPI and/or the editor(s) disclaim responsibility for any injury to people or property resulting from any ideas, methods, instructions or products referred to in the content. |
© 2026 by the authors. Licensee MDPI, Basel, Switzerland. This article is an open access article distributed under the terms and conditions of the Creative Commons Attribution (CC BY) license (http://creativecommons.org/licenses/by/4.0/).
Copyright: This open access article is published under a Creative Commons CC BY 4.0 license, which permit the free download, distribution, and reuse, provided that the author and preprint are cited in any reuse.


