Submitted:
31 January 2026
Posted:
03 February 2026
You are already at the latest version
Abstract
Accelerated technological iteration in new energy has prompted electric power system operating entities to engage in cross-organizational and cross-regional collaborative R&D through distributed innovation models. These models not only support knowledge integration and resource synergy but also play a vital role in enhancing system-wide planning and operational scheduling efficiency. However, due to variations in R&D intensity, structural configurations, and knowledge heterogeneity across projects, notable divergences in resource allocation efficiency have emerged, which further impact the responsiveness and flexibility of automated system dispatching.To characterize this divergence and its underlying mechanisms,this study constructs a sample of 187 collaborative R&D projects involving 42 power and new energy enterprises from 2012 to 2022. Input indicators include project-level R&D expenditure, R&D personnel hours, and experimental equipment conversion values, while output indicators comprise authorized patents, high-value patent ratios, prototype systems, and standard proposals, forming a collaborative R&D input-output database.Using the SBM-DEA model to measure resource allocation efficiency at the project level, results indicate an average efficiency value of 0.73 for the sample projects. Approximately 31% of projects operate on the efficient frontier, while around 27% exhibit redundant investment space.Further analysis using a double Bootstrap truncated regression model linked efficiency scores to firms' degree centrality within distributed innovation networks, cross-regional collaboration intensity, technological distance, and knowledge stickiness levels. Findings indicate that each standard deviation increase in network centrality boosts project efficiency by approximately 6.2%.while the interaction term between technological distance and knowledge stickiness index exerts a significant negative impact on efficiency. Projects characterized by high stickiness and high technological distance exhibit efficiency levels approximately 11%–14% lower than those with low stickiness and low distance. This study quantitatively reveals the formation mechanism of resource allocation efficiency in new energy collaborative R&D among electric power system operators within a distributed innovation context, providing methodological support for optimizing project portfolios and partner selection.
Keywords:
distributed innovation
; electric power system operators
; new energy collaborative R&D
; resource allocation efficiency
; SBM DEA
; Bootstrap truncated regression
; knowledge stickiness
1. Introduction
With the rapid evolution of new energy technology systems, electric power system operating entities—comprising grid operators, generation dispatch centers, and planning departments—are increasingly adopting distributed innovation networks to construct integrated cross-organizational R&D frameworks. These frameworks serve not only as channels for technological commercialization but also as instruments to enhance the coordination and adaptability of power system planning and dispatching functions.Collaborative R&D has become a key model for promoting resource aggregation, knowledge sharing, and system integration. However, due to differences in R&D resource endowments, knowledge infrastructure, and technology path selection among enterprises, resource allocation efficiency exhibits significant heterogeneity during collaboration.Efficiency deviations not only compromise project output quality but also constrain the overall operational effectiveness of innovation networks. Therefore, it is imperative to establish a scientific measurement system and causal mechanism model to uncover the intrinsic logic and key drivers of efficiency formation in collaborative R&D.Based on 187 new energy collaborative R&D projects from 2012 to 2022, this study employs the SBM-DEA model and double Bootstrap truncated regression to conduct systematic research from two perspectives: project efficiency measurement and structural factor analysis. It aims to provide theoretical support and methodological guidance for optimizing resource allocation strategies in electric power system operators under diverse collaborative models.
2. Current Status of Distributed Innovation and Collaborative R&D in electric power system operators
Within the current framework of distributed innovation and collaborative R&D among electric power system operating entities, system planners and dispatch units have progressively escalated investments in new energy R&D, particularly focusing on intelligent grid architecture, energy storage systems, and renewable integration. These investments aim to address systemic challenges in real-time scheduling, demand forecasting, and load balancing, forming the technical basis for adaptive system automation.. Over 70% of power companies prioritize new energy projects in their R&D budgets, with collaborative R&D emerging as a core mechanism for technological advancement.According to the latest industry reports, approximately 60% of electric power system operators have established cross-domain innovation platforms through multi-party collaboration, effectively integrating new energy technologies with traditional power systems[1] . Despite initial successes in collaborative R&D, significant challenges persist, primarily in the rational allocation and management efficiency of R&D resources. These challenges impact the speed of R&D outcome commercialization and the market adaptability of technological innovations.
3. Framework for Measuring the Efficiency of Distributed Innovation Resource Allocation in Electric electric power system operators Based on the SBM-DEA Model
3.1. Data Collection
To construct a scientifically sound efficiency measurement system, structured modeling of input and output indicators for collaborative R&D projects is required during data collection[2] . Based on the SBM-DEA framework, a sample data matrix was designed, defining the input matrix and output matrix , where m=3, s=4, n=187 represent the number of input indicators, output indicators, and sample projects, respectively.Input dimensions include: total project-level R&D funding, total R&D personnel hours , and equipment investment equivalent value unit: ten thousand yuan. Output dimensions include: number of authorized patents , proportion of high-value patents , number of prototype systems developed, and number of standard proposals submitted. The constructed basic measure function is as follows:
(1)
Where represents the efficiency value, denotes the linear combination coefficients, are slack variables for input redundancy and output deficiency respectively, and indicates the input and output vectors of the evaluated project. By constructing complete input-output vectors for each collaborative R&D project and using annual average data as the metric, a standardized efficiency analysis dataset is formed, laying the quantitative foundation for building the efficiency measurement model[3] .
3.2. Design of Resource Input and Output Indicators
To effectively measure the resource allocation efficiency of collaborative R&D projects for new energy under the context of distributed innovation in electric power system operators, a rigorous input-output indicator system must be established. This system should fully characterize the key resource input elements and the characteristics of technology transfer during project operation[4]. Based on the DEA method's requirement for input-output balance and considering the actual organizational form of new energy collaborative R&D, the indicator system includes three input dimensions and four output dimensions. These are measured respectively by "total funding" x₁ⱼ, "total labor hours" x₂ⱼ, and "equipment investment value" x₃ⱼ. The output dimension constitutes a comprehensive output space through technology transfer indicators. "Number of licensed patents" y₁ⱼ and "Number of prototype systems" y₃ⱼ reflect technological accumulation capacity, while "Proportion of high-value patents" y₂ⱼ and "Number of standard proposals" y₄ⱼ characterize technological output quality. Considering the non-radial property of the SBM-DEA model, the input-oriented efficiency function is expressed as follows:
(2)
where denotes the efficiency value of the th project; represents the input matrix, denotes the output matrix; is the linear combination weight vector to be optimized; and respectively indicate slack variables for input redundancy and output deficiency, reflecting the deviation of suboptimal projects.This function balances undesirable redundancy with desired output, demonstrating adaptability to non-equilibrium structures. It is well-suited for modeling the heterogeneous characteristics of high-investment, high-risk, and high-output projects in the new energy sector. By constructing the aforementioned measurement framework, the variable foundation for efficiency value calculation and regression analysis of influencing mechanisms is established[5] .
3.3. Application of the SBM-DEA Model and Efficiency Measurement
To achieve multidimensional quantification of resource allocation efficiency in new energy collaborative R&D within electric power system operators, an efficiency measurement process based on the SBM-DEA (Slack-Based Measure Data Envelopment Analysis) non-radial model was designed upon the established input-output indicator system. Embedded modeling was completed on the project sample set[6] .As shown in Figure 1, the efficiency measurement process comprises four key steps: normalization, redundant/insufficient variable analysis, linear programming solution, and efficiency frontier attribution determination.
During modeling, an input-oriented slack variable-driven optimization model is first established, with its efficiency objective function defined as follows:
(3)
where denotes the efficiency score of the th collaborative R&D project; and represent the observed values of the th input variable and the th output variable for the th project, respectively; and are slack variables; and are linear combination coefficients used to construct the comparative frontier surface.To mitigate the effects of outliers and scale, a range normalization correction mechanism is further introduced. All input and output variables undergo the following standardization process:
(4)
This transformation ensures comparability of input-output metrics, effectively mitigating sample heterogeneity's interference with model boundary constraints and enhancing model stability[7] .The standardized variables are fed into the main model for solution. A batch-solving framework based on a linear programming structure is constructed in MATLAB R2023b to output the efficiency value vectors for each project . Additionally, to enhance the robustness of the measure and satisfy the distribution assumptions for the efficiency value as the dependent variable in the subsequent truncated regression model, the following boundary contraction model is introduced:
(5)
In this equation, represents the adjusted efficiency value, ensuring it remains distinct from the contraction endpoint 0. This facilitates subsequent sample truncation in the double Bootstrap regression, enhancing the stability of parameter estimation and the consistency of model fit. Through the nested construction of the above model system, a comprehensive efficiency measurement design is achieved—spanning data preprocessing, efficiency boundary characterization, and variable value output—providing a robust efficiency labeling foundation for modeling the mechanisms of influencing factors.
3.4. Design of the Double Bootstrap Truncated Regression Model
To dissect the impact mechanisms of resource allocation efficiency in new energy collaborative R&D projects under distributed innovation models for electric power system operators, a dual Bootstrap truncated regression model is constructed based on efficiency measurement. This addresses issues such as skewed DEA efficiency value distributions, boundary contraction, and sample correlation errors[8] .The model design employs adjusted efficiency scores as the dependent variable, incorporating structured collaborative network and knowledge heterogeneity feature variables as explanatory vectors. The overall modeling logic is illustrated in Figure 2.
At the parameter modeling level, the following truncated regression model expressions are introduced:
(6)
where denotes the boundary-compressed efficiency value for the project, represents the observed value of the th sample across the explanatory variables (e.g., network degree centrality, interregional cooperation intensity, technological distance, knowledge stickiness level), is the coefficient to be estimated, is the truncated normal error term, and is the lower bound cutoff point for efficiency values.Since the original efficiency scores are non-iid and contain bias terms, a two-stage estimation using the double bootstrap mechanism from Simar and Wilson is employed. The outer bootstrap samples to generate a reset residual sequence, while the inner bootstrap performs bias correction on parameters and the efficiency score distribution.Regarding variable specification, explanatory factors include seven collaborative attribute variables and two control variables, covering network structure (e.g., degree centrality, betweenness centrality), organizational dimensions (e.g., number of collaborating firms, proportion of non-local partners), technological cognition heterogeneity (e.g., average technological distance, knowledge stickiness), and firm attributes (e.g., patent output capacity, registered capital).The total sample comprises 187 collaborative projects, with 9 explanatory variable dimensions, ensuring model interpretability. Through distribution correction and error deviation control, the model provides a reliable causal foundation for subsequent efficiency impact pathway identification and optimization recommendations[10] .
4. Empirical Findings and Analysis
4.1. Sample Description and Data Analysis
The dataset includes 187 cross-enterprise, cross-regional R&D projects conducted by 42 power and new energy firms from 2012 to 2022, covering six major power regions such as East and North China. All projects satisfy data completeness and participant traceability. Inputs consist of funding, labor, and equipment; outputs cover patents, prototypes, and standard proposals. Nine explanatory variables were derived, capturing network structure (e.g., degree centrality, technological distance), collaboration attributes (e.g., non-local partner share), and cognitive factors (e.g., knowledge stickiness). To ensure consistency and comparability, all variables were normalized or log-transformed. The resulting dataset provides a solid basis for modeling efficiency drivers and analyzing performance distribution.
4.2. SBM-DEA Model Measurement Results
Based on the constructed input-output indicator matrix and SBM-DEA model configuration, efficiency measurement of 187 new energy collaborative R&D projects yielded a complete efficiency value sequence. Overall, efficiency scores exhibited a right-skewed distribution within the [0,1] range, indicating that most projects in the sample suffer from varying degrees of resource redundancy and output insufficiency.The mean efficiency value was 0.73, indicating room for improvement in overall resource allocation. Only approximately 31% of projects fell on the DEA efficiency frontier, signifying optimal input-output structures. Further analysis revealed low concentration in high-efficiency ranges, while samples clustered in the low-efficiency segment (below 0.5), reflecting significant organizational heterogeneity and output volatility in collaborative R&D practices.Additionally, based on slack variable back-calculation results, the average redundant input ratio is estimated at approximately 27%, particularly pronounced in funding and equipment dimensions. These comprehensive measurement results lay the foundation for subsequent identification of efficiency-influencing factors and structural optimization mechanisms(See Figure 3 for details).
Figure 3 displays the point distribution of 187 sample projects after efficiency measurement. The point cloud fluctuates around the 0.7 axis, with minor clustering in the tail regions. This reflects a "frontier-periphery" polarization trend in resource allocation performance, providing a foundational basis for setting structural variables in regression modeling.
4.3. Analysis of Factors Influencing Collaborative R&D Efficiency
To identify the primary drivers of collaborative R&D efficiency in new energy, an empirical analysis was conducted on nine structural variables using a double Bootstrap truncated regression model. The results are presented in Table 1.
Table 1 shows that degree centrality has a significant positive effect on R&D efficiency (β = 0.062, p < 0.01), indicating that firms in central network positions allocate resources more efficiently. Technological distance and knowledge stickiness both show negative effects, with a highly significant interaction coefficient of -0.112, implying that efficiency drops sharply when both barriers coexist. A positive coefficient for high-value patent share (0.027) confirms that output quality enhances efficiency. These results highlight the combined influence of structural, cognitive, and capability factors on efficiency outcomes.
4.5. Correlation Analysis Between Distributed Innovation Network Characteristics and Project Efficiency
Degree centrality, as a key indicator of resource access and collaboration influence, significantly improves efficiency (β = 0.062, p < 0.01). Projects with higher centrality achieve better resource matching. The interaction between technological distance and knowledge stickiness shows a strong negative effect (β = -0.112, p < 0.001), indicating that dual divergence reduces efficiency by 11%–14%. Although cross-regional cooperation is marginally insignificant, its positive coefficient suggests potential benefits. Overall, network structure, cognitive barriers, and operational factors jointly shape resource allocation efficiency, underscoring the critical role of distributed innovation in enhancing real-time coordination and planning in electric power systems.
5. Conclusion
In summary, under the distributed innovation model, resource allocation efficiency in collaborative R&D projects conducted by electric power system operating entities shows significant structural heterogeneity and spatial divergence. These divergences not only reflect the disparities in innovation capacity but also highlight their implications for system-level planning coordination and automated operational management within electric power systems. This study systematically analyzes the causes of efficiency divergence across multiple dimensions, including collaborative network structure, cognitive barriers, and organizational characteristics.By constructing a comprehensive measurement and interpretation framework based on SBM-DEA and dual Bootstrap truncated regression models, This study enhances the applicability of efficiency evaluation frameworks to new energy collaborative R&D scenarios and underscores the practical implications for improving electric power system automation and scheduling efficiency under distributed innovation frameworks, thereby filling an empirical gap in managing large-scale, cross-regional R&D resource deployment.It should be noted that while the current sample coverage and variable dimensions are representative, there remains room for expansion in cross-cycle comparisons and dynamic evolution modeling.Future research may integrate dynamic network evolution theory, incorporate time-series feature variables, and establish causal graph construction mechanisms to explore time-varying drivers of collaborative innovation efficiency and optimize intervention strategies. This would provide more systematic decision support for refined management of multi-stakeholder collaboration mechanisms in electric power system operators.
Acknowledgments
The authors gratefully acknowledge the support from the National Natural Science Foundation of China (Grant No. 71072075).
References
- Jiao, J; Xu, Y; Li, J; et al. The evolution of a collaboration network and its impact on innovation performance under the background of government-funded support: An empirical study in the Chinese wind power sector[J]. Environmental Science and Pollution Research 2021, 28, 915–935. [Google Scholar] [CrossRef] [PubMed]
- Liu, Y; Guo, Z; He, Q. Configuring Technological Innovation and Resource Synergies for Performance in New Energy Vehicle Enterprises: A Path Analysis Using Empirical and Comparative Methods[J]. Sustainability 2025, 17, 5196. [Google Scholar] [CrossRef]
- Xue, Y; Lu, Y; Wang, Z. Multidimensional Analysis of Technological Innovation Efficiency in New Energy Vehicles: Industrial Chain Heterogeneity and Key Drivers[J]. World Electric Vehicle Journal 2025, 16, 233. [Google Scholar] [CrossRef]
- Gao, S; Yi, Z; Chen, Y; et al. How does industry-university-research collaborative green innovation affect regional carbon emissions?—nonlinear effects and multi-mechanism analysis[J]. Carbon Balance and Management 2025, 20, 45. [Google Scholar] [CrossRef] [PubMed]
- Wu, Y; Liu, Q; Guo, Q. Can Vertical Mergers and Acquisitions of Renewable Energy Enterprises Enhance Supply Chain Resilience?—Empirical Verification Based on Multi-Period Difference-in-Differences Model[J]. Sustainability 2025, 17, 3211. [Google Scholar] [CrossRef]
- Jia, Y; Wang, Z; Li, Q. Evaluation and Analysis of Industrial Internet Maturity for Power Enterprises in the Digital Transformation[J]. Systems 2025, 13, 104. [Google Scholar] [CrossRef]
- Alka, T A; Raman, R; Suresh, M. Critical success factors for successful technology innovation development in sustainable energy enterprises[J]. Scientific Reports 2025, 15, 14138. [Google Scholar] [CrossRef] [PubMed]
- Tong, L; Qi, Q; Wang, C; et al. Does Renewable Energy Technology Innovation Enhance Carbon Productivity? Evidence from China[J]. Energies 2025, 18, 1681. [Google Scholar] [CrossRef]
- Kim, D; Jung, S; Kim, E. Distributed leadership in inter-organisational public research and development teams[J]. European Journal of Innovation Management 2025, 28, 1709–1739. [Google Scholar] [CrossRef]
- Yang, X; Wang, W; Wu, H; et al. The impact of the new energy demonstration city policy on the green total factor productivity of resource-based cities: Empirical evidence from a quasi-natural experiment in China[J]. Journal of Environmental Planning and Management 2022, 66, 293–326. [Google Scholar] [CrossRef]
Figure 1.
Efficiency Measurement Flowchart for the SBM-DEA Model.
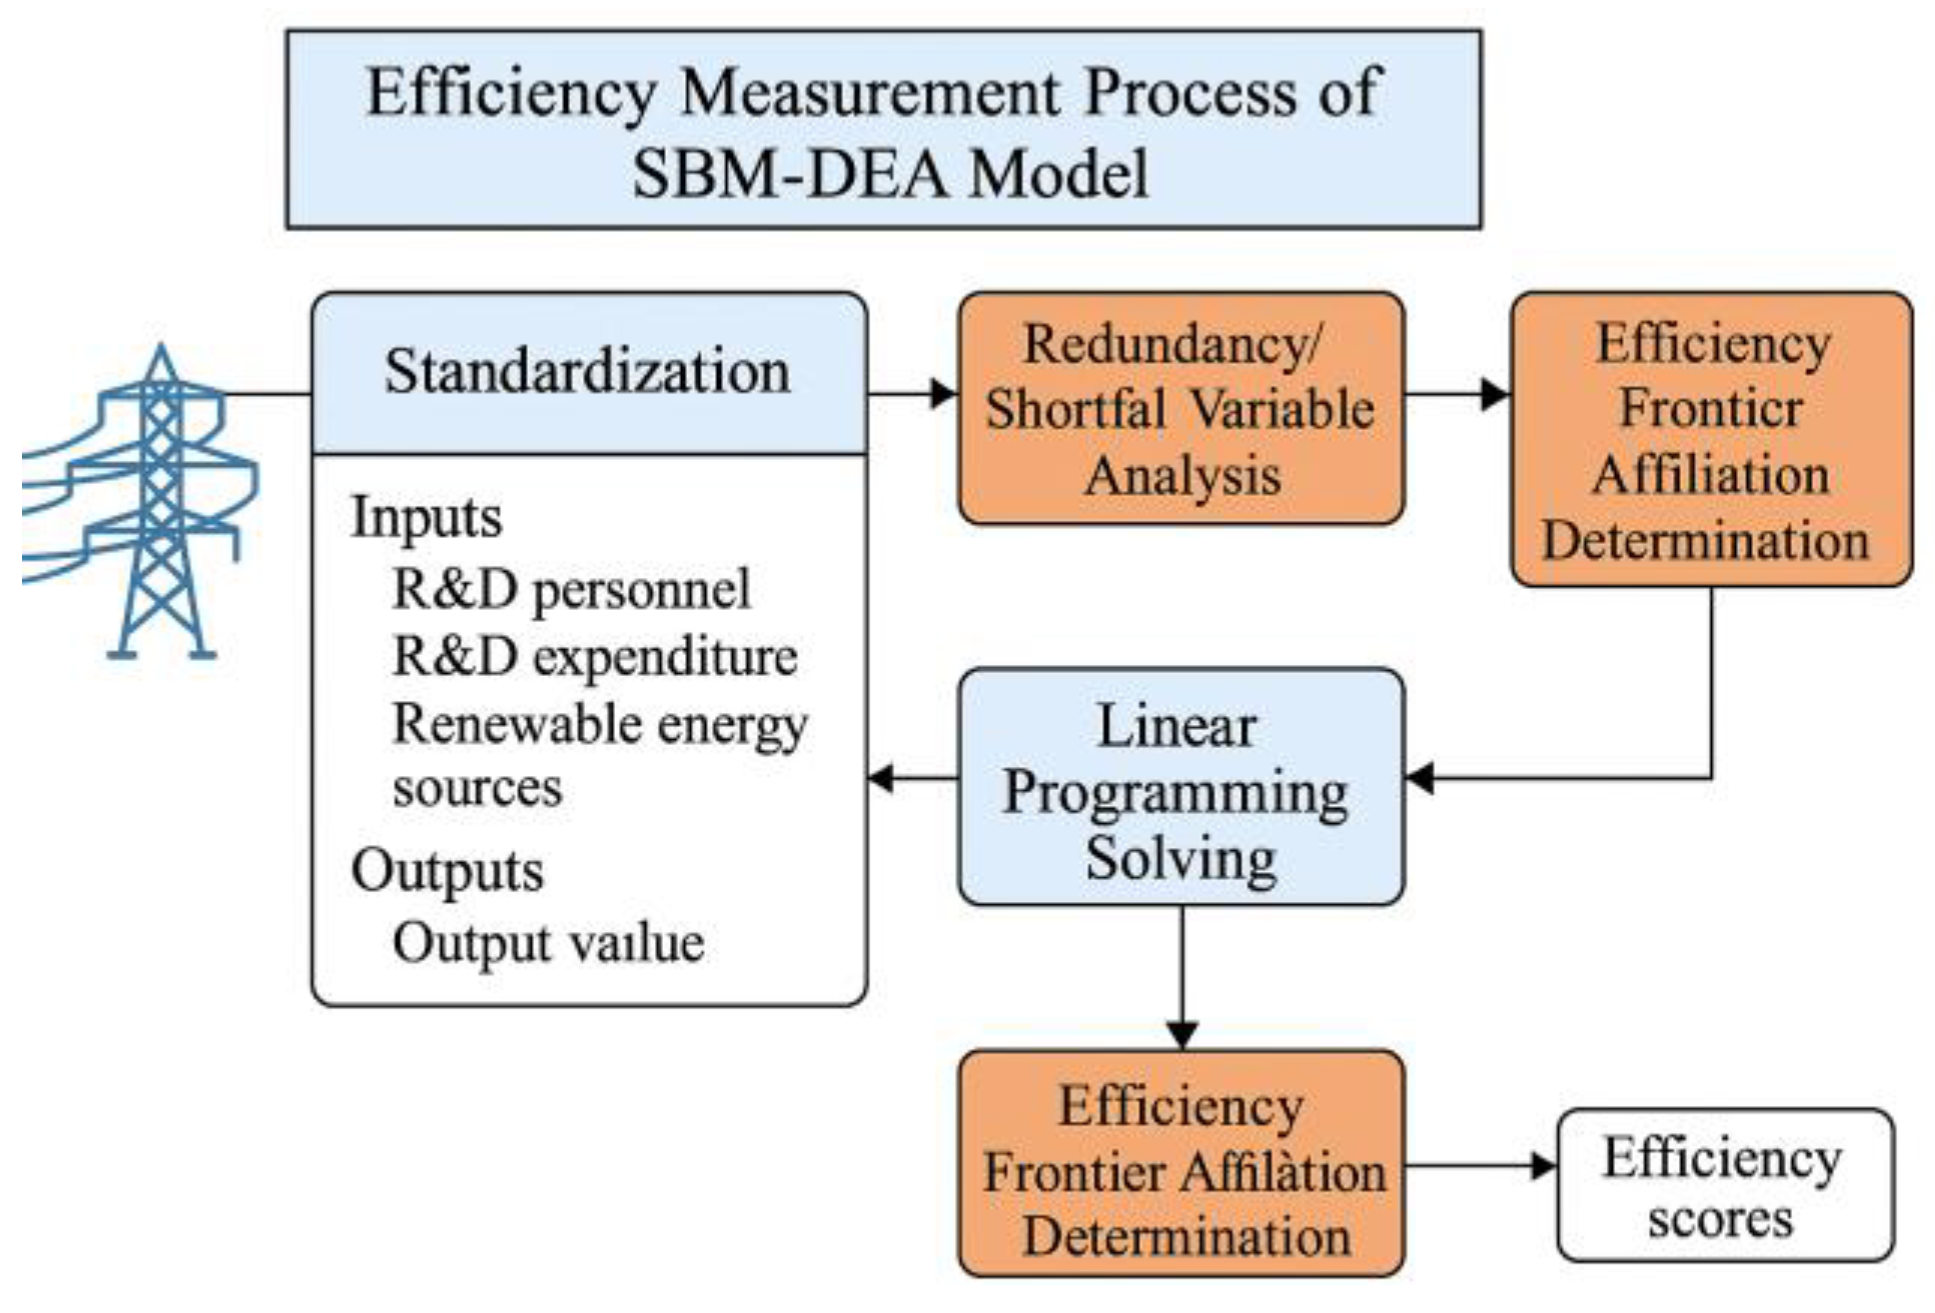
Figure 2.
Schematic Diagram of the New Energy Synergy Network Structure for electric power system operators.
Figure 2.
Schematic Diagram of the New Energy Synergy Network Structure for electric power system operators.
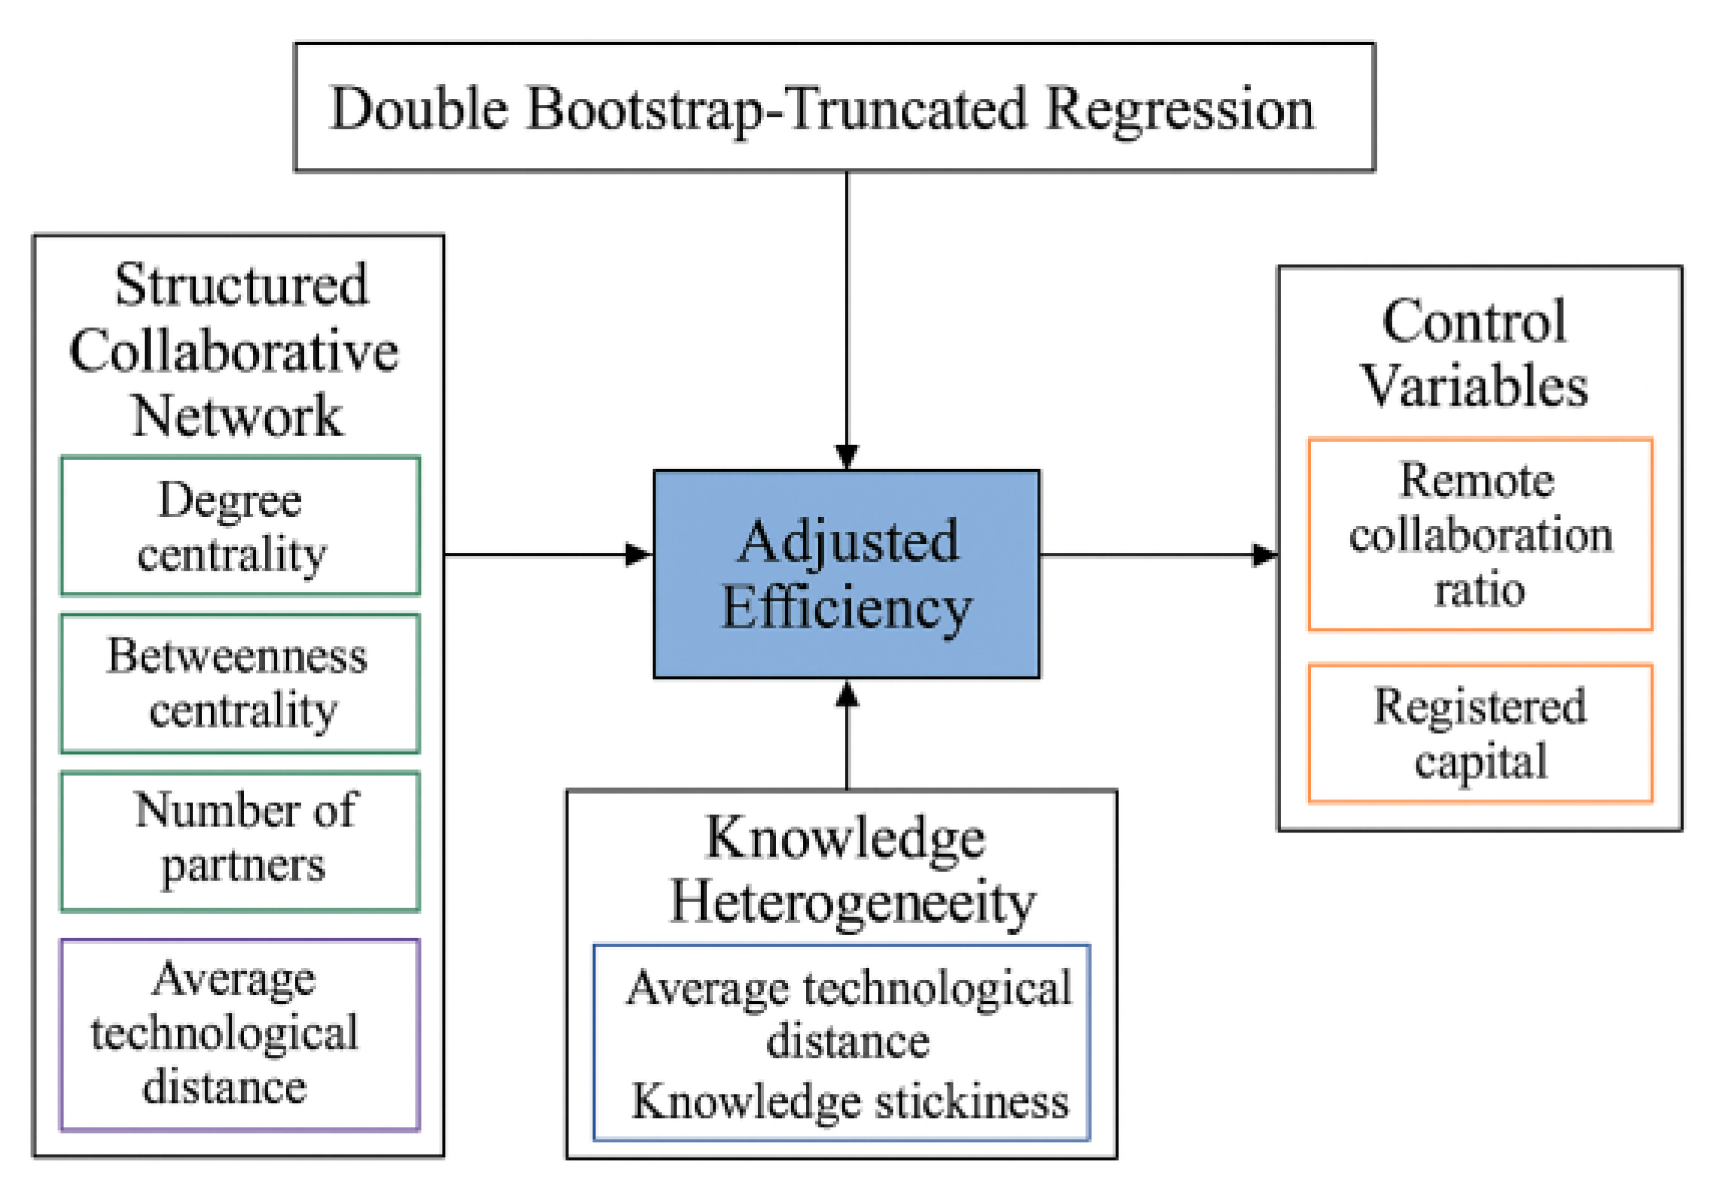
Figure 3.
Scatter Plot of SBM Efficiency Values for Collaborative R&D Projects.
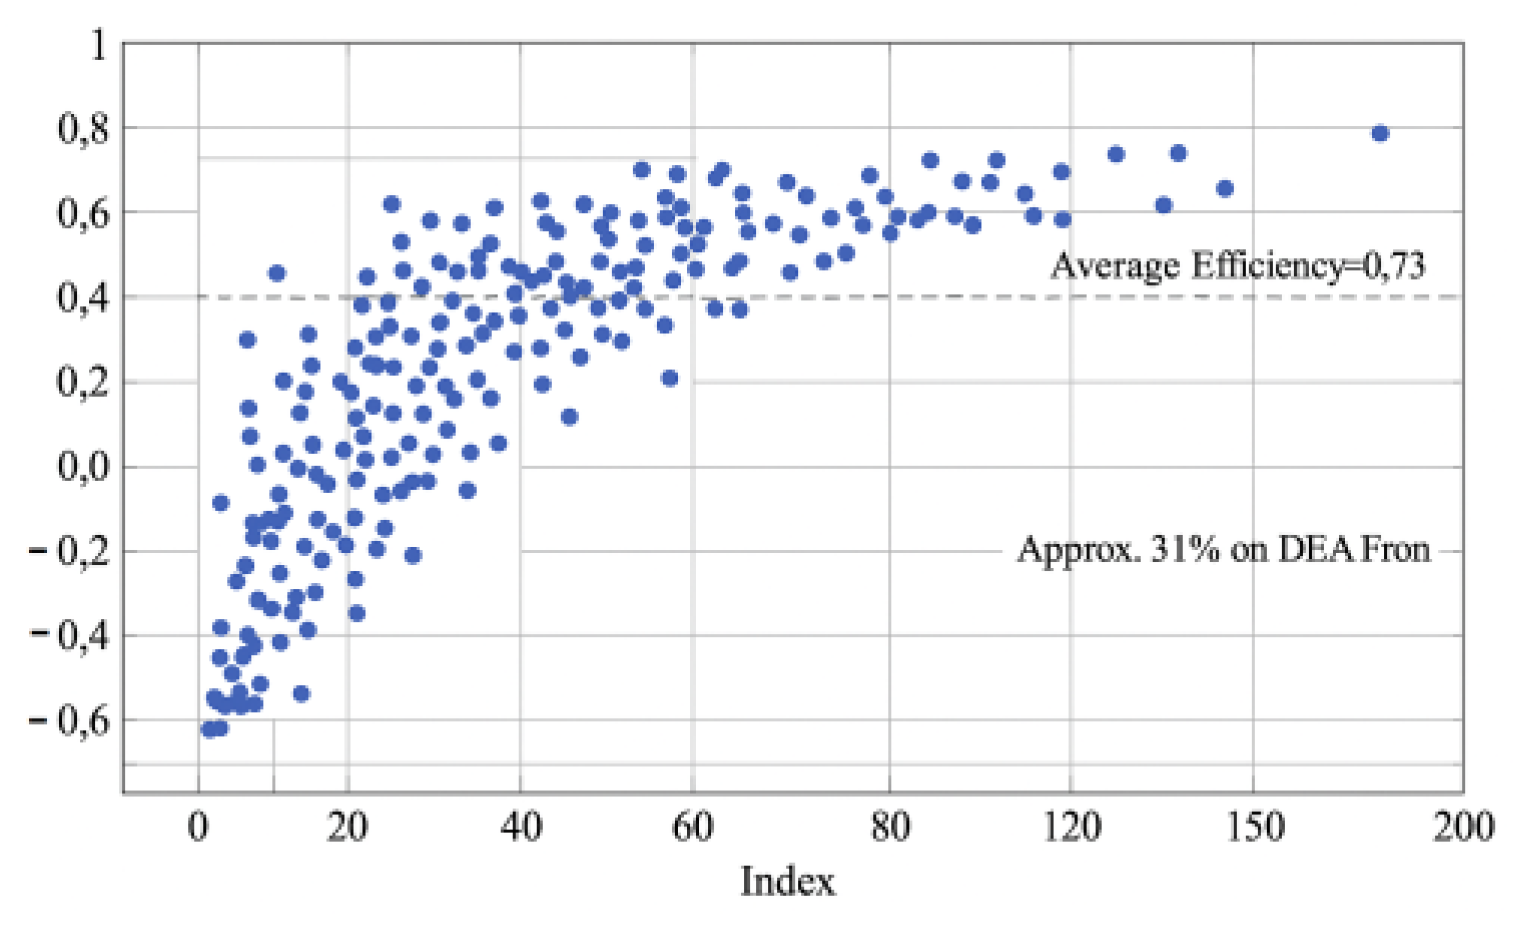

Table 1.
Truncated Regression Estimates of Factors Influencing Collaborative R&D Efficiency.
| Variable Name | Regression Coefficient β | Standard Error SE | Significance Level P-value |
| Network Degree Centrality | 0.062 | 0.018 | 0.001 |
| Cross-regional cooperation intensity | 0.037 | 0.021 | 0.087 |
| Technical Distance | -0.051 | 0.02 | 0.01 |
| Knowledge Stickiness | -0.043 | 0.017 | 0.014 |
| Technology Gap × Knowledge Stickiness | -0.112 | 0.031 | 0 |
| Number of Partner Enterprises | 0.008 | 0.012 | 0.474 |
| Enterprise Registered Capital (Logarithm) | 0.015 | 0.009 | 0.092 |
| High-value patent share | 0.027 | 0.011 | 0.021 |
| Regional dummy variable (control) | Control group setting | - | - |
Disclaimer/Publisher’s Note: The statements, opinions and data contained in all publications are solely those of the individual author(s) and contributor(s) and not of MDPI and/or the editor(s). MDPI and/or the editor(s) disclaim responsibility for any injury to people or property resulting from any ideas, methods, instructions or products referred to in the content. |
© 2026 by the authors. Licensee MDPI, Basel, Switzerland. This article is an open access article distributed under the terms and conditions of the Creative Commons Attribution (CC BY) license (http://creativecommons.org/licenses/by/4.0/).
Copyright: This open access article is published under a Creative Commons CC BY 4.0 license, which permit the free download, distribution, and reuse, provided that the author and preprint are cited in any reuse.


