
Submitted:
02 February 2026
Posted:
03 February 2026
You are already at the latest version
Abstract
Urban environments face increasing thermal stress from climate change and the Urban Heat Island effect, with significant implications for livability, public health, and energy sustainability. Outdoor thermal comfort defined as the state in which conditions are perceived as acceptable, depends on interactions among meteorological, morphological, physiological, and behavioral factors. This review synthesizes the application of machine learning (ML) to outdoor thermal comfort assessment into a practice-oriented taxonomy. Research spans diverse climates and urban forms, using inputs across environmental and human domains. Supervised learning dominates. Regression approaches (linear regression, support vector regression, random forest, gradient boosting) and classification algorithms (decision trees, support vector machines, K-nearest neighbors, Naïve Bayes, random forest classifiers) are widely used to predict thermal indices such as the Physiological Equivalent Temperature and Universal Thermal Climate Index, or to classify subjective responses including thermal sensation, comfort, and acceptability. Unsupervised learning (clustering, principal component analysis) supports identification of microclimatic zones and perceptual clusters, while deep learning (multilayer perceptrons, convolutional and recurrent neural networks, generative adversarial networks) achieves superior accuracy for complex, high-dimensional, and spatiotemporal data. Algorithms such as random forests, support vector machines, and gradient boosting consistently show strong performance for both indices and subjective responses when integrating multi-domain inputs. Semi-supervised and reinforcement learning remain underexplored but offer promise for leveraging large-scale sensor data and enabling adaptive, real-time comfort management. The review concludes with a roadmap emphasizing explainable artificial intelligence, scalable surrogate modeling, and integration with simulation-based optimization and parametric design tools.
Keywords:
outdoor thermal comfort
; machine learning
; surrogate modeling
; simulation-based optimization
; urban climate design
1. Introduction
Urban environments are increasingly exposed to thermal stress due to the dual pressures of global climate change and localized phenomena such as the Urban Heat Island (UHI) effect [1,2,3]. These climatic burdens reduce outdoor livability, exacerbate public health risks, and elevate energy demand for indoor cooling. As cities strive to enhance resilience and sustainability, outdoor thermal comfort (OTC) has emerged as a key consideration in urban design and planning. OTC is defined as the physiological and psychological condition in which individuals perceive outdoor thermal conditions as acceptable [4,5,6,7,8,9,10], capturing the complex interplay between meteorological variables, urban geometry, and individual human attributes.
Poor outdoor thermal conditions reduce the usability of public spaces, discourage physical activity, and increase reliance on air-conditioned indoor environments—further amplifying energy consumption and greenhouse gas emissions [11,12]. For this reason, OTC has been increasingly integrated into climate-responsive design and urban adaptation strategies, guiding interventions such as street shading, landscape cooling, and the deployment of green infrastructure [13,14]. Enhancing OTC supports broader goals of public health, equity, and behavioral adaptation to heat extremes [15,16,17].
OTC is governed by multiple, interdependent factors spanning meteorology, urban morphology, and human physiology. Meteorological drivers—such as air temperature, humidity, wind speed, and solar radiation—modulate the energy exchange between the human body and the environment [18,19,20,21,22,23]. Urban form—including aspect ratio (AR), sky view factor (SVF), surface materials, albedo, and vegetation—regulates local microclimates through shading, thermal storage, and airflow [17,21,24,25,26]. For instance, while narrow canyons may reduce solar exposure, they can also inhibit ventilation; conversely, vegetated surfaces promote evapotranspiration and reduce mean radiant temperature (MRT) [27]. Human thermal perception is further shaped by physiological parameters, including metabolic rate, age, clothing insulation and acclimatization [21,28,29,30].
To quantify OTC, several bioclimatic indices have been developed, including the Physiological Equivalent Temperature (PET) [31] , Universal Thermal Climate Index (UTCI) [32], Standard Effective Temperature (SET)* (with the asterisk indicating that it is an equivalent temperature index adjusted for humidity, air movement, and clothing) [33] and Predicted Mean Vote (PMV) [34]. These indices integrate environmental and physiological variables into standardized measures, facilitating cross-context assessment of thermal comfort [35].
Over the past two decades, OTC research has employed experimental, empirical, and simulation-based approaches to assess outdoor thermal conditions and guide design interventions. Field campaigns and thermal perception surveys have linked subjective responses to in situ measurements [19]. Empirical models, primarily based on regression analysis, have identified statistical relationships between microclimatic inputs and thermal indices [36]. At the same time, simulation platforms such as ENVI-met [37], RayMan [38], and tools based on computational fluid dynamics (CFD) [39] have enabled detailed assessments of urban thermal behavior and the evaluation of mitigation strategies [40].
Despite these advances, traditional approaches exhibit notable limitations. High-fidelity simulations often demand complex input data and are computationally intensive—limiting their utility in real-time or large-scale design processes. Moreover, regression and simulation models frequently rely on simplified or steady-state assumptions that fail to capture the nonlinear, context-sensitive, and adaptive nature of human thermal perception in outdoor environments [36].
To address these limitations, machine learning (ML) has emerged as a promising complement to conventional modeling approaches [41,42,43]. ML algorithms can uncover complex patterns from large and diverse datasets—including environmental, physiological, and behavioral variables—without relying on predefined physical equations. When properly trained, these models deliver high predictive accuracy, adaptability to varying contexts, and scalability for real-time or city-scale applications [44,45,46]. They are already being used for tasks such as thermal index prediction, spatial microclimate mapping, and simulation emulation via surrogate models.
Nonetheless, significant research gaps remain. First, most ML applications in OTC are fragmented and narrow in scope, typically designed for single-purpose prediction tasks and rarely transferable across climatic or morphological contexts [41,42,43,47]. Second, thermal comfort is strongly influenced by cultural and behavioral factors, which complicates model calibration and limits generalizability [19,48]. Third, many studies continue to rely on static or semi-dynamic approaches, with limited capacity to capture adaptive behaviors, feedback loops, or real-time environmental interactions [41,42,49]. Finally, and most critically, there is a lack of integration between ML and optimization frameworks. While ML provides accurate predictions, these insights are seldom coupled with simulation-based optimization (SBO), surrogate modeling, or multi-objective algorithms capable of informing adaptive, performance-driven design. This disconnect constrains the translation of predictive insights into actionable urban interventions.
To address these gaps, this review provides a systematic and critical assessment of how ML techniques can be applied—and more importantly, integrated with optimization frameworks—to assess, predict, and enhance OTC in urban environments. Specifically, this paper aims to:
- Synthesize ML methodologies used in OTC research, across supervised, unsupervised, deep learning, (DL), semi-supervised, and reinforcement learning paradigms;
- Explore the integration of ML with SBO, surrogate modeling, and scenario-based design strategies;
- Propose a roadmap for scalable, intelligent, and thermally adaptive urban design informed by ML capabilities.
The key innovative contributions of this review are:
- (a)
- Interdisciplinary synthesis: This study bridges urban climatology, environmental modeling, and artificial intelligence to build a cohesive understanding of ML-driven OTC assessment.
- (b)
- Systematic classification of ML techniques: A structured taxonomy of ML paradigms is developed, covering theoretical principles, input-output variables, performance metrics, and their contextual application in real-world case studies.
- (c)
- Integration with optimization workflows: A central innovation of this review is its focus on ML-optimization coupling. Through selected case studies, it highlights how ML can enhance SBO, evolutionary algorithms, and surrogate modeling in support of multi-objective and adaptive design strategies.
- (d)
- Proposal of a practical framework for OTC optimization: Drawing from state-of-the-art applications, the review formulates a transferable, context-sensitive framework that links climate analysis, parametric modeling, and ML-based optimization. This framework offers guidance on selecting appropriate indices, algorithms, and design parameters to support computationally efficient and implementation-ready OTC interventions across different urban and climatic contexts.
To ensure methodological rigor and relevance, a systematic literature search was conducted using Scopus (including ScienceDirect), Web of Science, and Google Scholar, covering peer-reviewed articles published between 2010 and 2025. Selection criteria included:
- (i)
- Relevance: priority to studies addressing ML-driven prediction, classification, or optimization of OTC in diverse urban contexts;
- (ii)
- Quality: inclusion of rigorously validated, peer-reviewed studies;
- (iii)
- Diversity: coverage of a broad but representative range of ML algorithms and optimization techniques;
- (iv)
- Applicability: emphasis on case studies demonstrating practical implementation, scalability, or integration into design workflows.
Conference papers, non-English publications, and purely theoretical studies without methodological contributions were excluded.
The rest of the paper is organized as follows: Section 2 introduces and categorizes ML paradigms relevant to OTC; Section 3 synthesizes empirical applications and case studies; Section 4 explores the integration of ML with optimization methods; and Section 5 provides conclusions and perspectives. Together, these sections establish a comprehensive framework for applying ML to develop scalable, adaptive, and climate-responsive design solutions that enhance OTC in urban environments
2. Machine Learning Approaches
ML, a fundamental subfield of Artificial Intelligence (AI), is concerned with the development of data-driven models that can identify patterns and make predictions, without the need for explicitly defined instructions for each possible scenario [50,51]. ML mainly aims to extract patterns from historical data to generate accurate and generalizable predictions on new, unobserved data [52]. A typical ML process includes preparing the dataset, training a model on labeled or structured data, assessing its performance on a separate subset, and applying it to practical tasks such as forecasting, classification, or automated control systems [53].
ML methodologies are commonly grouped into five categories, depending on the nature of the data and the learning mechanism [50,51,52,53,54,55]: (1) supervised learning (SL), (2) unsupervised learning (UL), (3) semi-supervised learning (SSL), (4) deep learning (DL) and (5) reinforcement learning (RL). These paradigms offer diverse strategies for addressing a wide range of tasks, from identifying hidden structures in data to optimizing adaptive decision-making processes (Figure 1).
SL is among the most extensively used ML techniques, particularly when labeled data are available. In this learning framework, the model is trained on input–output pairs, aiming to approximate an underlying function that minimizes the discrepancy between predicted and actual values [52]. This approach is well-suited to both regression tasks, which involve estimating continuous values, and classification problems, where categorical outcomes are assigned to observations. Well-known algorithms in this domain include linear regression (LR), decision trees (DTs), support vector machines (SVM), and artificial neural networks (ANNs). These tools are widely applied in environmental research and human-centric studies for tasks such as modeling climate-related indicators or predicting comfort perception [41,43].
In contrast, UL deals with scenarios where the dataset lacks predefined labels or output values. The focus here is on discovering inherent patterns or relationships within the data, often through techniques like clustering or dimensionality reduction [56]. These methods are instrumental in exploratory analysis, enabling researchers to group similar data points through techniques such as k-means or hierarchical clustering, as well as to reduce the complexity of large, high-dimensional datasets while retaining critical features, employing methods like Principal Component Analysis (PCA). Their utility in environmental applications includes the identification of microclimatic zones or behavioral patterns in human comfort responses [57].
SSL offers a hybrid approach, drawing on both labeled and unlabeled data to train more robust models [56]. By leveraging the information present in a limited labeled subset and the broader context provided by unlabeled data, SSL can enhance prediction accuracy without requiring extensive manual annotation. This is particularly advantageous in outdoor environmental monitoring or thermal comfort studies, where obtaining labeled data (e.g., subjective thermal sensation votes) can be costly or time-consuming.
DL refers to a subset of ML approaches based on multi-layered neural networks capable of learning complex and abstract data representations [53]. Unlike traditional ML models, which often rely on feature engineering, DL architectures such as Convolutional Neural Networks (CNNs), Recurrent Neural Networks (RNNs) and Long Short-Term Memory (LSTM) automatically learn hierarchical patterns from raw input. DL methods can operate under both supervised and unsupervised paradigms, but their distinguishing feature lies in their ability to handle unstructured and/or high-dimensional inputs such as images, time series, or spatial-temporal environmental data. DL has gained prominence in fields ranging from speech and image recognition to urban climate modeling and environmental sensing [58,59].
Finally, RL adopts a fundamentally different learning strategy. Rather than training on labeled datasets, RL involves an agent that learns by interacting with an environment, receiving evaluative feedback in the form of rewards or penalties [55]. Through trial and error, the agent refines its behavior to maximize cumulative rewards over time. RL is particularly powerful in applications requiring adaptive strategies, sequential decision-making, or dynamic control—ranging from robotics and game theory to emerging uses in real-time building operation and climate-responsive systems.
2.1. Supervised Learning
SL is one of the most established and frequently utilized ML approaches, especially when labeled datasets are available for model training. In this framework, an algorithm is trained on historical datasets comprising both input variables and their corresponding target values. Throughout the training process, the model refines its internal parameters iteratively to minimize a defined loss function that measures the discrepancy between predicted and actual values. Upon convergence, the trained model can be deployed to generate reliable predictions on unobserved data, provided that the training set adequately represents the underlying data distribution [50,51,60].
SL methodologies are broadly categorized into two functional domains: (1) regression, where the goal is to estimate continuous numerical responses, such as UTCI or PET; and (2) classification, which entails assigning discrete labels to input instances, such as thermal comfort categories). Both types are extensively employed in environmental informatics and human-centered thermal analysis, supporting the development of predictive models based on meteorological and subjective input variables.
In the following sub-sections, a selection of widely used regression and classification algorithms is presented. For each method, its theoretical framework is highlighted and its relevance to thermal comfort research is assessed, alongside a discussion of their advantages and limitations when applied to environmental datasets.
2.1.1. Regression Algorithms
Regression algorithms in SL are designed to predict continuous target variables by modeling the underlying relationships between input features and the corresponding outputs. These methods are particularly useful when the goal is to estimate scalar quantities, such as thermal indices, from complex environmental datasets. They form the basis of many predictive models in environmental and urban analytics due to their interpretability, scalability, and applicability to real-world datasets [61]. The most representative regression techniques include linear regression (LR), decision tree regression (DTR), support vector regression (SVR), and gradient boosting regression (GBR). More flexible methods, such as random forest (RF), artificial neural networks (ANNs), and extreme learning machines (ELMs), can also be applied to regression tasks, although they are capable of handling classification problems as well. All of these approaches are reviewed in the remainder of this section.
LR is a fundamental statistical learning technique employed to model the linear relationship between a continuous dependent variable and one or more independent predictors, under the assumption of additive and normally distributed errors. In the case of simple LR, the model is defined as [60,61]:
where denotes the observations, are the observed data pairs of the dependent variable and the single explanatory variable , and are the regression coefficients, and is an error term with zero mean and constant variance.
When more than one independent variable is available, the model generalizes as follows:
where again denotes the observations. Model parameters are typically estimated using the ordinary least squares (OLS) method, which minimizes the sum of squared differences between the observed and predicted values of the dependent variable [56]. Model performance is commonly evaluated using metrics such as the coefficient of determination (), adjusted , root mean square error (RMSE), and information-theoretic criteria like the Akaike Information Criterion (AIC) or the Bayesian Information Criterion (BIC) [62,63].
While LR is valued for its simplicity and interpretability, it is based on several assumptions—linearity, independence of errors, homoscedasticity, and normally distributed residuals—that may not hold in complex real-world datasets. In the context of outdoor thermal comfort assessment, LR provides a fast and transparent baseline model, although its limited capacity to capture nonlinear relationships may constrain its predictive performance in highly variable environmental settings.
DTR is a non-parametric supervised learning technique used for predicting continuous outcomes by recursively partitioning a dataset into subsets that minimize intra-node variance [61,64]. At each internal decision node, a binary split of the input data is performed with the objective of minimizing the prediction error. The algorithm selects the feature and the corresponding split point that optimally reduces the prediction error. For a given node, the algorithm evaluates all possible splits across the input features and computes the weighted average variance of the resulting subsets. The most common criterion for splitting is the weighted mean squared error (MSE), defined as [56]:
where and denote the left and right child nodes resulting from split s, are the observed values, and are the mean target values in each subset, and and represent the number of sample sizes in the left and right nodes, respectively. The split that minimizes the combined MSE is selected at each step. This recursive partitioning process continues until a stopping criterion is met, such as a minimum number of samples in a node or a threshold on variance reduction. The resulting DT consists of terminal leaves, each of which corresponds to a specific region of the input feature space. Within each of these regions, the predicted value is computed as the mean of the observed target values that fall into that region.
DTR is a rule-based learning algorithm that partitions data into increasingly homogeneous subsets by selecting optimal decision points, making it well-suited for modeling nonlinear patterns and intricate feature interactions. Unlike many other algorithms, DTR operates effectively without requiring normalization or scaling of inputs, and it can seamlessly manage both numerical and categorical variables. One of the strengths of DTR lies in its transparent decision structure, which facilitates interpretability and supports diagnostic analysis. It also shows resilience to outliers and multicollinearity, traits that are particularly valuable when working with real-world environmental datasets.
In the context of outdoor thermal comfort modeling, DTR has been employed to predict comfort-related indices such as PET and the UTCI by leveraging inputs such as air temperature, relative humidity, wind speed, and solar radiation [46,58]. Its ability to produce interpretable, tree-based decision rules makes it a practical and explainable modeling choice in environmental and urban climate studies [59,65,66].
SVM is a supervised ML technique derived from SVM, tailored for regression tasks. Unlike traditional regression methods that aim to minimize the prediction error directly, SVM’s primary objective is to identify a function that approximates the relationship between input features and continuous target values with high generalization performance, while allowing for an acceptable error tolerance [64,67,68]. The SVR function is generally expressed as [64]:
where denotes a nonlinear mapping of the input into a higher-dimensional feature space, is the weight vector, is the bias term, and denotes the inner product.
A distinctive feature of SVR is the introduction of the -insensitive loss function, which defines a margin of tolerance around the predicted function . Errors within this margin are not penalized, and only deviations larger than contribute to the optimization objective. The learning process involves minimizing both the model complexity, typically represented by , and the prediction errors outside the -margin.
To handle nonlinear patterns, SVR employs kernel functions—such as the radial basis function (RBF) or polynomial kernels—which enable implicit transformation of the input data into a higher-dimensional space where a LR model can be effectively constructed. Thanks to its balance between flexibility and generalization, SVR has been successfully used in outdoor thermal comfort studies for predicting indices such as PET and UTCI based on meteorological parameters, including air temperature, relative humidity, wind speed, and solar radiation [48,69].
GBR is an advanced ensemble ML strategy that constructs a strong predictive model through the iterative refinement of multiple weak learners—typically shallow DTs [70,71]. Unlike RFs, which employ parallel training via bootstrapped datasets, GBR takes a sequential approach. Each new tree is trained to address the prediction errors (residuals) made by the ensemble up to that point, thereby incrementally improving the model’s performance. The process begins with a baseline model, often a simple constant function such as the mean of the target variable. In each iteration, a new regression tree is fitted to the residuals, which are derived from the negative gradients of a specified loss function with respect to the current predictions. This gradient-based optimization framework allows GBR to effectively minimize the loss function over time. The ensemble model is updated iteratively as follows [70]:
where represents the model at iteration t, is the newly fitted tree, and is the learning rate that controls the contribution of each tree.
GBR provides considerable modeling flexibility by accommodating a wide range of loss functions—such as MSE for regression—and incorporating regularization mechanisms to control model complexity. A critical hyperparameter of GBR is the learning rate, since lower learning rate values (e.g., 0.01–0.1) typically lead to stable and generalized models, though they demand higher computational effort due to the increased number of boosting iterations required. Conversely, higher learning rates (e.g., 0.3–0.5) accelerate convergence but may compromise predictive performance by increasing the risk of overfitting. Techniques like shrinkage (via a learning rate) and constraints on tree depth help prevent overfitting, particularly when working with limited or noisy datasets.
In outdoor thermal comfort research, GBR has demonstrated strong predictive capabilities for indices such as the PET and UTCI [72]. Its ability to learn complex, nonlinear patterns and capture subtle interactions among meteorological inputs—such as air temperature, humidity, solar radiation, and wind speed—makes it especially valuable in applications involving diverse and heterogeneous environmental conditions. These attributes have positioned GBR as a reliable and high-performing method in climate-responsive predictive modeling.
Random forest regressor (RFR) is an ensemble-based ML technique that builds upon the principles of decision tree learning to improve predictive accuracy and model robustness. In this approach, multiple regression trees are trained in parallel, each on a different bootstrap sample drawn from the original dataset. To further diversify the ensemble, a randomly selected subset of input features is evaluated at each potential split within a tree [73,74,75,76]. This dual-randomization—both in data sampling and feature selection—serves to reduce the variance inherent in individual DTs, thereby enhancing the model’s generalization capabilities and resistance to overfitting. By aggregating the outputs of multiple trees, typically through averaging in the regression context, the final prediction benefits from reduced noise and improved stability. RFR is particularly effective in handling high-dimensional, nonlinear datasets with complex interactions and has been widely adopted in environmental modeling and climate-responsive prediction tasks [77,78].
Formally, for a dataset , RFR constructs trees , and the predicted output for a new input is [17]:
where denotes the output of the -th DT. This averaging mechanism yields a smoother and more stable prediction compared to an individual tree, particularly in the presence of noisy data or high-dimensional input spaces.
The ensemble averaging mechanism at the core of RFR contributes to its reliability by mitigating the sensitivity of individual DTs to data noise or variance. This collective decision-making approach enhances prediction stability, particularly in datasets characterized by high dimensionality or noisy measurements. A key advantage of RFR lies in its ability to model nonlinear relationships and variable interactions without extensive parameter tuning, while simultaneously offering tools for interpretability—such as feature importance rankings—which are valuable for understanding model behavior. Because of these strengths, RFR has gained traction in environmental and climate-related modeling, where data complexity and heterogeneity are common. Within the field of outdoor thermal comfort, RFR has been effectively used to estimate indices like PET and UTCI from meteorological predictors. Its consistent performance across varying climatic contexts [79] underscores its robustness and versatility as a predictive modeling tool in urban thermal analysis.
ANNs are algorithmic structures inspired by the architecture and functionality of the human brain, designed to simulate the way biological neurons transmit and process signals. These models have become central to many supervised learning applications, particularly those involving complex and highly nonlinear mappings between input features and target variables. One of the most widely used ANN architectures is the feedforward neural network (FFNN), also known as the multilayer perceptron (MLP) [80,81]. FFNNs are composed of layers of interconnected processing units, or neurons, through which information propagates in a single direction [52,53,81,82]. Figure 2 illustrates such an architecture, consisting of an input layer (), a number of hidden layers, two of which are shown ( and ), and an output layer ().
In an ANN, each neuron operates by calculating a weighted sum of its inputs, adding a bias term, and then applying a nonlinear activation function to the result. For a single-layer perceptron, this operation is typically formulated as [75]:
where, is the neuron’s output, denotes the activation function, are the input features, are the corresponding weights, is the bias term, and is the number of input nodes.
Training an ANN involves adjusting the weights and biases to reduce the discrepancy between predicted and actual outcomes. This is commonly achieved using the backpropagation algorithm, which computes the gradient of the loss function with respect to each parameter and applies optimization techniques such as stochastic gradient descent to update the network iteratively [83]. Because of their flexible, layered structure and capacity to approximate complex nonlinear mappings, ANNs are especially suitable for predictive modeling in environmental systems. In outdoor thermal comfort studies, they have been successfully utilized to estimate thermal indices like PET and UTCI based on meteorological data [44,84,85,86]. Their adaptability and high predictive accuracy make them well-suited for use in diverse urban environments with variable climatic conditions.
Finally, ELMs represent a class of single-layer FFNNs designed for high-speed learning. Unlike traditional ANNs, ELMs assign input weights and biases randomly and compute output weights analytically, which eliminates iterative tuning and significantly reduces training time. Despite their simplicity, ELMs have shown strong performance in regression tasks, including predicting thermal sensation votes in outdoor environments, making them suitable for real-time applications [87].
2.1.2. Classification Algorithms
Classification is a core task in supervised learning that involves assigning input data to one of several predefined categories based on patterns extracted from labeled examples. This technique is particularly relevant in environmental modeling and human-centric studies, where outcomes such as thermal sensation categories (e.g., comfortable vs. uncomfortable), heat stress levels, or subjective perception classes are inferred from sensor measurements or survey responses [52,60].
Several well-established classification algorithms are commonly used in this context:
- Decision tree classification (DTC) is a non-parametric technique that segments the feature space by recursively applying decision rules. It is valued for its clarity and ability to accommodate both categorical and continuous input variables [88].
- K-Nearest neighbors (KNN) is an intuitive, non-parametric classifier that assigns labels based on the majority class among the k closest data points in the feature space. While simple to implement, KNN is sensitive to noise and feature scaling, and can be computationally demanding for large datasets [89].
- Naive Bayes (NB) is a probabilistic classifier that applies Bayes’ theorem under the assumption of feature independence. Despite its simplistic assumptions, NB often performs competitively in high-dimensional or sparse data environments [90].
- Random forest classifier (RFC) is an ensemble learning approach that combines the predictions of multiple DTs through majority voting. RFC reduces variance and mitigates overfitting, offering improved stability over single-tree models [73].
Each classification method offers distinct trade-offs in terms of interpretability, computational cost, scalability, and resilience to noise. The optimal choice often depends on the characteristics of the dataset and the specific classification objectives involved.
2.2. Unsupervised Learning
UL encompasses a class of ML methods that aim to uncover latent patterns, internal structure, or meaningful groupings within datasets that do not contain labeled outputs. Unlike supervised approaches, UL models operate solely on input data, identifying relationships or organizing data points based on their inherent similarities. These techniques are essential in exploratory data analysis, anomaly detection, and feature extraction, where interpretability and reduction of data complexity are often required. In environmental and human-centric studies, UL has proven valuable for tasks such as classifying occupant behavior, recognizing perceptual clusters in comfort surveys, or identifying distinct microclimatic regimes using sensor-based observations [53,75,91,92,93,94,95,96]. Several widely adopted ul techniques are discussed in the following paragraphs.
K-means clustering is a distance-based sequential method that partitions a dataset into k predefined non-overlapping clusters by minimizing the intra-cluster variance. The squared Euclidean distance is the most frequently used metric in the k-means algorithm; however, alternative distance measures such as Mahalanobis, Manhattan, and Chebyshev can also be utilized depending on the type of the data. The choice of distance metric can significantly influence the resulting clustering. Each observation is assigned to the cluster with the nearest mean (centroid), and the algorithm iteratively updates cluster assignments and centroids to reduce the following objective function [93]:
where, is the total within-cluster sum of squares, is the number of clusters, is the set of points in cluster , is the centroid of cluster and is a data point in cluster . A common convergence criterion of the algorithm is that the cluster centroids remain unchanged across successive iterations.
Hierarchical clustering is an unsupervised learning technique that constructs a hierarchy of clusters without requiring the number of clusters to be predefined. It has two main forms: agglomerative (bottom-up), where each observation starts as its own cluster and clusters are merged iteratively based on similarity; and divisive (top-down), which begins with all observations in a single cluster and recursively splits them. The method relies on distance metrics such as Euclidean, Manhattan, or Mahalanobis distance for calculating the distances between observations, and linkage criteria such as simple (nearest neighbor), complete (farthest neighbor), average, Centroid, or Ward’s linkage to determine the proximity between clusters. The result is a dendrogram that illustrates cluster hierarchy at multiple scales. This method is particularly insightful in climate analytics, where multi-scale structures—such as regional comfort patterns or temporal behavioral trends—must be explored [97].
PCA is a method of identifying patterns in data and re-expressing the data in a way that highlights the underlying similarities and distinctions among observations. It is a linear technique for dimensionality reduction that projects high-dimensional data into a new coordinate system defined by uncorrelated principal components. These components are linear combinations of the initial variables, ranked by the proportion of variance they capture. The transformation is expressed as [95]:
where, is the mean-centered data matrix, contains the eigenvectors of the covariance matrix, and represents the transformed data. PCA is widely applied to reduce complexity in meteorological and comfort datasets, while preserving most of the variance [98].
T-distributed stochastic neighbor embedding (t-SNE) is a nonlinear dimensionality reduction algorithm aimed at preserving local data structure when projecting high-dimensional data into two or three dimensions. It is particularly effective for visualizing complex datasets where traditional linear methods like PCA may fail to preserve neighborhood information. In comfort studies, t-SNE has been utilized to reveal latent clusters in perception surveys or to explore spatial patterns in urban microclimates [53,94].
Autoencoders are a type of neural network trained in an unsupervised manner to compress and reconstruct input data. They consist of an encoder that maps the input to a latent representation , and a decoder that reconstructs the input from this compressed form. The overall transformation can be represented as: [92,96]:
where is the original input data vector, is the encoder function that compresses the input into a latent representation, is the decoder function that reconstructs the input from the latent code, and is the reconstructed approximation of the input. During training, the network learns to retain the most relevant features of the input by optimizing a loss function such as the MSE between and . Autoencoders are particularly valuable for dimensionality reduction, denoising, and unsupervised feature extraction. In microclimate modeling and environmental studies, autoencoders have been employed to generate compact representations of complex sensor data, enabling improved clustering, pattern recognition, or subsequent predictive modeling [99].
2.3. Semi-Supervised Learning
SSL occupies a middle ground between supervised and unsupervised learning, leveraging a limited set of labeled examples together with a much larger collection of unlabeled data to train more effective models. This hybrid approach is particularly advantageous in fields such as environmental sensing, urban microclimate analysis, and human thermal comfort studies, where collecting raw data is relatively straightforward, but obtaining ground truth labels is time-consuming or resource-intensive. By utilizing the latent structure within the data, SSL models can achieve better generalization performance compared to supervised methods trained solely on small labeled datasets [54,100].
A variety of SSL methodologies have been proposed. Some of the most commonly applied include self-training, co-training, graph-based approaches, consistency regularization, and generative models. In self-training, a supervised model is initially trained on the available labeled data. It then generates pseudo-labels for the unlabeled samples, and those predictions with the highest confidence are gradually added to the training set. This iterative process refines the model with increasingly enriched data [101]. Co-training involves training multiple classifiers on different, ideally conditionally independent subsets of features. Each model assigns labels to unlabeled examples, which are then used to train the other classifiers. This mutual reinforcement encourages complementary learning and can improve robustness [102]. In graph-based approaches, data points are represented as nodes in a graph, with edges weighted according to similarity metrics. Label information is propagated from labeled to unlabeled nodes using principles of transductive learning, which focuses on predicting labels only for the given unlabeled data rather than learning a general model, enabling label inference through relational structure [103]. Consistency regularization encourages the model to produce consistent predictions even when small perturbations (such as noise, augmentation, or dropout) are applied to the input data. By enforcing smooth decision boundaries, the algorithm becomes more robust to data variability [104]. Finally, in generative models, semi-supervised variational autoencoders (VAEs) and related generative techniques integrate unsupervised representation learning with supervised objectives, using latent variables to encode data structure in ways that benefit classification or regression tasks [105].
Although no current OTC-specific studies have adopted SSL frameworks, the method’s ability to reduce labeling requirements while maintaining predictive accuracy renders it highly promising for future applications. As cities deploy dense sensor networks and physiological data collection become more accessible via wearable devices, SSL is likely to play a pivotal role in advancing scalable, data-efficient, and context-aware thermal comfort modeling.
2.4. Deep Learning
DL refers to a class of ML techniques grounded in ANNs with multiple hidden layers. These multilayered structures can learn directly from raw data by extracting progressively more abstract features at each layer. DL models are particularly effective for high-dimensional, nonlinear problems, as they enable automatic feature learning and hierarchical representation of data [53,106,107]. Several prominent DL architectures have been applied in the environmental sciences and outdoor thermal comfort domain, each suited to different types of data and learning objectives [107], and are briefly described below.
MLPs are the most straightforward DL models, comprising fully connected layers where each neuron is connected to all neurons in the subsequent layer. They are suitable for tasks such as classification or regression when the dataset lacks spatial or sequential structure. Despite their simplicity, MLPs can approximate complex functions and are widely used for predicting thermal indices when the feature space is moderate [52,53,107].
CNNs are specialized for data with spatial structure, such as images or gridded environmental data. They use localized filters (kernels) that slide across the input to extract features like edges, gradients, or textures. This makes CNNs especially powerful for spatial prediction tasks, including urban microclimate mapping. The convolution operation is typically defined as [107,108]:
where is the output at spatial location , represents the input image or feature map, is the convolutional kernel (or filter) of size , denotes the region of the input over which the filter is convolved, is the bias, and denotes summation over the dimensions of the kernel.
Recurrent neural networks (RNNs) are designed to process sequential data and capture temporal dependencies, making them ideal for time-series predictions in microclimatic and energy demand applications [53,107,109]. A mathematical expression representing the recurrent relationship that defines how the hidden state is updated at each time step , based on the input and the previous hidden state , can be written as follows [53,107]:
where is the hidden state at time , is the weight matrix applied to the previous hidden state, is the weight matrix applied to the current input , is the bias term for the hidden layer, and is the activation function. In contrast to FFNNs, which process inputs independently, RNNs utilize feedback loops that allow them to capture temporal dependencies. This makes them essential in domains involving climate dynamics and behavioral sequences [83,107]. Several types of RNNs have been developed [110], such as Elman RNN [111], Jordan RNN [112], LSTM [107,110,113] and the Gated Recurrent Unit (GRU) [114].
Deep belief networks (DBNs) are composed of multiple layers of Restricted Boltzmann Machines [115], trained in a layer-wise unsupervised manner followed by supervised fine-tuning. Each layer extracts increasingly abstract representations of the data, enabling DBNs to capture intricate patterns. Their hybrid training process makes them particularly effective in scenarios with limited labeled data but large volumes of raw inputs. In environmental modeling, DBNs have been used for feature reduction, anomaly detection, and preprocessing sensor data [116,117].
Finally, generative adversarial networks (GANs) are a relatively recent innovation in the field of DL, particularly suited for unsupervised and semi-supervised tasks. They comprise two neural networks, the generator and the discriminator, that are trained simultaneously in a competitive framework. The generator is tasked with producing synthetic data that resemble real observations, while the discriminator attempts to distinguish between genuine data samples and those generated artificially. This adversarial interplay drives both models to improve over time, resulting in the generator learning to approximate the underlying data distribution effectively. The training objective is structured as a minimax game, where the generator aims to minimize the probability of the discriminator correctly identifying fake samples, and the discriminator seeks to maximize its accuracy. Through this iterative optimization, GANs are capable of producing highly realistic data outputs even in complex, high-dimensional spaces [118].
2.5. Reinforcement Learning
RL represents a distinctive branch of ML focused on training agents to make optimal decisions through trial-and-error interactions within an environment. Unlike supervised learning, which relies on annotated datasets, RL operates without direct instruction. Instead, the agent autonomously navigates the environment by selecting actions and receiving evaluative feedback in the form of rewards or penalties based on the consequences of those actions. Over time, the agent aims to refine its behavior by discovering a policy—a mapping from states to actions—that yields the maximum cumulative reward. This objective often involves balancing two competing strategies: exploration (testing new actions to gather information) and exploitation (choosing actions known to produce high rewards) [55].
RL is particularly effective for tackling problems that require sequential decision-making in environments where the system dynamics may be uncertain or change over time. Its ability to learn optimal actions based on feedback makes it suitable for complex, real-time scenarios. Beyond its established use in robotics and autonomous control systems [119,120] RL is gaining momentum in applied environmental and urban research [121,122]. It has been explored for smart building management, including dynamic HVAC control, adaptive regulation of outdoor thermal comfort, and optimization of microclimatic conditions in urban spaces [123,124]. These applications benefit from RL’s capacity to continuously adjust strategies based on evolving environmental data, enabling more responsive and energy-efficient interventions.
Formally, RL problems are often modeled as Markov Decision Processes [55], defined by a tuple where is the set of states; is the set of actions; is the state transition probability from state to given action and , ; is the reward function; and is the discount factor that balances immediate and future rewards [125]. At each time step , the agent perceives its current state taking an action , moving to a subsequent state , and receiving a reward signal . Using this sequence of experiences, the agent continually adjusts its policy , which defines the probability or strategy of choosing action when in state s.
RL algorithms are broadly categorized into two main classes [55,119]. Value-based methods, such as Q-learning and deep Q-Networks (DQN), estimate a value function that represents the expected return of performing action in state . The agent then chooses actions that maximize this estimated value. Policy-based methods, such as REINFORCE and actor–critic algorithms, directly optimize the policy without explicitly computing a value function. These approaches are especially suited for continuous or high-dimensional action spaces.
Recent studies have shown RL’s potential in climate-responsive applications, especially where adaptation and automation are key [121]. For example, RL has been deployed to optimize thermal control in smart buildings [123,124], adaptive shading systems [126,127], and real-time energy management frameworks [128,129]. Although its application in OTC remains largely theoretical, the method’s capacity to autonomously learn context-specific control strategies from continuous environmental feedback makes it a compelling candidate for outdoor thermal regulation. Nonetheless, several challenges persist. RL algorithms are often sample-inefficient, requiring extensive interactions to converge on optimal policies. They can also be sensitive to hyperparameter tuning and may exhibit instability in non-stationary environments. Despite these limitations, RLs ability to improve decision-making in complex, real-world systems underscores its promise as a foundation for intelligent outdoor comfort optimization.
Table 1 summarizes the main advantages and disadvantages of commonly used ML techniques. Broadly speaking, the key challenges associated with ML techniques can be grouped into two principal categories: (a) the complexity of algorithmic assumptions and model interpretability, and (b) the computational cost and data requirements associated with training and validation. These trade-offs become particularly important when selecting appropriate algorithms for environmental modeling tasks, where accuracy, scalability, and transparency are often competing priorities.
3. Real-World Applications
Over the last decade, the integration of ML techniques into OTC research has advanced rapidly, presenting robust alternatives to conventional thermal indices and static empirical formulations [41,131]. Traditional models such as the PMV, PET, and UTCI have long provided standardized methods for evaluating thermal comfort in outdoor settings [21,32]. Nevertheless, these indices often rely on steady-state assumptions, limited physiological representations, and predefined exposure scenarios, which may not fully account for complex environmental interactions or inter-individual variability in thermal perception [36,132]. Furthermore, their applicability under rapidly changing urban microclimates or diverse demographic contexts remains constrained. In contrast, ML models—particularly those employing SL and DL architectures—offer adaptive, nonlinear, and scalable frameworks capable of learning from empirical data and integrating multifactorial influences such as urban morphology, behavioral patterns, and real-time weather dynamics [36,41,42,43,132,133,134]
ML models are uniquely suited to unravel the intricate, nonlinear interdependencies among environmental variables, human physiology, and behavioral adaptation, thereby enabling real-time, high-resolution predictions of OTC across diverse urban contexts [48,86,135,136]. The growing proliferation of environmental sensor networks, wearable biometric devices, remote sensing platforms, and three-dimensional urban morphometric datasets has further enhanced the applicability of ML in OTC modeling. Among SL techniques, algorithms such as RF [44,45,47,59,137,138], SVM [139,140], Gradient Boosting Machines (GBMs) [46,47,59] have demonstrated strong predictive performance in classifying thermal sensation categories and estimating index-based comfort metrics such as PET and UTCI. In parallel, DL architectures—including ANNs with multiple hidden layers [59,141,142], CNNs [58,143], and hybrid models [138]—have shown increasing utility in capturing spatiotemporal dynamics and learning abstract representations of thermal conditions from high-dimensional, multimodal datasets. These advancements highlight the capacity of ML to support individualized, context-aware assessments within complex outdoor environments.
Although ML models have achieved commendable predictive accuracy in OTC applications, their adoption in this domain is still emerging when compared to the more established field of indoor environmental modeling. Most research efforts to date have focused on SL and DL, often adapted from methods originally developed for indoor conditions or environmental forecasting. Notably, RL—which has demonstrated substantial potential in building automation and adaptive HVAC control—remains underexplored in outdoor contexts, where dynamic and less-controllable environmental variables present additional modeling challenges.
Table 2 (for SL), 3 (for UL), and 4 (for DL) consolidate a comprehensive overview of recent studies that apply supervised, unsupervised, and DL algorithms to the prediction and classification of OTC conditions.
The reviewed SL studies in Table 2 were conducted across diverse regions, including Europe (Germany, Spain, Switzerland, Serbia, Cyprus), North America (United States), the Middle East (Iran), and Asia (China, Hong Kong, India, Taiwan, Singapore, Japan). Diverse urban contexts were examined, including high-density cities and metropolitan areas, public squares, pedestrian streets, urban canyons, various types of urban parks and open spaces, shaded areas, green sidewalks, and courtyards.
A wide range of methods was applied, including tree-based models (RF and its extensions such as quantile regression forest, DT, XGBoost, AdaBoost, LightGBM, CatBoost with Bayesian optimization, GB, GBT), linear and probabilistic models (LR, multinomial logit and ordered probability models, Bayesian ridge regression, least angle regression, logistic regression, NB, regression kriging), neural networks (ANN, including MLP, FFNN, BPNN), DL approaches, kernel-based methods (SVM, SVR), instance-based methods (KNN), and dimensionality reduction and clustering techniques (PCA, k-means), occasionally combined with SHAP analysis for improved model interpretability. SL algorithms—most notably RF, SVM, and XGBoost—have emerged as dominant tools in OTC modeling, owing to their robustness, interpretability, and efficiency in handling structured environmental datasets. These models are frequently employed to predict subjective thermal responses such as TSV, TCV, and TA, as well as to estimate objective comfort indices including the PET and UTCI.
The reviewed studies employed diverse input parameters, encompassing demographic and socioeconomic (age, gender), meteorological and environmental variables (time of day, season, air temperature, relative humidity, wind speed, solar and globe radiation, mean radiant temperature, PMV, PET), urban form and geometry metrics (elevation, slope, AR, orientation, sky view factor, canyon surface materials, tree metrics, green coverage, building density, albedo, emissivity), remote sensing indices (NDVI, NDWI, NDBI, LULC categories), and other personal factors (clothing insulation, metabolic rate, activity level, BMI, emotional state). Some studies incorporated physiological measurements (skin and ear temperature, heart rate) using sensors or infrared thermography, smartphone-based data (temperature readings, GPS), and questionnaire-derived variables (reason for visiting, frequency of attendance). Several studies also used simulated or modeled data (ENVI-met, Rayman) to compute thermal comfort indices and enhance the interpretation of field measurements.
Outputs included widely recognized thermal comfort indices—most notably PMV and UTCI, which are considered gold-standard metrics—together with PET, mPET, NET, and THI, representing additional physiologically based or empirical indicators of thermal stress. Environmental variables such as MRT, LST, and high-resolution Ta and RH fields (100–200 m) were also extracted to support detailed microclimatic analysis. Subjective responses were captured primarily through TSV, the benchmark ASHRAE −3 to +3 thermal sensation scale, complemented by TCV and TAV, which assess perceived comfort and acceptability, respectively. For statistical analysis, these responses were occasionally recoded into binary comfort classes (comfortable/uncomfortable) or aggregated into three broader categories—cool discomfort, neutral comfort, and warm discomfort. These subjective metrics served as dependent variables in ML models designed to evaluate outdoor and courtyard thermal performance.
Turning to different modeling approaches, model performance was consistently high across the reviewed studies, with reported classification accuracies often exceeding 85%, and regression metrics demonstrating strong predictive reliability—e.g., coefficient of determination (R2) values above 0.90, and MAPE below 5%. ML models, including ELM, RF, SVM, ANN, and XGBoost, consistently outperformed classical approaches in predicting TSV, PET, UTCI, and MRT. ELM achieved highest accuracy for MRT (R2=0.99) and TSV (R2=0.94), while SVM effectively predicted thermal sensation categories using local skin temperatures. Notably, several models retained high performance even when trained with reduced or simplified input feature sets, underscoring the efficiency and adaptability of these algorithms in real-world urban microclimatic applications. RF highlighted key physiological and seasonal predictors, and XGBoost often provided top OTC prediction accuracy, with SHAP analyses revealing nonlinear impacts of environmental, physiological, and design factors. ANN and DL models delivered accurate hourly PET and UTCI predictions, supporting applications with limited microclimatic inputs. As regards statistical and classical models, ordered probability and multinomial logit models outperformed LR in TSV prediction, with multinomial logit better for individual predictions and ordered probability capturing distributions. GA-trained binary-linear classifiers successfully predicted thermal comfort using PET thresholds, and regression kriging with MLR achieved high urban air temperature accuracy, although performance decreased under high variability.
Furthermore, including physiological data such as heart rate, skin temperature, and facial expressions improved OTC predictions, with children’s TSV predicted at 97.1% and real-time preferences at 66% accuracy. Individual factors like BMI, respiratory rate, and metabolic rate influenced comfort outcomes, particularly under varying shading, exposure duration, and activity levels. Urban landscape and environmental design strongly affected LST and thermal comfort. Built-up and vegetated areas reduced LST at boundaries, while urban expansion intensified UHI. Courtyard and sunken square parameters (including SVF, slope, AR, orientation, and vegetation) significantly influenced PET, with greening often more effective than material choices. Green exposure in subtropical environments further enhanced OTC, especially under moderate air velocity and SVF. High-resolution datasets and crowd-sourced sensors enabled accurate urban temperature and OTC mapping at city-wide and one-meter resolutions, capturing fine spatial–temporal variations and nighttime heat stress. Simplified sensor inputs retained predictive power, demonstrating scalable, cost-efficient alternatives to CFD simulations for urban planning and heat mitigation.
Finally, regarding index performance and predictive insights, PET and UTCI remained widely used indices, with ML improving prediction over PET-based methods, particularly for extreme and complex conditions. TSV predictions were generally reliable, whereas TCV showed greater variability due to subjectivity. Shading, exposure duration, and physiological adaptation strongly influenced accuracy. Regarding computational efficiency and model optimization, using GA, PCA, k-means clustering, and Bayesian methods enhanced ML performance while reducing computational demands, decreasing training dataset sizes by up to 70% without losing accuracy (MAPE <1% for MRT). ML approaches consistently captured complex spatial, temporal, and extreme thermal patterns more effectively than classical methods, enabling practical, human-centered, climate-responsive urban design.
The two UL studies presented in Table 3 were conducted in Tehran, Iran, using satellite imagery and ground-based climate data, and in Taipei, Taiwan, using meteorological big data from a dense urban area over summer months (2011–2020). PCA was used in Tehran to reduce dimensionality and inter-correlation among surface and meteorological features, while k-means clustering was applied in Taipei to categorize rainfall patterns and assess their effects on AT and PET. Input data included Landsat-derived LST, NDVI, NDWI, land cover, DEM, and in-situ meteorological measurements in Tehran, and hourly temperature, relative humidity, wind speed, precipitation, and cloud cover in Taipei. Outputs comprised a composite comfort index based on principal components calibrated to the DI in Tehran, and AT and PET under varying rainfall scenarios in Taipei. The PCA model in Tehran showed strong predictive performance, with DI higher in the warm season and bare land most uncomfortable, while in Taipei, summer rainfall influenced urban outdoor thermal comfort, improving it in just over one-third of events and worsening it in just under two-thirds.

Table 4.
DL applications in OTC studies.
| Reference | Location/Investigation method | DL Method | Input Parameters | Output Parameters | Main Results |
|---|---|---|---|---|---|
| [143] | Simulation-based study using 2,400 synthetic residential block configurations generated in Grasshopper, with building layouts inspired by Shenzhen planning guidelines (China) | Deep CNNs were tested in 12 model variations with different layer depths and kernel sizes, with the best model using six convolutional layers (3×3 kernels) followed by fully connected layers | Building geometry and meteorological data, including Ta, RH, and wind speed | UTCI | The best model (6-layer CNN, Group B) achieved R2 = 0.960 and MSE = 0.022, significantly outperforming ANNs; spatially invariant convolutional layers enhanced generalization, and hidden-layer visualization revealed how spatial features were extracted for UTCI prediction |
| [141] | Tianjin, China, where field measurements and questionnaire surveys were conducted in four Urban Blue-Green Infrastructure (UBGI) spaces during the winter | MLP with feed-forward back-propagation using hyperbolic tangent activation in the hidden layer and softmax activation in the output layer | Time of day, distance from water, and air temperature at waterfront greenery sites, based on 3,848 samples collected from eight sites on December 19, 2021 | Heat Island Intensity (HII), Coupling Effect Intensity (CEI), and UTCI | The ANN model showed high predictive performance, with relative area under the ROC curve 95.3–99.2% for HII and 72.0–95.9% for CEI; air temperature was the most influential factor for HII and time of day for CEI, supporting the development of a Microclimate Influence model and identifying an optimal thermal comfort range of Ta=9.07-14.75 °C |
| [58] | Xi’an, China, where real-time field measurements, thermal imaging, and questionnaires were conducted in an urban park with 405 children (aged 7–14) participating under three thermal stress levels and three activity intensities | Deep CNN was used for facial expression recognition and combined with RFR to predict children’s TCV | Facial expression images captured via real-time video, individual characteristics (age, gender), environmental parameters (air temperature, globe temperature, relative humidity, wind speed), physical activity levels, and clothing insulation | Children’s TCVs on a 7-point scale (−3=cold to +3=hot), used as ground truth for model prediction and validation | The CNN effectively extracted emotional features from children’s facial expressions, which, when combined with RF, yielded R2 = 0.825 for TCV prediction; the DL model outperformed manual scoring methods and traditional ML classifiers, demonstrating potential for real-time, non-contact outdoor thermal comfort assessment based on facial images |
| [59] | Shiraz, Iran, where a spatiotemporal analysis of the UHI was conducted using 2006–2021 Landsat imagery and urban configuration metrics, with LST predictions across built-up, soil, and vegetation areas | A Deep Neural Network (DNN) with three hidden layers was trained on geospatial features to predict LST, with performance compared against five other ML models, including RF, XGBoost, and KNN | Normalized indices (NDVI, NDBI, NDWI), LST, LULC, elevation, slope, aspect, proximity to roads and water bodies, and climatic parameters (Ta, humidity, and wind speed) | LST | Among six ML models tested, the DNN achieved the highest predictive performance for LST (R2 = 0.94, RMSE = 1.71 °C), accurately capturing spatial LST distributions across urban surfaces, with vegetation and NDVI as the most influential features, supporting DL-based urban heat modeling for climate-resilient planning |
| [138] | Freiburg, Germany, where citywide thermal comfort was modeled using urban sensor network data, high-resolution GIS layers, and ML emulation of numerical climate models over 2018–2022 | A hybrid DL human thermal comfort neural network (HTC-NN) combined two MLPs (each with three hidden layers) for air temperature and relative humidity, a U-Net CNN for MRT, and RF for wind speed estimation | Meteorological parameters (Ta, RH, wind speed, radiation, precipitation), geospatial data (land cover, building and vegetation height), and surface characteristics (SVF, albedo, population density) | UTCI at 1×1 m spatial resolution, derived from ML-predicted Ta, RH, wind speed (U), and MRT fields | HTC-NN achieved UTCI prediction accuracy of RMSE = 3.0 K and R2 = 0.92 against street-level sensor data, outperforming the numerical model |
| [142] | Hong Kong, where in situ microclimatic monitoring and questionnaire surveys were conducted in three urban parks across summer and winter, and neural network models were trained on subjective and objective variables to predict thermal comfort | ANN with two hidden layers, optimized via the Levenberg–Marquardt algorithm, and trained separately for summer (17 input neurons) and winter (14 input neurons) | Microclimatic variables (Ta, MRT, wind speed, RH, solar radiation), physiological variables (clo, MET), psychological inputs (thermal, solar, wind, humidity sensations), perceptions of park features bodies(trees, shade, water ), and personal traits (age, purpose of visit, thermal sensitivity) | Thermal Comfort Evaluation: self-rated comfort score from a field survey on a continuous scale | The optimized ANN with two hidden layers achieved R2 = 0.653 (summer) and R2 = 0.771 (winter) on the validation set; the DL model significantly outperformed PMV and PET models, with inclusion of perception and psychological variables improving prediction accuracy by over 30% |
| [151] | A multi-site analysis using data from 43 previously published OTC studies conducted across diverse climate zones worldwide | ANN models with three hidden layers, trained using backpropagation, were applied to predict TSV based on microclimatic and macroclimatic variables across global datasets | Meteorological parameters (Ta, RH, wind speed, globe temperature), subjective variables (clothing insulation, metabolic rate, gender), microclimatic modifiers (shade, surface material, tree coverage), and macroclimatic classification (climate zone index) | PET | ANN models with three hidden layers successfully predicted PET based on macro- and microclimatic variables across diverse urban settings; analysis showed that macroclimate factors (latitude, altitude, distance from the sea) and microclimate features (albedo, H/W, SVF, LAI) contributed similarly to OTC, with PET in equatorial regions ~13 °C higher than in polar regions during the summer, highlighting the need to integrate microclimate-sensitive design in cities with unfavorable macroclimates |
| [152] | Tehran, Iran, where image-based DL models were developed using ENVI-met simulation data | DL using a conditional GAN (pix2pix) | Urban geometry, greening configuration, and façade materials | UTCI map simulated by ENVI-met and predicted using a cGAN | The cGAN model accurately predicted UTCI maps from urban configuration images with a Structural Similarity Index (SSIM) of 96%, generating results in ~3 seconds compared to 30 minutes for ENVI-met, thus providing a fast and reliable alternative for urban design evaluations |
| [153] | Tallinn, Estonia, where CFD-based thermal and wind simulations were combined with deep generative surrogate modeling | DL using a generative surrogate model | Urban geometry, building shape and orientation, surface material properties, and boundary wind conditions | UTCI and wind comfort maps | A predictive and generative ML model, trained on CFD simulation data, reliably classified and generated outdoor thermal and wind comfort indicators across various configurations, offering a fast and scalable alternative for urban planning and design |
The reviewed studies span diverse geographic and climatic contexts, from high-density Asian cities (Shenzhen, Tianjin, Xi’an, Hong Kong) to European settings (Freiburg, Tallinn) and Middle Eastern climates (Shiraz, Tehran). Methodologically, investigations range from simulation-based analyses using parametric design tools, CFD, and ENVI-met, to field-based approaches incorporating in situ microclimatic monitoring, thermal imaging, and questionnaire surveys. Remote sensing and spatiotemporal analyses of urban heat islands were also employed, notably in Shiraz, while large-scale comparative studies synthesized findings from dozens of prior OTC investigations worldwide. Increasingly, hybrid approaches integrate empirical measurements with machine learning emulation or surrogate modeling, reflecting a methodological shift toward scalable, data-driven frameworks for assessing OTC.
The reviewed studies applied a wide range of DL architectures. Deep CNNs were tested in multiple variations, with the most effective configuration comprising six convolutional layers with 3×3 kernels and fully connected layers. Other approaches included MLPs with back-propagation, hyperbolic tangent hidden activations, and softmax outputs, as well as ANN models with two to three hidden layers optimized via backpropagation or the Levenberg–Marquardt algorithm. Hybrid architectures were also explored, such as an HTC-NN combining dual MLPs, a U-Net CNN, and RF components for multi-variable estimation. In specific applications, deep CNNs were coupled with RFR for children’s thermal comfort prediction, while DNNs with three hidden layers were benchmarked against RF, XGBoost, and KNN for LST forecasting. More advanced generative methods were employed in selected cases, including conditional GANs (pix2pix) and deep generative surrogate modeling, to emulate simulation data and generate synthetic comfort scenarios.
The studies incorporated a diverse range of environmental, physiological, and personal input parameters to capture OTC. Building geometry and meteorological variables such as Ta, RH, and wind speed were commonly used, while some studies extended inputs to include land surface indices (NDVI, NDBI, NDWI), LST, land use/cover, elevation, slope, and proximity to water or roads. Human-centric variables were also considered, including facial expressions, clothing insulation, metabolic rate, age, gender, and thermal sensitivity, often combined with perceptions of microclimatic features such as shade, vegetation, and water bodies. Several investigations integrated urban geometry, façade materials, greening configurations, and boundary wind conditions, reflecting a comprehensive approach to linking environmental context with individual comfort responses across diverse climatic and morphological settings.
The studies reported a variety of output metrics to quantify OTC. UTCI was the most frequently used indicator, often complemented by HII, CEI, or PET. In human-centric assessments, subjective measures such as children’s TCVs on a 7-point scale or self-reported comfort scores from field surveys were employed as ground truth for model validation. Other outputs included high-resolution maps of LST, UTCI, and wind comfort, with several studies leveraging ML or deep generative models (such as cGANs) to predict spatially detailed comfort fields derived from meteorological and urban parameters. These outputs collectively enabled both quantitative evaluation and spatial visualization of urban thermal environments.
The results of the reviewed studies collectively demonstrated that DL and hybrid ML approaches can achieve high predictive accuracy for OTC across diverse urban and climatic contexts. CNN- and DNN-based models consistently outperformed traditional ANNs and standard indices, with R2 values often exceeding 0.9 for both UTCI and LST predictions, while hybrid architectures incorporating RF, MLPs, or U-Net components further enhanced performance for multi-variable estimation. Key drivers of thermal comfort were consistently identified, including Ta, vegetation cover, NDVI, urban geometry, and macroclimatic factors, with perception- and behavior-related variables improving predictive accuracy when integrated. Generative and surrogate modeling approaches, such as cGANs and ML emulators of CFD simulations, enabled rapid, high-fidelity mapping of spatial comfort fields, reducing computational time from tens of minutes to seconds.
Although less widely applied than traditional SL methods, DL approaches have shown strong potential for handling complex, high-dimensional datasets, especially when fine spatial or temporal resolution is required. However, their broader adoption is hindered by the need for large, labeled datasets and limited interpretability—the so-called “black box” issue. To mitigate these challenges, studies have incorporated explainable AI techniques like SHAP [154], to improve model transparency and employed methods such as PCA and K-means clustering to reduce complexity, enhance generalization, and maintain predictive accuracy.
Overall, Table 2 and Table 3, and Table 4 underscore the ability of ML models to deliver high-accuracy predictions of OTC by integrating diverse environmental, physiological, and behavioral inputs. These data-driven approaches mark a methodological leap beyond traditional index-based models, enabling more flexible and nuanced representations of human–environment interactions. When applied to both subjective thermal votes and bioclimatic indices, ML frameworks—especially those enhanced with feature selection, dimensionality reduction, or interpretability tools—exhibit strong generalization across varied climates and urban forms. Collectively, these results highlight the potential of data-driven, scalable frameworks for informing climate-sensitive urban design, enabling both real-time assessment and scenario-based planning while capturing the combined effects of environmental, morphological, and human factors.
The reviewed studies highlight the growing relevance of ML in OTC assessment, particularly for its predictive accuracy and adaptability across diverse urban and climatic contexts. A key advantage of ML lies in its ability to integrate heterogeneous inputs—ranging from meteorological and morphological to physiological and behavioral data—thus addressing the limitations of traditional indices based on steady-state assumptions. Among the techniques reviewed, SL algorithms like RF, SVM, and XGBoost offer an effective balance between accuracy, efficiency, and interpretability, making them well-suited for both research and practical applications in urban design, planning, and real-time monitoring.
Despite notable advancements, several limitations hinder the broader application of ML in OTC research. First, most models are trained on location-specific datasets, limiting their generalizability across different urban morphologies and cultural contexts. Second, the subjective and culturally influenced nature of thermal comfort complicates model calibration and reduces transferability. Third, many existing models are static or semi-dynamic, lacking integration with adaptive behaviors, feedback loops, or real-time environmental interactions—elements essential for responsive, human-centric urban design
4. A Practical Framework for Optimizing Outdoor Thermal Comfort
Optimizing OTC has emerged as a critical decision-making procedure in climate-responsive urban design. In dense urban settings, achieving thermally comfortable outdoor conditions is inherently complex due to the diversity and the nonlinear interplay of multiple variables—including urban geometry, material properties, vegetation cover, wind dynamics, and solar exposure. A systematic approach to decision-making is of crucial importance for designing responsive, efficient and sustainable thermal comfort strategies. The supporting methodologies must be aptly selected and robustly combined to generate realistic and viable solutions that ensure accountability, transparency and integrity, as well as broader acceptance from stakeholders. Any approach that relies exclusively on the cumulative experience, trial-and-error, an intuitive style, empirical concepts or rule-based patterns, is highly likely to lead to controversial solutions with increased uncertainty and difficulty in identifying configurations that meet performance goals. Optimization provides an appropriate framework as well as reliable methods and tools for systematically navigating these high-dimensional design spaces and telling the decision maker which are the best ways to solve the puzzle of OTC. The core of optimization is to maximize or minimize one or more objective functions—quantifiable expressions such as energy use, cost, or thermal comfort—by calculating the optimum values of a defined set of design variables under a bundle of specified technological, economic, environmental, and logical constraints. These objectives may encompass both quantitative goals (e.g., minimizing energy consumption or construction cost) and qualitative targets (e.g., enhancing visual amenity, environmental quality, or thermal comfort) which often are conflicting in nature, resulting to an intriguing tug of war and interesting trade-off expressions [155,156]. A typical multi-objective optimization (mathematical programming) problem can be defined as follows:
where, k is the number of objective functions, n is the number of decision variables, m is the number of constraints, fk(x) is the k-st objective function, x is n-dimensional vector of the decision variables, ck is the vector of coefficients of the objective function, A is the matrix of the technological coefficients, b is the m-dimensional vector of right-hand side parameters and S is is the feasible region.
Multi-objective optimization supports the identification of comprehensive solutions that balance competing targets such as solar access, shading, ventilation, and thermal regulation. Within the OTC domain—where interactions among urban form, materiality, vegetation, and microclimate critically influence human thermal experience—the concept of multi-criteria decision making is not just advantageous but essential. It enables the formulation of design strategies that reconcile competing performance criteria (e.g., maximizing shading while preserving daylight access, or enhancing airflow without increasing discomfort), thereby supporting more adaptive, resilient, and human-centric urban environments [155]. Moreover, as cities confront escalating climate change impacts, the capacity to optimize OTC across seasonal and meteorological variations is increasingly vital for adaptive and resilient urban environments. To address the often-conflicting interactions between environmental drivers, architectural morphology, and human thermal perception, optimization techniques have gained substantial momentum in research and practice [157,158,159]. However, the multi-objective nature of OTC problems can significantly hinder the timely generation of design strategies due to their large computational complexity and time-consuming solution processes. These problems can become prohibitive as the number of conflicting objectives, and the size of datasets increase. One major reason for this large computational burden is the determination of the so-called nadir points when calculating the range of each objective function in order to construct the pay-off table (lexicographic optimization) using the advantageous ε-constraint method [160,161,162,163].
Optimization techniques for OTC can be broadly categorized into two main approaches: SBO and Surrogate Modeling. SBO integrates parametric modeling, dynamic simulation engines, and formal optimization algorithms to systematically investigate complex, high-dimensional design spaces [156,164,165].
. In the context of thermal comfort, SBO facilitates the exploration of urban design alternatives—such as variations in geometry, orientation, vegetation, or materiality—that minimize thermal stress while adhering to contextual and regulatory constraints [157,158]. Widely used tools such as EnergyPlus [166], ENVI-met [37], and Urban Weather Generator (UWG) [167] are often coupled with optimization algorithms like GA [168,169] or PSO [169,170], enabling iterative performance assessments based on objective functions such as UTCI or PET. In contrast to rule-of-thumb or trial-and-error methods, SBO supports multi-objective, multi-variable optimization, revealing trade-offs among key urban design goals such as reducing cooling energy demand, ensuring solar access, and enhancing pedestrian thermal comfort. This data-driven methodology is particularly valuable in dense or climatically challenging urban contexts, where nonlinear interactions between form, climate, and human exposure demand high-fidelity simulations and comprehensive optimization strategies [171,172,173].
In contrast, surrogate modeling—also known as meta-modeling—seeks to replicate the output behavior of computationally intensive simulation or optimization structures through data-driven ML algorithms, including ANNs [107,174], SVMs [107,175,176,177,178], and GPR models [110,179]. These surrogates serve as computationally efficient proxies, emulating the complex input–output relationships of high-fidelity modeling systems and enabling rapid performance evaluations across large, high-dimensional design spaces [156,164,180,181]. Once trained on representative datasets, surrogate models drastically reduce computational demands while preserving acceptable levels of predictive accuracy. This efficiency makes them ideal for supporting advanced tasks such as multi-objective optimization, global sensitivity analysis, and uncertainty quantification—processes that would be otherwise prohibitively time-consuming using direct optimization alone [182].
The surrogate modeling workflow typically involves four sequential steps [180,182]: (i) sampling the design space, often using Latin Hypercube Sampling or Sobol sequences [180,182]; (ii) generating simulation data through high-fidelity models [177,180]; (iii) training a predictive ML model [64,178]; and (iv) validating accuracy using metrics such as RMSE or MAE [179,183].
Among ML algorithms, ANNs are widely favored for capturing complex nonlinear dependencies [107,174]; SVMs offer robust generalization when data are limited [107,175,176]; and more advanced architectures—such as CNNs [107,109] and LSTM networks [107,110,184] —are increasingly employed for spatial and temporal modeling at urban scales. Recent OTC research shows a growing trend toward hybrid workflows that combine simulation-based optimization with ML surrogates. These integrated approaches effectively balance modeling fidelity and computational efficiency, particularly in contexts where urban morphology, vegetation, materials, and climatic variables interact in nonlinear and dynamic ways. As such, surrogate modeling emerges as a cornerstone of next-generation, performance-driven urban design workflows that center on thermal comfort without sacrificing scalability or speed [136,157,185].
Building on these foundations, Table 5 synthesizes recent real-world applications of optimization in OTC. The cases span diverse climates and design challenges, each defined by its design variables, tools, algorithms, and objective functions. Most studies employ SBO with evolutionary algorithms to navigate the interactions among form, materiality, vegetation, and microclimate. However, ML integration remains limited. Only three studies— [136,185,186]—use surrogate models, and just one [186] combines them with multi-objective optimization. This underutilization signals a significant opportunity: the full capabilities of ML—particularly for accelerating simulations, handling high-dimensional inputs, and modeling spatiotemporal dynamics—remain largely untapped in OTC optimization.
The key insights from the case studies presented in Table 5 could be synthesized as follows:
- From geometric tuning to high-dimensional optimization: Early studies focused on adjusting geometric variables (e.g., building height, spacing, orientation) to reduce PET or UTCI [172,173,190]. More recent works [194,195,196] adopt multi-parametric optimization strategies incorporating energy efficiency, daylight, and visual comfort—marking a shift toward data-driven, performance-oriented design.
- b. Hybrid and surrogate-based methodologies as emerging standards: Studies [136,185,186] showcase hybrid workflows combining surrogate models (e.g., ANN) with formal optimizers (e.g., GA, NSGA-II). Study [186] reported 89.9% accuracy across 150 configurations, demonstrating significant speed and accuracy benefits.
- d. Beyond thermal comfort and toward a multi-criteria urban performance: Many studies now include daylight access, SVF, wind protection, and energy demand as co-objectives [171,194,196]. For instance, study [196] simultaneously optimized PET and heating/cooling loads to balance comfort and energy use. (e) Sensitivity to climatic and socio-spatial contexts: Design objectives vary by climate: Guangzhou [188] emphasized shading and vegetation; Sydney [196] balanced summer cooling and winter sunlight; Shenyang and Beijing [186,191] prioritized solar gain and wind protection. Study [189] tailored optimization to user groups (e.g., hospital patients vs. healthy users), underscoring the need for inclusive design.
- e. Demonstrated performance gains and implementation potential: Comfort gains ranged from 2 °C to 6 °C in PET or UTCI—improvements with tangible public health and livability implications. Tools like Grasshopper [198], Ladybug [199], and Galapagos [200] enable integration into design workflows, even at early planning stages [194,197], enhancing regulatory and participatory potential.
- f. The reviewed literature demonstrates that optimization applications have matured from simple geometric manipulations into a robust, multi-objective and multi-scalar design approaches. Although SBO is currently dominant, ML-assisted methods—particularly surrogate modeling—hold considerable promise for future development. As urban areas grapple with climatic stressors, the convergence of optimization algorithms, parametric design tools, and data-driven surrogates offers a scalable and effective pathway toward thermally comfortable, climate-resilient urban environments.
Based on this body of evidence, a practical framework for optimizing outdoor thermal comfort can be articulated as a sequence of six interdependent stages that collectively link climate diagnosis, performance modeling, and design decision-making. First, the process begins with a systematic assessment of local climatic conditions, thermal exposure patterns, and user characteristics, which together inform the selection of appropriate thermal comfort indices and the definition of optimization objectives. Second, this diagnostic stage guides the parametric formulation of the urban design space, encompassing geometric configuration, material properties, vegetation characteristics, and spatial organization. Third, high-fidelity simulation tools are employed to generate performance datasets that capture the nonlinear interactions between urban form, microclimate, and human thermal exposure. Fourth, machine learning and surrogate modeling techniques are introduced to approximate simulation outputs, substantially reducing computational demands while enabling sensitivity analysis and uncertainty quantification. Fifth, multi-objective optimization algorithms are applied to systematically explore trade-offs among thermal comfort, daylight access, energy demand, and other competing constraints, yielding Pareto-optimal design solutions. Finally, these solution sets are translated into decision-support information, facilitating context-sensitive, scalable, and implementation-ready urban design strategies.
Across scales and contexts, the most impactful frameworks balance thermal comfort with co-constraints such as daylight availability, energy use, and social inclusion. In this way, optimization-driven workflows do not merely target thermal indices but provide a transparent, computationally efficient, and reproducible pathway for climate-responsive urban design.
5. Discussion and Conclusions
This review paper aimed to (1) synthesize ML methodologies used in OTC research, across learning paradigms, (2) explore the integration of ML with SBO, surrogate modeling, and scenario-based design strategies, and (3) propose a roadmap for scalable, intelligent, and thermally adaptive urban design informed by ML capabilities. Furthermore, this review aimed to propose a practical framework for OTC optimization, offering guidance on selecting appropriate indices, algorithms, and design parameters to support computationally efficient and implementation-ready OTC interventions across different urban and climatic contexts.
The reviewed literature spanned a broad geographic range—including urban contexts across Europe, Asia, and the Middle East—and encompasses diverse climatic zones such as Mediterranean, humid subtropical, arid, and tropical rainforest environments. While the majority of investigations rely on SL and DL techniques—often trained on labeled datasets such as thermal sensation votes or bioclimatic indices—several studies also incorporate unsupervised approaches, including clustering methods and PCA, to identify latent structures in thermal comfort data. Despite variability in data sources (e.g., in situ microclimatic monitoring, wearable physiological sensors, remote sensing), modeling strategies, and target variables (e.g., UTCI, PET, or subjective thermal responses), the collective findings emphasize the versatility and predictive strength of ML-based frameworks in modeling the complex, nonlinear dynamics that characterize outdoor thermal environments.
Among the reviewed studies, SL was by far the most commonly applied approach (28 applications), reflecting the widespread availability of labeled data such as TSV, PET, UTCI, and DI, which are well-suited for regression and classification tasks using models like RF, XGBoost, SVM, and ANN. DL was the second most frequent approach, with nine studies, as recent research has leveraged larger and higher-resolution datasets—including satellite imagery, high-frequency meteorological measurements, and crowdsourced sensor data—where the feature extraction and nonlinear modeling capabilities of MLPs, CNNs, and LSTMs provide clear advantages. In contrast, UL was rarely applied, with only two identified studies, primarily for clustering rainfall events or urban microclimate typologies; this reflects the field’s predominant focus on predicting target variables rather than exploring latent structures in the data. The disparity in application frequency among these paradigms is therefore reasonable, yet it also highlights a potential opportunity for more exploratory and pattern-discovery studies using unsupervised or hybrid methods to uncover hidden drivers of outdoor thermal comfort. Notably, none of the reviewed studies have explored RL or SSL, despite their success in related domains such as indoor environmental control [126,127]. RL, with its ability to learn optimal actions through environmental feedback, could support adaptive outdoor systems like dynamic shading or misting. SSL, by leveraging both labeled and unlabeled data, offers a solution to the limited availability of subjective comfort datasets. Coupling RL and SSL with wearable sensors, mobile data streams, and edge computing could enable intelligent, scalable, and personalized OTC management strategies in real time.
The reviewed optimization studies show that outdoor thermal comfort (OTC) optimization has advanced from simple geometric adjustments to sophisticated, multi-objective, and multi-scalar approaches that integrate thermal, energy, daylight, and social dimensions. Hybrid and surrogate-based methods are emerging as standards, offering high accuracy and reduced computational cost, while performance gains of 2–6 °C in PET/UTCI demonstrate tangible health and livability benefits. Effective frameworks are site-specific, adaptive to climatic and socio-spatial contexts, and increasingly supported by accessible parametric tools, making optimization a practical and scalable pathway toward climate-resilient urban design.
ML has emerged as a transformative tool for OTC assessment, capable of addressing the nonlinearities, contextual dependencies, and data complexities that limit conventional empirical and simulation approaches. A synthesis of evidence from the literature has demonstrated that SL, UL, and DL methods provide robust predictions for both comfort indices and subjective responses, while enabling applications such as city-scale mapping and fine-grained spatiotemporal modeling. In parallel, optimization methodologies are increasingly integrated with ML to translate predictive insights into design solutions. SBO offers direct integration with detailed microclimate simulations, while surrogate modeling replaces high-fidelity solvers with approximate models to drastically reduce computational demand. When combined with traditional or ML-based prediction and estimation techniques, both SBO and surrogate modeling enable efficient exploration of multi-objective design spaces, supporting trade-offs between thermal comfort, energy use, daylight, and other performance metrics. Reviewed applications have confirmed that these approaches can deliver tangible improvements in outdoor comfort and broaden the range of feasible interventions.
In conclusion, ML-based approaches for OTC modeling offer a flexible, accurate, and adaptable alternative to traditional methods. Future research should address three critical frontiers. First, improving the transferability of ML models across diverse urban morphologies and climates remains essential to achieving generalizable solutions. Second, greater exploration of advanced paradigms—such as semi-supervised learning, reinforcement learning, and physics-informed models—could enhance adaptability, reduce data requirements, and embed physical realism. Third, integrating ML and optimization within real-time sensing systems, digital twins, and participatory planning platforms offers a pathway to actionable, citizen-centered interventions. Future research should also focus on integrating multimodal data—including meteorological, morphological, physiological, and behavioral inputs—while advancing interpretable and scalable model architectures. Embracing adaptive learning frameworks that address uncertainty, individual variability, and dynamic feedback will be critical for translating research into practical, user-centered comfort optimization tools for complex urban environments.
By consolidating methodological advances and outlining a practice-oriented optimization framework, this work establishes the basis for a roadmap guiding the next generation of OTC research. Future directions should prioritize the integration of ML for predictive accuracy with SBO and surrogate modeling for computational efficiency, enabling context-sensitive, multi-objective, and scalable solutions. Such convergence can shift OTC assessment from a primarily diagnostic exercise to a proactive design instrument, advancing resilient, human-centered, and sustainable urban environments.
Abbreviations
| ANN | Artificial Neural Network |
| AR | Aspect Ratio |
| ASHRAE | American Society of Heating, Refrigerating and Air-conditioning Engineers |
| BMI | Body Mass Index |
| BPNN | Backpropagation Neural Network |
| CatBoost | Categorical Boosting |
| CEI | Coupling Effect Intensity |
| CNN | Convolutional Neural Network |
| DI | Discomfort Index |
| DL | Deep Learning |
| DNN | Deep Neural Network |
| DT | Decision Tree |
| DTR | Decision Tree Regression |
| ELM | Extreme Learning Machine |
| FFNN | Feedforward Neural Network |
| GA | Genetic Algorithm |
| GAN | Generative Adversarial Network |
| GBM | Gradient Boosting Machine |
| GBT | Gradient Boosting Trees |
| GP | Genetic Programming |
| GVI | Green View Index |
| HII | Heat Island Intensity |
| KNN | K-Nearest Neighbors |
| LDA | Linear Discriminant Analysis |
| LightGBM | Light Gradient Boosting Machine |
| LR | Linear Regression |
| LST | Land Surface Temperature |
| LULC | Land Use/Land Cover |
| MAE | Mean Absolute Error |
| MAPE | Mean Absolute Percentage Error |
| MET | Metabolic Rate (in Metabolic Equivalents of Task) |
| ML | Machine Learning |
| MLP | Multiple Layer Perception |
| MLR | Multiple Linear Regression |
| MOGA | Multi-Objective Genetic Algorithm |
| MOO | Multi-Objective Optimization |
| mPET | Modified Physiological Equivalent Temperature |
| MRT | Mean Radiant Temperature |
| NB | Naive Bayes |
| NBI | New Built-up Index |
| NDBI | Normalized Difference Built-up Index |
| NDVI | Normalized Difference Vegetation Index |
| NDWI | Normalized Difference Water Index |
| NET | Net Effective Temperature |
| OTC | Outdoor Thermal Comfort |
| PCA | Principal Component Analysis |
| PET | Physiological Equivalent Temperature |
| PMV | Predicted Mean Vote |
| RF | Random Forest |
| RFR | Random Forest Regressor |
| RH | Relative Humidity |
| RL | Reinforcement Learning |
| RMSE | Root Mean Square Error |
| ROC | Receiver Operating Characteristic |
| SBO | Simulation Based Optimization |
| SSL | Semi-supervised Learning |
| SHAP | Shapley Additive Explanations |
| SL | Supervised Learning |
| SVF | Sky View Factor |
| SVM | Support Vector Machine |
| TA | Thermal Acceptability |
| Ta | Air Temperature |
| TAV | Thermal Acceptance Vote |
| TC | Thermal Comfort |
| TCV | Thermal Comfort Vote |
| TD | Thermal Discomfort |
| THI | Temperature-Humidity Index |
| TSV | Thermal Sensation Vote |
| UHI | Urban Heat Island |
| UL | Unsupervised Learning |
| UTCΙ | Universal Thermal Climate Index |
| UTFVI | Urban Thermal Field Variance Index |
| UWG | Urban Weather Generator |
| WWR | Window-to-Wall Ratio |
| XGBoost | Extreme Gradient Boosting |
References
- Kong D, Gu X, Li J, Ren G, Liu J. Contributions of Global Warming and Urbanization to the Intensification of Human-Perceived Heatwaves Over China. J Geophys Res Atmos 2020;125:e2019JD032175. [CrossRef]
- Guo Y, Ren Z, Dong Y, Hu N, Wang C, Zhang P, et al. Strengthening of surface urban heat island effect driven primarily by urban size under rapid urbanization: national evidence from China. GIScience Remote Sens 2022;59:2127–43. [CrossRef]
- Oke TR. Boundary Layer Climates. Routledge; 1987. [CrossRef]
- ASHRAE. Standard 55 – Thermal Environmental Conditions for Human Occupancy. Am Soc Heating, Refrig Air-Conditioning Eng 2020. https://www.ashrae.org/technical-resources/bookstore/standard-55-thermal-environmental-conditions-for-human-occupancy (accessed September 16, 2025).
- Lin Y, Huang T, Yang W, Hu X, Li C. A Review on the Impact of Outdoor Environment on Indoor Thermal Environment. Build 2023, Vol 13, Page 2600 2023;13:2600. [CrossRef]
- Liu T, Wang Y, Zhang L, Xu N, Tang F. Outdoor Thermal Comfort Research and Its Implications for Landscape Architecture: A Systematic Review. Sustain 2025;17:2330. [CrossRef]
- Requena-Ruiz I, Siret D, Stavropulos-Laffaille X, Leduc T. Designing thermally sensitive public spaces: an analysis through urban design media. J Urban Des 2023;28:44–65. [CrossRef]
- Founda D. Urban Thermal Risk. Atmos 2021, Vol 12, Page 466 2021;12:466. [CrossRef]
- Cohen P, Potchter O, Matzarakis A. Human thermal perception of Coastal Mediterranean outdoor urban environments. Appl Geogr 2013;37:1–10. [CrossRef]
- Perivoliotis D, Arvanitis I, Tzavali A, Papakostas V, Kappou S, Andreakos G, et al. Sustainable Urban Environment through Green Roofs: A Literature Review with Case Studies. Sustain 2023, Vol 15, Page 15976 2023;15:15976. [CrossRef]
- Huang X, Yao R, Halios CH, Kumar P, Li B. Integrating green infrastructure, design scenarios, and social-ecological-technological systems for thermal resilience and adaptation: Mechanisms and approaches. Renew Sustain Energy Rev 2025;212:115422. [CrossRef]
- Morales RD, Audenaert A, Verbeke S. Thermal comfort and indoor overheating risks of urban building stock - A review of modelling methods and future climate challenges. Build Environ 2025;269:112363. [CrossRef]
- Demuzere M, Orru K, Heidrich O, Olazabal E, Geneletti D, Orru H, et al. Mitigating and adapting to climate change: Multi-functional and multi-scale assessment of green urban infrastructure. J Environ Manage 2014;146:107–15. [CrossRef]
- Kumar P, Debele SE, Khalili S, Halios CH, Sahani J, Aghamohammadi N, et al. Urban heat mitigation by green and blue infrastructure: Drivers, effectiveness, and future needs. Innov 2024;5:100588. [CrossRef]
- Qin H, Cheng X, Han G, Wang Y, Deng J, Yang Y. How thermal conditions affect the spatial-temporal distribution of visitors in urban parks: A case study in Chongqing, China. Urban For Urban Green 2021;66:127393. [CrossRef]
- Li X, Li X, Tang N, Chen S, Deng Y, Gan D. Summer Outdoor Thermal Perception for the Elderly in a Comprehensive Park of Changsha, China. Atmos 2022, Vol 13, Page 1853 2022;13:1853. [CrossRef]
- Alexandri E, Jones P. Temperature decreases in an urban canyon due to green walls and green roofs in diverse climates. Build Environ 2008;43:480–93. [CrossRef]
- Johansson E, Emmanuel R. The influence of urban design on outdoor thermal comfort in the hot, humid city of Colombo, Sri Lanka. Int J Biometeorol 2006;51:119–33. [CrossRef]
- Ali-Toudert F, Mayer H. Effects of asymmetry, galleries, overhanging façades and vegetation on thermal comfort in urban street canyons. Sol Energy 2007;81:742–54. [CrossRef]
- Andreou E. Thermal comfort in outdoor spaces and urban canyon microclimate. Renew Energy 2013;55:182–8. [CrossRef]
- Fanger PO. Thermal Comfort Analysis and Applications in Environmental Engineering. McGraw-Hill Book Company; 1972.
- Mihalakakou G, Souliotis M, Papadaki M, Menounou P, Dimopoulos P, Kolokotsa D, et al. Green roofs as a nature-based solution for improving urban sustainability: Progress and perspectives. Renew Sustain Energy Rev 2023;180:113306. [CrossRef]
- Kappou S, Souliotis M, Papaefthimiou S, Panaras G, Paravantis JA, Michalena E, et al. Cool Pavements: State of the Art and New Technologies. Sustain 2022, Vol 14, Page 5159 2022;14:5159. [CrossRef]
- Oke TR, Mills G, Christen A, Voogt JA. Urban Climates. Urban Clim 2017:1–525. [CrossRef]
- Oke TR. Street design and urban canopy layer climate. Energy Build 1988;11:103–13. [CrossRef]
- Ali-Toudert F. Exploration of the thermal behaviour and energy balance of urban canyons in relation to their geometrical and constructive properties. Build Environ 2021;188:107466. [CrossRef]
- Bowler DE, Buyung-Ali L, Knight TM, Pullin AS. Urban greening to cool towns and cities: A systematic review of the empirical evidence. Landsc Urban Plan 2010;97:147–55. [CrossRef]
- Gaitani N, Mihalakakou G, Santamouris M. On the use of bioclimatic architecture principles in order to improve thermal comfort conditions in outdoor spaces. Build Environ 2007;42:317–24. [CrossRef]
- Givoni B. Man, Climate & Architecture. 2nd Edition. Applied Science Publishers, Ltd., London; 1976.
- Erell E, Pearlmutter D, Williamson T. Urban microclimate : designing the spaces between buildings. Earthscan from Routledge; 2015.
- Höppe P. The physiological equivalent temperature - A universal index for the biometeorological assessment of the thermal environment. Int J Biometeorol 1999;43:71–5. [CrossRef]
- Jendritzky G, de Dear R, Havenith G. UTCI-Why another thermal index? Int J Biometeorol 2012;56:421–8. [CrossRef]
- Gagge A, Fobelets A, Berglund L. A standard predictive index of human response to the thermal environment. Ashrae Trans 1986.
- Ole Fanger P, Toftum J. Extension of the PMV model to non-air-conditioned buildings in warm climates. Energy Build 2002;34:533–6. [CrossRef]
- Meng F, Qin M, Gao Z, Wang H, Xu X, Xu F. A review of RayMan in thermal comfort simulation: Development, applications and prospects. Build Environ 2025;270:112547. [CrossRef]
- Johansson E, Thorsson S, Emmanuel R, Krüger E. Instruments and methods in outdoor thermal comfort studies – The need for standardization. Urban Clim 2014;10:346–66. [CrossRef]
- Bruse M, Fleer H. Simulating surface–plant–air interactions inside urban environments with a three dimensional numerical model. Environ Model Softw 1998;13:373–84. [CrossRef]
- Matzarakis A, Rutz F, Mayer H. Modelling radiation fluxes in simple and complex environments: Basics of the RayMan model. Int J Biometeorol 2010;54:131–9. [CrossRef]
- Toparlar Y, Blocken B, Maiheu B, van Heijst GJF. A review on the CFD analysis of urban microclimate. Renew Sustain Energy Rev 2017;80:1613–40. [CrossRef]
- Nikolopoulou M, Lykoudis S. Thermal comfort in outdoor urban spaces: Analysis across different European countries. Build Environ 2006;41:1455–70. [CrossRef]
- Luo T, Chen M. Advancements in supervised machine learning for outdoor thermal comfort: A comprehensive systematic review of scales, applications, and data types. Energy Build 2025;329:115255. [CrossRef]
- Feng Y, Liu S, Wang J, Yang J, Jao YL, Wang N. Data-driven personal thermal comfort prediction: A literature review. Renew Sustain Energy Rev 2022;161:112357. [CrossRef]
- Qavidel Fard Z, Zomorodian ZS, Korsavi SS. Application of machine learning in thermal comfort studies: A review of methods, performance and challenges. Energy Build 2022;256:111771. [CrossRef]
- Ding X, Zhao Y, Fan Y, Li Y, Ge J. Machine learning-assisted mapping of city-scale air temperature: Using sparse meteorological data for urban climate modeling and adaptation. Build Environ 2023;234:110211. [CrossRef]
- Chen G, Hua J, Shi Y, Ren C. Constructing air temperature and relative humidity-based hourly thermal comfort dataset for a high-density city using machine learning. Urban Clim 2023;47:101400. [CrossRef]
- Guo R, Yang B, Guo Y, Li H, Li Z, Zhou B, et al. Machine learning-based prediction of outdoor thermal comfort: Combining Bayesian optimization and the SHAP model. Build Environ 2024;254:111301. [CrossRef]
- Jeong J, Jeong J, Lee M, Lee J, Chang S. Data-driven approach to develop prediction model for outdoor thermal comfort using optimized tree-type algorithms. Build Environ 2022;226:109663. [CrossRef]
- Pantavou K, Delibasis KK, Nikolopoulos GK. Machine learning and features for the prediction of thermal sensation and comfort using data from field surveys in Cyprus. Int J Biometeorol 2022;66:1973–84. [CrossRef]
- Liu X, Gou Z, Yuan C. Application of human-centric digital twins: Predicting outdoor thermal comfort distribution in Singapore using multi-source data and machine learning. Urban Clim 2024;58:102210. [CrossRef]
- Mitchell TM. Machine learning. vol. 9. McGraw-Hill Science/Engineering/Math; (March 1, 1997); 1999.
- Alpaydin E. Introduction to Machine Learning in Adaptive Computation and Machine Learning series. Massachusetts Inst Technol 2020:1–712.
- Bishop CM. Pattern recognition and machine learning. Springer New York, NY; 2006.
- Goodfellow I, Courville A, Bengio Y. Deep Learning. The MIT Press; 2016.
- Zhu X, Goldberg AB. Introduction to Semi-Supervised Learning 2009. [CrossRef]
- Sutton RS., Barto AG. Reinforcement learning : an introduction. The MIT Press; 2018.
- James G, Witten D, Hastie T, Tibshirani R. An Introduction to Statistical Learning. New York, NY: Springer US; 2021. [CrossRef]
- Acero JA, Koh EJK, Pignatta G, Norford LK. Clustering weather types for urban outdoor thermal comfort evaluation in a tropical area. Theor Appl Climatol 2020;139:659–75. [CrossRef]
- Li Y, Nian X, Gu C, Deng P, He S, Hong B. Assessing children’s outdoor thermal comfort with facial expression recognition: An efficient approach using machine learning. Build Environ 2024;258:111556. [CrossRef]
- Tanoori G, Soltani A, Modiri A. Machine Learning for Urban Heat Island (UHI) Analysis: Predicting Land Surface Temperature (LST) in Urban Environments. Urban Clim 2024;55:101962. [CrossRef]
- Geron A. Hands-On Machine Learning with Scikit-Learn, Keras, and TensorFlow, 2nd Edition [Book], O’Reilly Media, Inc.; 2019.
- Weisberg S. Applied Linear Regression: Third Edition. Appl Linear Regres Third Ed 2005:1–310. [CrossRef]
- Gilmour SG. The interpretation of Mallows’s Cp-statistic. J R Stat Soc Ser D Stat 1996;45:49–56. [CrossRef]
- Burnham KP, Anderson DR. Multimodel Inference. Sociol Methods Res 2004;33:261–304. [CrossRef]
- Cortes C, Vapnik V. Support-Vector Networks. Mach Learn 1995;20:273–97. [CrossRef]
- Wang J, Li Q, Zhu G, Kong W, Peng H, Wei M. Recognition and prediction of elderly thermal sensation based on outdoor facial skin temperature. Build Environ 2024;253:111326. [CrossRef]
- Cheng CY, Lin TP. Decision tree analysis of thermal comfort in the courtyard of a senior residence in hot and humid climate. Sustain Cities Soc 2024;101:105165. [CrossRef]
- Schölkopf B, Smola AJ. Learning with Kernels: Support Vector Machines, Regularization, Optimization, and Beyond. Proc 2002 Int Conf Mach Learn Cybern 2001;1. [CrossRef]
- Drucker· H, Burges CJC, Kaufman L, Smola·· A, Vapoik V. Support Vector Regression Machines. Adv Neural Inf Process Syst 1997:155–61.
- Diz-Mellado E, Rubino S, Fernández-García S, Gómez-Mármol M, Rivera-Gómez C, Galán-Marín C. Applied Machine Learning Algorithms for Courtyards Thermal Patterns Accurate Prediction. Math 2021, Vol 9, Page 1142 2021;9:1142. [CrossRef]
- Friedman JH. Greedy function approximation: A gradient boosting machine. Ann Stat 2001;29:1189–232. [CrossRef]
- Natekin A, Knoll A. Gradient boosting machines, a tutorial. Front Neurorobot 2013;7:63623. [CrossRef]
- Avci AB, Balci GA, Basaran T. Exercise and resting periods: Thermal comfort dynamics in gym environments. Build Simul 2024;17:1557–78. [CrossRef]
- Breiman L. Random forests. Mach Learn 2001;45:5–32. [CrossRef]
- Nguyen C, Wang Y, Nguyen HN. Random forest classifier combined with feature selection for breast cancer diagnosis and prognostic. J Biomed Sci Eng 2013;6:551–60. [CrossRef]
- Hastie T, Tibshirani R, Friedman J. The Elements of Statistical Learning 2009. [CrossRef]
- Zhou ZH. Ensemble methods: Foundations and algorithms. CRC Press; 2012. [CrossRef]
- Mohite S, Surawar M. Assessment and prediction of pedestrian thermal comfort through machine learning modelling in tropical urban climate of Nagpur City. Theor Appl Climatol 2024;155:5607–28. [CrossRef]
- Fox EW, Ver Hoef JM, Olsen AR. Comparing spatial regression to random forests for large environmental data sets. PLoS One 2020;15:e0229509. [CrossRef]
- Jing W, Liu J, Qin Z, Mu T, Ge Z, Dong Y. Evaluating and enhancing the applicability of thermal comfort indices in diverse outdoor environments using Bayesian and random forest regression. Energy Build 2024;324:114858. [CrossRef]
- Hornik K, Stinchcombe M, White H. Multilayer feedforward networks are universal approximators. Neural Networks 1989;2:359–66. [CrossRef]
- Haykin S. Neural Networks and Learning Machines. Third Edition, Pearson Education, Inc. 2009.
- Chakraborty K, Mehrotra K, Mohan CK, Ranka S. Forecasting the Behavior of Multivariate Time Series Using Neural Networks. Neural Networks 1992;5:961–70. [CrossRef]
- Rumelhart DE, Hinton GE, Williams RJ. Learning representations by back-propagating errors. Nat 1986 3236088 1986;323:533–6. [CrossRef]
- Xi T, Wang M, Cao E, Li J, Wang Y, Sa’ad SU. Preliminary Research on Outdoor Thermal Comfort Evaluation in Severe Cold Regions by Machine Learning. Build 2024, Vol 14, Page 284 2024;14:284. [CrossRef]
- Shah R, Pandit RK, Gaur MK. Urban physics and outdoor thermal comfort for sustainable street canyons using ANN models for composite climate. Alexandria Eng J 2022;61:10871–96. [CrossRef]
- Jović S, Arsić N, Vilimonović J, Petković D. Thermal sensation prediction by soft computing methodology. J Therm Biol 2016;62:106–8. [CrossRef]
- Huang G Bin, Zhu QY, Siew CK. Extreme learning machine: Theory and applications. Neurocomputing 2006;70:489–501. [CrossRef]
- Breiman L, Friedman JH, Olshen RA, Stone CJ. Classification and regression trees. Classif Regres Trees 2017:1–358. [CrossRef]
- Cover TM, Hart PE. Nearest Neighbor Pattern Classification. IEEE Trans Inf Theory 1967;13:21–7. [CrossRef]
- Zhang Harry. The Optimality of Naive Bayes 2004.
- Aggarwal CC, Reddy CK. Data Clustering: Algorithms and Applications. Chapman and Hall/CRC; 2014. [CrossRef]
- Murphy KP. Machine learning : a probabilistic perspective 2012:1067.
- Jain AK. Data clustering: 50 years beyond K-means. Pattern Recognit Lett 2010;31:651–66. [CrossRef]
- Maaten L van der, Hinton G. Visualizing Data using t-SNE. J Mach Learn Res 2008;9:2579–605.
- Jollife IT, Cadima J. Principal component analysis: A review and recent developments. Philos Trans R Soc A Math Phys Eng Sci 2016;374. [CrossRef]
- Miller C, Nagy Z, Schlueter A. A review of unsupervised statistical learning and visual analytics techniques applied to performance analysis of non-residential buildings. Renew Sustain Energy Rev 2018;81:1365–77. [CrossRef]
- Johnson SC. Hierarchical Clustering Schemes. Psychometrika 1967;32:241–54. [CrossRef]
- Mijani N, Alavipanah SK, Firozjaei MK, Arsanjani JJ, Hamzeh S, Weng Q. Modeling outdoor thermal comfort using satellite imagery: A principle component analysis-based approach. Ecol Indic 2020;117:106555. [CrossRef]
- Kurihana T, Mastilovic I, Wang L, Meray A, Praveen S, Xu Z, et al. Identifying Climate Patterns Using Clustering Autoencoder Techniques. Artif Intell Earth Syst 2024;3. [CrossRef]
- Chapelle O, Schölkopf B, Zien A. Semi-supervised learning. MIT Press; 2010.
- Yarowsky D. Unsupervised Word Sense Disambiguation Rivaling Supervised Methods. Proc Annu Meet Assoc Comput Linguist 1995;1995-June:189–96. [CrossRef]
- Blum A, Mitchell T. Combining labeled and unlabeled data with co-training. Proc Annu ACM Conf Comput Learn Theory 1998:92–100. [CrossRef]
- Zhou D, Bousquet O, Lal TN, Weston J, Schölkopf B. Learning with Local and Global Consistency. Proc. 17th Int. Conf. Adv. Neural Inf. Process. Syst., vol. 16, 2003.
- Sajjadi M, Javanmardi M, Tasdizen T. Regularization With Stochastic Transformations and Perturbations for Deep Semi-Supervised Learning. Proc 30th Int Conf Adv Neural Inf Process Syst 2016;29. [CrossRef]
- Kingma DP, Rezende DJ, Mohamed S, Welling M. Semi-supervised Learning with Deep Generative Models. NIPS’14 Proc 28th Int Conf Adv Neural Inf Process Syst 2014;2.
- Lecun Y, Bengio Y, Hinton G. Deep learning. Nature 2015;521:436–44. [CrossRef]
- Paravantis JA, Malefaki S, Nikolakopoulos P, Romeos A, Giannadakis A, Giannakopoulos E, et al. Statistical and machine learning approaches for energy efficient buildings. Energy Build 2025;330:115309. [CrossRef]
- Lecun Y, Bottou L, Bengio Y, Haffner P. Gradient-based learning applied to document recognition. Proc IEEE 1998;86:2278–324. [CrossRef]
- Fukushima K. Neocognitron: A hierarchical neural network capable of visual pattern recognition. Neural Networks 1988;1:119–30. [CrossRef]
- Alom MZ, Taha TM, Yakopcic C, Westberg S, Sidike P, Nasrin MS, et al. A State-of-the-Art Survey on Deep Learning Theory and Architectures. Electron 2019, Vol 8, Page 292 2019;8:292. [CrossRef]
- Elman JL. Finding Structure in Time. Cogn Sci 1990;14:179–211. [CrossRef]
- Jordan MI. Serial Order: A Parallel Distributed Processing Approach. Adv Psychol 1997;121:471–95. [CrossRef]
- Hochreiter S, Schmidhuber J. Long Short-Term Memory. Neural Comput 1997;9:1735–80. [CrossRef]
- Chung J, Gulcehre C, Cho K, Bengio Y. Empirical Evaluation of Gated Recurrent Neural Networks on Sequence Modeling. Neural Evol Comput 2014. [CrossRef]
- Hinton GE. Training Products of Experts by Minimizing Contrastive Divergence. Neural Comput 2002;14:1771–800. [CrossRef]
- Bengio Y. Learning Deep Architectures for AI. Found Trends® Mach Learn 2009;2:1–127. [CrossRef]
- Hinton GE, Osindero S, Teh YW. A Fast Learning Algorithm for Deep Belief Nets. Neural Comput 2006;18:1527–54. [CrossRef]
- Creswell A, White T, Dumoulin V, Arulkumaran K, Sengupta B, Bharath AA. Generative Adversarial Networks: An Overview. IEEE Signal Process Mag 2018;35:53–65. [CrossRef]
- Mnih V, Kavukcuoglu K, Silver D, Rusu AA, Veness J, Bellemare MG, et al. Human-level control through deep reinforcement learning. Nature 2015;518:529–33. [CrossRef]
- Han D, Mulyana B, Stankovic V, Cheng S. A Survey on Deep Reinforcement Learning Algorithms for Robotic Manipulation. Sensors 2023, Vol 23, Page 3762 2023;23:3762. [CrossRef]
- Vázquez-Canteli JR, Nagy Z. Reinforcement learning for demand response: A review of algorithms and modeling techniques. Appl Energy 2019;235:1072–89. [CrossRef]
- Wang Z, Hong T. Reinforcement learning for building controls: The opportunities and challenges. Appl Energy 2020;269:115036. [CrossRef]
- Azuatalam D, Lee WL, de Nijs F, Liebman A. Reinforcement learning for whole-building HVAC control and demand response. Energy AI 2020;2:100020. [CrossRef]
- Chen Y, Norford LK, Samuelson HW, Malkawi A. Optimal control of HVAC and window systems for natural ventilation through reinforcement learning. Energy Build 2018;169:195–205. [CrossRef]
- Bertsekas DP, Tsitsiklis JN. Neuro-Dynamic Programming. Athena Scientific, Belmont, Massachusetts; 1996. [CrossRef]
- Li Z, Tian J, Ji G, Cheng T, Loftness V, Han X. Reinforcement Learning-Enabled Adaptive Control for Climate-Responsive Kinetic Building Facades. Build 2025, Vol 15, Page 2977 2025;15:2977. [CrossRef]
- Zeng T, Ma X, Luo Y, Yin J, Ji Y, Lu S. Improving outdoor thermal environmental quality through kinetic canopy empowered by machine learning and control algorithms. Build Simul 2025;18:699–720. [CrossRef]
- Ji Y, Wang J, Xu J, Fang X, Zhang H. Real-Time Energy Management of a Microgrid Using Deep Reinforcement Learning. Energies 2019, Vol 12, Page 2291 2019;12:2291. [CrossRef]
- Waseem M, Fahad S, Goudarzi A, Muqeet HA, Guo G, Gong Y. Multi-Microgrid Energy Management Strategy Based on Multi-Agent Deep Reinforcement Learning with Prioritized Experience Replay. Appl Sci 2023, Vol 13, Page 2865 2023;13:2865. [CrossRef]
- Krizhevsky A, Sutskever I, Hinton GE. ImageNet classification with deep convolutional neural networks. Commun ACM 2017;60:84–90. [CrossRef]
- Jiang J, Li Z, Bedra KB, Long C, Wu J, Zhong Q. Predicting outdoor thermal comfort in traditional villages: An explainable machine learning framework integrating model optimization, seasonal variability, and tourist-resident insights. Build Environ 2025;282:113315. [CrossRef]
- Bröde P, Fiala D, Błażejczyk K, Holmér I, Jendritzky G, Kampmann B, et al. Deriving the operational procedure for the Universal Thermal Climate Index (UTCI). Int J Biometeorol 2012;56:481–94. [CrossRef]
- Kántor N, Égerházi L, Unger J. Subjective estimation of thermal environment in recreational urban spaces-Part 1: Investigations in Szeged, Hungary. Int J Biometeorol 2012;56:1075–88. [CrossRef]
- Zheng G, Zhang Y, Yue X, Li K. Interpretable prediction of thermal sensation for elderly people based on data sampling, machine learning and SHapley Additive exPlanations (SHAP). Build Environ 2023;242:110602. [CrossRef]
- Zhang H, Ao M, Ardabili NG, Xu Z, Wang J. Impact of urban sunken square design on summer outdoor thermal comfort using machine learning. Urban Clim 2024;58:102214. [CrossRef]
- Xie Y, Ishida Y, Hu J, Mochida A. A backpropagation neural network improved by a genetic algorithm for predicting the mean radiant temperature around buildings within the long-term period of the near future. Build Simul 2022;15:473–92. [CrossRef]
- Zumwald M, Knüsel B, Bresch DN, Knutti R. Mapping urban temperature using crowd-sensing data and machine learning. Urban Clim 2021;35:100739. [CrossRef]
- Briegel F, Wehrle J, Schindler D, Christen A. High-resolution multi-scaling of outdoor human thermal comfort and its intra-urban variability based on machine learning. Geosci Model Dev 2024;17:1667–88. [CrossRef]
- Liu K, Nie T, Liu W, Liu Y, Lai D. A machine learning approach to predict outdoor thermal comfort using local skin temperatures. Sustain Cities Soc 2020;59:102216. [CrossRef]
- Prasad HPS, Satyanarayana ANV. Assessment of Outdoor Thermal Comfort Using Landsat 8 Imageries with Machine Learning Tools over a Metropolitan City of India. Pure Appl Geophys 2023;180:3621–37. [CrossRef]
- Fei F, Wang Y, Wang L, Fukuda H, Yao W, Zhou Y, et al. Mechanisms of urban blue-green infrastructure on winter microclimate using artificial neural network. Energy Build 2023;293:113188. [CrossRef]
- Chan SY, Chau CK. Development of artificial neural network models for predicting thermal comfort evaluation in urban parks in summer and winter. Build Environ 2019;164:106364. [CrossRef]
- Zhong G. Convolutional Neural Network Model to Predict Outdoor Comfort UTCI Microclimate Map. Atmos 2022, Vol 13, Page 1860 2022;13:1860. [CrossRef]
- Kariminia S, Shamshirband S, Motamedi S, Hashim R, Roy C. A systematic extreme learning machine approach to analyze visitors׳ thermal comfort at a public urban space. Renew Sustain Energy Rev 2016;58:751–60. [CrossRef]
- Lai D, Chen C. Comparison of the linear regression, multinomial logit, and ordered probability models for predicting the distribution of thermal sensation. Energy Build 2019;188–189:269–77. [CrossRef]
- Eslamirad N, Malekpour Kolbadinejad S, Mahdavinejad M, Mehranrad M. Thermal comfort prediction by applying supervised machine learning in green sidewalks of Tehran. Smart Sustain Built Environ 2020;5:511–28. [CrossRef]
- Kariminia S, Shamshirband S, Hashim R, Saberi A, Petković D, Roy C, et al. A simulation model for visitors’ thermal comfort at urban public squares using non-probabilistic binary-linear classifier through soft-computing methodologies. Energy 2016;101:568–80. [CrossRef]
- Wei D, Yang L, Bao Z, Lu Y, Yang H. Variations in outdoor thermal comfort in an urban park in the hot-summer and cold-winter region of China. Sustain Cities Soc 2022;77:103535. [CrossRef]
- Xie X, Liu M, Yang Y, Gou Z. Optimizing green exposure for summer outdoor thermal comfort in subtropical campus environments: A machine learning approach integrating climatic and physiological factors. Urban Clim 2025;62:102518. [CrossRef]
- Huang CH, Wang CH, Chen SH. Quantifying influence of rainfall events on outdoor thermal comfort in subtropical dense urban areas. Geocarto Int 2024;39:2306276. [CrossRef]
- Zhang J, Zhang F, Gou Z, Liu J. Assessment of macroclimate and microclimate effects on outdoor thermal comfort via artificial neural network models. Urban Clim 2022;42:101134. [CrossRef]
- Shahrestani SS, Zomorodian ZS, Karami M, Mostafavi F. A novel machine learning-based framework for mapping outdoor thermal comfort. Adv Build Energy Res 2023;17:53–72. [CrossRef]
- Eslamirad N, De Luca F, Sakari Lylykangas K, Ben Yahia S. Data generative machine learning model for the assessment of outdoor thermal and wind comfort in a northern urban environment. Front Archit Res 2023;12:541–55. [CrossRef]
- Lundberg SM, Lee SI. A Unified Approach to Interpreting Model Predictions. Adv Neural Inf Process Syst 2017;2017-December:4766–75.
- Nocedal J, Wright SJ. Numerical optimization. Springer Ser Oper Res Financ Eng 2006:1–664. [CrossRef]
- Arani S. Optimizing energy performance of building renovation using traditional and machine learning approaches. PhD thesis, Concordia University, 2020.
- Castrejon-Esparza NM, González-Trevizo ME, Martínez-Torres KE, Santamouris M. Optimizing urban morphology: Evolutionary design and multi-objective optimization of thermal comfort and energy performance-based city forms for microclimate adaptation. Energy Build 2025;342:115750. [CrossRef]
- Li J, Liu N. The perception, optimization strategies and prospects of outdoor thermal comfort in China: A review. Build Environ 2020;170:106614. [CrossRef]
- Hou G, Kuai Y, Yin L, Li Y, Shu P. A comprehensive review of thermal comfort related design strategy of semi-outdoor transitional spaces. Energy Build 2025;345:116116. [CrossRef]
- Steuer RE. Multiple criteria optimization; theory, computation, and application. vol. 10. Wiley Series in Probability and Mathematical Statistics.; 1989. [CrossRef]
- Miettinen K. Nonlinear multiobjective optimization. Kluwer Academic Publishers; 1999.
- Cohon JL. Multiobjective programming and planning. New York: Dover Publications; 2003.
- Mavrotas G. Effective implementation of the ε-constraint method in Multi-Objective Mathematical Programming problems. Appl Math Comput 2009;213:455–65. [CrossRef]
- Nguyen AT, Reiter S, Rigo P. A review on simulation-based optimization methods applied to building performance analysis. Appl Energy 2014;113:1043–58. [CrossRef]
- Arora RK. Optimization: Algorithms and applications. 1st Edition. Boca Raton, FL, USA: Chapman and Hall/CRC; 2015. [CrossRef]
- U.S. Department of Energy. Energy Plus: Weather Data 2024.
- Bueno B, Norford L, Hidalgo J, Pigeon G. The urban weather generator. J Build Perform Simul 2013;6:269–81. [CrossRef]
- Goldberg DE. Genetic algorithms in search, optimization, and machine learning. Publishing Co., Inc.75 Arlington Street, Suite 300 Boston, MAUnited State; 1989.
- Holland JH. Adaptation in Natural and Artificial Systems: An Introductory Analysis with Applications to Biology, Control, and Artificial Intelligence. The MIT Press; 1992. [CrossRef]
- Deb K. Multi-Objective Optimization using Evolutionary Algorithms. vol. 20. John Wiley & Sons, Inc., United States; 2001.
- Wang Y, Yan X, Zhang X, Zhang D. A multi-objective optimization framework for designing residential green space between buildings considering outdoor thermal comfort, indoor daylight and Green View Index. Sustain Cities Soc 2025;119:106045. [CrossRef]
- Mousaeipour M, Sanaieian H, Faizi M, Alafchi A, Hosseini SMA. Multi-objective optimization of urban block configuration to enhance outdoor thermal comfort: A case study of district 12, Tehran. Results Eng 2025;27:106012. [CrossRef]
- Sun R, Liu J, Lai D, Liu W. Building form and outdoor thermal comfort: Inverse design the microclimate of outdoor space for a kindergarten. Energy Build 2023;284:112824. [CrossRef]
- Gurney K. An Introduction to Neural Networks. 1st editio. CRC Press; 2018. [CrossRef]
- Cervantes J, Garcia-Lamont F, Rodríguez-Mazahua L, Lopez A. A comprehensive survey on support vector machine classification: Applications, challenges and trends. Neurocomputing 2020;408:189–215. [CrossRef]
- Khalil M, McGough AS, Pourmirza Z, Pazhoohesh M, Walker S. Machine Learning, Deep Learning and Statistical Analysis for forecasting building energy consumption — A systematic review. Eng Appl Artif Intell 2022;115:105287. [CrossRef]
- Hardy RL. Multiquadric equations of topography and other irregular surfaces. J Geophys Res 1971;76. [CrossRef]
- Cherkassky V, Ma Y. Practical selection of SVM parameters and noise estimation for SVM regression. Neural Networks 2004;17:113–26. [CrossRef]
- Broemeling LD. Bayesian Analysis of Time Series. Chapman and Hall/CRC; 2019. [CrossRef]
- Forrester AIJ, Sóbester A, Keane AJ. Engineering Design via Surrogate Modelling: A Practical Guide. Eng Des via Surrog Model A Pract Guid 2008:1–223. [CrossRef]
- Kleijnen JPC. Statistical tools for simulation practitioners. New York : M. Dekker; 1987.
- Han Z-H, Zhang K-S. Surrogate-Based Optimization. Real-World Appl. Genet. Algorithms, 2012. [CrossRef]
- Wang X, Yue YR, Faraway JJ. Bayesian Regression Modeling with INLA. Chapman and Hall/CRC, Taylor & Francis Group; 2018. [CrossRef]
- Abdulrahman ML, Ibrahim KM, Gital AY, Zambuk FU, Ja’Afaru B, Yakubu ZI, et al. A Review on Deep Learning with Focus on Deep Recurrent Neural Network for Electricity Forecasting in Residential Building. Procedia Comput Sci 2021;193:141–54. [CrossRef]
- Zhang R, Liu D, Shi L. Thermal-comfort optimization design method for semi-outdoor stadium using machine learning. Build Environ 2022;215:108890. [CrossRef]
- Wang SS, Yi YK, Liu NX. Multi-objective optimization (MOO) for high-rise residential buildings’ layout centered on daylight, visual, and outdoor thermal metrics in China. Build Environ 2021;205:108263. [CrossRef]
- Ji Y, Li Z, Chang Y, Feng T. Enhancing urban thermal comfort during heat waves: Exploring hierarchical optimization strategies through integration of network and patch morphology. Sustain Cities Soc 2024;115:105869. [CrossRef]
- Liu L, Zhang Z, Lan S, Tian X, Liu J, Liao W, et al. Developing a spatial optimization design approach towards energy-saving and outdoor thermal comfortable densely-built residential blocks using a dynamic local energy balance model. Energy Build 2025;328:115194. [CrossRef]
- Zhen M, Xia W, Sun G, Huang C, Ji J. Optimized design of hospital open space based on outdoor thermal comfort: The case of Shaanxi People’s Hospital in China. Energy Build 2025;337:115703. [CrossRef]
- Liu J, She X, Wang J. Comprehensive optimization of urban building cluster morphology based on microclimate: A two-level optimization approach. Sustain Cities Soc 2024;100:105005. [CrossRef]
- Xu X, Liu Y, Wang W, Xu N, Liu K, Yu G. Urban Layout Optimization Based on Genetic Algorithm for Microclimate Performance in the Cold Region of China. Appl Sci 2019, Vol 9, Page 4747 2019;9:4747. [CrossRef]
- Xu X, Yin C, Wang W, Xu N, Hong T, Li Q. Revealing Urban Morphology and Outdoor Comfort through Genetic Algorithm-Driven Urban Block Design in Dry and Hot Regions of China. Sustain 2019, Vol 11, Page 3683 2019;11:3683. [CrossRef]
- Ibrahim Y, Kershaw T, Shepherd P, Elwy I. A parametric optimisation study of urban geometry design to assess outdoor thermal comfort. Sustain Cities Soc 2021;75:103352. [CrossRef]
- Ibrahim Y, Kershaw T, Shepherd P, Coley D. On the Optimisation of Urban form Design, Energy Consumption and Outdoor Thermal Comfort Using a Parametric Workflow in a Hot Arid Zone. Energies 2021, Vol 14, Page 4026 2021;14:4026. [CrossRef]
- Ibrahim Y, Kershaw T, Shepherd P, Elkady H. Multi-objective optimisation of urban courtyard blocks in hot arid zones. Sol Energy 2022;240:104–20. [CrossRef]
- Abdollahzadeh N, Biloria N. Urban microclimate and energy consumption: A multi-objective parametric urban design approach for dense subtropical cities. Front Archit Res 2022;11:453–65. [CrossRef]
- Maged A, Abdelalim A, Mohamed AFA. Generative design optimization of tree distribution for enhanced thermal comfort in communal spaces with special reference to hot arid climates. Sci Reports 2025 151 2025;15:1–34. [CrossRef]
- McNeel R. Grasshopper - algorithmic modeling for Rhino. Robert McNeel Assoc 2013. https://www.grasshopper3d.com/ (accessed September 16, 2025).
- Roudsari MS, Pak M. Ladybug: A Parametric Environmental Plugin For Grasshopper To Help Designers Create An Environmentally-conscious Design. Proc BS 2013 13th Conf Int Build Perform Simul Assoc 2013;13:3128–35. [CrossRef]
- Rutten D. Galapagos Evolutionary Solver in Grasshopper. Robert McNeel Assoc 2010. https://www.cs.cmu.edu/afs/cs/academic/class/15394-s22/lectures/galapagos/galapagos.html (accessed September 16, 2025).
Figure 1.
Primary categories of machine learning approaches.
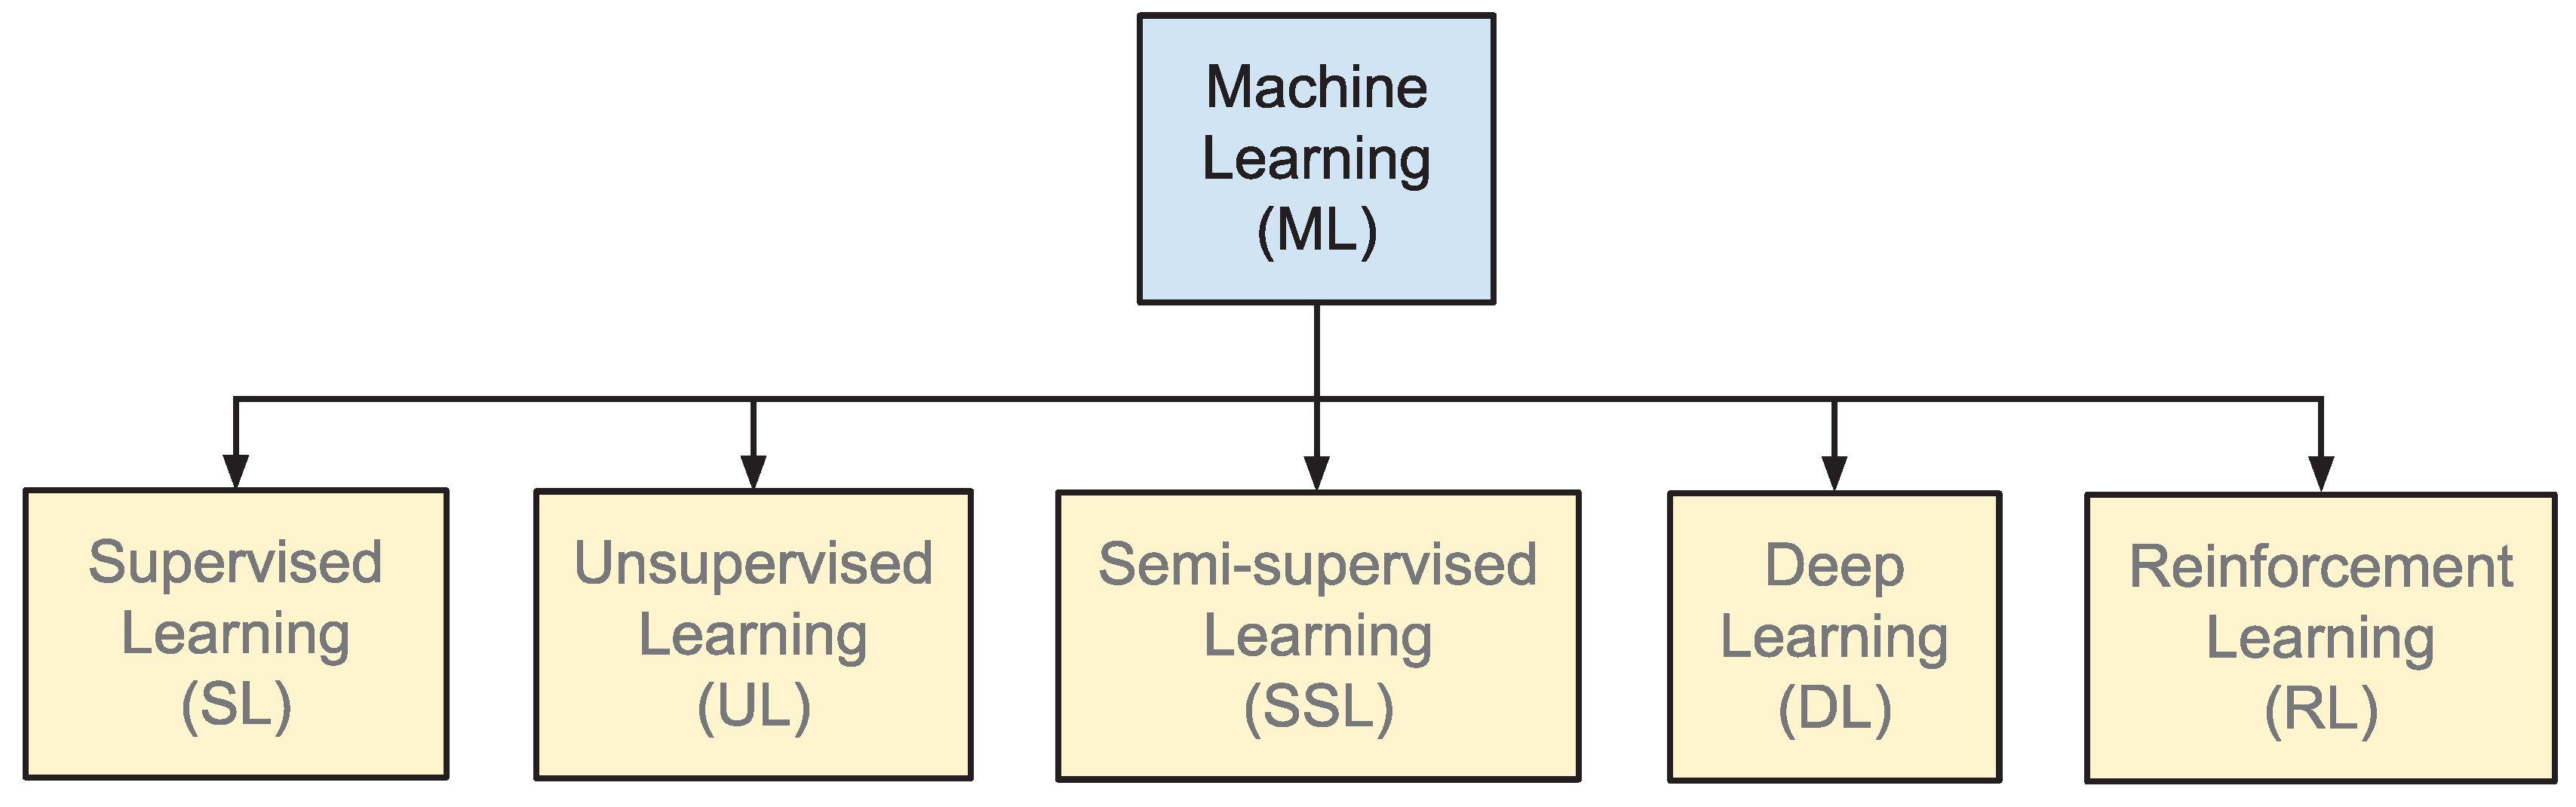
Figure 2.
Typical architecture of an FFNN model.
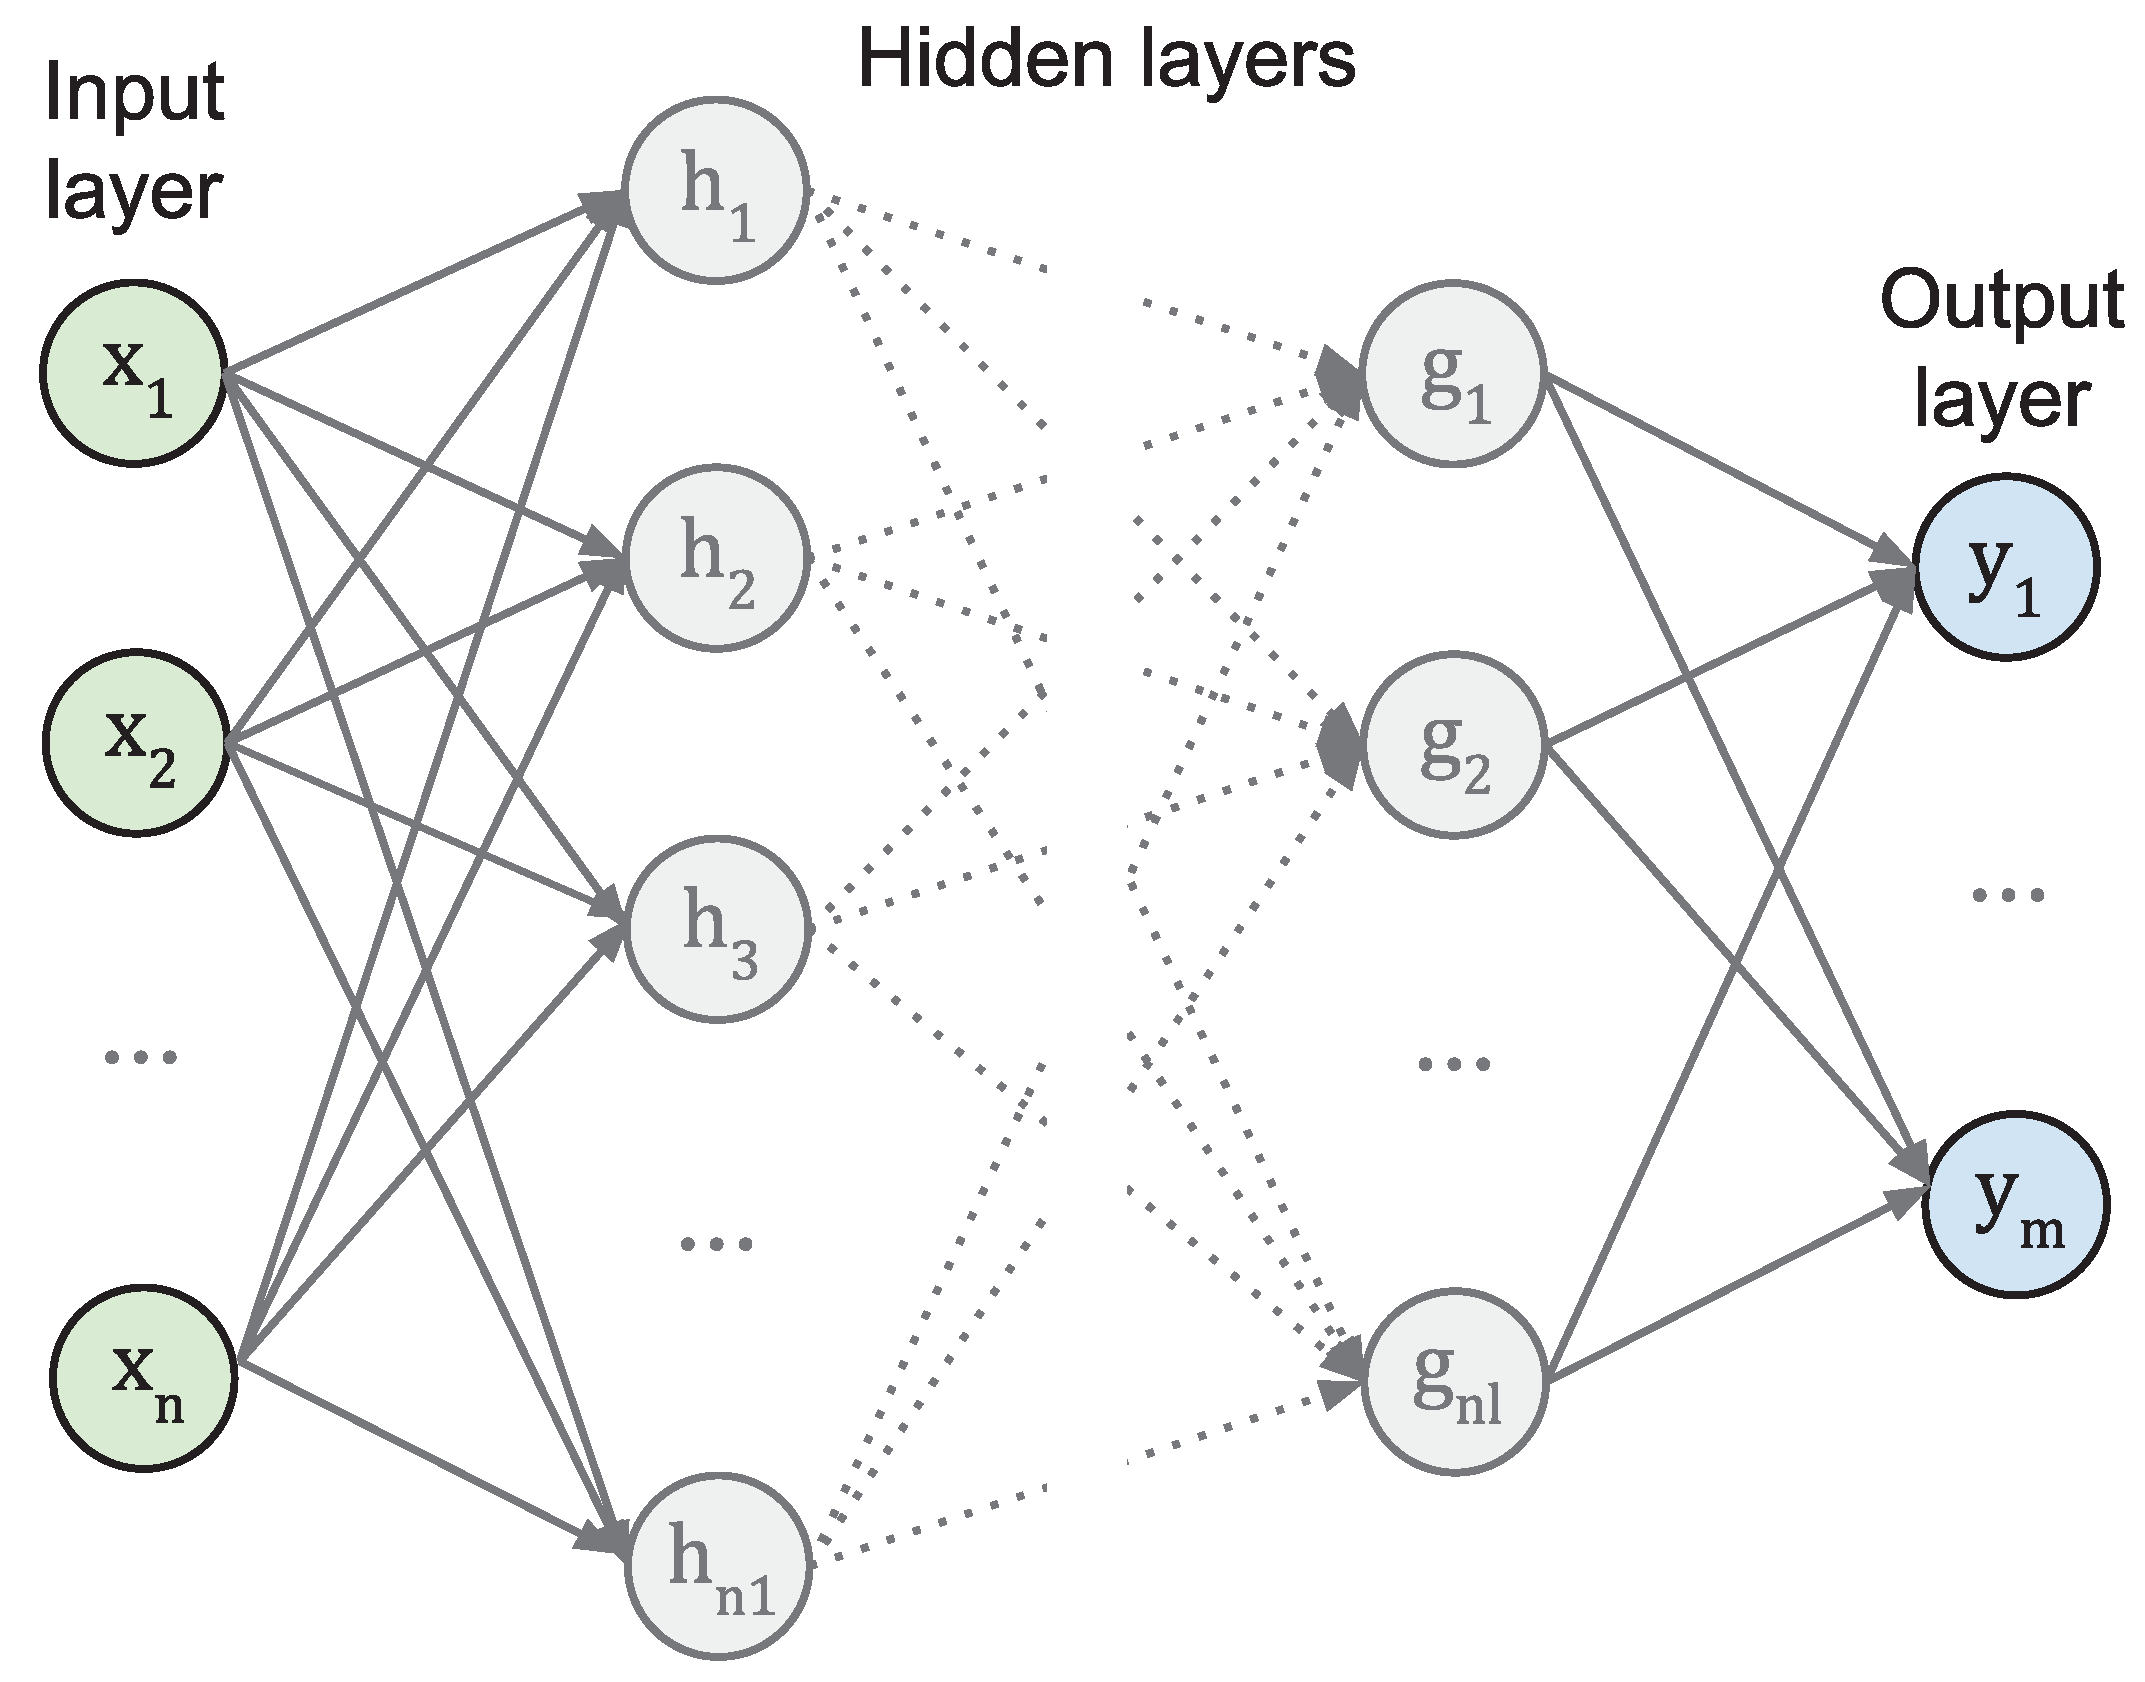
Table 1.
Summary of the main ML algorithms with their respective advantages and disadvantages.
| Learning paradigm |
Algorithm | Main advantages | Main disadvantages |
|---|---|---|---|
| Supervised learning (regression) |
LR [56,61,62,97] | Simplicity; interpretability; speed of training and evaluation; and usefulness as a baseline | Linearity assumption; sensitivity to multicollinearity; influence of outliers on performance; homoscedasticity; and normally distributed and uncorrelated errors |
| DTR [56,61,64,88] | Non-parametric nature; interpretability; capability for modeling nonlinear relationships; and suitability for both numerical and categorical data | Tendency for overfitting; and sensitivity to data noise and small changes | |
| SVR [64,67,68] | Effectiveness in high-dimensional spaces; robustness against overfitting; use of the kernel trick for modeling nonlinearity; and flexibility through hyperparameter tuning | Computational intensity; requirement for careful kernel and parameter tuning; and low interpretability | |
| RFR [73,74,75,76] | Reduction of overfitting; modeling of nonlinear relationships and high-dimensional data; and robustness and accuracy | Lower interpretability than single trees; and high computational intensity and resource demand compared to simpler models | |
| GBR [70,71] | High prediction accuracy; ability to handle complex nonlinear patterns; customizability of loss functions; robustness to overfitting; and capacity to process both numerical and categorical data | Tendency for overfitting without regularization; sensitivity to hyperparameters; low interpretability; and high memory requirement | |
| ANNs (regression) [52,53,75,81,82,83] | Capability to capture complex nonlinear relationships; and scalability to large datasets | Large data requirements; high computational demand; and risk of overfitting | |
| Supervised learning (classification) |
DTC [88] | Transparency; ease of visualization; capability to handle both numerical and categorical data as well as nonlinear relationships; and suitability for small- and medium-sized datasets | Overfitting on noisy data; and instability with small changes |
| SVM [64,67] | Effectiveness in high-dimensional spaces; flexibility through the use of kernels; and robustness to overfitting | Increasing computational cost with dataset size; and limited interpretability | |
| KNN [89] | Simplicity; absence of a training phase; and intuitiveness | Computationally costly during inference; sensitivity to data scaling and noise; and high storage requirements due to keeping all training data in memory | |
| NB [90] | Speed; efficiency; effectiveness in high-dimensional spaces; and usefulness as a baseline | Strong independence assumption rarely holding; and limitation to linear boundaries | |
| RFC [73] | Reduction of overfitting; robustness to noise; and effectiveness in handling imbalanced data | Low interpretability; high resource demand; and high storage requirements due to keeping multiple trees in memory | |
| ANNs (classification) [53,81] | Capability to capture complex decision boundaries; and adaptability to various data types | Significant data and tuning requirements; and low transparency | |
| Unsupervised learning | k-means clustering [93] | Simplicity; efficiency; wide usage; and scalability | Requirement for predefined k; sensitivity to initialization and outliers; and influence of distance metric choice on results |
| Hierarchical clustering [97] | Absence of a predefined number of clusters; provision of multi-scale insights; and generation of a dendrogram offering a visual representation of data groupings | High computational cost; and sensitivity to noise, outliers, and linkage criteria | |
| PCA [95] | Reduction of dimensionality; enhancement of interpretability; improvement of performance; and production of uncorrelated components | Linearity of the method; and difficulty in interpreting components | |
| t-SNE [94] | Excellence for visualization; and preservation of local structure | Limited scalability to very large datasets; variability of results between runs | |
| Autoencoders [53,92,96] | Effectiveness for dimensionality reduction; denoising; and unsupervised feature learning | Requirement for careful tuning; low interpretability; and sensitivity to noise or small datasets | |
| Semi-supervised learning | Self-training [101] | Simplicity and ease of implementation; extension of supervised models; and leveraging of unlabeled data | Sensitivity to confidence threshold; and variability in performance |
| Co-training [102] | Effective exploitation of feature redundancy through multiple, conditionally independent views of the data; and reduction of overfitting | Requirement for input features to be naturally split into distinct and sufficient subsets (views); and increased computational complexity | |
| Graph-based methods [103] | Efficient utilization of both labeled and unlabeled data through modeling of relationships as graph structures; and capability to model complex topologies and nonlinear manifolds in the input space | High computational intensity for large datasets due to construction and label propagation; and susceptibility to noise in graph connectivity | |
| Consistency regularization [104] | Encouragement of model robustness through enforcement of stable predictions under input perturbations such as noise or augmentation; and compatibility with modern neural network architectures and training pipelines | Sensitivity to the type and magnitude of perturbations; negative impact of poorly chosen augmentations on performance | |
| Generative models [105] | Simultaneous modeling of data distribution and classification; and capture of complex latent structures | High computational intensity and implementation complexity compared to simpler SSL methods; and requirement for careful balancing of supervised and unsupervised loss components | |
| Deep learning | CNNs [106,107,108,109,130] | High effectiveness for spatially structured data, such as images or grids | Limited capability for long-term temporal dependencies; and requirement for significant training data and computational resources |
| RNNs [53,106,107,109,110,111,112,113,114] | Tailoring for sequential/time-series data; capture of temporal dependencies in input signals; and usefulness for microclimate prediction, human behavior modeling, and control systems | Proneness to vanishing or exploding gradients during training; slow training due to sequential computation; and limited ability to retain long-term dependencies | |
| DBNs [116,117] | Combination of unsupervised pretraining with supervised fine-tuning; and capability to learn hierarchical feature representations | Difficulty in training and tuning; lower prevalence compared to CNNs and RNNs; and high computational cost | |
| GANs [118] | Generation of realistic synthetic data, such as for environmental data augmentation; and usefulness in missing data reconstruction and simulation | Difficulty and instability in training (mode collapse and convergence issues) | |
| Reinforcement learning | Value-based methods [55,119] | Well-established theoretical foundation; suitability for discrete action spaces; and effectiveness in tabular and low-dimensional settings | Scalability issues in large or continuous action spaces; and requirement for full value function estimation |
| Policy-based methods [55,119] | Direct optimization of the policy; effectiveness in continuous or stochastic environments; and capability to handle high-dimensional spaces | High variance in gradient estimates; and sample inefficiency and slow convergence |
Table 2.
SL applications in OTC studies.
| Reference | Location/Investigation method | SL Method | Input Parameters | Output Parameters | Main Results |
|---|---|---|---|---|---|
| [144] | An open urban space at Naghsh-e Jahan Square, located in Isfahan, Iran. Measurements and survey data. | ELM (single-layer feedforward network with random hidden layer parameters and analytically computed output weights) | Microclimatic and demographic parameters: air temperature, relative humidity, solar radiation, wind speed, clothing insulation, gender, reason for visiting, frequency of attendance | Thermal sensation vote (TSV), MRT, PMV, PET | ELM outperformed ANN and Genetic Programming (GP) in predicting TSV, PMV, PET, and MRT, achieving its highest accuracy for MRT (R2 = 0.99) and TSV (R2 = 0.94), thereby demonstrating superior predictive performance and computational efficiency |
| [145] | Open park in Tianjin, China. Field measurements and questionnaire surveys conducted. | LR, multinomial logit model, and ordered probability model (supervised statistical models used for TSV prediction) | Air temperature, water vapor pressure, metabolic heat generation, and clothing insulation | TSV | Ordered probability and multinomial logit models outperformed LR in predicting TSVs, achieving 10–30% higher accuracy; multinomial logit was slightly better for individual TSVs, whereas ordered probability better captured TSV distributions under specific conditions |
| [139] | Tianjin, China, and West Lafayette, USA / Outdoor human subject experiments with 26 participants exposed to varying microclimates. Environmental conditions, skin temperatures, and thermal sensation votes were monitored through instrumentation and questionnaires. | SVM | Environmental parameters (air temperature, relative humidity, global solar radiation, wind speed), Physiological variables (skin temperatures, mean skin temperature, thermal load) and clothing | Cool discomfort, comfort, and warm discomfort, derived from TSV scale | An SVM model using local skin temperature and thermal load predicted thermal sensation categories (cool discomfort, comfort, warm discomfort), with a highest 91.5% prediction accuracy using hand and head skin temperature points; the model improved up to 6.9% when combining multiple inputs and demonstrated strong generalization across different climates and seasons |
| [146] | Tehran, Iran, specifically along green sidewalks. Data were collected through field investigations, including on-site microclimatic measurements and questionnaire-based surveys to capture subjective thermal comfort responses. | Supervised ML techniques were applied to predict outdoor thermal comfort, although the specific algorithm was not disclosed. | Air temperature, relative humidity, wind speed, global solar radiation, and PMV values calculated using both ENVI-met simulations and a mathematical formula. | PMV | The supervised ML model effectively predicted thermal comfort from measured environmental conditions, offering a human-centered approach for green sidewalk design optimization, and enhancing urban outdoor quality of life |
| [137] | A case study in Zürich, Switzerland, crowd-sensing data collected via smartphones to map urban air temperature; validation with fixed weather stations. | Quantile Regression Forest (QRF), an extension of RF used for predicting conditional quantiles of urban temperature distributions. | Smartphone temperature readings, location coordinates, time of day, land use data, surface cover, elevation, and meteorological parameters. | Urban air temperature maps at high spatial resolution | Crowd-sourced sensor data enabled high-resolution urban temperature mapping despite uncertainties, with RF models accurately estimating spatial temperature using few reference stations for validation, offering a cost-efficient and scalable alternative to CFD models for urban heat mitigation and planning |
| [69] | Southwestern Spain (Mérida, Córdoba, Seville); field monitoring of 22 courtyards during the warm season using on-site environmental measurements and morphological analysis | SVR | Geometric and environmental features such as courtyard AR, location coordinates (longitude, latitude), height above sea level, and climatic classification of the site | Predicted indoor air temperature within the courtyard environments | The SVM model predicted courtyard microclimates ~1 °C RMSE and <0.05% relative error during peak overheating, matching CFD accuracy at lower computational cost and highlighting ML’s potential for energy-efficient courtyard design |
| [47] | The study developed a data-driven thermal comfort prediction model using optimized tree-type ML algorithms, including Extreme Gradient Boosting (XGBoost), RF, and DT | 5 ML algorithms: DT, RF, XGBoost, AdaBoost, Bayesian Ridge Regression | Air temperature, relative humidity, MRT, wind speed, solar radiation, and PET calculated using Rayman | PET | A user-friendly data-driven model predicted OTC using optimized tree-based ML algorithms, with XGBoost achieving the highest accuracy (95.21%), validated via five-fold cross-validation, enabling accurate PET prediction from publicly accessible input data, making it suitable for non-experts and practical applications like construction site management |
| [44] | Guangzhou, China. High-resolution air temperature mapping using sparse weather station data (321 stations), remote sensing (land cover), and socio-economic variables. | Eight ML models, Regression kriging, multiple linear regression (MLR), RF, XGBoost, ANN, etc. | Air temperature data from stations, Land cover (1 m resolution, from DL), Socio-economic variables, Geographic coordinates: latitude, longitude, altitude, time variables (hour, day) | Hourly air temperature distribution at neighborhood/building scale (∼200 m resolution) | Among eight spatial prediction models for urban air temperature, the integration of Regression Kriging (RK) combined with MLR achieved the highest predictive accuracy (R2=0.959, RMSE=0.92 °C, Mean Absolute Error or MAE=0.70 °C) over one month of hourly data, with high-resolution land cover and observed spatial-temporal variability strongly enhancing performance, although residuals increased under high variability |
| [45] | Hong Kong, a high-density city used as a case study for fine-scale, hourly thermal environment mapping during the summer season. RF algorithm was applied to generate 100 m resolution maps of air temperature, relative humidity, and net effective temperature, incorporating meteorological variables, topography, and local climate zone-based landscape features. | RF | Meteorological drivers, Topographic variables, Local Climate Zone (LCZ)-based landscape drivers: | Hourly air temperature (Ta) and relative humidity (RH) at 100 m spatial resolution; and Net Effective Temperature (NET), a thermal comfort index that combines Ta and RH to estimate perceived heat stress | A high-resolution (100 m) hourly thermal comfort dataset for Hong Kong (2008-2018) analyzed with RF achieved high accuracy for air temperature (R2=0.87, RMSE=1.12 °C) and RH (R2=0.80, RMSE=5.38%), while incorporating NET revealed intensified nighttime heat stress in dense urban areas, underscoring the relevance of fine-scale modeling |
| [140] | Hyderabad, India, a major metropolitan area with a tropical wet and dry climate. The study utilized Landsat 8 imagery integrated with meteorological data to estimate outdoor thermal comfort indices. | SVM | Inputs were derived from Landsat 8 imagery and used to assess spatial variations in thermal comfort across Hyderabad (Normalized Difference Vegetation Index or NDVI, Normalized Difference Water Index or NDWI, New Built-up Index or NBI, last surface temperature or LST, etc.) | Temperature-Humidity Index (THI), which is used as an indicator of outdoor thermal comfort, quantifying the combined effect of temperature and humidity on human well-being. | Distinct spatial variations in THI across Hyderabad showed highest mean values over barren lands (27.3), followed by built-up (26.9), vegetation (24.1), and water (20.7), with LST ranging from 27.39 °C (water) to 31.94 °C (vegetation); mean THI exceeded 25 °C in most land cover classes during the summer, and SVM effectively identified high thermal stress areas for targeted urban cooling strategies |
| [46] | Xi’an, China (cold climate zone; Kӧppen BSk/Cwa). Field study combining in situ microclimatic measurements and subjective thermal comfort surveys (questionnaires) during the summer. The dataset was divided into two categories (with shading and without shading) and used to train nine ML models. | Nine supervised machine learning models were evaluated: XGBoost, Light Gradient Boosting Machine (LightGBM), Categorical Boosting (CatBoost) with Bayesian optimization, RF, SVM, DT, KNN, Logistic Regression, NB | Environmental variables (air temperature, relative humidity, wind speed, MRT, solar radiation) and human-related features (age, gender, clothing, body mass index or BMI, metabolic rate, emotional state) | TSV (scale of how hot/cold a person feels), thermal acceptability (TA, i.e., whether the person finds the thermal condition acceptable), and thermal comfort vote (TCV, i.e., overall comfort level expressed by the participant) | Interpretable ML models predicted TSV, TA, and TCV from microclimate and physiological data, with shading-based dataset division improving accuracy by 9.2%, 9.31%, and 6.16% in unshaded spaces, and Bayesian optimization further enhancing performance by 6.83%, 4.05%, and 2.55%, respectively |
| [58] | Xi’an, China. Real-time meteorological measurements and questionnaire surveys conducted in three urban park environments: water-side square, pavilion, and tree-shaded space, differing in SVF and landscape features | Classification (KNN, SVM, DT, AdaBoost, RF, MLP) and regression approaches (Ridge Regression, Least Angle Regression, and Bayesian Ridge Regression) were employed to predict children’s outdoor thermal sensation by linking physiological indices and facial expression data. | (a) Environmental parameters (air temperature, relative humidity, SVF, landscape type) (b) Physiological indices (Mean ear skin temperature, Mean cheek temperature, Heart rate) (c) Facial expression metrics (Proportion of negative emotions) (d) Activity intensity level |
TSV, TCV | A highly accurate (97.1%) ML model predicted children’s outdoor thermal sensation from facial expressions, ear skin temperature, and heart rate, identifying ear skin temperature and negative emotions (sadness, disgust) as key non-invasive indicators across thermal stress and activity levels |
| [59] | Shiraz, Iran – a rapidly urbanizing city experiencing UHI effects. Use of Landsat satellite imagery and machine learning to predict LST variations linked to urban land use/land cover changes. | RF, SVM, DT, XGBoost, and DL | (a) NDVI, Normalized Difference Built-up Index (NDBI), NDWI (b) Land use/land cover (LULC) categories (vegetation, soil, built-up) (c) Elevation, slope (d) Air temperature, humidity, wind speed, solar radiation (e) Configuration/urban morphology metrics |
LST | Urban landscape configuration strongly influenced LST, with built-up and vegetated areas showing lower LSTs at the urban boundary; among six ML models, XGBoost performed best, followed by DL, while LULC transformation and urban expansion drove UHI intensification over 2006-2021 |
| [84] | Shenyang, Northeast China (Severe Cold Zone). Field measurements and continuous questionnaire surveys during spring (April 2023) in two microenvironments: open grassland and shaded rest area on a university campus. | RF, Gradient Boosting Trees (GBTs), XGBoost, and ANN | (a) Environmental factors: air temperature, wind speed, relative humidity, radiation temperature (b) Individual factors: gender, age, heigh, weight, time in Shenyang, clothing insulation |
TCV (based on questionnaire responses and representing the subjective thermal comfort level reported by participants); treated as the dependent variable in all ML models applied in the study) | XGBoost achieved the highest OTC prediction accuracy (r= 0.9313), outperforming GBT (0.7693), RF (0.7291), and ANN (0.5311), with comfort influenced by environmental and individual factors, showing significant differences across climate origins and clothing insulation levels |
| [77] | Nagpur City, Maharashtra, India – a city with a tropical wet and dry climate. Investigation methods: (a) Field measurements of microclimatic parameters (b) Surveys of pedestrian thermal sensation using questionnaires (c) Urban morphological analysis using remote sensing |
Two RF models were developed. Model included all microclimate and street geometry parameters, while model 2 used only the following most important features: air temperature, solar radiation, selected street geometry parameters | (a) Microclimatic parameters: air temperature, solar radiation, relative humidity, wind speed (b) Street geometry parameters: AR, orientation, SVF |
Modified Physiological Equivalent Temperature (mPET) | RFR models accurately predicted pedestrian thermal comfort (mPET) in tropical urban streets (up to 98% accuracy), while a simplified RFR using only air temperature, solar radiation, and street geometry retained high predictive power, supporting practical urban planning applications for thermal comfort |
| [138] | Freiburg, Germany. Microclimate data from stationary and mobile measurements were used, combined with high-resolution 3D urban morphology data. | Both SL (RF) and DL (MLP with three hidden layers) | Meteorological parameters Land use factors (vegetation, impervious surface, buildings, water, etc.) Surface characteristics (albedo, emissivity, etc.) Building density SVF |
Ta, RH, wind speed, MRT, and UTCI at street-level (and the final output) | An ML framework using RF and MLP predicted high-resolution UTCI with MAE of 2.3°K, enabling fast, city-wide hourly mapping at 1 m resolution and capturing strong spatial-temporal thermal comfort variability |
| [131] | Fenghuang County, Hunan Province, China – Field measurements and questionnaire surveys. | Eight ML models were tested: SVM, MLP, Logistic Regression, KNN, DT, XGBoost, NB, RF. | (a) Environmental parameters: air temperature, relative humidity, wind speed, global solar radiation, SVF (b) non-meteorological (questionnaire-based): gender, age, clothing, metabolic rate, time of exposure, etc. |
TSV, TCV, thermal acceptance vote (TAV) | XGBoost outperformed empirical and deterministic models in predicting TSV, providing high accuracy, stability, and explainability; TAV achieved the highest prediction accuracy; TCV was less reliable due to subjective variability; and tourists adapted better with longer exposure and fulfilled expectations, while residents were more sensitive to metabolic rate |
| [65] | Guangzhou, China. Field experiment conducted at a nursing home for elderly residents using outdoor thermal monitoring and facial infrared thermography during 6.5 days of summer. Thermal comfort votes and facial skin temperature from 34 participants (avg. age 83) were collected under varied activity levels and conditions | Six algorithms: RF, SVM, DT, Logistic Regression, AdaBoost (AB), and Gradient Boosting (GB); models trained on labeled facial and environmental data to predict thermal sensation votes (TSV) | Facial skin temperatures at five landmarks (forehead, left/right cheeks, nose, jaw) measured via infrared thermography, environmental parameters (air temperature, relative humidity, wind speed, solar radiation), individual characteristics (age, gender, clothing insulation, activity level)” | TSV recorded on a 7-point ASHRAE scale ranging from −3 (cold) to +3 (hot) | An RF model achieved the highest accuracy (79.6%) and area under the Receiver Operating Characteristic (ROC) curve (0.889) in predicting TSV; facial skin temperatures, especially on the nose and forehead, were the most influential features; the feasibility of using non-contact infrared thermography and ML models to assess elderly thermal sensation in real-time outdoor conditions was demonstrated |
| [147] | Isfahan, Iran. Field study in two urban public squares under hot-dry summer conditions, 500 visitors surveyed alongside microclimatic data collection at four distinct points using portable weather stations. | Supervised classification using a Binary Linear Classifier trained via Genetic Algorithm (GA); implemented within a soft-computing framework to distinguish between thermally comfortable and uncomfortable conditions based on labeled field data | Environmental parameters (air temperature, relative humidity, wind speed, solar radiation), clothing insulation (in clo), metabolic rate (MET), and Mean Radiant Temperature. All measured or estimated on-site in urban squares. | PET | A GA-trained binary-linear classifier accurately predicted thermal comfort in urban squares using PET-based thresholds, showing high agreement with actual comfort classes and demonstrating the feasibility of soft-computing for climate-responsive outdoor design |
| [85] | Gwalior, India. Field measurements in four urban street canyons during the winter, spring, and summer, used to train and validate ANN models for predicting thermal comfort indices in a composite climate | Supervised regression using FFNN with a single hidden layer. Model parameters optimized using backpropagation with 70-15-15 train-validation-test split. | Meteorological data (air temperature, wind speed, relative humidity, solar radiation), urban canyon geometry parameters (AR, orientation, canyon surface materials), temporal features (hour of day, month) | PET, UTCI | ANN models accurately predicted hourly PET and UTCI with high correlation and low RMSE; the best used full meteorological inputs, while a reduced-input model with only air temperature remained acceptably accuracy; supporting ANN use for comfort forecasting with limited microclimatic data |
| [148] | Chengdu, China. Field surveys conducted in People’s Park during the hottest (July) and coldest (January) months, involved on-site meteorological measurements and thermal comfort questionnaires at four sites with different landscape typologies and with 419 valid responses collected. | RF | Meteorological variables (air temperature, relative humidity, wind speed, globe temperature, solar radiation), landscape type, personal attributes (age, gender, clothing insulation, activity level), seasonal context (summer vs. winter) | TSV (subjective thermal comfort reported by participants) on a 7-point ASHRAE scale from −3 (cold) to +3 (hot) | RF identified RH and Ta as dominant TSV predictors, varying seasonally (Ta in summer, RH in winter), while landscape type significantly influenced thermal comfort, with woods preferred in summer and lakeside/lawn in winter |
| [66] | Tainan City, Taiwan. ENVI-met simulations conducted for the courtyard of a senior residence under construction to assess outdoor thermal comfort under hot and humid summer conditions. | DT algorithm to identify and rank the influence of 11 design parameters on thermal comfort. | Eleven courtyard design parameters including: green coverage ratio, tree planting configuration, courtyard width-to-height (W/H) ratio, orientation, pavement material, floor reflectance, tree height, tree spacing, grass planting, and building layout. | Binary thermal comfort classification: comfortable or uncomfortable based on PET thresholds for senior courtyard users under hot-humid summer conditions simulated by ENVI-met | DT classification identified key courtyard design parameters affecting elderly thermal comfort; simulations reduced areas with PET>38 °C by 14.3% and increased thermally acceptable areas (PET 30-34 °C) to over 54% by late afternoon, showing that vegetation and courtyard geometry modifications significantly enhance outdoor comfort in hot-humid conditions |
| [49] | Singapore. Year-long, city-scale field study leveraging smartwatches to collect thermal comfort perception and physiological data | Supervised classification using XGBoost optimized via Bayesian methods. Shapley Additive Explanations (SHAP) analysis was applied to interpret feature contributions |
Physiological data (heart rate, skin temperature) from smartwatches, geolocation (GPS), time of day, activity level, environmental variables (air temperature, relative humidity, wind speed, solar radiation), urban characteristics (green view index or GVI, land use type, building density) | Thermal comfort levels | XGBoost with Bayesian optimization achieved 66% accuracy in predicting real-time thermal comfort preferences, with heart rate, GPS location, and solar variables as key features, and SHAP analysis confirming nonlinear physiological and environmental impacts, supporting user-aware thermal planning |
| [135] | Chongqing, China. Field measurements and ENVI-met simulations conducted for sunken urban squares during the summer. | Supervised regression using XGBoost, trained to predict PET from simulation-derived microclimate and geometric features. SHAP analysis was applied to interpret the relative influence of environmental and design variables. | Microclimatic parameters: global horizontal radiation, solar altitude, air temperature, wind speed, relative humidity; Geometric/design parameters: SVF, slope angle, orientation, width-to-height ratio (W/H), square depth |
PET | XGBoost predicted PET in sunken squares with high accuracy (R2=0.991); SHAP analysis identified SVF, slope angle, and orientation as key nonlinear design parameters, with PET positively correlated with SVF and AR, negatively with slope angle, W/H ratio, and depth, while greening (especially shrubs) unenhanced thermal comfort more than material choices |
| [86] | Nis, Serbia. Field data collected at the Observatory Nis during the summer months. | Three soft computing models: ANN, ELM, and GP; trained to predict thermal sensation votes based on meteorological inputs. | Meteorological parameters including air temperature, relative humidity, wind speed, globe temperature, and solar radiation | PET | Among ANN, ELM, and GP, ELM achieved the highest PET prediction accuracy, providing robust results despite environmental complexity, and supporting its use for assessing OTC in urban spaces |
| [48] | Republic of Cyprus (Nicosia, Limassol, Larnaca, Pafos, Ammochostos). Field surveys conducted in public squares, pedestrian streets, and promenades between July 2019 and February 2020. Simultaneous environmental monitoring and questionnaires were used to collect meteorological and physiological data and thermal sensation votes | RF, SVM, MLP-ANN with 2 hidden layers, and Linear Discriminant Analysis (LDA) | Environmental variables: air temperature, mean radiant temperature, relative humidity, wind speed, globe temperature, solar radiation and PET. Personal parameters: gender, age, clothing insulation (in clo), metabolic rate (activity level), location and time of day. |
Thermal sensation | Τhe RF classifier outperformed MLP, SVM, and LDA in predicting TSV, providing more accurate classifications than PET-based methods, especially for extreme sensations, highlighting PET’s value as input while demonstrating ML’s superior ability to capture complex comfort patterns across urban sites and seasons |
| [136] | Sendai, Japan. MRT Data at pedestrian height (1.5 m) were obtained from radiative heat balance simulations over the summer of 2019. These were combined with historical weather data (2014–2018) from the Japan Meteorological Agency | Supervised regression using three ANN approaches: (a) FFNN, (b) Backpropagation Neural Networks or BPNN, and (c) GA–optimized BPNN (GA-BPNN); trained to predict MRT based on weather and solar geometry inputs. PCA and K-means clustering were applied to reduce the training dataset size while maintaining prediction accuracy. |
Meteorological and solar parameters: solar altitude, solar azimuth, air temperature at true solar time, minimum daily air temperature, and global solar radiation | MRT at pedestrian height (1.5 m), predicted as a continuous thermal comfort index using supervised neural network models | The GA-optimized BPNN outperformed FFNN and BPNN, achieving the highest MRT prediction accuracy (Mean Absolute Percentage Error or MAPE < 1%), while PCA and k-means clustering reduced the training dataset by ~70% while preserving accuracy |
| [149] | Shenzhen, China. Field measurements + on-site thermal comfort surveys + machine learning analysis (XGBoost + SHAP) | Extreme Gradient Boosting (XGBoost) with SHAP analysis for model interpretability | (a) Climatic factors (air temperature, wind speed, solar radiation, black globe temperature, relative humidity; (b) physiological factors (respiratory rate, BMI); and (c) environmental and morphological factors (GVI, SVF, vegetation density) | Thermal comfort | Green exposure significantly improved OTC in subtropical environments, with optimal comfort at GVI 20-56%; low BMI and respiratory rate further improve comfort, amplified by moderate air velocity (0.5-1 m/s) and SVF (12–20%) |
Table 3.
UL applications in OTC studies.
| Reference | Location/Investigation method | UL Method | Input Parameters | Output Parameters | Main Results |
|---|---|---|---|---|---|
| [98] | Tehran, Iran, where outdoor thermal comfort was assessed using satellite imagery and ground-based climatic data | PCA was applied tto reduce dimensionality and inter-correlation among input features derived from surface biophysical indices and meteorological variables | Landsat-derived LST, NDVI, NDWI, land-cover, DEM, in-situ meteorological data (air temperature, relative humidity, wind speed) | Principal components forming composite comfort index calibrated to the Discomfort Index (DI) | The PCA model demonstrated strong predictive performance (correlation up to 0.89, RMSE =1.15 °C), revealing that DI was on average 8.5 °C higher in the warm season, with bare land being the most uncomfortable surface and water bodies the most comfortable, while the approach proved efficient for large-scale thermal comfort modeling |
| [150] | Taipei, Taiwan (subtropical dense urban area) with meteorological big data from the Taipei Weather Station covering June–August (2011–2020) | K-means clustering was applied to categorize rainfall weather patterns and assess their impact on apparent temperature (AT) and physiological equivalent temperature (PET) under different rainfall scenarios | Hourly meteorological data (temperature, RH, wind speed, precipitation, cloud cover) | Apparent temperature (AT) and PET under different rainfall scenarios | In subtropical oceanic climates, summer rainfall significantly influences urban OTC, with 37.7% of rainfall events improving comfort and 62.3% leading to its deterioration |
Table 5.
Case studies applying optimization methods for OTC enhancement across diverse urban and climatic contexts.
Table 5.
Case studies applying optimization methods for OTC enhancement across diverse urban and climatic contexts.
| Reference | Location | Optimization method | Design Variables | Objectives | Main results |
|---|---|---|---|---|---|
| [136] | Sendai, Japan | GA was applied to optimize the training of a backpropagation-based ANN, adjusting weights and thresholds to predict MRT | Meteorological and solar parameters: solar altitude; solar azimuth; air temperature at true solar time; minimum daily air temperature; and global solar radiation | MRT | The GA-optimized ANN significantly improved the prediction accuracy of MRT under future climate conditions in Sendai, Japan, while the hybrid optimized model more reliably captured long-term seasonal variations and microclimatic dynamics than the standard ANN, with reduced MAE |
| [185] | Tianjin Tuanbo tennis center, Tianjin, China (semi-outdoor space) | ANN and GA | Stadium geometric and morphological parameters | Maximize thermal comfort, expressed in (average percentage of comfortable seats with UTCI between 9 °C and 26 °C) | The study proposed a surrogate-based optimization method combining ANN and GA to improve semi-outdoor stadium design, introduced as a new comfort evaluation metric, and achieved an 8.96% improvement in thermal comfort, demonstrating the feasibility of AI-driven morphological design |
| [187] | Shenyang, China | Two-stage simulation-based optimization was performed using a hierarchical GA: Stage 1 optimized network morphology, while Stage 2 refined patch-level configuration, without the use of surrogate models | Stage 1: network-level morphology (street orientation, road network density, intersection spacing, block size and layout); Stage 2: patch-level morphology (vegetation distribution, green space configuration, patch shape and size) | Urban thermal field variance index (UTFVI) | UTFVI was reduced by up to 35% in key areas, with optimization identifying 20 TC sources, 20 thermal discomfort (TD) sources, and 78 thermal corridors; barrier points and core areas were spatially mapped; and network-level design was found to be the most effective |
| [171] | Beijing, China | Simulation-based multi-objective optimization was conducted using NSGA-II, integrated with parametric modeling | Tree parameters: height, crown diameter, spacing, layout pattern, species selection, and greenbelt width | Minimize UCLI for thermal comfort; maximize daylight factor; maximize GVI | UCLI was reduced by 12.7%, daylight factor improved by 26.3%, GVI increased by 35.8%, and trade-offs between shading and daylight were effectively balanced through tree layout optimization |
| [188] | Guangzhou, China (hot and humid climate) | Deterministic simulation-based optimization was conducted using a dynamic local energy balance model | Land-use configuration: building layout and spacing; vegetation coverage; and road orientation | Minimize cooling energy demand and improve outdoor thermal comfort (PET, MRT) | A parametric optimization strategy using a dynamic energy balance model identified optimal ranges for building density (0.45–0.5), building height (10–20 floors), and greenland/woodland ratios (0.25–0.4); building density and floor number were the most influential factors on a comprehensive indicator (CI) combining cooling demand and PET; and the study demonstrated that spatial configuration significantly affects energy and thermal performance, offering guidance for high-density residential design in hot-humid regions |
| [189] | Xi’an, China | Parametric spatial optimization was performed based on TSV and UTCI evaluations | Vegetation arrangement, surface materials, user type (patients vs. healthy), and microclimate characteristics | Maximize outdoor thermal comfort for different user groups in hospital open spaces | Patients have higher neutral UTCI (18.8 °C) than healthy individuals (16.9 °C); thermal comfort design should be tailored by user type; and the key drivers are air temperature and black globe temperature |
| [172] | District 12, Tehran, Iran | Multi-Objective Genetic Algorithm (MOGA) optimization was performed using NSGA-II implemented via the Wallacei plugin in Grasshopper | Block orientation, height, spacing, and vegetation percentage | Minimize MRT and UTCI; and maintain RH within a comfortable range | Optimized block orientation (+35°), spacing (6 m alleys), and H/W ratio reduced MRT by 3.34 °C, UTCI by 2.91 °C, and PET by 0.52 °C; peak thermal stress shifted earlier in the day, enhancing OTC |
| [173] | Various kindergartens located in high-density residential areas, China | GA optimization was implemented using the Galapagos plugin in Grasshopper | Building shape, façade orientation, and location | Minimize outdoor thermal stress, expressed by UTCI | Optimization reduced thermal stress from 6.53 °C to 5.37 °C in Tianjin and from 3.57 °C to 2.87 °C in Shanghai; ladder-shaped buildings with context-sensitive orientations were most effective; solar radiation was more influential than wind in improving thermal comfort; and the framework offers actionable guidance for early-stage building design focused on OTC |
| [190] | Nanjing, China (subtropical monsoon climate) | Two-level parametric and enumeration-based optimization | Building orientation, height, spacing, layout type, and site coverage | Improve UTCI-based thermal comfort across seasons: reduce summer heat stress and mitigate winter cold stress | The two-level optimization framework improved OTC by modifying both the layout and form of urban building clusters; compared to the base case, the optimized plan reduced mean UTCI by 0.73 °C at noon in the summer and increased it by 1.91 °C at night in the winter, indicating better thermal comfort in both cooling and heating seasons; layout had a stronger effect in the winter, while lower-level refinements (e.g., wind corridors, solar access) further improved local microclimate conditions |
| [191] | Shenyang City, China (cold climate) | GA via Galapagos in Grasshopper, coupled with UTCI-based simulation using Ladybug | Urban block type (e.g., multistory vs. high-rise); street width; building placement layout; and north-side building configuration | Maximize OTC by increasing the percentage of time during which the UTCI remains within the acceptable range (−17 °C to 20 °C) during daytime hours on a typical winter day | Optimization achieved 87.7% UTCI compliance at the block level and 90.3% at the street level; multistory blocks outperformed high-rise and open layouts in cold climates; and placing dense block enclosures on the north side was effective for wind protection and thermal comfort enhancement |
| [192] | Kashgar, China (hot and dry climate) | SBO using GA via Galapagos in Grasshopper, coupled with Ladybug, Butterfly (Computational Fluid Dynamics), and OpenFOAM for microclimate simulation | Building height, orientation, length and width; open space layout; and street orientation | Minimize outdoor thermal stress by reducing UTCI and MRT through the optimization of urban block form and spatial layout | Average UTCI decreased from 31.17 °C to 27.43 °C (−3.74 °C) and mean MRT reduced from 43.94 °C to 41.29 °C (−2.65 °C); the optimization framework effectively improved OTC in a hot-dry urban setting by adjusting urban form parameters |
| [186] | Beijing, China (cold climate) | Multi-objective optimization (MOO) integrating daylight, sunlight hours, SVF, and OTC metrics for high-rise residential layouts in cold climates; a parametric model controlled building layout; and simulation outputs were accelerated using a trained ANN as a surrogate model | Building layout parameters including position; spacing; orientation; and rotation of high-rise residential buildings on a large urban site | Multi-objective optimization: maximize daylight; maximize annual sunlight hours; maximize SVF; and improve OTC | The MOO framework identified the top 10 building layout solutions (out of 150) that improved combined performance metrics by approximately 21% compared to the baseline; ANN surrogate modeling accelerated performance evaluation with an average prediction accuracy of 89.9%; and the optimized layouts offered balanced improvements across daylight, sunlight hours, SVF, and UTCI, demonstrating the potential of integrated optimization for sustainable high-rise residential design |
| [193] | Greater Cairo region, Egypt (hot-arid climate) | Parametric simulation-based optimization using Ladybug tools in Grasshopper 3D; variations of building height, street width, and orientation were simulated to assess and optimize UTCI across different urban canyon configurations | Building height; street width; street orientation; symmetrical and asymmetrical height-to-width (H/W) ratios | Maximize OTC by minimizing diurnal average UTCI through the optimization of canyon geometry in hot-arid urban environments | UTCI reductions of up to ~6 °C were achieved through optimized H/W ratio and orientation; a strong negative correlation was found between UTCI and H/W ratio (R2=0.71, and R2=0.91 excluding E–W orientations); and optimized asymmetrical canyons outperformed regulatory baselines, supporting climate-adaptive planning in hot-arid cities |
| [194] | Cairo, Egypt (hot-arid climate) | Parametric simulation-based optimization using a Design of Experiments approach evaluated 3,430 hypothetical urban configurations based on three typologies (scattered, linear, and courtyard) in a hot-arid climate with Ladybug Tools integrated in Grasshopper, aiming to identify optimal trade-offs between outdoor thermal comfort (UTCI and PET) and energy consumption | Urban typology (scattered, linear, courtyard); building height; street width; plot ratio (density); block orientation; building spacing; footprint dimensions; and arrangement and distribution of open spaces | Simultaneously enhance OTC and reduce building energy consumption across diverse urban forms in hot-arid climates | (a)Strong correlation found between design parameters and combined performance (UTCI + EUI), with R2=0.84. (b)Urban density had the highest impact on both thermal comfort (R2=0.70) and energy use (R2=0.95). |
| [195] | Cairo, Egypt | MOGA implemented via Octopus in Grasshopper, using Pareto-based evolutionary optimization | Courtyard block orientation; building height; courtyard proportions (W/L); and interspace dimensions | Minimize outdoor thermal stress (UTCI) and reduce summer weekly cooling loads | Optimal layouts reduced UTCI by up to 1.6 °C and cooling loads by 31.7% compared to the baseline; preferred orientations were 45° for square blocks and 135° for elongated blocks; minimum interspaces were consistently favored; and solar exposure increased by ~4%, offering winter heating potential |
| [196] | Western Sydney, Australia | A MOO parametric framework was employed integrating urban- and building-scale design variables within Grasshopper, with environmental performance metrics—OTC (PET) and energy demand for cooling and heating—simulated using EnergyPlus via Honeybee and Ladybug plugins | Urban grid rotation (street layout angle); AR; building typology; building use; and window-to-wall ratio (WWR) | Minimize simulated annual building cooling and heating energy loads, and maximize OTC (evaluated using PET) | The optimization framework achieved up to 25.85% improvement in OTC and reductions of 72.76% in cooling loads and 93.67% in heating loads compared to the baseline; optimal solutions typically featured compact urban forms with lower AR, north–south grid orientation, and moderate window-to-wall ratios |
| [197] | Madinaty, New Cairo, Egypt | A generative design tool using a mutation-based evolutionary algorithm via Dynamo in the Revit/Autodesk environment was coupled with Ladybug and Grasshopper for simulation-informed iteration to evaluate OTC via UTCI | Tree count and spatial distribution; and neighborhood morphology types (clustered, semi-clustered, fully open) | Minimize UTCI in outdoor communal areas by optimizing vegetation layout (tree distribution) | Optimized tree distributions improved UTCI across all neighborhood types, with clustered layouts reducing UTCI from 38.0 °C to 37.55 °C using fewer trees, decreasing from 43 to 33; semi-clustered layouts improving UTCI from 39.40 °C to 38.01 °C with more trees, increasing from 27 to 45; and fully open layouts showing a slight UTCI reduction from 39.60 °C to 39.55 °C using fewer trees, reduced from 31 to 25 |
Disclaimer/Publisher’s Note: The statements, opinions and data contained in all publications are solely those of the individual author(s) and contributor(s) and not of MDPI and/or the editor(s). MDPI and/or the editor(s) disclaim responsibility for any injury to people or property resulting from any ideas, methods, instructions or products referred to in the content. |
© 2026 by the authors. Licensee MDPI, Basel, Switzerland. This article is an open access article distributed under the terms and conditions of the Creative Commons Attribution (CC BY) license (http://creativecommons.org/licenses/by/4.0/).
Copyright: This open access article is published under a Creative Commons CC BY 4.0 license, which permit the free download, distribution, and reuse, provided that the author and preprint are cited in any reuse.


