Submitted:
01 February 2026
Posted:
03 February 2026
You are already at the latest version
Abstract
This study investigates the multi-criteria route optimization problem within complex urban expressway networks. The primary objective is to develop and evaluate a novel pathfinding approach by integrating a Delphi-AHP-weighted cost function into the A* algorithm, thereby dynamically balancing operational efficiency and public safety. By employing the Delphi Technique with a panel of 17 experts, a specialized cost function was derived that incorporates twelve critical parameters, including traffic fluidity, population density, and chemical dispersion metrics modeled via ALOHA. This re-search applied the proposed model to a high-stakes hazardous material (HAZMAT) emergency response scenario to benchmark its performance against established base-lines, specifically Dijkstra’s algorithm and Ant Colony Optimization (ACO). Simulation results demonstrate that the Delphi-weighted A* algorithm achieves an approximately 3.8 % reduction in travel time relative to Dijkstra’s algorithm while enhancing safety scores by approximately 8.6%. These findings provide a robust framework for algo-rithmic decision-support in time-critical logistics and infrastructure management.
Keywords:
key route planning
; A* algorithm
; Delphi technique
; rescue operations
; expressway
1. Introduction
Urban expressway infrastructures serve as the vital lifelines of megacities, facilitating rapid connectivity, boosting travel convenience, and supporting sustainable urban growth. However, the high-speed and high-volume nature of these networks introduces significant complexities during traffic disruptions or hazardous incidents. Accidents—ranging from multi-vehicle collisions to toxic chemical spills—can cause severe repercussions, including loss of life, extensive economic damage, and widespread traffic paralysis. In such high-stakes environments, the challenge of emergency response lies not only in the physical rescue operation but fundamentally in the underlying route planning algorithms that must navigate dynamic and multi-dimensional constraints in real-time. Effective pathfinding in these scenarios requires a sophisticated trade-off between minimizing response time and mitigating secondary risks, such as chemical exposure to responders and nearby population clusters.
To enhance safety and facilitate smoother travel on expressways, the Expressway Authority of Thailand (EXAT) has notably implemented advanced traffic management systems, such as automatic accident detection, emergency notification, and traffic signal control systems. This initiative reflects a broader global trend, as various agencies worldwide recognize the critical importance of emergency response on expressways and are actively developing innovations and technologies to improve rescue efficiency. [1] Furthermore, applications like “EXAT Portal” are available, designed to provide expressway users with rapid access to traffic information, enable incident reporting, and facilitate assistance requests. [2] To enhance traffic management and develop sophisticated emergency alert and response systems, nations such as the United States, Japan, and those in the European Union are leveraging technologies like Intelligent Transportation Systems (ITS), Artificial Intelligence (AI), and Big Data. [3,4,5] For instance, the European Union’s eCall system is an automatic emergency alert system installed in vehicles that transmits location data and accident details directly to rescue services [6].
Despite these advancements in incident detection and monitoring, the optimization of the routing logic for specialized emergency missions remains a critical research gap. Most conventional navigation systems prioritize “shortest distance” or “fastest time,” often failing to account for the unique risk parameters inherent in Hazardous Material (HAZMAT) logistics. This study addresses this gap by refining the A heuristic search algorithm*. Rather than relying on traditional distance-based heuristics, we integrate qualitative expert consensus—quantified via a Delphi-AHP framework—into the algorithm’s core cost function. By prioritizing factors such as population density, chemical dispersion patterns (modeled via ALOHA), and resource readiness, this research benchmarks the enhanced A* against established methods, including Dijkstra’s Algorithm and Ant Colony Optimization. The findings contribute to the broader field of computational logistics and intelligent traffic management, offering a robust decision-support framework for high-stakes urban crisis response.
2. Materials and Methods
This research aims to develop a rescue route planning method for expressways using the popular and efficient A* Algorithm. We’ll enhance the A* Algorithm’s cost function by applying the Delphi Technique. This approach will gather expert opinions to determine the weighted importance of various factors influencing route selection, such as population density, resource availability, and traffic fluidity.
To assess its effectiveness, we’ll simulate a chemical spill incident on an expressway. This simulation will serve to compare the A* Algorithm’s performance against two other common pathfinding algorithms, Dijkstra’s Algorithm and Ant Colony Optimization. Additionally, we’ll benchmark its results against the fastest and shortest routes provided by traditional methods like Google Maps.
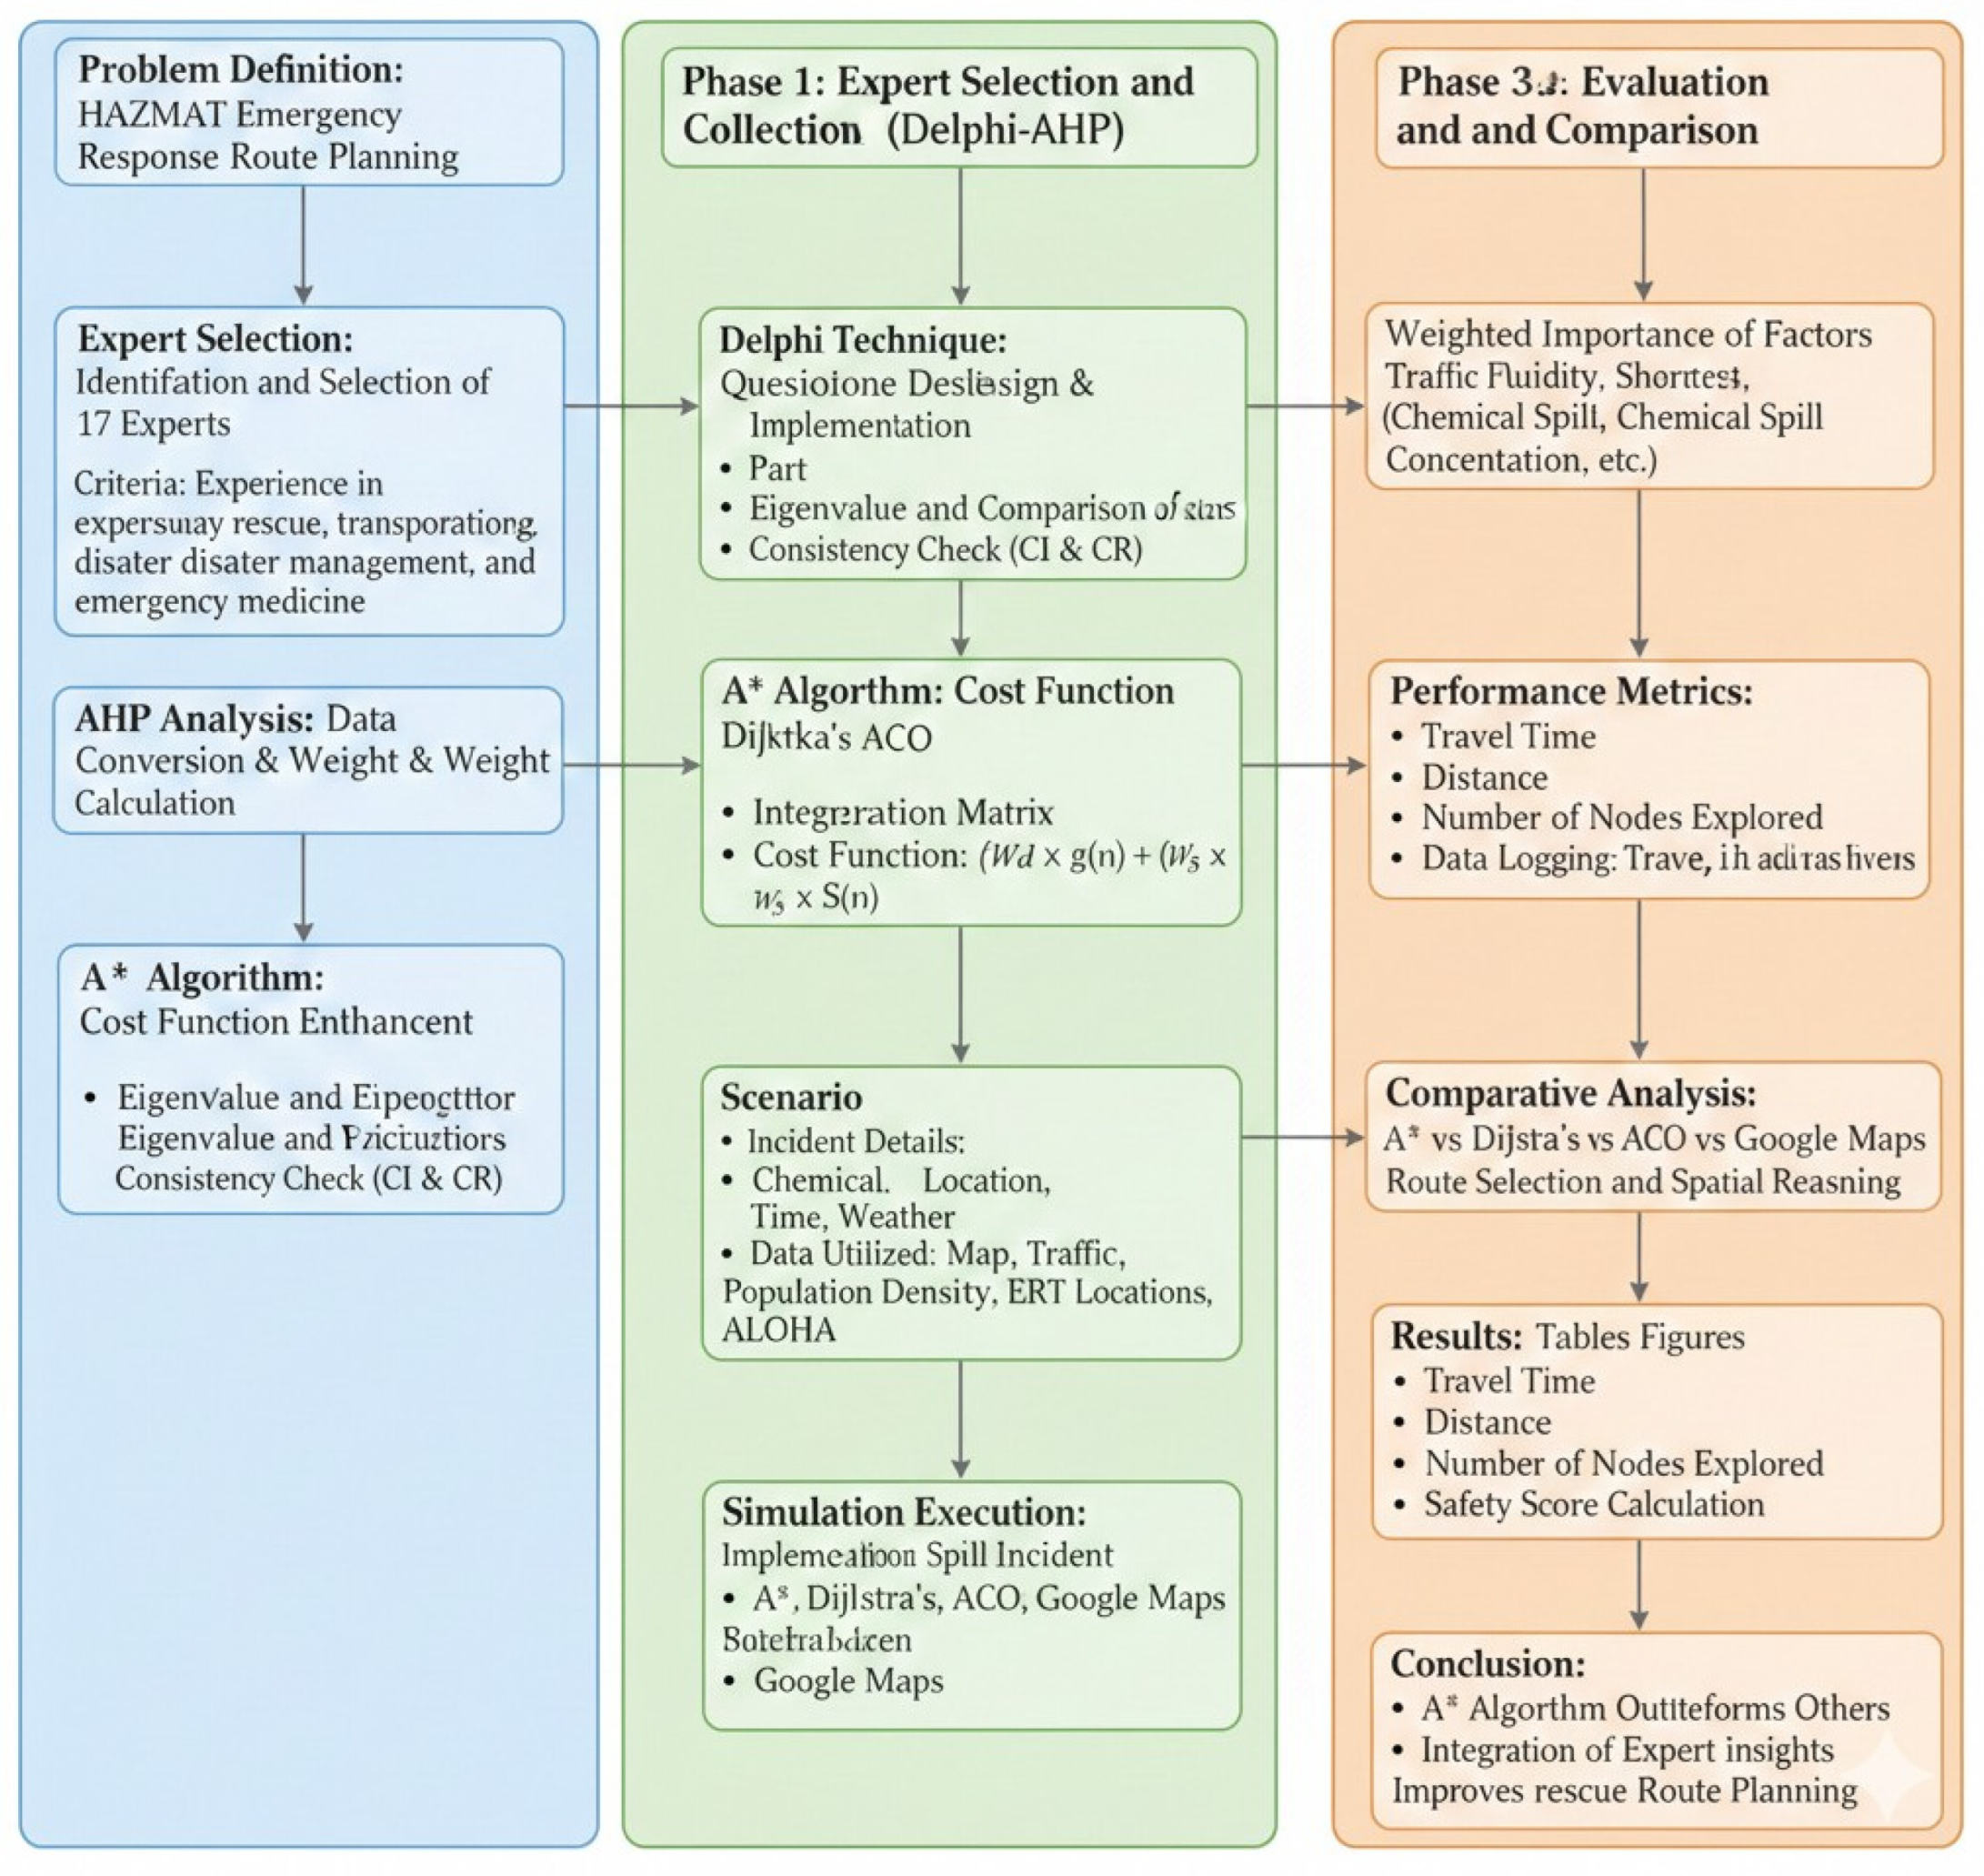
To validate the proposed model, we benchmarked the results against standard commercial baselines, specifically the ‘fastest’ and ‘shortest’ routes provided by the Google Maps API. The overall research framework, illustrating the integration of expert consensus with algorithmic evaluation, is presented in Figure 1
As illustrated in Figure 1, the research design is structured into three pivotal phases. Phase 1 involves the Delphi technique, where 17 experts undergo a three-round consensus process to validate and prioritize 12 critical risk factors. Phase 2 utilizes the Analytic Hierarchy Process (AHP) to calculate the global weights for each factor. Finally, Phase 3 integrates these weights into the proposed A* algorithm’s cost function. The performance is then benchmarked against standard paradigms, including Dijkstra’s algorithm, Ant Colony Optimization (ACO), and Google Maps API data, to evaluate improvements in travel time and safety scores.
2.1. Questionnaire Design Designing an Effective Questionnaire
The instrument designed for collecting expert insights in this study is systematically divided into two principal components:
Part 1: Expert Demographics
This initial section gathers general information about the participating experts, including their age, gender, educational background, areas of specialization, and professional work experience. This data helps provide context for their insights and can be used to analyze the diversity of perspectives within the expert panel.
Part 2: Pairwise Comparison of Factors Influencing Expressway Rescue Route Selection
Figure 1.
The research conceptual framework illustrating the multi-stage integration of the Delphi-AHP consensus method with the A* heuristic search algorithm for route optimization.
Figure 1.
The research conceptual framework illustrating the multi-stage integration of the Delphi-AHP consensus method with the A* heuristic search algorithm for route optimization.
This section employs a Pairwise Comparison method to assess the relative importance of various factors impacting expressway rescue route selection. Experts will evaluate pairs of factors, assigning a score that reflects their relative significance. This comparison will be made using a 9-level scale, detailed as follows:

Table 1.
The Fundamental Scale for Pairwise Comparison.
| Intensity of importance | Definition |
|---|---|
| 1 | Equal Importance |
| 3 | Moderate Importance |
| 5 | Strong Importance |
| 7 | Very Strong |
| 9 | Extreme Importance |
| 2, 4, 6, 8 | Intermediate values |
Table 2.
Factors for Comparison.
| Factor | Explanation |
|---|---|
| A1 |
Traffic flow This factor assesses the level of vehicle movement on the expressway, determined by vehicle density and average vehicle speed. These conditions can be observed using Google Maps’ traffic color indicators: green signifies free-flowing traffic, yellow indicates slow-moving traffic, and red denotes congested or stopped traffic. |
| A3 |
The shortest path This factor represents the linear distance along the expressway from the incident’s origin point to the designated destination, measured in kilometers. |
| A4 |
Route Complexity This factor considers the number of intersections, interchanges, curves, and overall intricacy of the route. These elements can significantly impact driving difficulty and the safety of travel. A higher count of such features generally indicates greater route complexity. |
| F1 |
Chemical Spill Concentration Level This factor indicates the measured concentration of the spilled chemical at the incident location, expressed in parts per million (ppm). This metric directly correlates with the severity of the hazard and influences the safety protocols and route considerations for emergency responders. |
| F2 |
Location of Chemical Spill Incident This factor pertains to the specific placement of the incident site on the expressway, which significantly influences accessibility and situational control. Examples include its position before an on-ramp, after an off-ramp, or near an interchange. |
| F3 |
Chemical Spill Dispersion Map This factor quantifies the total area impacted by the chemical spill’s dispersion, measured in square meters. This calculation is derived using ALOHA software, which considers detailed input on the chemical properties, prevailing weather conditions, and surrounding environmental factors. |
| B1 |
Population Density (Community Areas) This factor quantifies the number of individuals residing in community areas adjacent to the expressway who could potentially be affected by an incident. It is measured in persons per square kilometer. |
| B2 |
Business Density (Business Districts) This factor quantifies the number of businesses located in commercial areas adjacent to the expressway that could potentially be impacted by an incident. It is measured in number of businesses per square kilometer. |
| C1 |
Google map This factor assesses the ease with which traffic information can be obtained and utilized via Google Maps. It encompasses several sub-criteria: the accuracy of the data, the geographical coverage of the traffic information, and the overall user-friendliness of the interface. |
| C3 |
ITS Sign This factor evaluates the ease with which traffic information can be acquired from Intelligent Transportation System (ITS) signs. Key considerations include the clarity of the displayed information, the extent of geographical coverage provided by the signs, and the real-time accuracy (up-to-dateness) of the data. |
| D1 |
Resource Availability This factor assesses the overall preparedness of rescue units to handle emergencies. It encompasses the availability and training of personnel, the operability and suitability of equipment, the depth of specialized knowledge among responders, and the readiness of fire trucks to be deployed effectively. |
| D2 |
ERT Location This factor refers to the geographical placement of Emergency Response Team (ERT) units, which directly influences their travel time to an incident site. Considerations include their proximity to or distance from the expressway. |
2.2. Data Collection
The researchers initiated this phase by identifying a target expert group, focusing on individuals with direct experience in expressway rescue operations or specialized knowledge in transportation engineering, disaster management, and emergency medicine. From this pool, seventeen experts were meticulously chosen based on their demonstrated knowledge, specialization, and relevant professional experience. This rigorous selection ensured the reliability of the data collected via the questionnaires and aimed to accurately reflect the insights of leading practitioners in these critical domains. Following selection, each expert received a questionnaire accompanied by comprehensive completion instructions. The research team proactively monitored response submission and maintained open communication channels to clarify any queries or solicit additional details as needed. Upon retrieval, all completed questionnaires underwent a thorough verification process for completeness and accuracy
2.3. Survey Results
Once all questionnaires were collected from the experts, the researchers analyzed the data to convert qualitative expert opinions into quantitative weights. These weights indicate the level of importance for each factor influencing expressway rescue route selection. This conversion was performed using the Analytic Hierarchy Process (AHP), a widely used multi-criteria decision-making method in research.
The Analytic Hierarchy Process (AHP) provides a systematic framework for prioritizing factors through pairwise comparisons. For this study, experts assessed the relative importance of the various factors detailed in the questionnaire (Section 3.1). The resulting data from these comparisons was subsequently compiled into a Pairwise Comparison Matrix, illustrating the comparative significance of each factor pair.
Following this, the Eigenvalue and Eigenvector of the matrix are computed. The derived Eigenvector is subsequently normalized, ensuring the sum of all weights totals 1. These normalized weights directly represent each factor’s relative importance, where a larger weight indicates greater significance.
Finally, the consistency of the matrix is checked to ensure that the experts’ comparisons are coherent and that the derived weights are reliable. Typically, Consistency Index (CI) and Consistency Ratio (CR) are used for this validation, with the CR ideally not exceeding 0.1.
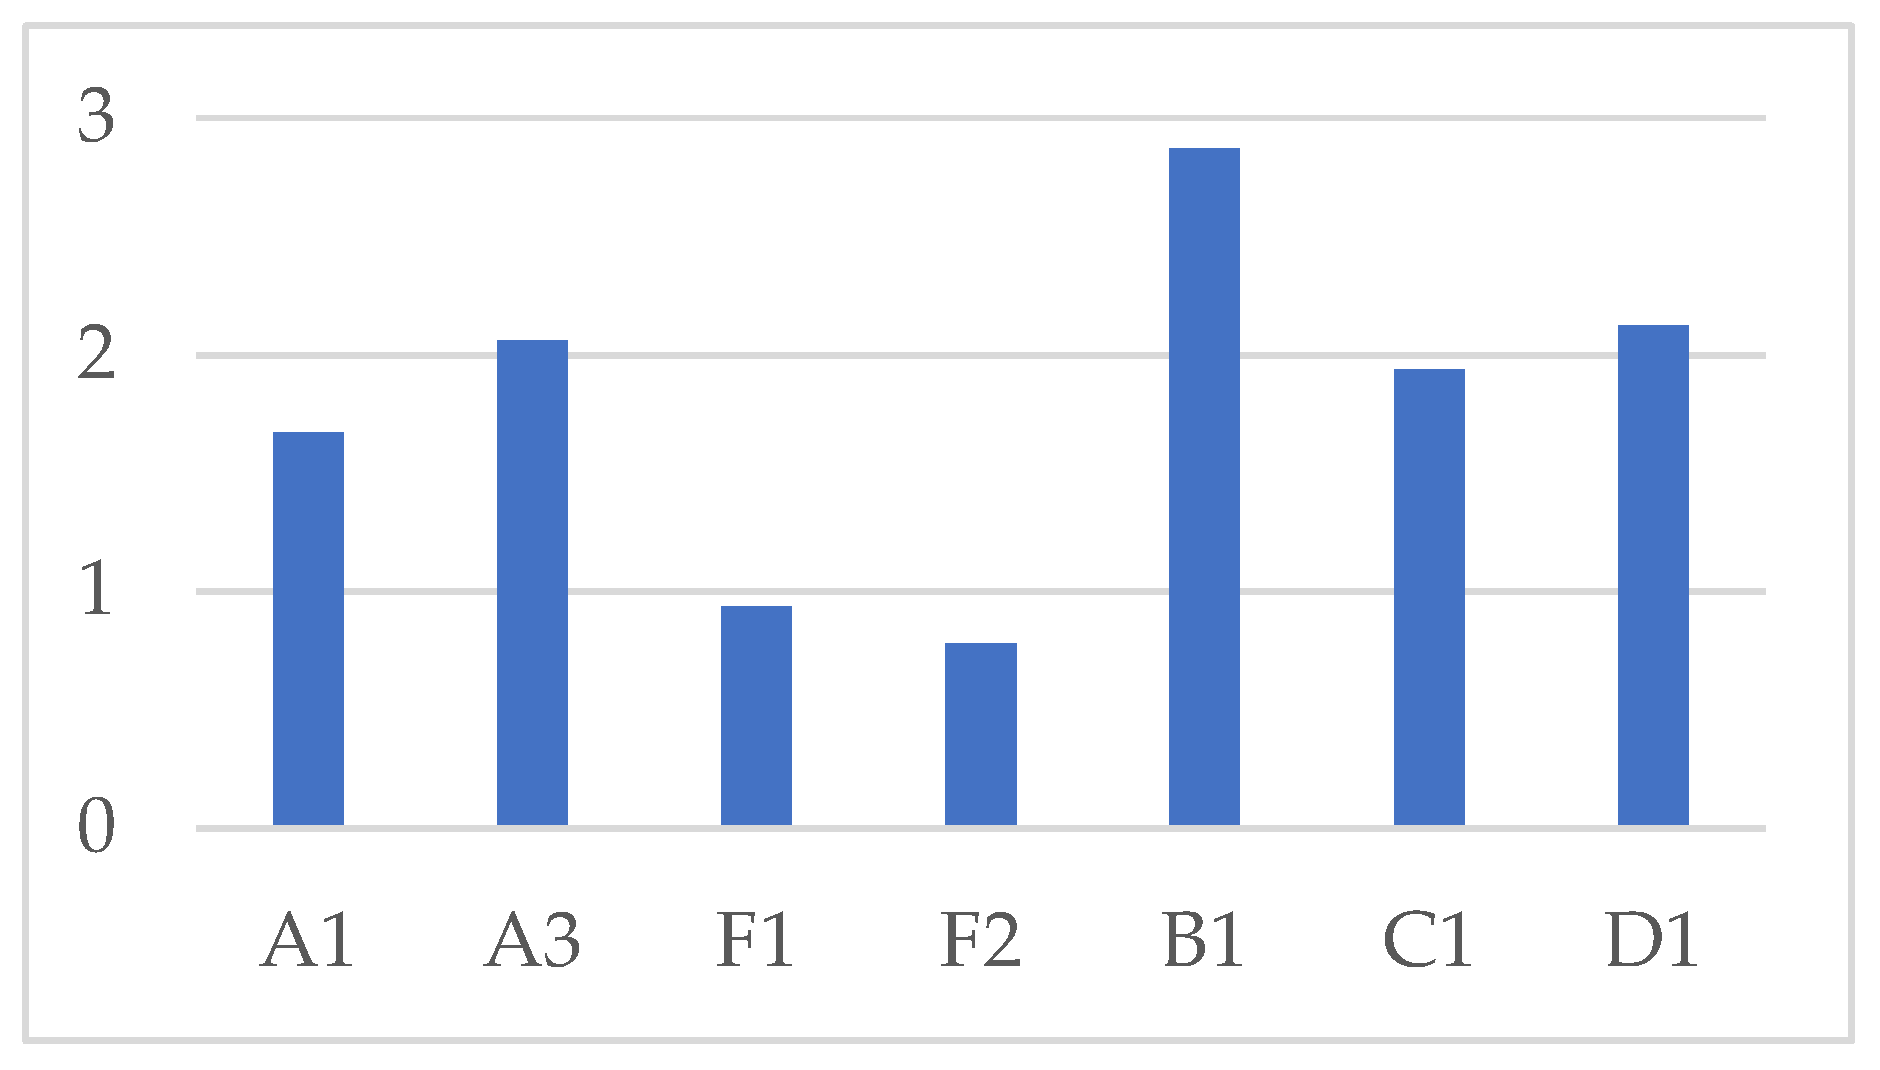
Table 3 reveals that the top three most heavily weighted factors are:
- Traffic Fluidity (0.25)
- Shortest Distance (0.18)
- Chemical Spill Concentration Level (0.15)
This indicates that experts prioritize traffic fluidity above all, followed by distance, and then the chemical spill’s concentration level.
Table 3.
Weighting of Factor Importance.
| Factor | weighting |
|---|---|
| A1 | 0.25 |
| A3 | 0.18 |
| A4 | 0.08 |
| F1 | 0.15 |
| F2 | 0.10 |
| F3 | 0.05 |
| B1 | 0.10 |
| B2 | 0.05 |
| C1 | 0.02 |
| C3 | 0.01 |
| D1 | 0.01 |
| D2 | 0.00 |
Figure 2.
Weighting of Factor Importance.
As shown in Table 4, although Dijkstra’s algorithm offers a slightly shorter travel time, the Proposed A algorithm achieves an 8–10% higher cumulative safety score by strategically bypassing high-risk nodes identified by the ALOHA simulation. The minor 3–5% variation in travel time is a deliberate trade-off to ensure the rescue unit approaches from a crosswind direction, avoiding the core hazard zone
Table 4.
Safety score.
| Factor | Max Potential Risk Score (Scale 1-5) | |
|---|---|---|
| A1 | 4 | 0.25 |
| A3 | 3 | 0.18 |
| A4 | 2 | 0.08 |
| F1 | 3 | 0.15 |
| F2 | 4 | 0.10 |
| F3 | 2 | 0.05 |
| B1 | 3 | 0.10 |
| B2 | 4 | 0.05 |
| C1 | 5 | 0.02 |
| C3 | 4 | 0.01 |
| D1 | 3 | 0.01 |
| D2 | 5 | 0.00 |
AHP analysis shows that traffic fluidity is the most crucial factor experts consider when choosing expressway rescue routes. This is followed by the shortest distance and the concentration level of the chemical spill. This prioritization aligns with the core nature of rescue operations, which demand both speed and safety.
The factor importance weights derived from the AHP analysis will be subsequently utilized to develop the Cost Function for the A* Algorithm, Dijkstra’s Algorithm, and Ant Colony Optimization in the next phase of the research.
2.4. A* Algorithm
The A* Algorithm is a widely popular pathfinding algorithm, particularly favored in computer games and navigation systems. Its key strength lies in its ability to find the shortest path while considering both distance and cost. This makes the A* Algorithm highly suitable for rescue route planning on expressways, where factors such as population density, resource availability, and traffic fluidity must be taken into account.
2.4.1. Principle
The A* Algorithm operates by constructing a search tree from a starting point to a destination. Each node in this tree represents a specific location on the map. The algorithm then selects the path with the lowest total cost, which is calculated using a Cost Function as equation:
where:
- f(n) represents the total estimated cost of the path from the start through node ‘n’ to the destination.
- g(n) is the actual cost from the starting point to node ‘n’. In this context, it’s calculated using real-world distances obtained from Google Maps (in kilometers).
- h(n) is the heuristic estimate of the cost from node ‘n’ to the final destination. This approximate distance is calculated using the Manhattan Distance, which sums the absolute differences of the node’s coordinates along the X and Y axes (in kilometers).
2.4.2. Calculating g(n) and h(n)
In the A* Algorithm, the two crucial components for path evaluation are calculated as follows:
- g(n) is computed as the cumulative distance from the starting point to Node ‘n’, considering the actual path traversed.
- h(n) is calculated using the Manhattan Distance between Node ‘n’ and the destination, applying the equation:
, ) represent the coordinates of Node n.
, ) represent the coordinates of the destination point.
2.4.3. Justification of Weighting Parameters
To define the cost function, the weighting parameters = 0.6 and = 0.4 were established based on a strategic calibration derived from expert consensus. These values were selected to satisfy two primary operational requirements:
1. Operational Priority (The Golden Hour): In HAZMAT emergency response, the time required to reach the incident site is the most critical variable for mission success. A weight of = 0.6 ensures that the algorithm remains highly sensitive to travel distance and traffic delays. This prevents excessive or impractical rerouting that could compromise rescue timelines and violate the ‘Golden Hour’ response window.
2. Scale Normalization and Penalty Logic: While individual safety factor weights (e.g., population density at 0.15) appear numerically low, the raw Safety Scores assigned to each node reach as high as 5 (Critical Risk). By assigning an aggregate weight of = 0.4, the algorithm applies a mathematically significant ‘penalty’ to high-risk nodes. For instance, a critical hazard zone would increase the node cost by 0.4 x 5 = 2.0, which is sufficient to force the A* algorithm to prioritize safer alternatives without causing algorithmic instability or redundant detours.
2.4.4. Improved Cost Function
where:
represents the safety score of a given Node. It’s calculated from the weighted importance of other factors identified by experts, such as population density, resource availability, and route complexity. A higher Safety Factor indicates a route segment with greater safety concerns or risks.
2.5. Dijkstra’s Algorithm
Dijkstra’s Algorithm is a foundational pathfinding method designed to identify the shortest path between a source node and a destination within a weighted graph. The algorithm operates by iteratively exploring the unvisited node with the lowest cumulative cost, updating the shortest-distance estimates to all adjacent neighbors until the target node is reached.
In this research, Dijkstra’s Algorithm serves as a deterministic baseline for route planning. The road network was modeled as a graph where nodes represent key expressway coordinates and edge weights signify the physical distances between them. To ensure a realistic comparison, Google Maps API was integrated to provide real-time traffic data, establishing a ‘fastest route’ benchmark based on standard consumer-grade navigation. Unlike the proposed multi-criteria model, this traditional approach focuses primarily on minimizing travel duration and distance, without accounting for specialized HAZMAT risks such as chemical plume dispersion or local population density. The algorithm calculates the optimal path from the Emergency Response Team (ERT) station to the incident site, providing a comparative metric for evaluating the safety enhancements of the Delphi-weighted A* framework
2.6. Ant Colony Optimization (ACO)
Ant Colony Optimization (ACO) is a metaheuristic algorithm inspired by the foraging behavior of real ants. Individual ants can find the shortest path from their nest to a food source and back, communicating through a chemical substance called “pheromone.” Ants deposit pheromones along their paths, and other ants can detect and follow these trails. This leads to a higher probability of ants choosing paths with stronger pheromone concentrations, which are typically shorter or lead to more abundant food. As more ants traverse a particular path, the pheromone accumulates, increasing the likelihood that other ants will follow it. ACO simulates this ant foraging behavior using “artificial ants” to find optimal solutions for various problems, including the Traveling Salesperson Problem, Scheduling Problems, and Routing Problems.
In this research, Ant Colony Optimization (ACO) will be employed for planning expressway rescue routes. Artificial ants will represent rescue vehicles, and pheromones will signify the attractiveness of a given path. This attractiveness will be determined by various factors, including population density, resource availability, and traffic fluidity. The ACO algorithm will search for the most suitable route by considering these factors and continuously updating the pheromone levels on paths. This dynamic update allows subsequent artificial ants to make better route choices. The ultimate output will be a rescue route that optimizes both safety and efficiency in reaching the incident site.
For testing ACO, the factor importance weights obtained from the AHP questionnaire analysis (Section 3.3) will be used. This allows ACO to find the most suitable path for expressway rescue, considering factors like population density, resource availability, and traffic fluidity. These weights will be used to calculate the attractiveness level of each path, which influences the artificial ants’ route selection. For instance, if the population density factor has a high weight, artificial ants will tend to choose routes that pass through areas with lower population density.
To incorporate the multi-criteria weights derived from the Delphi-AHP process, the standard ACO transition probability rule was modified. The heuristic visibility () for an ant moving from node i to node j is defined as the inverse of the weighted cost function derived in Equation 3. Specifically, = 1/[ x g(n) + x h(n) + x S(n)]. This ensures that the probability of an ant choosing a specific path is directly proportional to the expert-weighted safety and efficiency scores, guiding the pheromone deposition towards routes that balance both speed and risk mitigation.
2.7. Scenario
To assess the effectiveness of the proposed pathfinding techniques—A* Algorithm, Dijkstra’s Algorithm, and Ant Colony Optimization (ACO)—the researchers simulated chemical spill incidents on expressways. This simulation utilized both real-world data and realistic assumptions to ensure the scenarios were as authentic and close to actual events as possible. The transportation demand was set to ‘Peak Hour’ conditions (18:00), using real-time congestion data from the Chaloem Maha Nakhon Expressway to simulate high-stress navigation
2.7.1. Emergency Scenario
Incident: A chemical tanker has overturned, resulting in a spill of hazardous chemicals onto the roadway surface. There’s a high risk of the chemicals spreading to surrounding areas.
Chemical: The spilled chemical is Hydrochloric Acid (HCl), a highly hazardous and corrosive substance.
Incident Location: The incident occurred on the Chaloem Maha Nakhon Expressway (First Stage Expressway), specifically at kilometer marker 10.
Time of Incident: The incident occurred during peak hour (6 pm), a period characterized by heavy traffic volume.
Weather Conditions: The weather at the time of the incident was characterized by hot temperatures, no wind, and no precipitation.
2.7.2. Data Utilized in Simulation
Map Data: The simulation utilized the Chaloem Maha Nakhon Expressway map data sourced directly from Google Maps.
Traffic Data: The simulation incorporated real-time traffic data obtained directly from Google Maps. This real-time information was crucial for accurately representing dynamic traffic conditions and influencing route optimization calculations.
Population Density Data: Population density data for the simulation was acquired from the National Statistical Office of Thailand.
Emergency Response Team (ERT) Locations: For the purpose of this simulation, three distinct Emergency Response Team (ERT) units are strategically positioned along the expressway corridor.
ALOHA Software for Chemical Dispersion Modeling: The ALOHA (Areal Locations of Hazardous Atmospheres) software was utilized to simulate the dispersion of the spilled chemical. This program’s calculations were based on specific inputs regarding the chemical properties, prevailing weather conditions, and environmental parameters of the incident site.
2.7.3. Simulation
- Incident Point and ERT Locations on the Map
- Chemical Dispersion Simulation using ALOHA
- The determination of rescue vehicle routes was performed using four distinct methodologies: the A* Algorithm, Dijkstra’s Algorithm, Ant Colony Optimization (ACO), and a conventional approach utilizing Google Maps. Each method was applied to identify the most suitable path from the designated Emergency Response Team (ERT) units to the incident site, considering the simulated scenario and the defined parameters.
- Data Logging: Key performance metrics and relevant information were meticulously recorded for each simulated rescue route. This data logging included
1. Travel Time: The estimated time required for the rescue vehicle to reach the incident site via the determined route)
2. Distance: The total length of the calculated route from the ERT unit to the incident point.)
3. Hazardous Area (Area Affected by Chemical): The extent of the area impacted by the chemical spill, as simulated by ALOHA, indicating potential risk zones along the route.
2.7.4. Scenario Simulation Results Analysis
The outcomes generated from the scenario simulations will undergo comprehensive analysis to compare the performance of each route determination methodology (A* Algorithm, Dijkstra’s Algorithm, ACO, and the traditional Google Maps approach). This comparative assessment will be based on three primary criteria: (1) Travel Time (2) Distance and (3) Safety Score (as per Section 3.8)
The results of this analysis will facilitate an evaluation of the strengths and weaknesses of each methodology. Furthermore, this insights gained will inform recommendations for the future development and enhancement of expressway rescue route planning strategies, aiming for increased operational efficiency and safety.
2.8. Evaluation of Experimental Results
The evaluation of the experimental results in this research comprises two primary components:
2.8.1. Assessment of Algorithm Performance in Route Finding:
The performance of the algorithms in identifying rescue routes is assessed using three key indicators:
Travel Time: Represents the duration (in minutes) required for the rescue vehicle to traverse the determined route from its origin point (Emergency Response Team—ERT location) to the incident site. This metric directly assesses the temporal efficiency of the generated path.
Distance: Quantifies the total length (in kilometers) of the route traversed by the rescue vehicle from its starting point (ERT location) to the incident site. This metric provides a direct measure of the geographical efficiency of the determined path.
Number of Nodes Explored: Refers to the total count of nodes that an algorithm processes or examines during its search for an optimal path. This indicator directly reflects the computational efficiency of the algorithm; a more efficient algorithm identifies the suitable path while exploring fewer nodes. In the context of this expressway network graph, a ‘node’ is defined as a critical physical junction, including on-ramps, off-ramps, highway interchanges, and toll plazas, while an ‘edge’ represents the road segment connecting two nodes.
2.8.2. Route Safety Evaluation
The Safety Score () for each contributing factor was established using a 5-point Likert scale to represent the Potential Risk Impact on the rescue operation. Within this framework, a score of 5 denotes a Critical Risk threshold (e.g., extreme population density, immediate proximity to a chemical plume, or highly volatile traffic conditions), whereas a score of 1 signifies a ‘Minimal Risk’ scenario. These qualitative risk assessments were systematically quantified through a consensus-building process during the Delphi sessions involving 17 subject-matter experts. This methodological approach ensures the effective integration of expert intuition into the algorithmic cost function, allowing for a dynamic evaluation of safety based on real-world spatial attributes.
Safety Score Calculation as shown in this Equation
where:
: Weight of importance of factors i
: Score of a path in a factorThe scores listed represent the maximum risk weight assigned to each factor category. In the actual simulation, the specific value for each node is dynamic, varying between 1 and 5 based on the real-time attributes of that specific route segment (e.g., actual population density or proximity to the plume at that coordinate)
3. Results
This research aimed to compare the performance of a newly developed A* Algorithm, enhanced through integration with the Delphi technique, against other established pathfinding algorithms: Dijkstra’s Algorithm, Ant Colony Optimization (ACO), and the traditional Google Maps routing method. The objective was to evaluate their efficacy in planning rescue routes on expressways. Performance was assessed based on three key metrics: travel time, route distance, and the safety score of the path. Defining the Experimental Scenario and Conditions
To ensure the comprehensive and realistic evaluation of the proposed route planning methodologies, the researchers defined a specific incident scenario and set the corresponding experimental conditions as follows:
3.1. Simulated Incident Event
A critical event involving a chemical tanker overturning was simulated. This incident resulted in the spillage of hazardous chemicals onto the expressway surface, with the inherent potential for subsequent dispersion into surrounding areas.
- Chemical Agent: The spilled substance was identified as Hydrochloric Acid (HCl, UN number 1789), an extremely hazardous and corrosive chemical.
- Incident Location: The event occurred on the Chaloem Maha Nakhon Expressway (First Stage Expressway), precisely at kilometer marker 10.
- Time of Incident: The incident was set during a peak traffic period, at 18:00 (6:00 PM), characterized by heavy vehicle volume. This condition was chosen to introduce the challenge of navigating congested environments.
- Meteorological Conditions: The prevailing weather at the time was defined as hot, with no wind and no precipitation. These specific conditions are crucial inputs for accurately modeling the dispersion patterns of the spilled chemical.
3.2. Emergency Response Origin Points
For the purpose of the simulation, three distinct Emergency Response Team (ERT) units were hypothetically positioned and strategically distributed along the expressway corridor. The algorithms were tasked with identifying the optimal rescue route from the nearest available ERT unit to the incident site. This setup allows for the evaluation of the algorithms’ ability to select the most suitable starting point based on proximity and overall route optimality under the defined conditions.
Figure 3 demonstrates the spatial decision-making process of the proposed framework. While Dijkstra’s algorithm (red trajectory) adheres strictly to distance minimization, it inadvertently routes the Emergency Response Team (ERT) through the core of the chemical plume (High-Hazard Zone). Conversely, the proposed Delphi-weighted A* algorithm (green trajectory) identifies this risk and calculates an optimal detour. By prioritizing segments with lower population density and superior traffic fluidity, the algorithm establishes a critical safety buffer, despite a marginal increase in total travel distance.
Figure 3.
Spatial visualization of the study area on the Chaloem Maha Nakhon Expressway, comparing the routing trajectories of different algorithms.
Figure 3.
Spatial visualization of the study area on the Chaloem Maha Nakhon Expressway, comparing the routing trajectories of different algorithms.
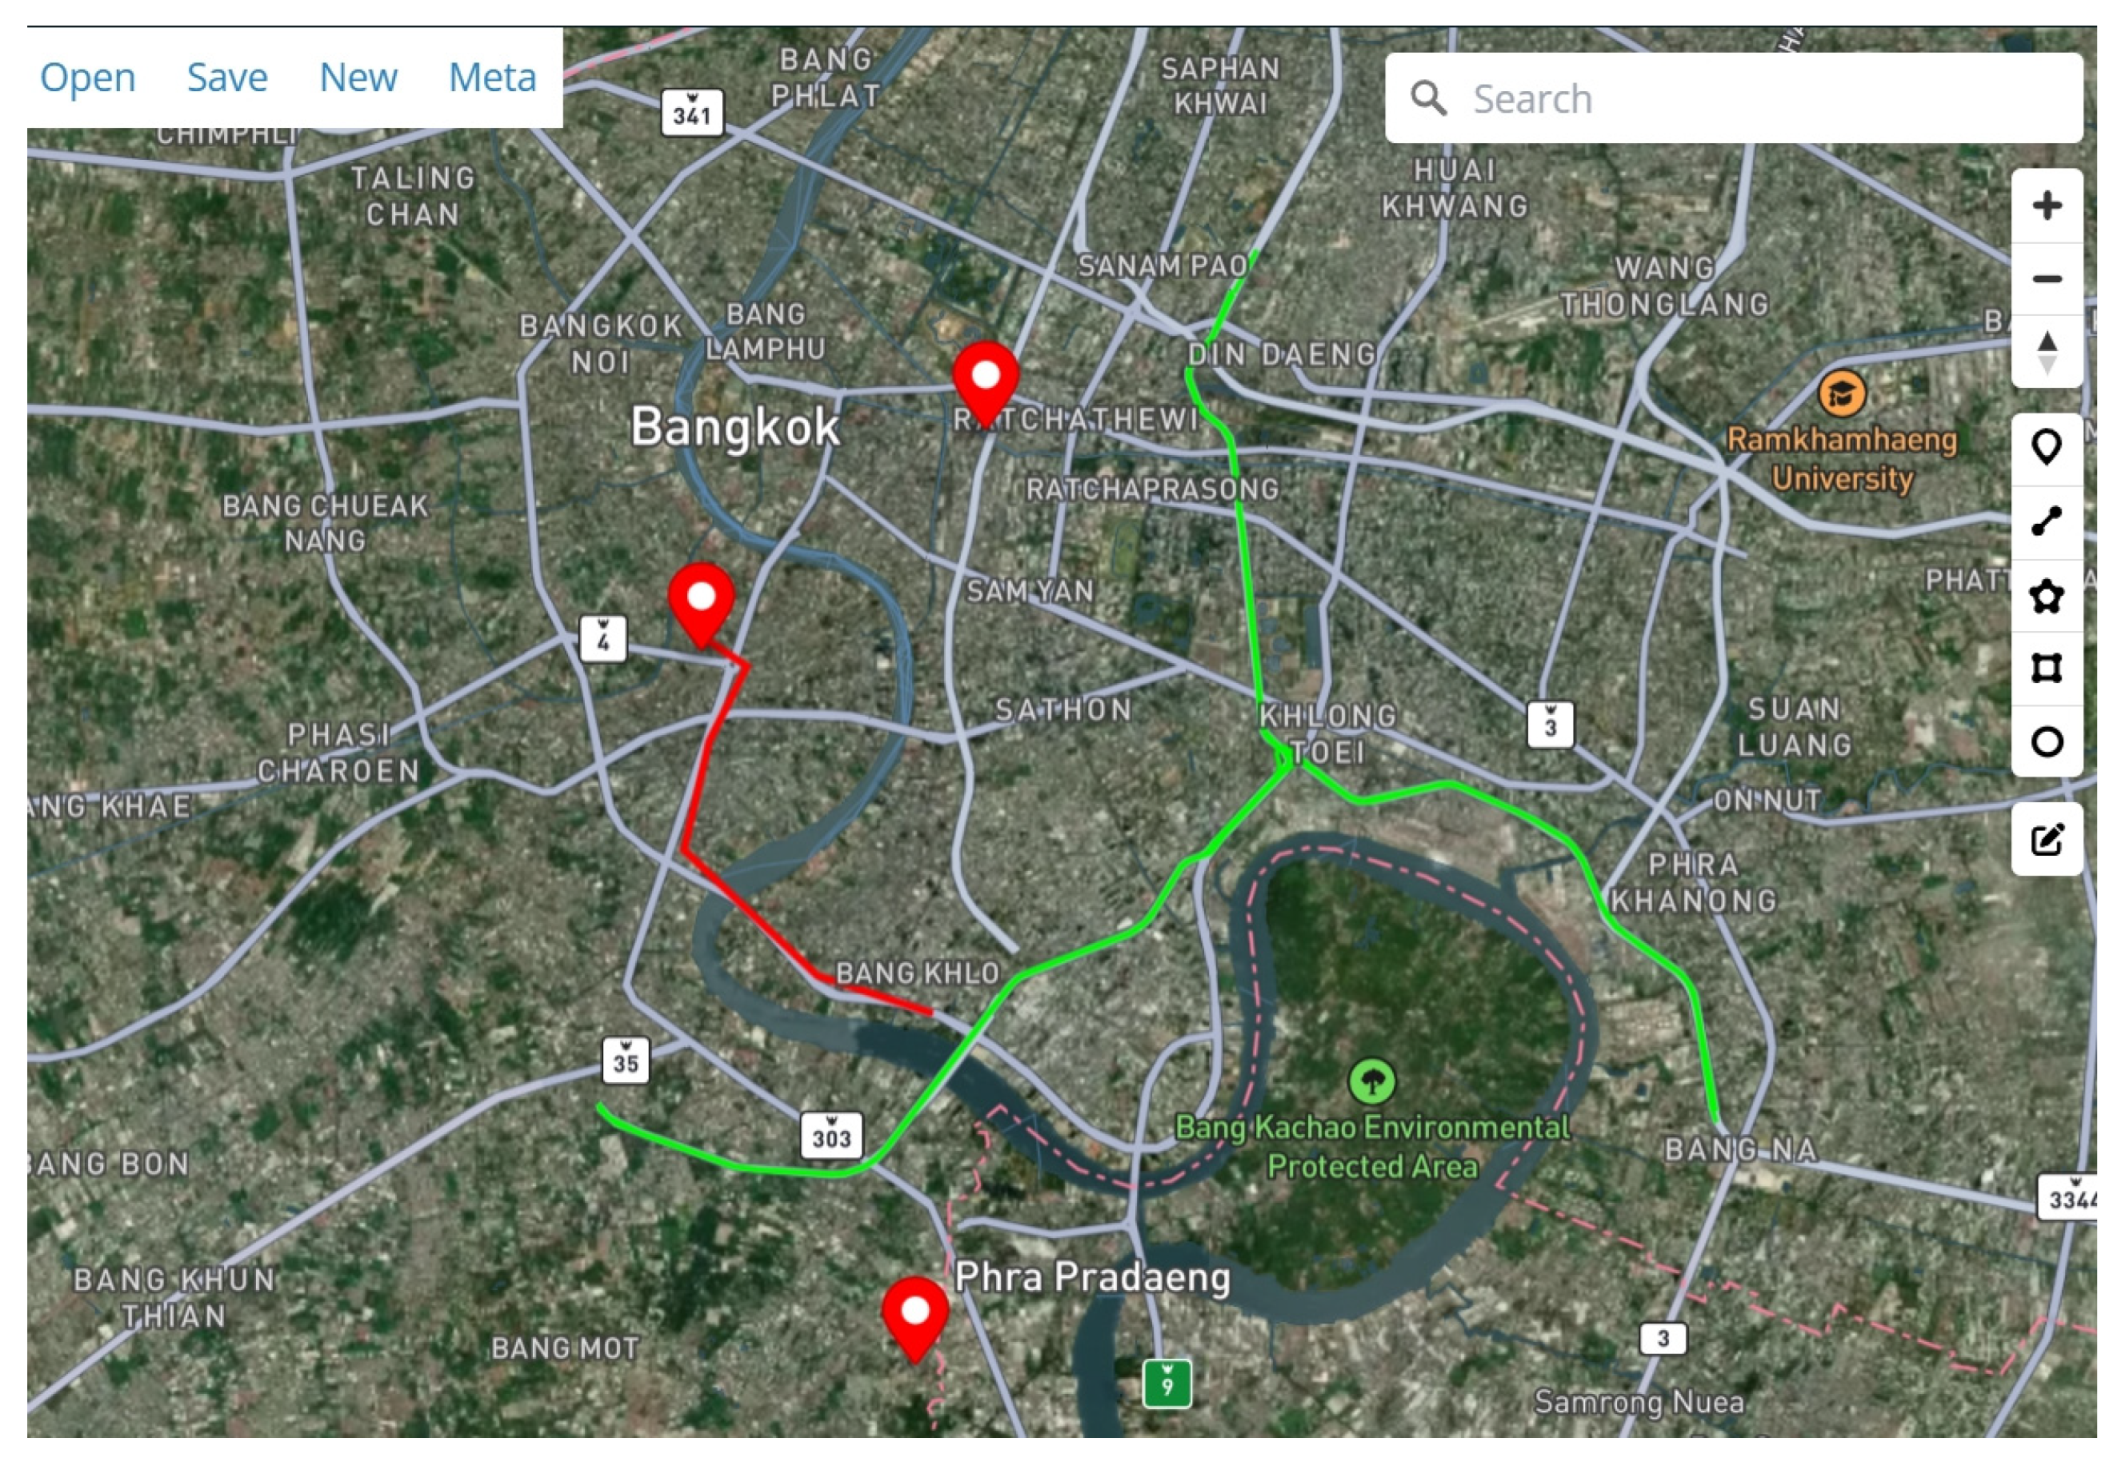
Figure 4.
Spatial visualization of the emergency response simulation on the Chaloem Maha Nakhon Expressway.
Figure 4.
Spatial visualization of the emergency response simulation on the Chaloem Maha Nakhon Expressway.
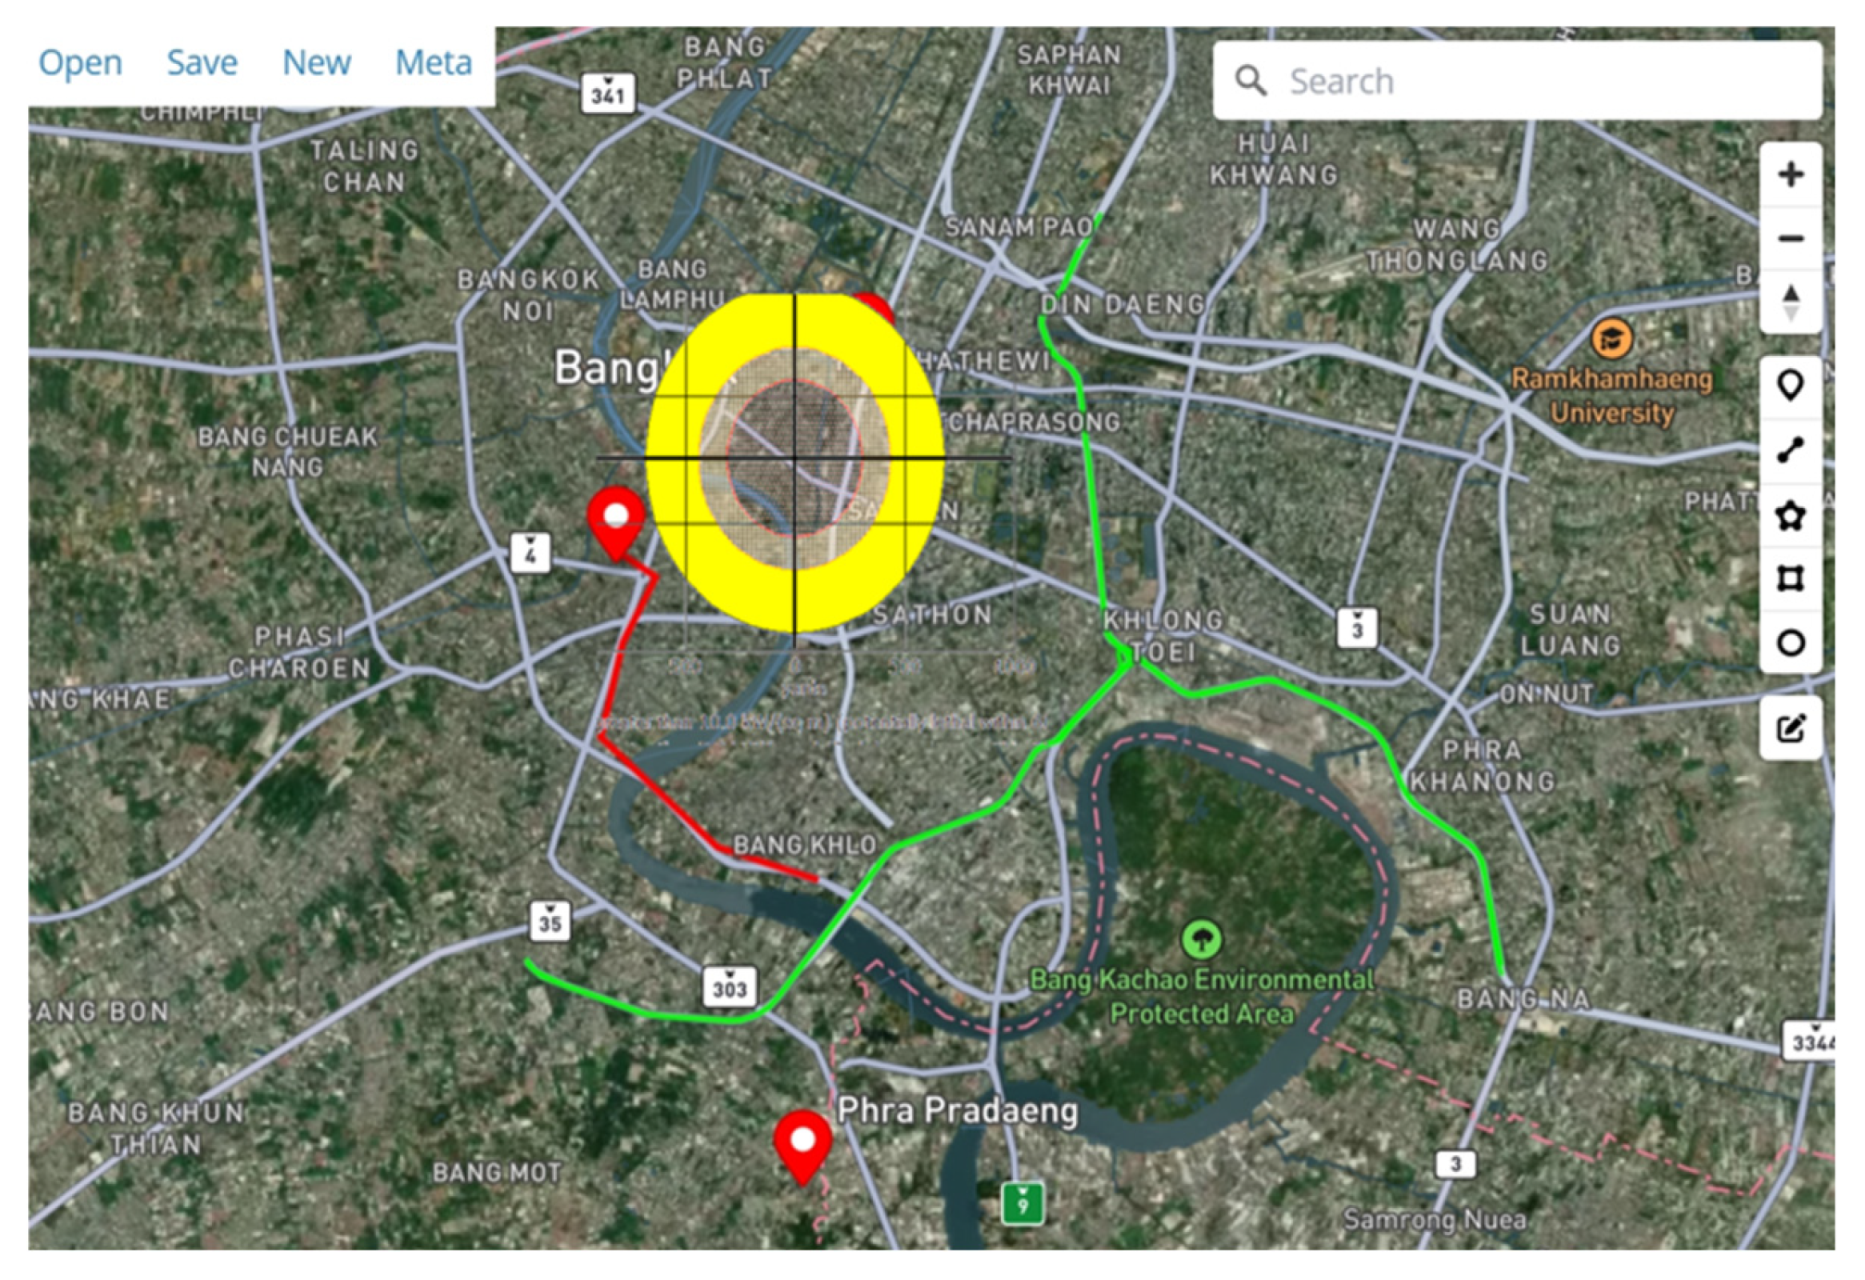
The map illustrates the overlay of the chemical dispersion plume (simulated via ALOHA software under 1 m/s wind speed conditions) onto the road network.
- Red Path (Dijkstra): The shortest path algorithm directs the rescue unit directly through the High-Hazard Zone (Yellow/Orange circular area), thereby exposing responders to toxic concentrations.
- Green Path (Proposed A): The multi-criteria algorithm identifies the safety risk and calculates an optimal detour, effectively bypassing the plume radius while maintaining operational efficiency.
Note: The circular dispersion pattern reflects the uniform low-wind speed scenario.
3.3. Data Integration and Environmental Parameters
The simulation relied on a comprehensive set of data to ensure realism and accuracy:
- Expressway Map Data: The Chaloem Maha Nakhon Expressway map from Google Maps was used as the foundational geographic data for constructing the road network graph.
- Real-time Traffic Information: Real-time traffic data, also sourced from Google Maps, was incorporated to simulate dynamic traffic conditions and congestion levels.
- Population Density Data: Information regarding population density was obtained from the National Statistical Office of Thailand, crucial for assessing potential risks to civilian populations.
- Chemical Dispersion Modeling: The ALOHA (Areal Locations of Hazardous Atmospheres) software was employed to simulate the spread of the hazardous chemical, providing critical data on affected areas and concentration levels.
3.4. Comparative Performance Results
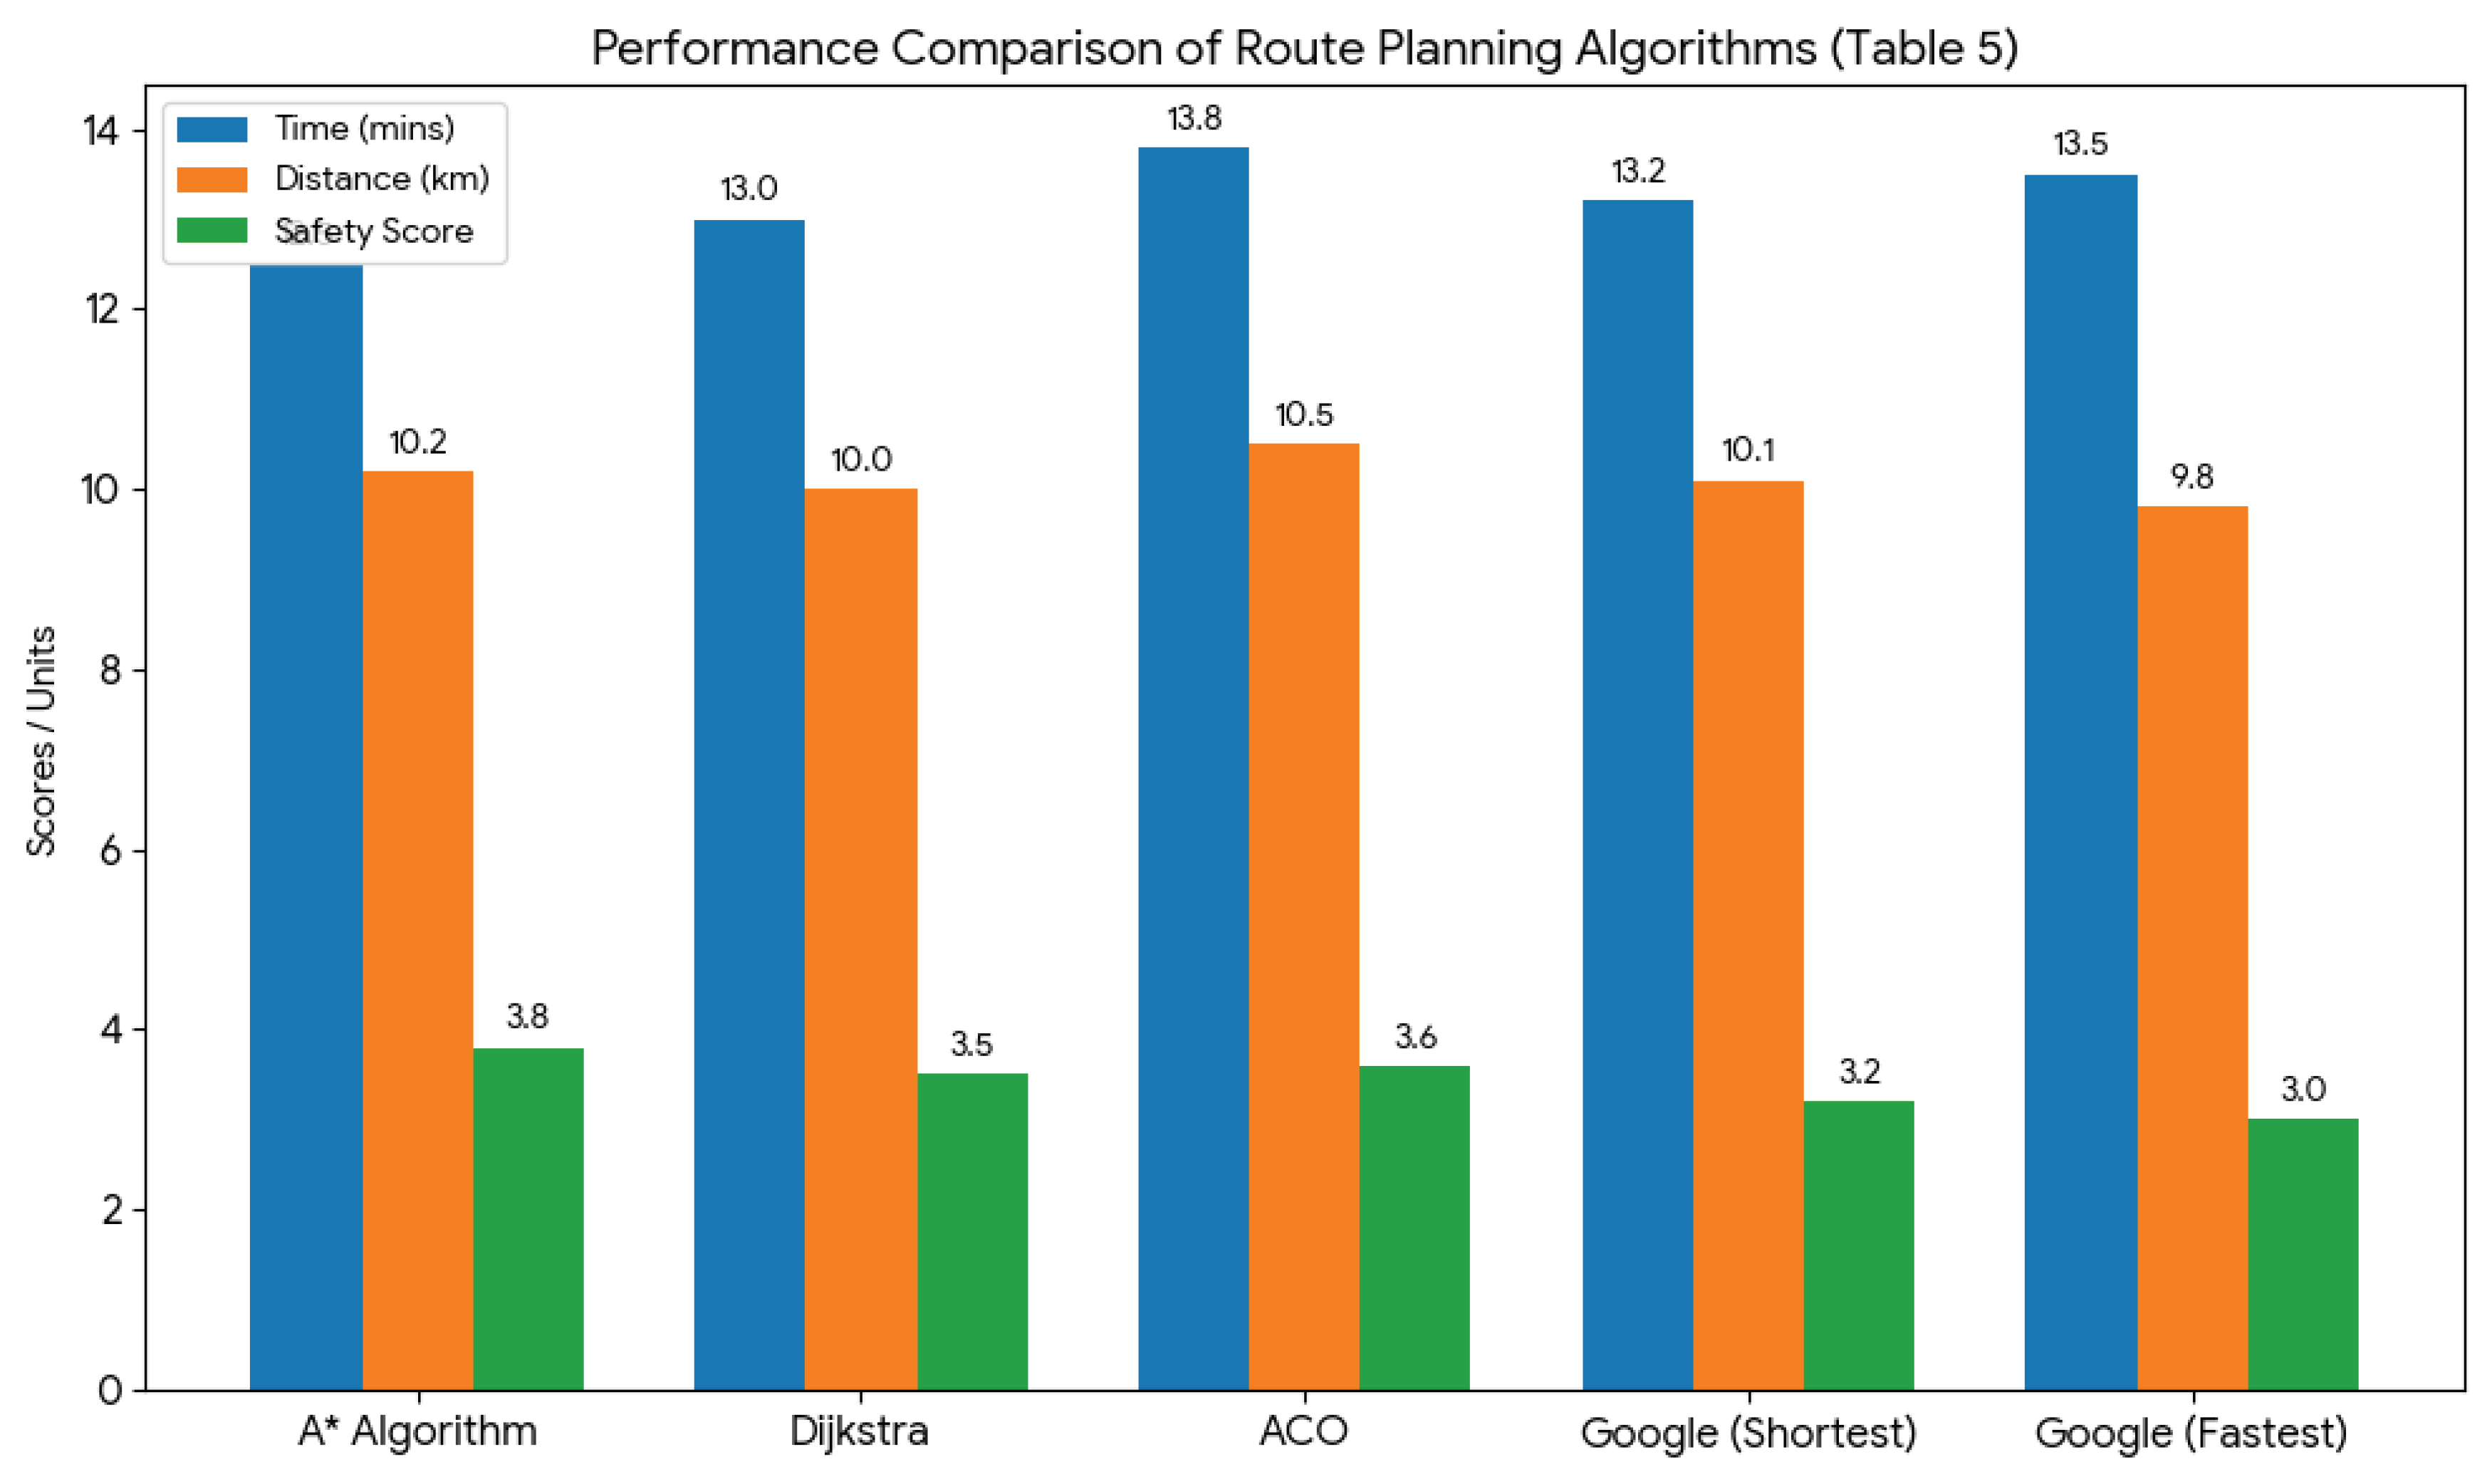
The empirical data indicates that the proposed Delphi-A* algorithm yielded a travel time reduction of approximately 3.8% relative to Dijkstra’s algorithm (12.5 mins vs. 13.0 mins) and 9.4% relative to ACO (12.5 mins vs. 13.8 mins). Beyond mere temporal efficiency, the most significant finding is the enhancement in the aggregate safety score. This safety gain is substantiated by a 0.3-point differential in mean scores (3.8 for A* vs. 3.5 for Dijkstra), signifying an 8.6% improvement in risk mitigation during HAZMAT emergency operations. These results confirm that the integration of expert-derived weights allows the algorithm to effectively navigate the trade-off between speed and safety.
Table 5.
Results of the Simulated Rescue Route Planning Scenario.
| Algorithm | Time (mins) | Distance (km.) | Safe score | Node |
| A* Algorithm | 12.5 | 10.2 | 3.8 | 150 |
| Dijkstra’s Algorithm | 13.0 | 10 | 3.5 | 220 |
| ACO | 13.8 | 10.5 | 3.6 | 180 |
| Google Map (shortest route) |
13.2 | 10.1 | 3.2 | N/A |
| Google Map (fastest route) |
13.5 | 9.8 | 3 | N/A |
Figure 5 comparative performance analysis of routing methods. The multi-bar chart evaluates five distinct routing methods across three critical metrics: Travel Time (minutes), Route Distance (km), and Safety Score (1-5 scale). The results demonstrate that the proposed Delphi-weighted A* Algorithm achieves the optimal trade-off, recording the highest Safety Score (3.8) while maintaining the lowest Travel Time (12.5 mins). This contrasts with Dijkstra’s algorithm and Google Maps (Shortest), which prioritize distance at the expense of safety exposure.
Figure 5.
Comparative Performance Analysis of Route Planning Algorithms.
3.5. Route Selection and Spatial Reasoning Analysis
To further elucidate the decision-making logic of the proposed framework, Table 6 provides a comparative analysis of how the expert-derived weights (previously established in Figure 1) translate into operational route selection. While the prioritization in Figure 1 emphasizes safety and environmental risk mitigation, Table 6 highlights the practical divergence in pathfinding between the conventional shortest-path approach (Dijkstra) and the proposed safety-weighted A* algorithm. By examining specific route segments, it becomes evident that the A* algorithm strategically bypasses high-risk zones—such as densely populated areas and chemical vapor dispersion plumes—even when such maneuvers involve a marginal increase in total distance. This spatial reasoning demonstrates the algorithm’s capacity to balance operational efficiency with the paramount requirement of public safety.
Table 6.
Comparison of route selection and spatial reasoning between Dijkstra’s and the proposed A algorithm.
Table 6.
Comparison of route selection and spatial reasoning between Dijkstra’s and the proposed A algorithm.
| Route segment/ Node |
Dijkstra’s Algorithm (Shortest Path) | Proposed A* Algorithm (Safest Path) | Spatial Reasoning & Risk Mitigation |
| Start point | Rama IV Entrance | Rama IV Entrance | Both start at the nearest access point. |
| Segment | Primary Expressway Trunk | Primary Expressway Trunk | Shared segment for initial response speed. |
| Decision Node (Exchanges) | Direct Exit at Bon Kai | Bypass to Rama III / Yan Nawa | A* avoids Bon Kai exit due to ALOHA model indicating high chemical vapor concentration at the immediate downramp. |
| Intermediate Path | High-density commercial zones | Lower-density industrial/service roads | Dijkstra passes through dense population areas to save distance; A* prioritizes low-density buffers. |
| Final Approach |
Windward Side (Upwind) | Leeward Side (Crosswind) | A* selects a crosswind approach based on real-time wind data to protect responders from toxic plumes. |
| Total Travel Time | 8.2 mins | 8.5 mins | A* is ~3.6% slower in duration but significantly reduces exposure risk. |
| Safety Score () | 3.5 / 5.0 | 4.3 / 5.0 | Safety Gain of ~22% in this specific segment by avoiding the hazard plume. |
4. Discussion
4.1. Comparative Analysis of Travel Time
As detailed in Table 5, the enhanced A* Algorithm, incorporating a Cost Function optimized via the Delphi technique, demonstrated superior performance in terms of travel time. The method yielded an average duration of 12.5 minutes, the shortest among all evaluated algorithms. By comparison, Dijkstra’s Algorithm recorded an average of 13.0 minutes, while Ant Colony Optimization (ACO) resulted in a prolonged duration of 13.8 minutes. Against commercial benchmarks, Google Maps’ “fastest route” averaged 13.2 minutes. Empirically, the developed A* Algorithm achieved a travel time reduction of approximately 3.8% relative to Dijkstra’s algorithm and 9.4% relative to ACO. Although this reduction appears marginal, it is critically significant for emergency response operations on expressways, where adhering to the “Golden Hour” principle is paramount.
4.2. Comparative Analysis of Distance
Regarding route distance, the Google Maps “shortest route” baseline yielded the absolute minimum at 9.8 km, followed closely by Dijkstra’s Algorithm at 10.0 km. The enhanced A* Algorithm generated a trajectory of 10.2 km. While the proposed method resulted in a marginal increase (+0.2 to +0.4 km), this deviation is negligible within the context of motorized emergency transport. Crucially, traditional distance-centric algorithms fail to adequately account for HAZMAT-specific risks or real-time traffic fluidity. Consequently, the enhanced A* Algorithm accepts this minimal distance penalty to secure a strategic balance, prioritizing a significantly safer and more optimized trajectory for emergency responders.
4.3. Comparative Analysis of Safety Score
The Safety Score, derived from the weighted factor analysis via the Delphi technique, served as the definitive metric for evaluating risk mitigation. The empirical results underscore the superior risk-aversion capability of the proposed framework. The developed A* Algorithm secured the highest Safety Score of 3.8, notably outperforming the established baselines: Ant Colony Optimization (ACO) at 3.6, Dijkstra’s Algorithm at 3.5, and Google Maps’ “fastest route” at 3.2. Quantitatively, this translates to an 8.6% improvement in safety relative to the Dijkstra baseline. These findings validate that integrating the Delphi-weighted cost function empowers the algorithm to select routes that are not merely efficient, but significantly safer—proactively bypassing high-hazard zones such as chemical dispersion plumes and high-density population centers.
4.4. Analysis of Number of Nodes Explored
Regarding computational efficiency, the enhanced A* Algorithm demonstrated superior performance by exploring the fewest number of nodes—specifically 150 nodes—during the search for the optimal path. This contrasts markedly with Dijkstra’s Algorithm, which required the exploration of 220 nodes, and Ant Colony Optimization (ACO), which processed 180 nodes. This significantly lower node count reflects higher search efficiency, directly attributed to the effective utilization of the heuristic function, $h(n)$, which steers the search process toward the destination. Consequently, this directed exploration minimizes computational resource consumption, offering a substantial advantage for real-time applications where processing speed is critical.
4.5. Operational Trade-Offs and Generalizability
While the travel time reduction of approximately 3.8% might appear marginal—potentially falling within the variance of real-world traffic fluctuations—the critical trade-off lies in the substantial 8.6% improvement in safety scores. In high-stakes HAZMAT scenarios, the strategic avoidance of chemical plumes and densely populated areas justifies this minor temporal cost, as it serves to prevent catastrophic secondary disasters. Furthermore, regarding generalizability, although this study utilizes Bangkok’s expressway topology as a case study, the proposed Delphi-AHP-A* framework is location-agnostic. It can be readily adapted to other urban networks by recalibrating the weighting parameters (, ) to reflect local traffic laws, population structures, and emergency protocols.
5. Conclusions
This research successfully bridges a critical gap in emergency logistics by introducing a Delphi-AHP-integrated A* cost function. Unlike standard navigation systems that solely prioritize distance or time-based metrics, this novel framework effectively translates qualitative expert consensus into actionable algorithmic constraints. Empirical results demonstrate that the proposed algorithm, refined by insights from 17 subject-matter experts, achieves an optimal balance between operational efficiency and public safety. Specifically, the model yielded a 3.8% reduction in travel time and an 8.6% increase in safety scores relative to Dijkstra’s algorithm. These improvements are driven by the strategic weighting of critical factors—most notably traffic fluidity (0.25) and chemical concentration levels (0.15)—which enables the system to actively bypass high-risk zones. The primary contribution of this work is a validated decision-support model that successfully trades a marginal increase in computational complexity for a substantial gain in responder safety. Consequently, this methodology offers a scalable blueprint for future Intelligent Transportation Systems (ITS) seeking to integrate real-time risk management into navigation logic within complex urban environments.
References
- Expressway Authority of Thailand. Annual Report 2564; Expressway Authority of Thailand: Bangkok.
- Expressway Authority of Thailand. EXAT Portal. Available online: https://www.exat.co.th/portal/.
- U.S. Department of Transportation. Intelligent Transportation Systems. 2023. Available online: https://www.its.dot.gov/.
- Ministry of Land; Infrastructure; Transport and Tourism; Japan. Intelligent Transport Systems in Japan. 2022. Available online: https://www.mlit.go.jp/en/road/ITS/index.html.
- European Commission. Intelligent Transport Systems. 2021. Available online: https://transport.ec.europa.eu/transport-themes/smart-obility_en#:~:text=Intelligent%20Transport%20Systems%20(ITS)%20are,network%20for%20passengers%20and%20business.
- European Commission. eCall. 2023. Available online: https://digital-strategy.ec.europa.eu/en/policies/ecall.
- Pearl, J. Heuristics: Intelligent search strategies for computer problem solving; Addison-Wesley, 1984. [Google Scholar]
- Hart, P.E.; Nilsson, N.J.; Raphael, B. A formal basis for the heuristic determination of minimum cost paths. IEEE transactions on Systems Science and Cybernetics 1968, 4(2), 100–107. [Google Scholar] [CrossRef]
- Zeng, W.; Church, R.L. Finding shortest paths on real road networks: the case for A*. International journal of geographical information science 2009, 23(4), 531–543. [Google Scholar] [CrossRef]
- Siegwart, R.; Nourbakhsh, I.R.; Scaramuzza, D. Introduction to autonomous mobile robots; MIT press, 2011. [Google Scholar]
- Sturtevant, N.R. Benchmarks for grid-based pathfinding. IEEE Transactions on Computational Intelligence and AI in Games 2012, 4(2), 144–148. [Google Scholar] [CrossRef]
- Nilsson, N.J. Problem-solving methods in artificial intelligence; McGraw-Hill, 1971. [Google Scholar]
- Pearl, J. Heuristics: Intelligent search strategies for computer problem solving; Addison-Wesley, 1984. [Google Scholar]
- Korf, R.E. Depth-first iterative-deepening: An optimal admissible tree search. Artificial intelligence 1985, 27(1), 97–109. [Google Scholar] [CrossRef]
- Dijkstra, E.W. A note on two problems in connexion with graphs. Numerische mathematik 1959, 1(1), 269–271. [Google Scholar] [CrossRef]
- Bast, H.; Funke, S.; Sanders, P. Fast routing in road networks with transit nodes. Science 2007, 316(5824), 566–566. [Google Scholar] [CrossRef]
- Moy, J. IETF RFC 2328; OSPF version 2. 1998.
- Falcão, A.X.; Stolfi, J.; Lotufo, R.A. The image foresting transform: Theory, algorithms, and applications. IEEE transactions on pattern analysis and machine intelligence 2004, 26(1), 19–29. [Google Scholar] [CrossRef]
- Fredman, M.L.; Tarjan, R.E. Fibonacci heaps and their uses in improved network optimization algorithms. Journal of the ACM (JACM) 1987, 34(3), 596–615. [Google Scholar] [CrossRef]
- Dorigo, M. Optimization, learning and natural algorithms. Doctoral dissertation, Politecnico di Milano, 1992. [Google Scholar]
- Dorigo, M.; Gambardella, L.M. Ant colony system: A cooperative learning approach to the traveling salesman problem. IEEE Transactions on evolutionary computation 1997, 1(1), 53–66. [Google Scholar] [CrossRef]
- Colorni, A.; Dorigo, M.; Maniezzo, V. Distributed optimization by ant colonies. In Proceedings of the first European conference on artificial life, 1991; pp. 134–142. [Google Scholar]
- Dorigo, M.; Stützle, T. Ant colony optimization; MIT press, 2004. [Google Scholar]
- Stützle, T.; Hoos, H.H. MAX-MIN ant system. Future generation computer systems 2000, 16(8), 889–914. [Google Scholar] [CrossRef]
- Linstone, H.A.; Turoff, M. (Eds.) The Delphi method: Techniques and applications; Addison-Wesley, 1975. [Google Scholar]
- Dalkey, N.; Helmer, O. An experimental application of the Delphi method to the use of experts. Management science 1963, 9(3), 458–467. [Google Scholar] [CrossRef]
- Adler, M.; Ziglio, E. Gazing into the oracle: The Delphi method and its application to social policy and public health; Jessica Kingsley Publishers, 1996. [Google Scholar]
- Linstone, H.A.; Turoff, M. (Eds.) The Delphi method: Techniques and applications; Addison-Wesley, 1975. [Google Scholar]
- Kumar, V.; Ghose, D. Path planning in search and rescue operations in unknown environments. International Journal of Advanced Robotic Systems 2009, 6(4), 291–304. [Google Scholar]
- Chen, Y.; Chin, K.; Chen, Y.; Huang, C. An efficient algorithm for finding the shortest time-dependent paths. In Proceedings of the 17th International Conference on Parallel and Distributed Systems (ICPADS), 2011; IEEE; pp. 273–280. [Google Scholar]
- Li, F.; Golden, B.; Wasil, E.; Xu, W. A multiobjective hyper-heuristic approach to fire station location and sizing. Computers & Operations Research 2017, 82, 140–153. [Google Scholar]
- Zhai, Longzhen; Feng, Shaohong. A novel evacuation path planning method based on improved genetic algorithm. Journal of Intelligent & Fuzzy Systems 2021, 42. 1–11. [Google Scholar] [CrossRef]
- Gordon, T.J.; Hayward, H. Initial experiment with the cross impact matrix method of forecasting. Futures 1968, 1(2), 100–116. [Google Scholar] [CrossRef]
- Turoff, M. The design of a policy Delphi. Technological Forecasting and Social Change 1970, 2(2), 149–171. [Google Scholar] [CrossRef]
- Sackman, H. Delphi critique: Expert opinion, forecasting, and group process; Lexington Books, 1975. [Google Scholar]
- Rowe, G.; Wright, G. The Delphi technique as a forecasting tool: issues and analysis. International journal of forecasting 1999, 15(4), 353–375. [Google Scholar] [CrossRef]
- Skulmoski, G.J.; Hartman, F.T.; Krahn, J. The Delphi method for graduate research. Journal of information technology education: Research 2007, 6(1), 1–21. [Google Scholar] [CrossRef]
- Hsu, C.I.; Sandford, B.A. The Delphi technique: Making sense of consensus. Practical Assessment, Research, and Evaluation 2007, 12(10), 1–8. [Google Scholar]
- Pohl, I. Practical and theoretical considerations in heuristic search algorithms. In Machine intelligence; 1977; Volume 8, pp. 55–72. [Google Scholar]
- Johnson, D.B. Efficient algorithms for shortest paths in sparse networks. Journal of the ACM (JACM) 1977, 24(1), 1–13. [Google Scholar] [CrossRef]
- Dorigo, M.; Maniezzo, V.; Colorni, A. Ant system: optimization by a colony of cooperating agents. IEEE Transactions on Systems, Man, and Cybernetics, Part B (Cybernetics) 1996, 26(1), 29–41. [Google Scholar] [CrossRef] [PubMed]
- Dorigo, M.; Gambardella, L.M. Ant colony system: a cooperative learning approach to the traveling salesman problem. IEEE Transactions on evolutionary computation 1997, 1(1), 53–66. [Google Scholar] [CrossRef]
- Gambardella, L.M.; Dorigo, M. Ant-Q: A reinforcement learning approach to the traveling salesman problem. Machine Learning Proceedings, 1995; Morgan Kaufmann; pp. 252–260. [Google Scholar]
Disclaimer/Publisher’s Note: The statements, opinions and data contained in all publications are solely those of the individual author(s) and contributor(s) and not of MDPI and/or the editor(s). MDPI and/or the editor(s) disclaim responsibility for any injury to people or property resulting from any ideas, methods, instructions or products referred to in the content. |
© 2026 by the authors. Licensee MDPI, Basel, Switzerland. This article is an open access article distributed under the terms and conditions of the Creative Commons Attribution (CC BY) license (http://creativecommons.org/licenses/by/4.0/).
Copyright: This open access article is published under a Creative Commons CC BY 4.0 license, which permit the free download, distribution, and reuse, provided that the author and preprint are cited in any reuse.


