Submitted:
22 January 2026
Posted:
03 February 2026
You are already at the latest version
Abstract
This study aimed to identify the structural relationships of corporate governance within an accredited public university, as its assessment remains unexplored and its polysemic nature gives rise to disagreements over measurement criteria. Moreover, no studies have simultaneously analysed the most common constructs comprising its dimensions using a measurement scale within a structural equation framework and partial least squares as a reflective model. The novelty lies in developing a model in which the measures reflect the effects of corporate governance as the main construct, with variables grounded in the new institutionalism, stakeholder theory, and the resource-based view. Methodologically, deductive reasoning was employed, drawing on relevant theoretical considerations and metrics, utilising SmartPLS software, version 4.1.0.9. The confirmed hypotheses indicate that the governance of an accredited public university can be assessed through four constructs: administrative process, university autonomy, stakeholders, and accountability system.
Keywords:
corporate governance
; public higher education
; structural equation modelling
; PLS-SEM
; reflective measurement
1. Introduction
From the perspective of Aversano [1], corporate governance (CG) assessment is a field that is being explored in accredited public higher education institutions (APHEIs) through collaborative efforts. There is a growing interest in monitoring the dimensions of CG in such organisations [2], measured from different perspectives, becoming dynamic and multidimensional [3]. In the specialised literature, studies that evaluate KM move in planning and accountability [4] with different latent and observable variables derived from the polysemy of the concept [5]. Therefore, it follows that CG should be assessed through sequential and complementary constructs that include indicators not only of management efficiency but also of the strategic vision of the university's role in society exercised with autonomy and responsibility [6], empowered by stakeholders [7] and monitored through accountability [8].
Generally, the constructs assessed in CG in higher education institutions can be located in the dynamic interaction between institutional governance and strategic management [9]. Thus, for the assessment of CG, first-order constructs may include (i) the administrative process [10]; (ii) university autonomy [11]; (iii) stakeholders [12]; and (iv) the accountability system [13]. The first contains planning, organisation, direction, and control [14]. The second involves organisational, academic, and financial autonomy [15]. The third comprises partition and representation [16]. Finally, the fourth integrates accountability mechanisms [17], responsibility, and transparency [18]. Consequently, the measurement of CG in higher education institutions moves from relatively detailed ex-ante regulation to ex-post control, with university autonomy as a change factor [11]. Based on the above, it is concluded that the referenced constructs are relevant because they allow for diagnosing academic and administrative performance [19] and are consistent with the indicators of evaluation processes for HEI accreditation purposes [20].
Studying the evaluation of CG in public sector organisations is essential, especially in APHEIs, because they have unique characteristics according to their typology [21]. In addition, some studies have shown a high association between CG and quality assurance [22]. From this perspective, some authors recommend monitoring this eventual correlation since the indicators that are usually linked to CG measure the commitment of APHEIs to develop their mission with the highest quality criteria, according to applicable performance standards [23]. Likewise, because CG is a dynamic concept under construction [24], some authors suggest carrying out studies in the future that allow applying metrics to evaluate governance from an organisational perspective and interest groups [12]; the role of university governance in CG processes considering the possible influence of administrative culture [25]; alternative governance instruments to university autonomy [26]; academic freedom and curriculum quality [27]; governance with stakeholders from a management perspective [28]; accountability mechanisms and transparency [29]; the administrative process, university autonomy, stakeholders and accountability system [30].
Based on the above, the relevance of empirically validating an instrument to measure GC in APHEIs was identified, whose measurement scale could help improve the understanding of the scope of its dimensions. Thus, considering a gap in the literature regarding developing a metric that fits the global context of APHEIs, the question arose: What are the structural relationships of corporate governance constructs in APHEIs? Therefore, based on the above discussions, this study aimed to propose and validate a measurement scale to assess GC as a central construct; its correlations with the administrative process, university autonomy, stakeholders, and the accountability system as first-order constructs; and with that of the second-order constructs associated with each of the above. Consequently, adapting the methodological proposal of Hair [31], this research followed a quantitative approach using a case study, applying a partial least squares structural equation model (PLS-SEM) in two stages: the evaluation of the reflective measurement model and that of the structural model. In the first stage, the loading of reflective indicators, internal consistency reliability, convergent validity, and discriminant validity were studied. In the second stage, collinearity, correlation coefficient (R²), predictive relevance (Q²), and effect size (f2) were studied, and following the recommendations of Henseler & Schuberth [32], the global evaluation of the model using the SRMR (Root Mean Square Residual) was included.
The research began with the theoretical framework and hypotheses, followed by the methodology, where the approach, the stages of the research design, the sample design and size, and the criteria implemented for data analysis were explained. This was followed by the results derived from the rigorous evaluation of the reflective measurement model and the structural model. A discussion of the results concerning the hypotheses put forward followed. The study concluded with the findings, highlighting theoretical, methodological, and practical implications, limitations, and suggestions for future research related to the object of study.
2. Materials and Methods
2.1. Theoretical Framework and Hypothesis
In line with Affandi [33], governance is high on the agenda of higher education (HE) stakeholders, as it is a determining factor in the quality assurance evaluation system, which has been strengthened since the Bologna declaration [34]. Based on the theoretical orientations of various studies, such as Gesser [35] and Sziegat [36] it can be deduced that HE governance is a concept under construction; therefore, there is no consensus on the constructs that comprise it. However, the most recurrent ones are the administrative process [10], university autonomy [15], stakeholders [37], and accountability [38]. Consequently, authors who have studied governance agree that it is a polysemic concept and that its constructs vary according to the sector and the type of management by economic activity [39]. They also agree that its epistemological scope can be supported by administrative theories since its constructs, regardless of their denomination, are found within its object of study, which are organisations [40]
In terms of administrative theories, those that explain the scope of governance assessment are (i) new institutionalism because it is possible to argue the incidence of variables related to decision-making, rules, participation, and performance [41]. Along these lines, according to March & Olsen [41], it is possible to study the correlation of the constructs underlying administrative theory with elements related to public policies, under which the objectives and strategies of the APHEIs are managed [42]. (ii) The resource-based vision theory, given the need to assess the degree of interaction of management capacity and resources with the variables that determine institutional change [43]. This theory is fundamental to understanding performance evaluation [44]. Also, it emerges as a dominant framework in strategy as a theoretical response to study the changes occurring in the corporate domain [45]. (iii) Stakeholder theory complements the other two theories; according to Freeman [46], it shows a set of actors within organisations and in the environment who are interrelated for a common cause, determined by variables that revolve around organisational efficiency and effectiveness. In this sense, according to Daniri [47], the transformation process of universities can be measured through the constructs that can be extracted from this theory.
2.1.1. Corporate Governance-Main Construct
The constructs included in the different models of CG are dissimilar, corresponding to the plurality of concepts proposed for this latent variable [37]. A trend in the literature characterizes CG models through constructs with a systemic relationship determined by planning and control [4]. Three constructs are often included: management, institutional autonomy, and accountability [48]. However, different positions are observed; e.g., Scott [49] present other CG constructs related to efficiency and responsiveness. They include constructs such as management processes and stakeholders. Peng [50] associate CG with variables linked with strategic management. The CG assessment should consider indicators of organisational structure, strategies, and culture [51]. In addition, Fatma [52] recommend studying the influence of autonomy as a regulatory factor of CG. Gesser [35] propose analysing stakeholder representation and participation variables. Finally, Pilon & Brouard [53], suggest assessing the accountability system as an integral indicator of organisational performance. By the above discussion, the following hypotheses are put forward in the field of APHEIs:
H1: CG positively influences the administrative process.
H2: CG positively influences university autonomy.
H3: CG positively influences stakeholders.
H4: CG positively influences accountability system.
2.1.2. First Order Constructs
Administrative process. Latent variables such as planning, organisation, direction, and control are integrated into the CG models proposed in the literature [54] Planning includes indicators of strategic objectives and policies [55]. In an organisation, structure, allocation of functions and resources, and the definition of authority and responsibility converge [56]. Management relates to the arrangement of human talent in the academic and administrative subsystems [19]; it also includes motivation, communication, and leadership [57]. Finally, control includes quality standards, performance evaluation, and analysis of deviations from plans [58]. Consequently, this construct makes it possible to evaluate the performance of APHEIs's governing bodies in the decision-making process to continuously improve academic and administrative processes [51]. From this perspective, the following hypotheses are proposed:
H1a: In CG, the administrative process positively affects the planning.
H1b: In CG, the administrative process positively affects the organisation.
H1c: In CG, the administrative process positively affects the management.
H1d: In GC, the administrative process positively affects the control.
University Autonomy. This construct, with its practical implications, comprises latent variables such as organisational, financial, and academic autonomy [59]. Organisational autonomy includes indicators measuring the ability to decide on the administrative structure and the freedom to designate university government [15]. With the associated metrics, it is possible to assess whether the APHEIs is executing its objectives according to its development strategy [60]. Financial autonomy contains indicators related to the principles of austerity, efficiency, and effectiveness [61]. In addition, it includes indicators to assess the degree of autonomous distribution of funds for academic and administrative operations. Finally, academic autonomy involves including indicators that can establish the degree of independence of the APHEIs to develop teaching, research, and outreach [62]. As a result of these arguments, the following hypotheses are formulated:
H2a: In CG, university autonomy positively affects the organisational autonomy.
H2b: In CG, university autonomy positively affects the academic autonomy.
H2c: In CG, university autonomy positively affects the financial autonomy.
Stakeholders. This construct is studied from the perspective of representation and participation [63]. About the former, it is necessary to analyse indicators that can measure the effectiveness of the delegate function in the governing bodies [64] of each of the strata of the university community, made up of students, managers, academics, and administrative staff [65]. Likewise, external stakeholders comprise public and private organisations that are part of APHEIs' economic, social, and environmental surroundings [28]. Indicators are also recommended to measure the effectiveness of the representation of subjects of special constitutional protection integrated, for example, by ethnic groups [66] and gender approach [67]. About the latter, the relevant indicators are those that make it possible to assess the involvement of internal and external stakeholders in the strategic formulation of the university [68]. Together, it is possible to assess the effectiveness of participatory spaces [64] in decision-making processes for continuous improvement [69]. Based on this line of reflection, the following hypotheses are presented:
H3a: In CG, stakeholders positively affect the participation.
H3b: In CG, stakeholders positively affect the representation.
Accountability System. The constructs inherent in the accountability system are transparency, responsibility, and accountability mechanisms [16]. Transparency can include indicators associated with the accessibility of information related to the administrative actions of the university government [70]. Responsibility measures the obligation of university management to act in the best interests of the APHEIs and its stakeholders [71]. Responsibility, a key component, ensures that the system is in good hands, making the audience feel that the university management is taking its obligations strictly. Accountability mechanisms, the system's backbone, support indicators to measure the effectiveness of the tools available to disseminate the results of transparency and liability [72]. They articulate elements aimed at ensuring truthful information, allowing internal and external stakeholders to be informed about the current situation of an APHEIs [73]. These mechanisms, crucial for decision-making, provide a perception of security and trust, as they offer alternatives such as public hearings, assemblies of the academic community, dialogues with the external sector, and audits. Consequently, these constructs form a control structure for assessing the scope of university management [74]. Along these lines, the following hypotheses were developed:
H4a: In CG, accountability positively affect the transparency.
H4b: In CG accountability positively affect the responsibility.
H4c: In CG, accountability positively affect the accountability mechanisms.
Figure 1 presents the hypotheses to be tested and formulated based on the theoretical framework that supports them. They are related to the structural equation model, and each hypothesis deals with the relationship with a construct.
2.2. Methodology
2.2.1. Approach and Stages of Research Design
To develop the research question about, what are the structural relationships of corporate governance constructs in the APHEIs? a quantitative approach was implemented to understand the causal relationships between the latent and observable variables included in the theoretical model [75]. The research employed rigorous deductive reasoning [76], focusing on the structural relationships of corporate governance in APHEIs. A case study approach was employed through the theoretical and metric considerations necessary for PLS-SEM analysis, using SmartPLS software version 4.1.0.9 [77], in two stages: the evaluation of the reflective measurement model and that of the structural model.
2.2.2. Design and sample size
The population from which the sample was drawn included teachers and administrative staff of one APHEI in Colombia. During the data collection period, from November 2023 to January 2024, data were collected from 398 respondents (226 teachers and 172 managers) out of a population of 3490 individuals, consisting of 2545 teachers and 945 middle and senior managers. The sample size is significant and representative, with a confidence level of 95% and a margin of error of approximately 5% (4,624%), valid according to the scope of the proposed study [78]. The selection of the sample was done with utmost care, ensuring its representativeness. Furthermore, the stratified sampling procedure [79] ensured that respondents were adequately represented across faculties and management levels. To measure the latent variables, a semantic Likert-type differential Likert scale from 1 to 7 was adapted [80]. Table 1. shows these variables. This instrument includes the variables observed and their relationship with each construct.
The above research instrument, consisting of 52 observable variables and 17 constructs, forms the basis of the structural model. CG and its relationship to each construct and indicator are included as endogenous variables.
2.2.2. Criteria applied to data analysis
The reflective measurement model was implemented in agreement with Hair [31] The causal relationship was oriented from the primary latent variable, corporate governance, to examine it as a theory in development [24], towards its most recurrent first-order constructs: administrative process, university autonomy, stakeholders, and accountability system [30], the second-order constructs, indicators, and their covariations, as manifestations of the respective underlying construct. This was all based on the theoretical framework and how the hypotheses were stated. Utilizing a causal-predictive approach, the PLS-SEM method played a crucial role in allowing the estimation of the proposed complex model with many constructs, indicator variables, and structural trajectories without imposing distributional assumptions on the data. Table 2 summarises the criteria analyzed for the evaluation of the reflective model and the structural model.
The rules of thumb in the table above are general guidelines that suggest how to interpret the results [87]. They were applied according to the theoretical framework and research contexts, involving a detailed comparison of different models. The criteria focused mainly on the interplay between prediction and hypothesis testing, based on a rigorous process of validating the causal relationships implicit in the measurement and structural model [98].
3. Results
According to the criteria recommended by Hair [31], this phase of the study was divided into two stages: the first stage evaluated the reflective measurement model, and the second stage evaluated the structural model.
3.1. Evaluation of the Measurement Model
In line with Henseler [99], the evaluation of the reflective measurement model included the reliability of the measures, both at the indicator level (reflective indicator loadings) and at the construct level (internal consistency reliability). The validity assessment focused on the convergent validity of each measure using the AVE [100]. In addition, the HTMT correlations ratio allowed assessing the discriminant validity of a reflectively measured construct, compared to other construct measures in the same model, together with the Fornell-Larcker criterion and cross-loadings between indicators and latent variables [95].
- (i)
- Reflective Indicator Loading. Following the guidelines of Hair [31], it is evident that the constructs under study have external loadings greater than 0,78, which means that the indicators associated with CG have high commonality and, therefore, constitute an indicator of reliability. That is, all indicators are statistically significant [101]. The reason for this rule can be understood in the context of the square of the external loadings of a standardized indicator, which represents the percentage of the variance of an item explained by the construct and is described as the variance extracted from that item [89]. In this way, the proposed theoretical model complies with the established rule of thumb, as the latent variables in the theoretical model explain a substantial part of the variance (plus 50%) of each indicator [102]. Therefore, the shared variance between the construct and its indicators is guaranteed to exceed the variance of the measurement error [93].
- (ii)
- Internal Consistency Reliability (Cα). The Cα coefficient values were above 0,70, as follows: the main construct (0,891), the four first-order constructs (0,961≥ Cα ≥ 0,875), and the 12 second-order constructs (0,974≥ Cα ≥ 0,893). The results show that the research instrument has relatively high validity and reliability [87] and can assess CG in APHEIs. The internal reliability of the instrument, as measured by the Cα, is a crucial aspect of the research. According to Efthymiopoulos & Goula [84] in agreement with Hair [96] and Henseler [103], values above 0,7 is a remarkable point to establish the effectiveness of the indicators and a consistent measurement of the constructs. Furthermore, they fall within the classification referenced by Samad [104], where Cα >0,9 means very high reliability, and 0,80 < Cα < 0,89 expresses satisfactory results. This comprehensive understanding of reliability levels contributes to the conclusion that there is a significant level of associativity between constructs and indicators [105]. Consequently, the theoretical model provides a relevant reliability estimate for all constructs based on the correlations of the observed indicator variables with a significance level of 95% [90].
- (iii)
- Composite Reliability (rhoc). All rhoc scores were above 0,70 and below 1 (0,971≥ rhoc >0,876). The items were weighted according to the construct indicators' individual loadings; therefore, this reliability is higher than the Cα [87]. The results are considered relevant because the Cα is a less accurate measure, as the items are not weighted [95]. Therefore, construct reliability was assessed by comparing the Cα and rhoc values. Consequently, the results indicate appropriate levels of reliability, as posited by Kabongo & Mbonigaba [82]
- (iv)
- Convergent Validity (AVE). For all constructs, AVE values were found to be higher than 0,5, namely: the main construct (0,754), the four first-order constructs (0,896≥AVE≥ 0,775), and the 12 second-order constructs (0,927≥ AVE≥ 0,755). Under this rule, each construct explains more than 50% of the variance of the indicators [106]. Based on the above results, convergent validity confirms that the scale correlates with other known measures of the concept of CG and that the indicators of each construct converge or share a high proportion of variance in common [95]. In summary, in terms of reliability, convergent validity indicates that the corresponding set of indicators represents their underlying construct [107]. The AVE shows the commonality of the construct [87]. Thus, it can be concluded that the model is made up of appropriate constructs, indicating that the variance of the construct can be explained through the chosen indicators [85].
Table 3 shows that all the constructs of the model meet the criteria for reflective evaluation according to the empirical rules referenced. Furthermore, considering that the size of the resulting t-value is more significant than 1,96, it can be affirmed that the path coefficient is significantly different from zero at a significance level of 5% (α = 0,05; two-tailed test) [98]. This is relevant because, in multiple regression, the t-value is used to assess the significance of each coefficient [89].
- (v)
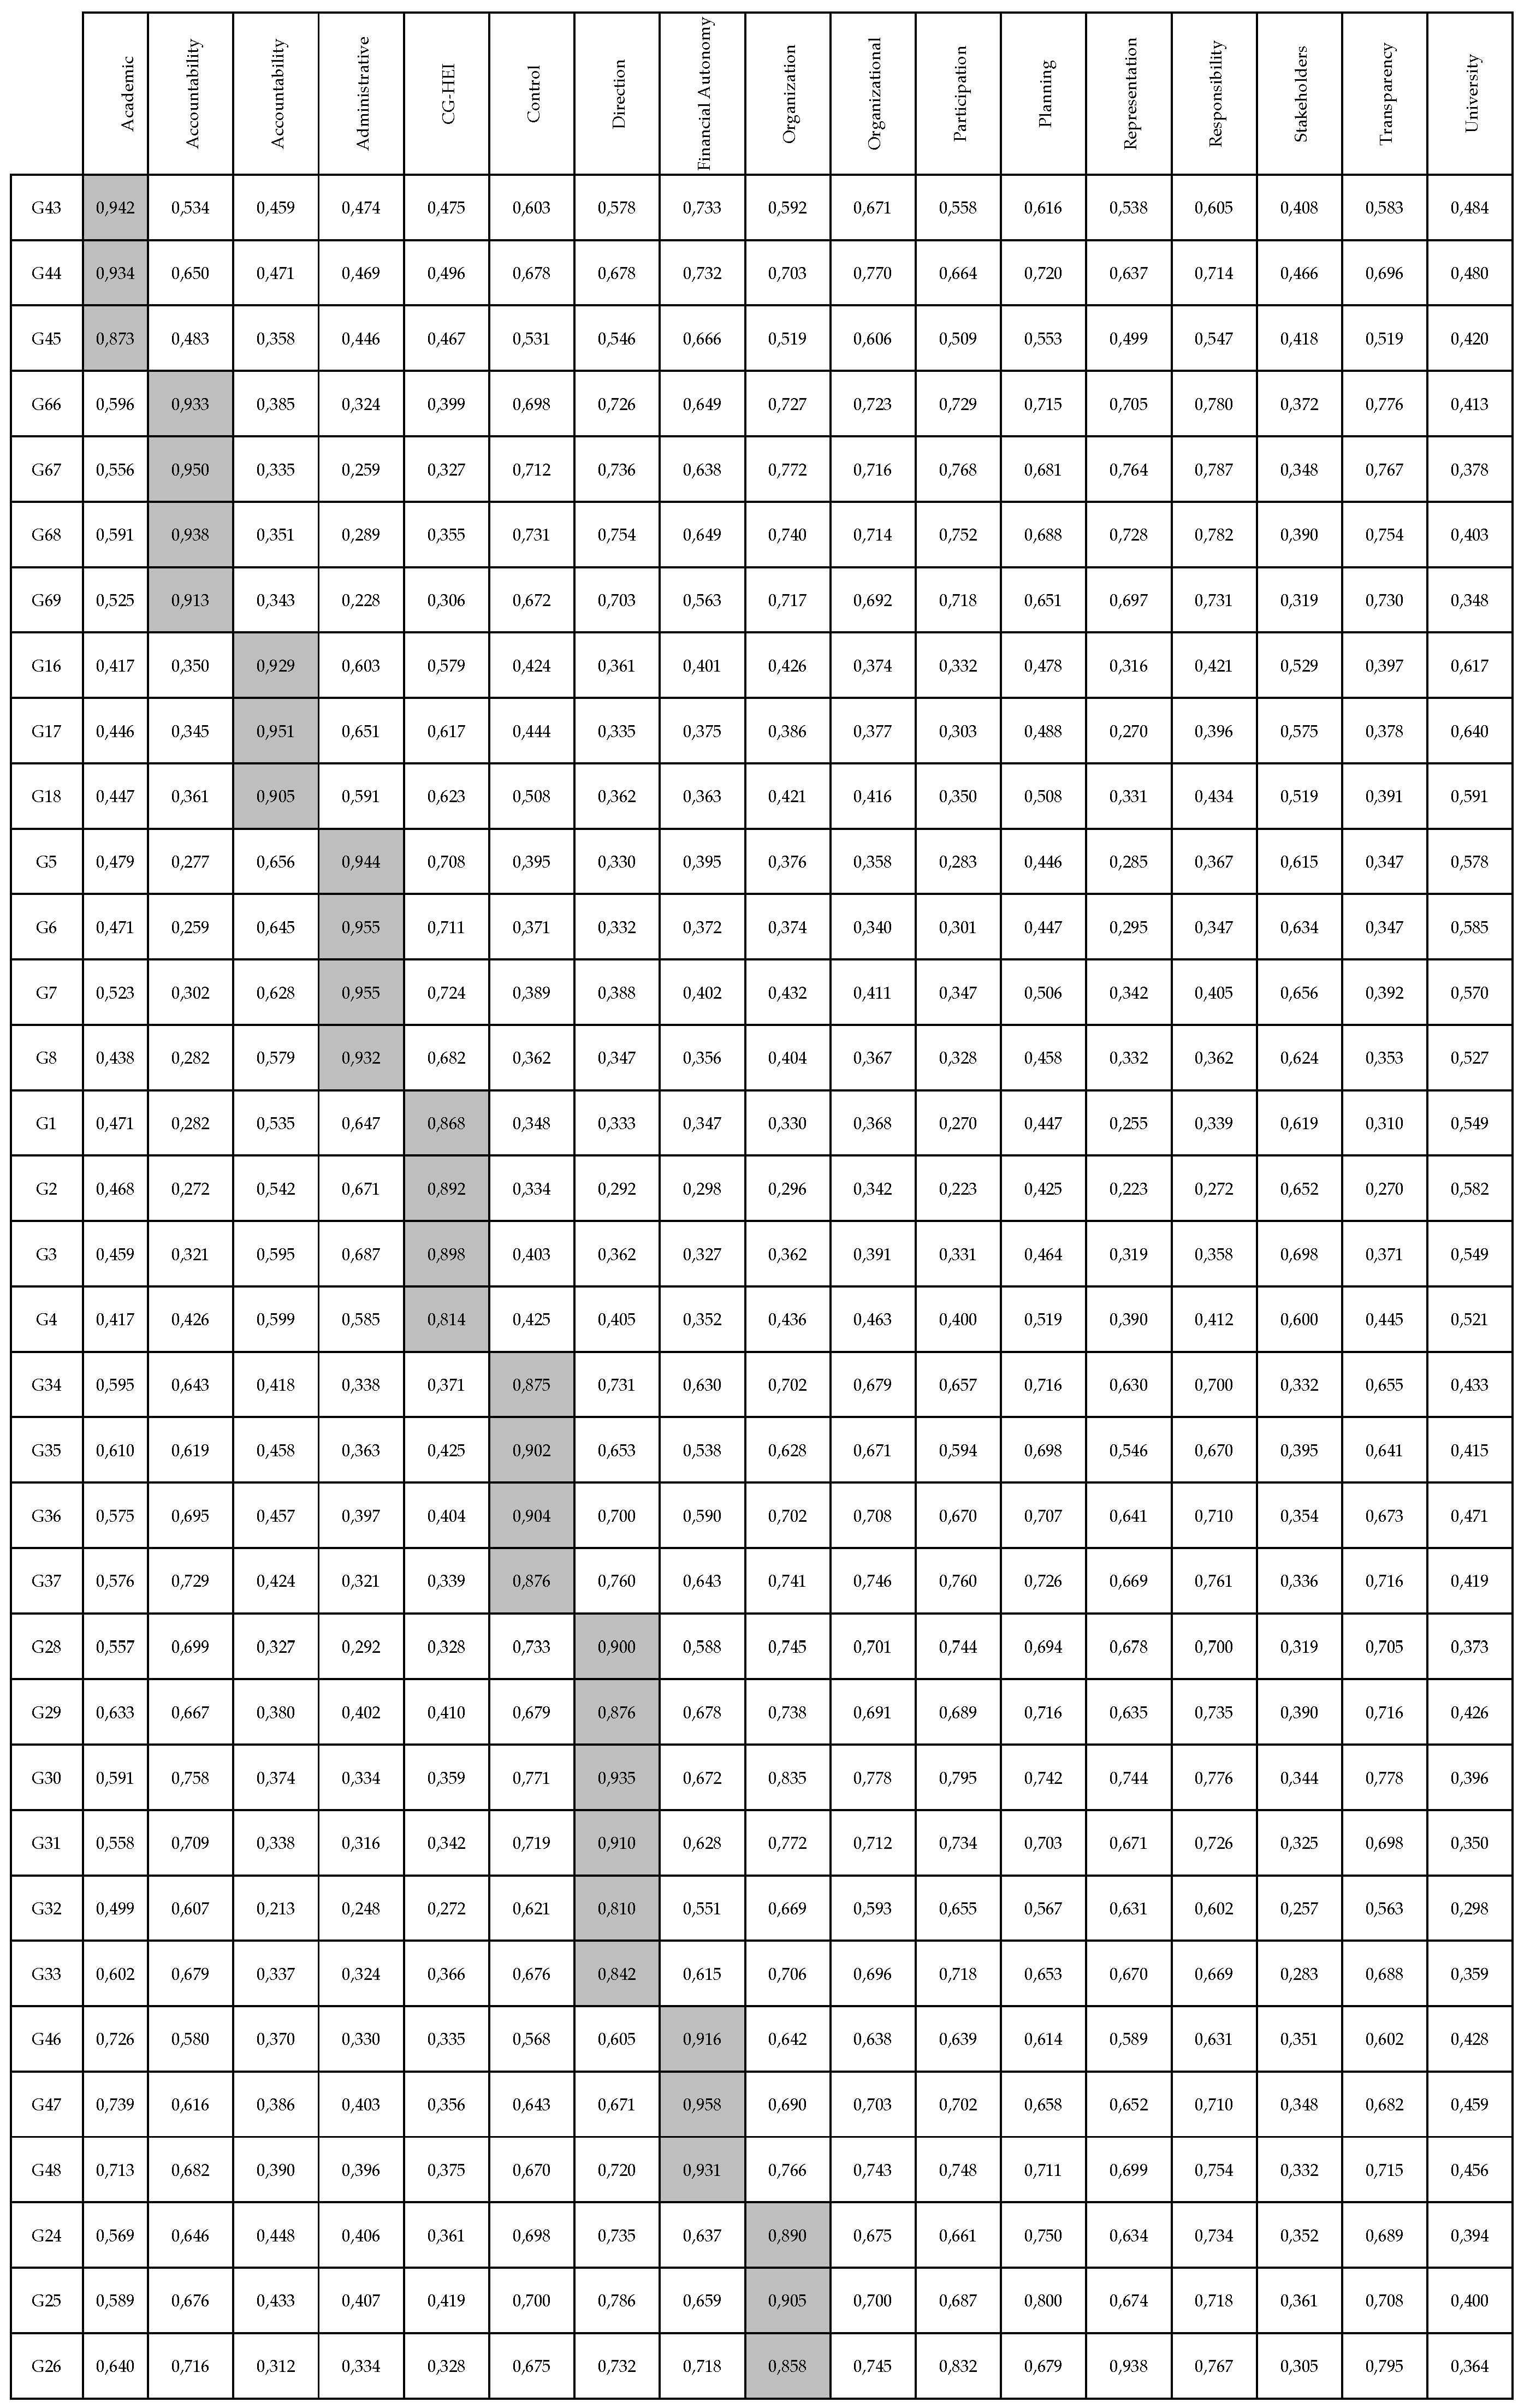
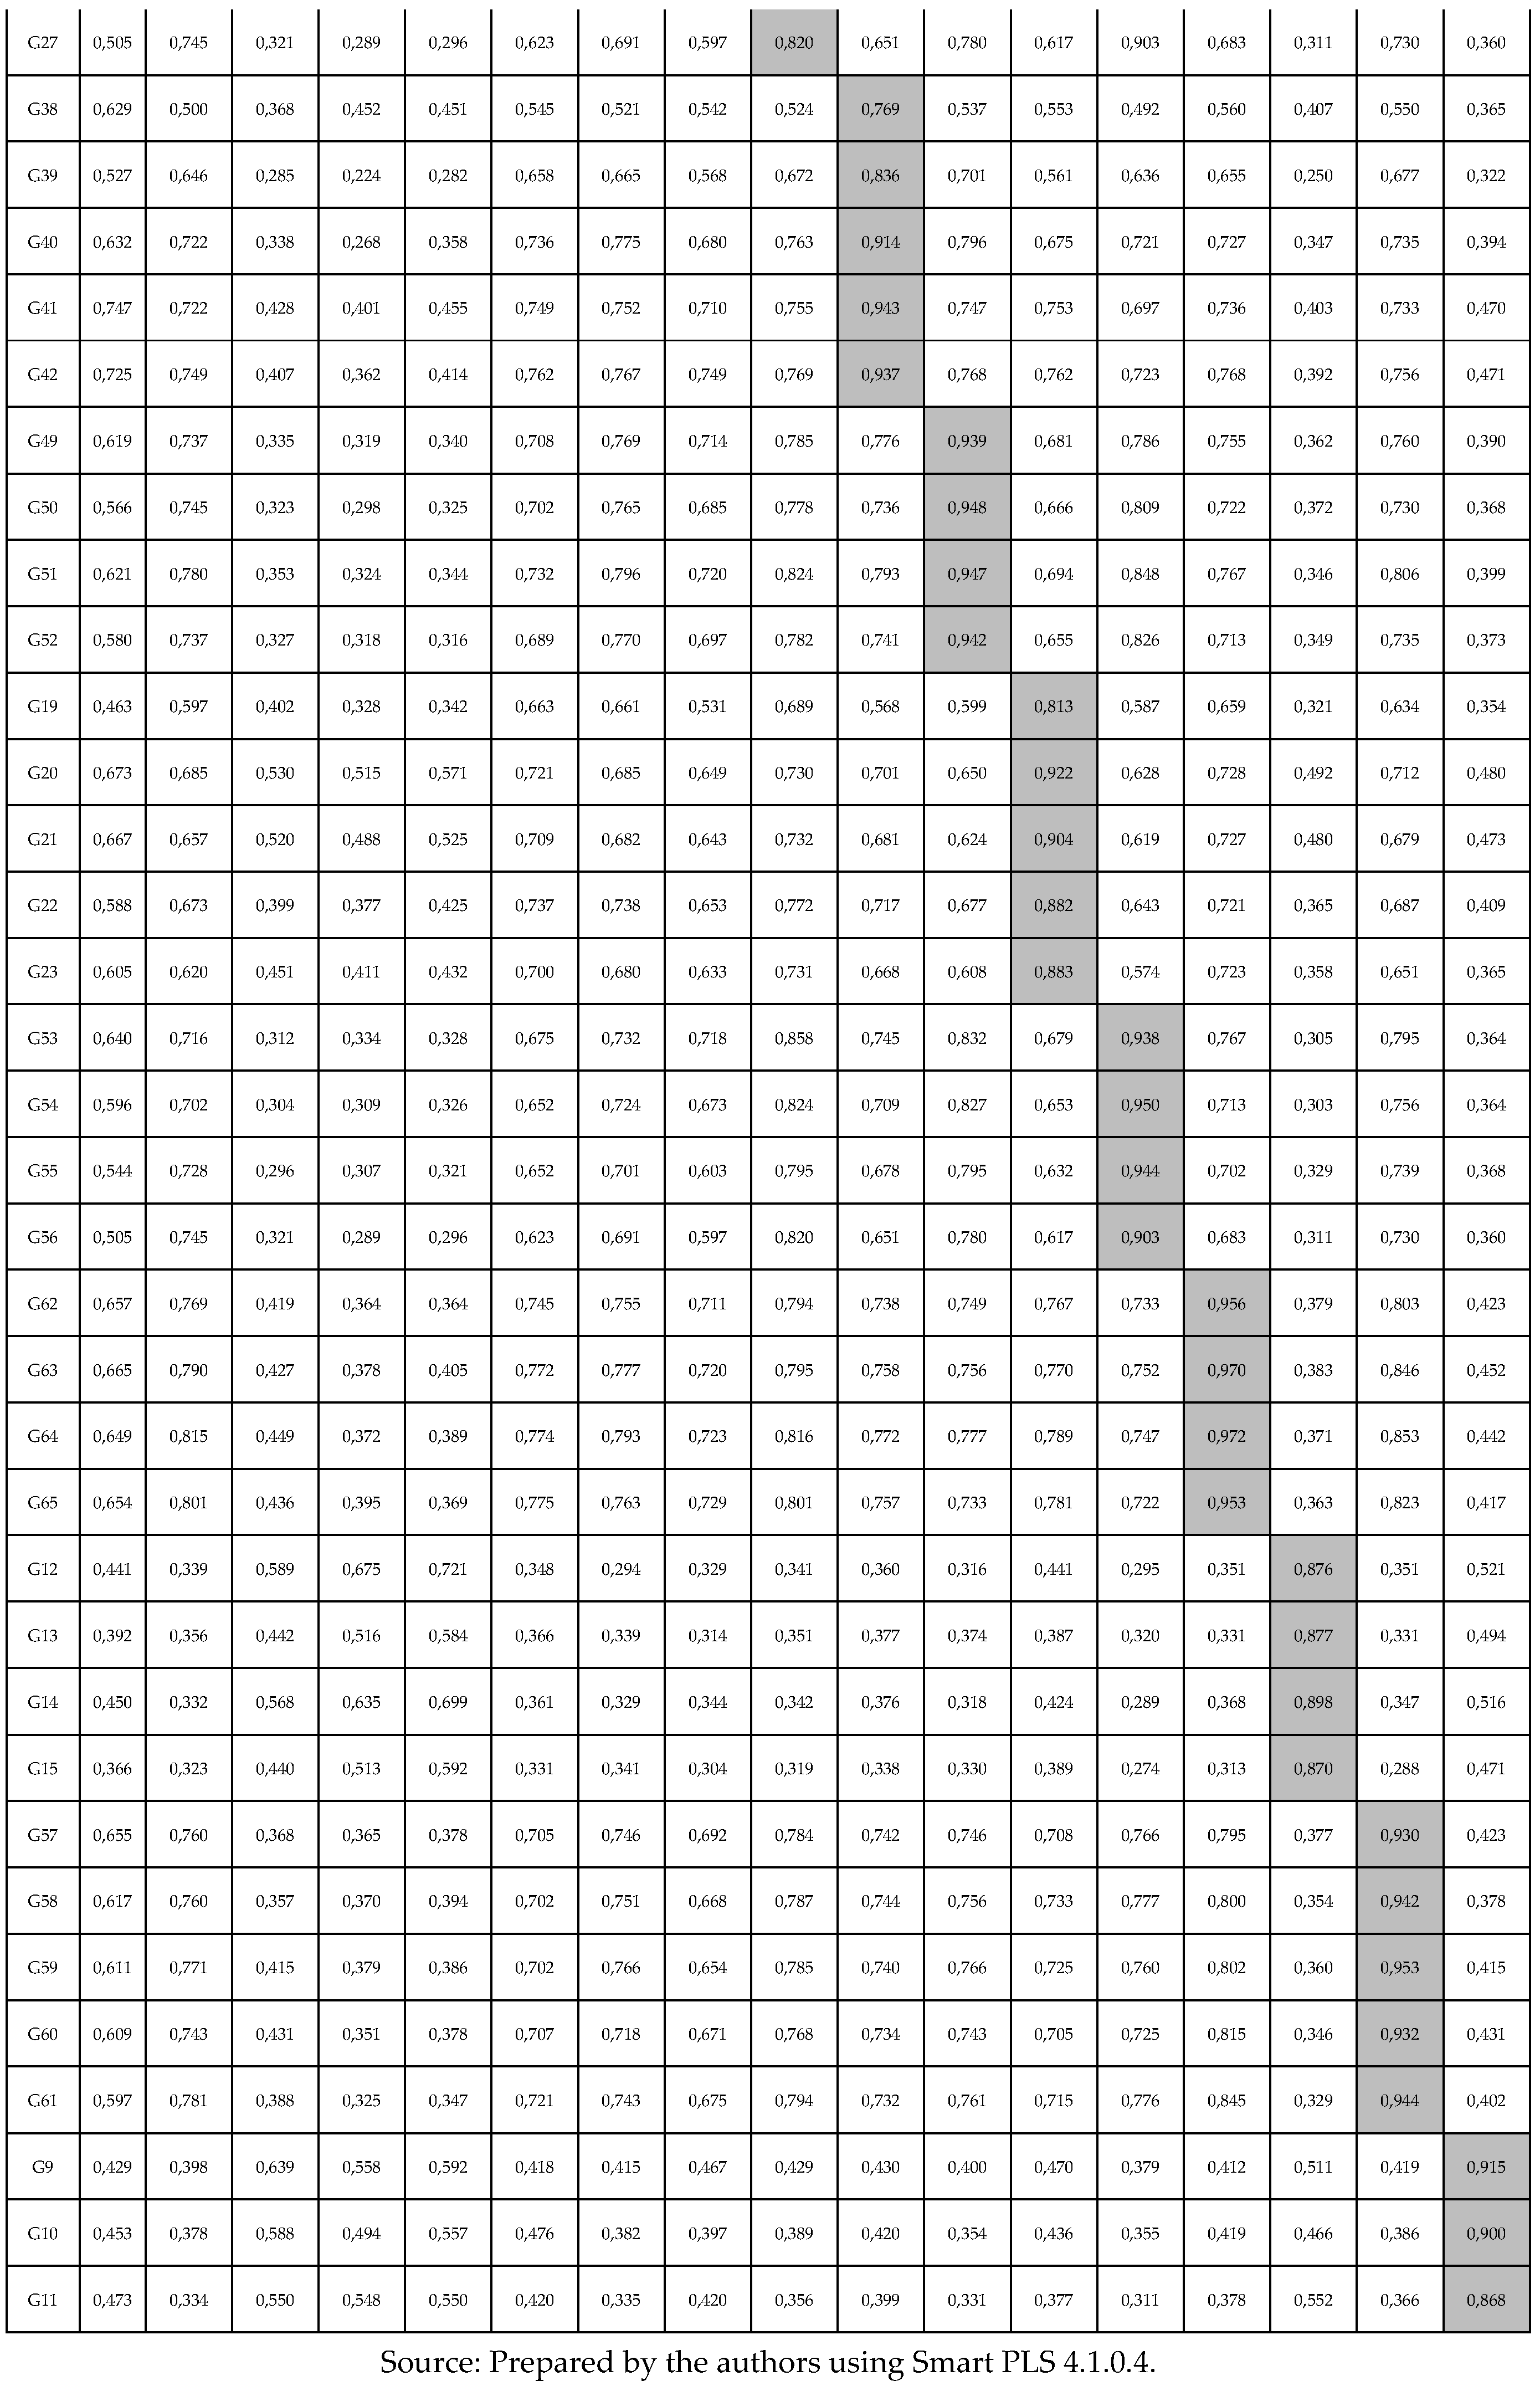
- Discriminant validity. To study discriminant validity comprehensively, according to Henseler [108], three criteria were assessed: (a) the Fornell-Larcker criterion, (b) the HTMT, and (c) cross-loadings between indicators and latent variables. Applying the Fornell & Larcker [109] criterion, the results in Table 4 (values below the diagonal, black) show that the square root of the AVE of each reflective construct is higher than the correlations that the rest of the constructs in the model have. This provides strong empirical evidence for the confirmation of discriminant validity, as the values of the items on the diagonal are higher than other values in their respective rows and columns [110]. The HTMT criterion (values located above the diagonal, blue color) further supports the evidence, showing that the constructs compared are empirically different from 1 at a 95% confidence level.
In addition, the evaluation was complemented by comparing the cross-factorial loadings of the indicators of a latent variable with the loadings of the indicators of the other latent variables [111]. Appendix 1 shows that the cross-factorial loadings registered a higher value with their latent variable than those assessed in the model [106]. Consequently, according to the results of the dominant approaches, it is concluded that a construct is empirically distinguished from other constructs in the structural model of CG [112].
In conclusion, in correspondence with Kabongo & Mbonigaba [82], it was shown that the indicator loadings, convergent validity, internal consistency reliability, and discriminant validity are within the parameters accepted by the scientific community. Therefore, empirical evidence was obtained that the evaluation criteria of the reflective model, both of the main construct, first-order constructs, second-order constructs, and corresponding indicators, are suitable for assessing CG in APHEIs.
3.2. Evaluation of the Structural Model
Following the recommendations of Hair [31], the structural model was evaluated after confirming the reliability and validity of the reflective model. The relationships between CG and the first- and second-order constructs, and these with the corresponding observable variables, were studied [75].
Thus, according to Hair [113], the following calculations were performed: (a) collinearity, through the variance inflation factor (VIF), here it was found that all constructs registered a VIF ≤ 5; consequently, it was concluded that there are no collinearity problems within the model. (b) The coefficient of determination, under this metric, it was found that all R2 values were more significant than 0,1; therefore, they were considered satisfactory [87]. However, taking more specific criteria, where R2 values of 0,75; 0,50; and 0,25 can be considered substantial, moderate, and weak, it was found that the first-order constructs are in a range between 3,5 and 5,57, i.e., they indicate an acceptable predictive power. (c) Predictive relevance, Q2 values above 0,1 were found, which are valid according to Hair [31]. The Q2 values of the main constructs are between 0,418 and 0,551, which means a relatively sizeable predictive accuracy; Hair [114] suggest that values above 0; 0,25; and 0,50 indicate small, medium, and large predictive accuracy. (d) The effect size of f2, all constructs exceeded the threshold value (f2>0), and the main constructs evidenced significant effects (f2>0,35), as it was taken into account that results above 0,02; 0,15; and 0,35 represent small, medium and large f2 effect sizes, respectively [87,93,95]. (e) The overall assessment of the model, an SRMR of 0,04 was found, indicating a good fit [102], since values below 0,08 imply a confirmatory assessment of the structural model [98]. Supported by the above empirical tests, Table 5 shows the results of the hypothesis test, where it is observed that CG has a strong positive causal relationship with the first-order constructs (0,634≤ß≤0,747, p= ,000) and, although with a lower range, this association applies to the second-order constructs (0,334≤ß≤0,491, p= ,000). Furthermore, the t-value shows statistically significant residuals, with values above 1,96 [87].
4. Discussion
The discussion was conducted by cross-checking the hypotheses' results with the suggested future work reviewed in the introduction and the findings of other authors included in the theoretical model.
In the first hypothesis (H1: CG→AP), the relationship between CG and the administrative process was verified with high confidence (β= 0,747 p= ,000). This construct included variables related to planning (H1a β= 0,491 p = ,000), organisation (H1b β= 0,420 p= ,000), direction (H3c β=0,370, p= ,000) and control (H4d β=0,401 p = .000). As can be seen, they all have a positive impact. They are consistent with the findings of authors such as Primmer & Furman [115] and [116] in confirming that CG is explained through constructs that move between the extremes of planning and control. Complementarily, in agreement with Kienast [117], it was found that indicators allow evaluating organisational performance to improve academic and administrative processes continuously. Consequently, in line with Juiz [9], it can be affirmed that this construct constitutes the most relevant dimension of CG and that the interaction of variables inherent to strategic management whose indicators underlie the administrative process can be measured with a high degree of significance [10].
About the second hypothesis (H2: CG→UA), the relationship between CG and university autonomy was confirmed (β= 0,634 p = ,000). The results showed that there is a significant correlation with dimensions of institutional autonomy: academic autonomy (H2a β= 0,465 p= ,000), organisational autonomy (H2b β= 0,504 p= ,000) and financial autonomy (H2c β= 0,479 p = ,000), as suggested by, among others, Paredes [118] and Quyet [119]. It was found that the autonomy indicators related to the organisational sphere are valid, as they enable the assessment of decision-making capacity concerning the administrative structure and the freedom to appoint university governing bodies [119]. Likewise, in line with Tuan & Trang [120], the relevance of the metrics of financial autonomy was confirmed since, in the perspective of the new public administration, the indicators were consistent in measuring elements related to the principles of austerity, efficiency, effectiveness and the management of funds for academic and administrative operations. Together, as Trivedi [121] points out, relevant results were presented in academic autonomy, whose indicators allow establishing the degree of independence of APHEIs to develop teaching, research, and outreach. Consequently, in line with Shin [122], it was confirmed that university autonomy has relevant elements to measure the extent of self-regulation and continuous improvement.
For the third hypothesis (H3: CG→SH), a significant correspondence was found between CG and stakeholders (β= 0,741 p= ,000). After the administrative process, this is the construct with the most tremendous significance in CG, in line with the approach of Huang-Horowitz [123]. It was confirmed, in agreement with Mineiro [124], that this construct is appropriate to analyze from two perspectives: participation (H3a β= 0,379 p= ,000) and representation (H3b β= 0.334 p= ,000). The first perspective confirms the effectiveness of indicators measuring the delegatory role of stakeholders in administration bodies, as proposed by Cole [125]. The second perspective, in line with Bleiklie [126], underlines the importance of indicators related to stakeholder involvement in strategic formulation and assessing the effectiveness of participatory spaces in decision-making processes. Consequently, these results, which align with Marin-Garcia [127], provide reassurance about the validity of the construct under study, confirming that internal and external stakeholders are strategic actors in the CG structure, with indicators revolving around the principles of participation and representation, in the balance of power distribution, as indicated by Daniri [47].
Finally, the fourth hypothesis (H4: CG→AS) found a preponderant relationship between CG and the accountability system (β= 0,653 p= ,000). It was confirmed that this construct is one of the most recurrent elements in CG models, as Elken (2023) states. A significant association was evident with transparency (H4a: β= 0,419 p= ,000), accountability (H4b: β=0,450 p= ,000), and accountability mechanisms (H4c: β=0.380 p= ,000), which is in line with the findings of several studies, such as those of Purwanti [129] and Machado [130]. The results are a notable point in establishing the effectiveness of the items and a consistent measurement of the second-order constructs associated with the accountability system, as enunciated by Marchisott [131]. According to Hoque [132], this first-order construct plays a crucial role in measuring the results of institutional management with stakeholders by promoting dialogue. Consequently, the consistency and validity of indicators are shown as a set of interrelated elements through which APHEIs demonstrates the outcome of the exercise of university autonomy and facilitates the assessment of management performance, as stated by Sahin [133] and Agyemang [134].
Overall, in agreement with Hair [114], the structural model took into account two fundamental criteria: the sequence of the constructs and the relationships between them. Both issues, fundamental to the modeling concept, were significant and represented the hypotheses and their relationships in the theoretical model being tested [87]. However, following the recommendations of Hair [96], rules of thumb, by their very nature, are general guidelines that suggest how to interpret the results, and they tend to vary depending on the context and any thresholds or guidelines raised in the literature should be considered provisional.
5. Conclusions
This study aimed to answer the following research question: What are the structural relationships of corporate governance constructs in APHEIs? Therefore, it was necessary to validate a measurement scale for its evaluation, using the required considerations and metrics for PLS-SEM analysis. Hypothesis testing revealed a highly positive and statistically significant impact of CG with the four first-order latent variables: administrative process (H1), university autonomy (H2), stakeholders (H3), and accountability system (H4). Associated with the above, 12 hypotheses were tested (representing the 12 second-order latent variables), and the results confirmed the following positive relationships, which are likely to substantially predict each construct: H1 with planning, organisation, direction, and control; H2 with organisational, academic and financial autonomy; H3 with participation and representation; H4 with transparency, responsibility and accountability mechanisms, respectively. As a significant contribution to the field of university management, this study has developed a novel instrument to assess CG from a reflective structural perspective. The key innovation lies in establishing a positive causal relationship from the main latent variable (CG) to its constituent constructs. This approach is unique in that it integrates the most recurrent constructs into a measurement scale using PLS-SEM, a method not previously employed in this context.
The theoretical implications lie in the association of CG categories with indicators that measure the capacity for anticipation (planning), the impact of the action (stakeholders) through the level of ownership (university autonomy) to monitor self-regulation and continuous improvement (accountability system), under the theoretical lens of new institutionalism, resource-based vision, and stakeholders. Furthermore, this study is the first reported initiative that explains CG in APHEIs as a reflective model. Consequently, the novelty is structuring a quality assurance model in which measures represent the effects of an underlying construct, and causality is measured through a trajectory from the second-order construct to its indicators, all related to observable variables recurrent in international higher education quality assurance models. In other words, this paper contributes to filling the knowledge gap identified in the literature by providing empirical information on the concept of CG in APHEIs.
Methodologically, the newness in evaluating the reflective and structural models lies in the inclusion of the most recent parameters rigorously implemented sequentially and complementary. The first filter was the reflective indicators used to evaluate the reflective measurement model. The composite reliability, since Cronbach's alpha is the sole criterion of internal consistency, is a less precise measure, as the items are not weighted. In discriminant validity, besides the assessment of cross-loadings and the Fornell Larcker criterion, the HTMT ratio was included because the first two are often questioned individually, significantly when the loadings of the indicators in a construct differ slightly. Along the same lines, the evaluation of the structural model was carried out. It began with a screening focused on the evaluation of collinearity to move on to R2 and Q2. Then, the size of the f2 effects was included (optional metric in most research) to visualize the order of importance of the constructs in correspondence with the size of the path coefficients. Finally, to support the stability of the results, the global SRMR evaluation was integrated. With sufficient goodness of fit, robustness, and significance, it was found that the model, in addition to being confirmatory, is causal and predictive. Consequently, the necessary flexibility for the interaction between theory and data was guaranteed by the context of the object of study in favor of the proposed theoretical model.
Regarding practical implications, the instrument developed to measure CG at APHEIs is a valid and reliable starting point with predictive power and relevance, susceptible to being adapted to any APHEIs. It is even susceptible to being implemented in non-accredited universities. This can help improve the understanding of CG dimensions and, consequently, the management of their academic and administrative processes under the principle of self-regulation and continuous improvement. Therefore, the constructs analyzed in this paper provide an idea of how their implementation can optimize the assessment of CG performance in APHEIs.
Although this study empirically validated an instrument to measure CG in APHEIs, the results have limitations inherent to a case study. Consequently, the results cannot be generalized because they are only from the perception of one APHEI. Therefore, the sampling frame of the consulted institution is insufficient, given that it must be expanded and stratified according to the institutional typology, identity, and mission in other education systems at a global level.
Concerning future research, further studies in similar settings are recommended to generalize the results obtained. It's important to note that the suggested thresholds for model fit measures in the PLS-SEM framework are preliminary and need to be examined in more detail in further studies. Likewise, rules of thumb are general guidelines suggesting how to interpret the results and often vary depending on the context of APHEIs. Consequently, the metrics reported in this paper are helpful for current applications but should always be kept up to date with the latest concepts in CG and advances in the PLS-SEM method.
Author Contributions
Conceptualization, F.M.Z., M.E.-S., and J.-A.P.L.D.M.; methodology, F.M.Z. and M.E.-S.; software, F.M.Z.; validation, F.M.Z., M.E.-S., and J.-A.P.L.D.M.; formal analysis, F.M.Z.; investigation, F.M.Z.; resources, F.M.Z.; data curation, F.M.Z.; writing—original draft preparation, F.M.Z.; writing—review and editing, F.M.Z.; visualization, F.M.Z., M.E.-S., and J.-A.P.L.D.M.; supervision, F.M.Z., M.E.-S., and J.-A.P.L.D.M.; project administration, F.M.Z.; funding acquisition, F.M.Z. All authors have read and agreed to the published version of the manuscript.
Funding
This research received no external funding.
Informed Consent Statement
Not applicable.
Data Availability Statement
The data presented in this study are available upon request from the corresponding authors.
Acknowledgements
The authors thank the professors and academic administrators of the University of Tolima (Colombia) for their valuable participation in this study. They also acknowledge the University of Medellín for providing access to the SCOPUS and Web of Science databases used in this research.
Conflicts of Interest
The authors declare no conflicts of interest.
Appendix 1
Cross-factorial loadings
References
- Aversano, N; Nicolò, G; Ferullo, D; Polcini, PT. The effect of board gender diversity on financial and non-financial performance: evidence from Italian public universities. Public Money and Management 2023, 43(7), 679–88. [Google Scholar] [CrossRef]
- Al Sawafi, A; Banneheka, BMSG; Hashim, MW; Valsala, S; Noushad, B. Development and Validation of a University Governance Index for the Higher Educational Institutions in Oman. International Journal of Interdisciplinary Organizational Studies 2023, 18(2), 65–92. [Google Scholar] [CrossRef]
- Niedlich, S; Bauer, M; Doneliene, M; Jaeger, L; Rieckmann, M; Bormann, I. Assessment of sustainability governance in higher education institutions—a systemic tool using a governance equalizer. Sustainability (Switzerland) 2020, 12(5), 1–17. [Google Scholar] [CrossRef]
- Resende, P; Oliveira, N. Proposta de instrumento para avaliação da governança organizacional em uma instituição do setor público. Revista de Servicio Público 2020, 71(2), 397–426. [Google Scholar]
- Santos, DJ; Souza, KR. Governance in Brazilian Public Higher Education Institutions. RIAEE – 2022, 17(3), 1533–59. [Google Scholar]
- Aly, D; Abdelqader, M; Darwish, TK; Toporkiewicz, A; Radwan, A. Board characteristics and sustainability in higher education institutions: The case of the United Kingdom. Higher Education Quarterly 2024, (January), 1–20. [Google Scholar] [CrossRef]
- Huang-Horowitz, NC; Boyraz, M; Lie Owens, S. Stakeholder identity orientations: understanding the perceptions of a public university’s identity through the lenses of students, faculty, and staff. Atl J Commun. 2024, 00(00), 1–18. [Google Scholar] [CrossRef]
- Fazle Rabbi, Md; Sabharwal, Meghna. Understanding Accountability Overload: Concept and Consequences in Public Sector Organizations. International Journal of Public Admnistration 2024, 00(00), 1–19. [Google Scholar]
- Juiz, C; Duhamel, F; Guti, I; Luna-reyes, LF. IT Managers ’ Framing of IT Governance Roles and Responsibilities in Ibero-American Higher Education Institutions. 2022.
- Chan, KN. Public administration in authoritarian regimes: propositions for comparative research. Asia Pacific Journal of Public Administration 2024, 00(00), 1–23. [Google Scholar] [CrossRef]
- Flipse, C; Van Berckel, F; Huisman, J. Understanding organizational identity in universities: Unravelling autonomy, governance and leadership in the case of the Vrije Universiteit Amsterdam. Higher Education Quarterly 2024, 78(1), 254–67. [Google Scholar] [CrossRef]
- Wilson, JP; Dyer, R; Cantore, S. Universities and stakeholders: An historical organisational study of evolution and change towards a multi-helix model. Industry and Higher Education 2023, 38(2), 124–35. [Google Scholar] [CrossRef]
- Barreyro, GB. políticas educativas Instrumentos de Accountability na Educação Superior; 2023; pp. 1–26. [Google Scholar]
- Wang, XL. Meta-governance, uncertainty and self-organization in corporatist social service sectors: The case of Hong Kong. International Review of Administrative Sciences 2023, 89(4), 1186–202. [Google Scholar] [CrossRef]
- Van, Quyet P; Hoc, LH; Hai, PTT. Autonomy Governance Transformation in the Higher Education Institutions Towards the Typical Models in Vietnam. Journal of Higher Education Theory and Practice 2023, 23(20), 1–14. [Google Scholar]
- Marchisott, G; Rodrigues Filho, S; França, S; Toledo, R; Castro, H; Alves, C; et al. Hybrid Governance System Value Perception Model. International Journal for Quality Research 2021, 16(1), 261–78. [Google Scholar] [CrossRef]
- Huisman, J. Accountability in higher education; Springer Science+Business Media Dordrecht, 2020;(January 2019. [Google Scholar]
- Ocean, M; McLaughlin, J; Hodes, J. “We Take EVERYONE”: Perceptions of External Assessment and Accountability at the Community College. Community Coll J Res Pract. 2022, 46(4), 223–39. [Google Scholar] [CrossRef]
- Mrzygłocka-Chojnacka, J; Ryńca, R. Using a Multi-Criteria Ranking Method to Assess Factors Influencing the Implementation of Sustainable Development at Higher Educational Institutions. Sustainability (Switzerland) 2023, 15(7). [Google Scholar] [CrossRef]
- Pineda, P; Salazar Morales, D. Managerialism, accreditation and insecure academic employment across different higher education traditions. In Studies in Higher Education; 2023; pp. 1–24. [Google Scholar]
- Chaika, NK. Assessing Corporate Governance. Russian Engineering Research 2024, 44(2), 258–61. [Google Scholar] [CrossRef]
- Hou, AYC; Hill, C; Hu, Z; Lin, L. What is driving Taiwan government for policy change in higher education after the year of 2016–in search of egalitarianism or pursuit of academic excellence? Studies in Higher Education 2022, 47(2), 338–51. [Google Scholar] [CrossRef]
- Hieu, NT; Niem, LD. Autonomy Acquisition and Performance within Higher Education in Vietnam—A Road to a Sustainable Future? Sustainability (Switzerland) 2024, 16(3). [Google Scholar] [CrossRef]
- Leal Filho, W; A Mifsud, MC; Eustachio, JHPP; Albrecht, CF; Dinis, MAP; Borsari, B; et al. Governance in the implementation of the UN sustainable development goals in higher education: global trends. Environ Dev Sustain. 2023;(0123456789).
- Friedrich, PE. Who is responsible for what? On the governance relationship between ministry and agencies in Austrian and Norwegian higher education. Studies in Higher Education 2021, 46(12), 2581–94. [Google Scholar] [CrossRef]
- Lackner, EJ. Agreements between the state and higher education institutions–how do they matter for institutional autonomy? In Studies in Higher Education; 2023; pp. 1–13. [Google Scholar]
- Mekonnen, GT; Kilpatrick, S; Kenny, J; Kilpatrick, S; Kenny, J. Constrained autonomy : academics and institutional leaders empowerment in Ethiopia in the context of the Bologna Process. J Furth High Educ. 2022, 46(2), 143–58. [Google Scholar] [CrossRef]
- Gesser, GA; de Oliveira, CM; Roczanski, CRM; de Melo, PA. Governança Universitária e Relacionamento com os Stakeholders: A Visão dos Gestores Graziele. Educ Policy Anal Arch 2022, 30. [Google Scholar]
- Memarian, B; Doleck, T. Fairness, Accountability, Transparency, and Ethics (FATE) in Artificial Intelligence (AI) and higher education: A systematic review. Computers and Education: Artificial Intelligence 2023, 5(May), 100152. [Google Scholar] [CrossRef]
- Mejia, F; Escobar-Sierra, M; Polanco, JA. Corporate Governance in Accredited Public Higher Education Institutions : Analysis through Text Mining and Expert Interviews Corporate Governance in Accredited Public Higher Education Institutions : Analysis through Text Mining and Expert Interviews. In Revista Científica General José María Córdova; 2024; p. 22. [Google Scholar]
- Hair, JF; Ringle, CM; Danks, NP; Hult, TM; Sarstedt, M; Ray, S. Review of Partial Least Squares Structural Equation Modeling (PLS-SEM) Using R: A Workbook. In Partial Least (PLS-SEM) Using R Equation Modeling Squares Structural Equation Modeling (PLS-SEM) Using R; 2023; Vol. 30, pp. 165–167. [Google Scholar]
- Henseler, J; Schuberth, F. Should PLS become factor-based or should CB-SEM become composite-based? Both! European Journal of Information Systems [Internet] 2024, 00(00), 1–13. [Google Scholar] [CrossRef]
- Affandi, N; Hidayat, S; Eryanto, H; Hidayat, DR. Higher Education Governance and Lecturer Performance: The Role of Leadership, Commitment, and Culture. Journal of Higher Education Theory and Practice 2023, 23(6), 185–95. [Google Scholar] [CrossRef]
- Sziegat, H. Transforming Governance of German Higher Education Institutions. Research in Educational Administration and Leadership 2022, 7(3), 472–517. [Google Scholar] [CrossRef]
- Gesser, GA; de Oliveira, CM; Roczanski, CRM; de Melo, PA. Governança Universitária e Relacionamento com os Stakeholders: A Visão dos Gestores Graziele. Educ Policy Anal Arch 2022, 30. [Google Scholar]
- Sziegat, H. Transforming Governance of German Higher Education Institutions. Research in Educational Administration and Leadership 2022, 7(3), 472–517. [Google Scholar] [CrossRef]
- Daniri, MA; Wahyudi, S; Pangestuti, IRD; Hersugondo. The Role of Good University Governance for Transformation Towards the Entrepreneurial University. Corporate and Business Strategy Review 2023, 4(1), 167–81. [Google Scholar] [CrossRef]
- Borch, I; Sandvoll, R; Roxå, T. Academic developers’ roles and responsibilities in strengthening student evaluation of teaching for educational enhancement. Higher Education Research and Development. 2024.
- Santos, DJ; Souza, KR. Governance in Brazilian Public Higher Education Institutions. RIAEE – 2022, 17(3), 1533–59. [Google Scholar]
- Han, Y; Zhou, Y; Carr, S; Jiang, J. Lifelong learning in the workplace: the knowledge management role of corporate universities in China. Humanit Soc Sci Commun. 2024, 11(1), 1–11. [Google Scholar] [CrossRef]
- March, J; Olsen, J. The New Institutionalism: Organizational Factors in Political Life. Am Polit Sci Rev. 1984, 78(3), 734–49. [Google Scholar] [CrossRef]
- Hasanefendic, S; Donina, D. A heuristic perspective on organizational strategizing in complex and coherent higher education fields. Tertiary Education and Management 2023, 29(4), 391–409. [Google Scholar] [CrossRef]
- Barney, JB. Is the resource-based view a useful perpective for strategic management research? yes. Academy of Management Review 2001, 26(1), 41–56. [Google Scholar]
- Bhat, AA; Mir, AA; Allie, AH; Ahmad Lone, M; Al-Adwan, AS; Jamali, D; et al. Unlocking corporate social responsibility and environmental performance: Mediating role of green strategy, innovation, and leadership. Innovation and Green Development 2024, 3(2), 100112. [Google Scholar] [CrossRef]
- Patnaik, S; Munjal, S; Varma, A; Sinha, Sujay. Extending the resource-based view through the lens of the institution-based. J Bus Res. 2022, 147, 124–41. [Google Scholar] [CrossRef]
- Freeman, RE; Wicks, AC; Parmar, B. Stakeholder theory and The corporate objective revisited. Organization Science 2004, 15(3). [Google Scholar] [CrossRef]
- Daniri, MA; Wahyudi, S; Pangestuti, IRD; Hersugondo. The Role of Good University Governance for Transformation Towards the Entrepreneurial University. Corporate and Business Strategy Review 2023, 4(1), 167–81. [Google Scholar] [CrossRef]
- Elken, M. Collaborative design of governance instruments in higher education. In Studies in Higher Education; 2023; pp. 1–12. [Google Scholar]
- Scott, RJ; Donadelli, F; Merton, ERK. Administrative philosophies in the discourse and decisions of the New Zealand public service: is post-New Public Management still a myth? International Review of Administrative Sciences 2023, 89(4), 941–57. [Google Scholar] [CrossRef]
- Peng, MW; Wang, JC; Kathuria, N; Shen, J; Welbourne Eleazar, MJ. Toward an institution-based paradigm. Asia Pacific Journal of Management [Internet] 2023, 40(2), 353–82. [Google Scholar] [CrossRef]
- Kienast, SR. How do universities’ organizational characteristics, management strategies, and culture influence academic research collaboration? A literature review and research agenda. Tertiary Education and Management 2023, 29(2), 139–60. [Google Scholar] [CrossRef]
- Fatma, T; Sulaiman, T; Ariff, Z; Ghadas, A. Social Sciences & Humanities Corporate Governance Models for Higher Educational Institutions : An Analysis. 2021, 29, 149–68. [Google Scholar]
- Pilon, M; Brouard, F. Accountability Theory in Nonprofit Research: Using Governance Theories to Categorize Dichotomies. Voluntas 2023, 34(3), 585–99. [Google Scholar] [CrossRef]
- Lillo, AILP; Saenz, CFL; Armijos, JC; Valencia, BY. Aspirations and commitment of the Peruvian universities. Perfiles Latinoamericanos 2023, 31(61), 1–30. [Google Scholar]
- Yahya, M; Khu, M. The Impact of Strategic Planning in the University ’ s Competitiveness According to NIAS. Academic journal of interdisciplinary studies 2021, 10(5), 83–101. [Google Scholar]
- Van Berckel, F. The rise of new public management at the institutional level: an analysis of a Dutch university and the role of administrators in initiating organizational change, 1980s to 2010s. Management and Organizational History 2023, 18(3–4), 223–43. [Google Scholar] [CrossRef]
- Haftel, YZ; Lenz, T. Measuring institutional overlap in global governance. Review of International Organizations 2022, 17(2), 323–47. [Google Scholar] [CrossRef]
- Idil, G; Bolatan, S; Golgeci, I; Arslan, A; Tatoglu, E. Unlocking the relationships between strategic planning, leadership and technology transfer competence : the mediating role of strategic quality management. 2022, 26(11), 89–113. [Google Scholar]
- Górska, A; Pikos, A; Dobija, D; Grossi, G. Autonomy Without Accountability in Resource Allocation Reforms : Blending Old and New Logic in Universities 1. Central European Management Journal 2022, 30(2), 43–82. [Google Scholar] [CrossRef]
- Wang, Y; Liu, Q; Chen, R. Comparative study on the internal governance models of Chinese and European universities. Asia Eur J. 2022, 20, 115–35. [Google Scholar] [CrossRef]
- Tuan, NA; Trang, NN. Assessing Impacts of University Autonomy Policies on Universities’ Competitiveness in Vietnam. Wseas Transactions on Business and Economics 2024, 21, 957–66. [Google Scholar] [CrossRef]
- Trivedi, C. The Crisis of University Autonomy in India: A Critical Reflection on the Policy Framework. J Asian Afr Stud. 2024. [Google Scholar] [CrossRef]
- Mineiro, J. Managerialism and Democratic Governance in Portuguese Higher Education: Assessing the Impact of the Legal Framework. Higher Education Policy. 2024;(0123456789).
- Cole, K; Giordano, JB; Hassel, H. A Faculty Guidebook for Effective Shared Governance and Service in Higher Education. A Faculty Guidebook for Effective Shared Governance and Service in Higher Education. 2023. 1–200 p.
- Hernández-Diaz, PM; Polanco, JA; Escobar-Sierra, M; Leal Filho, W. Holistic integration of sustainability at universities: Evidences from Colombia. J Clean Prod. 2021, 305, 127145. [Google Scholar] [CrossRef]
- Wise, G; Dickinson, C; Katan, T; Gallegos, MC. Inclusive higher education governance: managing stakeholders, strategy, structure and function. Studies in Higher Education 2020, 45(2), 339–52. [Google Scholar] [CrossRef]
- Bayhantopcu, E; Aymerich Ojea, I. Integrated sustainability management and equality practices in universities: A case study of Jaume I University. International Journal of Sustainability in Higher Education 2024, 25(3), 631–48. [Google Scholar] [CrossRef]
- Bleiklie, I. Norwegian higher education futures; High Educ (Dordr), 2023; Volume (1). [Google Scholar]
- Marin-Garcia, JA; Garcia-Sabater, JJ; Garcia-Sabater, JP; Maheut, J. Relevant factors to implement continuous improvement in administrative services of public universities: an action research study. Production Planning and Control 2024, 0(0), 1–21. [Google Scholar] [CrossRef]
- Biondi, L; Russo, S. Integrating strategic planning and performance management in universities: a multiple case-study analysis. Journal of Management and Governance 2022, 26(2), 417–48. [Google Scholar] [CrossRef]
- Dove, ES; Douglas, C. Ethics governance in Scottish universities: how can we do better? A qualitative study. Res Ethics 2023, 19(2), 166–98. [Google Scholar] [CrossRef]
- Lopez, B; Rangel, C; Fern, M. The impact of corporate social responsibility strategy on the management and governance axis for sustainable growth. 2022, 150, 690–8. [Google Scholar] [CrossRef]
- Karkošková, S. Data Governance Model To Enhance Data Quality In Financial Institutions. Information Systems Management 2023, 40(1), 90–110. [Google Scholar] [CrossRef]
- Allen, A; Gann, N. The architecture of school governance: Rebuilding democratic legitimacy within an academized system. Management in Education 2022, 36(1), 11–7. [Google Scholar] [CrossRef]
- Affandi, N; Hidayat, S; Eryanto, H; Hidayat, DR. Higher Education Governance and Lecturer Performance: The Role of Leadership, Commitment, and Culture. Journal of Higher Education Theory and Practice 2023, 23(6), 185–95. [Google Scholar] [CrossRef]
- Escobar-Sierra, M; Lara-Valencia, LA; ValenciaDeLara, P. ‘Step-by-step’ method to conduct applied research in organizational engineering and business management. Cultura y Educacion 2021, 33(1), 28–77. [Google Scholar] [CrossRef]
- Ringle, CM; Wende, S; Becker, JM. SmartPLS4; SmartPLS: Bönningstedt, 2024. [Google Scholar]
- Bandalos, D. Methodology in the Social Sciences; The Guilford Press: New York, USA, 2018; p. 661. [Google Scholar]
- Groves, RM; Fowler, FJJr; Couper, M; Lepkowski, JM; Singer, E; Tourangea, R. Questions and answers in surveys. In Survey Methodology; 2004; pp. 201–240. [Google Scholar]
- Rodríguez-Peña, A. Corporate entrepreneurship and firm performance relationship under the moderating effect of environmental dynamism: Replication and extension analysis. In Journal of International Entrepreneurship; Springer US, 2023. [Google Scholar]
- Kabongo, WNS; Mbonigaba, J. Effectiveness of public health spending: Investigating the moderating role of governance using partial least squares structural equation modelling (PLS-SEM). Health Res Policy Syst. 2024, 22(1), 1–16. [Google Scholar] [CrossRef] [PubMed]
- Kabongo, WNS; Mbonigaba, J. Effectiveness of public health spending: Investigating the moderating role of governance using partial least squares structural equation modelling (PLS-SEM). Health Res Policy Syst [Internet] 2024, 22(1), 1–16. [Google Scholar] [CrossRef]
- Razi-ur-Rahim, M; Uddin, F; Dwivedi, P; Pandey, DK. Entrepreneurial intentions among polytechnic students in India: Examining the theory of planned behaviour using PLS-SEM. International Journal of Management Education [Internet] 2024, 22(3), 101020. [Google Scholar] [CrossRef]
- Efthymiopoulos, A; Goula, A. Measuring the Reliability and Validity of Allen and Meyer’S Organizational Commitment Scale in the Public Sector. Corporate Governance and Organizational Behavior Review 2024, 8(2), 113–23. [Google Scholar] [CrossRef]
- Fornell, C; Larcker, DF. Evaluating Structural Equation Models with Unobservable Variables and Measurement. 1981, XVIII(February), 39–50. [Google Scholar]
- Shi, D; Maydeu-Olivares, A. The Effect of Estimation Methods on SEM Fit Indices. Educ Psychol Meas. 2020, 80(3), 421–45. [Google Scholar] [CrossRef]
- Hair, JF; Ringle, CM; Danks, NP; Hult, TM; Sarstedt, M; Ray, S. Review of Partial Least Squares Structural Equation Modeling (PLS-SEM) Using R: A Workbook. In Partial Least (PLS-SEM) Using R Equation Modeling Squares Structural Equation Modeling (PLS-SEM) Using R; 2023; Vol. 30, pp. 165–167. [Google Scholar]
- Henseler, J; Ringle, CM; Sarstedt, M. A new criterion for assessing discriminant validity in variance-based structural equation modeling; 2015; pp. 115–35. [Google Scholar]
- Hair, JF; Hult, GT; Ringle, C; Sarstedt, M. A Primer on Partial Least Squares Structural Equation Modeling (PLS-SEM); Sage: Kennesaw, 2017; p. 374. [Google Scholar]
- Hair, JF; Sharma, PN; Sarstedt, M; Ringle, CM; Liengaard, BD. The shortcomings of equal weights estimation and the composite equivalence index in PLS-SEM. Eur J Mark. 2024, 58(13), 30–55. [Google Scholar] [CrossRef]
- Cohen, J. Statistical Power Analysis for the Behavioral Sciences, Second Edi ed; Lawrence Erlbaum Associates, Publishers: New York, 1988; p. 579. [Google Scholar]
- Zoghby, JC; Marshall, G; Hair, JF; Williams, AJ. Introducing the diversity ecosystem: exploring the construct and its relationship to internal marketing and positive organizational outcomes. Journal of Marketing Theory and Practice 2024, 00(00), 1–17. [Google Scholar] [CrossRef]
- Benitez, J; Henseler, J; Castillo, A; Schuberth, F. How to perform and report an impactful analysis using partial least squares: Guidelines for confirmatory and explanatory IS research. Information and Management 2020, 57(2), 103168. [Google Scholar] [CrossRef]
- Henseler, J; Schuberth, F. Should PLS become factor-based or should CB-SEM become composite-based? Both! European Journal of Information Systems 2024, 00(00), 1–13. [Google Scholar] [CrossRef]
- Hair, JF; Risher, JJ; Sarstedt, M; Ringle, CM. When to use and how to report the results of PLS-SEM. European Business Review 2019, 31(1), 2–24. [Google Scholar] [CrossRef]
- Hair, JF; Risher, JJ; Sarstedt, M; Ringle, CM. When to use and how to report the results of PLS-SEM. European Business Review 2019, 31(1), 2–24. [Google Scholar] [CrossRef]
- Henseler, J; Schuberth, F. Partial least squares as a tool for scientific inquiry: comments on Cadogan and Lee. Eur J Mark. 2023, 57(6), 1737–57. [Google Scholar] [CrossRef]
- Hair, JF; Sarstedt, M; Ringle, CM; Sharma, PN; Liengaard, BD. Going beyond the untold facts in PLS–SEM and moving forward. Eur J Mark. 2024, 58(13), 81–106. [Google Scholar] [CrossRef]
- Henseler, J; Ringle, CM; Sarstedt, M. Testing measurement invariance of composites using partial least squares. International Marketing Review 2016, 33(3), 405–31. [Google Scholar] [CrossRef]
- Moganadas, SR; Nun, SH; Subramaniam, S; Bahaman, AS. Perspectives of academic staff concerning the sustainable development dimensions of a Malaysian higher education institution. Environ Dev Sustain. 2022, 24(12), 13817–40. [Google Scholar] [CrossRef]
- Rodríguez-Peña, A. Assessing the impact of corporate entrepreneurship in the financial performance of subsidiaries of Colombian business groups: under environmental dynamism moderation. J Innov Entrep. 2021, 10(1). [Google Scholar] [CrossRef]
- Alamer, A; Schuberth, F; Henseler, J. When and how to use confirmatory composite analysis (CCA) in second language research. Stud Second Lang Acquis. 2024, 46(2), 597–616. [Google Scholar] [CrossRef]
- Henseler, J; Hubona, G; Ray, PA. Using PLS path modeling in new technology research: Updated guidelines. Industrial Management and Data Systems 2016, 116(1), 2–20. [Google Scholar] [CrossRef]
- Samad, N; Mohd Noor, MA; Mansor, M. Exploratory Factor Analysis: Evaluating the Validity and Reliability of the Middle Leader Competency Model; Interciencia, 2023. [Google Scholar]
- Yesuf, YM; Getahun, DA; Debas, AT. Determinants of employees’ creativity: modeling the mediating role of organizational motivation to innovate. J Innov Entrep. 2024, 13(1). [Google Scholar] [CrossRef]
- Martínez Ávila, M; Fierro Moreno, E. Aplicación de la técnica PLS-SEM en la gestión del conocimiento: un enfoque técnico práctico / Application of the PLS-SEM technique in Knowledge Management: a practical technical approach; RIDE Revista Iberoamericana para la Investigación y el Desarrollo Educativo, 2018; Vol. 8, pp. 130–164. [Google Scholar]
- Henseler, J; Ringle, CM; Sarstedt, M. Testing measurement invariance of composites using partial least squares. International Marketing Review 2016, 33(3), 405–31. [Google Scholar] [CrossRef]
- Henseler, J; Ringle, CM; Sarstedt, M. A new criterion for assessing discriminant validity in variance-based structural equation modeling; 2015; pp. 115–35. [Google Scholar]
- Fornell, C; Larcker, DF. Evaluating Structural Equation Models with Unobservable Variables and Measurement. 1981, XVIII(February), 39–50. [Google Scholar]
- Mignot, S; Samuel, G; Stéphanie, S; Ponroy, C. research metrics . The case of French universities. High Educ (Dordr). 2022;(0123456789).
- Efthymiopoulos, A; Goula, A. Measuring the Reliability and Validity of Allen and Meyer’S Organizational Commitment Scale in the Public Sector. Corporate Governance and Organizational Behavior Review 2024, 8(2), 113–23. [Google Scholar] [CrossRef]
- Rafique, T; Awan, MU; Shafiq, M; Mahmood, K. Development of university ranking scale for higher education institutions. Qual Quant. 2024. [Google Scholar] [CrossRef]
- Hair, JF; Sarstedt, M; Ringle, CM; Sharma, PN; Liengaard, BD. Going beyond the untold facts in PLS–SEM and moving forward. Eur J Mark. 2024, 58(13), 81–106. [Google Scholar] [CrossRef]
- Hair, JF; Sharma, PN; Sarstedt, M; Ringle, CM; Liengaard, BD. The shortcomings of equal weights estimation and the composite equivalence index in PLS-SEM. Eur J Mark. 2024, 58(13), 30–55. [Google Scholar] [CrossRef]
- Primmer, E; Furman, E. How have measuring, mapping and valuation enhanced governance of ecosystem services? Ecosyst Serv [Internet] 2024, 67, 101612. [Google Scholar] [CrossRef]
- dos P, Oliveira N; Resende Junior, PC. Proposta de instrumento para avaliação da governança organizacional em uma instituição do setor público. Revista do Serviço Público 2020, 71(2), 397–426. [Google Scholar] [CrossRef]
- Kienast, SR. How do universities’ organizational characteristics, management strategies, and culture influence academic research collaboration? A literature review and research agenda. Tertiary Education and Management 2023, 29(2), 139–60. [Google Scholar] [CrossRef]
- Paredes, H; Del, Rosario A; Uriarte, S; Jhair, C; Becerra, L; Díaz Moron, P; et al. Public Management in University Higher Education: A Literature Review. 2022, 8(1), 2022. [Google Scholar]
- Van, Quyet P; Hoc, LH; Hai, PTT. Autonomy Governance Transformation in the Higher Education Institutions Towards the Typical Models in Vietnam. Journal of Higher Education Theory and Practice 2023, 23(20), 1–14. [Google Scholar]
- Tuan, NA; Trang, NN. Assessing Impacts of University Autonomy Policies on Universities’ Competitiveness in Vietnam. Wseas Transactions on Business and Economics 2024, 21, 957–66. [Google Scholar] [CrossRef]
- Trivedi, C. The Crisis of University Autonomy in India: A Critical Reflection on the Policy Framework. J Asian Afr Stud. 2024. [Google Scholar] [CrossRef]
- Shin, JC; Li, X; Nam, I; kyung, Byun B. Institutional Autonomy and Capacity of Higher Education Governance in South Asia : A Comparative Perspective. Higher Education Policy [Internet] 2022, 35(2), 414–38. [Google Scholar] [CrossRef]
- Huang-Horowitz, NC; Boyraz, M; Lie Owens, S. Stakeholder identity orientations: understanding the perceptions of a public university’s identity through the lenses of students, faculty, and staff. Atl J Commun [Internet] 2024, 00(00), 1–18. [Google Scholar] [CrossRef]
- Mineiro, J. Managerialism and Democratic Governance in Portuguese Higher Education: Assessing the Impact of the Legal Framework. Higher Education Policy [Internet] 2024, 0123456789. [Google Scholar] [CrossRef]
- Cole, K; Giordano, JB; Hassel, H. A Faculty Guidebook for Effective Shared Governance and Service in Higher Education. A Faculty Guidebook for Effective Shared Governance and Service in Higher Education; 2023; pp. 1–200. [Google Scholar]
- Bleiklie, I. Norwegian higher education futures. High Educ (Dordr) [Internet]. 2023;(1). [CrossRef]
- Marin-Garcia, JA; Garcia-Sabater, JJ; Garcia-Sabater, JP; Maheut, J. Relevant factors to implement continuous improvement in administrative services of public universities: an action research study. Production Planning and Control [Internet] 2024, 0(0), 1–21. [Google Scholar] [CrossRef]
- Elken, M. Collaborative design of governance instruments in higher education. Studies in Higher Education 2024, 49(6), 1095–106. [Google Scholar] [CrossRef]
- Purwanti, L; Triyuwono, I; Ichsan, M; Ramadhani, FN; Arief Effendi, S. Formal-cultural accountability: a [new] paradigm of public accountability. Cogent Soc Sci [Internet] 2024, 10(1). [Google Scholar] [CrossRef]
- Machado, A; Terra, R; Tannuri-Pianto, M. Higher education responses to accountability. Econ Educ Rev [Internet] 2024, 98, 102493. [Google Scholar] [CrossRef]
- Marchisott, G; Rodrigues Filho, S; França, S; Toledo, R; Castro, H; Alves, C; et al. Hybrid Governance System Value Perception Model. International Journal for Quality Research [Internet] 2021, 16(1), 261–78. Available online: https://www.researchgate.net/publication/357882936_hybrid_governance_system_value_perception_model. [CrossRef]
- Hoque, Z. New development: New public management values and public sector accounting education in Australia—A ‘reflection-in-action’ perspective. Public Money and Management 2023, 43(7), 750–4. [Google Scholar] [CrossRef]
- Sahin, A; Imamoglu, G; Murat, M; Ayyildiz, E. A holistic decision-making approach to assessing service quality in higher education institutions. Socioecon Plann Sci [Internet] 2024, 92(January), 101812. [Google Scholar] [CrossRef]
- Agyemang, G. Let’s have a relook at accountability; British Accounting Review, 2024; Vol. 56. [Google Scholar]
Figure 1.
Hypothesis model from the theoretical framework. Source: Authors’ elaboration.
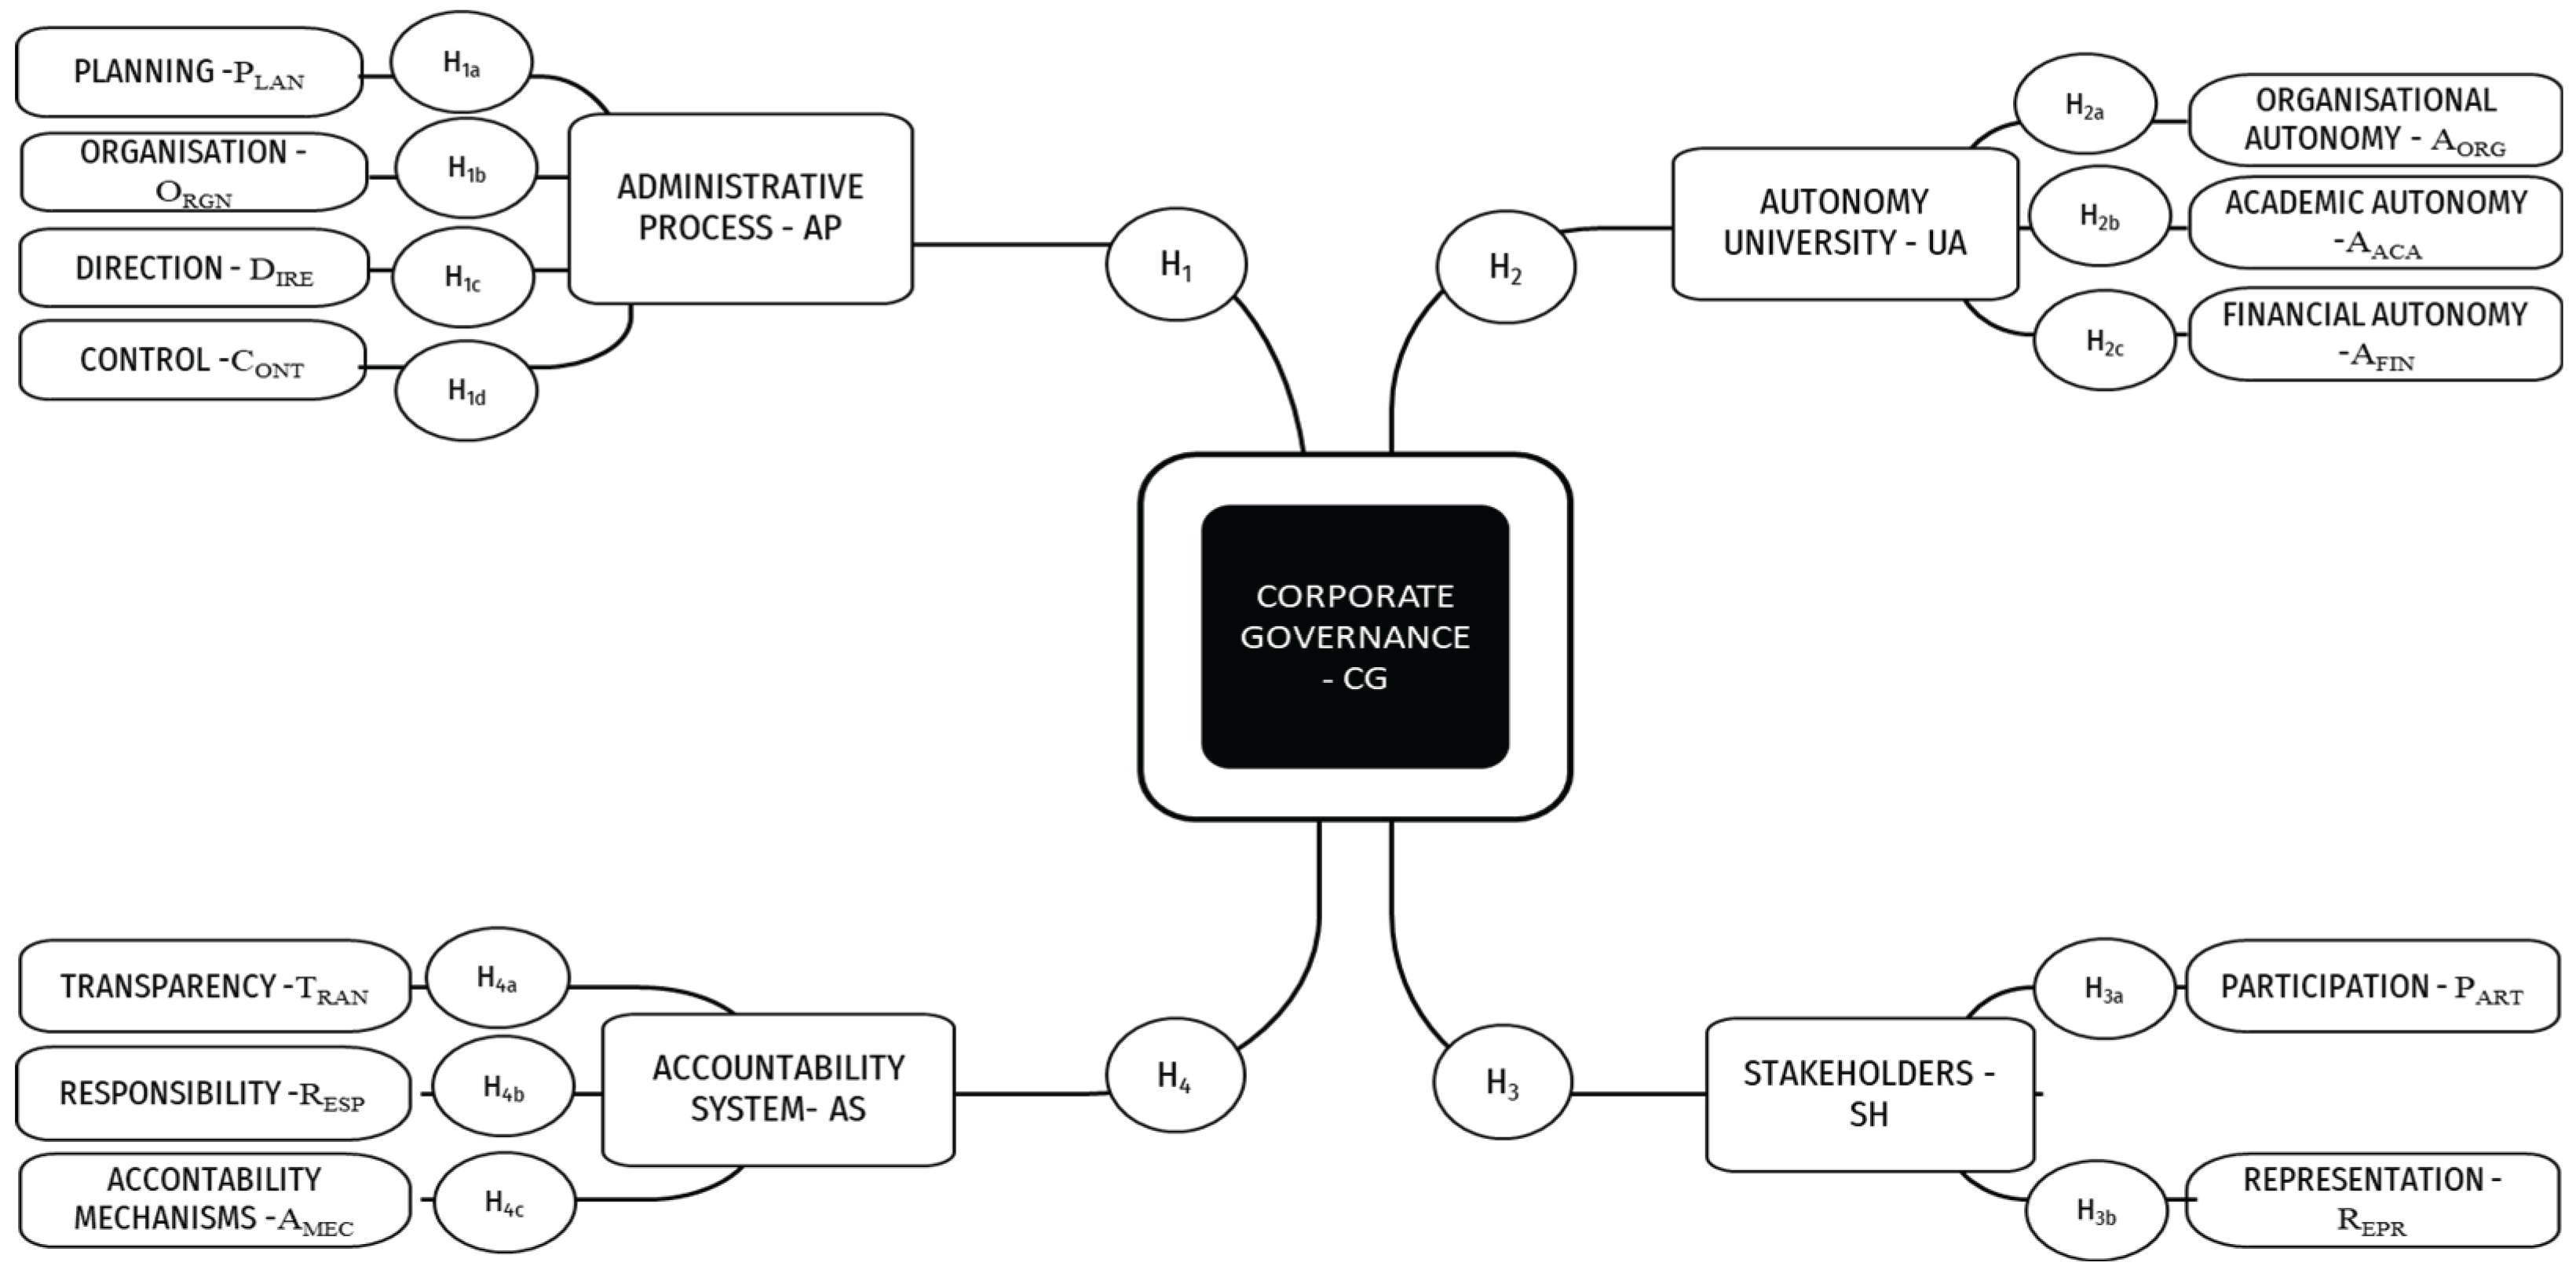
Figure 2.
Measurement and structure model results and path coefficient values with outer loadings. Source: Authors’ elaboration using SmartPLS version 4.1.0.9.
Figure 2.
Measurement and structure model results and path coefficient values with outer loadings. Source: Authors’ elaboration using SmartPLS version 4.1.0.9.
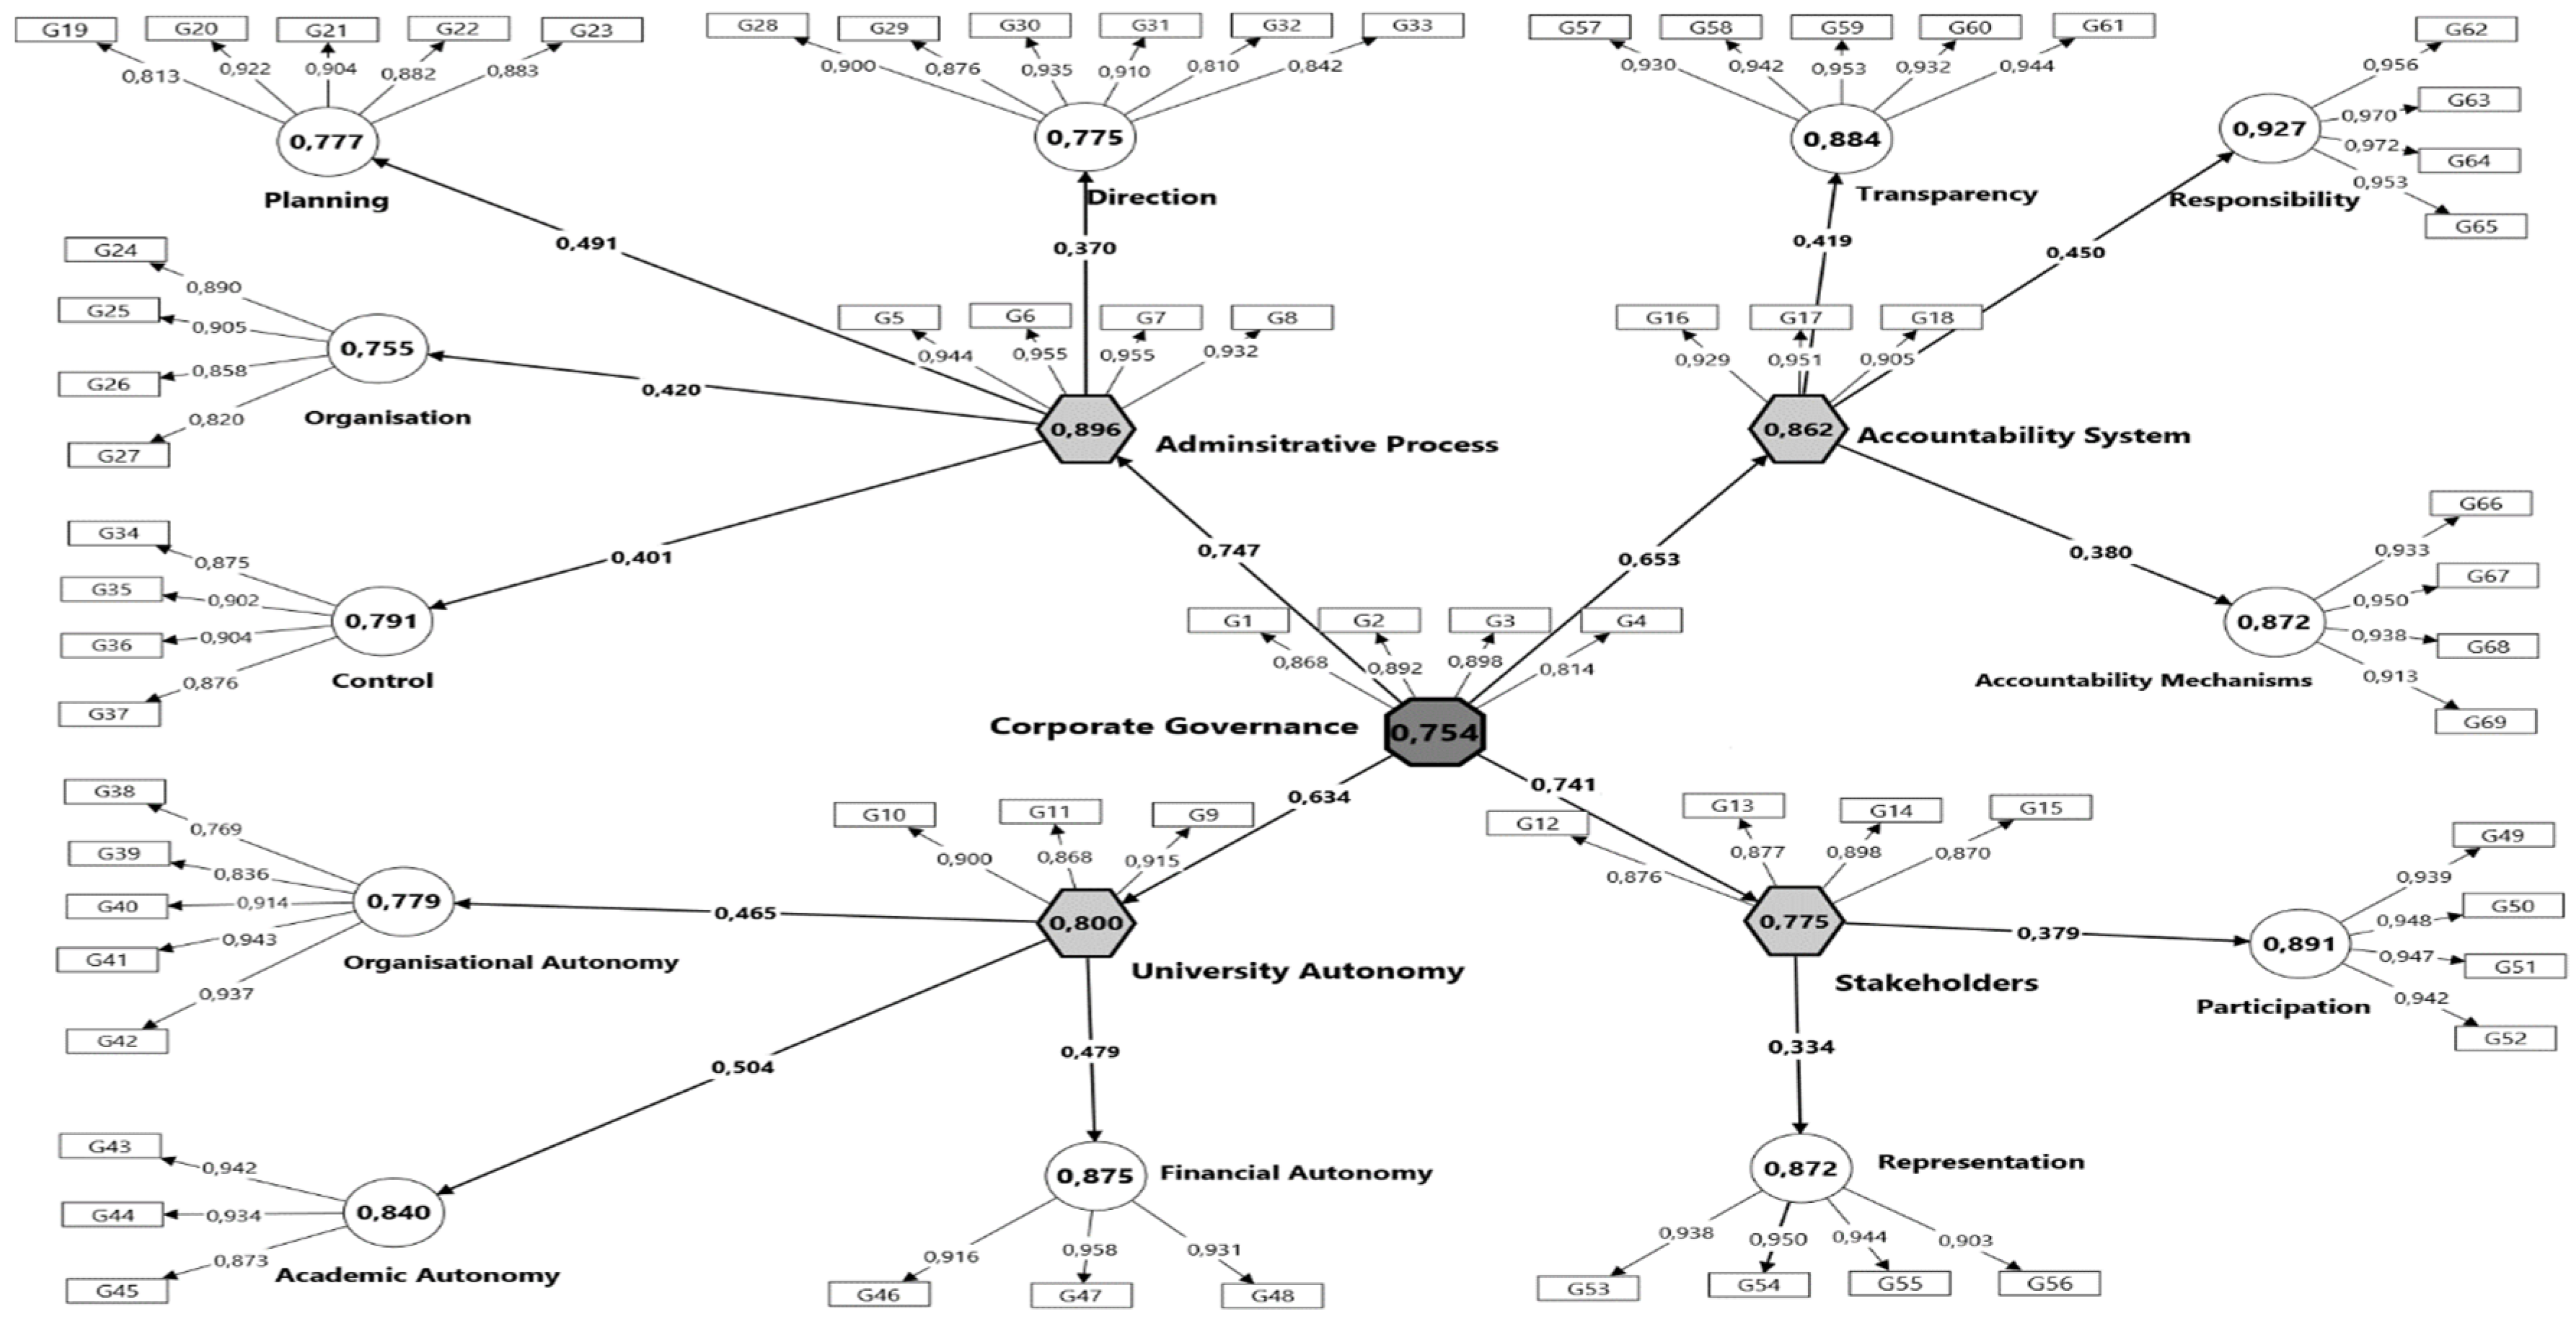

Table 1.
Corporate governance research instrument in APHEIS.
| Main Constructs | Code | First-Order Constructs | Code | Second-Order Constructs | CODE | Observed variables |
| Corporate Governance-CG | G1 | Administrative Process-AP | G5 | Planning-PLAN | G19 | Strategic diagnostic |
| G20 | Strategic objectives | |||||
| G21 | Policies | |||||
| G22 | Available resources | |||||
| G23 | Development plan | |||||
| G6 | Organisation-ORGN | G24 | Organisational structure | |||
| G25 | Job specialisation (administrative) | |||||
| G26 | Job specialisation (academic) | |||||
| G27 | Resource assignment | |||||
| G7 | Direction-DIRE | G28 | Coordination | |||
| G29 | Empowerment | |||||
| G30 | Participatory leadership | |||||
| G31 | Communication | |||||
| G32 | Incentives | |||||
| G33 | Training | |||||
| G8 | Control-CONT | G34 | Performance standards | |||
| G35 | Quality assessment | |||||
| G36 | Internal regulatory framework | |||||
| G37 | Achievement plan | |||||
| G2 | University Autonomy-UA | G9 | Organisational Autonomy-AORG | G38 | Administrative structure | |
| G39 | University government | |||||
| G40 | Decentralisation | |||||
| G41 | Performance | |||||
| G42 | Self-Regulation | |||||
| G10 | Academic Autonomy -AACA | G43 | Academic programs creation | |||
| G44 | Academic freedom | |||||
| G45 | Student admission | |||||
| G11 | Financial Autonomy-AFIN | G46 | Management of non-state resources | |||
| G47 | Own resources | |||||
| G48 | Financing continuous improvement | |||||
| G3 | Stakeholders-SH |
G12 G13 |
Participation-PART Internals Externals |
G49 | University community (strategic formulation) | |
| G50 | External sector (strategic formulation) | |||||
| G51 | University community (decision making) | |||||
| G52 | External sector (decision making) | |||||
|
G14 G15 |
Representation-REPR Internals Externals |
G53 | University community (university's governing bodies) (Continued) |
|||
| G54 | External sector (university's governing bodies) | |||||
| G55 | Graduates (university's governing bodies) | |||||
| G56 | Inclusion (university's governing bodies) | |||||
| Corporate Governance-CG | G4 | Accountability System-AS | G16 | Transparency-TRAN | G57 | Access to communication |
| G58 | Online information | |||||
| G59 | Precise information | |||||
| G60 | Ethic (uprightness, probity, honesty) | |||||
| G61 | Transparency channel | |||||
| G17 | Responsibility-RESP | G62 | Objective self-assessment | |||
| G63 | Self-regulation (substantive functions) | |||||
| G64 | Self-regulation (administrative management) | |||||
| G65 | Improvement plans | |||||
| G18 | Accountability Mechanisms-AMEC | G66 | Public participatory hearing | |||
| G67 | Assembly of the academic community | |||||
| G68 | Dialogue with the external sector | |||||
| G69 | Citizen audits |
Source: Authors’ elaboration.
Table 2.
Evaluation criteria of the reflective model and the structural model.
| Evaluation of the Reflective Measurement Model | |
| Loads of reflective indicators Composite Reliability (rhoc) |
≥ 0,708 This number squared equals 0,50, i.e., it explains a substantial part of each indicator's variance, typically at least 50% [81]. 1> rhoc> 0,70the items are weighted according to the individual loadings of the construct indicators, and therefore, this reliability is higher than Cronbach's alpha [82,83] |
| Internal Consistency Reliability - Cronbach's alpha (Cα) | Cα ≥0,70 it is a notable point for establishing item efficacy and consistent measurement of constructs [84] |
| Convergent Validity-Extracted Variance Average (AVE) | AVE ≥ 0,50 shows that the chosen indicators can explain the variance of the construct [85]. |
| Discriminant Validity - Cross loads - Fornell Larcker criterion - Ratio Heterotrait-Monotrait (HTMT) |
Each reflective indicator should have a higher loading on the construct to which it is linked [86,87]. The square root of the AVE of each reflective construct must be greater than the correlations of the other constructs in the model [88]. 1 ≥ HTMT ≥ 0,85 indicates that a construct is genuinely distinct from others, both in terms of its degree of correlation with other constructs and the extent to which the measured variables represent only that construct; it must be demonstrated that HTMT values are significantly different from 1 [87,88]. |
| Structural Model Assessment | |
| Collinearity | VIF ≤ 5 there are no collinearity problems within the model. That is, 2 or more reflective indicators do not have exactly the same information entered into them [89]. |
| Coefficient of Determination | R2 ≥ 0,1 considered satisfactory, it measures the predictive power of the model [87]*. |
| Predictive relevance | Q2 >0 values for a reflective latent variable indicate the model's predictive relevance. Values greater than 0; 0,25; and 0,50 indicate small, medium, and large predictive accuracy, respectively [90]. |
| Effect sizes (f2) |
f2 >0 values greater than 0,02; 0,15; and 0,35 represent small, medium and large f2 effect sizes [87,91]. Measures whether the size of the f2 effect is similar to the size of the path coefficients [92]. |
| Overall Assessment of the Structural Model | |
| Standardised root mean square residual |
SRMR < 0,08 makes the confirmatory assessment of the structural model relevant [89,93,94]. |
Table 3.
Evaluation results for the reflective model.
| Indicators Loading | t-Value | Internal Consistency Reliability | Convergent Validity | |||
|
Cronbach´s Alpha (Cα) |
Composite Reliability (rhoc) | Average Variance Extracted (AVE) | ||||
| Latent Variable | Observable Variable | ≥ 0,708 | t >1,96 | Cα > 0,70 | 1> rhoc > 0,70 | AVE> (0,5) |
| Corporate Governance | G1 | 0,868 | 28,011 | 0,891 | 0,893 | 0,754 |
| G2 | 0,892 | 29,409 | ||||
| G3 | 0,898 | 28,615 | ||||
| G4 | 0,814 | 27,878 | ||||
| Administrative Process | G5 | 0,944 | 36,233 | 0,961 | 0,963 |
0,896 |
| G6 | 0,955 | 41,044 | ||||
| G7 | 0,955 | 29,561 | ||||
| G8 | 0,932 | 26,697 | ||||
| Planning | G19 | 0,813 | 7,283 | 0,929 | 0,947 |
0,777 (continued) |
| G20 | 0,922 | 12,78 | ||||
| G21 | 0,904 | 12,646 | ||||
| G22 | 0,882 | 12,142 | ||||
| G23 | 0,883 | 13,16 | ||||
| Organisation | G24 | 0,890 | 11,441 | 0,893 | 0,909 | 0,755 |
| G25 | 0,905 | 15,716 | ||||
| G26 | 0,858 | 12,398 | ||||
| G27 | 0,820 | 10,754 | ||||
| Direction | G28 | 0,900 | 12,332 | 0,942 | 0,953 | 0,775 |
| G29 | 0,876 | 15,001 | ||||
| G30 | 0,935 | 17,028 | ||||
| G31 | 0,910 | 16,505 | ||||
| G32 | 0,810 | 8,733 | ||||
| G33 | 0,842 | 9,676 | ||||
| Control | G34 | 0,875 | 7,157 | 0,912 | 0,918 |
0,791 |
| G35 | 0,902 | 10,206 | ||||
| G36 | 0,904 | 10,674 | ||||
| G37 | 0,876 | 9,231 | ||||
| University Autonomy | G9 | 0,915 | 24,648 | 0,875 | 0,876 | 0,800 |
| G10 | 0,900 | 20,402 | ||||
| G11 | 0,868 | 19,272 | ||||
| Organisational Autonomy | G38 | 0,769 | 8,572 | 0,928 | 0,945 |
0,779 |
| G39 | 0,836 | 10,027 | ||||
| G40 | 0,914 | 17,451 | ||||
| G41 | 0,943 | 19,137 | ||||
| G42 | 0,937 | 20,498 | ||||
| Academic Autonomy | G43 | 0,942 | 21,741 | 0,905 | 0,911 | 0,840 |
| G44 | 0,934 | 25,163 | ||||
| G45 | 0,873 | 16,536 | ||||
| Financial Autonomy | G46 | 0,916 | 20,065 | 0,928 | 0,930 | 0,875 |
| G47 | 0,958 | 27,954 | ||||
| G48 | 0,931 | 21,726 | ||||
| Stakeholders | G12 | 0,876 | 25,812 | 0,903 | 0,906 | 0,775 |
| G13 | 0,877 | 27,673 | ||||
| G14 | 0,898 | 26,472 | ||||
| G15 | 0,870 | 25,245 | ||||
| Participation | G49 | 0,939 | 20,873 | 0,959 | 0,960 | 0,891 |
| G50 | 0,948 | 23,201 | ||||
| G51 | 0,947 | 24,37 | ||||
| G52 | 0,942 | 21,454 | ||||
| Representation | G53 | 0,938 | 18,075 | 0,951 | 0,952 | 0,872 |
| G54 | 0,950 | 20,376 | ||||
| G55 | 0,944 | 20,526 | ||||
| G56 | 0,903 | 14,829 | ||||
| Accountability System | G16 | 0,929 | 44,512 | 0,920 | 0,920 | 0,862 (continued) |
| G17 | 0,951 | 42,642 | ||||
| G18 | 0,905 | 29,582 | ||||
| Transparency | G57 | 0,930 | 19,278 | 0,967 | 0,971 |
0,884 |
| G58 | 0,942 | 18,224 | ||||
| G59 | 0,953 | 23,552 | ||||
| G60 | 0,932 | 17,852 | ||||
| G61 | 0,944 | 20,207 | ||||
| Responsibility | G62 | 0,956 | 26,648 | 0,974 | 0,975 | 0,927 |
| G63 | 0,970 | 28,31 | ||||
| G64 | 0,972 | 28,103 | ||||
| G65 | 0,953 | 28,4 | ||||
| Accountability Mechanisms | G66 | 0,933 | 15,561 | 0,951 | 0,954 |
0,872 |
| G67 | 0,950 | 19,806 | ||||
| G68 | 0,938 | 16,557 | ||||
| G69 | 0,913 | 15,476 | ||||
Source: Authors’ elaboration using SmartPLS version 4.1.0.9.
Table 4.
Showing discriminant validity using the Fornell-Larcker criterion and the Heterotrait-Monotrait Ratio (HTMT).
Table 4.
Showing discriminant validity using the Fornell-Larcker criterion and the Heterotrait-Monotrait Ratio (HTMT).
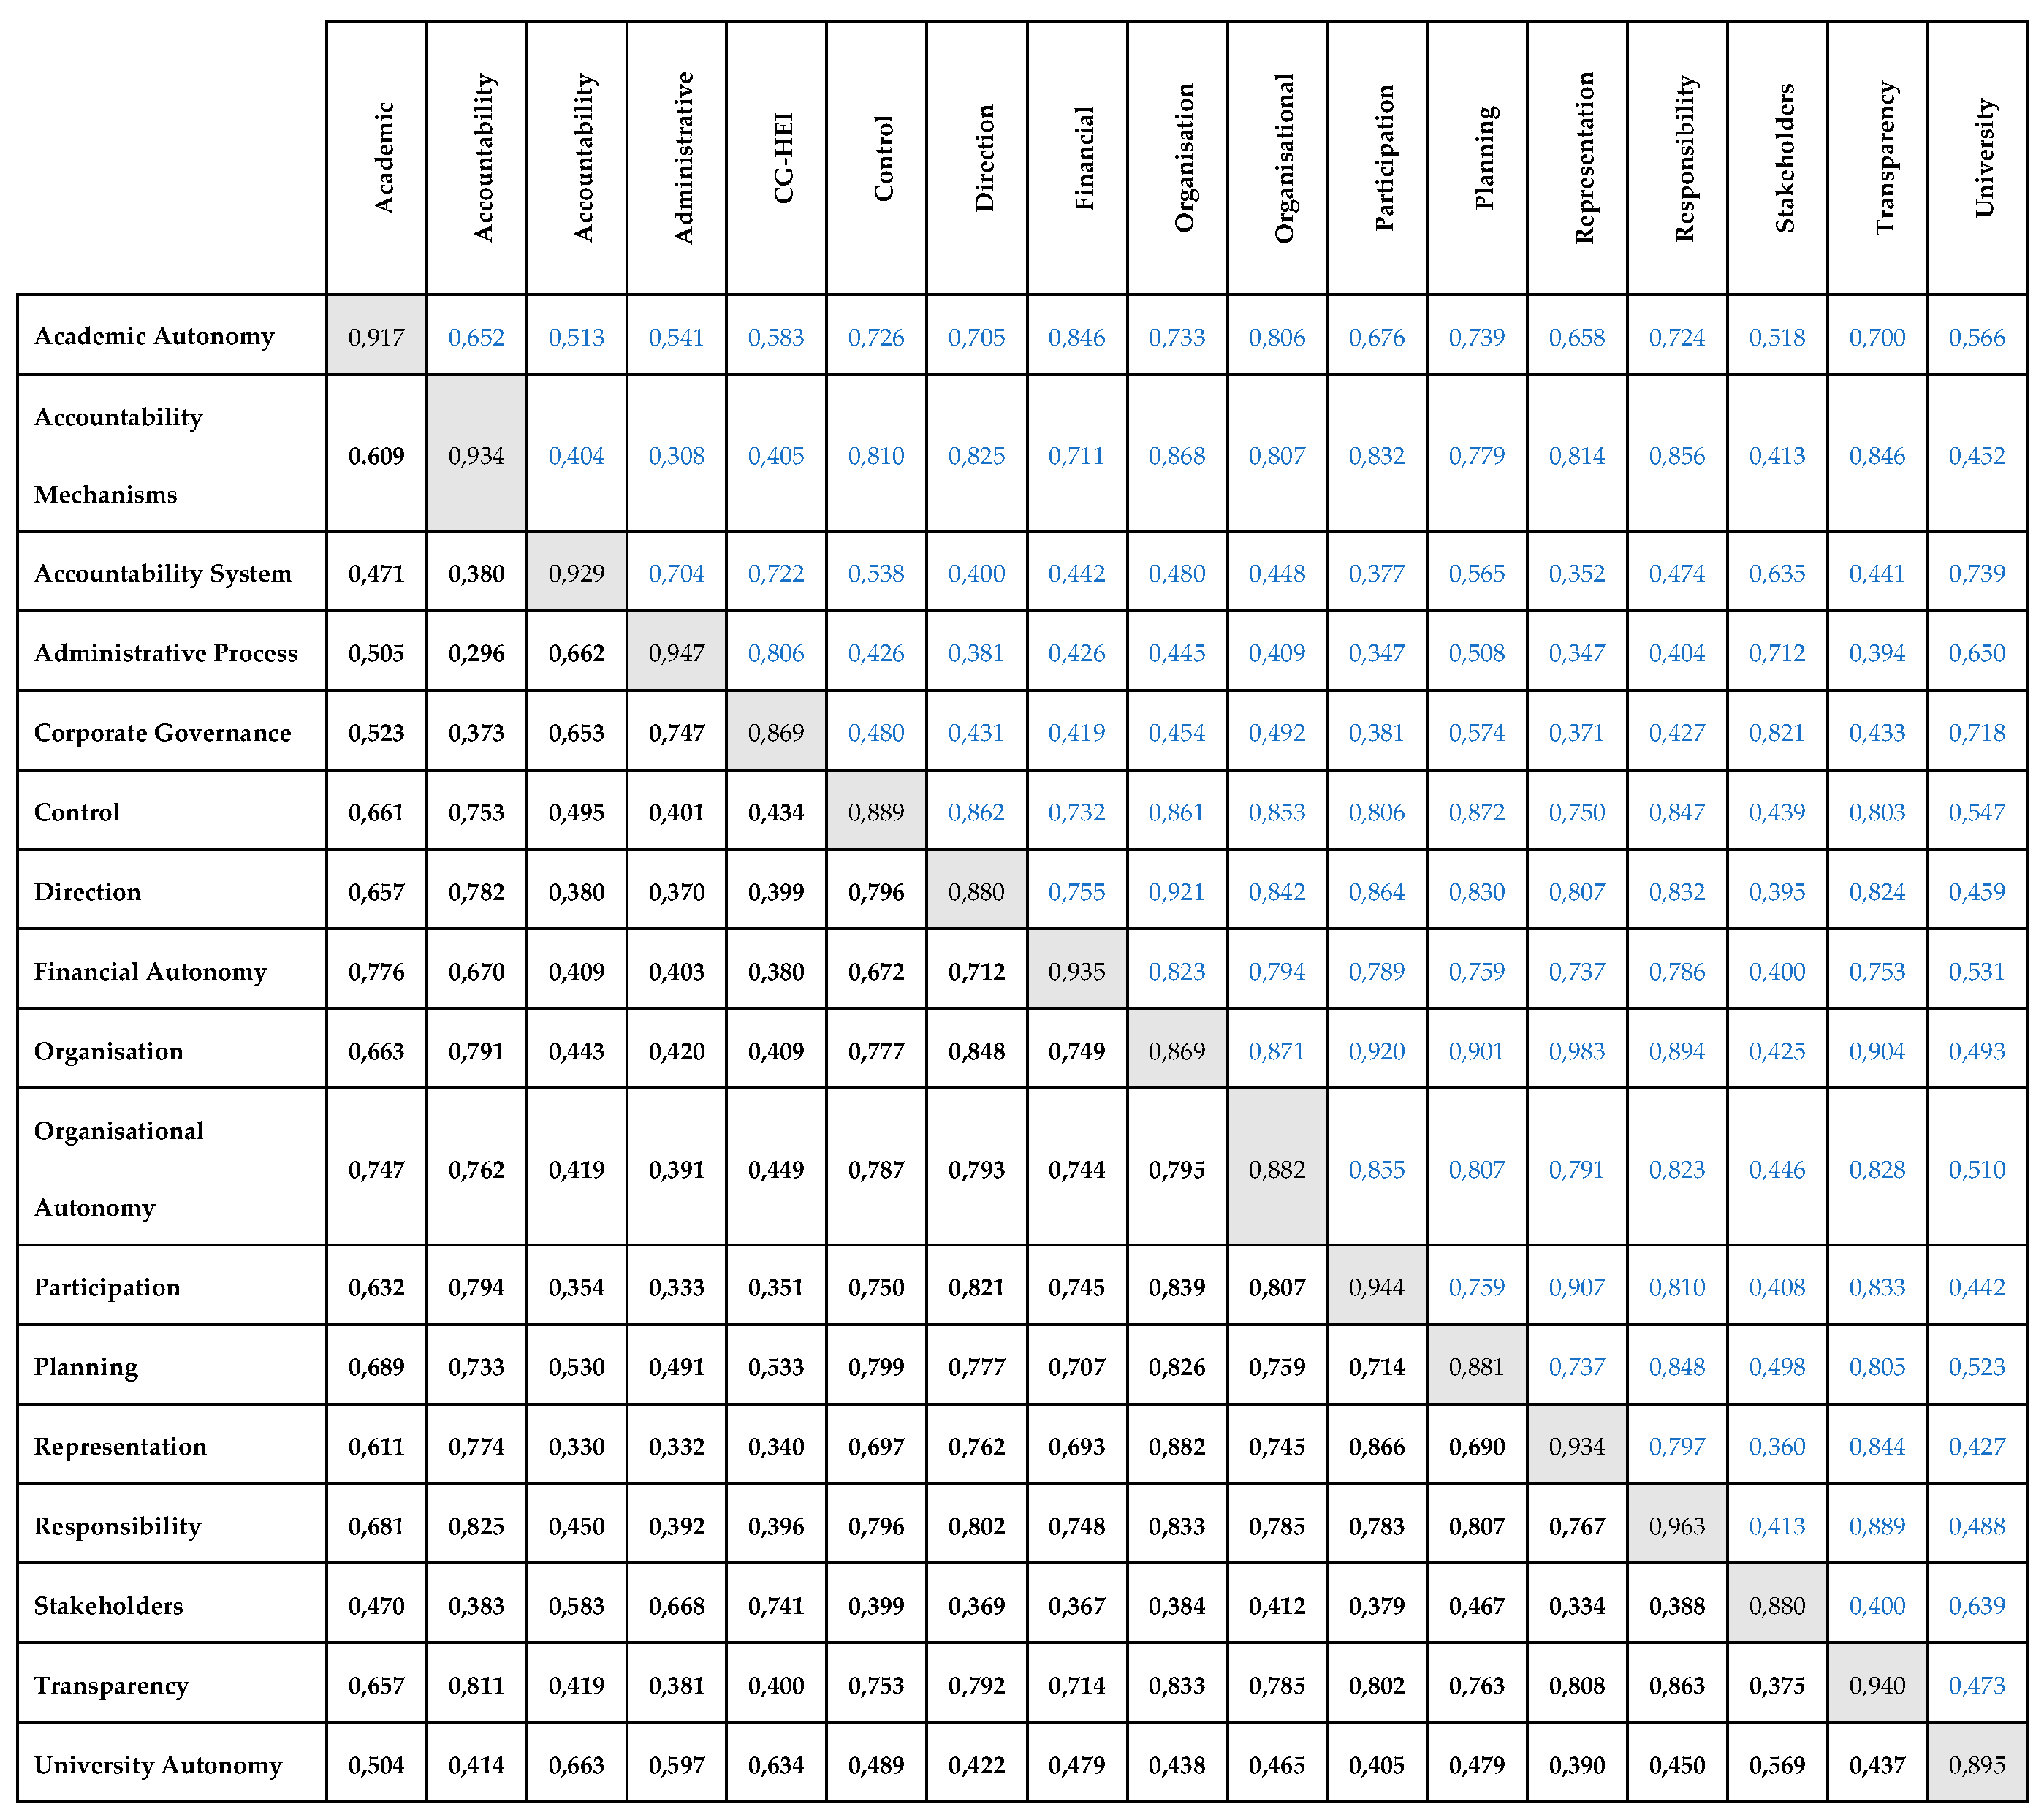 |
Source: Authors’ elaboration using SmartPLS version 4.1.0.9.
Table 5.
Results of the reflective model evaluation and results of hypothesis testing.
| Hypothesis /Path |
VIF ≤ 5 |
R 2 >0,1 |
Q 2 >0 |
Path Coefficient (Standardisedβ) β≠0 |
f2 >0 |
95% Confidence Interval of the Direct Effect (With Bias Correction) |
t-Value t >1,96 |
p-Value (p < 0,05) |
Significance | |
| H1 : CG→AP | 1,0 | 0,557 | 0,551 | 0,747 | 1,259 | (0,630; 0,823) | 15,858 | 0 | Yes | |
| H2 : CG→UA | 1,0 | 0,402 | 0,395 | 0,634 | 0,671 | (0,519; 0,723) | 12,047 | 0 | Yes | |
| H3 : CG→SH | 1,0 | 0,549 | 0,546 | 0,741 | 1,215 | (0,661; 0,801) | 20,793 | 0 | Yes | |
| H4 : CG→AS | 1,0 | 0,427 | 0,418 | 0,653 | 0,745 | (0,541; 0,746) | 12,659 | 0 | Yes | |
| H1a : AP→PLAN | 1,0 | 0,241 | 0,250 | 0,491 | 0,317 | (0,370; 0,595) | 8,778 | 0 | Yes | |
| H1b : AP→ORGN | 1,0 | 0,176 | 0,152 | 0,420 | 0,214 | (0,293; 0,518) | 7,426 | 0 | Yes | |
| H1c : AP→DIRE | 1,0 | 0,137 | 0,140 | 0,370 | 0,158 | (0,242; 0,473) | 6,371 | 0 | Yes | |
| H1d : AP→CONT | 1,0 | 0,161 | 0,165 | 0,401 | 0,191 | (0,287; 0,505) | 7,252 | 0 | Yes | |
| H2a : AU→AORG | 1,0 | 0,217 | 0,176 | 0,465 | 0,277 | (0,356; 0,556) | 9,221 | 0 | Yes | |
| H2b : AU→AACA | 1,0 | 0,254 | 0,229 | 0,504 | 0,341 | (0,396; 0,600) | 9,611 | 0 | Yes | |
| H2c : AU→AFIN | 1,0 | 0,230 | 0,135 | 0,479 | 0,298 | (0,370; 0,572) | 9,360 | 0 | Yes | |
| H3a : SH→PART | 1,0 | 0,144 | 0,114 | 0,379 | 0,168 | (0,267; 0,481) | 6,993 | 0 | Yes | |
| H3b : SH→REPR | 1,0 | 0,112 | 0,103 | 0,334 | 0,126 | (0,221; 0,438) | 5,932 | 0 | Yes | |
| H4a : AS→TRAN | 1,0 | 0,175 | 0,142 | 0,419 | 0,213 | (0,320; 0,510) | 8,580 | 0 | Yes | |
| H4b : AS→RESP | 1,0 | 0,202 | 0,144 | 0,450 | 0,253 | (0,344; 0,545) | 8,731 | 0 | Yes | |
| H4c : AS→AMEC | 1,0 | 0,144 | 0,122 | 0,380 | 0,168 | (0,278; 0,466) | 7,897 | 0 | Yes | |
| ASSESSMENT OF THE OVERALL MODEL = 0,04 (SRMR < 0,08) | ||||||||||
Source: Authors’ elaboration using SmartPLS version 4.1.0.9.
Disclaimer/Publisher’s Note: The statements, opinions and data contained in all publications are solely those of the individual author(s) and contributor(s) and not of MDPI and/or the editor(s). MDPI and/or the editor(s) disclaim responsibility for any injury to people or property resulting from any ideas, methods, instructions or products referred to in the content. |
© 2026 by the authors. Licensee MDPI, Basel, Switzerland. This article is an open access article distributed under the terms and conditions of the Creative Commons Attribution (CC BY) license (http://creativecommons.org/licenses/by/4.0/).
Copyright: This open access article is published under a Creative Commons CC BY 4.0 license, which permit the free download, distribution, and reuse, provided that the author and preprint are cited in any reuse.


