Submitted:
30 January 2026
Posted:
03 February 2026
You are already at the latest version
Abstract
Background/Objectives: Anshenbunao Syrup (ABS) enjoys robust demand in the Chinese health application owing to its steady therapeutic efficacy for insomnia and neurasthenia. However, it contains a substantial proportion of Polygoni Multiflori Radix Praeparata (PMRP), which is associated with reported cases of drug–induced liver injury (DILI). Here, we aim to establish an integrated approach combining PK screening with a dual-model toxicity verification system to systematically identify liver injury components (from high to low concentrations, and from direct to idiosyncratic hepatotoxicity) for the accurate uncovering of diverse potential hepatotoxicity markers. Methods: A sensitive UPLC-MS/MS method was used to accurately quantify the components in plasma at ng/mL level and conduct pharmacokinetic analysis. Rat models were used to evaluate exposure levels of the eight active constituents and three major metabolites after a single oral gavage dose of 10 mL/kg ABS and identify the quality markers. The early-stage and high-throughput assessment of direct and idiosyncratic hepatotoxicity was conducted in vitro utilizing HepG2 cells. After administration of the quality markers (0.01-80 μM), CCK-8 was used to detect cell viability on both normal and susceptible cells, the latter was induced by lipopolysaccharide. Results: As a result, seven quality markers were screened based on their contents and exposure levels in rat plasma by UPLC–MS/MS, including emodin (EM), liquiritin (LI), 2,3,5,4′–Tetrahydroxystilbene–2–O–β–D–glucoside (TSG), icariin, emodin–8–O–β–D–glucoside, baohuoside I (BA) and 18β–glycyrrhetinic acid (GTA). Moreover, the half maximal inhibitory concentration values of both normal cells and the lipopolysaccharide–induced immune stress liver injury cells were fitted within the concentration range of 0.01–80 μM, based on which, EM, BA, and GTA were identified as the principal hepatotoxic constituents in ABS at elevated concentrations. This study is the first to demonstrate the idiosyncratic hepatotoxicity of TSG, EM, LI, and GTA in normal hepatocytes at low concentrations, whereas EM was also the direct hepatotoxic components. Given that TSG is one of the major ingredients in ABS, the underappreciated idiosyncratic hepatotoxicity could elevate the risk of adverse clinical outcomes. Conclusion: In conclusion, this study identifies effectively hepatotoxic constituents in ABS, and evaluates their hazards under the immune stress condition and the toxicity profiles in clinical concentrations, which also provides a robust foundation for the awareness of the PMRP–induced DILI of ABS.
Keywords:
anshenbunao syrup
; pharmacokinetics
; chemical basis
; drug induced liver injury
1. Introduction
Polygoni Multiflori Radix Praeparata (PMRP), which is the processed form of Polygoni Multiflori Radix (PMR), is the key botanical material in the Anshenbunao Syrup (ABS) prescription. The Chinese Pharmacopoeia includes 53 Traditional Chinese medicines (TCMs) containing PMRP (6–12 g/day), among them ABS stands out as one of the most famous formulation with clinically validated therapeutic benefits as it can ameliorate cognitive dysfunction and attenuate neuronal degeneration [1].
However, their clinical prescriptions related hepatorenal side-reactions have raised substantial safety concerns [2,3,4]. Recent studies have indicated that the processing of PMR can reduce significantly its hepatotoxicity while modifying its pharmacological profile. The resulting processed product exhibits enhanced nourishing and anti–aging properties, which correlates with the decreased content levels of its ingredients, such as catechin, physcion (PH), emodin–8–O–β–D–glucoside (EMG), and dianthrones [5,6,7].
Nevertheless, clinical reports from multiple countries have documented cases of acute liver injury associated with both PMRP and TCMs containing PMRP, though they are administrated at the recommended dosage range that is regarded as safe [8,9]. Consequently, the confirmation of the key hepatotoxic components and their risk factors associated with PMRP and its TCMs need further investigation.
2,3,5,4′–Tetrahydroxystilbene–2–O–β–D–glucoside (TSG) has been recognized as a principal component of PMRP, demonstrating extensive biological functionalities across multiple physiological processes. It alleviates myocardial ischemia/reperfusion injury, both in vivo and in vitro, by activating the Notch1/Hes1 signaling pathway and inhibiting endoplasmic reticulum stress–induced apoptosis [10]. Besides, TSG enhances melanogenesis in B16 cells through activation of mitogen–activated protein kinase and upregulation of tyrosinase [11], ameliorates female ovarian aging [12], and exhibits osteoblast differentiation–promoting activity [13]. Emodin (EM) is also a classical bioactive constituent of PMRP, which can trigger ferroptosis in colorectal cancer cells via NCOA4–mediated ferritinophagy and inactivation of the NF–κB signaling pathway [14]. However, EM exhibits the most pronounced hepatotoxicity among the major anthraquinones in PMRP, with documented associations to hepatic cholestasis, intracellular glutathione depletion and nephrotoxicity [15,16]. Moreover, the anthraquinone glycosides (e.g., EMG) in processed PMRP undergo hydrolysis into their corresponding aglycones (e.g., EM) in the gastrointestinal tract, thereby enhancing their systemic bioavailability [16,17]. Thence, the collective toxicological effects of ABS components and their pharmacokinetic interactions may potentiate the multifactorial liver damage induced mainly by PMRP through ABS administration.
Drug–induced liver injury (DILI) represents a clinically significant adverse reaction that accounts for a substantial proportion of acute liver failure cases and an important contributor to post–marketing drug withdrawals [18,19,20], which can be classified as being direct (i.e., dose–dependent, intrinsic, and predictable), idiosyncratic (IDILI, i.e., largely dose–independent, multifactorial, and unpredictable) and indirect (i.e., dose–independent, secondary, and unpredictable) [21]. The comprehensive evaluation of DILI cases necessitates the systematic exclusion of alternative etiologies of liver injury, including the viral hepatitis, metabolic liver diseases, autoimmune hepatitis, and pancreaticobiliary disorders [22]. Recent studies have demonstrated significant associations between initial biochemical markers, such as the metabolism extent, the levels of total bilirubin and alkaline phosphatase at the onset of DILI, and the progression timeline of DILI [21,23,24]. Particularly, IDILI cases are unpredictable in a minority of patients, and clinically categorized into hepatocellular, mixed, and cholestatic phenotypes, which facilitates the differential diagnosis of other potential hepatotoxic etiologies [25,26]. Emerging evidence indicates that genetic factors, such as polymorphisms within the human leukocyte antigen (HLA) region, as well as environmental factors, including comedications and infections, may modulate individual susceptibility to IDILI [23,27]. For example, HLA–B*35:01 has been implicated in hepatotoxicity associated with Polygonum multiflorum in Asian populations.
While PMRP–enriched ABS exhibits well–documented therapeutic efficacy and remains with good clinically application, sporadic liver–injury adverse reactions persist [28]. PMR, the botanical precursor to PMRP, has been specifically listed as a distinct entry in the DILI database released by the U.S. National Library of Medicine [29]. Given this, it becomes essential to advance current understanding regarding the phytochemical constituents, pharmacokinetic profiles, and molecular pathways underlying the hepatotoxicity of ABS.
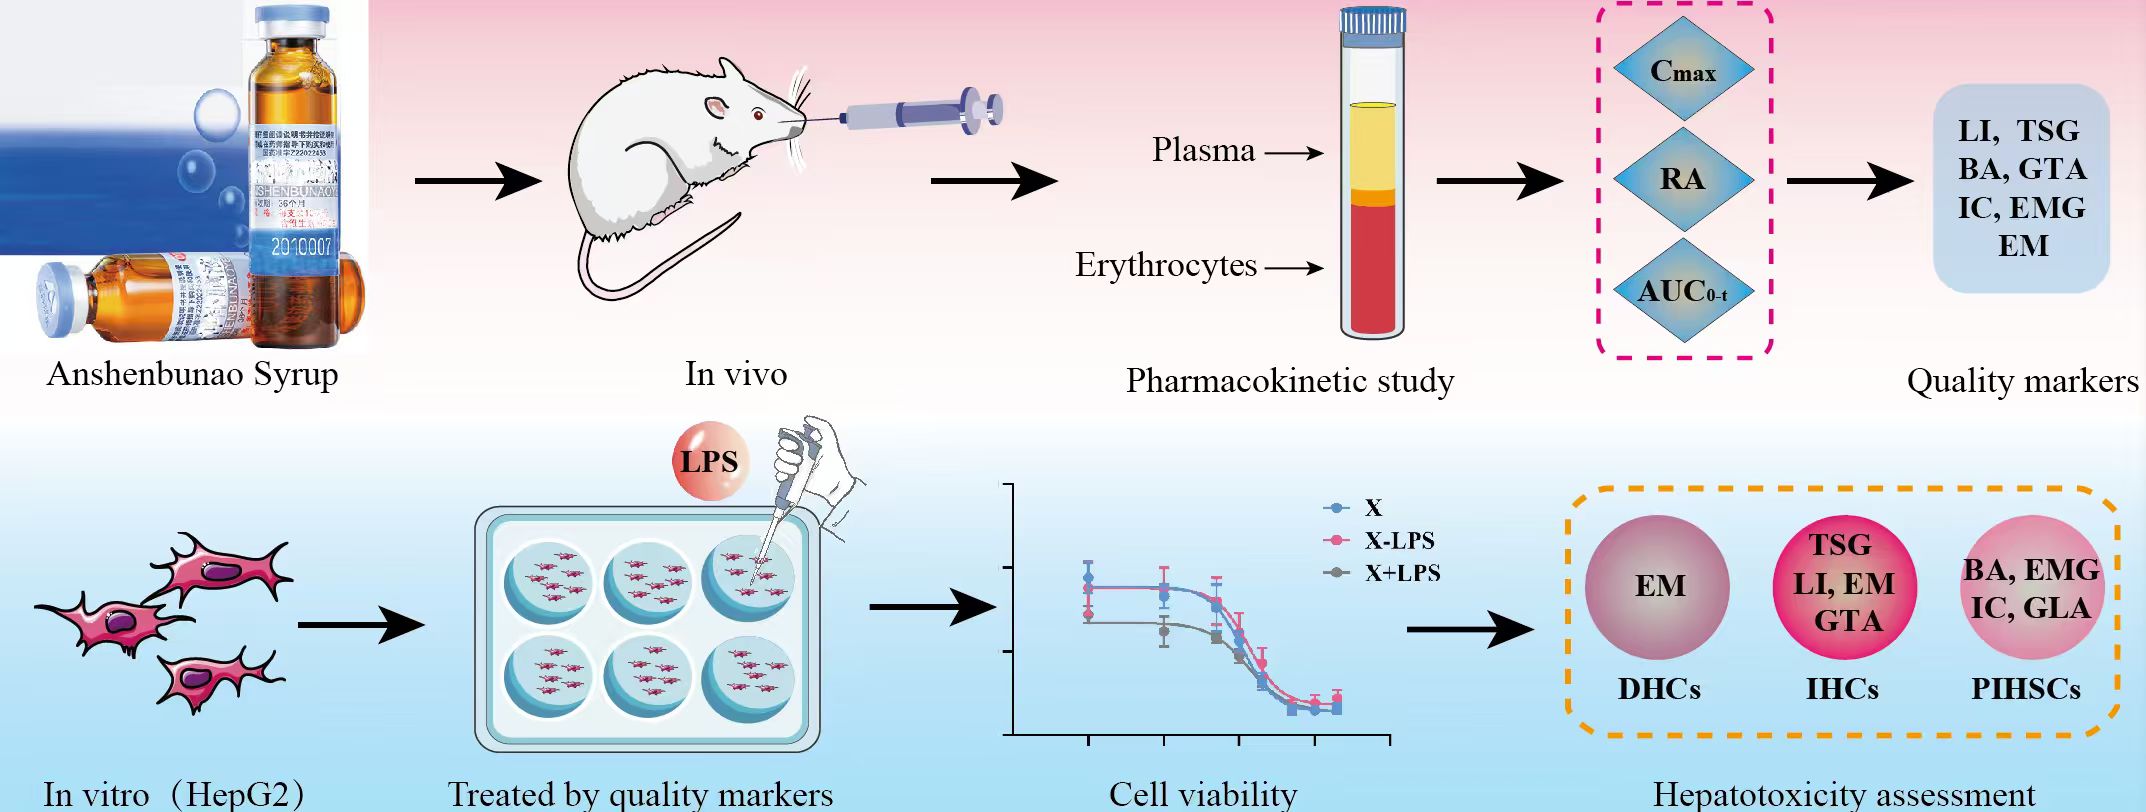
This investigation has determined the contents of the characteristic constituents of ABS and integrates them with the rats’ pharmacokinetic analyses to evaluate the in vivo exposure levels of these phytochemicals and their metabolites, thereby the representative quality markers of ABS are identified as well, which based on “PK screening and dual-model verification ” are essential for both the quality control and the potential hepatotoxicity evaluation [30,31,32]. Through this study, seven quality marker components in ABS have been identified in rats following oral administration of ABS using a validated UPLC–MS/MS method. Subsequently, these components are comparatively evaluated for the hepatotoxicity using both normal and immune–stressed hepatocyte cell models in vitro to reveal the toxic components in ABS and elucidate the material basis of the hepatotoxic effects. This study is the first to demonstrate the idiosyncratic hepatotoxicity of TSG, EM, LI, and GTA in normal hepatocytes at low concentrations, and EM retains hepatotoxic activity even at a concentration as low as 0.1 μM. These findings may offer useful chemical basis for rational clinical application of PMRP and ABS formulations.
2. Results
2.1. Quantitative Analysis of the Key Components in ABSs
Eight key components in the utilized ABSs were determined in the experiment (Figure S1). The linear calibration ranges for the determination of TSG, GLA, LI, EMG, and EM in ABS were Y=6.74×10³X+1.57×10⁵ (R2=0.9982, 1.0-2000 μg/mL), Y=4.91×10⁴X-5.62×10³ (R2=0.9998, 1.0-250 μg/mL), Y=2.00×10⁴X-7.21×10³ (R2=0.9990, 1.0-250 μg/mL), Y=1.08×10⁴X-1.84×10³ (R2=1.0000, 1.0-100 μg/mL), Y=6.40×10⁴X-1.13×10⁵ (R2=0.9999, 0.5-250 μg/mL), respectively. The contents of IC, EP-C and EP-B were determined using the methods outlined in the Chinese Pharmacopoeia, with IC as the reference standard, in which the corresponding correction factors were 1.00, 1.22 and 1.28, respectively. Accordingly, the contents of the eight key components were listed in Table 1.
2.2. Rats Plasma Pharmacokinetics of ABS with a Single Oral Administration
In addition to the 8 major components of each TCMs (IC, TSG, EP–C, EP–B, LI, GTA, EMG, EM), certain representative metabolites (BA, 2'–O–RI Ⅱ, and SA–B) were also included in the in vivo studies (Table S1-S2), thereby enabling the comprehensive identification of quality–representative key components through the amalgamation of in vivo and in vitro data.
The experiment investigated the plasma exposure of eleven characteristic constituents of ABS, including several metabolites, in normal rats following a single intragastric administration at a volume of 10 mL/kg. To evaluate the in vivo exposure of these characteristic constituents, pharmacokinetic parameters were established in rats to evaluate the PEI and TEI, respectively (Figure 1). As a result, a set of seven representative quality markers of ABS was identified from eleven components, including IC, BA, TSG, LI, GTA, EMG, and EM. Their structures are presented in Figure S3.
The mean plasma concentration–time profiles of the seven ABS quality marker constituents after a single oral administration in rats are shown in Figure 2. The rat’s plasma pharmacokinetic parameters evaluated include the plasma peak concentration (Cmax) and the corresponding peak time (Tmax), the area under the plasma concentration–time curves (AUC0–t), and the terminal elimination half-life time (t1/2) for these main components found in vivo.
2.3. Sources and Attribution of the Principal Constituents in ABS
2.3.1. Epimedii Folium: IC and Its Metabolites
IC represents the component with the highest mean content in ABSs, and BA is the primary metabolite of IC, formed via intestinal transformation. A secondary absorption phase of BA emerges after 4 hours, corresponding to the point at which plasma concentrations of IC has been markedly reduced (Figure 2C, E).
2.3.2. PMRP: TSG, EM, and EMG
The average content of TSG in ABS is second only to IC. Its Tmax in ABS is approximately 6 minutes, indicating rapid absorption and entry into the systemic circulation. With a t1/2 of 2.46 hours, TSG demonstrates the second–shortest elimination time among the seven representative quality markers, suggesting rapid metabolism in the body and a relatively short duration of pharmacological action (Table 2). EM exhibits a secondary plasma concentration peak approximately 2 hours post–administration (Figure 2F). EMG shows near–total elimination from plasma after 2 hours (Figure 2D).
2.3.3. Glycyrrhizae Radix et Rhizome: GTA and LI
With the exception of GTA, the other six components attain peak blood concentrations are within one hour after a single dose, indicating a relatively rapid absorption rate. In contrast, the Tmax of GTA is 11 hours, and its t1/2 is relatively prolonged at 8.70 hours (Figure 2G). The AUC0–t for LI is second only to that of GTA (Table 2).
2.4. Optimization of Concentration Range for the Target Compounds
The study systematically evaluated the cytotoxicity of seven ABS quality markers and the original component GLA of GTA on HepG2 cells. The experimental design comprised three treatment groups X, X–LPS and X+LPS, with the X representing a set of eight distinct components. The X group represented the direct test group, whereas the X–LPS and X+LPS groups employed models involving co–administration with LPS. Specifically, in the X–LPS group, LPS was added to the blank control at a concentration of 10 μg/mL. Eight different substrate concentrations were prepared for the experiment (Figure 3). The concentrations were set as follows: EM at 0.01, 0.1, 0.5, 1, 2, 5, 10, and 20 μM; BA at 0.1, 1, 3, 5, 7, 10, 20, and 40 μM; GTA at 0.1, 1, 5, 10, 15, 20, 40, and 60 μM; and the remaining five components at 0.1, 1, 5, 10, 20, 40, 60, and 80 μM.
2.5. Hepatotoxic Effects of the Target Compounds in HepG2 Cells
The half maximal inhibitory concentration (IC50) values of the eight target compounds were calculated from the concentration–cell viability curves. As shown in Figure 3, EM exhibits a low IC50 value of 1.12 μM in HepG2 cells. Additionally, BA and GTA demonstrate hepatotoxic effects, with IC50 values of 6.97 μM and 12.8 μM, respectively. EM, BA, and GTA exhibit significantly greater hepatotoxic potential compared to the other five substances under these in vitro conditions (Figure 3C, F, G). EMG, IC and GLA exhibit relatively low inherent hepatotoxicity within the tested concentration range (0.1–80 μM) (Figure S4). TSG and LI are found to exhibit no hepatotoxic effects within the therapeutic concentration range. Notably, TSG confers a moderate hepatoprotective effect at high concentrations. However, it is observed that both TSG and LI elicit signs of hepatic damage in the LPS–induced immune stress hepatocyte model (Figure 4). Except for the 0.1 μM GTA, 5 μM IC and 0.1 μM LI group, no statistically significant differences are observed between the X–LPS group and the X group across all concentrations of the other five substances (P > 0.05) (Figure 5). In the X+LPS group, GTA demonstrates a significant inhibitory effect (P < 0.05). In contrast, both LI (P < 0.05) and the high–concentration of IC (P < 0.01) have exhibited synergistic effects by enhancing HepG2 cell viability.
2.6. Screening the Idiosyncratic Hepatotoxic Components of ABS
Given that low–concentration scenarios more accurately reflect clinical reality, they warrant particular emphasis and more detailed analyses. At a concentration of 0.1 μM, EM exhibits direct cytotoxicity toward normal cells (P < 0.05), and this toxicity has been further exacerbated under LPS–mediated cell susceptibility conditions (P < 0.01) (Figure 4A). In contrast to their absence of cytotoxicity on normal cells under the tested conditions, TSG, LI, and GTA demonstrate significant increased cytotoxicity in LPS–mediated susceptible cells with P < 0.05, P < 0.01, and P < 0.001, respectively (Figure 4C, D, H). BA, EMG, IC and GLA exhibit no significant cytotoxicity in either normal or susceptible cells; however, statistically significant differences have been observed in their cytotoxicity toward these two cell types (P < 0.01, P < 0.01, P < 0.05, P < 0.0001, respectively) (Figure 4B, E, F, G). Their cytotoxicity is markedly amplified in susceptible cells.
3. Discussion
Studies have demonstrated that ABS effectively ameliorates cognitive dysfunction through suppression of amyloid-β accumulation and phosphorylation Tau aggregation, collectively attenuating neuronal degeneration [1]. Additionally, it exhibits comparable or lower incidence rates of gastrointestinal disturbances and dizziness compared to Western medications or placebo controls [33]. As a result, ABS demonstrates substantial demand in clinical practice within China due to its consistent therapeutic efficacy. However, the proportion of PMRP is as high as 42.4% in the formulation of ABS, and its clinical usage has been associated with reported cases of abnormal liver function biochemical indicators [8,9]. Therefore, it is imperative to identify the hepatotoxic constituents of ABS and elucidate their metabolic profiles in vivo, thereby providing a scientific basis for rational drug administration and mitigating potential safety risks in clinical practice.
The quantitative analysis of the constituents in ABS indicates that IC exhibited the highest content of 234.5 μg/mL and served as the sole quality control marker for content determination specified in the Chinese Pharmacopoeia (no less than 60 μg/mL). The concentration of TSG ranked second, following closely behind that of IC. Therefore, from a content standpoint, the primary active ingredients of ABS are derived from Epimedii Folium and PMRP.
The pharmacokinetic profile of key bioactive constituents in TCMs has been utilized to predict their therapeutic efficacy and potential toxicological implications [34]. The PEI and TEI were employed to evaluate the in vivo exposure levels of individual components and their metabolites. The greater are the values of PEI and TEI, the higher will be the in vivo exposure of the investigated constituents. Seven from eleven components were screened based on their contents and exposure levels in rat plasma as the quality markers of ABS. Compared with the monomer [35], intragastric administration of ABS resulted in a shortened t1/2 of IC, suggesting an accelerated elimination of IC from the body. This observation is consistent with the ability of certain components in ABS to induce the activity of metabolic enzymes, particularly the cytochrome P450 enzyme system, in the liver or intestine, thereby enhancing the rate of metabolic conversion [36,37]. Notwithstanding the various effects attributable to IC, such as tonifying kidney yang and dispelling wind–dampness, the hepatotoxic risk associated with its principal metabolite, BA, lacks supporting biological data. It is therefore imperative to conduct cellular–level studies to clarify this risk.
TSG is the principal bioactive component of PMRP, demonstrating a spectrum of pharmacological activities such as anti–inflammatory, anti–aging, antioxidant, hepatoprotective, and antitumor effects [10,11]. PMRP is processed through the traditional method of "nine cycles of steaming and drying." This process is arduous, requiring significant time and energy, and serves to attenuate toxicity while potentiating therapeutic efficacy, thereby transforming the properties of the raw PMR [38]. Although TSG possesses significant pharmacological activity, its safety profile, particularly regarding hepatotoxicity, has long been questioned, necessitating further conclusive research. The secondary plasma concentration peak of EM is attributed to fluctuations in blood drug levels caused by enterohepatic circulation and reabsorption [15,16]. Metabolic transformation represents another key contributing factor underlying the observed pharmacokinetic profile (Figure 2F). Conjugated anthraquinones like EMG are partially absorbed into the bloodstream in the small intestine, where they undergo hepatic metabolism to form free anthraquinones. The unabsorbed fraction undergoes microbial metabolism by colonic microbiota into free anthraquinones, thereby enabling subsequent absorption through the colonic wall [16,17]. These findings are in alignment with the observed elimination profile of EMG (Figure 2D). Given that EM is a potential factor of liver injury, and the level of EMG influences the final systemic exposure to EM undergoing metabolic transformation in vivo, rigorous quality control of EMG, a currently overlooked aspect, becomes essential.
LI and GTA are the principal constituent or major metabolite of Glycyrrhizae Radix et Rhizome, and they exhibit a broad spectrum of biological activities, including potent antioxidant, anti–inflammatory, antiviral, antitumor, and immunomodulatory activities [39]. The delayed pharmacokinetic profile of GTA is due to the fact that, under the influence of intestinal symbiotic bacteria, its precursor GLA is converted to the active metabolite GTA via the enzymatic hydrolysis and removal of two glucuronic acid molecules (Figure 2G).
In this study, the dual-model toxicity verification was used to screen the ABS active components related to their both direct and idiosyncratic hepatotoxic effects from high to low concentrations. The results suggest that BA, EM, and GTA exhibit direct cytotoxic effects and are considered to represent the substance basis for the hepatotoxicity of ABS (Figure 3C, F, G). Although EMG, IC and GLA exhibit relatively low inherent hepatotoxicity, they are considered indirect hepatotoxicants through their metabolic conversion into EM, BA and GTA in vivo [5,40,41], respectively, thereby representing non–negligible risk factors for liver injury. The hepatoprotective effect of TSG at high concentrations is in consistence with the literature results [42]. The lack of significant differences between the X–LPS and X groups for most substances suggests that the interaction between these substances and LPS are negligible. The biological activities of the compounds vary considerably under immune stress. The synergistic hepatoprotective effects observed for IC and LI in the X+LPS group are in consistence with their previously reported hepatoprotective effects [43,44].
Based on the analysis of hepatotoxic components at the relatively low concentrations, EM is the singular direct hepatotoxic component (DHC) (Figure 4A). Previous studies have suggested that mild immune stress (MIS) may be one of the susceptibility-related factors of IDILI caused by ABS [45]. In this paper, we found that the same dose of four components (TSG, EM, LI, and GTA) caused abnormal liver damage in MIS model cells, while it did not result in liver injury in normal cells, further confirming that MIS is a susceptibility factor for ABS-IDILI. This study is the first to categorize TSG, EM, LI, and GTA in ABS as the idiosyncratic hepatotoxic components (IHCs). Notably, the TSG content in ABS is considerably high. Thus, uncovering its previously neglected risks related to IHCs carries substantial clinical importance. Furthermore, BA, EMG, IC and GLA, while not cytotoxic in either condition, show amplified effects in susceptible cells, implicating their potential role as idiosyncratic hepatotoxicity susceptibility components (PIHSCs). Consequently, EM and TSG emerge respectively in ABS as the most typical DHC (at both high and low concentrations) and IHC approaching clinical levels. This strategy will facilitate the accurate detection of diverse potential hepatotoxicity markers, which can then be applied to investigate the toxicological basis, pharmacological mechanisms and therapeutic drug monitoring.
4. Materials and Methods
4.1. Experimental Reagents
The Cell Counting Kit–8 (CCK–8) was purchased from UElandy Biotechnology Co., LTD (Suzhou, China). Chemical reference standards of TSG, EMG, EM, liquiritin (LI), icariin (IC), 18β–glycyrrhetinic acid (GTA), glycyrrhiic acid (GLA), epimedin B (EP–B), epimedin C (EP–C), 2'–O–rhamnosylicariside Ⅱ (2'–O–RI Ⅱ), and sagittatoside B (SA–B), were obtained from Shanghai Yuanye Biotech Co., Ltd (Shanghai, China) with HPLC ≥ 98%. Baohuoside I (BA) and 1,8–dihydroxyanthraquinone (as the IS for the MS/MS determination) were purchased from Chengdu Pufei De Biotech Co., Ltd (Chengdu, China) with HPLC ≥ 98%. HPLC–grade methanol was obtained from Tedia Company, Inc. (Fairfield, OH, USA). Lipopolysaccharide (LPS) (Escherichia coli 055:B5) was obtained from Sigma–Aldrich (Shanghai, China). The ABS (Lot: 2205656) was purchased from Jilin Aodong Pharmaceutical Group Co. Ltd. (Jilin, China), and the specification of ABS was 10 mL per bottle. Analytical grade ethyl acetate and acetic acid were supplied by Nanjing Chemical Reagent Co. Ltd. (Nanjing, China). Ultrapure water was prepared using a Millipore purification system (Millipore, MA, USA).
4.2. Animals
Specific Pathogen–Free (SPF)–grade male Sprague–Dawley (SD) rats, aged 6–8 weeks and weighing 180–220 g, were purchased from Shanghai SIPPR–BK Laboratory Animal Co., Ltd. (License No.: SYXK 2023–0009). All rats were acclimatized in the laboratory for a week and kept under specific pathogen–free conditions: 25 ± 5°C, 50 ± 20% humidity, 12/12 h light/dark cycle, with free access to food and water. All animal studies are carried out in accordance with the Guide for the Care and Use of Laboratory Animals by the Chinese Association for Laboratory Animal Science, and approved by the Animal Experiment Ethics Review Committee of China Pharmaceutical University (Ethical Approval No.: 202409132). The study is reported in accordance with the ARRIVE (Animal Research: Reporting of In Vivo Experiments) guidelines.
4.3. Pharmacokinetic Study
All rats underwent an acclimate period of a week, and an overnight fasting with free access to water only. Six rats were randomly selected and administered the ABS. Each rat was administered with a single ABS oral gavage dose of 10 mL/kg. Blood samples (approximately 150 μL) were collected from the orbital venous plexus using heparinized tubes at predefined time points (0, 0.033, 0.083, 0.167, 0.25, 0.5, 0.75, 1, 2, 4, 6, 8, 10, 12, 24, 36, 48 and 60 h) post–administration. The rats were given a 1 mL intragastric administration of saline at 2, 4 or 6 hours post the administration, and provided with unrestricted access to food and water thereafter throughout the experimental period. The plasma samples were obtained through centrifugation of the bloods at 400 g force for 10 minutes at 4 °C, and stored in Eppendorf tubes at −80 °C until analysis. An aliquot of 50 μL plasma was spiked with 10 μL of the internal standard (IS, 500 ng/mL), 0.2 mL saline and 0.5 mL ethyl acetate. The mixture was vortex-mixed for 5 minutes and centrifuged at 12,000 g force, 4 °C for 10 minutes to facilitate the analytes extraction. The supernatant was carefully collected and evaporated to dryness at 40 °C using a ZLS–1 vacuum centrifugal concentrator. The residue was reconstituted with 100 μL of methanol–water solution (60:40, v/v) by vortex–mixing for 5 minutes, and a centrifugation at 12,000 g force, 4 °C for 10 minutes. Then, an aliquot of 10 μL of the resulting supernatant was injected into the UPLC–MS/MS system for the analysis.
The ABSs sourced from Jilin Aodong Pharmaceutical Group Co. Ltd. were utilized in the experiment. HPLC analysis for eight key components in the ABS was based on the previously reported method by our team [9] and was performed at a flow rate of 1.0 mL/min, using acetonitrile and water containing 0.1% phosphoric acid as the mobile phases A and B, respectively. The elution program was set as follows (A:B): 0 min (10:90) → 10 min (20:80) → 20 min (30:70) → 40 min (45:55) →55 min (90:10) → 59 min (90:10) → 60 min (10:90). PDA detection wavelength was 254 nm.
4.4. Evaluation of Plasma Exposure Level
The peak exposure indices (PEI) and total exposure indices (TEI) were calculated using the following formula, in which n represented each compound: PEI = max (n) / (max) max, TEI = (n) / max. The quality markers of ABS were identified by considering the regression area (RA) of each compound after data normalization (RA ≥ 0.9 × ) based on their plasma exposure levels.
4.5. Plasma Samples UPLC–MS/MS Assay Parameters
An UPLC-MS/MS system (TSQ Quantis, Thermo Scientific, San Jose, CA, USA) equipped with a heated electrospray ionization interface (HESI) operating in the negative ion mode was used for the plasma samples analysis of IC, BA, TSG, EP–C, 2'–O–RI Ⅱ, EP–B, SA–B, GTA, LI, EMG, and EM. Chromatographic separation was achieved on a Thermo BDS Hypersil C18 column (100 × 4.6 mm, 3 µm) with linear gradient elution at 0.7 mL/min using methanol and water both containing 0.1% acetic acid as the mobile phases A and B, respectively. The elution program was set as follows (A:B): 0 min (30:70) → 1 min (30:70) → 3 min (95:5) → 6.5 min (95:5) →7 min (30:70) → 8 min (30:70). The column temperature was maintained at 40°C. Representative chromatograms for all 11 components were provided in Figure S2. The MS conditions were as follows: spray voltage of – 4.5 KV; ion transfer tube temperature and vaporizer temperature of 350°C; nitrogen sheath gas of 241 kPa; and auxiliary gas of 35 kPa. The quantification analysis was conducted under the multiple reaction monitoring (MRM) mode with the argon gas collision–induced dissociation (CID) pressure set at 0.2 Pa. The ion reactions were set as follows: m/z 721.5@18eV → 513.1 for IC, m/z 513.0@26eV → 366.0 for BA, m/z 405.3@19eV → 243.0 for TSG, m/z 867.4@20eV → 659.1 for EP–C, m/z 659.5@ 33eV → 365.9 for 2'–O–RI Ⅱ, m/z 853.5@18eV → 645.1 for EP–B, m/z 645.5@34eV → 366.0 for SA–B, m/z 469.5@38eV → 425.1 for GTA, m/z 417.3@20eV → 255.0 for LI, m/z 431.1@30eV → 268.9 for EMG, m/z 269.0@20eV → 225.0 for EM, and m/z 239.2@27eV → 210.9 for IS.
4.6. Cell Culture
HepG2 cells were purchased from the Cell Bank of Chinese Academy of Sciences (Shanghai, China) and cultured in Roswell Park Memorial Institute (RPMI–1640) with 10% fetal bovine serum and 1% penicillin–streptomycin at 37 °C in a humidified atmosphere of 5% CO2. The culture medium was refreshed at least every two days to maintain exponential growth.
4.7. Evaluation of Hepatotoxicity In Vitro
When conducting an experiment, cells were cultured overnight in a 96–well plate at 8×10³ cells/well, after which the inhibitory effects of seven target compounds (TSG, LI, BA, IC, EM, EMG and GTA) and GLA, the original component of the metabolite GTA, on the proliferation of HepG2 cells were evaluated in a series of concentrations using the CCK–8 assay. Simultaneously, additional experimental groups were established based on whether or not the control group was supplemented with LPS. A separate batch of HepG2 cells was seeded into 96–well plates and cultured for 24 hours and, thereafter, the cells were co–cultured with 10 μg/mL LPS and each of the eight target compounds at varying concentrations for 48 hours. The culture medium was subsequently removed, and a 10% CCK–8 working solution was added to each well, followed by incubation for 1 hour. The optical density (OD) value of each well was measured at a wavelength of 450 nm using a microplate reader (Thermo Fisher, USA). Cell viability was calculated using the following formula: Cell viability (%) = (OD sample–OD blank)/(OD control–OD blank) × 100.
4.8. Statistical Analysis
WinNonlin software version 7.0 (Pharsight, St. Louis, MO, USA) was used to analyze pharmacokinetic parameters. The mean plasma concentration–time profiles of the representative components were plotted using Origin 2024b (OriginLab Corporation, Massachusetts, USA) and the data were expressed as mean ± standard error. Statistical differences between two groups were determined using GraphPad Prism 8.0 (GraphPad Software Inc., San Diego, CA) via a two–tailed Student’s t–test, and one–way ANOVA was used for three or more groups of data. p < 0.05 was considered as statistical significance.
5. Conclusions
ABS is an OTC TCM formulation with very big annual consumption due to its remarkable therapeutic effects and widespread clinical indications. In this study, seven representative quality marker components of ABS have been identified leveraging the UPLC–MS/MS, with three derived from PMRP. Furthermore, cellular–level hepatotoxicity assessments elucidate the substance basis underlying ABS–induced liver injury related with the relatively high dose level of PMRP. Unlike conventional toxicity evaluations that predominantly employ high–concentration exposures, our work has identified one DHC and four IHCs under low–concentration conditions approximating clinical dosage regimens. This study will provide a scientific foundation for the rational clinical application of ABS. However, the plasma concentrations of various components in rats remain relatively low and demonstrate significant inter–individual variability owing to limitations associated with the administration method, in which no concentration or lyophilization processes are applied to guarantee complete absorption of all constituents, including volatile compounds.
Supplementary Materials
The following supporting information can be downloaded at the website of this paper posted on Preprints.org. Table S1. The linear range, regression data and LLOQ for the determination of eleven characteristic components in ABS for their plasma exposure evaluation by UPLC-MS/MS. Table S2 Summary of method validation results for eleven key components of ABS in rats’ plasma samples. Figure S1. HPLC–UV chromatograms of eight key components determined in the ABS. Figure S2. UPLC–MS/MS chromatograms of eleven components determined in the rats’ plasma samples. Figure S3. Chemical structures of the quality marker components associated with ABS. Figure S4. The primary metabolic pathways and corresponding metabolites of the three glucoside types or their analogs.
Author Contributions
L.C: Writing–review & editing, Investigation, Formal analysis, Data curation. Z.W: Writing–review & editing, Conceptualization. R.C. and P.H.: Investigation, Formal analysis. S.W., W.W. and A.I.: Data curation, Supervision. Y.Z and F.C.: Formal analysis, Supervision. T.H.: Conceptualization, Validation. All authors have read and agreed to the published version of the manuscript.
Institutional Review Board Statement
All animal studies are carried out in accordance with the Guide for the Care and Use of Laboratory Animals by the Chinese Association for Laboratory Animal Science, and approved by the Animal Experiment Ethics Review Committee of China Pharmaceutical University (Ethical Approval No.: 202409132). The study is reported in accordance with the ARRIVE (Animal Research: Reporting of In Vivo Experiments) guidelines.
Data Availability Statement
The original contributions presented in the study are included in the article/Supplementary Material, further inquiries can be directed to the corresponding author.
Acknowledgments
This work was financially supported by National Key Research and Development Program of China (No. 2024YFF1106702).
Conflicts of Interest
The authors declare that they have no known competing financial interests or personal relationships that could have appeared to influence the work reported in this paper.
List of Abbreviations
| ABS | Anshenbunao Syrup |
| BA | baohuoside I |
| DHC | direct hepatotoxic component |
| PMRP | Polygoni Multiflori Radix Praeparata |
| DILI | drug induced liver injury |
| EM | emodin |
| LI | liquiritin |
| TSG | 2,3,5,4′–Tetrahydroxystilbene–2–O–β–D–glucoside |
| GTA | 18β–glycyrrhetinic acid |
| PMR | Polygoni Multiflori Radix |
| TCM | traditional Chinese medicine |
| EMG | emodin–8–O–β–D–glucoside |
| HLA | human leukocyte antigen |
| EP–B | epimedin B |
| EP–C | epimedin C |
| 2'–O–RI Ⅱ | 2'–O–rhamnosylicariside Ⅱ |
| SA–B | sagittatoside B |
| HESI | heated electrospray ionization interface |
| OD | optical density |
| Cmax | plasma peak concentration |
| Tmax | corresponding peak time |
| AUC0–t | area under the plasma concentration–time curves |
| t1/2 | terminal elimination half-life time |
| IHC | idiosyncratic hepatotoxic component |
References
- Sun, Y.; Xia, Q.; Du, L.; Gan, Y.; Ren, X.; Liu, G.; Wang, Y.; Yan, S.; Li, S.; Zhang, X. Neuroprotective effects of Anshen Bunao Syrup on cognitive dysfunction in Alzheimer's disease rat models. Biomed. Pharmacother. 2024, 176, 116754. [Google Scholar] [CrossRef]
- He, X.; Liu, J.; Long, G.; Xia, X.; Liu, M. 2, 3, 5, 4′-Tetrahydroxystilbene-2-O-β-D-glucoside, a major bioactive component from Polygoni multiflori Radix (Heshouwu) suppresses DSS induced acute colitis in BALb/c mice by modulating gut microbiota. Biomed. Pharmacother. 2021, 137, 111420. [Google Scholar] [CrossRef]
- Wu, Q.; Hou, Z.; Liu, Z.; Zheng, Z.; Xing, J.; Sun, R.; Liu, S. The difference of composition between Polygoni Multiflori Radix and Rhei Radix et Rhizoma revealed their primary hepatotoxicity components. J. Ethnopharmacol. 2025, 351, 120106. [Google Scholar] [CrossRef] [PubMed]
- Gong, L.; Du, H.; Guo, X.; Li, J.; Zhu, X.; Shen, X.; Huang, Z.; Wu, K.; Zhang, G.; Sun, R. Shouhui Tongbian Capsule in treatment of constipation: Treatment and mechanism development. Chin. Herb. Med. 2024, 16, 239–247. [Google Scholar] [CrossRef]
- Wang, X.; Zhao, G.; Ju, C.; Dong, L.; Liu, Y.; Ding, Z.; Li, W.; Peng, Y.; Zheng, J. Reduction of emodin-8-O-ß-D-glucoside content participates in processing-based detoxification of polygoni multiflori radix. Phytomedicine 2023, 114, 154750. [Google Scholar] [CrossRef] [PubMed]
- Li, W.; Wang, Y.; Qiu, C.; Li, J.; Bao, J.; Yang, J.; Jin, H. Processing-induced reduction in dianthrones content and toxicity of Polygonum multiflorum: Insights from ultra-high performance liquid chromatography triple quadrupole mass spectrometry analysis and toxicological assessment. Anim. Models Exp. Med. 2025, 8, 685–695. [Google Scholar] [CrossRef] [PubMed]
- Shi, Z.; Li, X.; Liu, Y.; Li, P.; Niu, M.; Bai, Z.; Zhang, G.; Lu, Y.; Wang, J. Spectrum-toxicity correlation study revealed the influence of the nine-time steaming and sun drying method on hepatotoxic components of Polygoni Multiflori Radix. World J. Tradit. Chin. Med. 2021, 7, 227–233. [Google Scholar] [CrossRef]
- Huang, C.; Jiang, Y.; Bao, Q.; Wang, L.; Tang, L.; Liu, Y.; Yang, L. Study on the differential hepatotoxicity of raw polygonum multiflorum and polygonum multiflorum praeparata and its mechanism. BMC Complementary Med. Ther. 2024, 24, 161. [Google Scholar] [CrossRef]
- Wang, S.; Kong, X.; Chen, N.; Hu, P.; Boucetta, H.; Hu, Z.; Xu, X.; Zhang, P.; Zhan, X.; Chang, M. Hepatotoxic metabolites in Polygoni Multiflori Radix—Comparative toxicology in mice. Front. Pharmacol. 2022, 13, 1007284. [Google Scholar] [CrossRef]
- Zhang, M.; Yu, L.; Zhao, H.; Zhou, X.; Yang, Q.; Song, F.; Yan, L.; Zhai, M.; Li, B.; Zhang, B. 2, 3, 5, 4′-Tetrahydroxystilbene-2-O-β-D-glucoside protects murine hearts against ischemia/reperfusion injury by activating Notch1/Hes1 signaling and attenuating endoplasmic reticulum stress. Acta Pharmacol. Sin. 2017, 38, 317–330. [Google Scholar] [CrossRef]
- Jiang, Z.; Xu, J.; Long, M.; Tu, Z.; Yang, G.; He, G. 2, 3, 5, 4′-tetrahydroxystilbene-2-O-β-d-glucoside (THSG) induces melanogenesis in B16 cells by MAP kinase activation and tyrosinase upregulation. Life Sci. 2009, 85, 345–350. [Google Scholar] [CrossRef] [PubMed]
- Lin, H.; Yang, Y.; Chen, Y.; Huang, T.; Crawford, D.; Chuang, H.; Chin, Y.; Chu, H.; Li, Z.; Shih, Y. 2, 3, 5, 4′-Tetrahydroxystilbene-2-O-β-D-Glucoside improves female ovarian aging. Front. Cell Dev. Biol. 2022, 10, 862045. [Google Scholar] [CrossRef] [PubMed]
- Zheng, Y.; Li, J.; Wu, J.; Yu, Y.; Yao, W.; Zhou, M.; Tian, J.; Zhang, J.; Cui, L.; Zeng, X. Tetrahydroxystilbene glucoside isolated from Polygonum multiflorum Thunb. demonstrates osteoblast differentiation promoting activity. Exp. Ther. Med. 2017, 14, 2845–2852. [Google Scholar] [CrossRef] [PubMed]
- Shen, Z.; Zhao, L.; Yoo, S.; Lin, Z.; Zhang, Y.; Yang, W.; Piao, J. Emodin induces ferroptosis in colorectal cancer through NCOA4-mediated ferritinophagy and NF-κb pathway inactivation. Apoptosis 2024, 29, 1810–1823. [Google Scholar] [CrossRef]
- Hu, Y.; Yang, L.; Lai, Y. Recent findings regarding the synergistic effects of emodin and its analogs with other bioactive compounds: Insights into new mechanisms. Biomed. Pharmacother. 2023, 162, 114585. [Google Scholar] [CrossRef] [PubMed]
- Dong, X.; Fu, J.; Yin, X.; Cao, S.; Li, X.; Lin, L.; Hu, Y.; Ni, J. Emodin: a review of its pharmacology, toxicity and pharmacokinetics. Phytother. Res. 2016, 30, 1207–1218. [Google Scholar] [CrossRef] [PubMed]
- Wang, D.; Duan, J.; Chen, X.; Liu, K.; Guo, Y.; Shi, R.; Li, S.; Liu, M.; Zhao, L.; Li, B. Pharmacokinetic characteristics of emodin in polygoni Multiflori Radix Praeparata. J. Ethnopharmacol. 2023, 303, 115945. [Google Scholar] [CrossRef]
- Chalasani, N.; Li, Y.; Dellinger, A.; Navarro, V.; Bonkovsky, H.; Fontana, R.J.; Gu, J.; Barnhart, H.; Phillips, E.; Lammert, C. Clinical features, outcomes, and HLA risk factors associated with nitrofurantoin-induced liver injury. J. Hepatol. 2023, 78, 293–300. [Google Scholar] [CrossRef]
- Jaeschke, H.; Ramachandran, A. Acetaminophen hepatotoxicity: paradigm for understanding mechanisms of drug-induced liver injury. Annu. Rev. Pathol.:Mech. Dis. 2024, 19, 453–478. [Google Scholar] [CrossRef] [PubMed]
- Yang, Y.; Zhou, K.; Ma, M.; Liu, H.; Jin, M.; Yin, C.; Wang, S.; Zhang, J. Thiol “click” chromene mediated cascade reaction forming coumarin for in-situ imaging of thiol flux in drug-induced liver injury. Chem. Eng. J. 2023, 452, 139020. [Google Scholar] [CrossRef]
- Segovia Zafra, A.; Di Zeo Sánchez, D.e.; López Gómez, C.; Pérez Valdés, Z.; Garcia Fuentes, E.; Andrade, R.j.; Lucena, M.; Villanueva Paz, M. Preclinical models of idiosyncratic drug-induced liver injury (iDILI): Moving towards prediction. Acta Pharm. Sin. B 2021, 11, 3685–3726. [Google Scholar] [CrossRef]
- Fontana, R.j.; Liou, I.; Reuben, A.; Suzuki, A.; Fiel, M.i.; Lee, W.; Navarro, V. AASLD practice guidance on drug, herbal, and dietary supplement–induced liver injury. Hepatol. 2023, 77, 1036–1065. [Google Scholar] [CrossRef]
- Almagharbeh, W. Mechanisms of drug-induced liver injury: Exploring pathways and risk factors for liver toxicity. Trends Life Sci. Biotechnol. 2024, 1, 13–26. [Google Scholar]
- Li, G.; Yu, G. Drug-induced liver injury with ritonavir-boosted nirmatrelvir: evidence from coronavirus disease 2019 emergency use authorization adverse event reporting system. Gastroenterology 2023, 165, 305–306. [Google Scholar] [CrossRef] [PubMed]
- Fontana, R.; Bjornsson, E.; Reddy, R.; Andrade, R. The evolving profile of idiosyncratic drug-induced liver injury. Clin. Gastroenterol. Hepatol. 2023, 21, 2088–2099. [Google Scholar] [CrossRef]
- Yokoi, T.; Oda, S. Models of idiosyncratic drug-induced liver injury. Annu. Rev. Pharmacol. Toxicol. 2021, 61, 247–268. [Google Scholar] [CrossRef] [PubMed]
- Pinazo Bandera, J.; Niu, H.; Alvarez Alvarez, I.; Medina Cáliz, I.; Del Campo Herrera, E.; Ortega Alonso, A.; Robles Díaz, M.; Hernandez, N.; Parana, R.; Nunes, V. Rechallenge in idiosyncratic drug-induced liver injury: an analysis of cases in two large prospective registries according to existing definitions. Pharmacol. Res. 2024, 203, 107183. [Google Scholar] [CrossRef]
- Tu, C.; Gao, Y.; Bai, Z.; Xiao, X.; Wang, J. Discovery, evaluation, prevention, and control of liver injury risk by Polygoni Multiflori Radix. Acupunct. Herb. Med. 2024, 4, 271–281. [Google Scholar] [CrossRef]
- Xiao, X.; Wang, J.; Song, H.; Ouyang, D.; Zou, Z.; Wang, R.; He, T.; Jing, J.; Guo, Y.; Bai, Z. Guidelines for safe use of Polygoni Multiflori Radix. Acupunct. Herb. Med. 2024, 4, 151–158. [Google Scholar] [CrossRef]
- Lu, Y.; Men, X.; Wu, C.; Wei, X.; Chen, M.; Wang, J. Speciation of selenium-containing small molecules in urine and cell lysate by CE-ICPMS with in-capillary enrichment. Talanta 2025, 281, 126929. [Google Scholar] [CrossRef]
- Chen, L.; Chen, F.; Liu, T.; Feng, F.; Guo, W.; Zhang, Y.; Feng, X.; Lin, J.; Zhang, F. Lipidomics profiling of HepG2 cells and interference by mycotoxins based on UPLC-TOF-IMS. Anal. Chem. 2022, 94, 6719–6727. [Google Scholar] [CrossRef]
- Hu, X.; Luo, H.; Kasai, N.; Nakajima, H.; Kato, S.; Uchiyama, K.; Mao, S. An Inclined Push–Pull Probe for In Situ Cell Staining and Calcium Channel Activation. Anal. Chem. 2025, 97, 15376–15383. [Google Scholar] [CrossRef] [PubMed]
- Ma, N.; Pan, B.; Yang, S.; Lai, H.; Ning, J.; Li, Y.; Liu, J.; Huang, J.; Ma, Y.; Hou, L. Comparative efficacy and safety of Chinese patent medicines for primary insomnia: A systematic review and network meta-analysis of 109 randomized trials. J. Ethnopharmacol. 2025, 340, 119254. [Google Scholar] [CrossRef]
- Wu, W.; Cheng, R.; Boucetta, H.; Xu, L.; Pan, J.; Song, M.; Lu, Y.; Hang, T. Differences in Multicomponent Pharmacokinetics, Tissue Distribution, and Excretion of Tripterygium Glycosides Tablets in Normal and Adriamycin–Induced Nephrotic Syndrome Rat Models and Correlations With Efficacy and Hepatotoxicity. Front. Pharmacol. 2022, 13, 910923. [Google Scholar] [CrossRef]
- Xu, S.; Yu, J.; Zhan, J.; Yang, L.; Guo, L.; Xu, Y. Pharmacokinetics, tissue distribution, and metabolism study of icariin in rat. BioMed Res. Int. 2017, 2017, 4684962. [Google Scholar] [CrossRef] [PubMed]
- Jiang, L.; Zhao, D.; Fan, Y.; Yu, Q.; Lai, Y.; Li, P.; Li, H. Transcriptome analysis to assess the cholestatic hepatotoxicity induced by Polygoni Multiflori Radix: Up-regulation of key enzymes of cholesterol and bile acid biosynthesis. J. Proteomics 2018, 177, 40–47. [Google Scholar] [CrossRef]
- Cheng, A.; Lei, S.; Zhu, J.; Lu, J.; Paine, M.F.; Xie, W.; Ma, X. Chemical basis of pregnane X receptor activators in the herbal supplement Gancao (licorice). Liver Res. 2022, 6, 251–257. [Google Scholar] [CrossRef]
- Luo, D.; Jia, P.; Zhao, S.; Zhao, Y.; Liu, H.; Wei, F.; Ma, S. Identification and Differentiation of Polygonum multiflorum Radix and Polygoni multiflori Radix Preaparata through the Quantitative Analysis of Multicomponents by the Single-Marker Method. J. Anal. Methods Chem. 2019, 2019, 7430717. [Google Scholar] [CrossRef]
- Zuo, J.; Meng, T.; Wang, Y.; Tang, W. A review of the antiviral activities of glycyrrhizic acid, glycyrrhetinic acid and glycyrrhetinic acid monoglucuronide. Pharmaceuticals 2023, 16, 641. [Google Scholar] [CrossRef]
- Wu, H.; Kim, M.; Han, J. Icariin metabolism by human intestinal microflora. Molecules 2016, 21, 1158. [Google Scholar] [CrossRef] [PubMed]
- Stecanella, L.; Bitencourt, A.; Vaz, G.; Quarta, E.; Silva Junior, J.; Rossi, A. Glycyrrhizic acid and its hydrolyzed metabolite 18β-glycyrrhetinic acid as specific ligands for targeting nanosystems in the treatment of liver cancer. Pharmaceutics 2021, 13, 1792. [Google Scholar] [CrossRef]
- Yu, W.; Zhao, J.; Li, W.; Zheng, Y.; Zhu, J.; Liu, J.; Liu, R.; Wang, Z.; Wang, X.; Hai, C. 2, 3, 5, 4′-Tetrahydroxystilbene-2-O-β-d-glucoside alleviated the acute hepatotoxicity and DNA damage in diethylnitrosamine-contaminated mice. Life Sci. 2020, 243, 117274. [Google Scholar] [CrossRef]
- Choi, J.; Choi, H.; Chung, J. Icariin supplementation suppresses the markers of ferroptosis and attenuates the progression of nonalcoholic steatohepatitis in mice fed a methionine choline-deficient diet. Int. J. Mol. Sci. 2023, 24, 12510. [Google Scholar] [CrossRef] [PubMed]
- Yan, M.; Guo, L.; Ma, J.; Yang, Y.; Tang, T.; Zhang, B.; Zhou, W.; Zou, W.; Hou, Z.; Gu, H. Liquiritin alleviates alpha-naphthylisothiocyanate-induced intrahepatic cholestasis through the Sirt1/FXR/Nrf2 pathway. J. Appl. Toxicol. 2023, 43, 350–359. [Google Scholar] [CrossRef] [PubMed]
- Tu, C.; He, Q.; Li, C.; Niu, M.; Han, Z.; Ge, F.; Zhou, Y.; Zhang, L.; Wang, X.; Zhu, J. Susceptibility-related factor and biomarkers of dietary supplement polygonum multiflorum-induced liver injury in rats. Front. Pharmacol. 2019, 10, 335. [Google Scholar] [CrossRef] [PubMed]
Figure 1.
In vivo exposure levels of 11 candidate compounds in rat plasma following intragastric administration of the ABSs.
Figure 1.
In vivo exposure levels of 11 candidate compounds in rat plasma following intragastric administration of the ABSs.
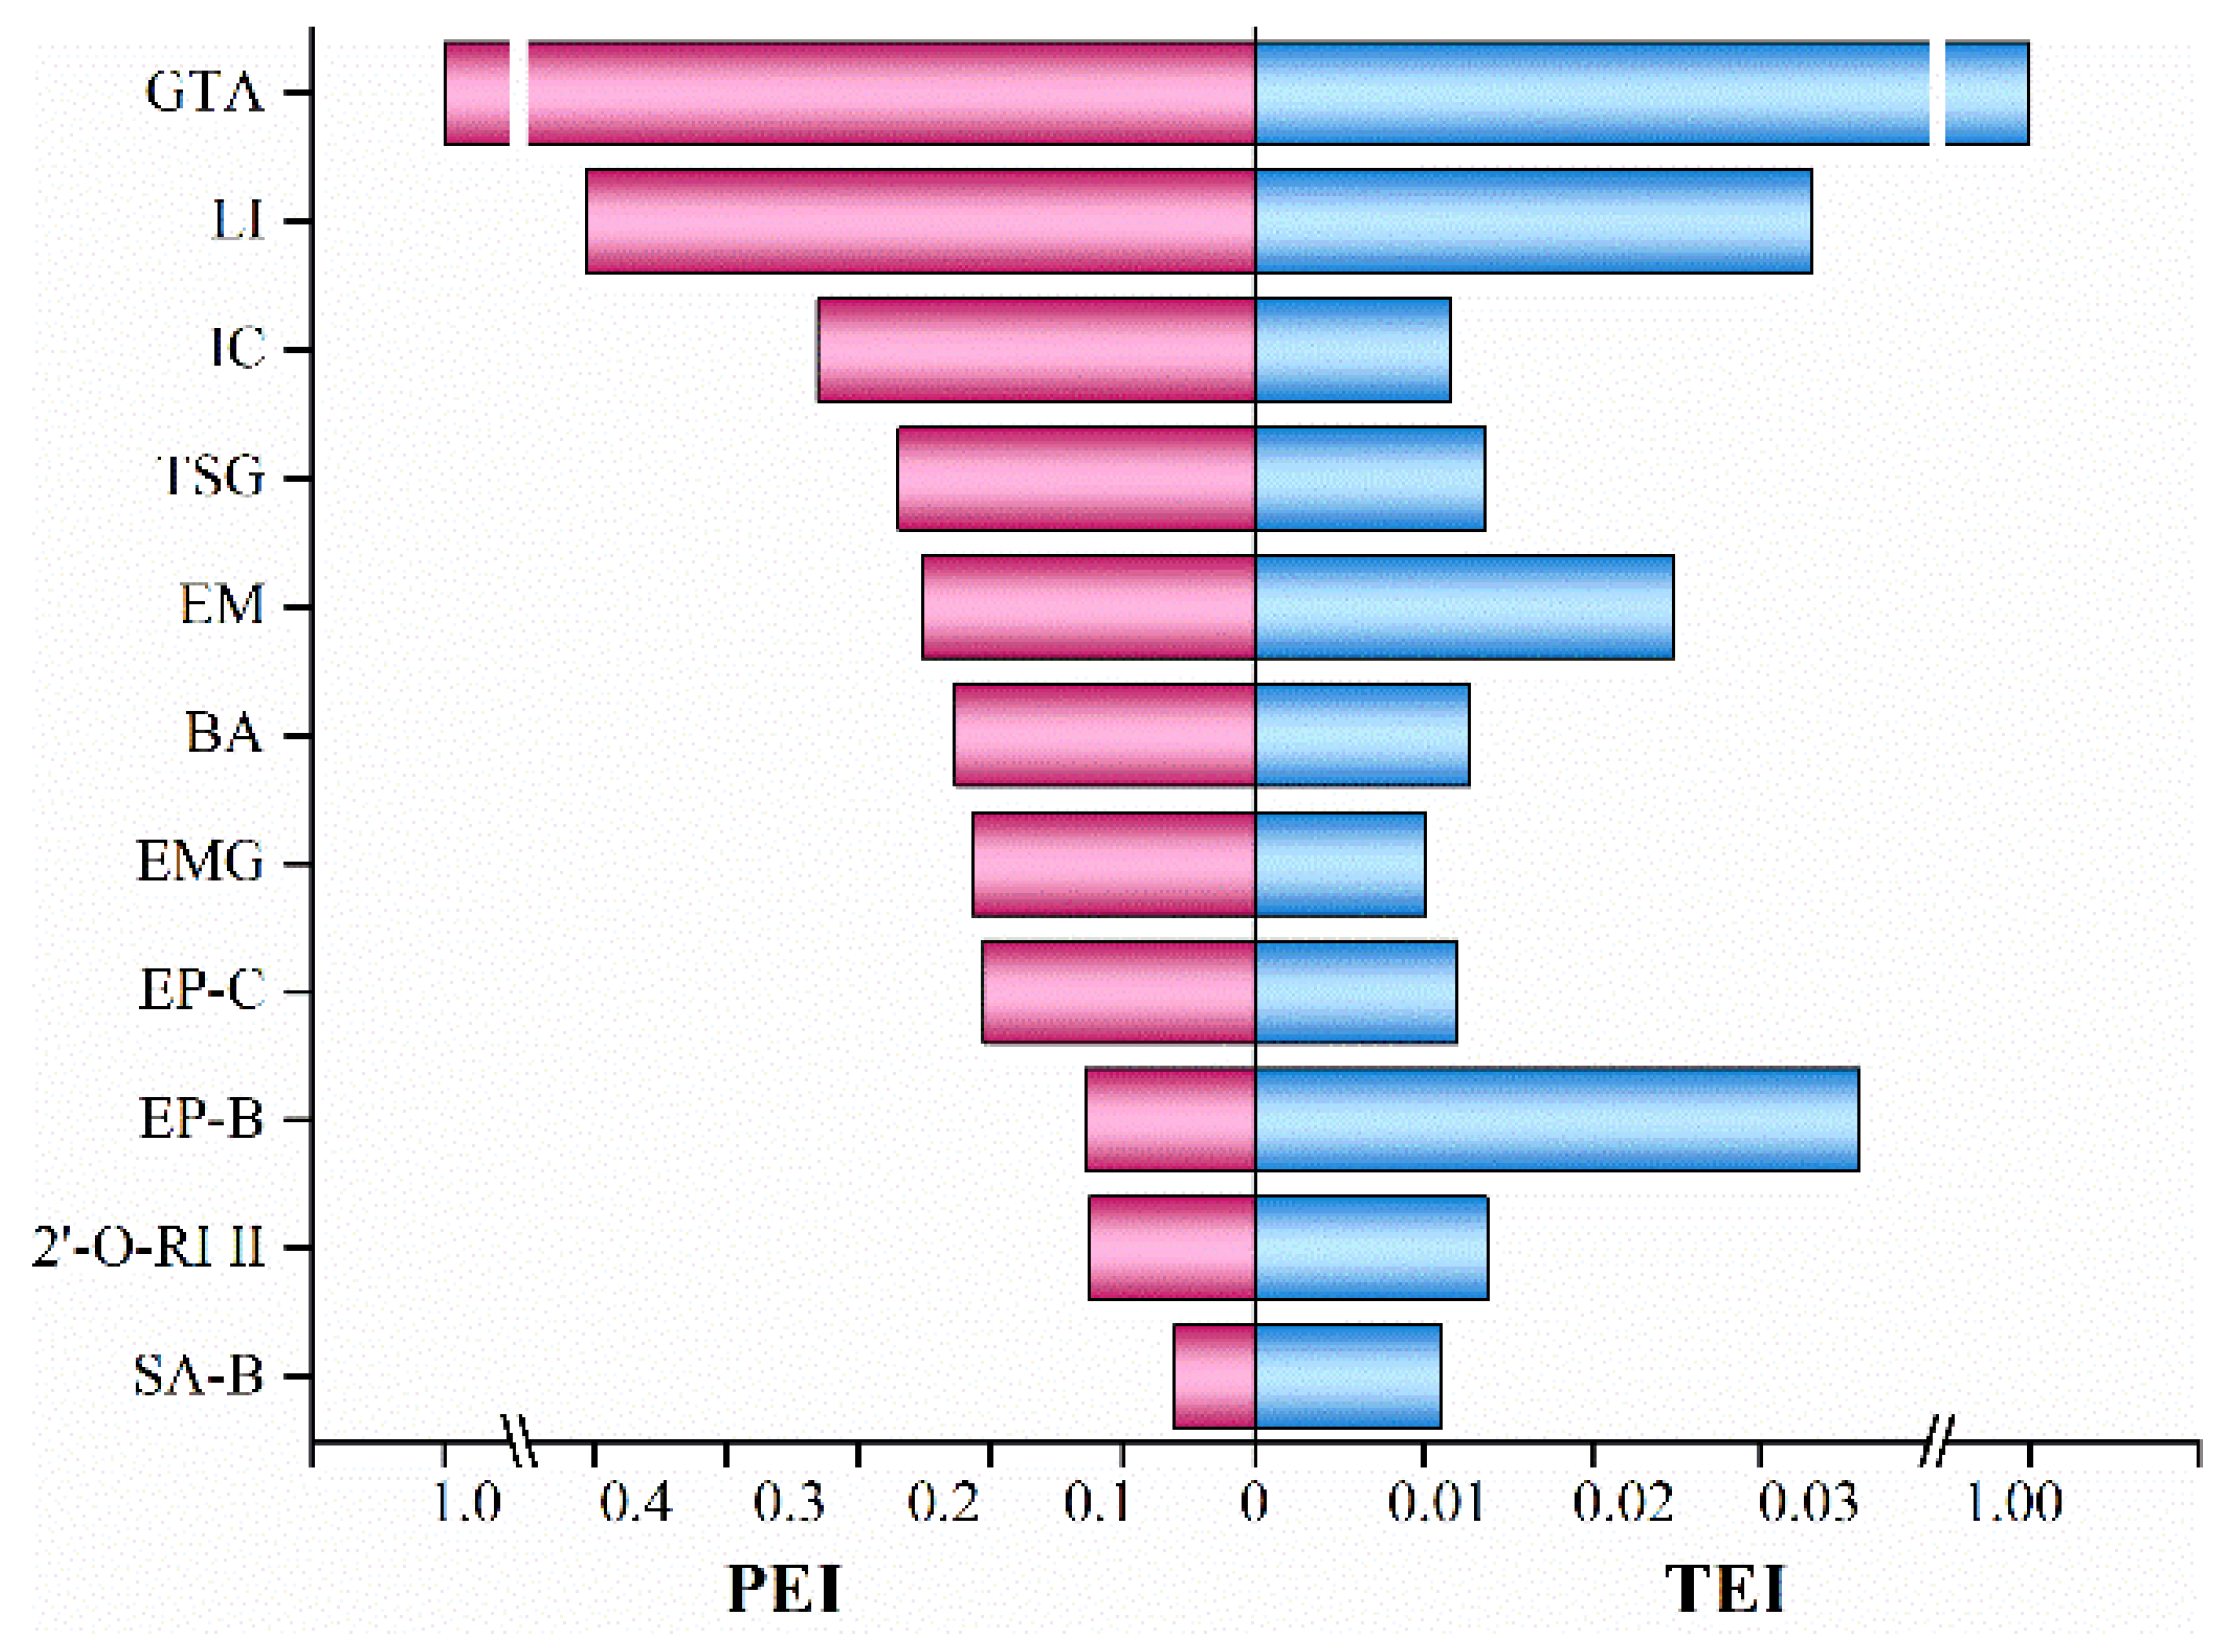
Figure 2.
Mean plasma concentration–time profiles of the seven quality marker components following intragastric administration of 10 mL/kg ABS in rats (n = 6). (A) TSG. (B) LI. (C) IC. (D) EMG. (E) BA. (F) EM. (G) GTA. (H) BA (0-4h). (I) EM (0-2h).
Figure 2.
Mean plasma concentration–time profiles of the seven quality marker components following intragastric administration of 10 mL/kg ABS in rats (n = 6). (A) TSG. (B) LI. (C) IC. (D) EMG. (E) BA. (F) EM. (G) GTA. (H) BA (0-4h). (I) EM (0-2h).
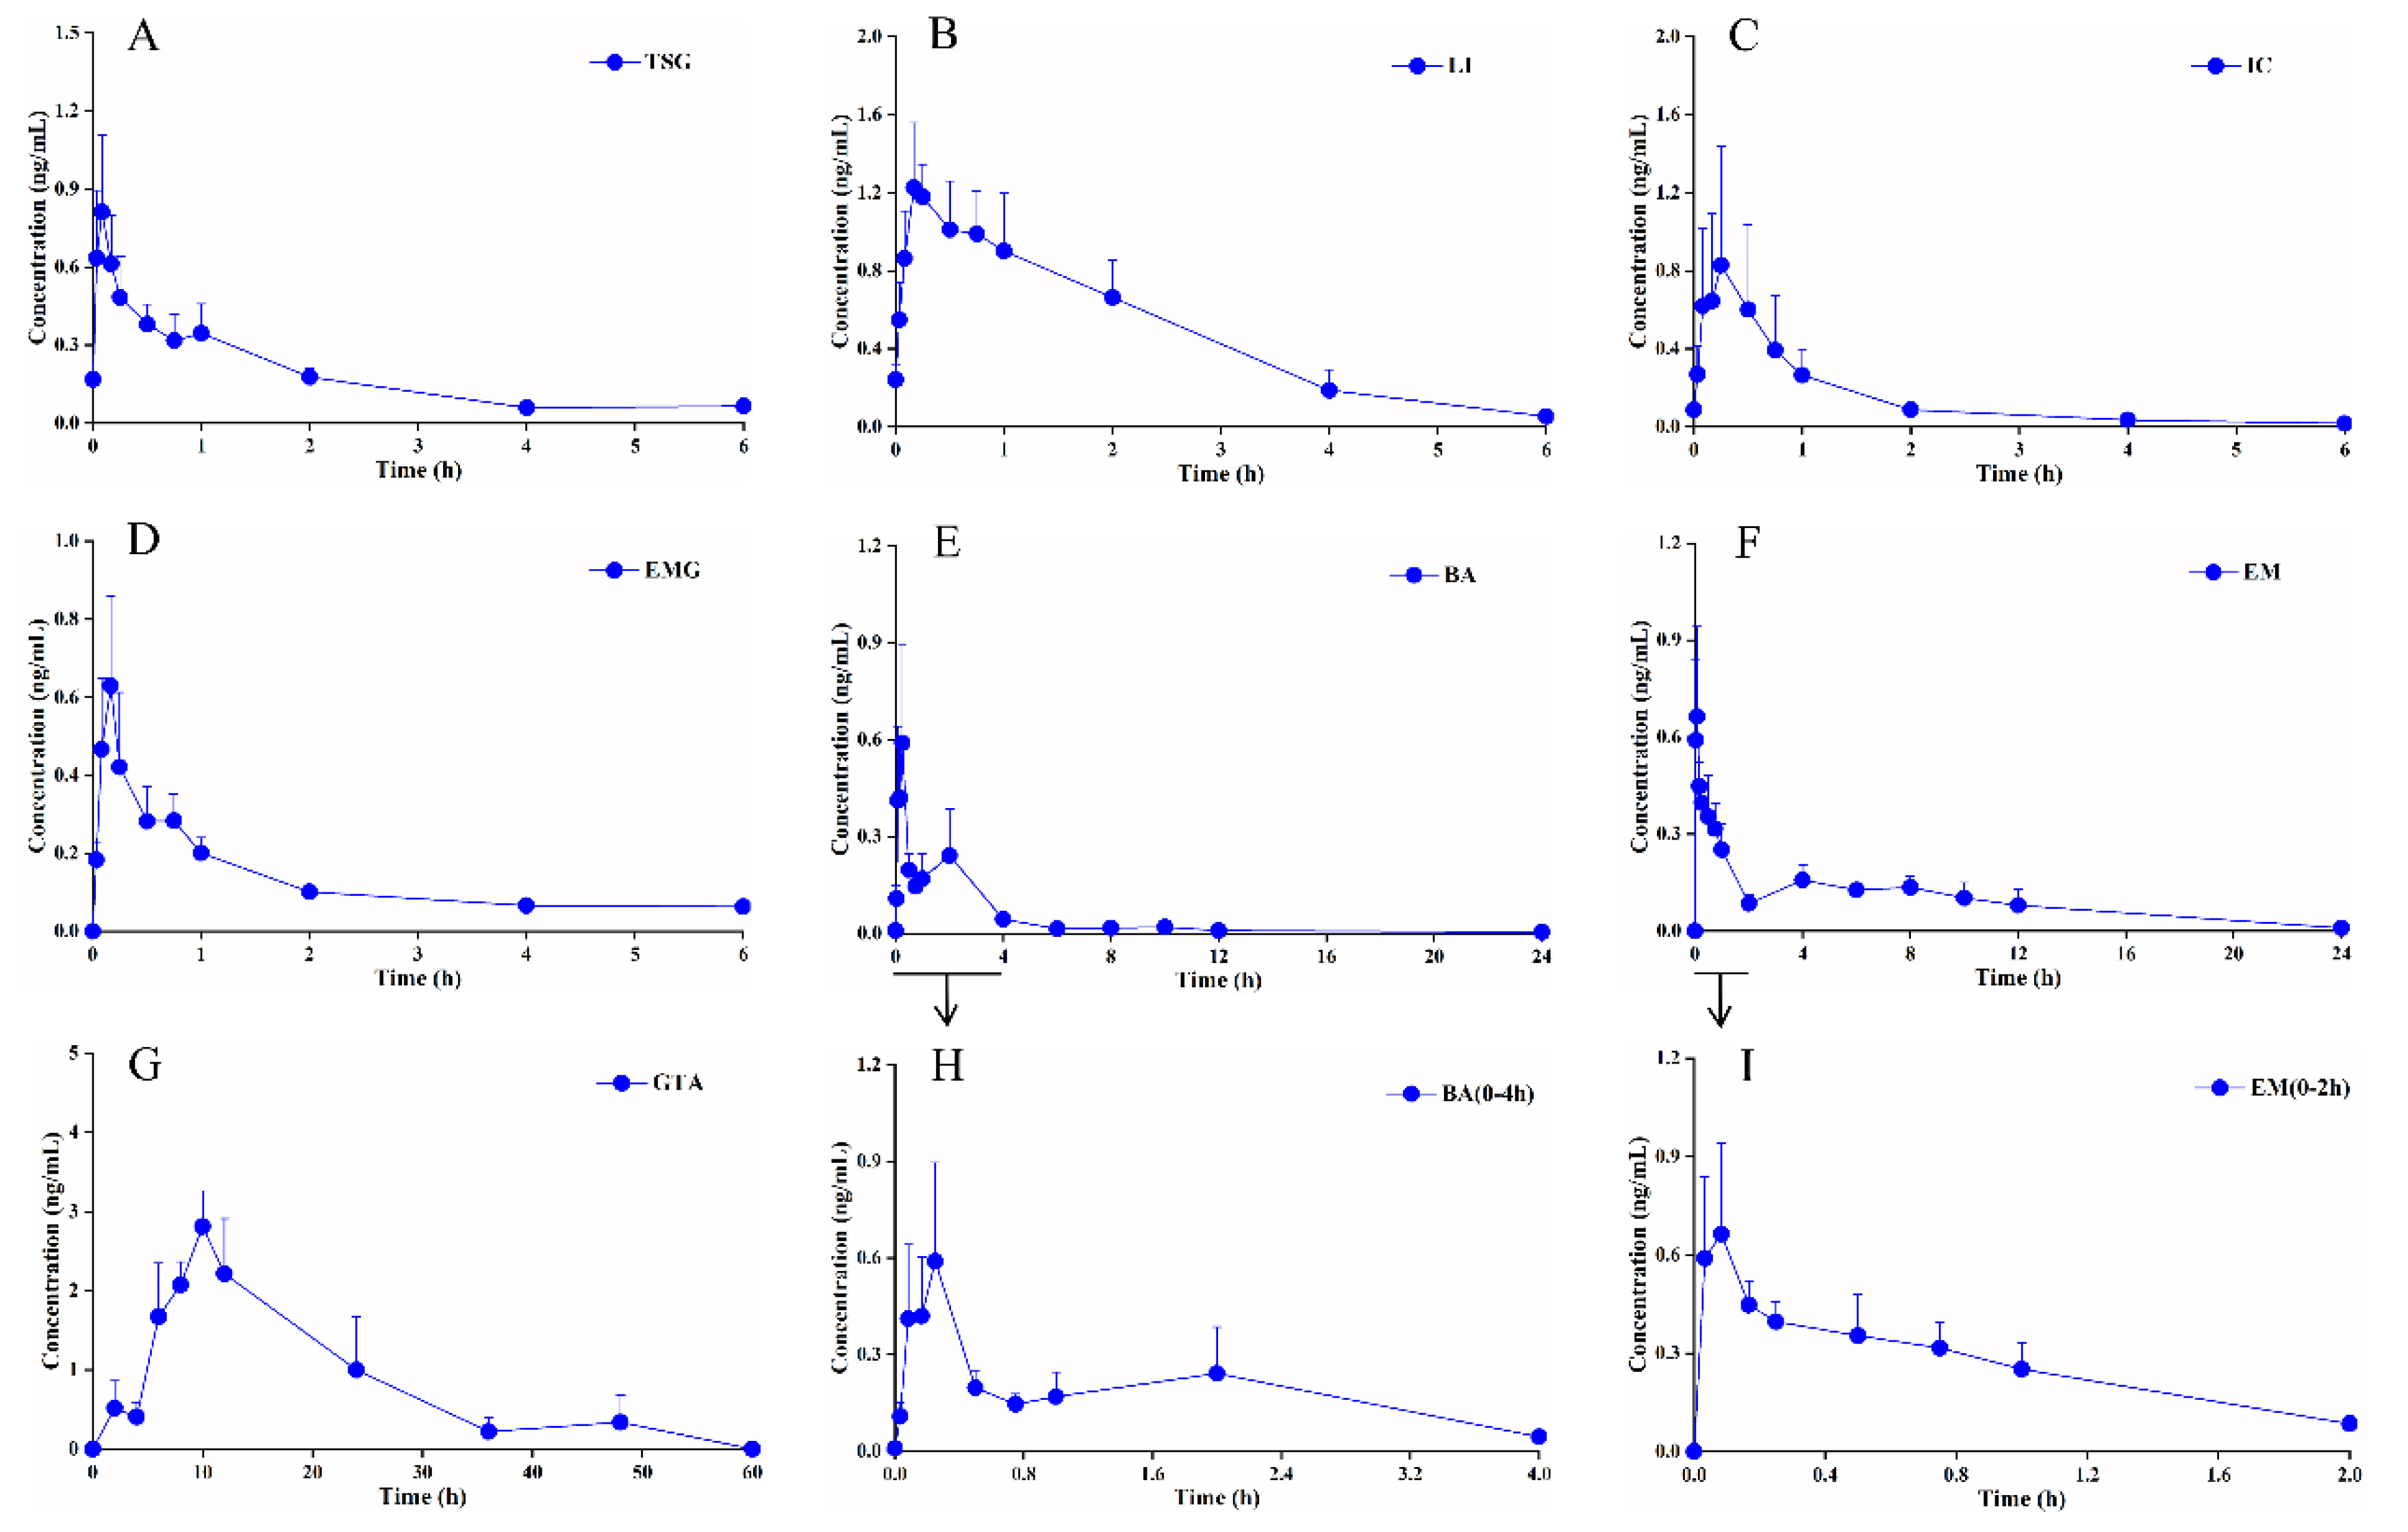
Figure 3.
Drug concentration–cell viability curves of the seven ABS quality marker components and an original component of GTA in HepG2 cells (n = 6). (A) TSG. (B) LI. (C) BA. (D) IC. (E) EMG. (F) EM. (G) GTA. (H) GLA.
Figure 3.
Drug concentration–cell viability curves of the seven ABS quality marker components and an original component of GTA in HepG2 cells (n = 6). (A) TSG. (B) LI. (C) BA. (D) IC. (E) EMG. (F) EM. (G) GTA. (H) GLA.
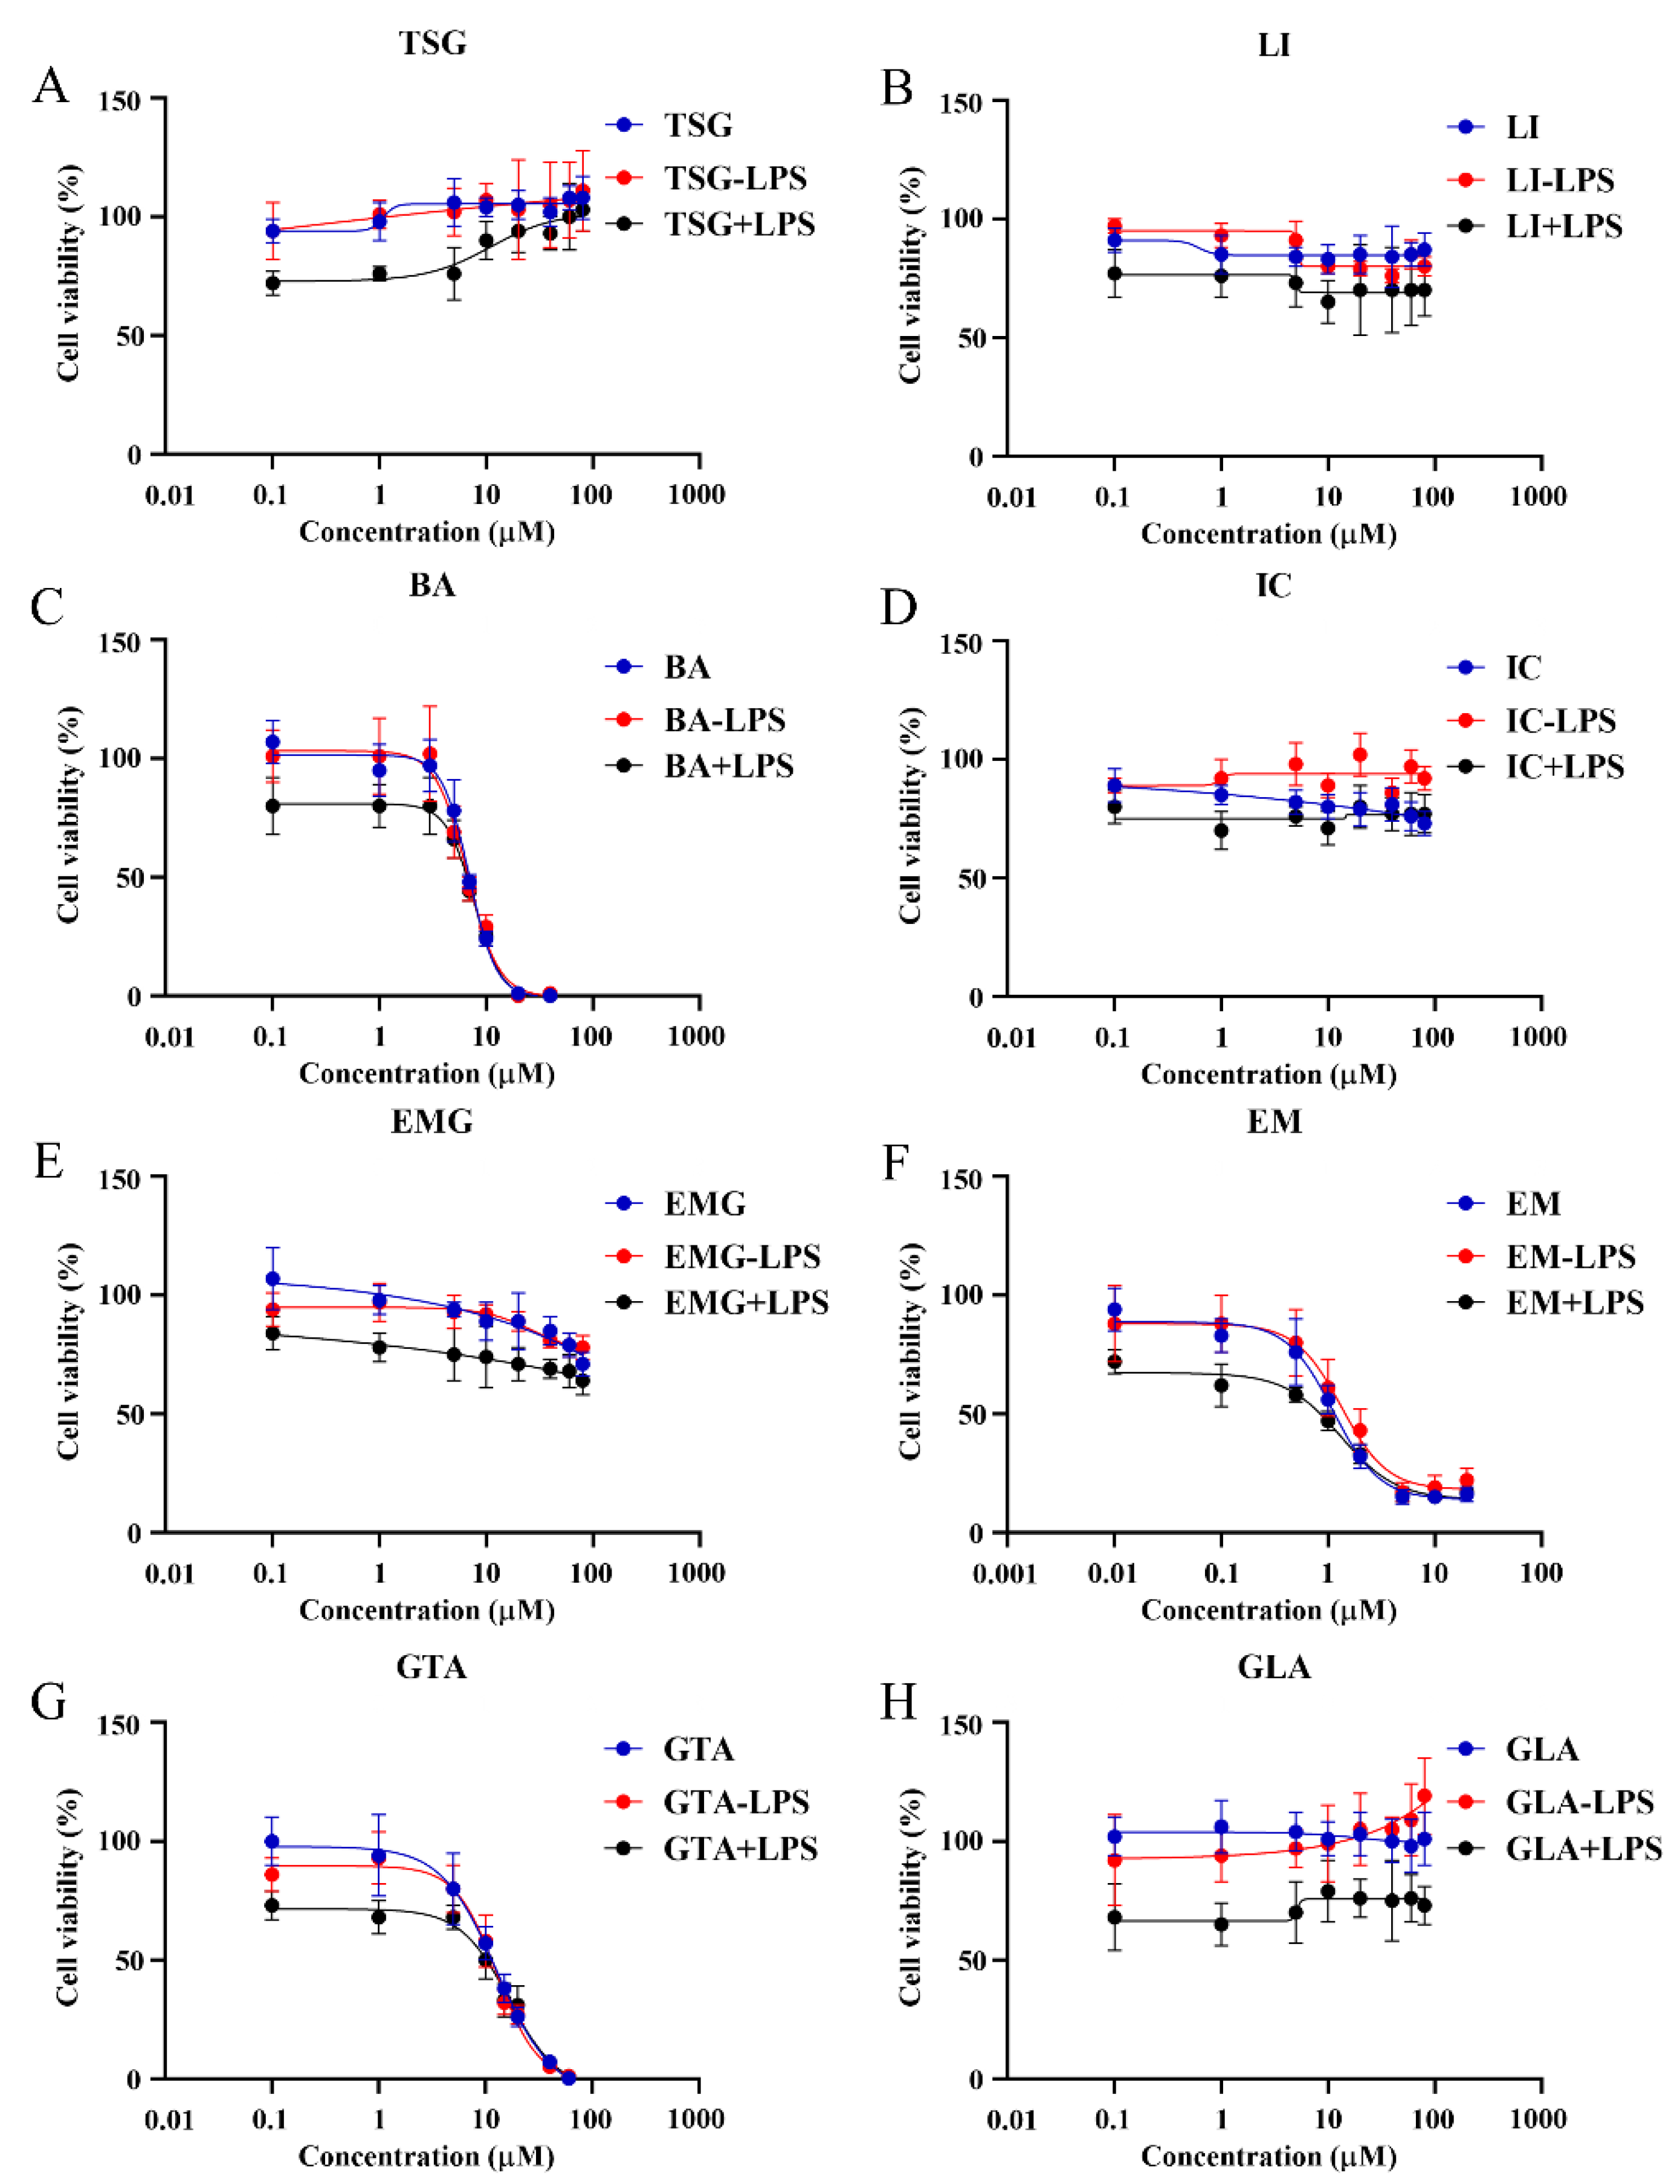
Figure 4.
Hepatotoxicity assessment of seven ABS quality marker components and an original component of GTA in normal HepG2 cells and LPS-induced susceptible liver injury cells (n = 6). (A) EM. (B) BA. (C) GTA. (D) TSG. (E) EMG. (F) IC. (G) GLA. (H) LI. *p<0.05, **p<0.01, ***p<0.001, ****p<0.0001.
Figure 4.
Hepatotoxicity assessment of seven ABS quality marker components and an original component of GTA in normal HepG2 cells and LPS-induced susceptible liver injury cells (n = 6). (A) EM. (B) BA. (C) GTA. (D) TSG. (E) EMG. (F) IC. (G) GLA. (H) LI. *p<0.05, **p<0.01, ***p<0.001, ****p<0.0001.
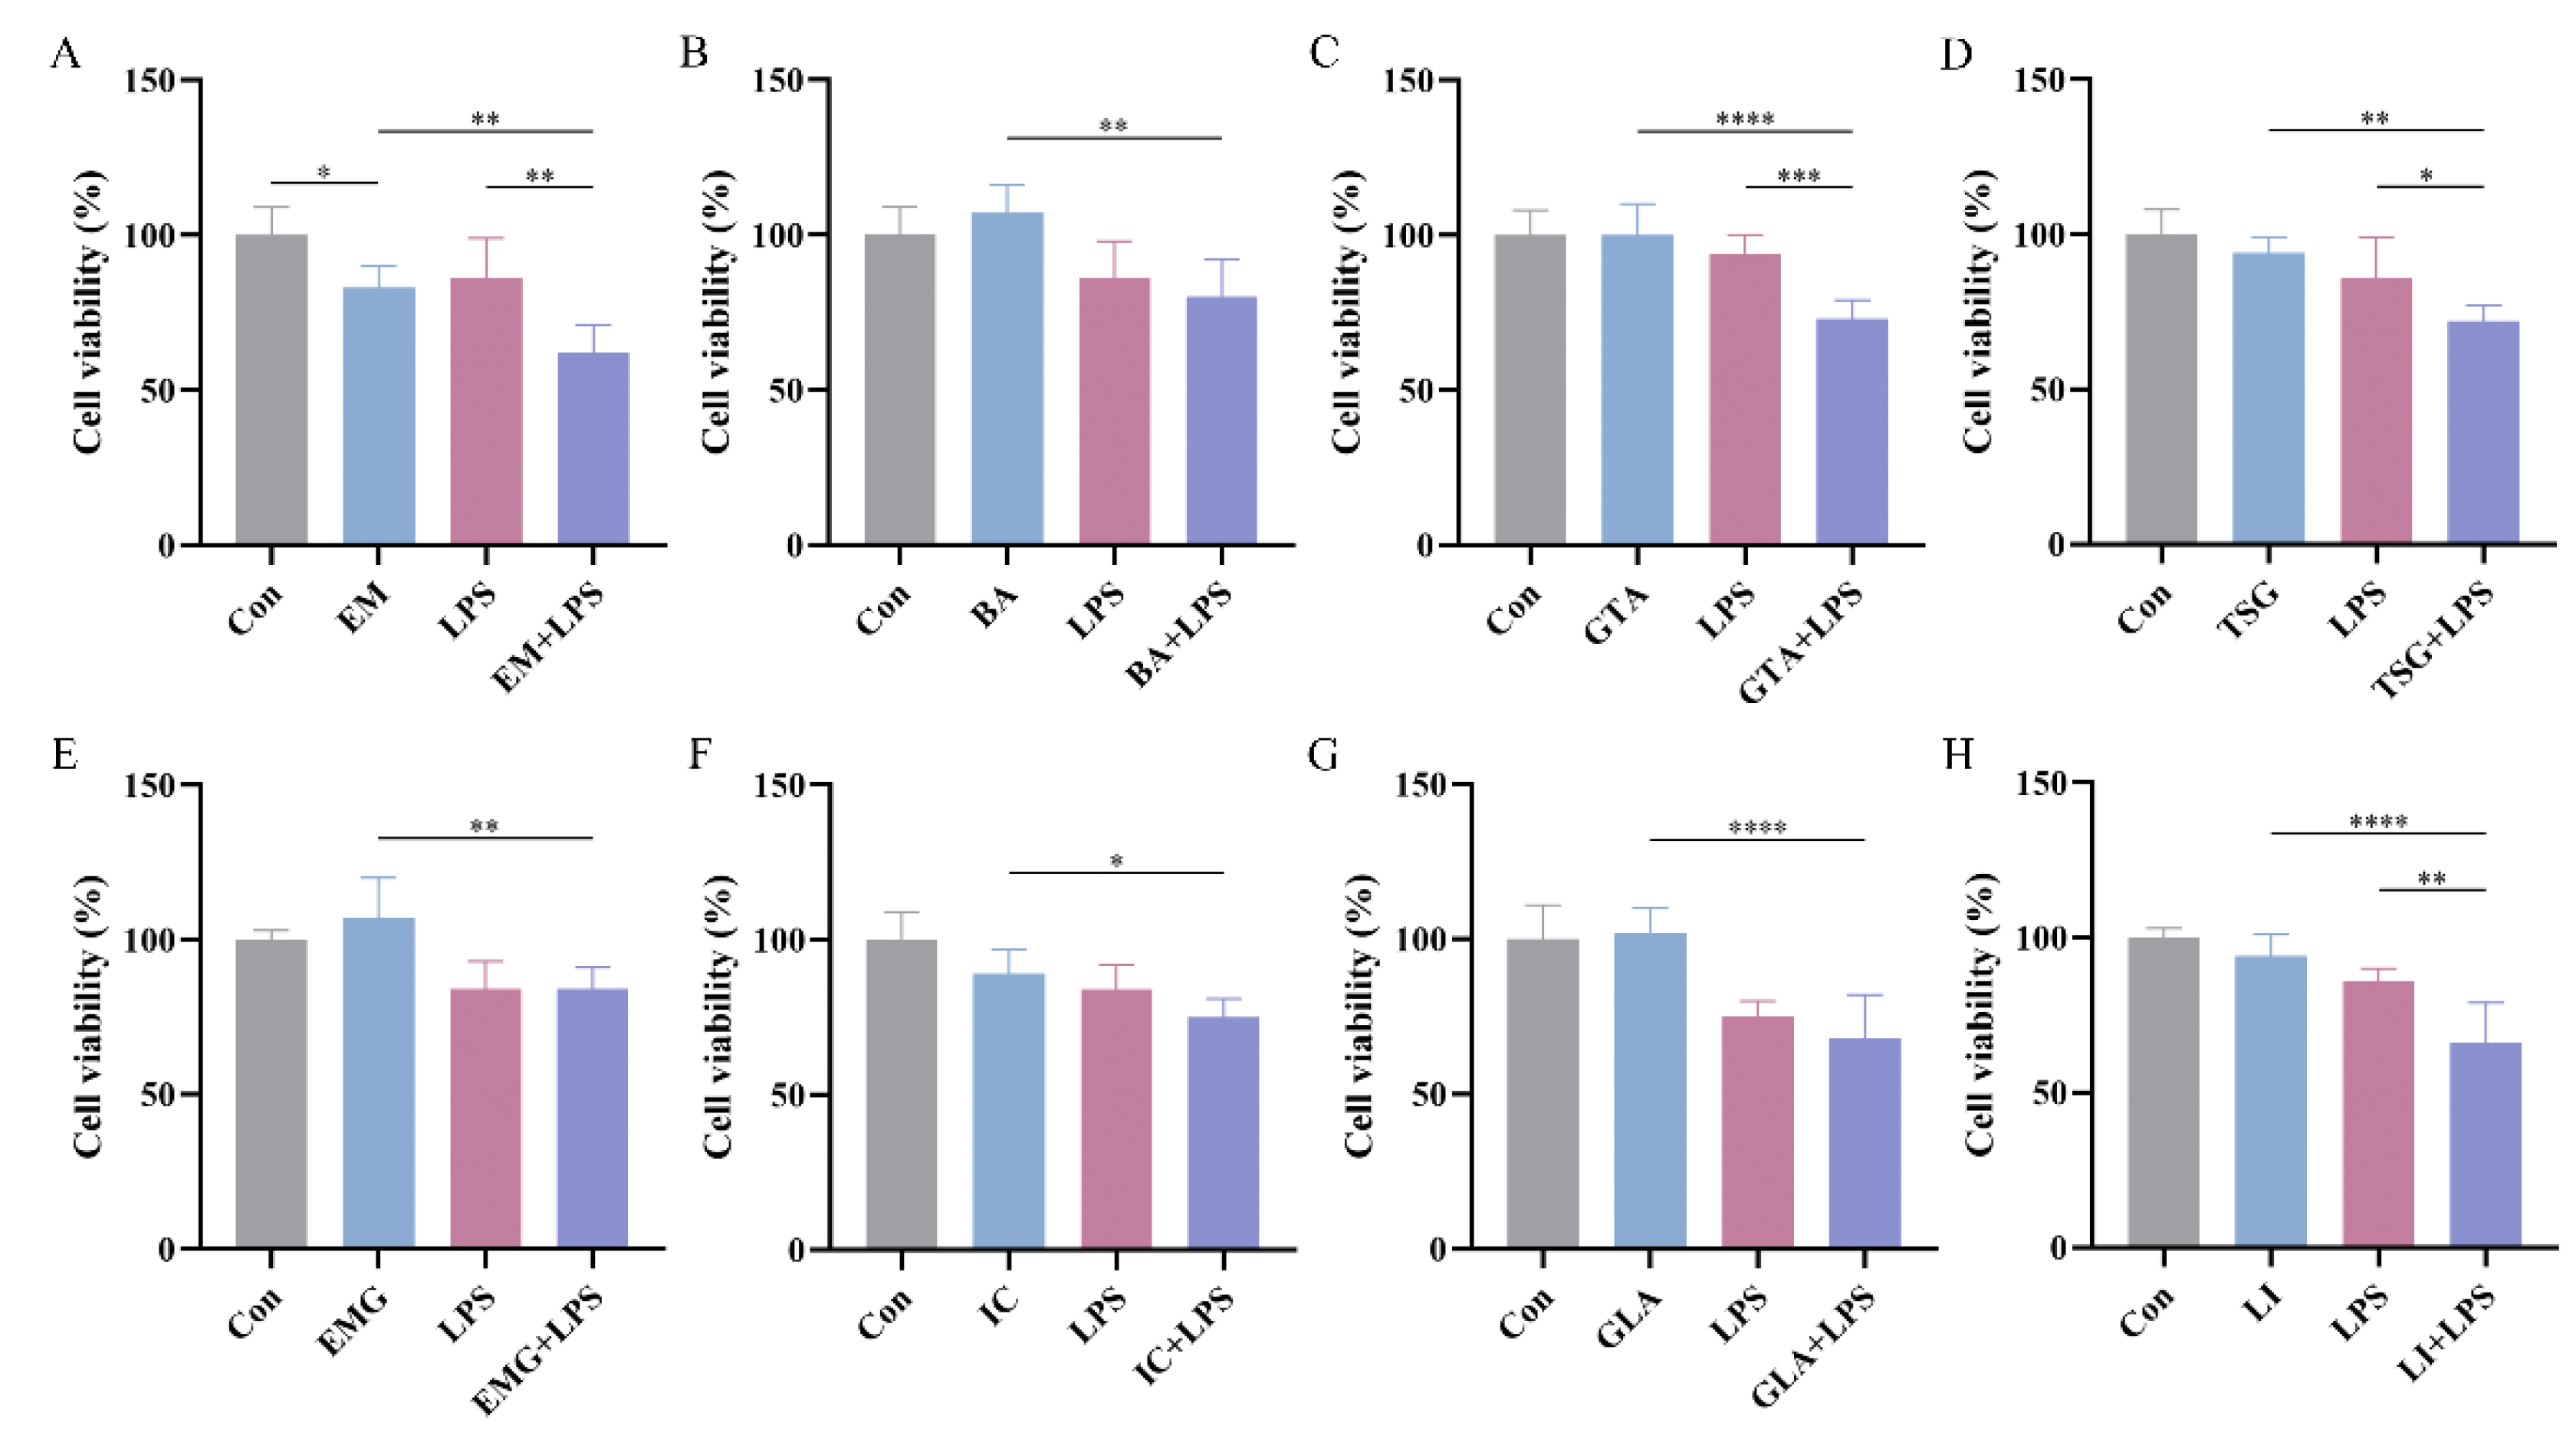
Figure 5.
Effect of LPS on the hepatotoxicity of individual ABS quality marker components and GLA at low, medium and high concentrations (n = 6). (A) EM. (B) BA. (C) GTA. (D) TSG. (E) EMG. (F) IC. (G) GLA. (H) LI. *p<0.05, **p<0.01.
Figure 5.
Effect of LPS on the hepatotoxicity of individual ABS quality marker components and GLA at low, medium and high concentrations (n = 6). (A) EM. (B) BA. (C) GTA. (D) TSG. (E) EMG. (F) IC. (G) GLA. (H) LI. *p<0.05, **p<0.01.
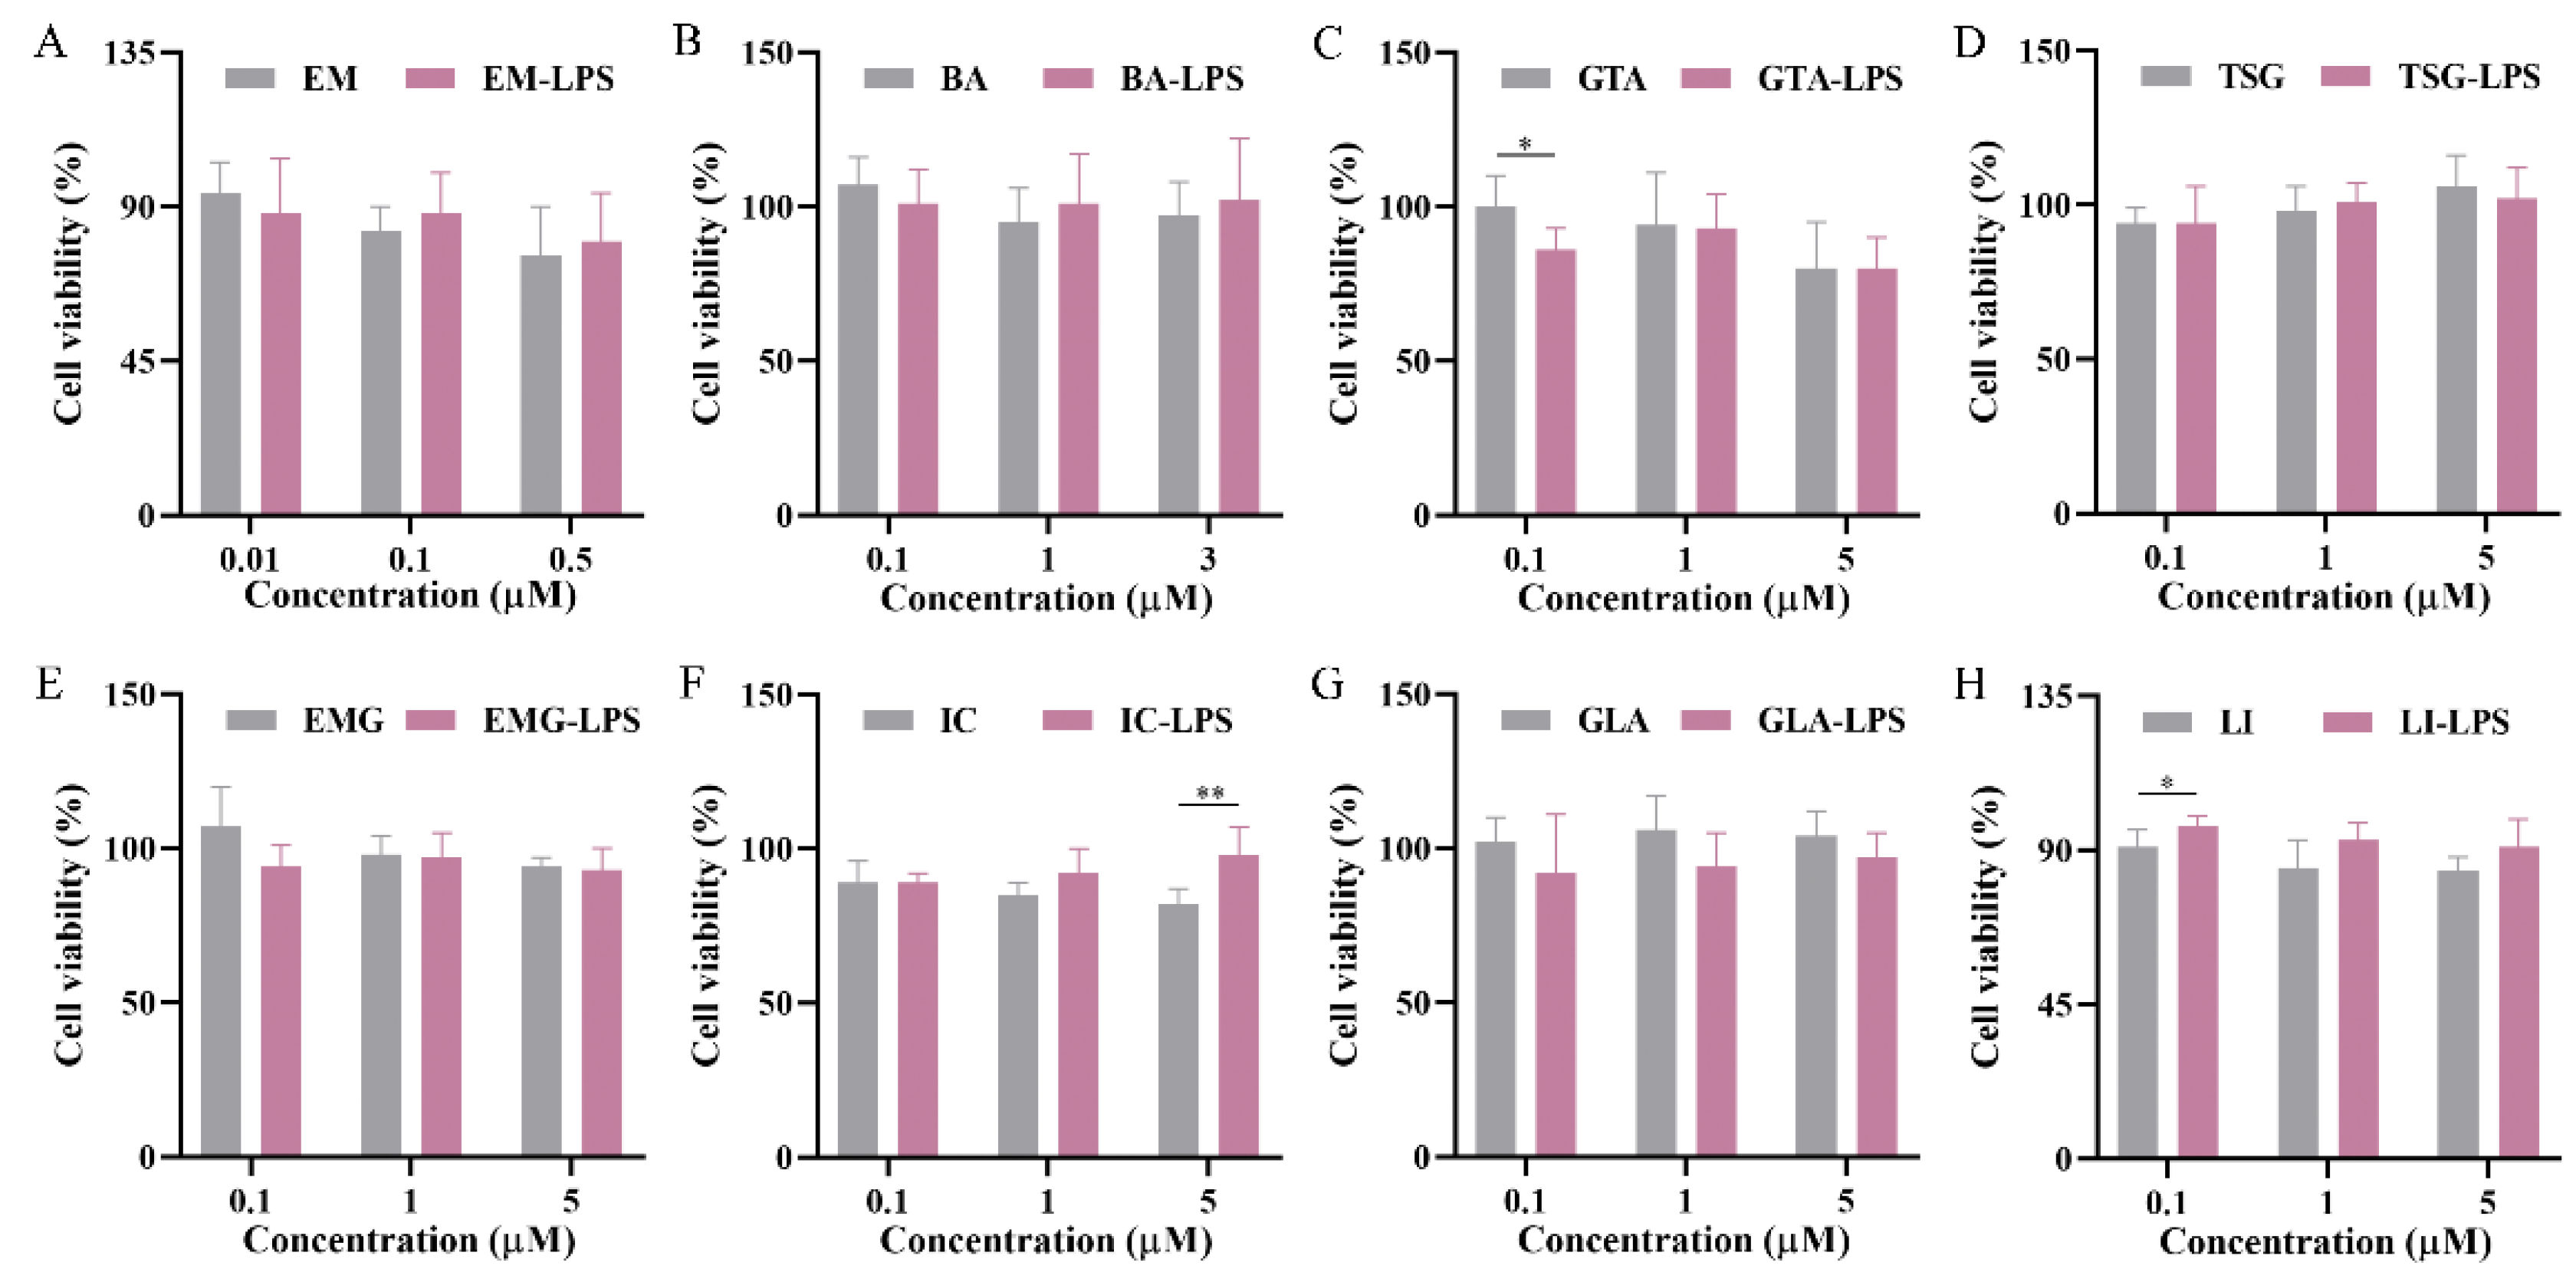

Table 1.
Concentrations of key components determined in the ABSs (n=3).
| Components | Concentrations (μg/mL) |
| IC | 234.5±0.2 |
| TSG | 232.0±3.7 |
| EP-C | 28.8±0.1 |
| EP-B | 34.7±0.1 |
| GLA | 11.2±0.1 |
| LI | 8.78±0.07 |
| EMG | 4.81±0.08 |
| EM | 3.00±0.02 |
Table 2.
Pharmacokinetic parameters of the seven representative constituents of ABS quality markers in the rats after a single oral gavage dose of 10 mL/kg (n = 6).
Table 2.
Pharmacokinetic parameters of the seven representative constituents of ABS quality markers in the rats after a single oral gavage dose of 10 mL/kg (n = 6).
| Ingredients | Cmax | Tmax | AUC0-t | t1/2 |
|---|---|---|---|---|
| (ng/mL) | (h) | (h*ng/mL) | (h) | |
| IC | 1.08±0.72 | 0.31±0.11 | 0.90±0.47 | 1.35±0.24 |
| BA | 0.74±0.29 | 0.82±0.38 | 0.99±0.28 | 7.58±1.96 |
| TSG | 0.88±0.27 | 0.10±0.03 | 1.06±0.20 | 2.46±0.40 |
| GTA | 3.27±0.17 | 11.0±0.58 | 77.5±1.43 | 8.70±0.38 |
| LI | 1.65±0.22 | 0.20±0.03 | 2.52±0.44 | 1.26±0.09 |
| EMG | 0.70±0.25 | 0.31±0.14 | 0.78±0.13 | 4.00±1.35 |
| EM | 0.82±0.25 | 0.44±0.16 | 1.92±0.36 | 4.63±1.53 |
Disclaimer/Publisher’s Note: The statements, opinions and data contained in all publications are solely those of the individual author(s) and contributor(s) and not of MDPI and/or the editor(s). MDPI and/or the editor(s) disclaim responsibility for any injury to people or property resulting from any ideas, methods, instructions or products referred to in the content. |
© 2026 by the authors. Licensee MDPI, Basel, Switzerland. This article is an open access article distributed under the terms and conditions of the Creative Commons Attribution (CC BY) license (http://creativecommons.org/licenses/by/4.0/).
Copyright: This open access article is published under a Creative Commons CC BY 4.0 license, which permit the free download, distribution, and reuse, provided that the author and preprint are cited in any reuse.


