Submitted:
02 February 2026
Posted:
02 February 2026
You are already at the latest version
Abstract
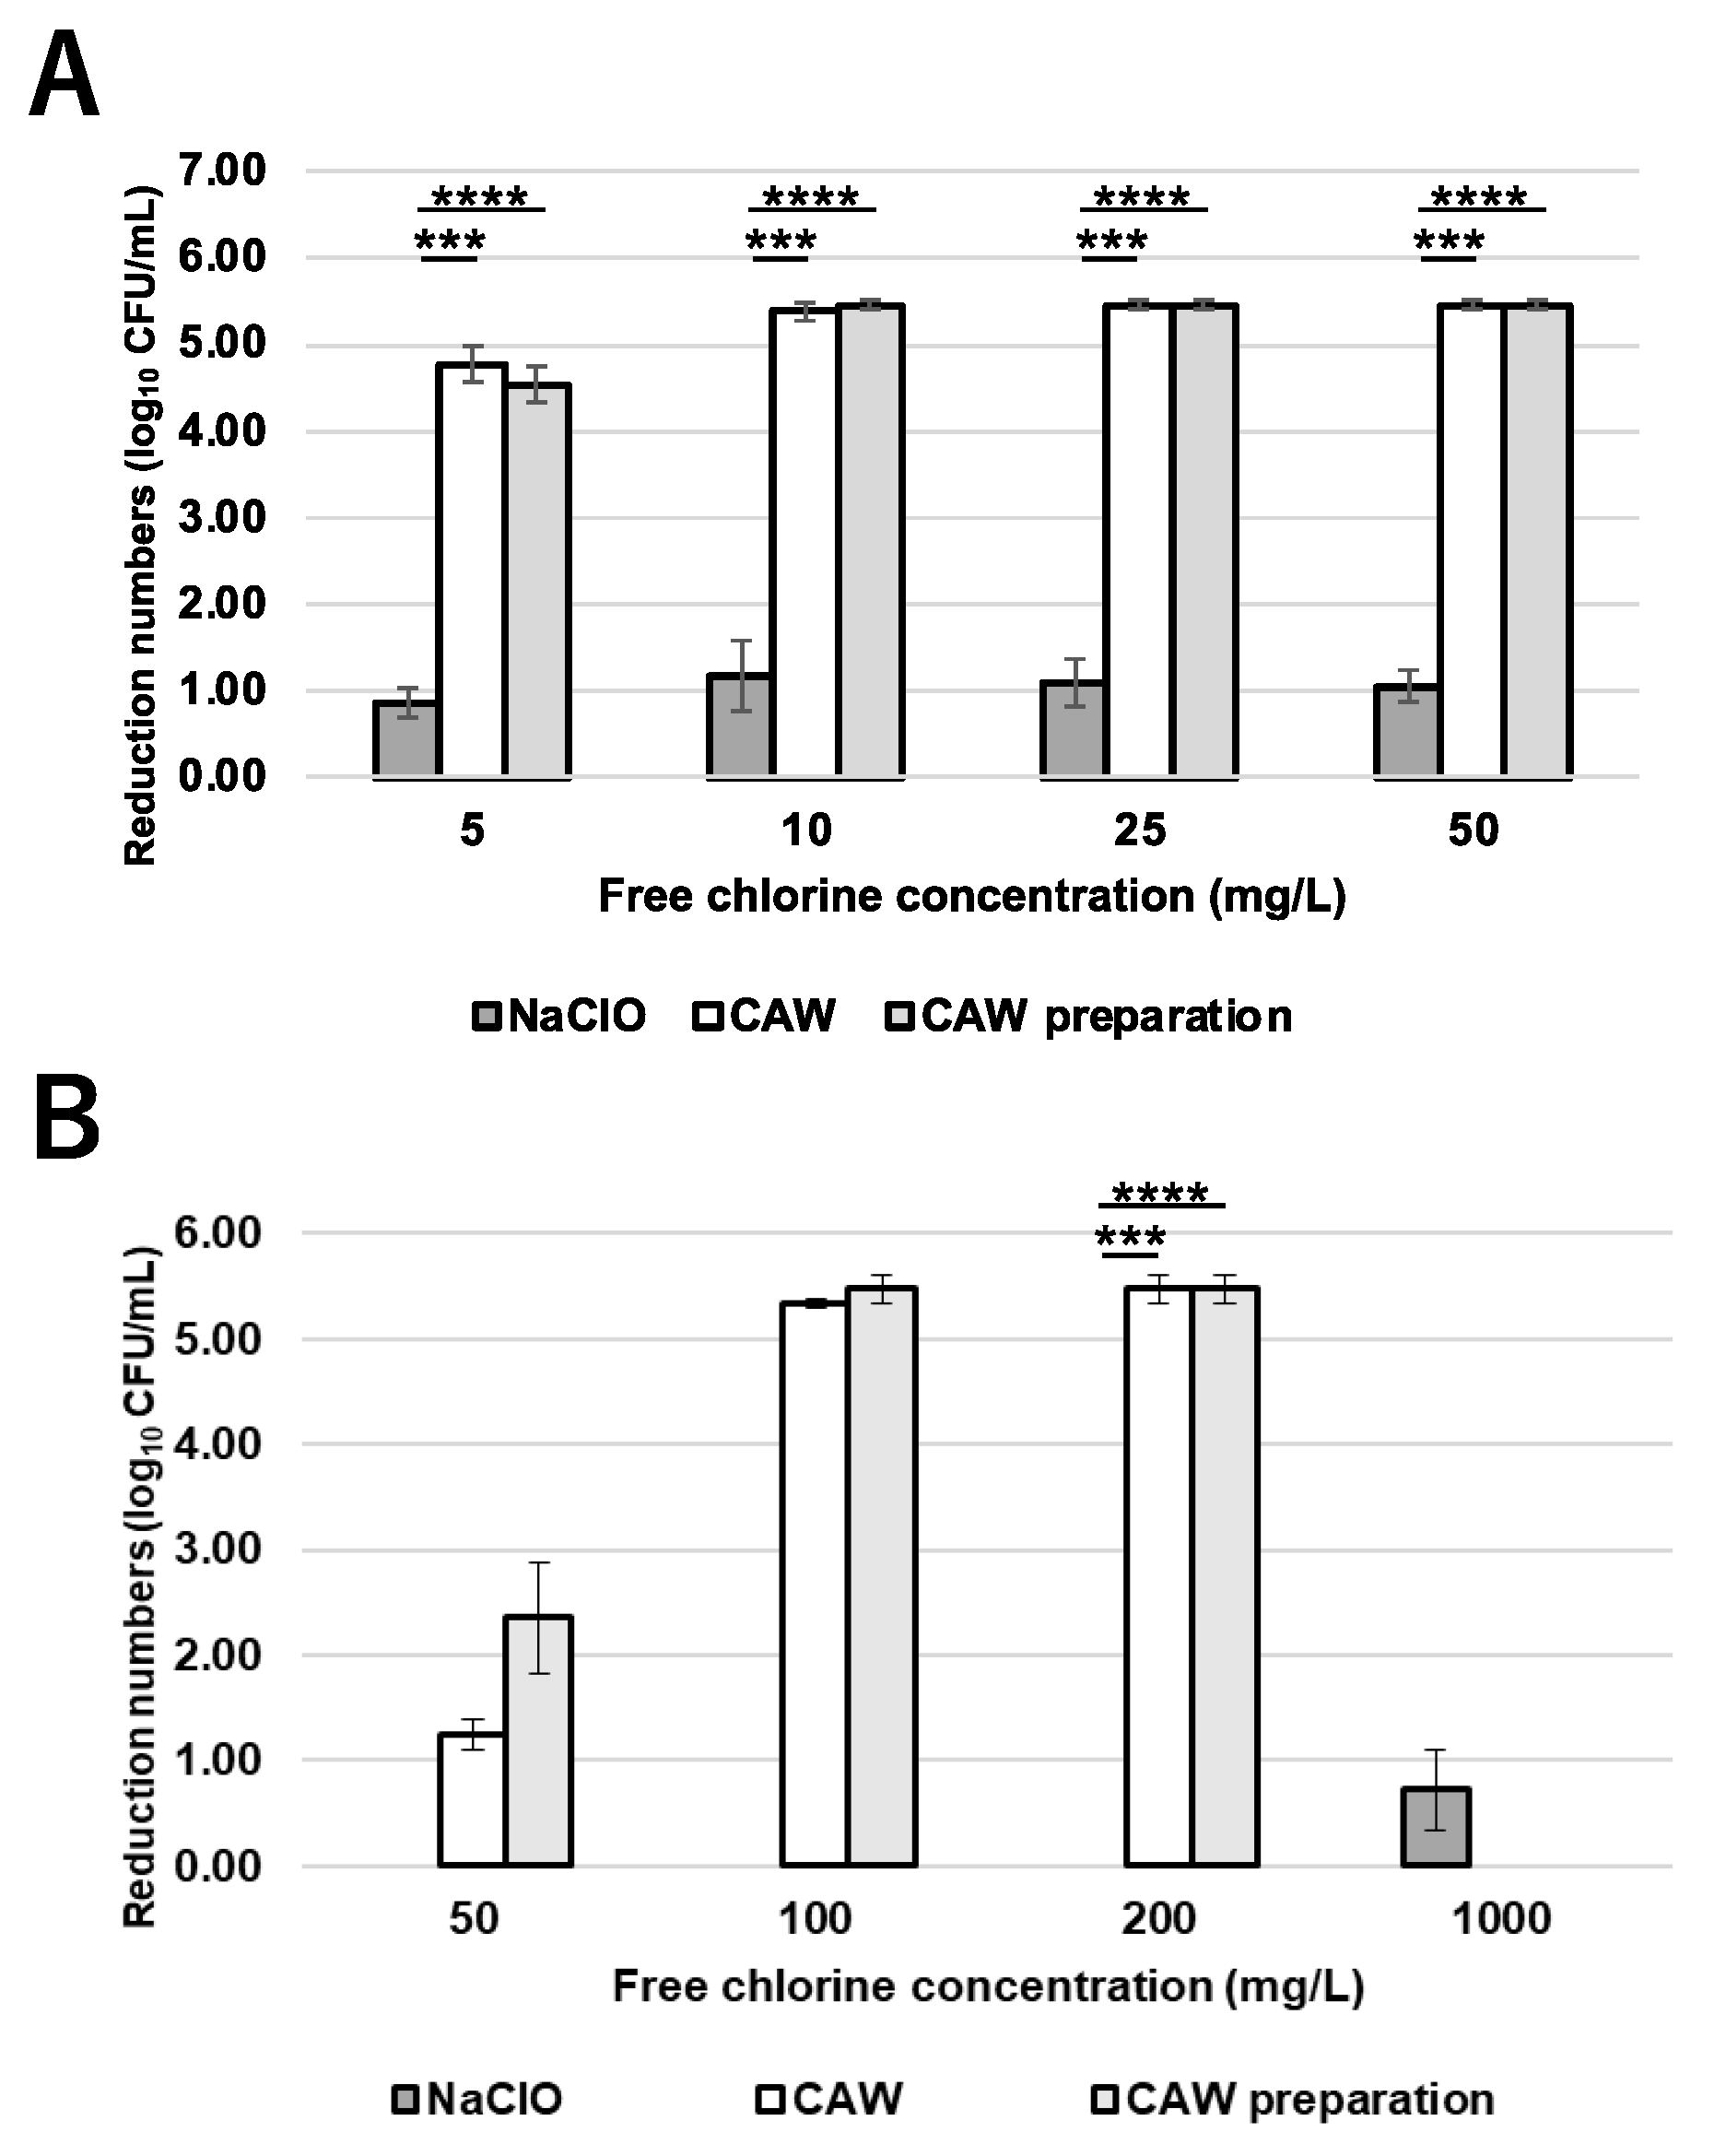
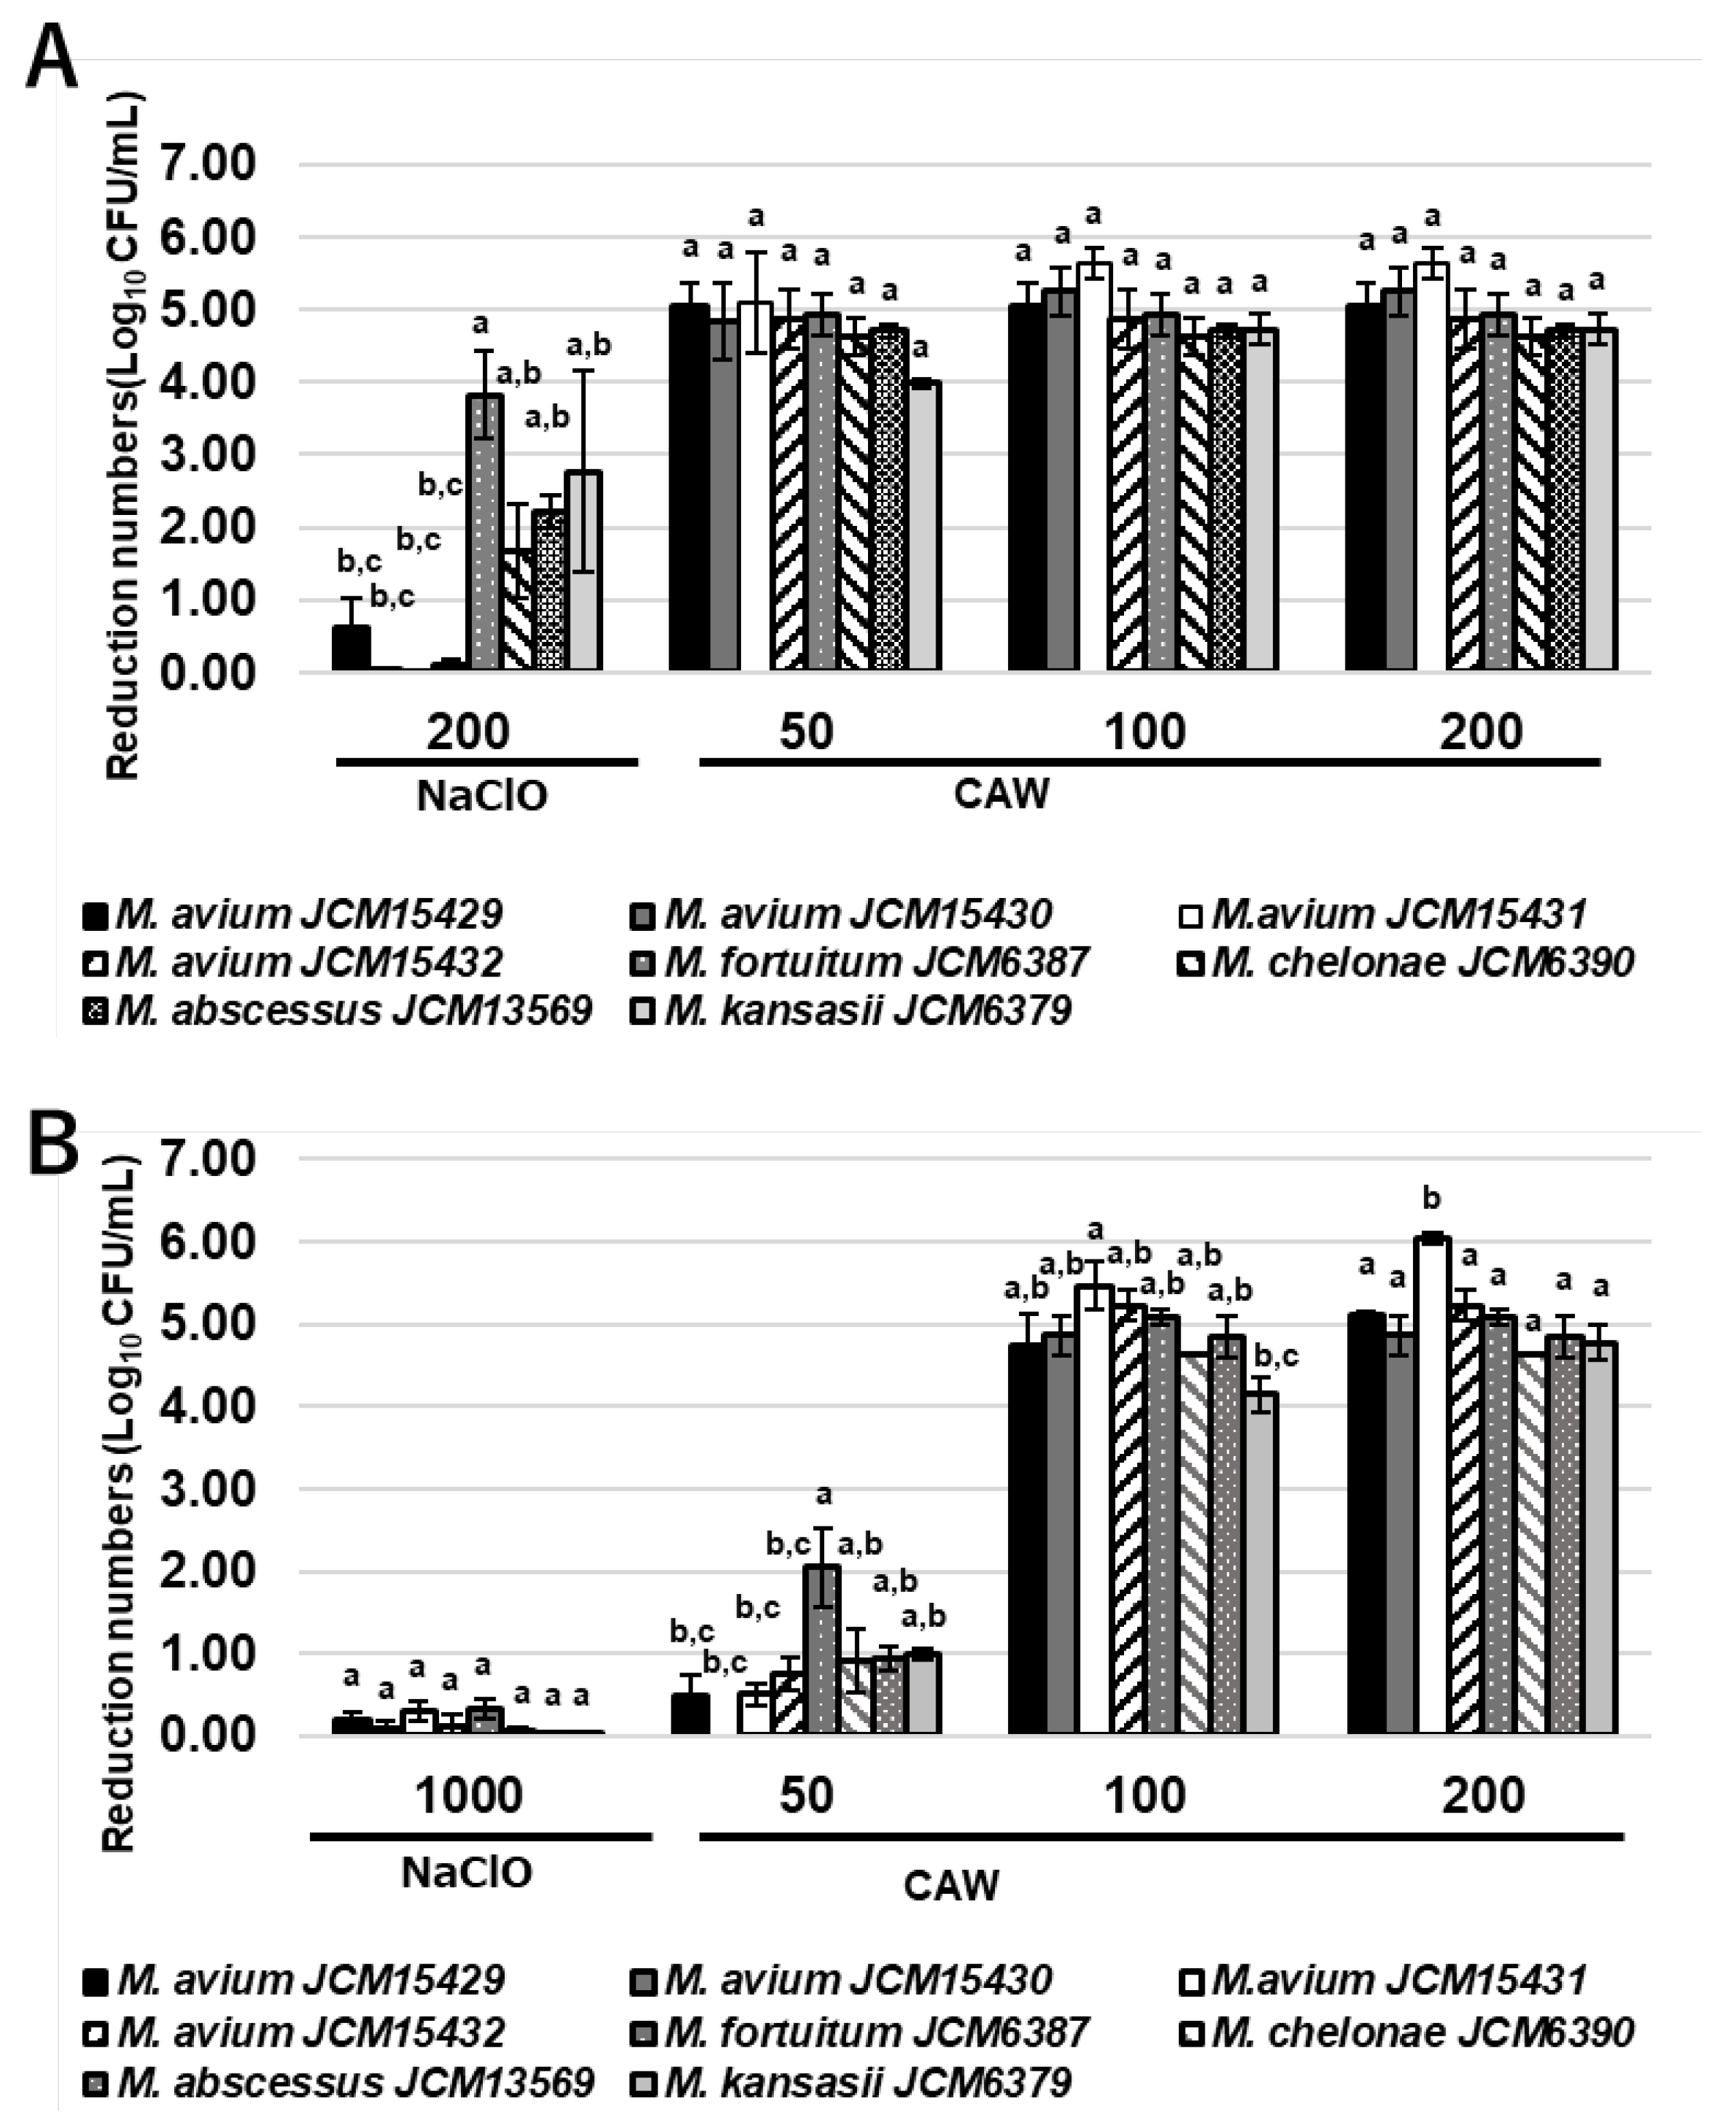
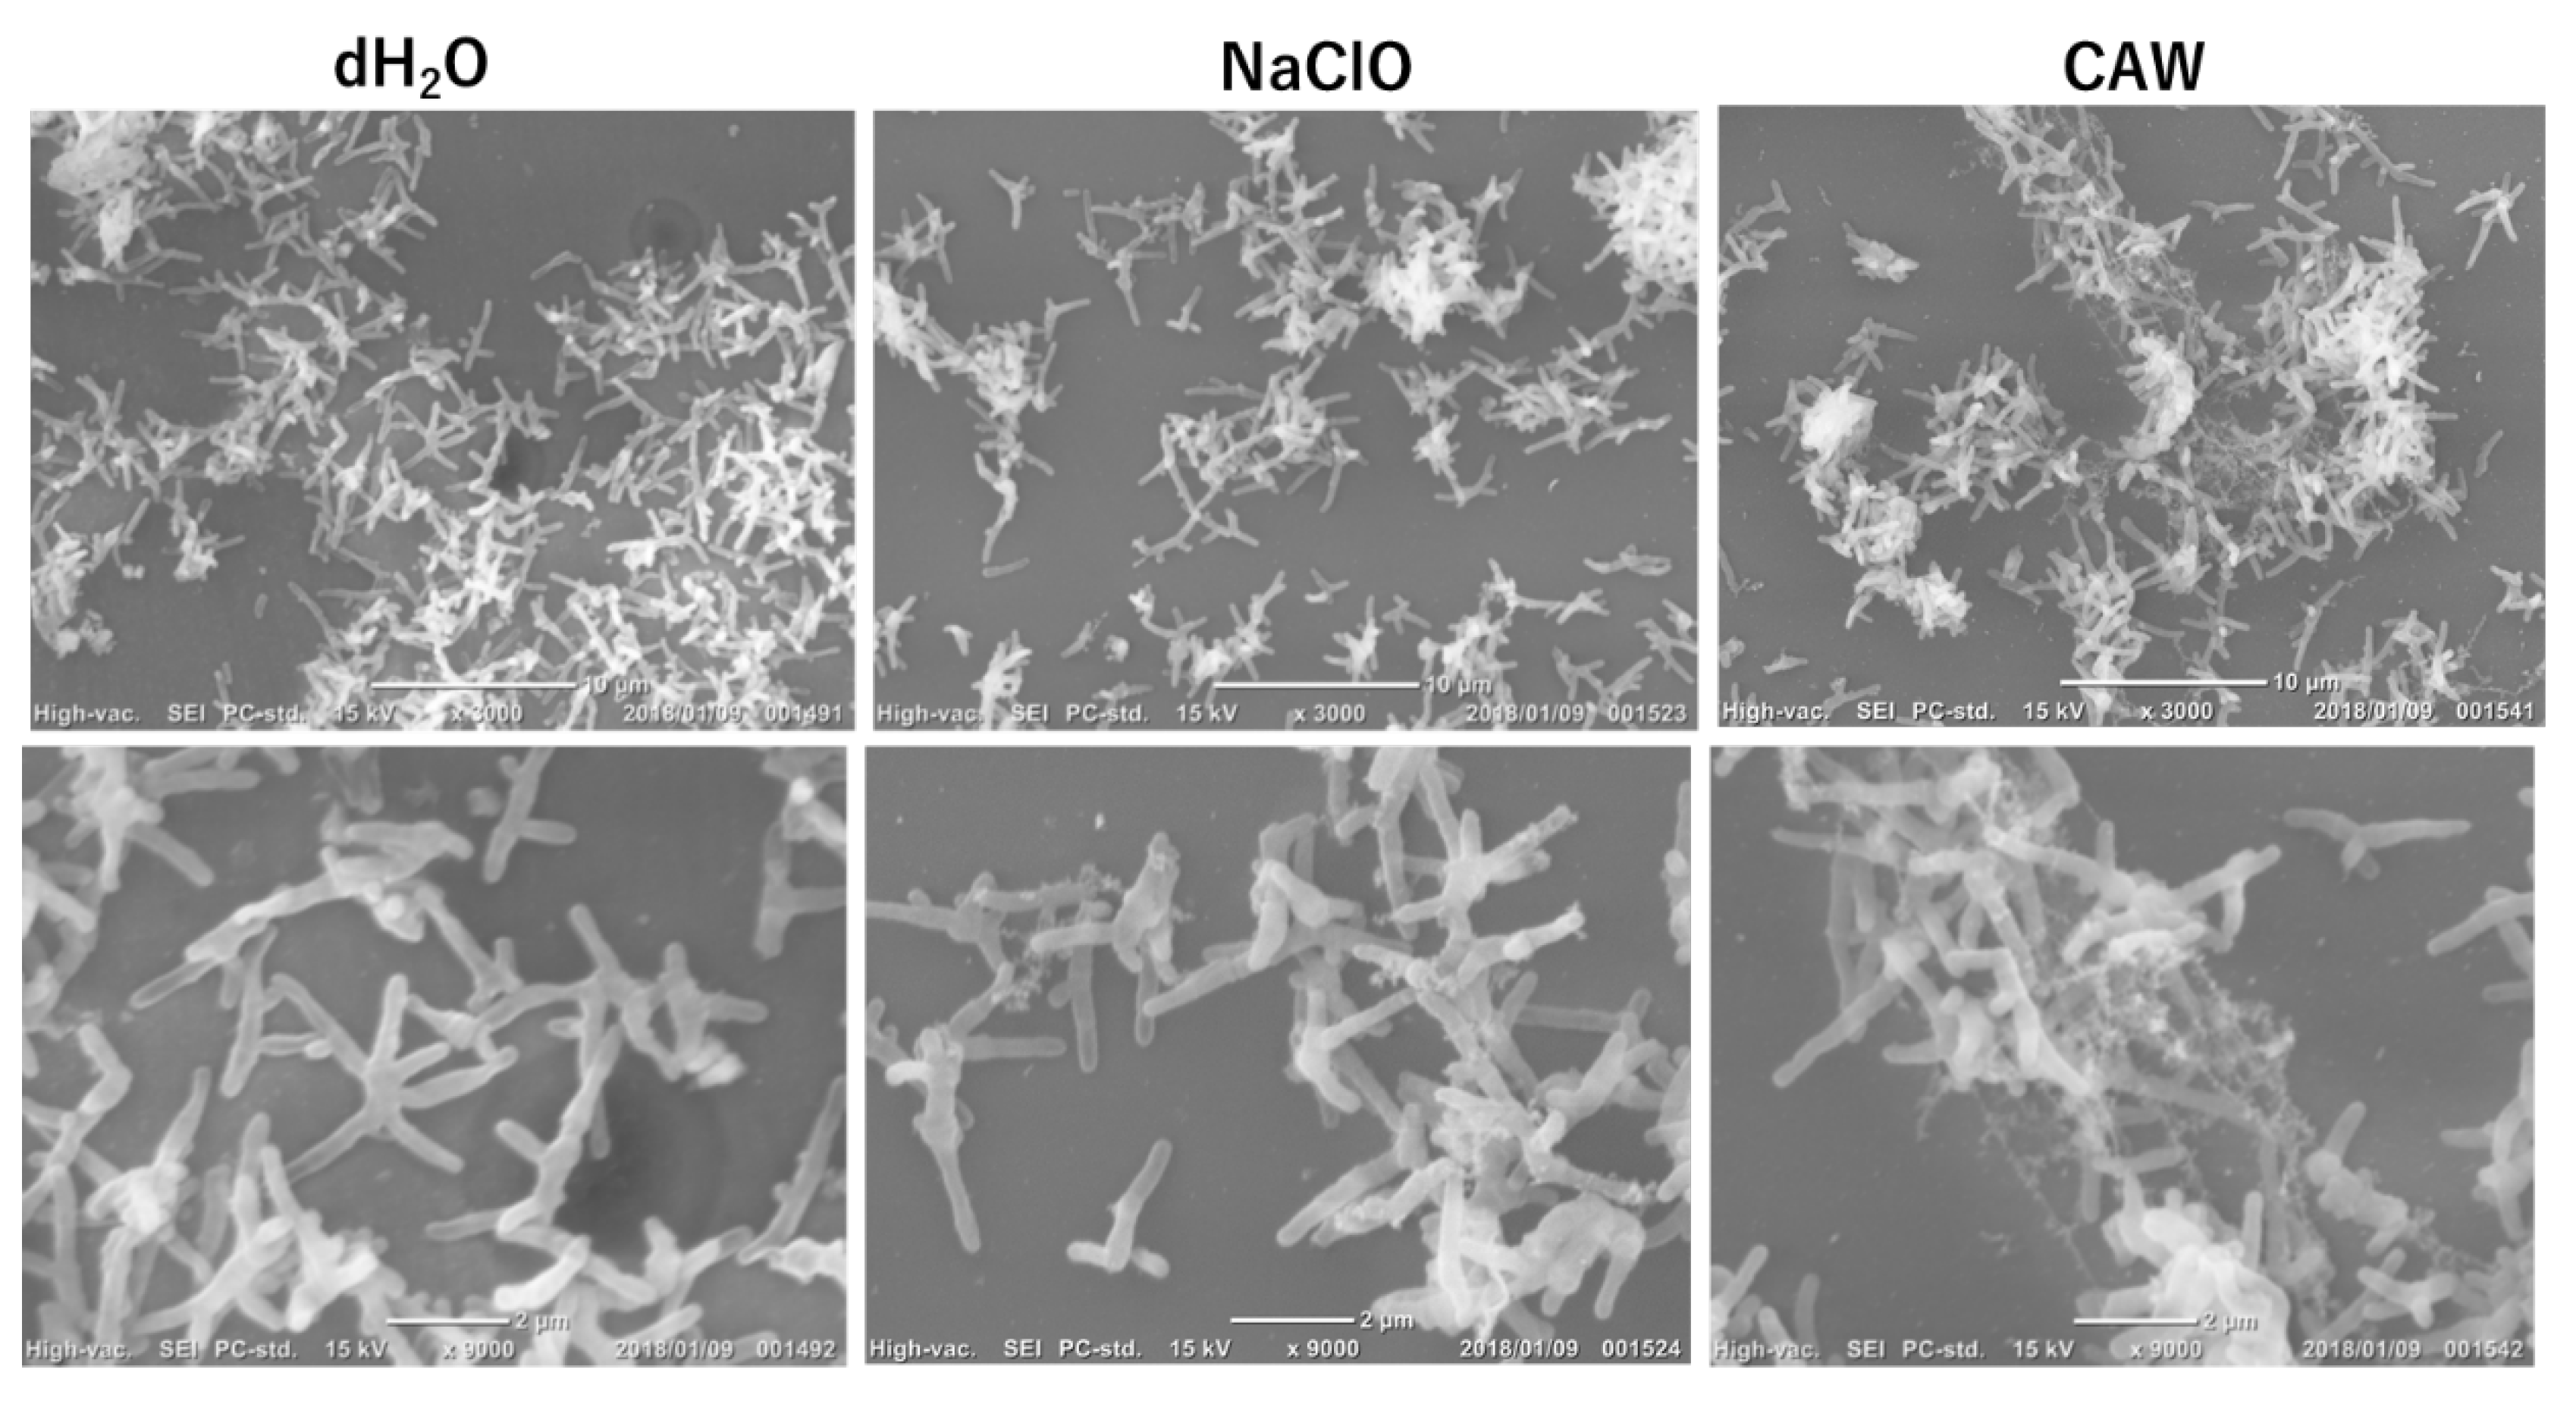
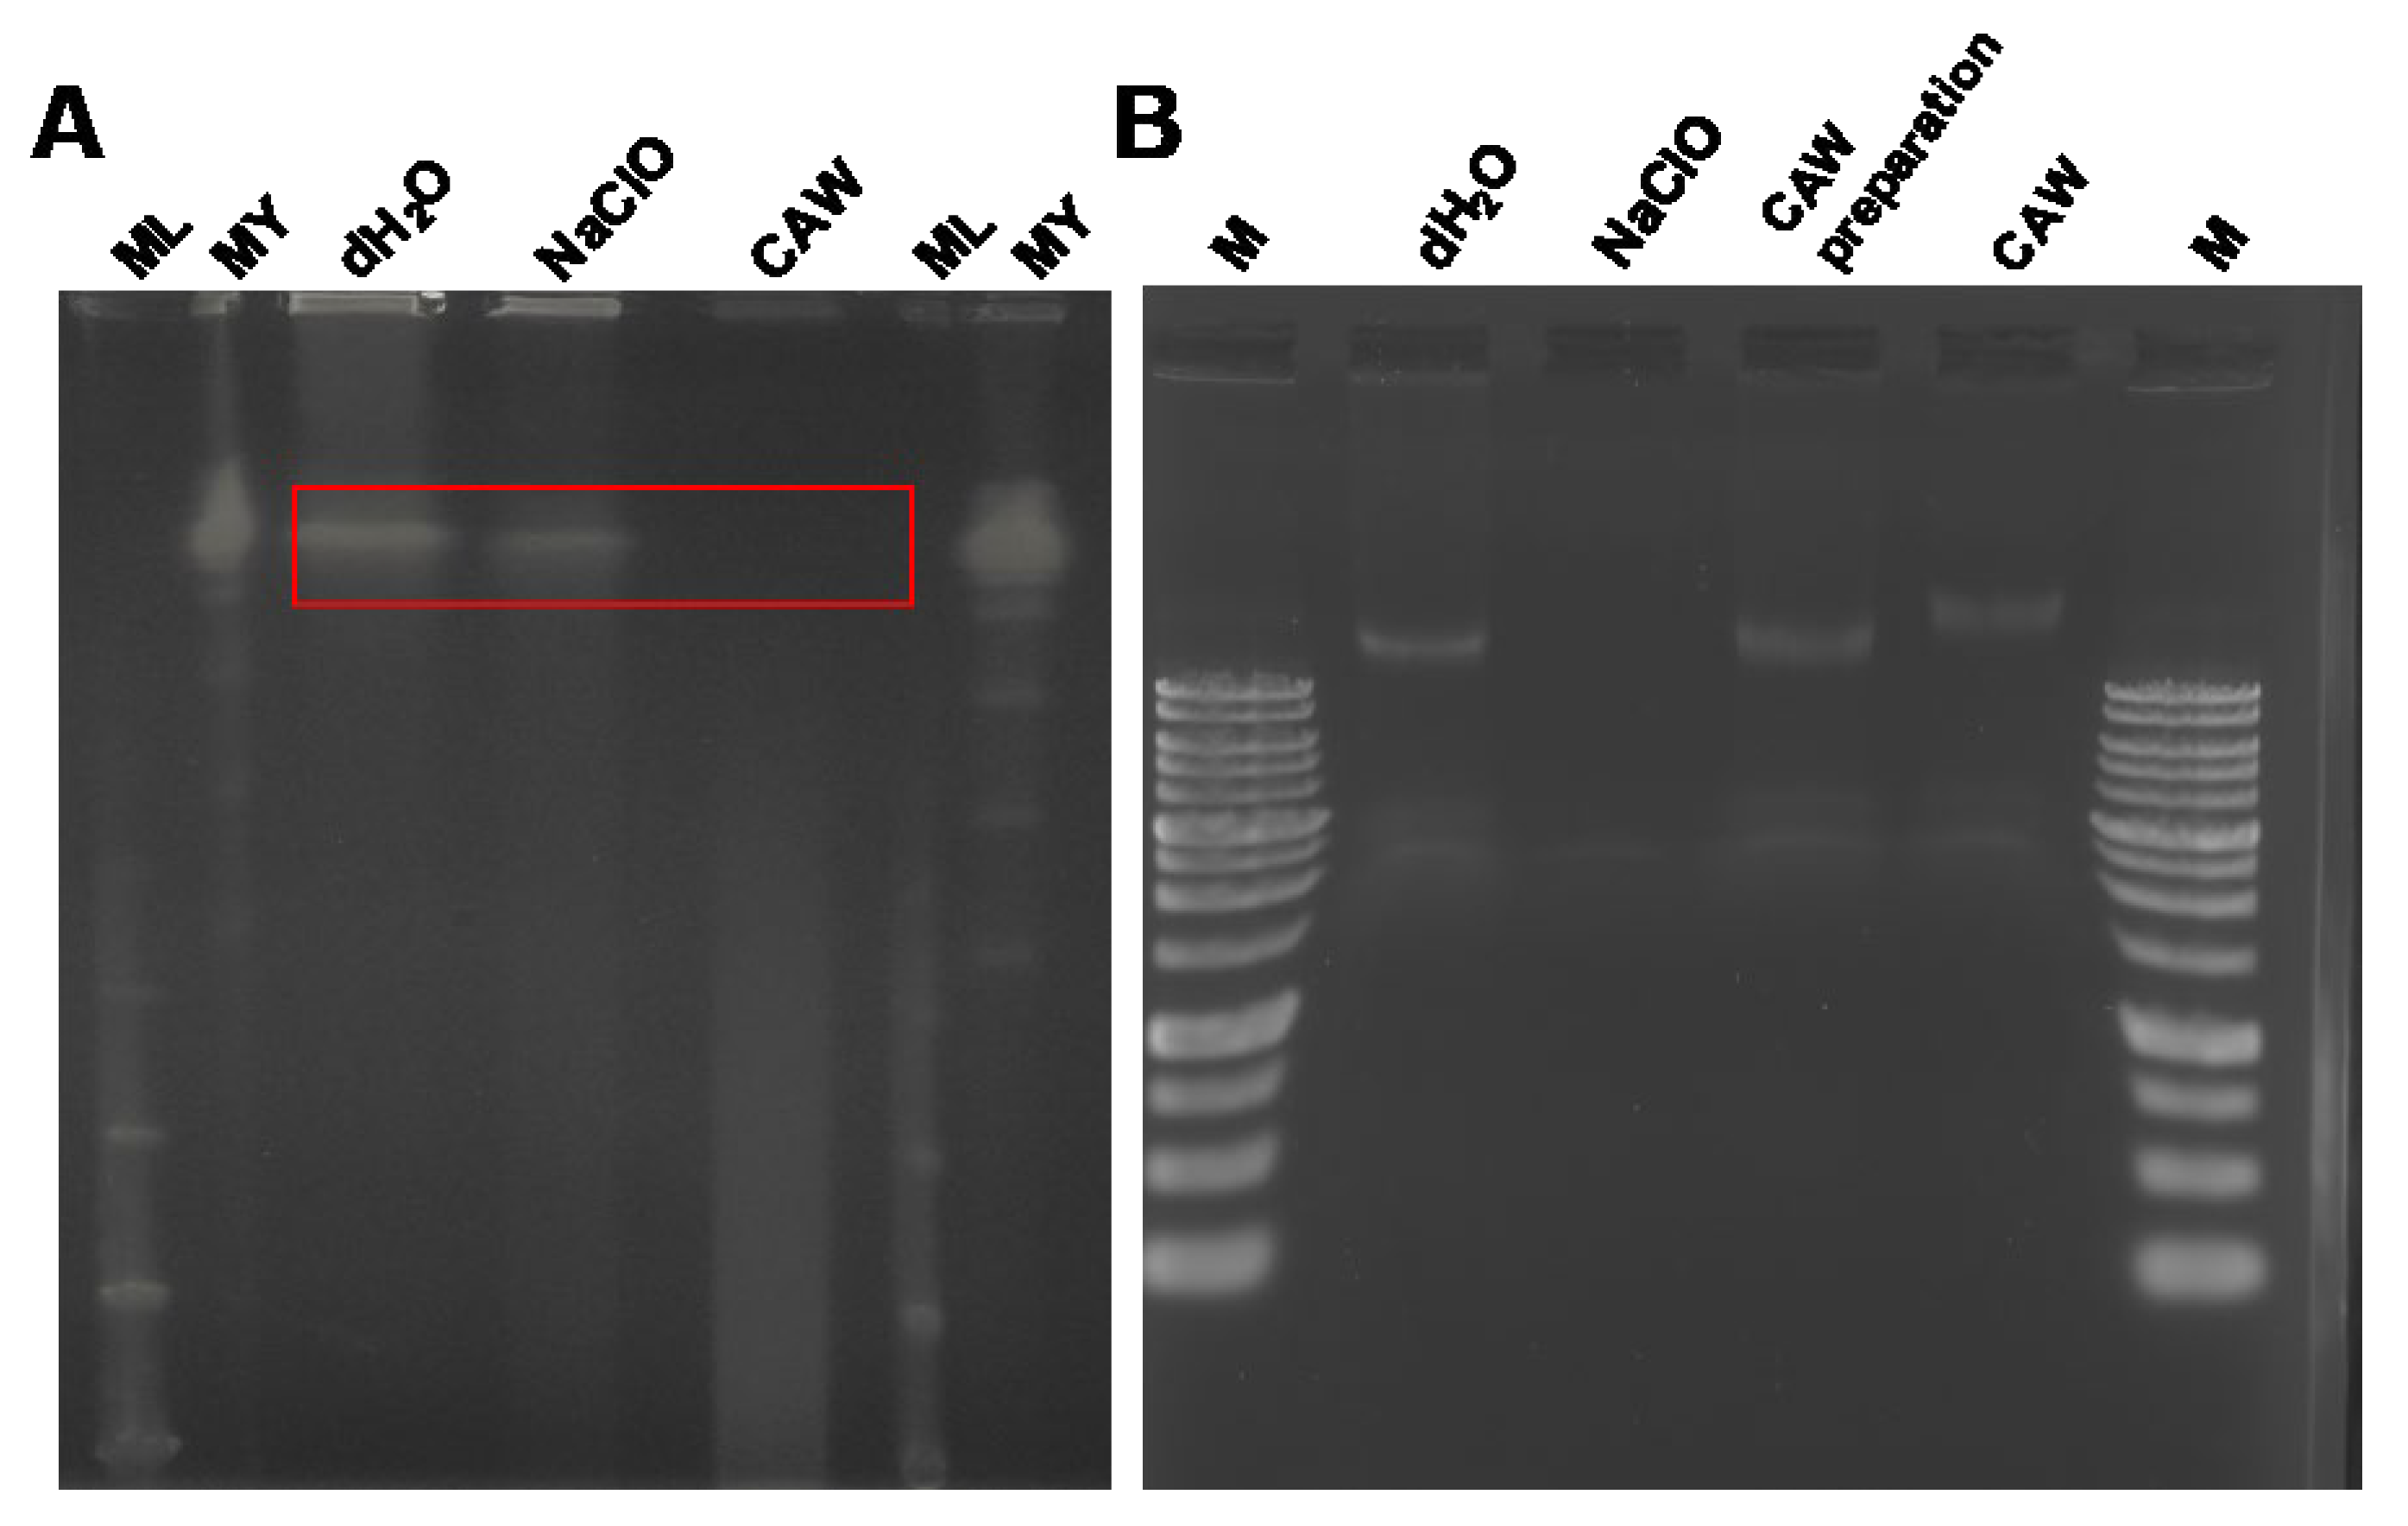
The global prevalence of pulmonary infections caused by non-tuberculous Mycobacteria (NTM), particularly the Mycobacterium avium complex (MAC), is increasing. Since NTM are ubiquitous in moist environments and resistant to standard disinfectants, this study evaluated the efficacy of chlorous acid water (CAW) against them. CAW demonstrated superior sanitizing effects compared to sodium hypochlorite (NaClO). It efficiently inactivated NTM at free available chlorine concentrations of 25 mg/L without organic matter and 100 mg/L with organic matter. In contrast, NaClO at 1000 mg/L failed to inactivate NTM in the presence of organic matter. MAC showed higher resistance to both agents compared to other NTM species. Mechanistically, the bactericidal effect of CAW did not correlate with DNA degradation. While prolonged exposure induced DNA damage, the primary mode of action was identified as a reduction in membrane potential, ATP production, and reactive oxygen species levels without altering cell morphology. These results indicate that CAW inactivates NTM effectively by damaging membrane components and the respiratory chain, rather than targeting DNA.
Keywords:
1. Introduction
2. Results
2.1. Bactericidal Effects of CAW and NaClO on NTM
2.2. Effects of CAW and NaClO on the Morphology of Mycobacteria
2.3. Effects of CAW, CAW Preparations and NaClO on Mycobacterial Genomic DNA
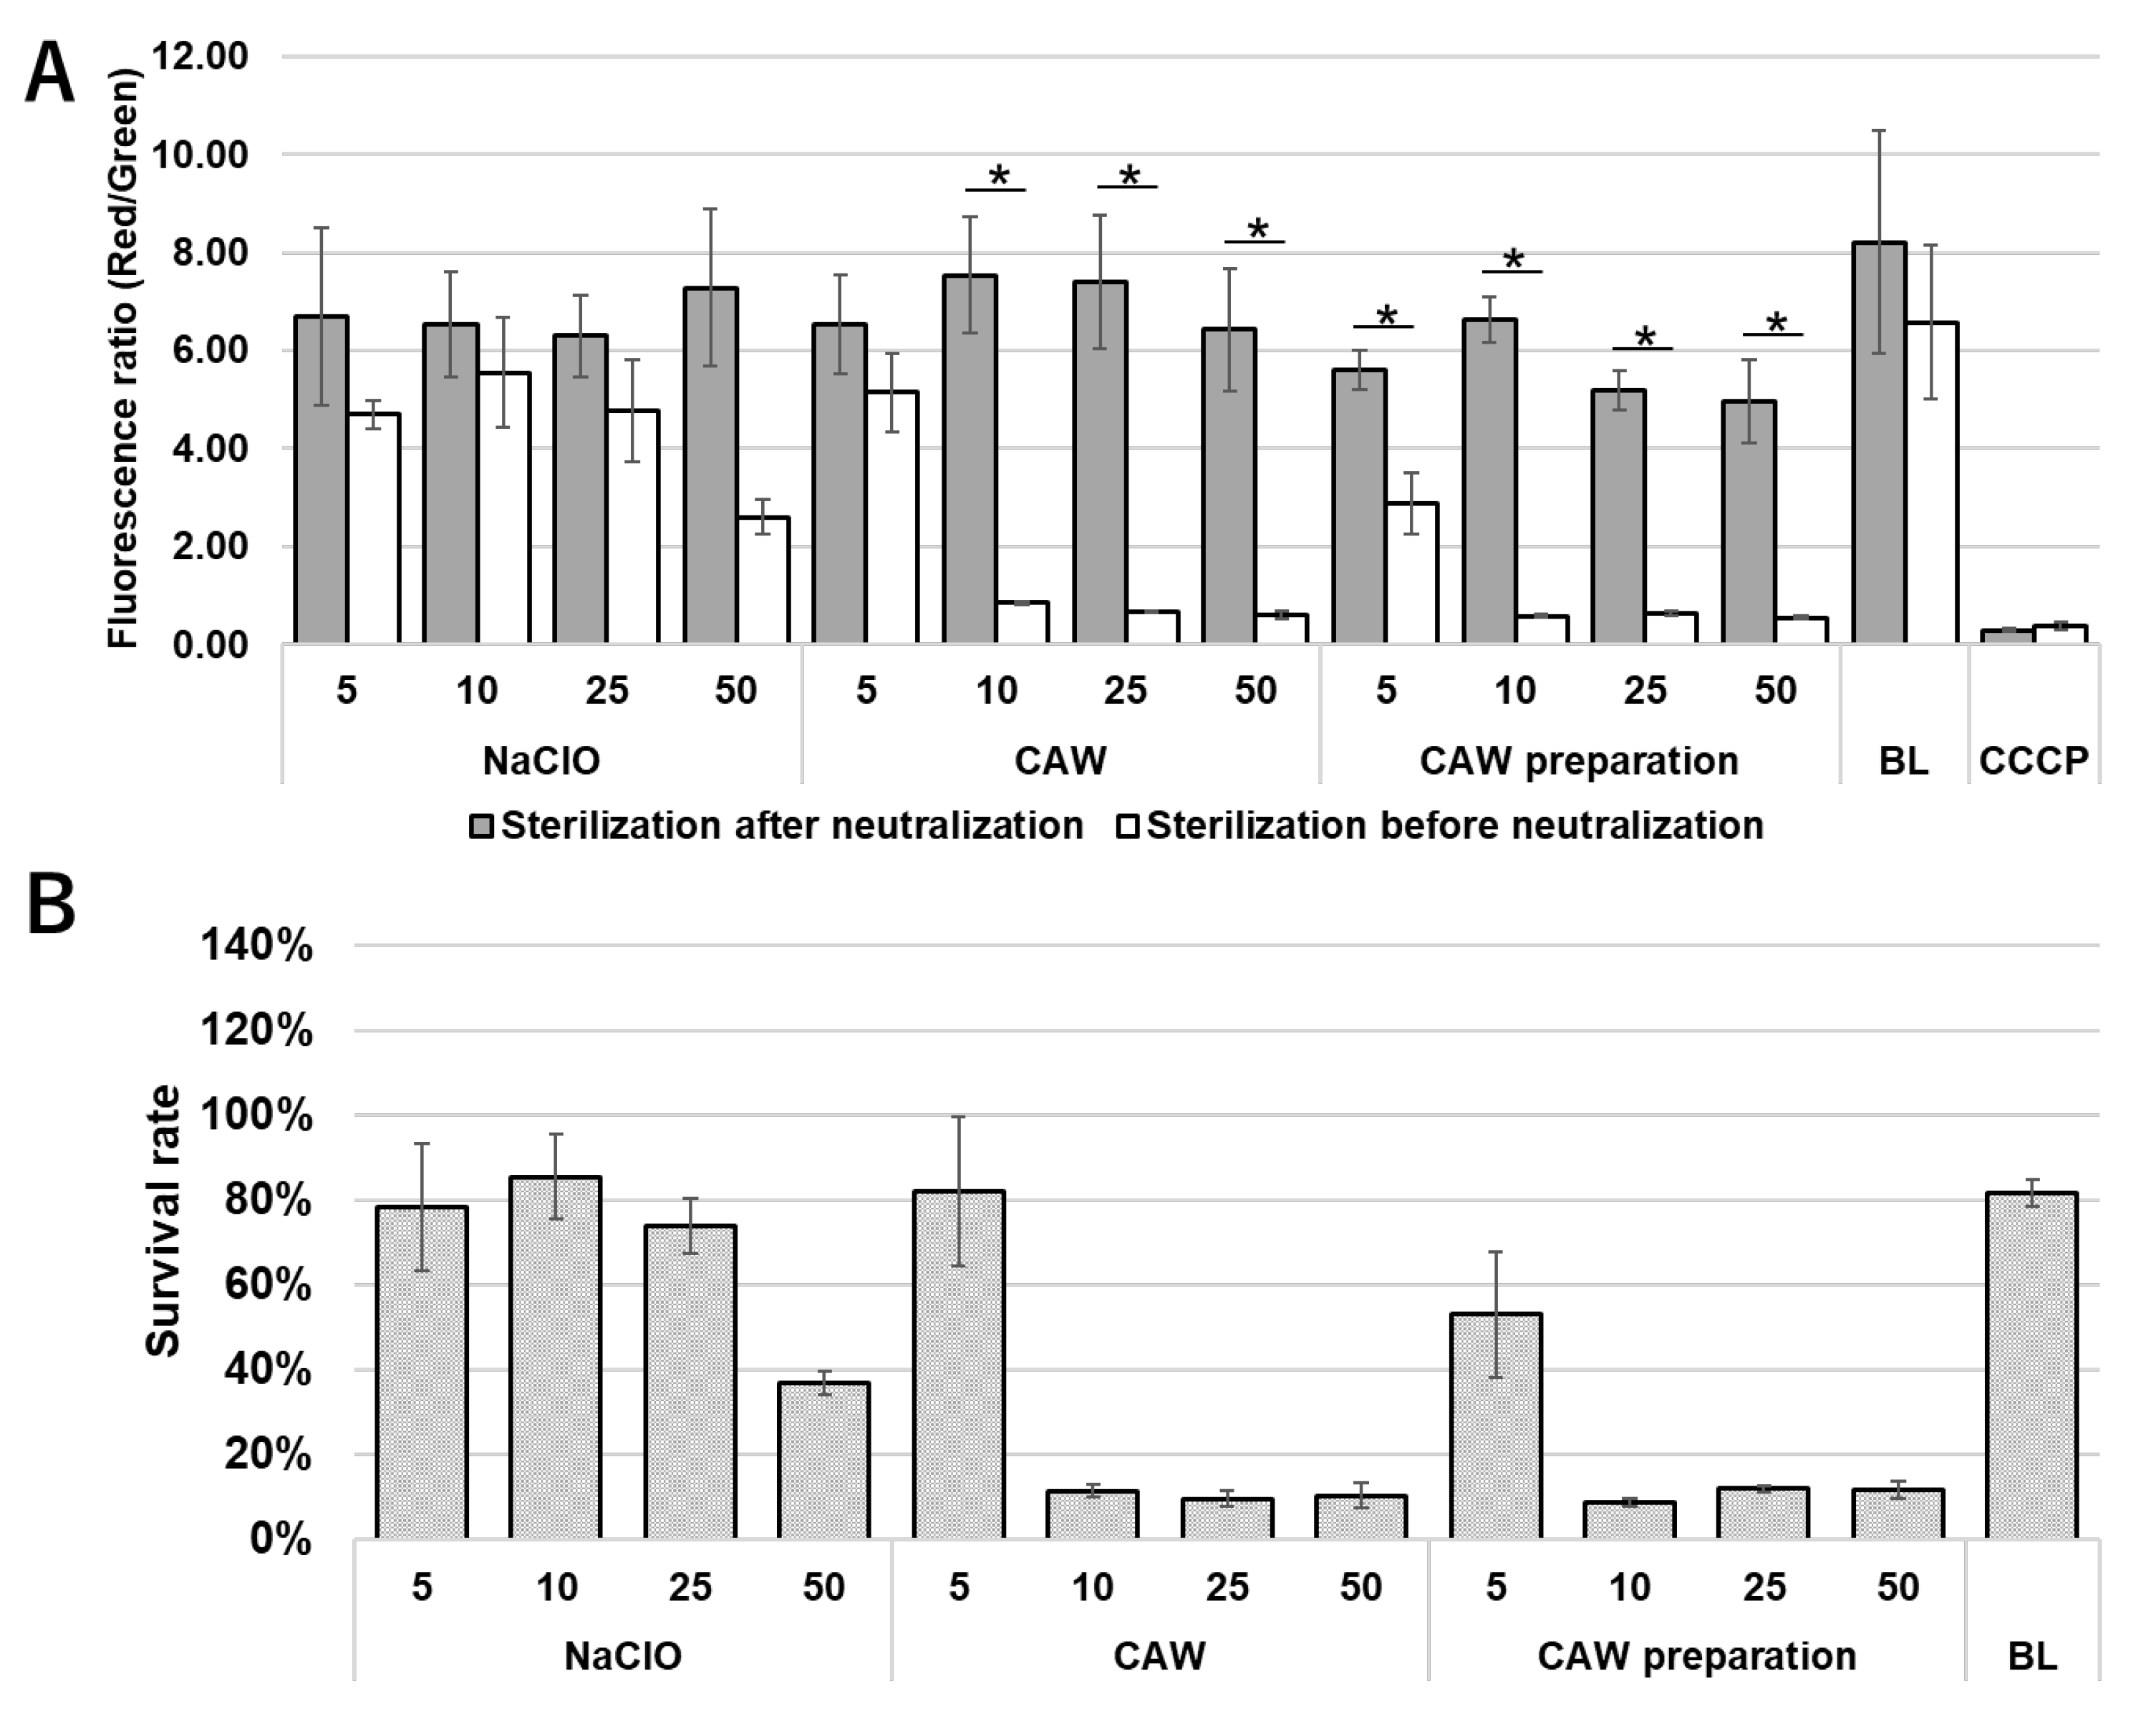
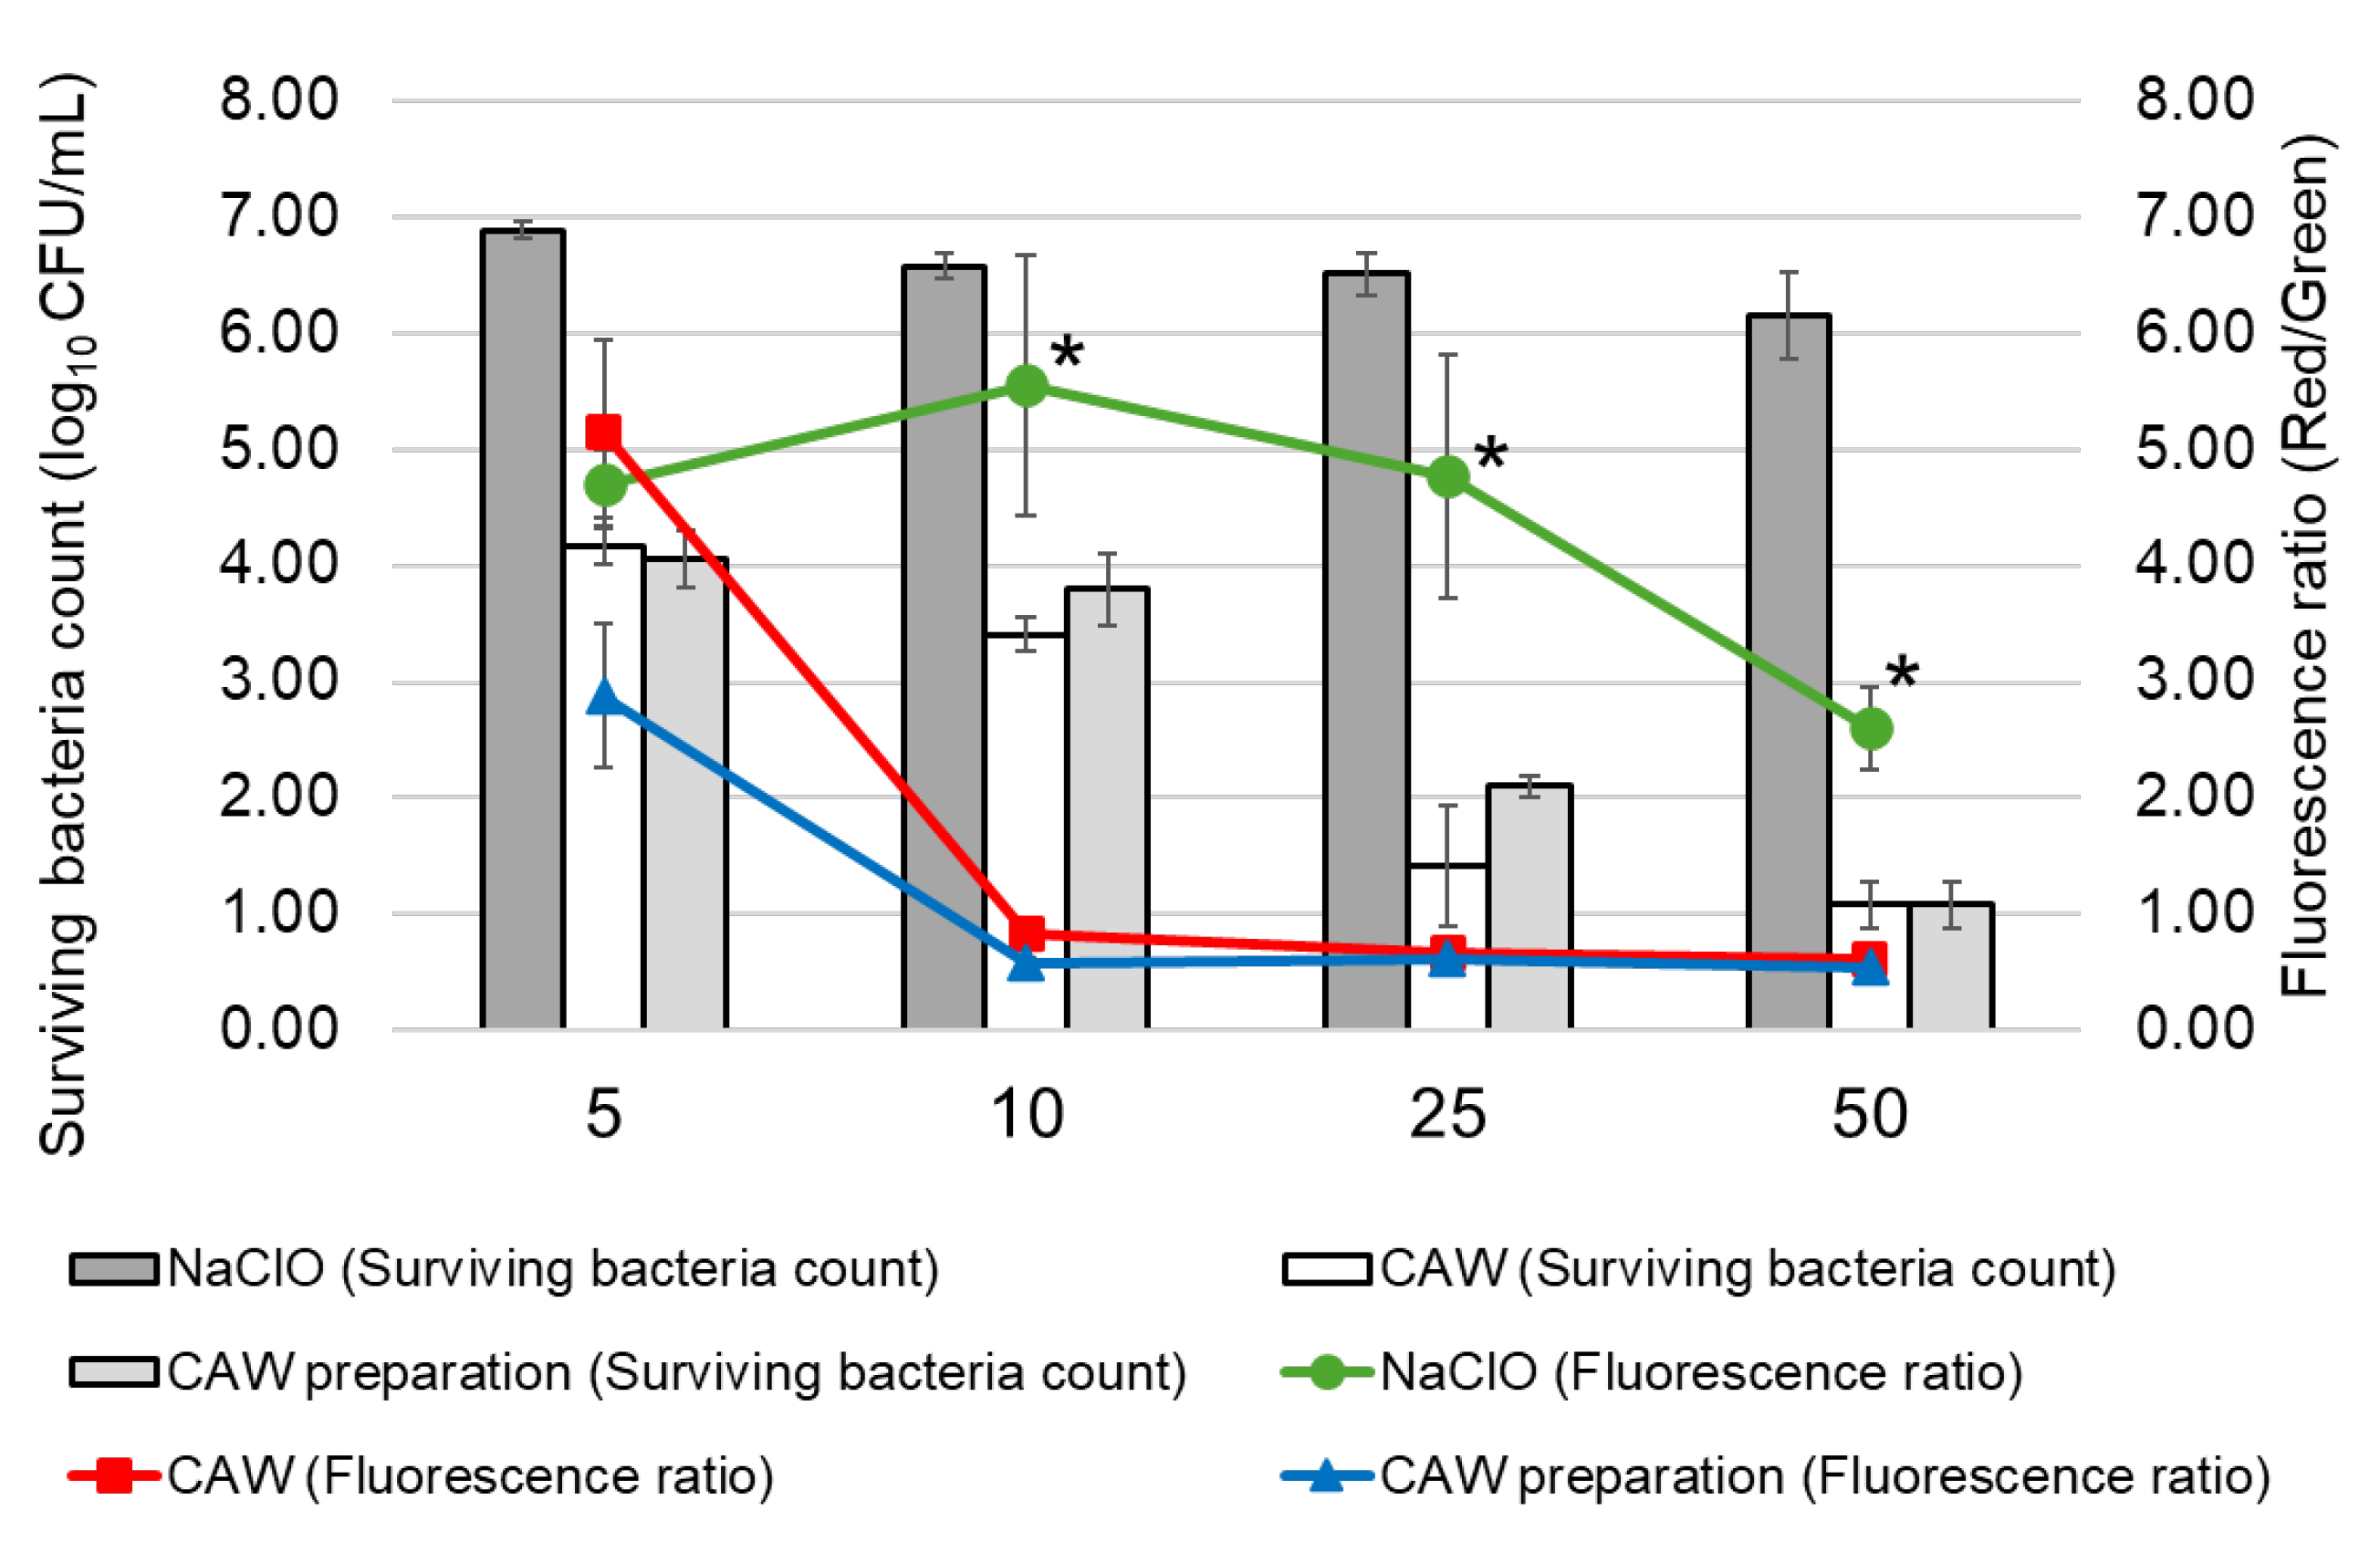
2.4. Effect of CAW, CAW Preparations and NaClO on Membrane Potential
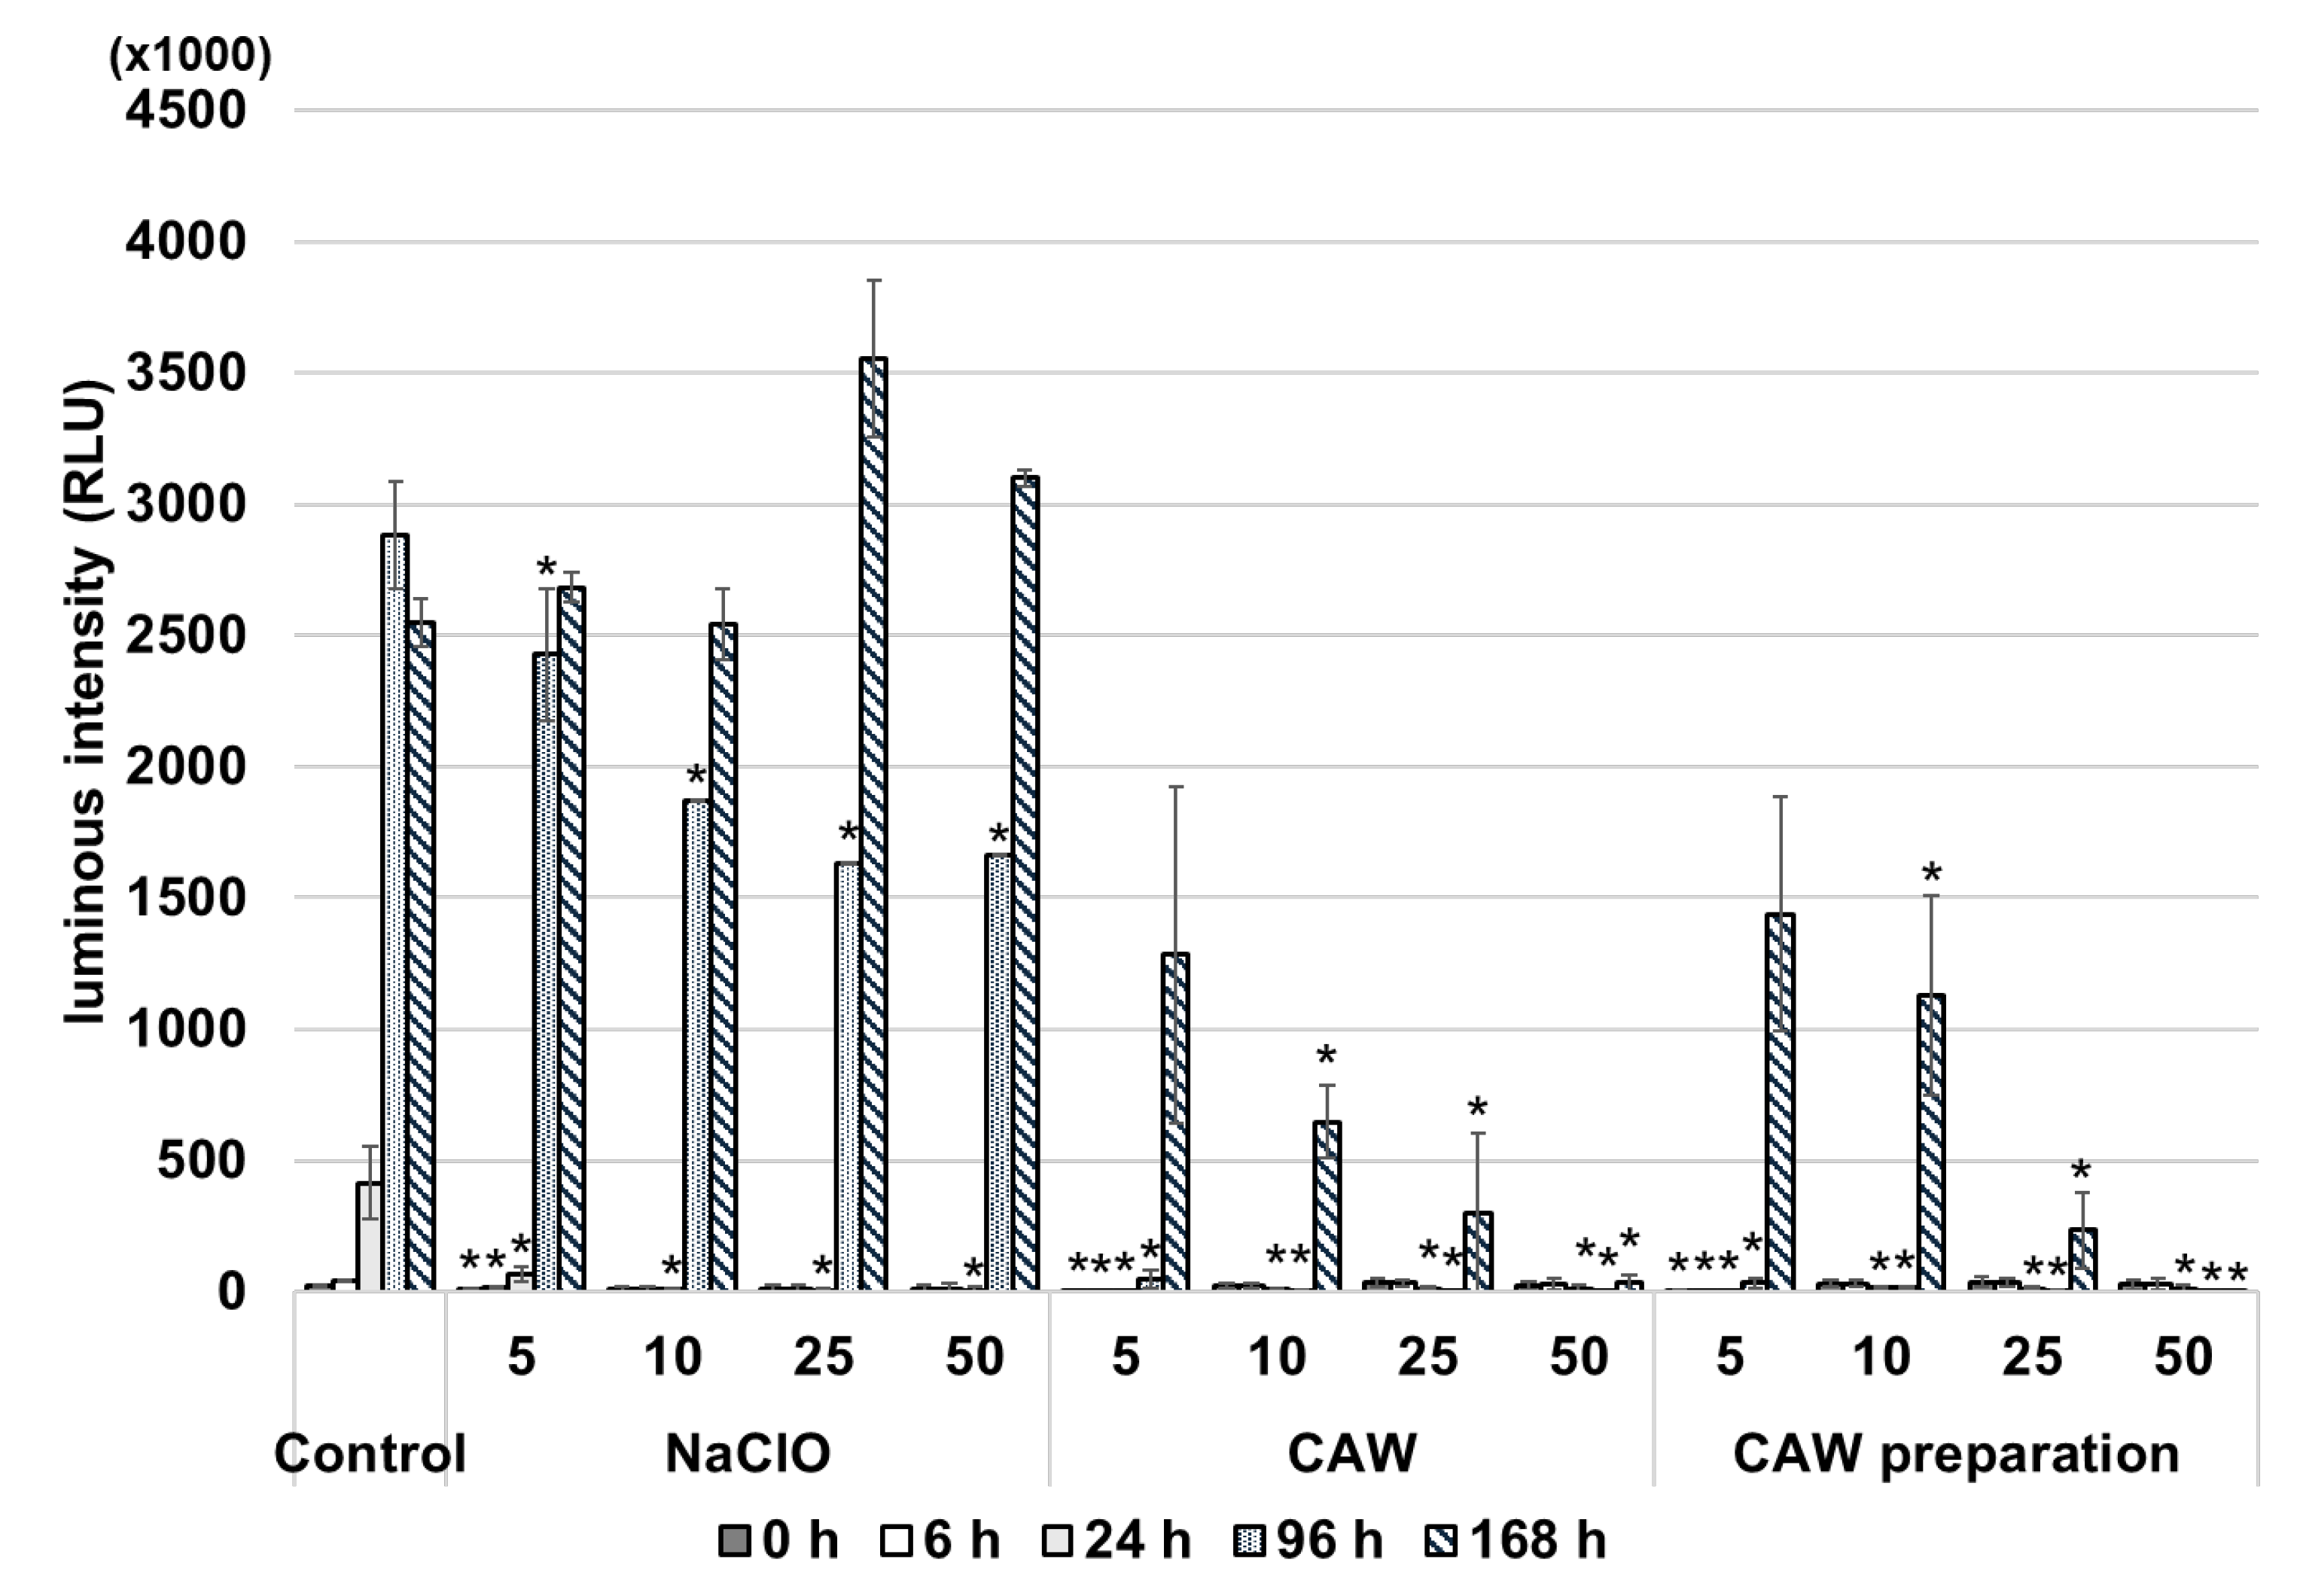
2.5. Alterations in Intracellular ATP Levels After Treatment with CAW, CAW Preparation and NaClO
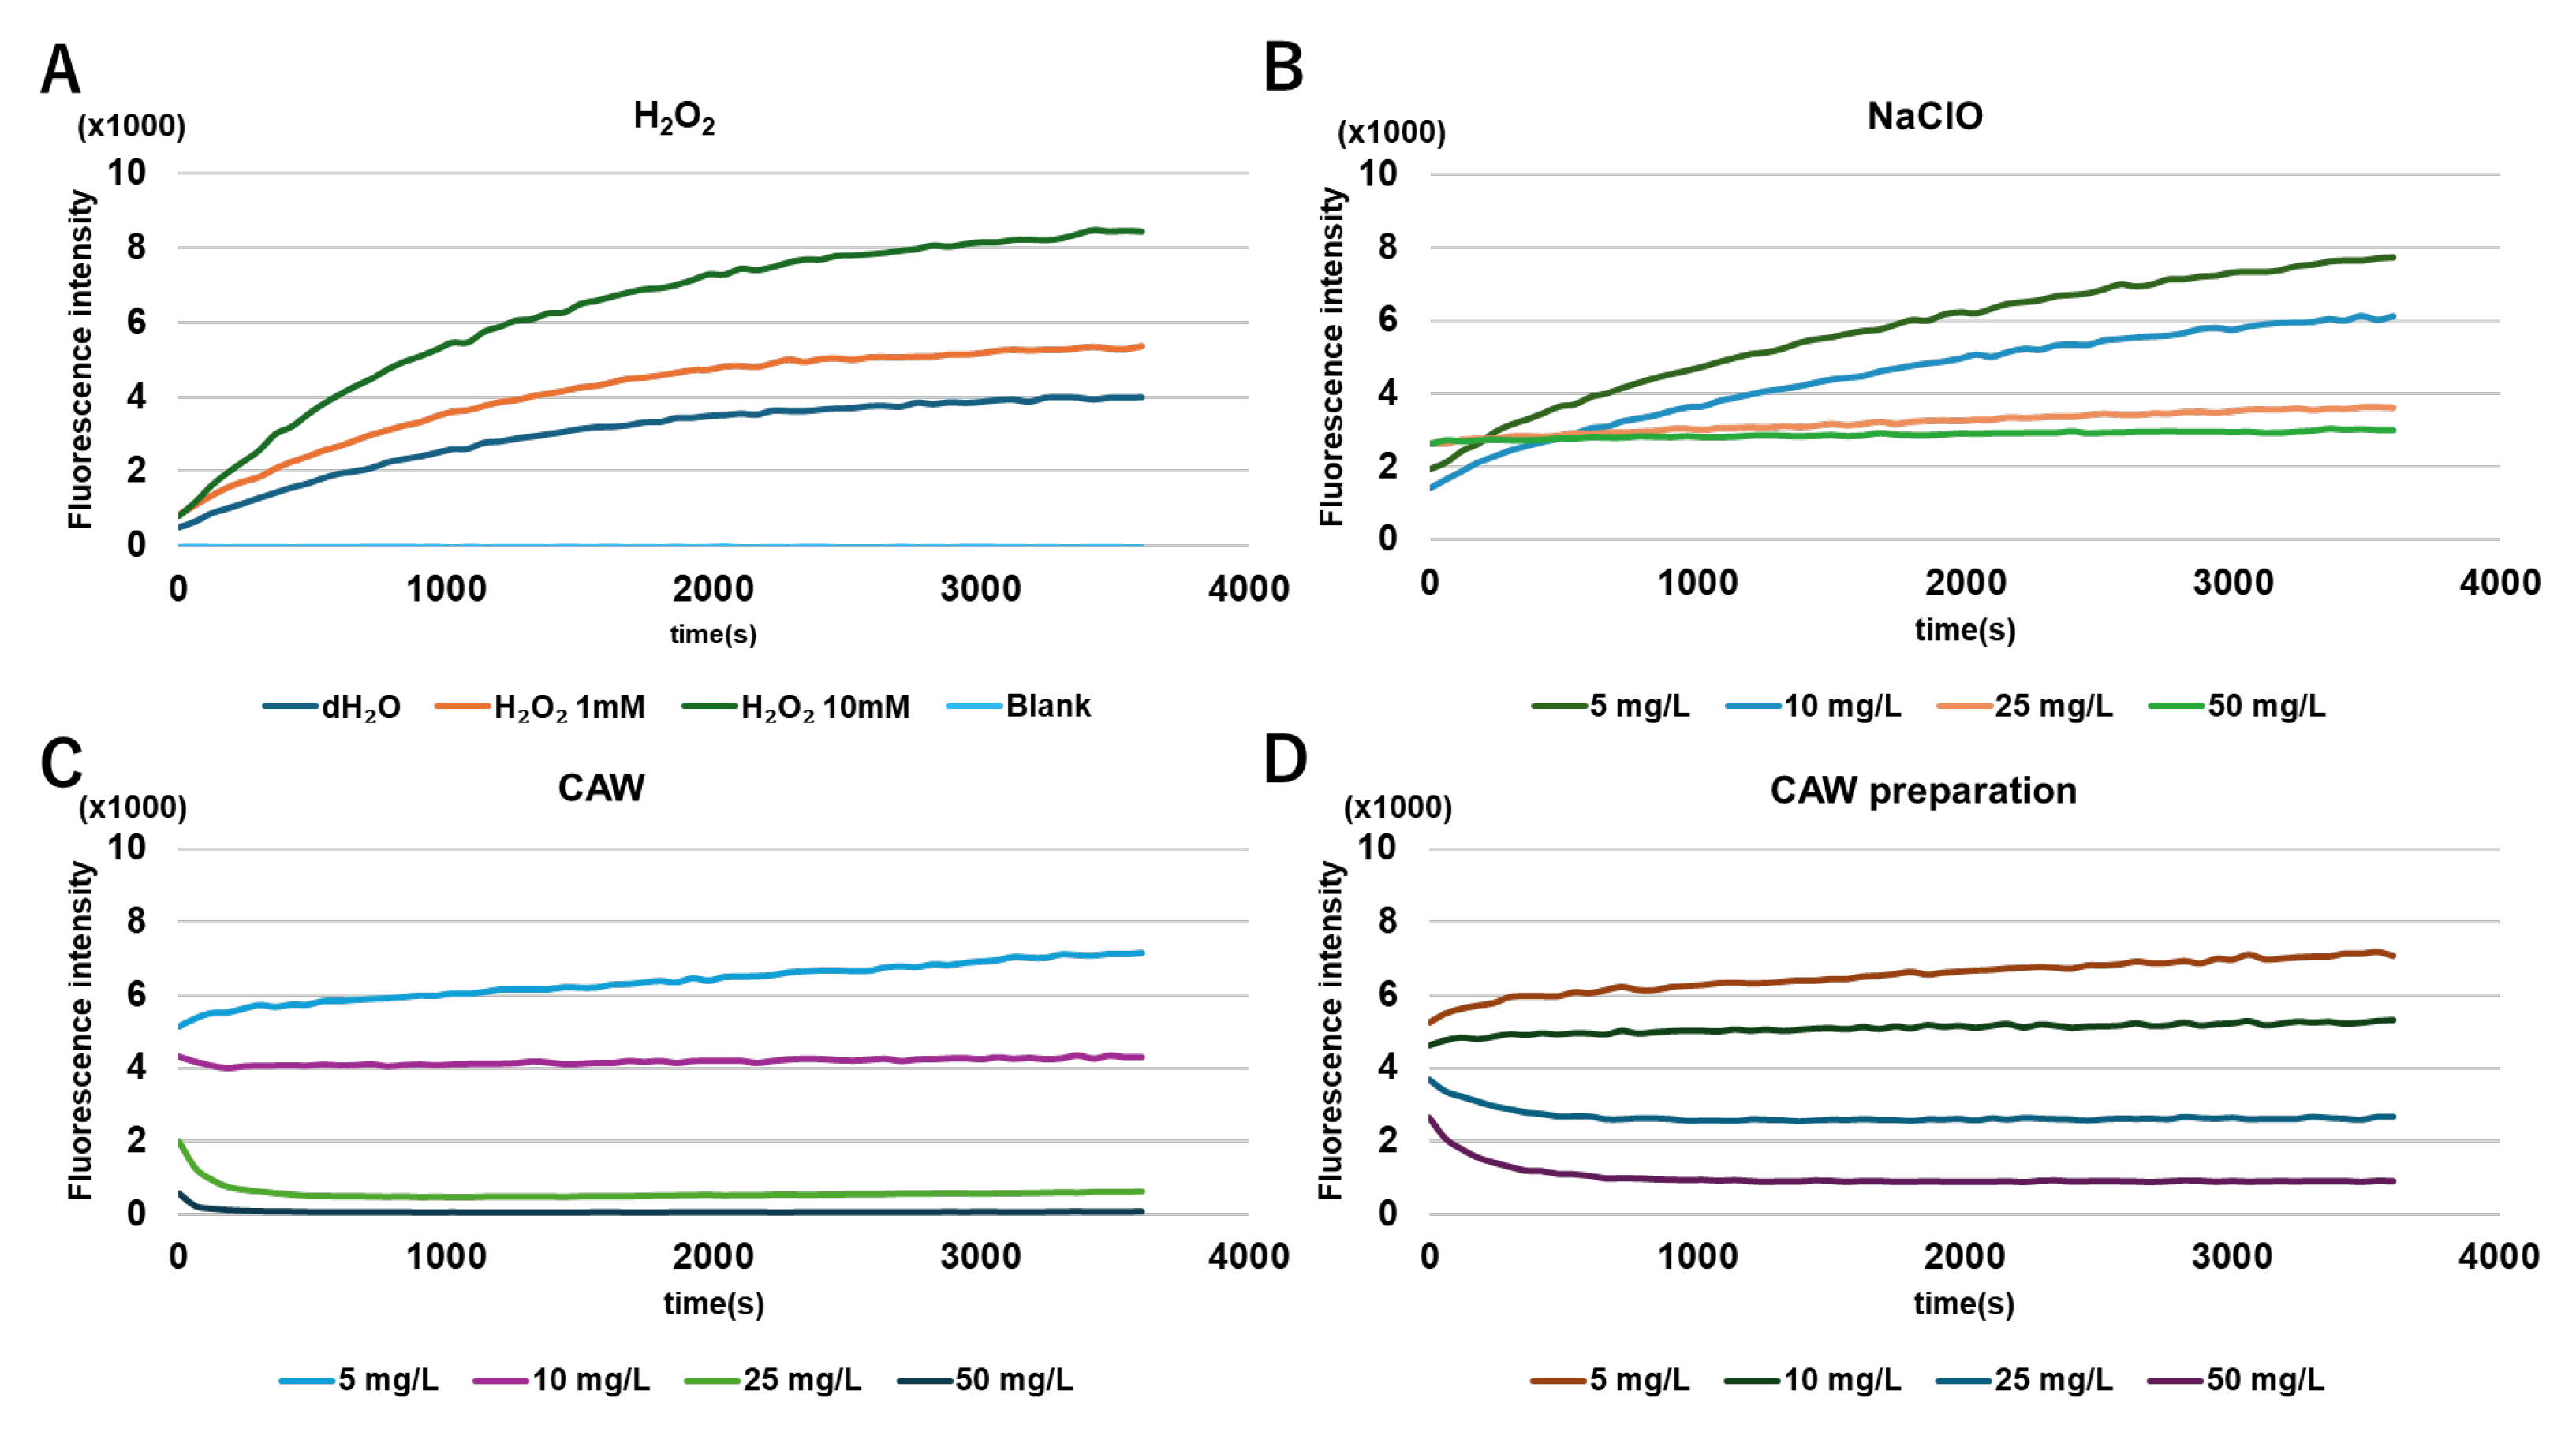
2.6. Reactive Oxygen Species (ROS) Generation After Treatment with Each Sanitizer
3. Discussion
4. Materials and Methods
4.1. Bacterial Strains and Culture Conditions
4.2. Disinfectants
4.3. Bactericidal Assays
4.4. Scanning Electron Microscopy
4.5. Pulsed-Field Gel Electrophoresis (PFGE)
4.6. DNA Extraction
4.7. Digestion of Single Stranded DNA
4.8. Measurement of Membrane Potential
4.9. Measurement of ATP
4.10. ROS Measurement
4.11. Statistical Analysis
5. Conclusions
Supplementary Materials
Author Contributions
Funding
Data Availability Statement
Acknowledgments
Conflicts of Interest
Abbreviations
| CAW | Chlorous acid water |
| NaClO | Sodium hypochlorite |
| NTM | Non-tuberculous mycobacteria |
| ROS | Reactive oxygen species |
References
- Ministry of Health; Labour and Welfare. Annual Report on Tuberculosis Registrant Information Survey 2023; Ministry of Health, Labour and Welfare: Tokyo, Japan, 2024; Available online: https://www.mhlw.go.jp/stf/seisakunitsuite/bunya/0000175095_00011.html (accessed on 2 September 2025).
- Namkoong, H.; Kurashima, A.; Morimoto, K.; Hoshino, Y.; Hasegawa, N.; Ato, M.; Mitarai, S. Epidemiology of Pulmonary Nontuberculous Mycobacterial Disease, Japan. Emerg. Infect. Dis. 2016, 22, 1116–1117. [Google Scholar] [CrossRef]
- Winthrop, K.L.; McNelley, E.; Kendall, B.; Marshall-Olson, A.; Morris, C.; Cassidy, M.; Saulson, A.; Hedberg, K. Pulmonary Nontuberculous Mycobacterial Disease Prevalence and Clinical Features: An Emerging Public Health Disease. Am. J. Respir. Crit. Care Med. 2010, 182, 977–982. [Google Scholar] [CrossRef]
- Matsuyama, M.; Matsumura, S.; Nonaka, M.; Nakajima, M.; Sakai, C.; Arai, N.; Ueda, K.; Hizawa, N. Pathophysiology of Pulmonary Nontuberculous Mycobacterial (NTM) Disease. Respir. Investig. 2023, 61, 135–148. [Google Scholar] [CrossRef] [PubMed]
- Shah, N.M.; Davidson, J.A.; Anderson, L.F.; Lalor, M.K.; Kim, J.; Thomas, H.L.; Lipman, M.; Abubakar, I. Pulmonary Mycobacterium avium-intracellulare Is the Main Driver of the Rise in Non-Tuberculous Mycobacteria Incidence in England, Wales and Northern Ireland, 2007-2012. BMC Infect. Dis. 2016, 16, 195. [Google Scholar] [CrossRef] [PubMed]
- Daley, C.L. Mycobacterium avium Complex Disease. Microbiol. Spectr. 2017, 5. [Google Scholar] [CrossRef] [PubMed]
- Morimoto, K.; Hasegawa, N.; Izumi, K.; Namkoong, H.; Uchimura, K.; Yoshiyama, T.; Hoshino, Y.; Kurashima, A.; Sokunaga, J.; Shibuya, S.; et al. A Laboratory-Based Analysis of Nontuberculous Mycobacterial Lung Disease in Japan from 2012 to 2013. Ann. Am. Thorac. Soc. 2017, 14, 49–56. [Google Scholar] [CrossRef]
- Morimoto, K.; Ato, M.; Hasegawa, N.; Mitarai, S. Population-Based Distribution of Mycobacterium avium and Mycobacterium intracellulare in Japan. Microbiol. Res. 2021, 12, 739–743. [Google Scholar] [CrossRef]
- van Ingen, J.; Obradovic, M.; Hassan, M.; Lesher, B.; Hart, E.; Chatterjee, A.; Daley, C.L. Nontuberculous Mycobacterial Lung Disease Caused by Mycobacterium avium Complex—Disease Burden, Unmet Needs, and Advances in Treatment Developments. Expert Rev. Respir. Med. 2021, 15, 1387–1401. [Google Scholar] [CrossRef]
- Koh, W.-J.; Jeong, B.-H.; Jeon, K.; Lee, N.Y.; Lee, K.S.; Woo, S.Y.; Shin, S.J.; Kwon, O.J. Clinical Significance of the Differentiation between Mycobacterium avium and Mycobacterium intracellulare in M. avium Complex Lung Disease. Chest 2012, 142, 1482–1488. [Google Scholar] [CrossRef]
- Griffith, D.E.; Aksamit, T.; Brown-Elliott, B.A.: Catanzaro, A; Daley, C; Gordin, F.; Holland, S.M.; Horsburgh, R.; Huitt, G.; Iademarco, M.F.; Iseman, M.; Olivier, K.; Ruoss, S.; von Reyn, C.F.; Wallace Jr, R.J.; Winthrop, K.; ATS Mycobacterial Diseases Subcommittee; American Thoracic Society; Infectious Disease Society of America. An official ATS/IDSA statement: diagnosis, treatment, and prevention of nontuberculous mycobacterial diseases. Am. J. Respir. Crit. Care Med. 2007, 175, 367–416. [CrossRef]
- Wallace, R.J., Jr.; Brown-Elliott, B.A.; McNulty, S.; Philley, J.V.; Killingley, J.; Wilson, R.W.; York, D.S.; Shepherd, S.; Griffith, D.E. Macrolide/Azalide therapy for nodular/bronchiectatic Mycobacterium avium complex lung disease. Chest 2014, 146, 276–282. [Google Scholar] [CrossRef]
- Lee, B.Y.; Kim, S.; Hong, Y.; Lee, S.-D.; Kim, W.S.; Kim, D.S.; Shim, T.S.; Jo, K.-W. Risk factors for recurrence after successful treatment of Mycobacterium avium complex lung disease. Antimicrob. Agents Chemother. 2015, 59, 2972–2977. [Google Scholar] [CrossRef]
- Nishiuchi, Y.; Iwamoto, T.; Maruyama, F. Infection Sources of a Common Non-Tuberculous Mycobacterial Pathogen, Mycobacterium avium Complex. Front. Med. 2017, 4, 27. [Google Scholar] [CrossRef]
- Whiley, H.; Keegan, A.; Giglio, S.; Bentham, R. Mycobacterium avium Complex—the Role of Potable Water in Disease Transmission. J. Appl. Microbiol. 2012, 113, 223–232. [Google Scholar] [CrossRef]
- Nishiuchi, Y.; Maekura, R.; Kitada, S.; Tamaru, K.; Taguri, T.; Kira, Y.; Hiraga, T.; Hirotani, A.; Yoshimura, K.; Miki, M.; Ito, M. The recovery of Mycobacterium avium-intracellulare complex (MAC) from the residential bathrooms of patients with pulmonary MAC. Clin. Infect Dis. 2007, 45, 347–351. [Google Scholar] [CrossRef] [PubMed]
- Dantec, C.L.; Duguet, J.-P.; Montiel, A.; Dumoutier, N.; Dubrou, S.; Vincent, V. Chlorine disinfection of atypical mycobacteria isolated from a water distribution system. Appl. Environ. Microbiol. 2002, 68, 1025–1032. [Google Scholar] [CrossRef]
- Taylor, R.H.; Falkinham, J.O., 3rd; Norton, C.D.; LeChevallier, M.W. Chlorine, chloramine, chlorine dioxide, and ozone susceptibility of Mycobacterium avium. Appl. Environ. Microbiol. 2000, 66, 1702–1705. [Google Scholar] [CrossRef]
- Goda, H.; Yamaoka, H.; Nakayama-Imaohji, H.; Kawata, H.; Horiuchi, I.; Fujita, Y.; Nagao, T.; Tada, A.; Terada, A.; Kuwahara, T. Microbicidal Effects of Weakly Acidified Chlorous Acid Water against Feline Calicivirus and Clostridium difficile Spores under Protein-Rich Conditions. PLoS ONE 2017, 12, e0176718. [Google Scholar] [CrossRef]
- Hatanaka, N.; Awasthi, S.P.; Xu, B.; Goda, H.; Kawata, H.; Horiuchi, I.; Yasugi, M.; Yamasaki, S. Comparative Evaluation of Chlorous Acid and Sodium Hypochlorite Activity against SARS-CoV-2. Access Microbiol. 2022, 4, acmi000354. [Google Scholar] [CrossRef] [PubMed]
- Goda, H.; Nakayama-Imaohji, H.; Yamaoka, H.; Tada, A.; Nagao, T.; Fujisawa, T.; Koyama, A.H.; Kuwahara, T. Inactivation of Human Norovirus by Chlorous Acid Water, a Novel Chlorine-Based Disinfectant. J. Infect. Chemother. 2022, 28, 67–72. [Google Scholar] [CrossRef] [PubMed]
- Ministry of Health; Labour and Welfare. The 9th Edition of the Japanese Standards for Food Additives; Ministry of Health, Labour and Welfare: Tokyo, Japan, 2018; Available online: https://www.ecfr.gov/current/title-21/chapter-I/subchapter-B/part-173/subpart-D/section-173.325 (accessed on 2 September 2025).
- eCFR. 21 CFR 173.325 --Acidified Sodium Chlorite Solutions. Available online: https://www.ecfr.gov/current/title-21/chapter-I/subchapter-B/part-173/subpart-D/section-173.325 (accessed on 2 September 2025).
- Horiuchi, I.; Kawata, H.; Nagao, T.; Imaohji, H.; Murakami, K.; Kino, Y.; Yamasaki, H.; Koyama, A.H.; Fujita, Y.; Goda, H.; et al. Antimicrobial Activity and Stability of Weakly Acidified Chlorous Acid Water. Biocontrol Sci. 2015, 20, 43–51. [Google Scholar] [CrossRef]
- Hatanaka, N.; Awasthi, S.P.; Goda, H.; Kawata, H.; Uchino, Y.; Kubo, T.; Aoki, S.; Hinenoya, A.; Yamasaki, S. Chlorous Acid Is a More Potent Antibacterial Agent than Sodium Hypochlorite against Campylobacter. Food Control 2020, 111, 107046. [Google Scholar] [CrossRef]
- Hatanaka, N.; Awasthi, S.P.; Goda, H.; Kawata, H.; Hinenoya, A.; Yamasaki, S. Chlorous Acid Inactivates Mycobacterium tuberculosis with Much Lower Available Chlorine Concentration than Sodium Hypochlorite. Jpn. J. Infect. Dis. 2025; ahead of print. [Google Scholar] [CrossRef]
- Kawata, H.; Kohno, M.; Nukina, K.; Horiuchi, I.; Goda, H.; Kuwahara, T.; Yoshimori, K.; Miyaji, A.; Kamachi, T.; Yoshikawa, T. Identifying the Chloroperoxyl Radical in Acidified Sodium Chlorite Solution. PLoS ONE 2021, 16, e0252079. [Google Scholar] [CrossRef]
- Gupta, A.; Imlay, J.A. Escherichia coli Induces DNA Repair Enzymes to Protect Itself from Low-Grade Hydrogen Peroxide Stress. Mol. Microbiol. 2022, 117, 754–769. [Google Scholar] [CrossRef] [PubMed]
- Zhao, R.-Z.; Jiang, S.; Zhang, L.; Yu, Z.-B. Mitochondrial Electron Transport Chain, ROS Generation and Uncoupling (Review). Int. J. Mol. Med. 2019, 44, 3–15. [Google Scholar] [CrossRef] [PubMed]
- Xia, D.; Yu, C.A.; Kim, H.; Xia, J.Z.; Kachurin, A.M.; Zhang, L.; Yu, L.; Deisenhofer, J. Crystal Structure of the Cytochrome bc1 Complex from Bovine Heart Mitochondria. Science 1997, 277, 60–66. [Google Scholar] [CrossRef] [PubMed]
- Devlin, T.; Hofman, C.R.; Acevedo, Z.P.V.; Kohler, K.R.; Tao, L.; Britt, R.D.; Hoke, K.R.; Hunsicker-Wang, L.M. DEPC Modification of the CuA Protein from Thermus thermophilus. J. Biol. Inorg. Chem. 2019, 24, 117–135. [Google Scholar] [CrossRef]
- Snyder, C.H.; Merbitz-Zahradnik, T.; Link, T.A.; Trumpower, B.L. Role of the Rieske Iron-Sulfur Protein Midpoint Potential in the Protonmotive Q-Cycle Mechanism of the Cytochrome bc1 Complex. J. Bioenerg. Biomembr. 1999, 31, 235–242. [Google Scholar] [CrossRef]
- Yamaoka, H.; Nakayama-Imaohji, H.; Horiuchi, I.; Yamasaki, H.; Nagao, T.; Fujita, Y.; Maeda, H.; Goda, H.; Kuwahara, T. Tetramethylbenzidine Method for Monitoring the Free Available Chlorine and Microbicidal Activity of Chlorite-Based Sanitizers under Organic-Matter-Rich Environments. Lett. Appl. Microbiol. 2016, 62, 47–54. [Google Scholar] [CrossRef]
- Singh, S.P.; Salamon, H.; Lahti, C.J.; Farid-Moyer, M.; Small, P.M. Use of Pulsed-Field Gel Electrophoresis for Molecular Epidemiologic and Population Genetic Studies of Mycobacterium tuberculosis. J. Clin. Microbiol. 1999, 37, 1927–1931. [Google Scholar] [CrossRef]
- Chawla, M.; Singh, A. Detection of Membrane Potential in Mycobacterium tuberculosis. Bio-protocol 2013, 3, e785. [Google Scholar] [CrossRef]
- Yuroff, A.; Fan, F.; Butler, B.; Collins, M. Application of the BacTiter-Glo™ Assay for Rapid Enumeration and Screening of Antimicrobial Compounds for Mycobacterium avium Complex Bacteria. Promega Notes 2008, 98, 8–10. [Google Scholar]
Disclaimer/Publisher’s Note: The statements, opinions and data contained in all publications are solely those of the individual author(s) and contributor(s) and not of MDPI and/or the editor(s). MDPI and/or the editor(s) disclaim responsibility for any injury to people or property resulting from any ideas, methods, instructions or products referred to in the content. |
© 2026 by the authors. Licensee MDPI, Basel, Switzerland. This article is an open access article distributed under the terms and conditions of the Creative Commons Attribution (CC BY) license (http://creativecommons.org/licenses/by/4.0/).


