
Submitted:
30 January 2026
Posted:
02 February 2026
You are already at the latest version
Abstract
The disappearance of the trawler Ravenel in January 1962, resulting in the loss of fifteen men from the Saint-Pierre-and-Miquelon archipelago, has long remained unresolved. This study integrates archival documentation, eyewitness testimony, atmospheric and oceanic reanalyses, and probabilistic drift modelling to reconstruct the circumstances of the loss and to constrain the wreck location. Backward and forward drift simulations were conducted using the Mothy sea-drift model, incorporating high-resolution tidal dynamics and wind forcing from ERA-20C and ERA5 reanalysis. Results show that uncertainty in debris stranding time exerts a much stronger influence on reconstructed drift paths than uncertainty in stranding location. The discovery of the wreck in May 2025 enabled forward simulations that indicate a most probable sinking time, with ERA5 producing debris stranding times consistent with historical observations. Although the wreck’s location and likely sinking window are now established, key questions regarding the sequence of events and loss of communication remain unresolved.
Keywords:
drift modelling
; marine debris
; historical shipwreck
; search and rescue
; atmospheric reanalysis
1. Introduction
The disappearance of the trawler Ravenel in January 1962 had a profound impact on the population of the Saint-Pierre-and-Miquelon archipelago. Fifteen men, all from the archipelago, lost their lives. Since then, the circumstances surrounding the loss have remained a subject of uncertainty for the local community.
The Ravenel departed Saint-Pierre on 21 January for a fishing trip in the southwestern sector of the Grand Banks of Newfoundland, approximately 150 miles from the archipelago. On Saturday, 27 January, at 14:00 (all times are expressed in Saint-Pierre time, UTC−03:00, unless otherwise stated), the captain informed the shipowner of his intention to make a detour to the Saint-Pierre Bank for additional trawls before returning to Saint-Pierre no later than the morning of Monday, 29 January.
On Sunday, 28 January, at approximately 09:30, the Ravenel attempted to contact the trawler Galantry, but no communication was established. Later that day, at 14:00, the vessel did not make its customary call to the shipowner, and subsequent attempts to reach it at 18:00 were unsuccessful. While the absence of communication did not, in itself, constitute evidence of a shipwreck, no further contact was ever made.
With no news on 29 January, the shipowner notified the authorities, and search operations were initiated that afternoon. The search continued until 3 February and involved several vessels from the archipelago, aircraft from the Royal Canadian Air Force, and ships from the US Navy. A few days after the search began, debris attributed to the Ravenel was recovered along the coast of the Burin Peninsula (Newfoundland, Canada).
Despite several research efforts undertaken since the 1960s, the wreck remained undiscovered for decades. It was not until 2020 that a larger-scale research campaign project, coordinated by Nicolas Cormier, began to take shape. The French government mobilized several public agencies, notably the Département des recherches archéologiques subaquatiques et sous-marines (Drassm) of the French Ministry of Culture and Météo-France, to coordinate the scientific analysis and definition of a potential search area. A synthesis of 169 archival documents compiled by local associations in Saint-Pierre [1] provided the basis for Météo-France to conduct backward-drift simulations of debris recovered along the Newfoundland coast using the Mothy sea-drift model.
In this context, the objective of the present study is twofold. First, it aims to reconstruct the most probable circumstances of the loss of the Ravenel and to constrain the location and timing of the shipwreck by integrating archival documentation, eyewitness accounts, atmospheric and oceanic reanalyses, and probabilistic drift modelling. Second, it seeks to evaluate the relevance and limitations of drift modelling approaches when applied to historical maritime losses, with particular emphasis on the sensitivity of the results to uncertainties in debris stranding time and location.
2. Data and Methods
2.1. Atmospheric Data
The weather conditions at the time of the disappearance are well documented. The investigation report, supported by observations from the Saint-Pierre weather station and accounts from sailors in the area, describes extremely poor weather. During the night of January 27–28, the air temperature dropped sharply from 2 °C to –11 °C, with winds of 30–45 knots, gusts reaching 60 knots, and heavy seas. These severe gusts, combined with intense cold, may have contributed to ice formation on the trawler.
Atmospheric reanalyses provide spatially and temporally consistent meteorological fields suitable for forcing drift simulations over the study area.
ERA-20C [2], produced by the European Centre for Medium-Range Weather Forecasts (ECMWF) using the Integrated Forecasting System (IFS) and a 4D-VAR data assimilation scheme, assimilates surface observations and covers the period 1900–2010. It has a 3-hour temporal resolution and a horizontal resolution of about 125 km.
ERA5 [3], the fifth-generation ECMWF reanalysis, initially spanned 1979 to the present before being extended to 1959 in mid-2022 and to 1940 in 2023. It is now the reference reanalysis, offering much higher resolution, hourly in time and 31 km in space, and incorporating a wider range of observations with improved assimilation.
At the time the work to support the wreck search was conducted, ERA-20C was the only dataset available. Later calculations presented here will show the added value provided by ERA5.
2.2. Oceanic Data
The waters between the Saint-Pierre-and-Miquelon archipelago and the Burin Peninsula are relatively shallow, with depths ranging from 20 to 150 m. A preliminary analysis of large-scale circulation, using EU Copernicus Marine Service data, indicates that mean currents are weak. This was confirmed when ORAS5 global ocean reanalysis [4] became available in September 2021, showing a surface ocean current of 0.07 m/s flowing eastward in January 1962. The circulation is dominated by wind-driven events, particularly in winter, and by tidal currents. Consequently, ocean currents used in this study are generated exclusively by the hydrodynamic module embedded within the Mothy drift model.
This hydrodynamic module couples a 2-D shallow-water model with a 1-D eddy-viscosity formulation. This approach has proven effective for drift simulations on continental shelves [5], especially under strong wind conditions such as those relevant here.
The model domain extends from 57.4375° W to 54.4375° W in longitude and from 45.3125° N to 47.8125° N in latitude. Bathymetry is taken from the GEBCO_2014 grid (1/120° resolution), with manual adjustments near the coastline to obtain a more realistic shoreline.
Tides are represented using the FES2014 tidal atlas [6]. FES2014 is based on hydrodynamic tidal modelling (Toulouse Unstructured Grid Ocean model, T-UGOm) coupled with an ensemble data-assimilation scheme (Spectral Ensemble Optimal Interpolation, SpEnOI). After regridding from its native unstructured mesh, it is provided on a regular 1/16° grid. Seventeen tidal constituents (M2, S2, K1, O1, N2, P1, K2, Q1, Mf, Mm, Ssa, 2N2, L2, Mu2, Nu2, T2, M4) are used as boundary conditions for the hydrodynamic model.
The tidal forcing points were selected to be common to both GEBCO_2014 (1/120°) and FES2014 (1/16°) grids, and interpolation was performed along the grid boundaries at 1/120°. Model calibration was validated by comparing simulated water levels with observations from the Saint-Pierre tide gauge for January 27–31, 1962. Incorporating tidal currents accurately is essential, because despite the shipwreck occurring during neap tide, when tidal currents are weaker, tidal flows remain strong in this region.
2.3. Debris Data
Archival documents gathered by two associations in Saint-Pierre and analysed by Drassm were used to assess which debris items should be retained, based on both the likelihood that they originated from the Ravenel and the reliability of the recorded discovery locations and dates. Two stranding areas on the Burin Peninsula were considered (Figure 1).
The primary area extends from Point Crewe to Lamaline, with the vicinity of Lories providing the most reliable information. Objects found within this sector began to be discovered on the morning of 31 January 1962. A secondary area, between Fortune and Grand Bank, includes items found on the morning of February 1, 1962. The attribution of these objects to the Ravenel, as well as the precision of their reported positions, is less certain, resulting in a lower level of confidence.
The debris includes life belts, boots and shoes, a gangway door, shelving fragments, and various other items clearly identifiable as originating from the trawler.
2.4. Drift Modelling Principles in the Mothy System
The Mothy sea-drift model, developed at Météo-France, was initially designed for oil spills [5], later extended to drifting containers [7], and finally adapted for search-and-rescue (SAR) targets. This latest version is used in the present study. Mothy predicts the trajectories of floating objects by combining high-resolution environmental forcing with a probabilistic representation of object behaviour. In this study, the model simulates the drift of 8,760 virtual objects with statistically distributed physical characteristics, allowing uncertainties in leeway parameters to be represented explicitly and translated into probabilistic drift forecasts. The drift simulations are intended to constrain plausible source regions and timelines and do not aim to reproduce the exact trajectory of any individual debris item.
A central feature of Mothy is its treatment of leeway, defined, following Allen and Plourde [8], as the motion of an object induced by 10-m wind and waves relative to the ambient surface current. Floating objects generally drift at an angle relative to the wind; Mothy therefore decomposes leeway into a downwind (DWL) component and a crosswind (CWL) component, with right- and left-of-wind branches. Because small variations in initial orientation can cause an object to drift on either side of the wind direction with equal likelihood, Mothy assigns initial orientations stochastically and introduces probabilistic tack changes, transitions between right- and left-drift, at a rate of roughly 4% per hour following Allen’s recommendation [9].
The leeway coefficients used in this study are those recommended by Allen and Plourde [8], based on the experimental work of Igeta et al. [10], who investigated drift characteristics of debris typical of Japanese fishing vessels. Their test objects included a lifejacket, life ring, glass fishing-float balls, a fishing-box lid, and a wooden board.
The resulting empirical coefficients are:
- DWL = 1.97% · W₁₀m
- CWL = 0.36% · W₁₀m
- Standard deviations: 8.30 cm/s (DWL) and 6.70 cm/s (CWL)
where W₁₀m is the wind speed at 10 m height.
More recent experiments by Mu et al. [11], performed on wooden planks of sizes 1.5 × 1.5 m and 1.0 × 1.0 m, yielded comparable results, with a DWL of 2.09% of W₁₀m, confirming the robustness of these empirical relationships for small-to-moderate floating debris.
The total drift is computed every 5 minutes as the vector sum of the ocean current and leeway. The ocean current field is generated by Mothy’s hydrodynamic module, which resolves surface circulation at high spatial resolution (1/120°). Waves are considered in two complementary ways. First, their direct influence on leeway is implicitly included through the empirical coefficients derived from field experiments. In this formulation, the combined effects of wind-sea waves and the Stokes drift they generate, typically reinforcing downwind motion, are embedded in the linear regression coefficients linking wind speed to DWL and CWL components, as pointed out by Breivik and Allen [12]. Second, in energetic sea states, wave-induced forces contribute to tack changes by destabilizing object orientation, an effect represented stochastically in the model. This approach ensures that wave contributions to leeway are accounted for without requiring explicit wave parameters as inputs.
By combining high-resolution hydrodynamics, empirically calibrated leeway formulations, and stochastic ensemble techniques, Mothy provides a robust framework for reconstructing the drift of floating objects and identifying the most probable drift pathways relevant to the search for the Ravenel wreck.
3. Results
3.1. Backward Drift from all Stranding Sites
We computed the backward trajectories of debris that was discovered along the shores of the Burin Peninsula, on the south coast on the morning of 31 January, and on the north coast on the morning of 1 February. Because the precise time at which the debris stranded cannot be established, we adopted the simplifying assumption that stranding occurred at the time of the morning high tide: 04:45 on 31 January for debris found on the southern shoreline, and 05:46 on 1 February for debris found on the northern shoreline.
Backward-trajectory simulations indicate that the potential search area is extensive (Figure 2). Debris recovered along the north coast drifted rapidly westward until midday on 31 January, subsequently turning southward, and then drifting west-northwestward during 30 January. Debris beached on the south coast drifted quickly south–southeast during the night preceding stranding, and west–northwest during daylight hours on 30 January. Although the two groups exhibit broadly consistent drift patterns, the northern trajectories do not fully converge with those from the south. This discrepancy likely reflects a combination of uncertainties in assumed stranding times and unresolved small-scale atmospheric variability particularly along the western cliffs of the Burin Peninsula.
The spatial probability of the wreck’s presence is mapped on a grid of 2 × 1 arc-minute cells, expressed in tenths of a percent and derived from the backward trajectories of six independent debris items (Figure 3). For each debris item, a probability distribution is constructed based on the spread of its associated virtual particles, assuming Gaussian variability arising from stochastic deviations of the drift coefficients relative to the deterministic baseline. The cumulative probability represented by the 8,670 virtual particles reaches 99%. For each grid cell and each hour, the probabilities contributed by all virtual particles are summed and then divided by six, in order to normalize the result and express the mean contribution per debris item rather than the cumulative contribution of all items. The maximum probability and its corresponding time of occurrence are retained. A threshold value n is applied such that only grid cells receiving simultaneous contributions from at least n of the six debris items are displayed, thereby highlighting regions of consistent convergence among independent drift reconstructions.
The associated temporal probability of the wreck’s presence is shown on the same grid of 2 × 1 arc-minute cells, expressed by day and hour and derived from the backward trajectories of six debris items (Figure 4).
Taken together, these two maps allow the identification of areas with the highest likelihood of containing the wreck.
After excluding shipwreck dates that appear either too early or too late, two priority areas are identified:
- an area around Green Island, corresponding to a shipwreck occurring late on January 29, between 15:00 and midnight;
- an area southeast of Green Island, corresponding to a later shipwreck on January 30, between 04:00 and 08:00.
3.2. Focus on the Lories Stranding Site and Timeline
Uncertainty in the timing of debris arrival along the Burin Peninsula directly affects the delineation of potential wreck locations. Among all documented stranding sites, the Lories site is particularly valuable because it is the only one for which the time of discovery is known with precision. A life belt, a boot, and a fragment of shelving, each formally identified by a former captain of the Ravenel as originating from the vessel, were recovered at 09:00 on 31 January 1962.
In earlier analyses, it was assumed that these objects came ashore at the preceding high tide, i.e., at 04:45. However, given the meteorological conditions prior to their discovery, namely, southwesterly winds of approximately 10 knots during the afternoon of 30 January, veering to south–southeast and increasing to 30 knots overnight, the debris could plausibly have stranded at any time during the preceding night or even earlier. It is therefore essential to quantify how this uncertainty in arrival time influences the inferred search area for the wreck.
To examine this effect, we performed a series of backward-drift simulations originating at the Lories beach (46°54′N, 55°57′W), initialized every two hours between 30 January 1962 at 15:00 and 31 January 1962 at 09:00.
The results demonstrate a clear temporal sensitivity in the reconstructed drift pathways. Later stranding times yield backward trajectories that place the likely wreck site farther south, whereas earlier stranding times shift the inferred search area progressively northward and westward. Consequently, the timing of the sinking is a critical factor in constraining the search domain. It should also be noted that debris was recovered exclusively along the Burin Peninsula; this effectively rules out an early loss of the vessel in a region where debris would instead have been transported to the coast of Saint-Pierre. Similarly, a sinking occurring after the start of the aerial search on 30 January can be excluded, as the vessel would likely have been detected.
By eliminating these early and late scenarios, the plausible time window for the sinking can be restricted to 28 January 1962 at 21:00 through 30 January 1962 at 08:00 (Figure 5). This refinement allows for direct comparison with previous results (Figure 3). Within this window, the two primary areas highlighted in purple in Figure 3 remain evident, though additional zones located farther east and south must also be considered.
All simulated arrival times are consistent with the subsequent discovery of debris between Fortune and Grand Bank on 1 February.
3.3. First Research Campaign
Largely informed by these drift calculations, a search area of approximately 390 km² was defined in advance, extending across both Canadian and French waters (Figure 6). This area was systematically surveyed using geophysical methods between 19 May and 7 July 2021 by the uncrewed surface vessel DriX, designed and manufactured by iXblue Shipyards. For this mission, DriX was equipped with an ultra-high-resolution multibeam echo sounder, complemented by a compensation magnetometer. Following the survey, Drassm investigated 56 anomalies considered potentially consistent with the wreck of the trawler, using a BlueROV2 fitted with a GoPro camera. Although this campaign resulted in the discovery of two previously unknown wooden shipwrecks, the wreck of the Ravenel was not found [13].
3.4. Focus on Flagstaff Cove
Shortly after the conclusion of the 2021 campaign, the project partners met to define a new research area for 2022. During these discussions, Mr. Stacey’s testimony concerning the location and conditions under which objects from the Ravenel were discovered along the coast of Newfoundland was reexamined. This testimony indicates that the debris were unearthed in Flagstaff Cove in Lories, a detail consistent with an article published on 1 February 1962 in the Newfoundland newspaper The Telegram. Earlier backward-drift calculations had been based primarily on debris recovered at Lories Beach, treated as a precise landing location. Taken together, these sources suggest that “Lories” refers to a broader stretch of coastline rather than a single point, potentially encompassing Flagstaff Cove, and underline the need to reassess how the assumed landing site influences the drift reconstructions.
If the debris reached the Newfoundland coast late on the night of 30 January or early on the morning of 31 January, backward-trajectory simulations indicate that debris arriving at Flagstaff Cove are associated with source regions shifted slightly eastward and southward than debris traced back from Lories Beach during the initial phase of the retro-drift. After this early divergence, both sets of trajectories converge toward the southern and eastern coasts of Saint Pierre (Figure 7.).
If, instead, the debris arrived earlier on the Newfoundland coast, backward trajectories show that debris beached at either Flagstaff or Lories first drifted toward Green Island and then toward Miquelon (Figure 8.).
In both scenarios, the inferred shipwreck time is shifted by several hours earlier compared with estimates based on debris arrival at Lories Beach.
Overall, uncertainties in the debris arrival time have a much greater impact on the backward-drift results than the choice of landing site. Later arrival times produce more southerly retrograde drift paths, extending the search area to the southern margins of previously investigated zones and south of both Saint-Pierre-and-Miquelon. Conversely, earlier arrival times shift the inferred search area northward, beyond Green Island and toward Miquelon.
3.5. Focus on an Early Shipwreck on January 28, 1962
In parallel with the reassessment of the debris recovery locations, the circumstances surrounding the loss of the trawler were reexamined in order to determine whether the temporal window used for the backward-drift calculations could be narrowed and thus improve their accuracy. The 2021 campaign had initially allowed prospecting to be carried out over a relatively broad time frame, spanning from 28 to 31 January. Subsequent analysis, however, made it possible to rule out a loss occurring in the later part of this period, based on several converging observations.
The Ravenel’s radio call to the Galantry on the morning of 28 January was most likely not a distress call, indicating that the trawler was not yet in difficulty at that time. The vessel was scheduled to dock in Saint-Pierre at 09:00 on 29 January to unload its catch; its failure to arrive strongly suggests that serious difficulties had already occurred before that deadline. Although a search was requested at 15:00 on the 29th, aerial assets were not effectively mobilized until the following day, when the alert was raised by RCAF headquarters in Torbay on the morning of 30 January. Visibility conditions during the initial days of the aerial search were reported to be good, implying that the absence of any sighting was most likely due to the vessel having already sunk.
To further refine this assessment, Drassm, with logistical support from DTAM, conducted a series of interviews with experienced sailors from the archipelago, including individuals familiar with fishing conditions at the time, as well as former crew members or contemporaries of the Ravenel. Although these testimonies naturally vary in detail and interpretation, a strong consensus emerges. Weather conditions on 27 and 28 January 1962 were such that fishing was clearly impossible, forcing the captain, after his call on the morning of the 27th, to quickly decide to return to Saint-Pierre. The return deadline set by the shipowner was mandatory and routinely respected by skippers. Moreover, if the vessel had merely been underway and not in distress, there would have been no reason for the crew not to respond to the scheduled radio call at 18:00 on the 28th, strongly suggesting that the Ravenel had already sunk by that time.
Taken together, these independent lines of evidence suggest that the Ravenel most likely sank on 28 January 1962 between 09:00 and 18:00. This refined temporal window provides a critical additional constraint on the backward-drift calculations.
Restricting the sinking to this interval shifts the probable wreck location westward relative to earlier analyses. When assuming a late arrival of debris at Flagstaff Cove, the resulting search area extends from south of Saint-Pierre to the southwest of Miquelon. Conversely, an early arrival of debris places the inferred search region farther north, between Miquelon and areas that have already been surveyed, an outcome that appears less consistent with the plausible navigational routes of the vessel.
3.6. Second Research Campaign
Additional survey operations were conducted south of Saint-Pierre during the summer of 2022 under conditions similar to those of the previous year. A search area of approximately 165 km² was systematically surveyed using geophysical methods, and particularly favorable conditions allowed several additional square kilometers to be covered to the west of the initial study area, bringing the total area surveyed to about 210 km² (Figure 9). Drassm selected and investigated 20 anomalies considered potentially consistent with the wreck of the trawler or associated debris; however, all features examined were determined to be of natural origin, and no evidence of the Ravenel was found [14].
3.7. Discovery of the Wreck and Determination of the Sinking Time
On 22 May 2025, a hydrographic survey was conducted following a report from a local fisherman Mr. Karl Beaupertuis, whose crab traps had become entangled on a suspected wreck. Sonar data acquired by an underwater drone deployed from the vessel Martin Hélène revealed the remains of a trawler approximately 30 m in length. A few days later, the identity of the wreck was confirmed by a remotely operated vehicle (ROV). The vessel lies at a depth of 122 meters, southeast of Saint-Pierre, roughly 4 nautical miles from the area surveyed in earlier missions (Figure 9).
This discovery raises two key questions: Is the wreck’s location consistent with the debris-stranding sites predicted by the drift model? And can this information help constrain the actual time of the sinking?
To address these questions, we conducted forward-drift simulations originating from the wreck site. Forty-nine scenarios were evaluated, corresponding to hourly sinking times between 28 January 1962 at 09:00 and 30 January 1962 at 09:00. Because newer atmospheric reanalysis data (ERA5) have since become available, simulations were performed using both ERA-20C and ERA5 in order to assess the sensitivity of the results to the forcing dataset.
For each scenario, we calculated the probability that debris would strand along the coast between Point Crewe and Lamaline, as a function of the assumed sinking time. In both reanalysis systems, the maximum probability occurs for a sinking around 30 January at 01:00 (Figure 10.). An earlier sinking time would have occurred during a prolonged period of westerly winds, which would have driven debris eastward offshore, leaving no realistic possibility for grounding along this section of the Burin Peninsula.
For a sinking on 30 January at 01:00, simulations forced with ERA-20C predict later coastal arrivals than those forced with ERA5 (Figure 11).
ERA-20C simulations indicate a stranding period beginning on 31 January at 06:00, with a peak probability occurring at 12:00 on the same day (Figure 12). In contrast, ERA5 simulations suggest an earlier stranding window starting at 03:00 on 31 January, with a maximum probability at 08:00. The ERA5 results are in close agreement with observations, as the only debris item with a precisely documented discovery time was found at 09:00 on 31 January.
4. Discussion
Backward- and forward-drift simulations provide a coherent framework for interpreting the debris recovered along the Burin Peninsula following the loss of the Ravenel in January 1962. Although the recent discovery of the wreck southeast of Saint-Pierre resolves its final location, uncertainties remain regarding the timing and circumstances of the sinking. The results highlight both the capabilities and inherent limitations of drift modelling for reconstructing historical maritime accidents.
4.1. Influence of Stranding Location and Timing
The temporal uncertainty associated with debris arrival on the Burin Peninsula proved to be a major factor influencing the inferred search areas. For most stranding sites, the exact time at which the debris reached shore cannot be determined with precision. Assumptions regarding arrival time therefore directly affect the reconstructed drift pathways.
Lories is a key reference site because debris was documented there at 09:00 on 31 January 1962. Backward-drift simulations from this site show marked sensitivity to stranding time: later arrivals yield more southerly retrograde trajectories, while earlier arrivals shift the inferred source northward and westward. The absence of debris along the shores of Saint-Pierre further constrains the admissible time window, excluding scenarios in which debris would have been advected there by coastal circulation.
Similarly, when accounting for evidence indicating that the principal stranding site was Flagstaff Cove, located 6 km east of Lories, additional drift simulations were conducted. These demonstrated that the substitution of Flagstaff for Lories leads only to modest changes in the inferred drift routes, initial divergences in the trajectories diminish rapidly, and both sets of debris ultimately trace back toward the south and east coasts of Saint-Pierre.
Taken together, these results indicate that, for this particular event and dataset, uncertainty in stranding time has a stronger influence on backward-drift reconstructions than uncertainty in the precise alongshore location of debris recovery.
4.2. Constraints from Historical Evidence and Implications of the Wreck Discovery
Eyewitness accounts, operational practices, and communication records provide independent constraints on the sinking time. Investigations indicate that the Ravenel most likely sank on 28 January between 09:00 and 18:00. Incorporating this temporal window shifts the most probable source areas westward, from south of Saint-Pierre toward southwest of Miquelon for later stranding scenarios.
The discovery of the wreck on 22 May 2025, southeast of Saint-Pierre, enabled forward-drift simulations constrained by the known wreck location. Simulations were performed using both ERA-20C and ERA5 atmospheric reanalyses. Both datasets identify 30 January at 01:00 as the sinking time that yields the highest consistency with observed debris stranding patterns along the Burin Peninsula. The ERA5-forced simulations produce a stranding window that closely matches the documented discovery times, underscoring the benefits of higher-resolution, modern reanalysis products for historical reconstructions.
At first glance, the sinking window inferred from historical evidence (28 January between 09:00 and 18:00) appears inconsistent with the model-derived sinking time of 30 January at 01:00. However, these two constraints do not necessarily describe the same physical event. Historical testimonies and operational records primarily constrain the timing at which the Ravenel likely encountered critical difficulties or ceased normal operations, whereas the drift simulations are sensitive to the timing of final loss of buoyancy leading to debris release. This discrepancy suggests that the vessel may have remained afloat for a period after the initial event, potentially in a compromised or unstable state, before ultimately sinking. The following subsection explores a physically plausible capsizing scenario that may reconcile these temporal constraints and examines its implications for post-loss drift behavior.
4.3. Possible Capsizing Scenario and Implications for Post-Loss Drift
Testimonies from captains of trawlers operating in the area on Saturday 27 and Sunday 28 January describe extremely severe weather conditions, characterized by sudden and violent gusts and heavy seas that forced vessels to heave to. During the night from Saturday to Sunday and throughout the following day, intense icing conditions led to rapid ice accumulation on superstructures. Such conditions could have significantly slowed the Ravenel’s return to port, impaired radio communications, and critically affected vessel stability.
Under these circumstances, it cannot be excluded that the Ravenel capsized before sinking and may have drifted keel-up for several hours. Its steel hull and relatively enclosed superstructure could have temporarily trapped sufficient air to provide buoyancy following capsizing, provided that no major structural breaches occurred. Moreover, the vessel was reportedly carrying approximately 40 tonnes of fish, well below its usual load of about 100 tonnes, and had a very low level of diesel fuel (official investigation report, Le Boeuf, 7 May 1962). This reduced loading would have resulted in a lighter vessel with shallower draft, potentially increasing its capacity to remain afloat for a given degree of flooding. Winter conditions and ice accretion may also have slowed water ingress through certain openings, without ensuring long-term watertight integrity.
To explore this hypothesis, drift simulations were performed using leeway coefficients representative of a capsized (keel-up) vessel. These coefficients were derived from observations of the artisanal fishing vessel Tommy Evans, which capsized in August 2018 and drifted in an inverted (keel-up) orientation for approximately ten days off the coast of Saint-Pierre-and-Miquelon.
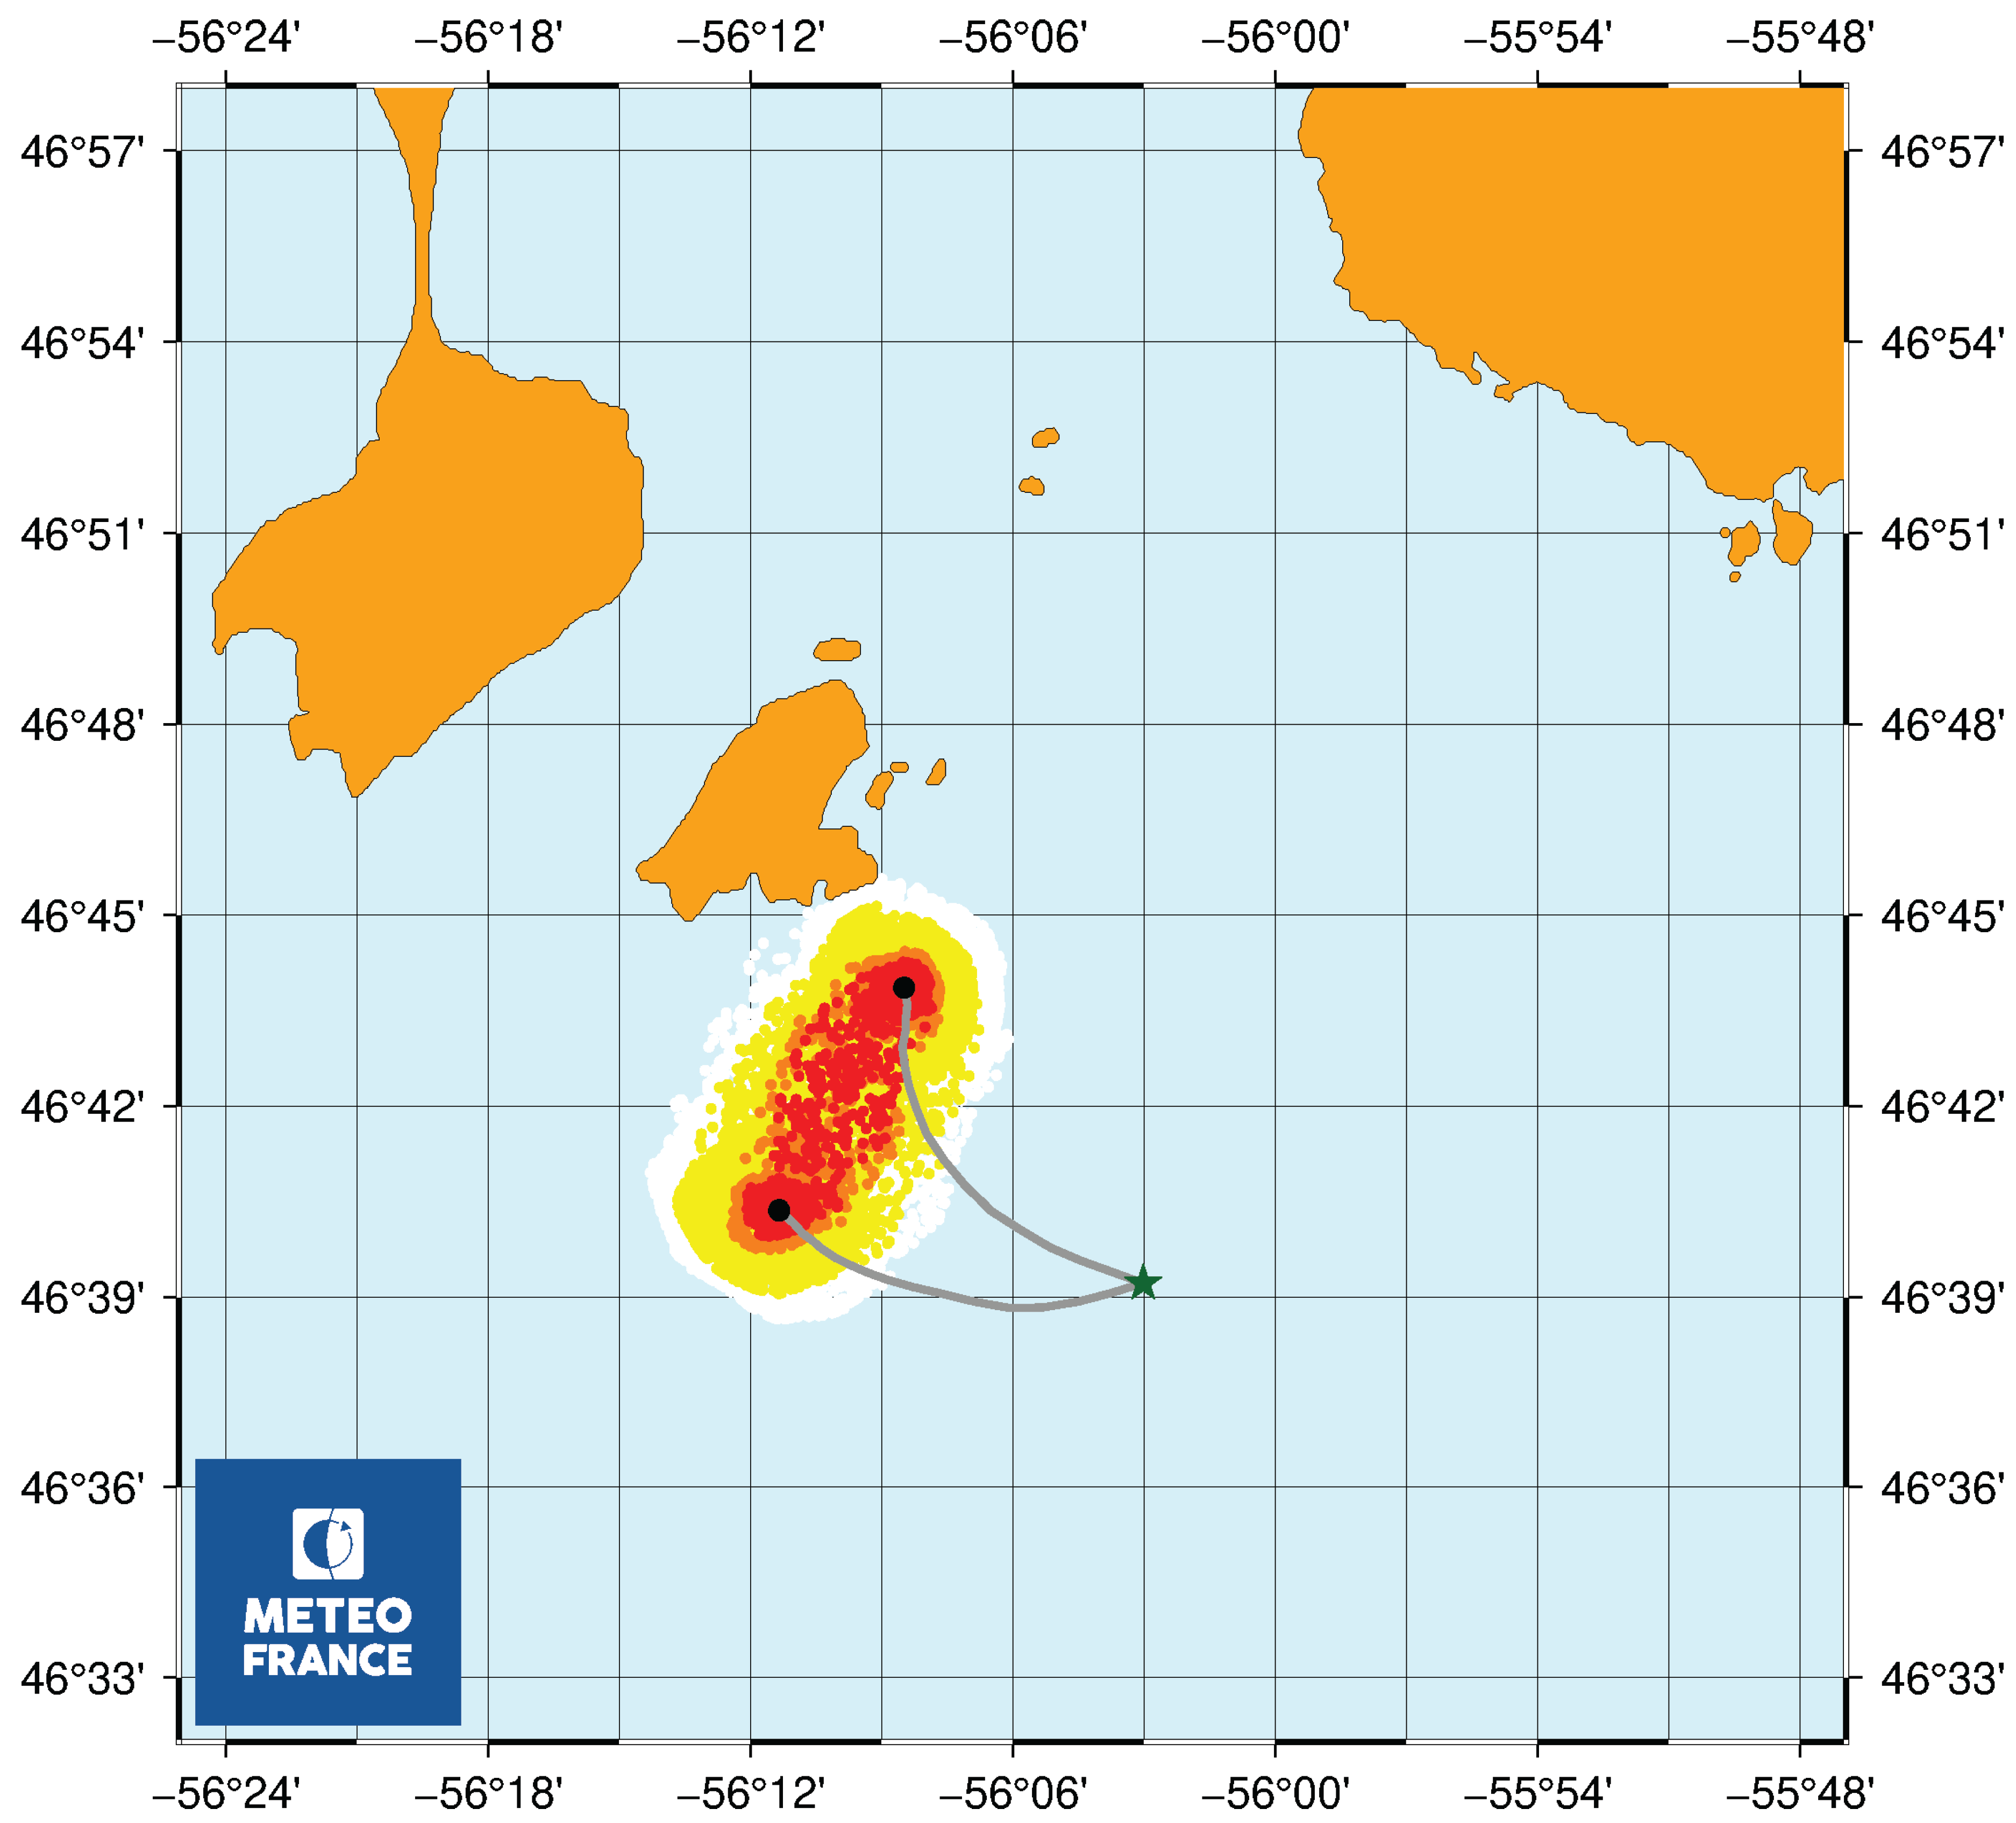
Backward-drift simulations of a capsized (keel-up) vessel, initiated from the wreck location and assuming a sinking time of 30 January at 01:00, indicate that the vessel could plausibly have been located just south of Saint-Pierre early on 29 January (Figure 13).
4.4. Remaining Uncertainties and Outlook
The capsizing scenario outlined above should be regarded as a tentative interpretative framework rather than a reconstruction of events. While certain observations are compatible with such a scenario, none provide conclusive or exclusive support for it. The composition of the recovered debris, largely limited to external elements, with only a single object originating from the vessel’s interior, and the largely intact condition of the wreck on the seabed are consistent with a loss of stability without major structural failure. However, these features are not diagnostic and could arise under alternative sinking mechanisms. Consequently, they do not allow the sequence of events preceding the sinking to be determined with confidence.
Significant uncertainty also affects the interpretation of debris drift and wreck orientation. Some debris items may have been released well after the vessel had sunk, particularly exterior components potentially constrained by ice accretion, implying that debris stranding times may not directly reflect the timing of the sinking itself. The wreck lies less than one nautical mile from the route inferred between the last known position and Saint-Pierre, with an orientation broadly parallel to this track. Although this geometry is compatible with limited drift prior to sinking, it does not constitute evidence for such a process, nor does it exclude alternative drift histories or final sinking configurations. Testimony collected in Saint-Pierre in 2022 suggesting proximity to port during the night of 28–29 January further illustrates the range of plausible scenarios but remains insufficient to discriminate among them. Overall, the available evidence permits multiple interpretations, and any reconstruction of the vessel’s final moments remains necessarily uncertain in the absence of direct visual observations of the wreck.
Despite extensive modelling and multiple search campaigns, including unsuccessful surveys conducted in 2021 and 2022, several aspects of the Ravenel’s loss remain unclear. Drift modelling effectively constrains plausible scenarios but cannot address mechanical failures or human factors. While the discovery of the wreck provides closure regarding its location, a definitive explanation of the sinking mechanism remains beyond the scope of available evidence.
More broadly, this study demonstrates the value of combining drift modelling, modern atmospheric reanalyses, high-resolution ocean modelling, and historical evidence to investigate past maritime accidents. The approach is readily transferable to other historical cases in regions characterized by complex atmospheric and oceanic dynamics.
Author Contributions
Conceptualization, P.D.; methodology, P.D.; software, P.D.; validation, P.D.; formal analysis, P.D.; investigation, P.D., G.C., N.C., M.L. and C.S., ; resources, P.D., G.C., N.C., M.L. and C.S.; data curation, P.D. and C.S; writing—original draft preparation, P.D.; writing—review and editing, P.D., G.C., N.C., M.L. and C.S.; visualization, P.D. and A.R.; supervision, P.D.; project administration, P.D. All authors have read and agreed to the published version of the manuscript.
Funding
This research received no external funding.
Data Availability Statement
The atmospheric reanalysis datasets ERA-20C and ERA5 are publicly available from ECMWF. The ocean reanalysis dataset ORAS5 is available from the Copernicus Climate Data Store. Other data supporting the findings of this study are available from the corresponding author upon request.
Acknowledgments
The authors thank the associations of Saint-Pierre-and-Miquelon (Association Ravenel, Association recherche du Ravenel) for access to archival documents and the local sailors who shared their testimonies. They also extend their thanks to Mathilde Jomé and Alexandrine Grandemange (University of Toulouse, France), and to Samy Gallego, Gwenvaël Le Baron, Fleur Nicolay, and Clémence Turbé (Ecole Nationale de la Météorologie, Toulouse, France) for their valuable contributions to this work during their student internships.
Conflicts of Interest
The authors declare no conflict of interest.
References
- Sauvage, C. : Synthèse de la documentation relative à la perte du chalutier Ravenel, personal communication: Drassm; France, 2020.
- Poli, P.; Hersbach, H.; Dee, D.P.; Berrisford, P.; Simmons, A.; Vitart, F.; Laloyaux, P.; Tan, D.; Peubey, C.; Thépaut, J-N.; Trémolet, Y.; Holm, E.; Bonavita, M.; Isaksen, L.; Fisher, M. ERA-20C: An Atmospheric Reanalysis of the Twentieth Century. J. Clim. 2016, 29, 4083–4097. [Google Scholar] [CrossRef]
- Hersbach, H.; Bell, B.; Berrisford, P.; Hirahara, S.; Horányi, A.; Muñoz-Sabater, J.; Nicolas, J.; Peubey, C.; Radu, R.; Schepers, D.; Simmons, A.; Soci, C.; Abdalla, S.; Abellan, X.; Balsamo, G.; Bechtold, P.; Biavati, G.; Bidlot, J.; Bonavita, M. The ERA5 Global Reanalysis. Q. J. R. Meteorol. Soc. 2020, 146, 1999–2049. [Google Scholar] [CrossRef]
- ORAS5 global ocean reanalysis monthly data from 1958 to present, Accessed on. Copernicus Climate Change Service (C3S) Climate Data Store (CDS), 2021. (accessed on 7 January 2026). [CrossRef]
- Daniel, P. Operational forecasting of oil spill drift at Meteo-France. Spill Sci. Technol. Bull. 1996, 3(1-2), 53–64. [Google Scholar] [CrossRef]
- Lyard, F.H.; Allain, D.J.; Cancet, M.; Carrère, L.; Picot, N. FES2014 global ocean tide atlas: Design and performance. Ocean Sci. 2021, 17, 615–649. [Google Scholar] [CrossRef]
- Daniel, P.; Jan, G.; Cabioc’h, F.; Landau, Y.; Loiseau, E. Drift modeling of cargo containers. Spill Sci. Technol. Bull. 2002, 7(5-6), 279–288. [Google Scholar] [CrossRef]
- Allen, A.A.; Plourde, J.V. Review of Leeway: Field Experiments and Implementation (No. CG-D-08-99); Coast Guard Research and Development Center Groton CT: New London, CT, USA, 1999. [Google Scholar]
- Allen, A.A. Leeway Divergence. USCG R&D Center Technical Report CG-D-05-05, 2005. [Google Scholar]
- Igeta, Y.; Suzuki, T.; Sato, H. Experiment on the Sea Regarding Distress and Search of Small Fishing Boat-I. J. Jpn. Inst. Navig. 1983, 68, 103–112. [Google Scholar] [CrossRef]
- Mu, L.; Tu, H.; Geng, X.; Qiao, F.; Chen, Z.; Jia, S.; Zhu, R.; Zhang, T.; Chen, Z. Research on the Drift Prediction of Marine Floating Debris: A Case Study of the South China Sea Maritime Drift Experiment. J. Mar. Sci. Eng. 2024, 12, 357. [Google Scholar] [CrossRef]
- Breivik, Ø.; Allen, A.A. An operational search and rescue model for the Norwegian Sea and the North Sea. J. Mar. Syst. 2008, 69(1-2), 99–113. [Google Scholar] [CrossRef]
- Sauvage, C.; Rochat, A.; L’Hour, M.; Daniel, P.; Moisan, O. Recherche du chalutier Ravenel: rapport de la campagne 2021. MC-Drassm 2021, 36 p. [Google Scholar]
- Sauvage, C.; Rochat, A.; L’Hour, M.; Cormier, N.; Daniel, P.; Moisan, O. Recherche du chalutier Ravenel: rapport de la campagne 2022. MC-Drassm 2023, 34. [Google Scholar]
Figure 1.
Map of the exploration area between the Saint-Pierre-and-Miquelon archipelago and the Burin Peninsula, showing documented debris stranding locations.
Figure 1.
Map of the exploration area between the Saint-Pierre-and-Miquelon archipelago and the Burin Peninsula, showing documented debris stranding locations.
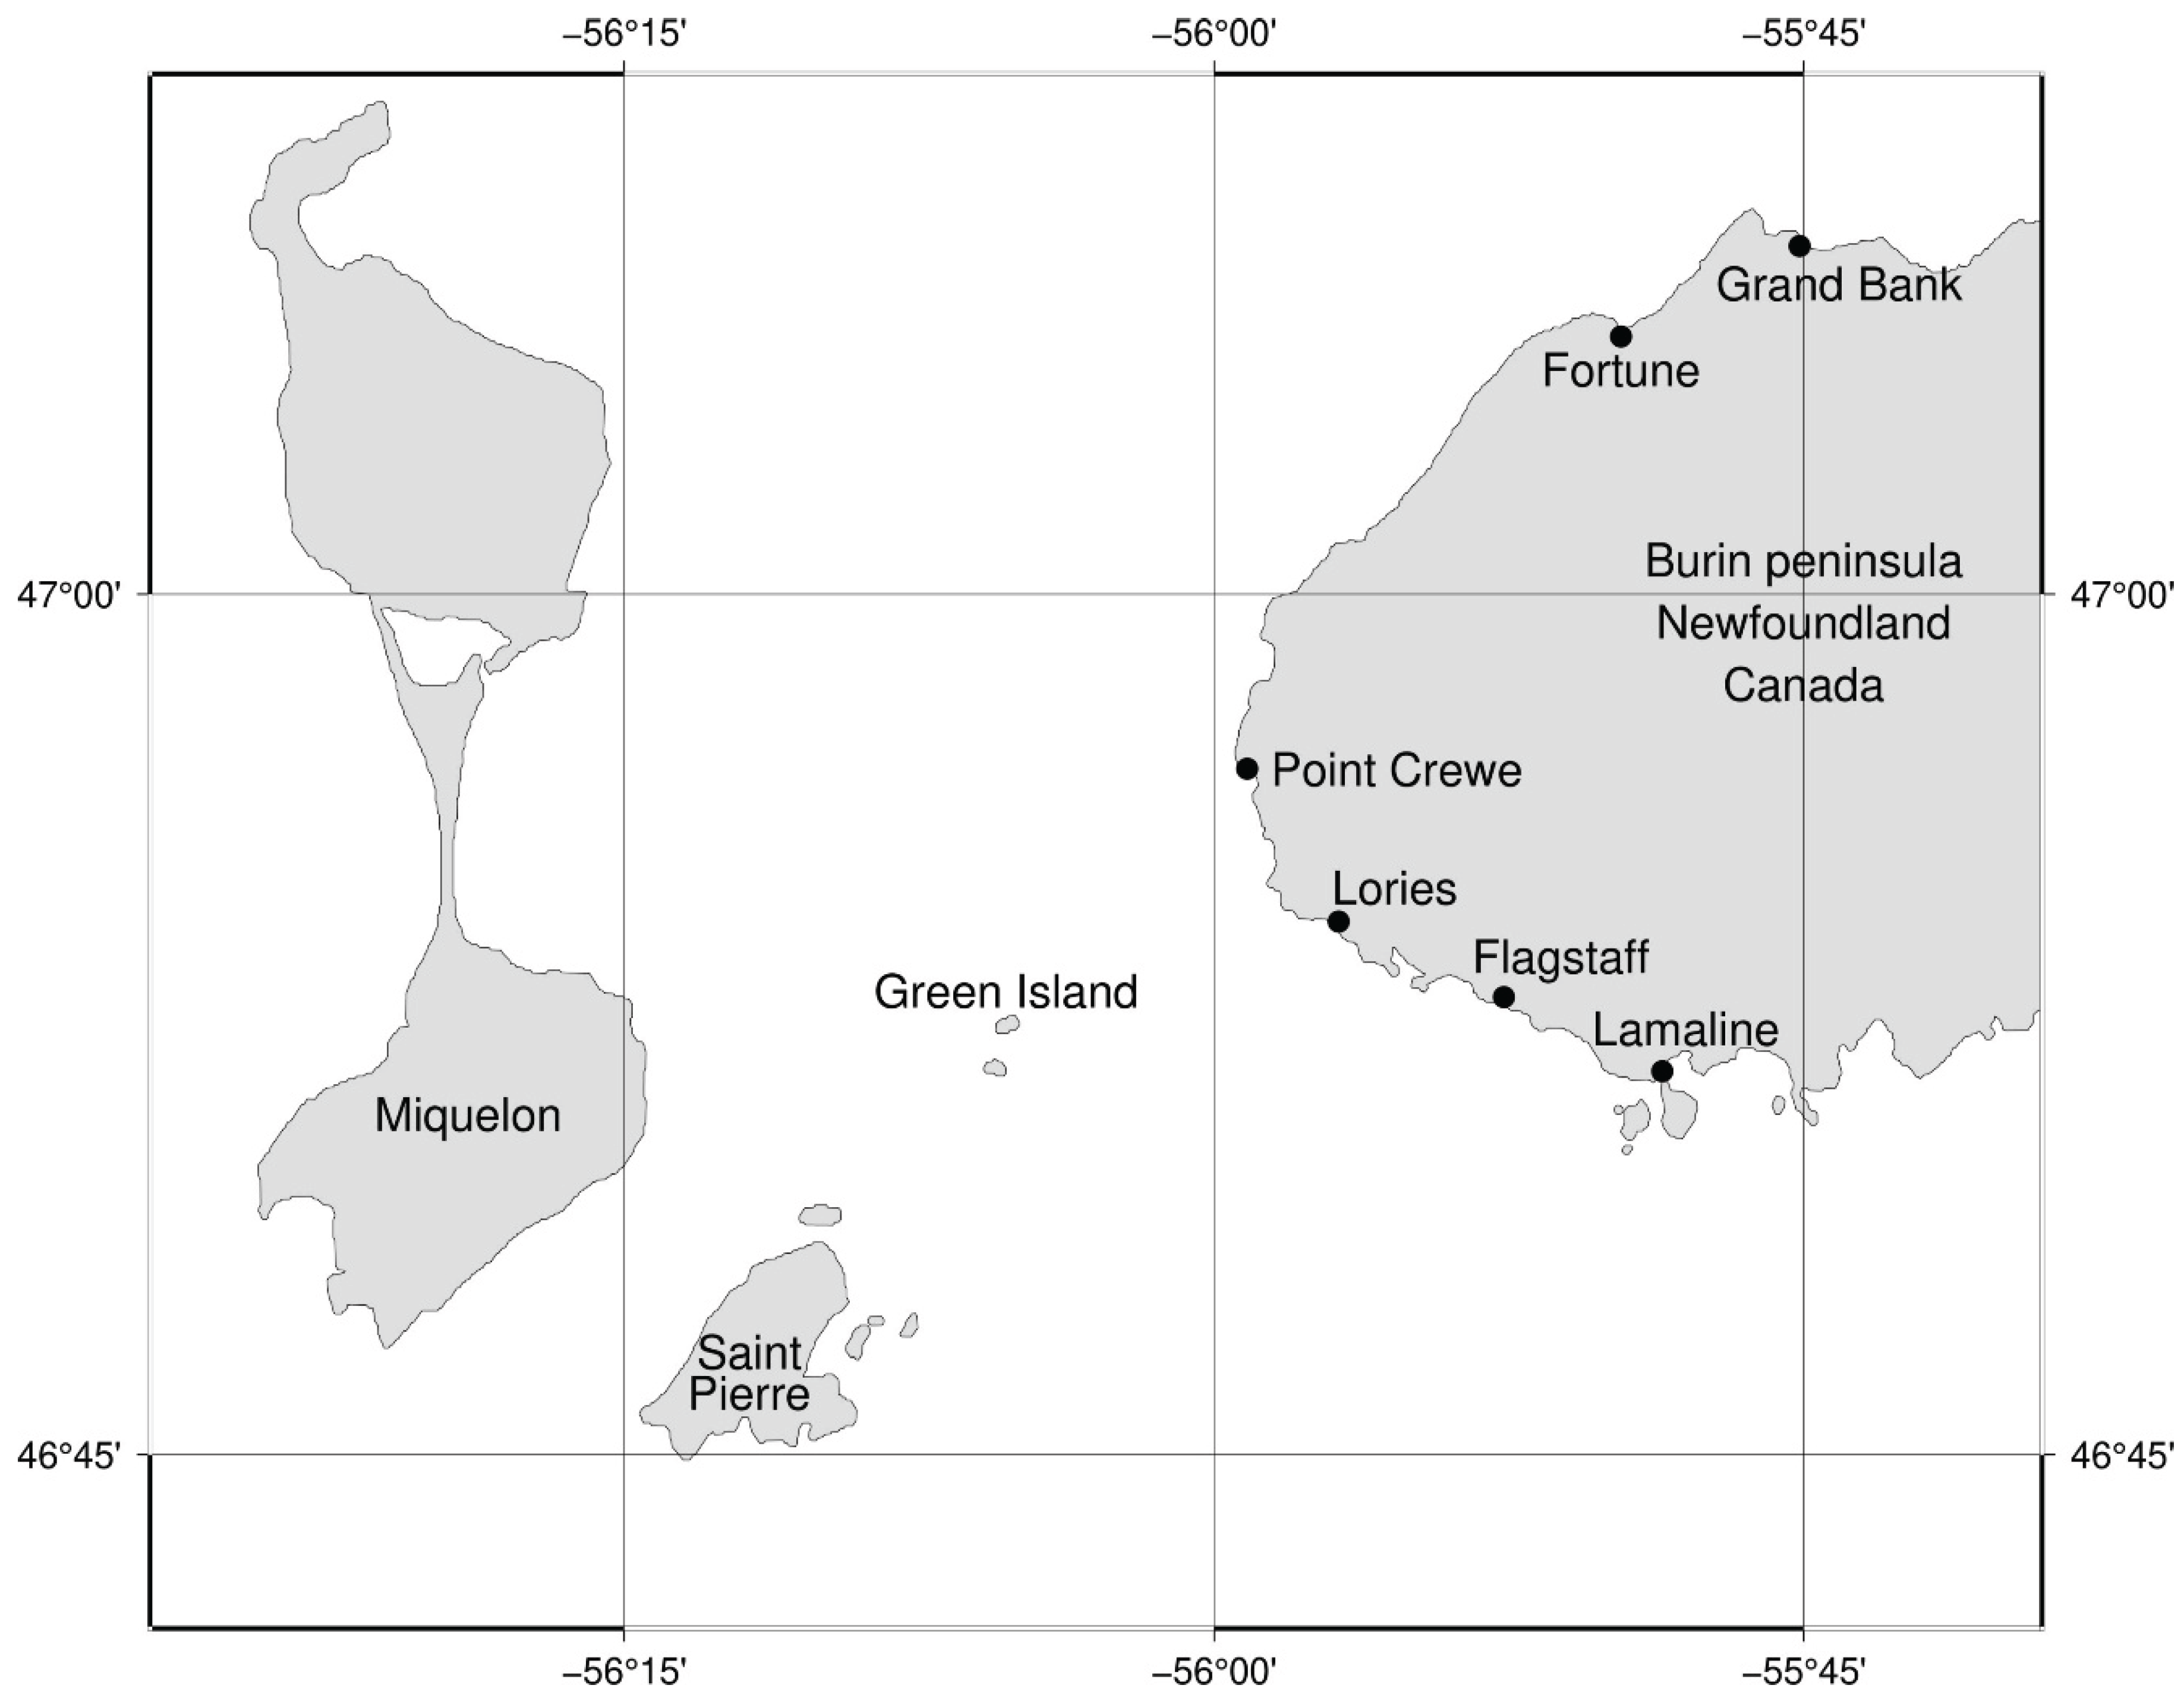
Figure 2.
Backward drift trajectories from six debris stranding sites (green stars) along the Newfoundland coast, traced back to 04:00 on 30 January. The gray trajectories, terminating at black dots, represent drift simulations to the left and right of the wind without changes in tack. The colored regions depict the probabilistic search areas that account for changes in tack: red indicates a 50% probability, red and orange together indicate 66%, red, orange, and yellow indicate 95%, and red, orange, yellow, and white indicate 99%.
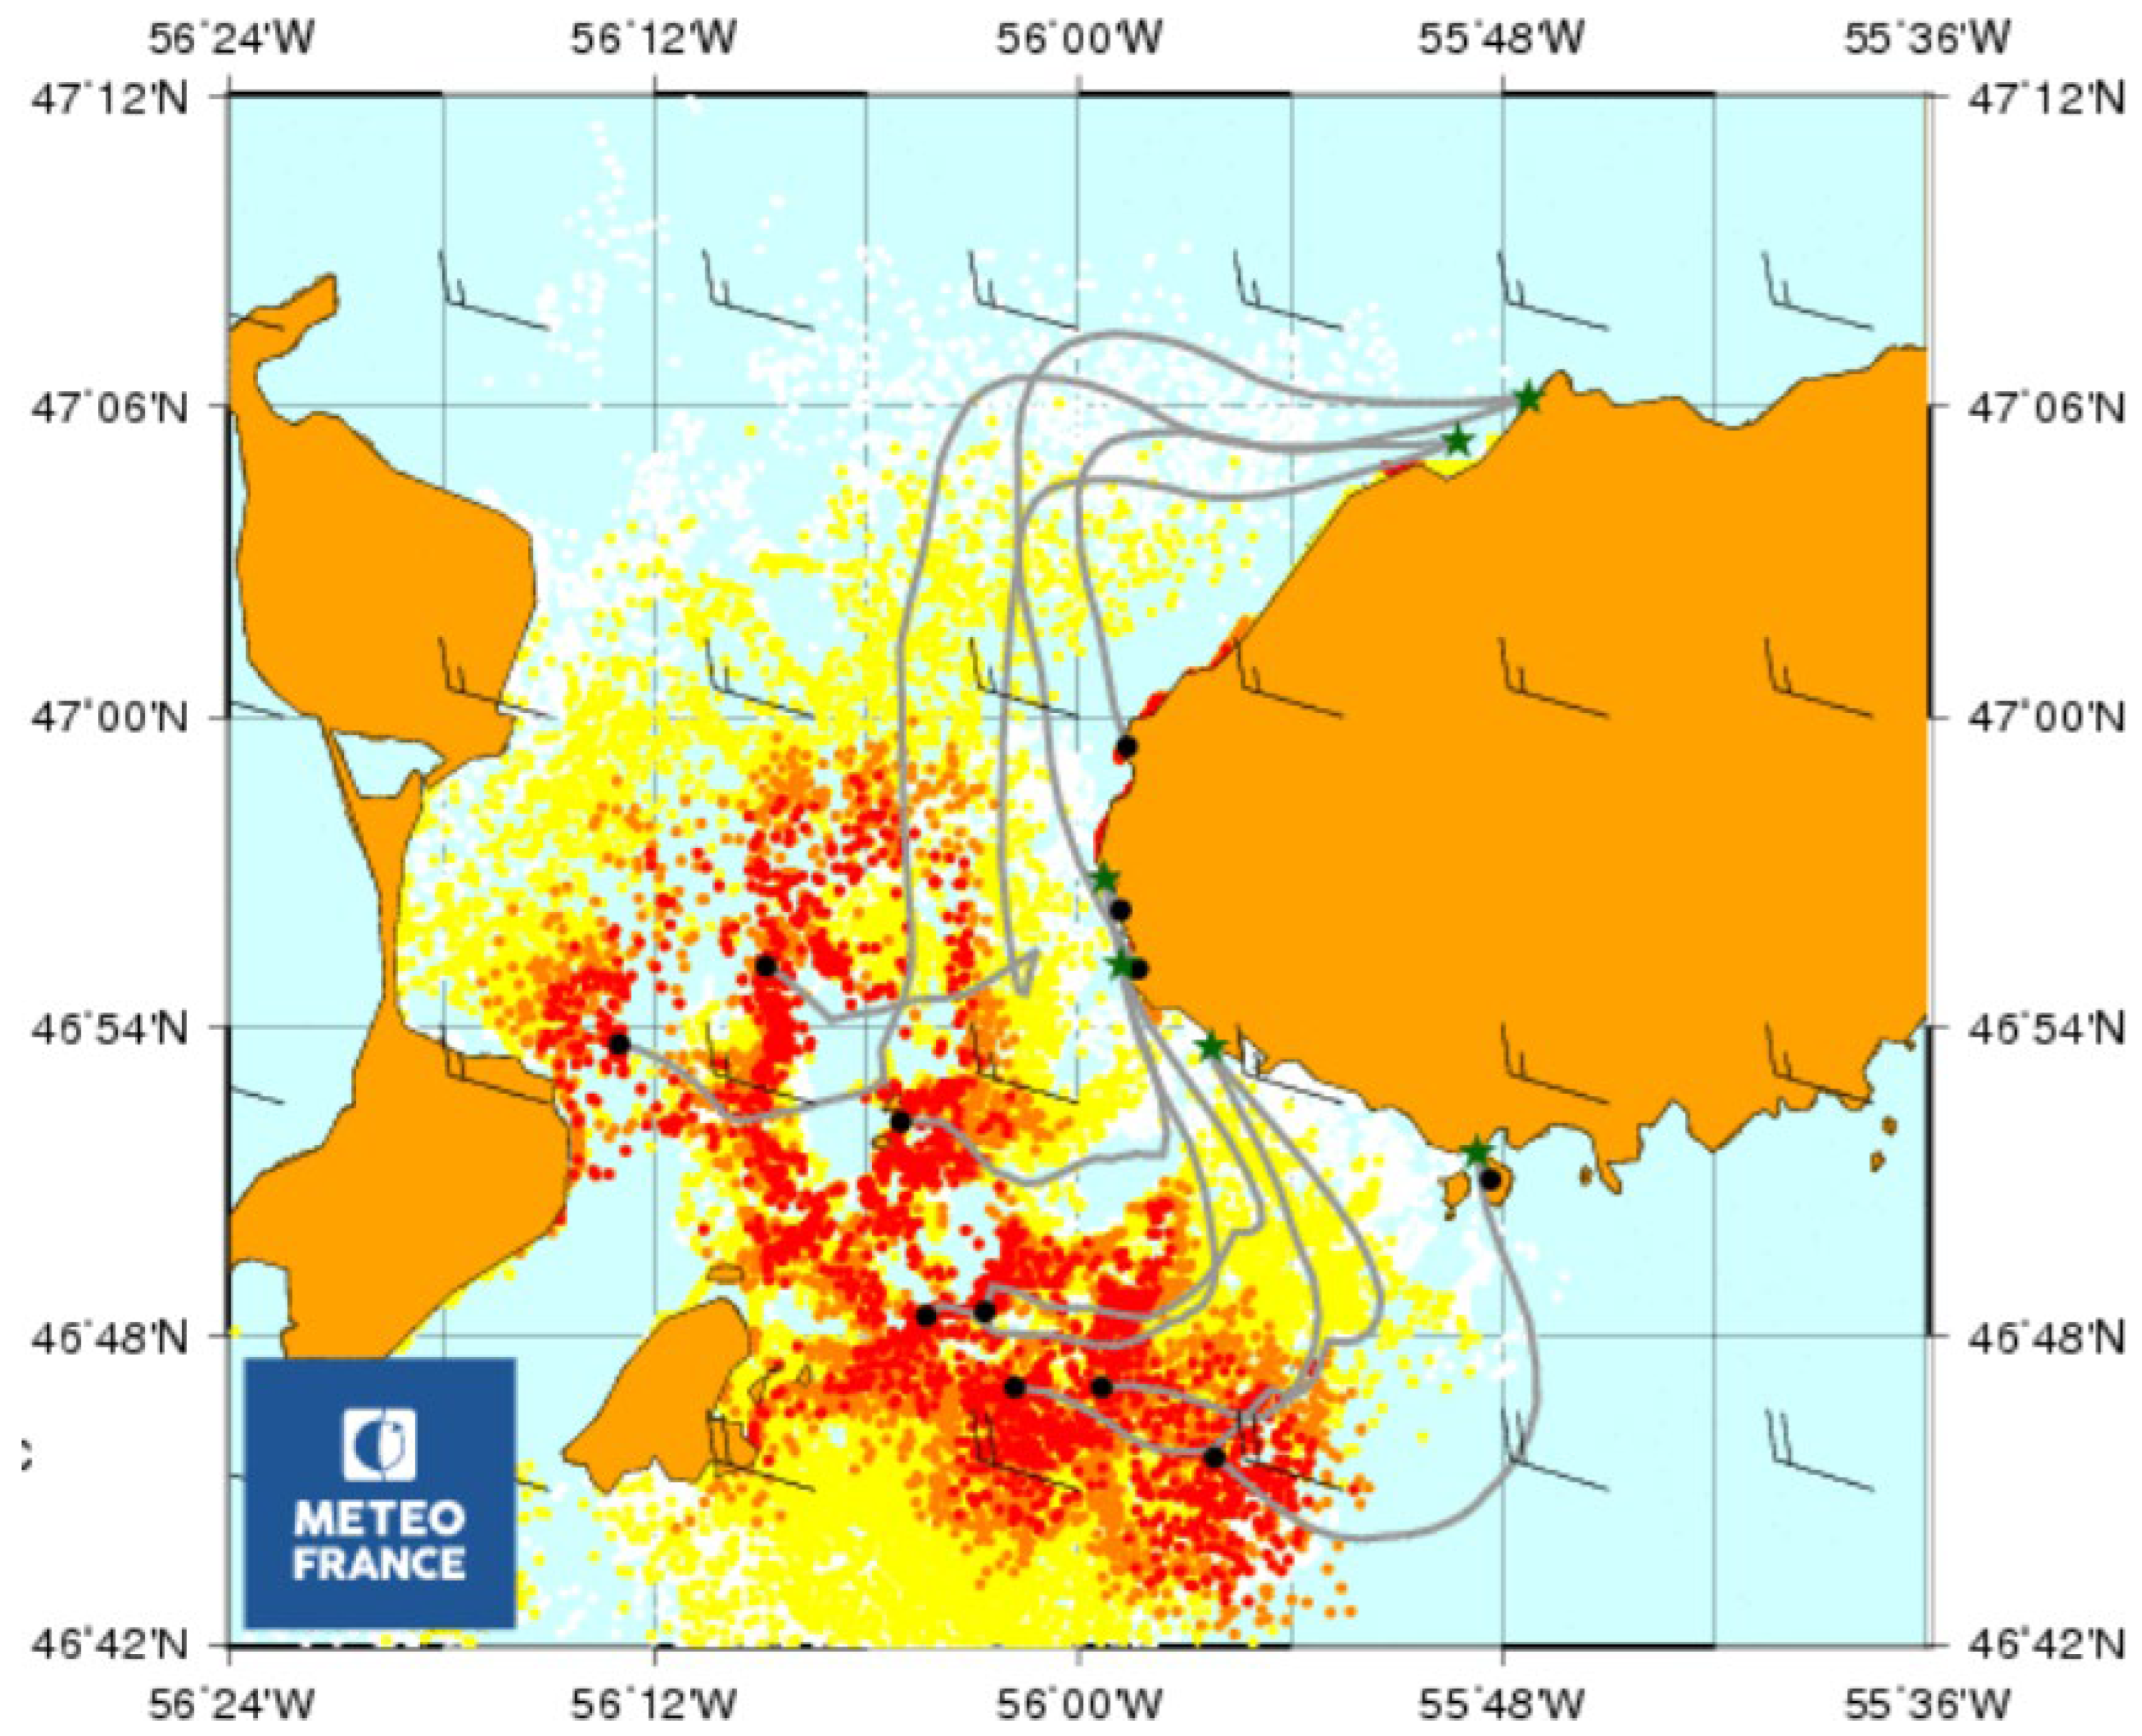
Figure 3.
Maximum probabilities (expressed in tenths of a percent) for a threshold of five debris items contributing simultaneously to a grid cell.
Figure 3.
Maximum probabilities (expressed in tenths of a percent) for a threshold of five debris items contributing simultaneously to a grid cell.
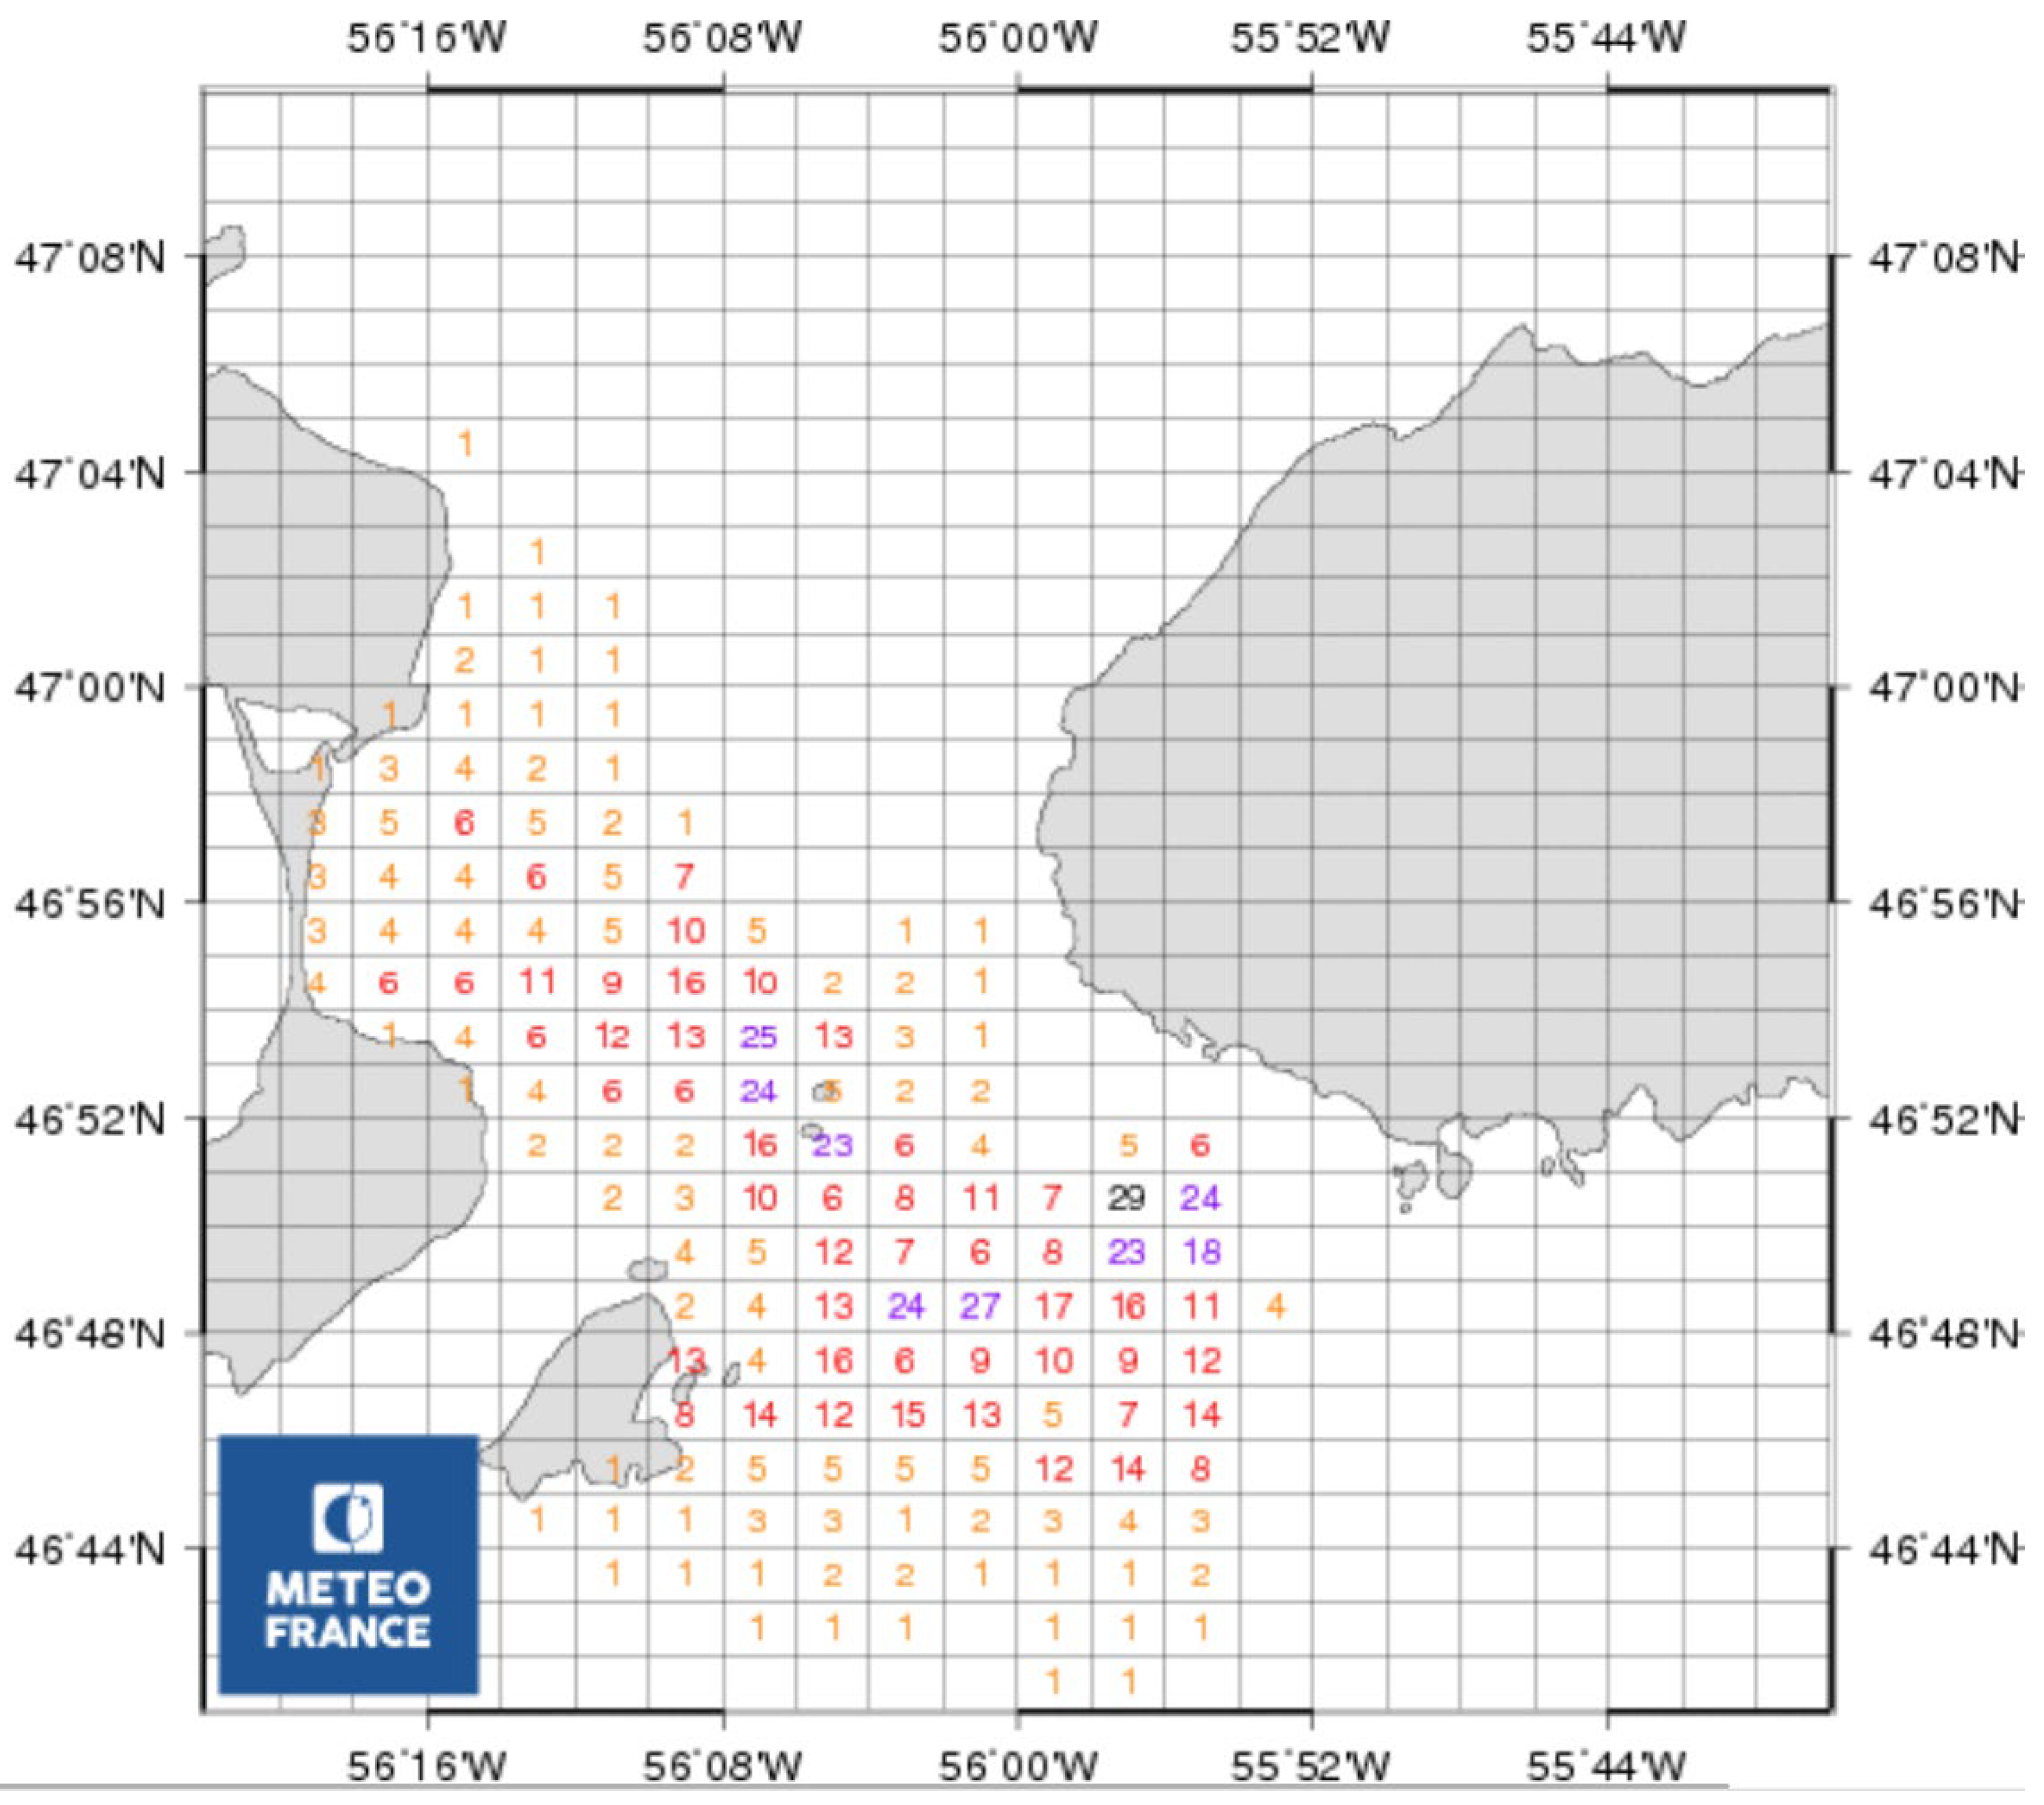
Figure 4.
Time of maximum probability (expressed in day and UTC hour) for a threshold of five debris items contributing simultaneously to a grid cell. Local time = UTC – 3.
Figure 4.
Time of maximum probability (expressed in day and UTC hour) for a threshold of five debris items contributing simultaneously to a grid cell. Local time = UTC – 3.

Figure 5.
Maximum hourly probabilities, expressed in tenths of a percent, for objects arriving in Lories between January 30 at 15:00 and January 31 at 09:00, assuming the shipwreck occurred between January 28 at 21:00 and January 30 at 08:00.
Figure 5.
Maximum hourly probabilities, expressed in tenths of a percent, for objects arriving in Lories between January 30 at 15:00 and January 31 at 09:00, assuming the shipwreck occurred between January 28 at 21:00 and January 30 at 08:00.
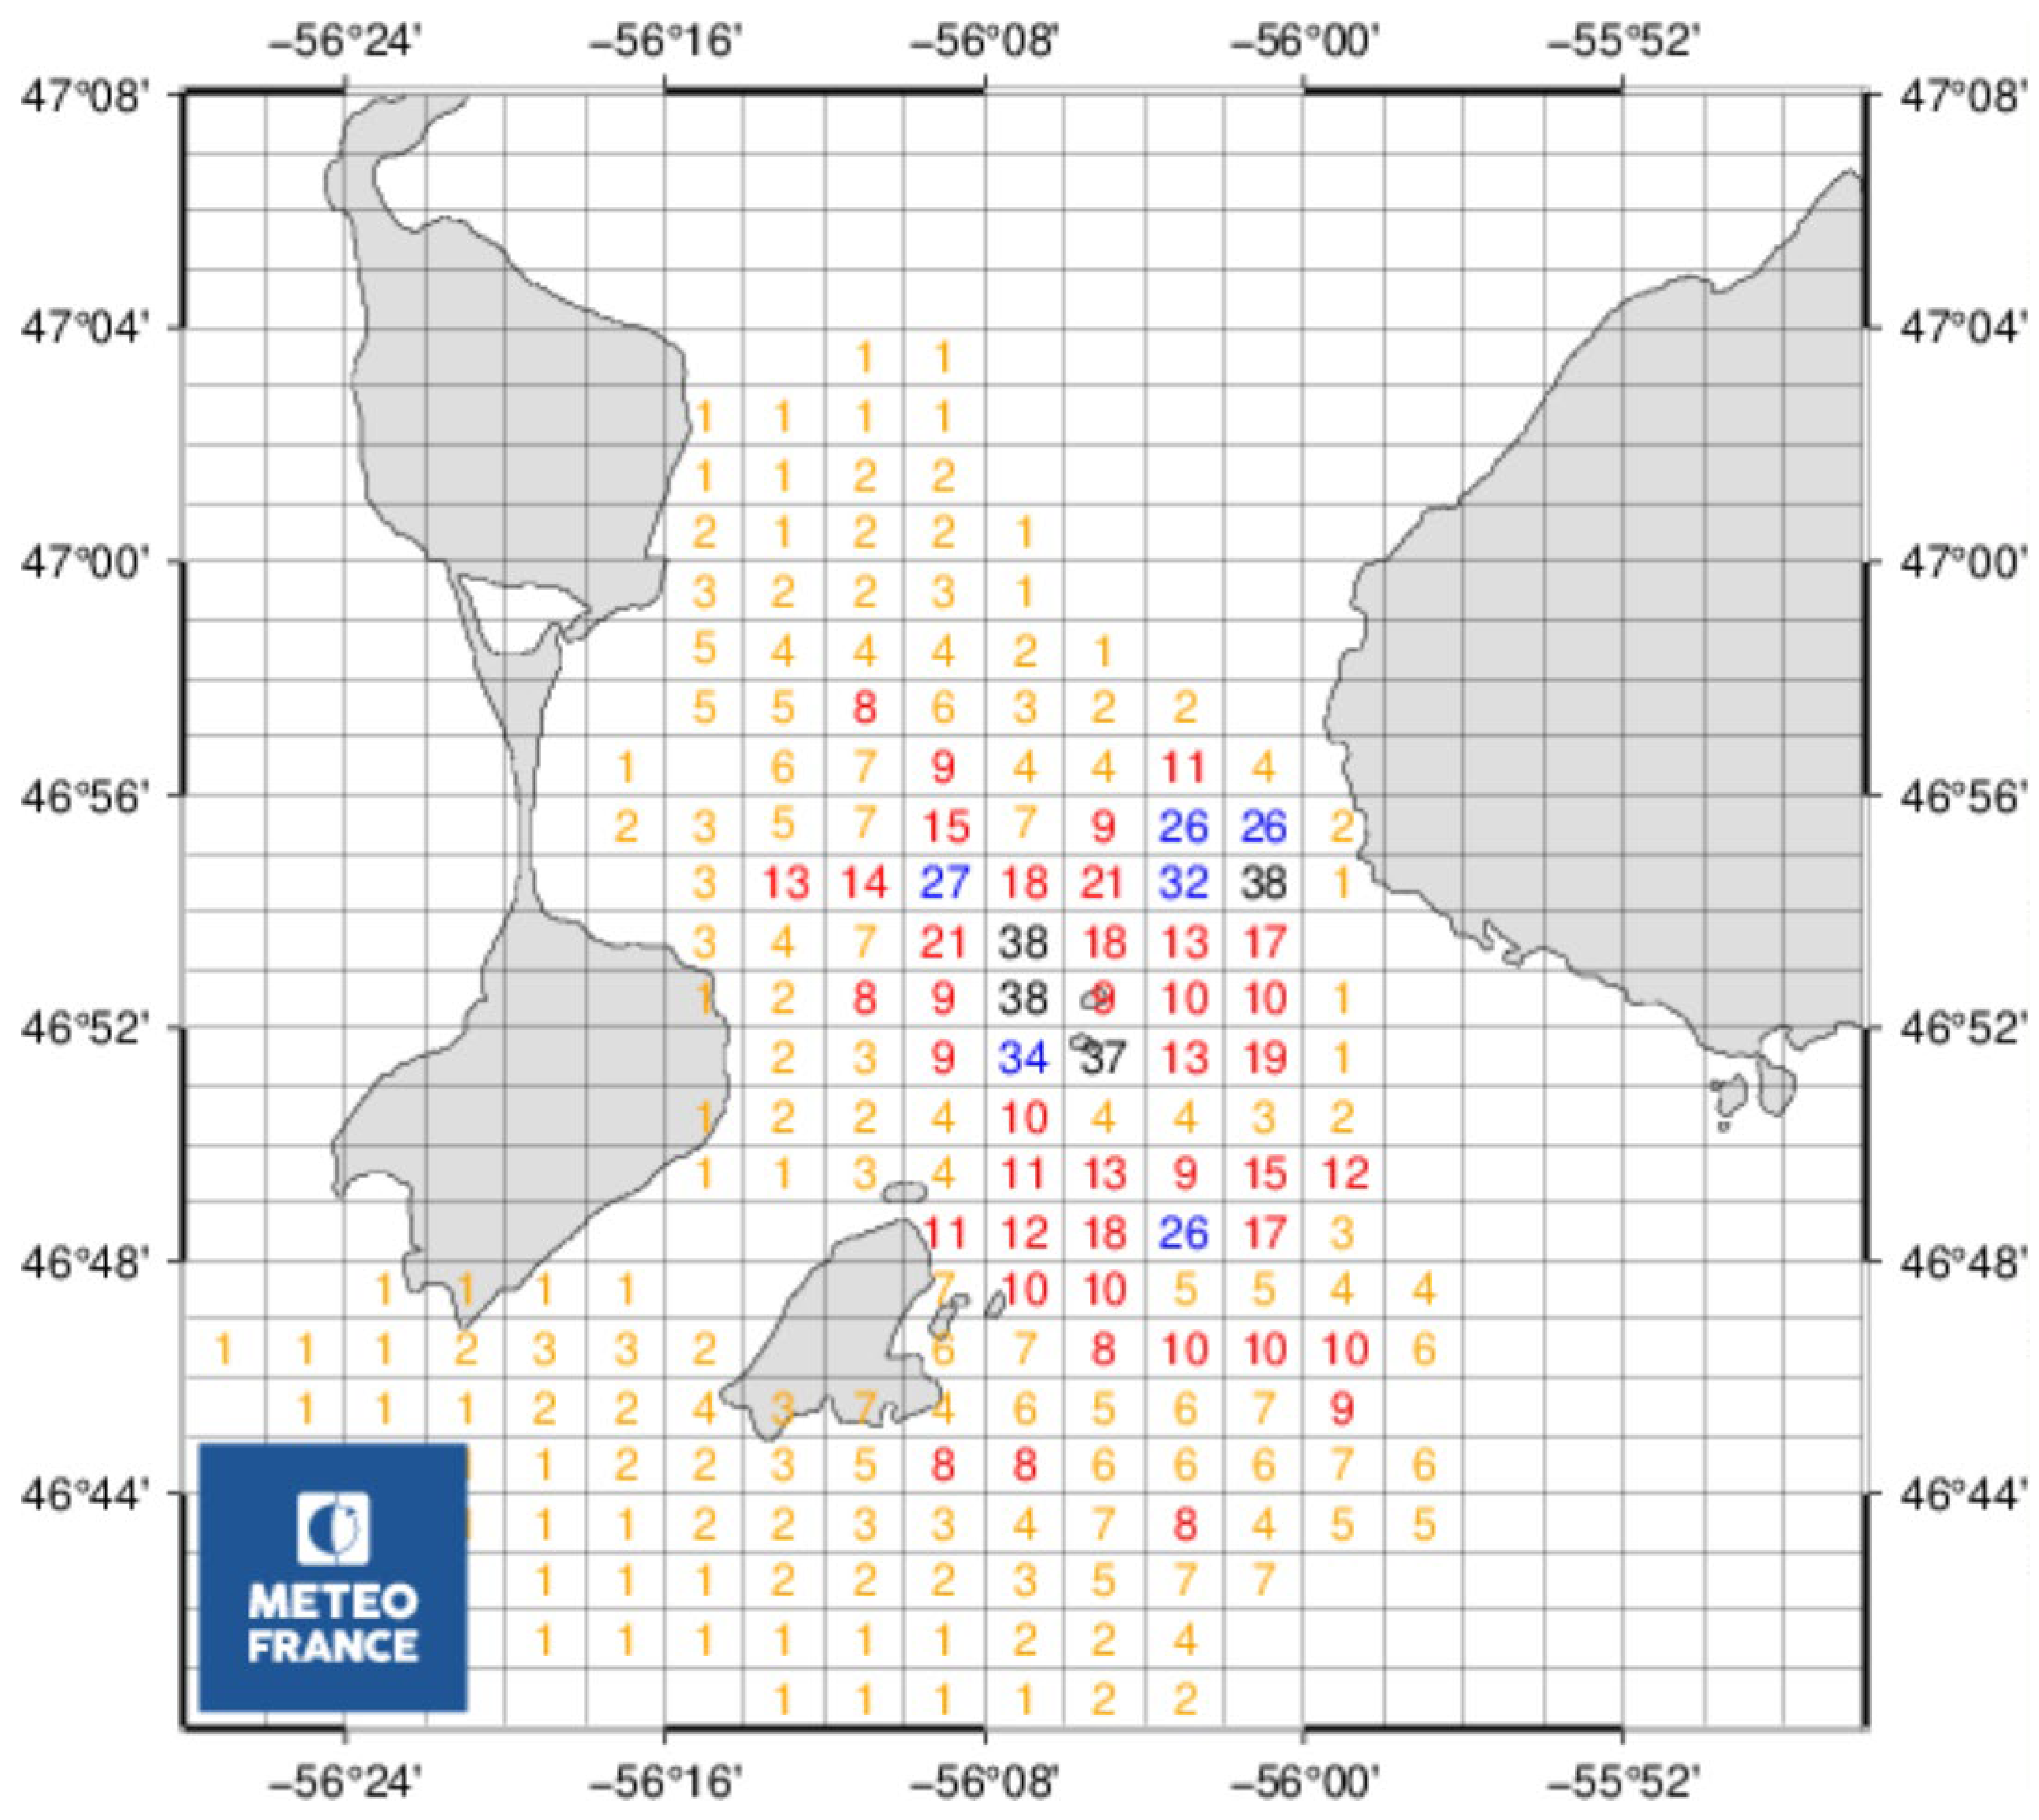
Figure 6.
Area prospected in 2021, covering approximately 390 km², based on backward-drift simulations. © iXblue, cartography iXblue.
Figure 6.
Area prospected in 2021, covering approximately 390 km², based on backward-drift simulations. © iXblue, cartography iXblue.
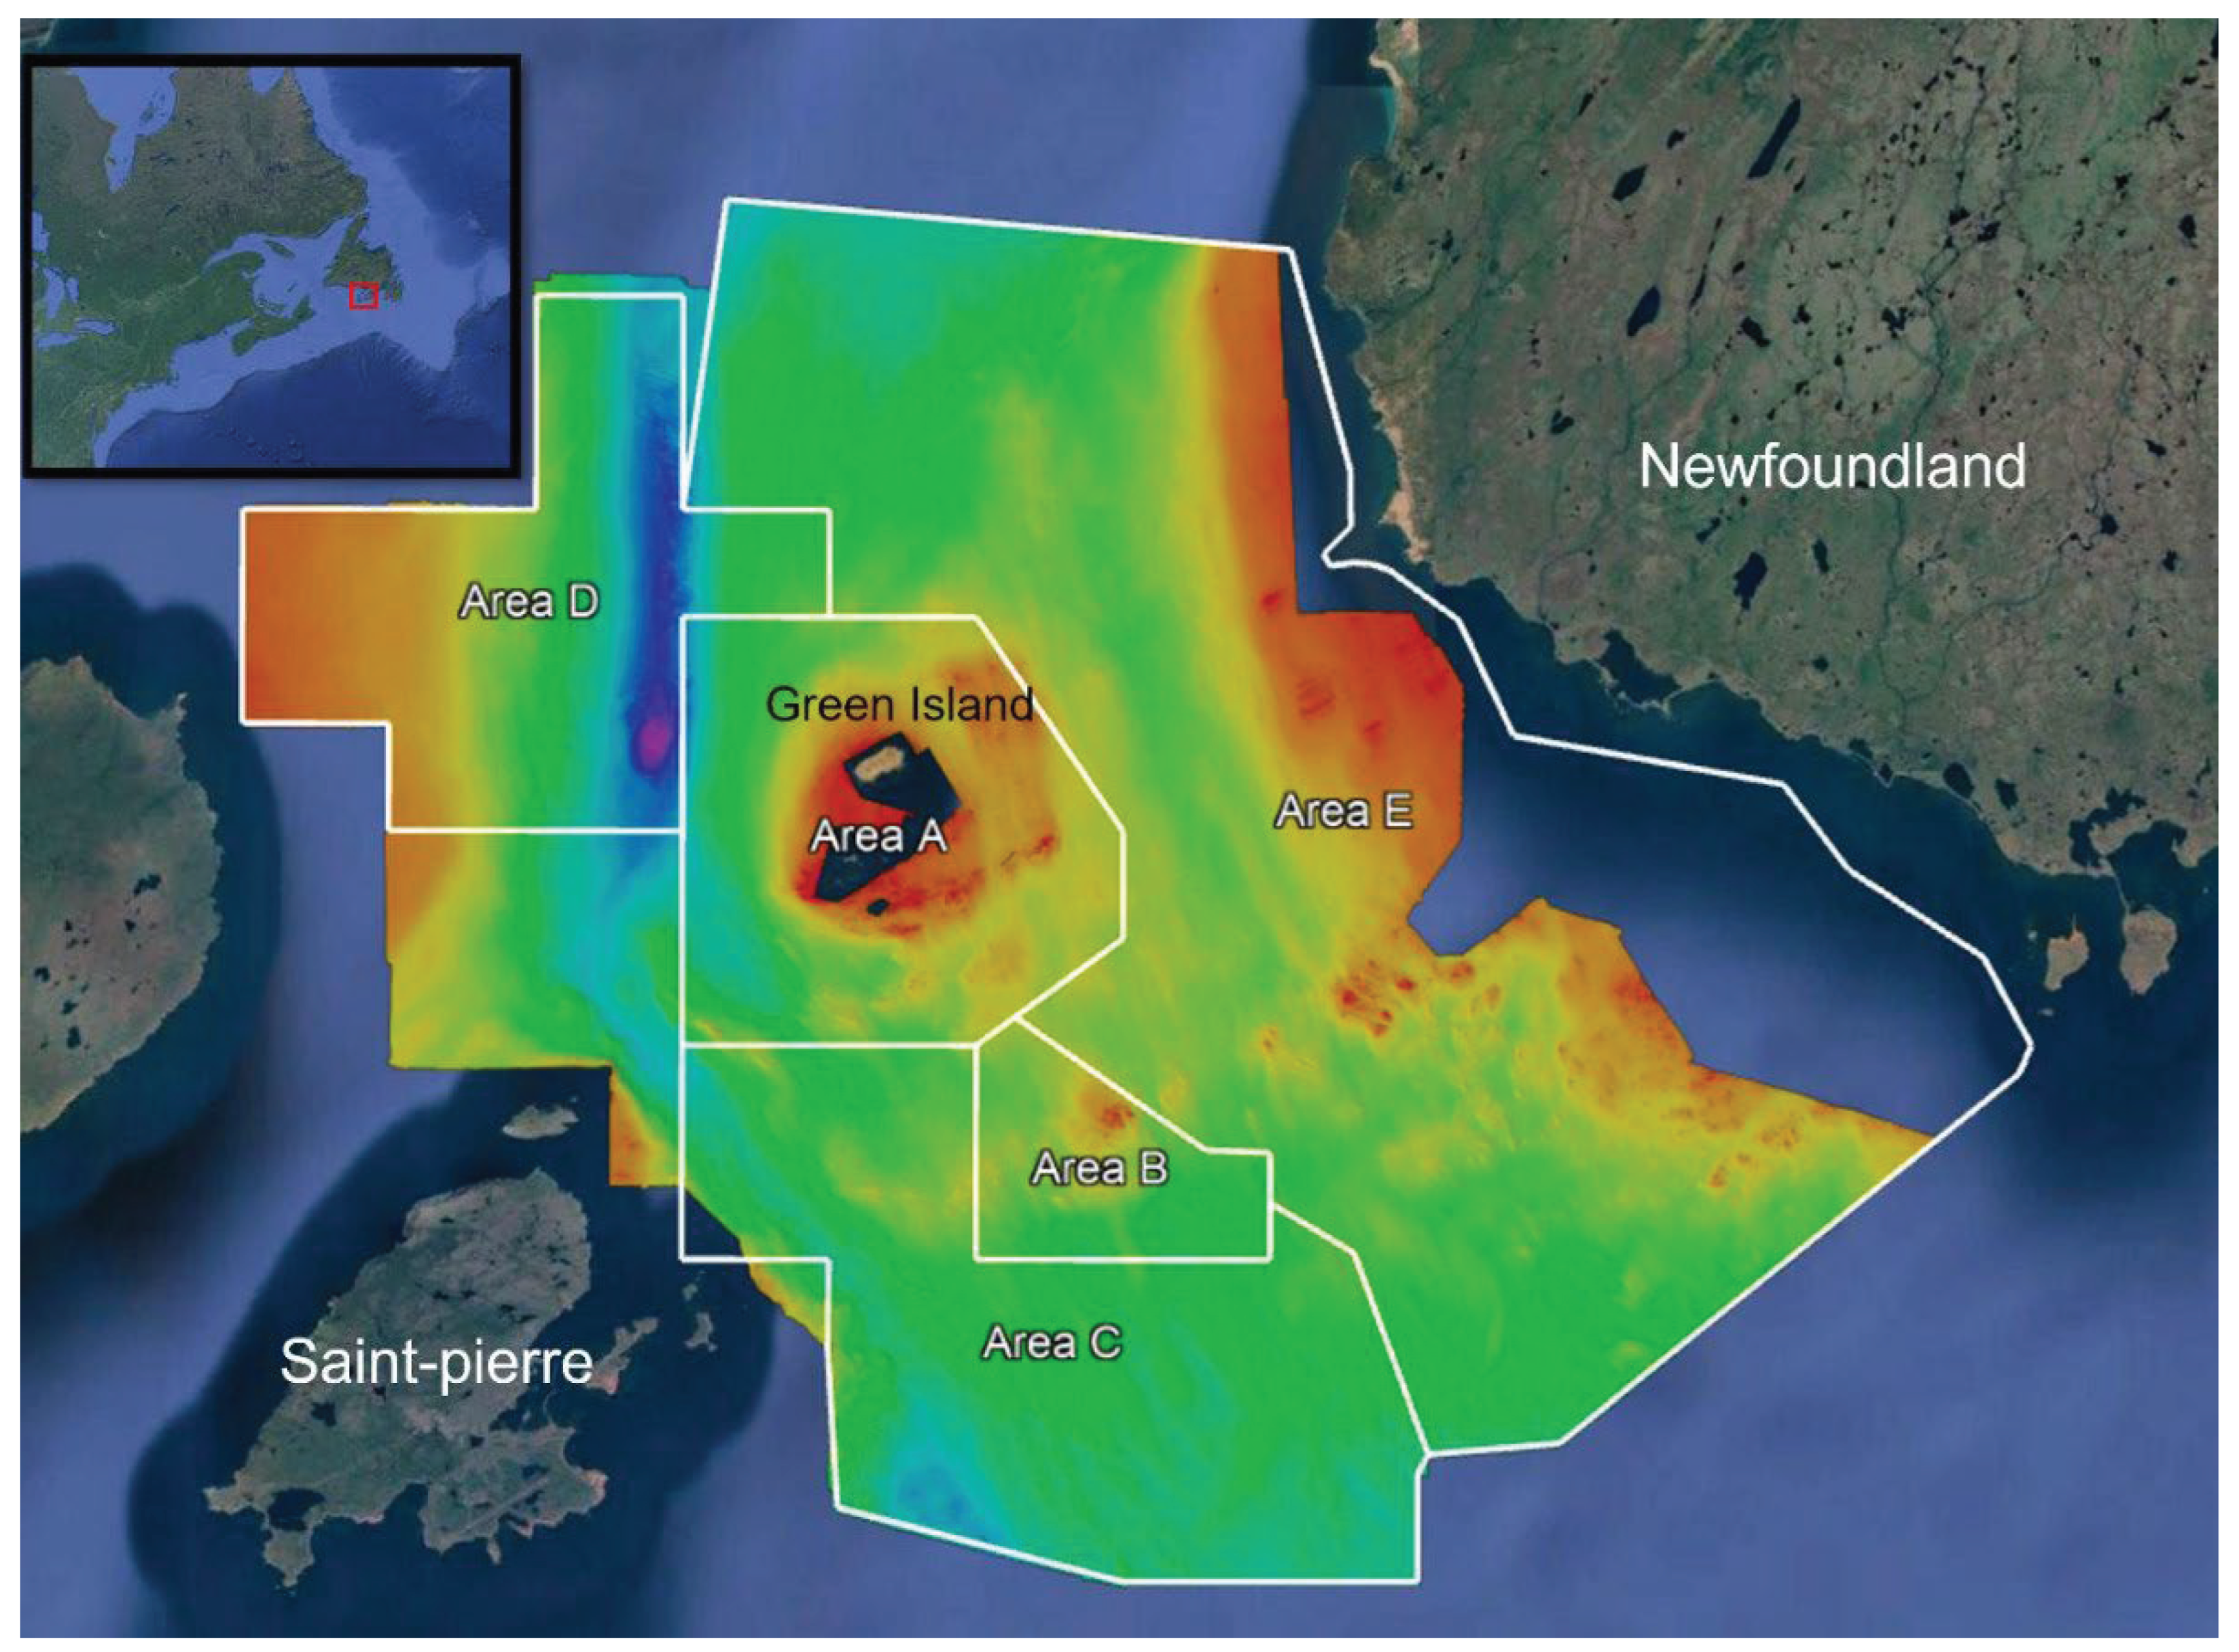
Figure 7.
Maximum hourly probabilities (%) for objects arriving at Lories (a) and Flagstaff (b) at 09:00 on 31 January 1962, derived from backward drift simulations extending to 10:00 on 28 January.
Figure 7.
Maximum hourly probabilities (%) for objects arriving at Lories (a) and Flagstaff (b) at 09:00 on 31 January 1962, derived from backward drift simulations extending to 10:00 on 28 January.
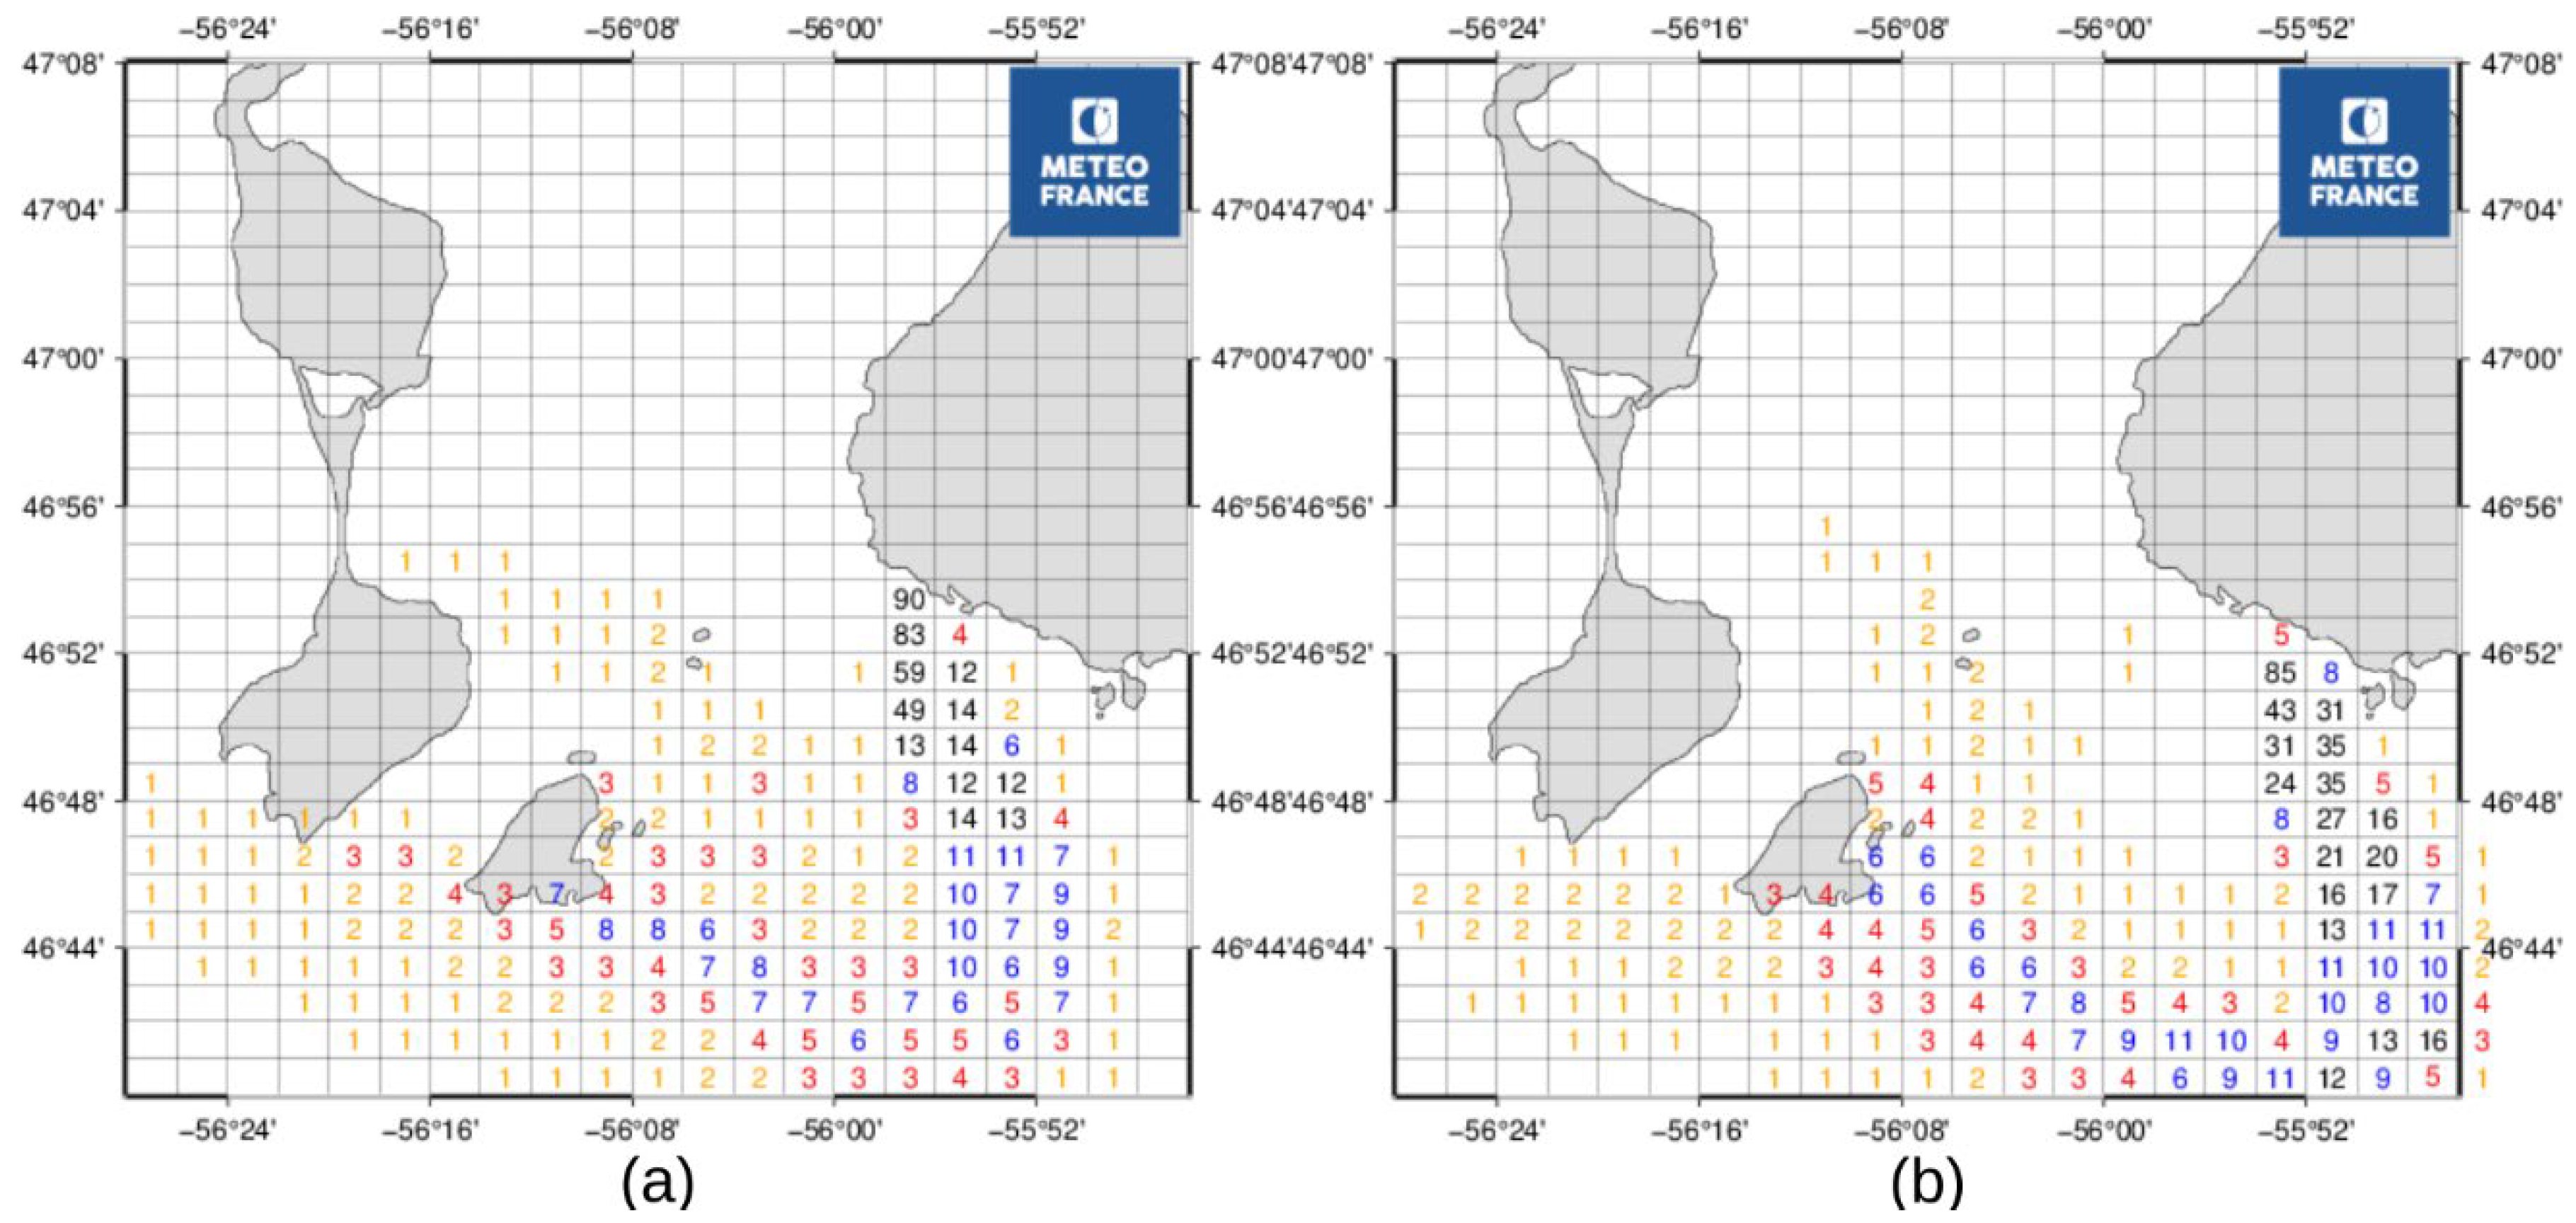
Figure 8.
Maximum hourly probabilities (%) for objects arriving at Lories (a) and Flagstaff (b) at 15:00 on 30 January 1962, derived from backward drift simulations extending to 10:00 on 28 January.
Figure 8.
Maximum hourly probabilities (%) for objects arriving at Lories (a) and Flagstaff (b) at 15:00 on 30 January 1962, derived from backward drift simulations extending to 10:00 on 28 January.
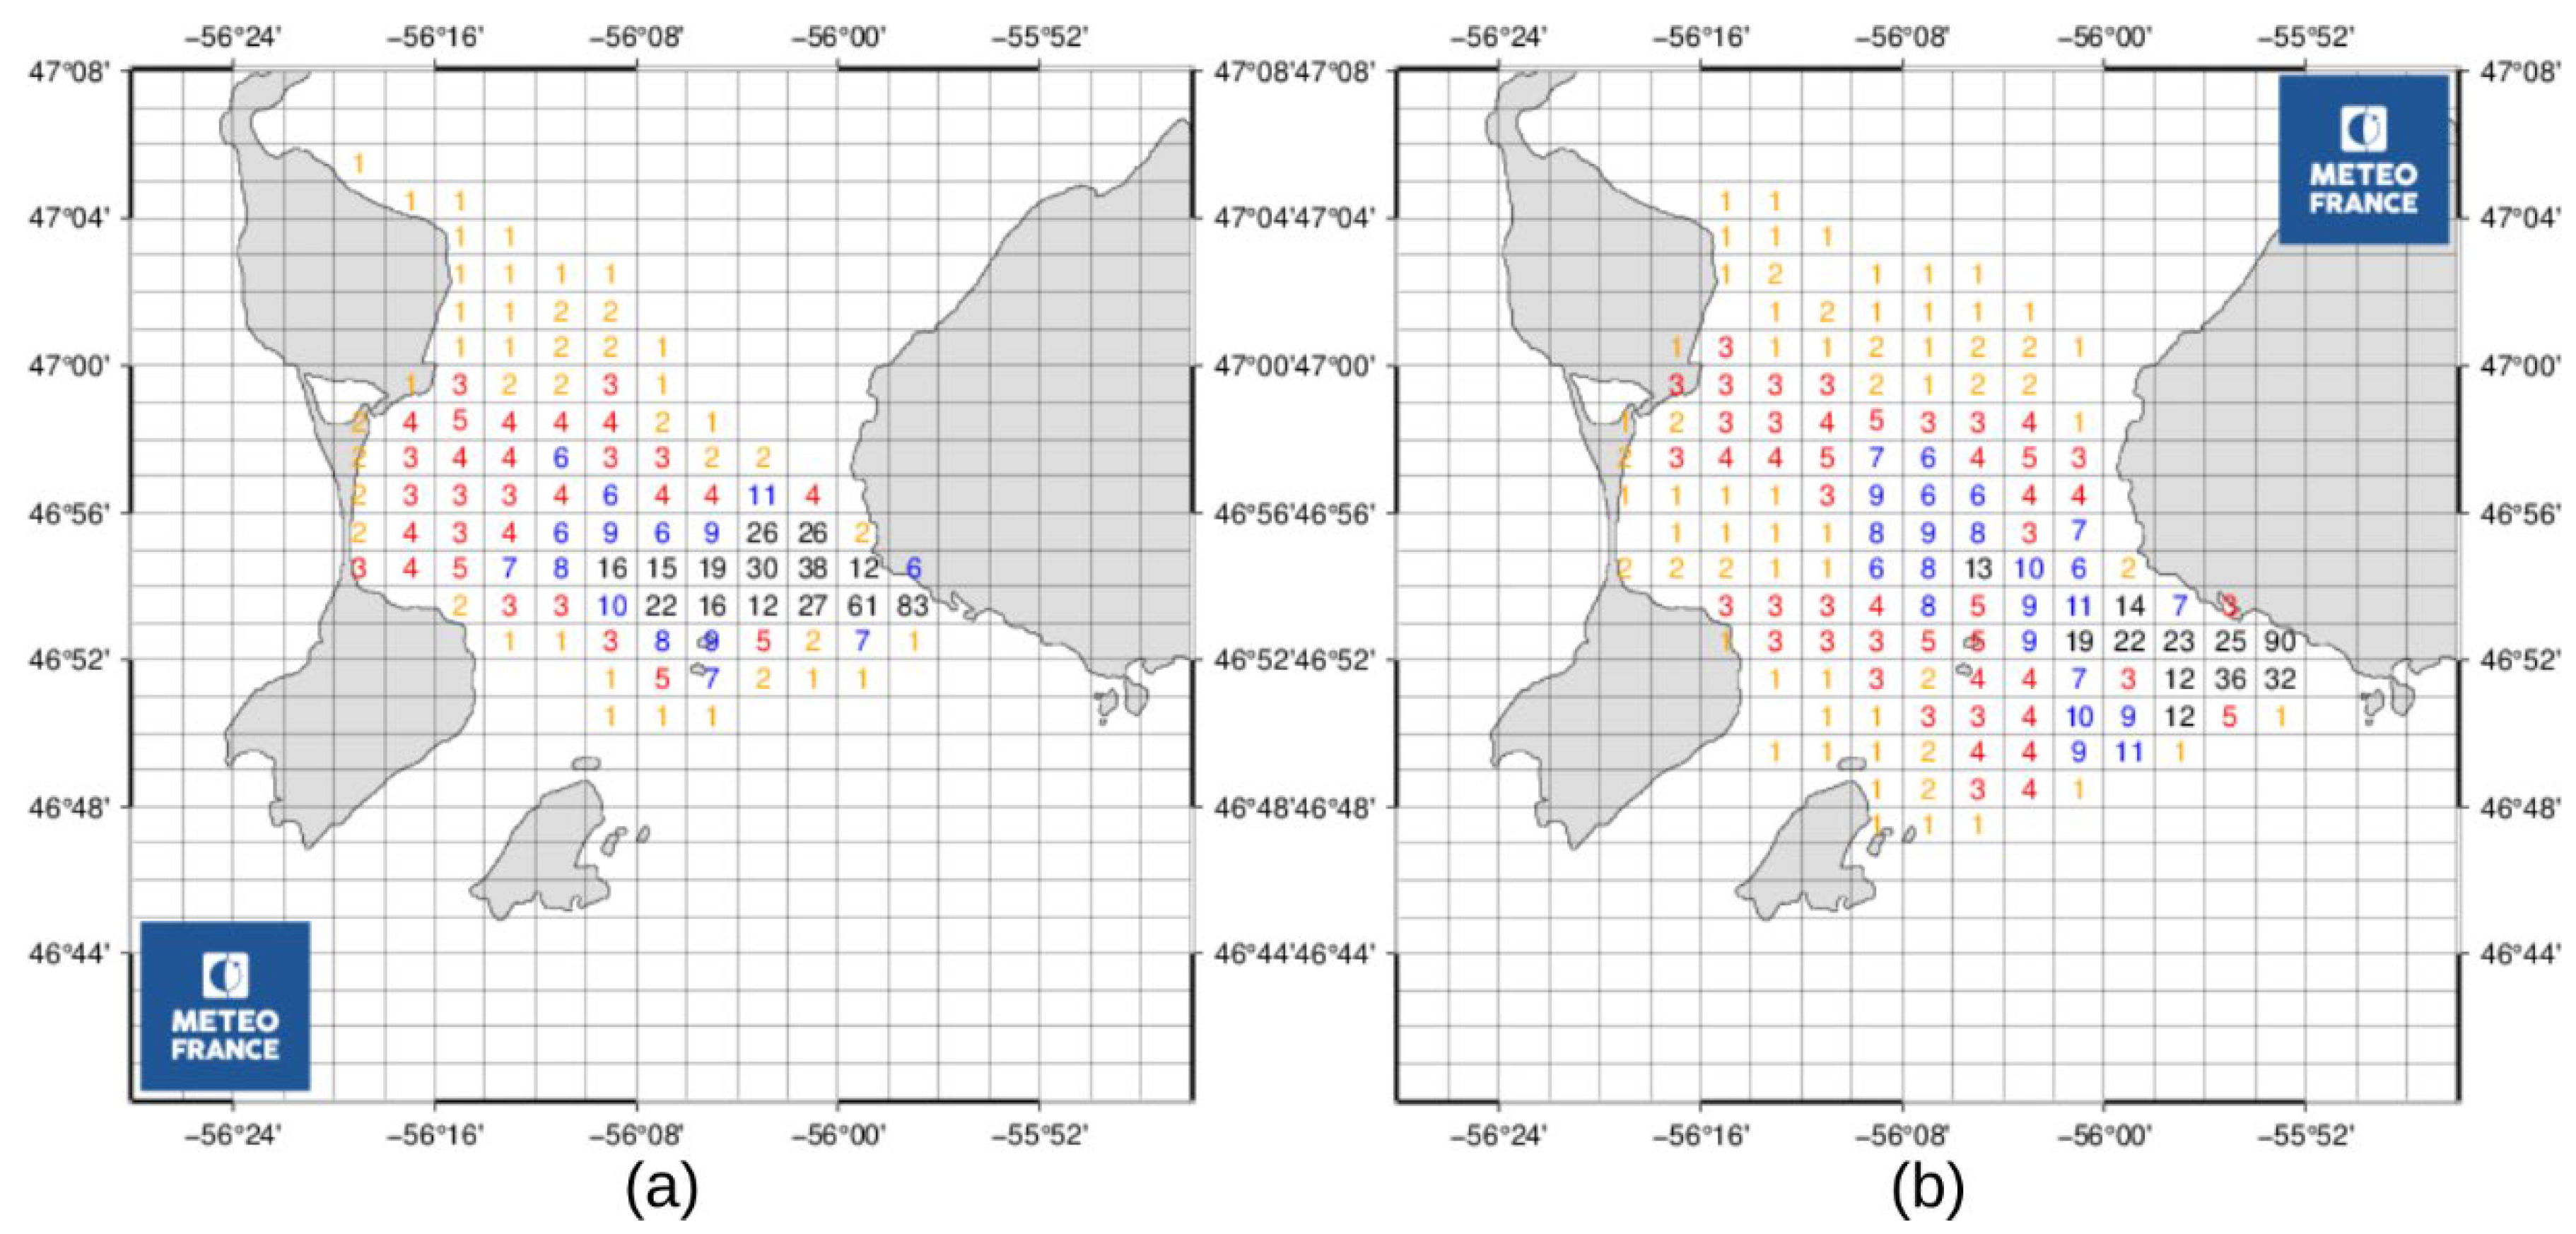
Figure 9.
Areas surveyed in 2021 (outlined in blue) and in 2022 (outlined in green), covering a total area of approximately 600 km², together with the location of the wreck (in red). Data from iXblue-Drassm and mapping by Alexis Rochat/Drassm.
Figure 9.
Areas surveyed in 2021 (outlined in blue) and in 2022 (outlined in green), covering a total area of approximately 600 km², together with the location of the wreck (in red). Data from iXblue-Drassm and mapping by Alexis Rochat/Drassm.
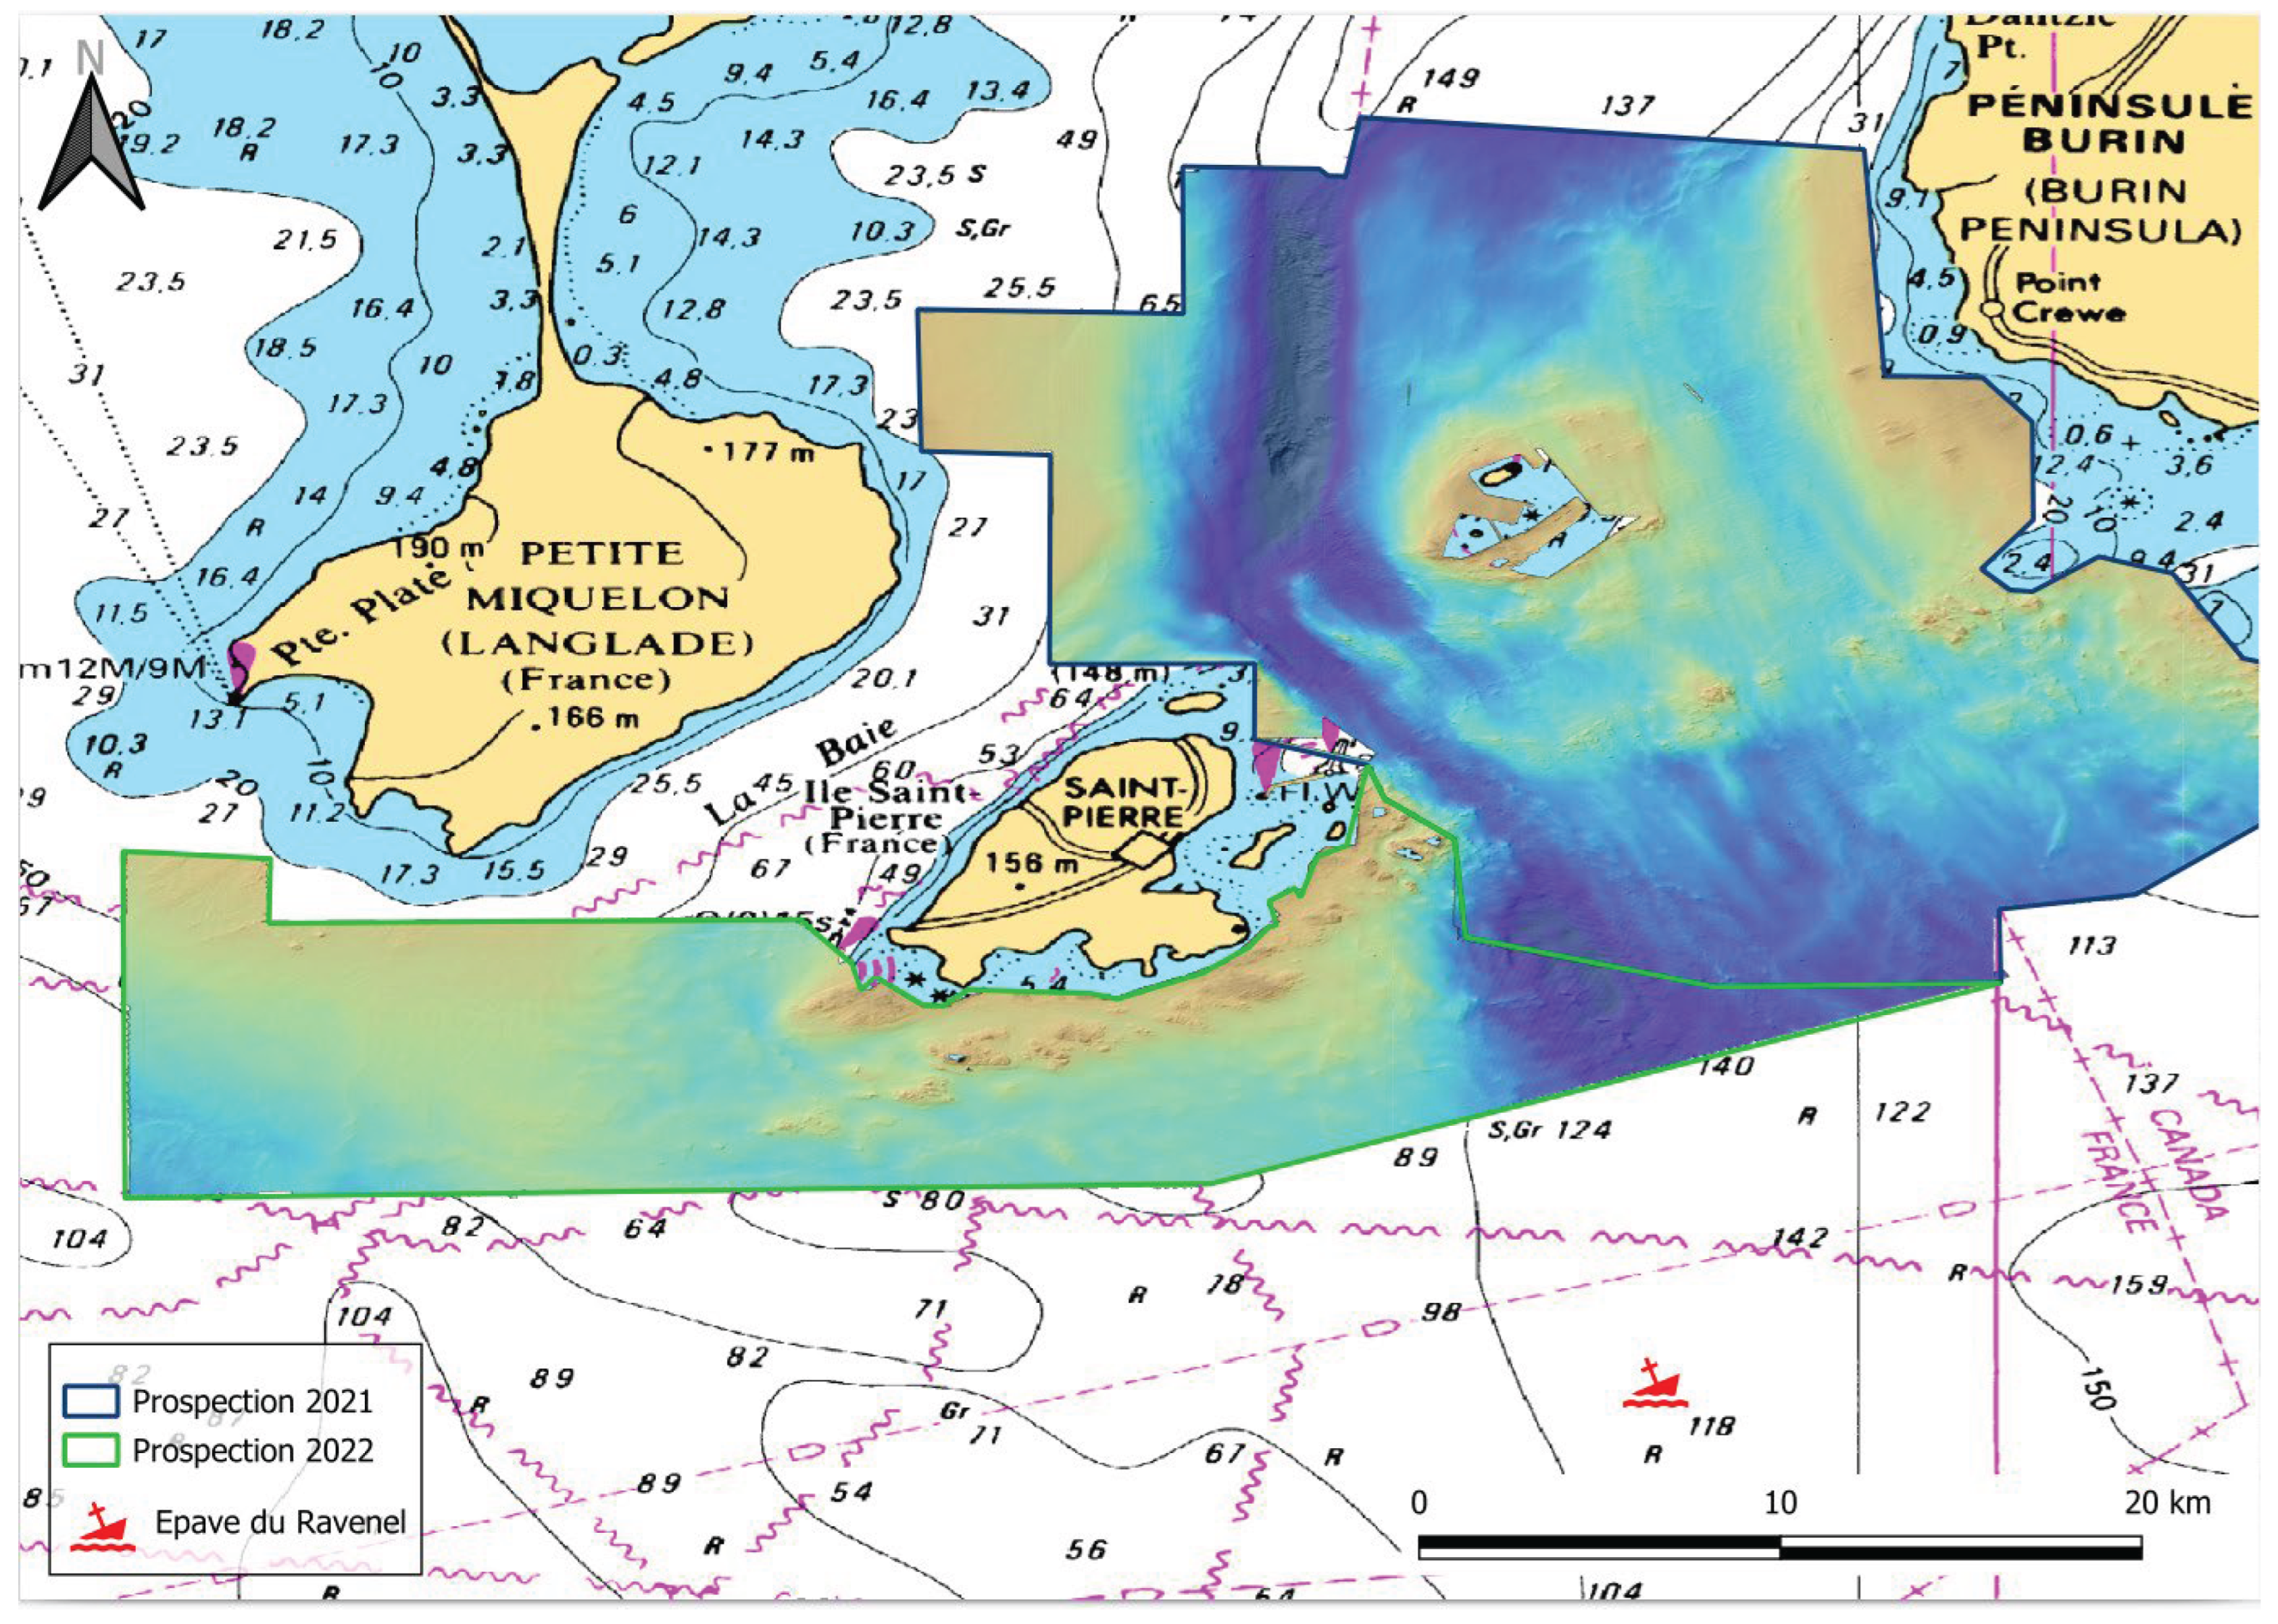
Figure 10.
Probability of debris coming ashore between Point Crewe and Lamaline as a function of sinking time, using ERA-20C forcing (blue) and ERA5 forcing (red).
Figure 10.
Probability of debris coming ashore between Point Crewe and Lamaline as a function of sinking time, using ERA-20C forcing (blue) and ERA5 forcing (red).
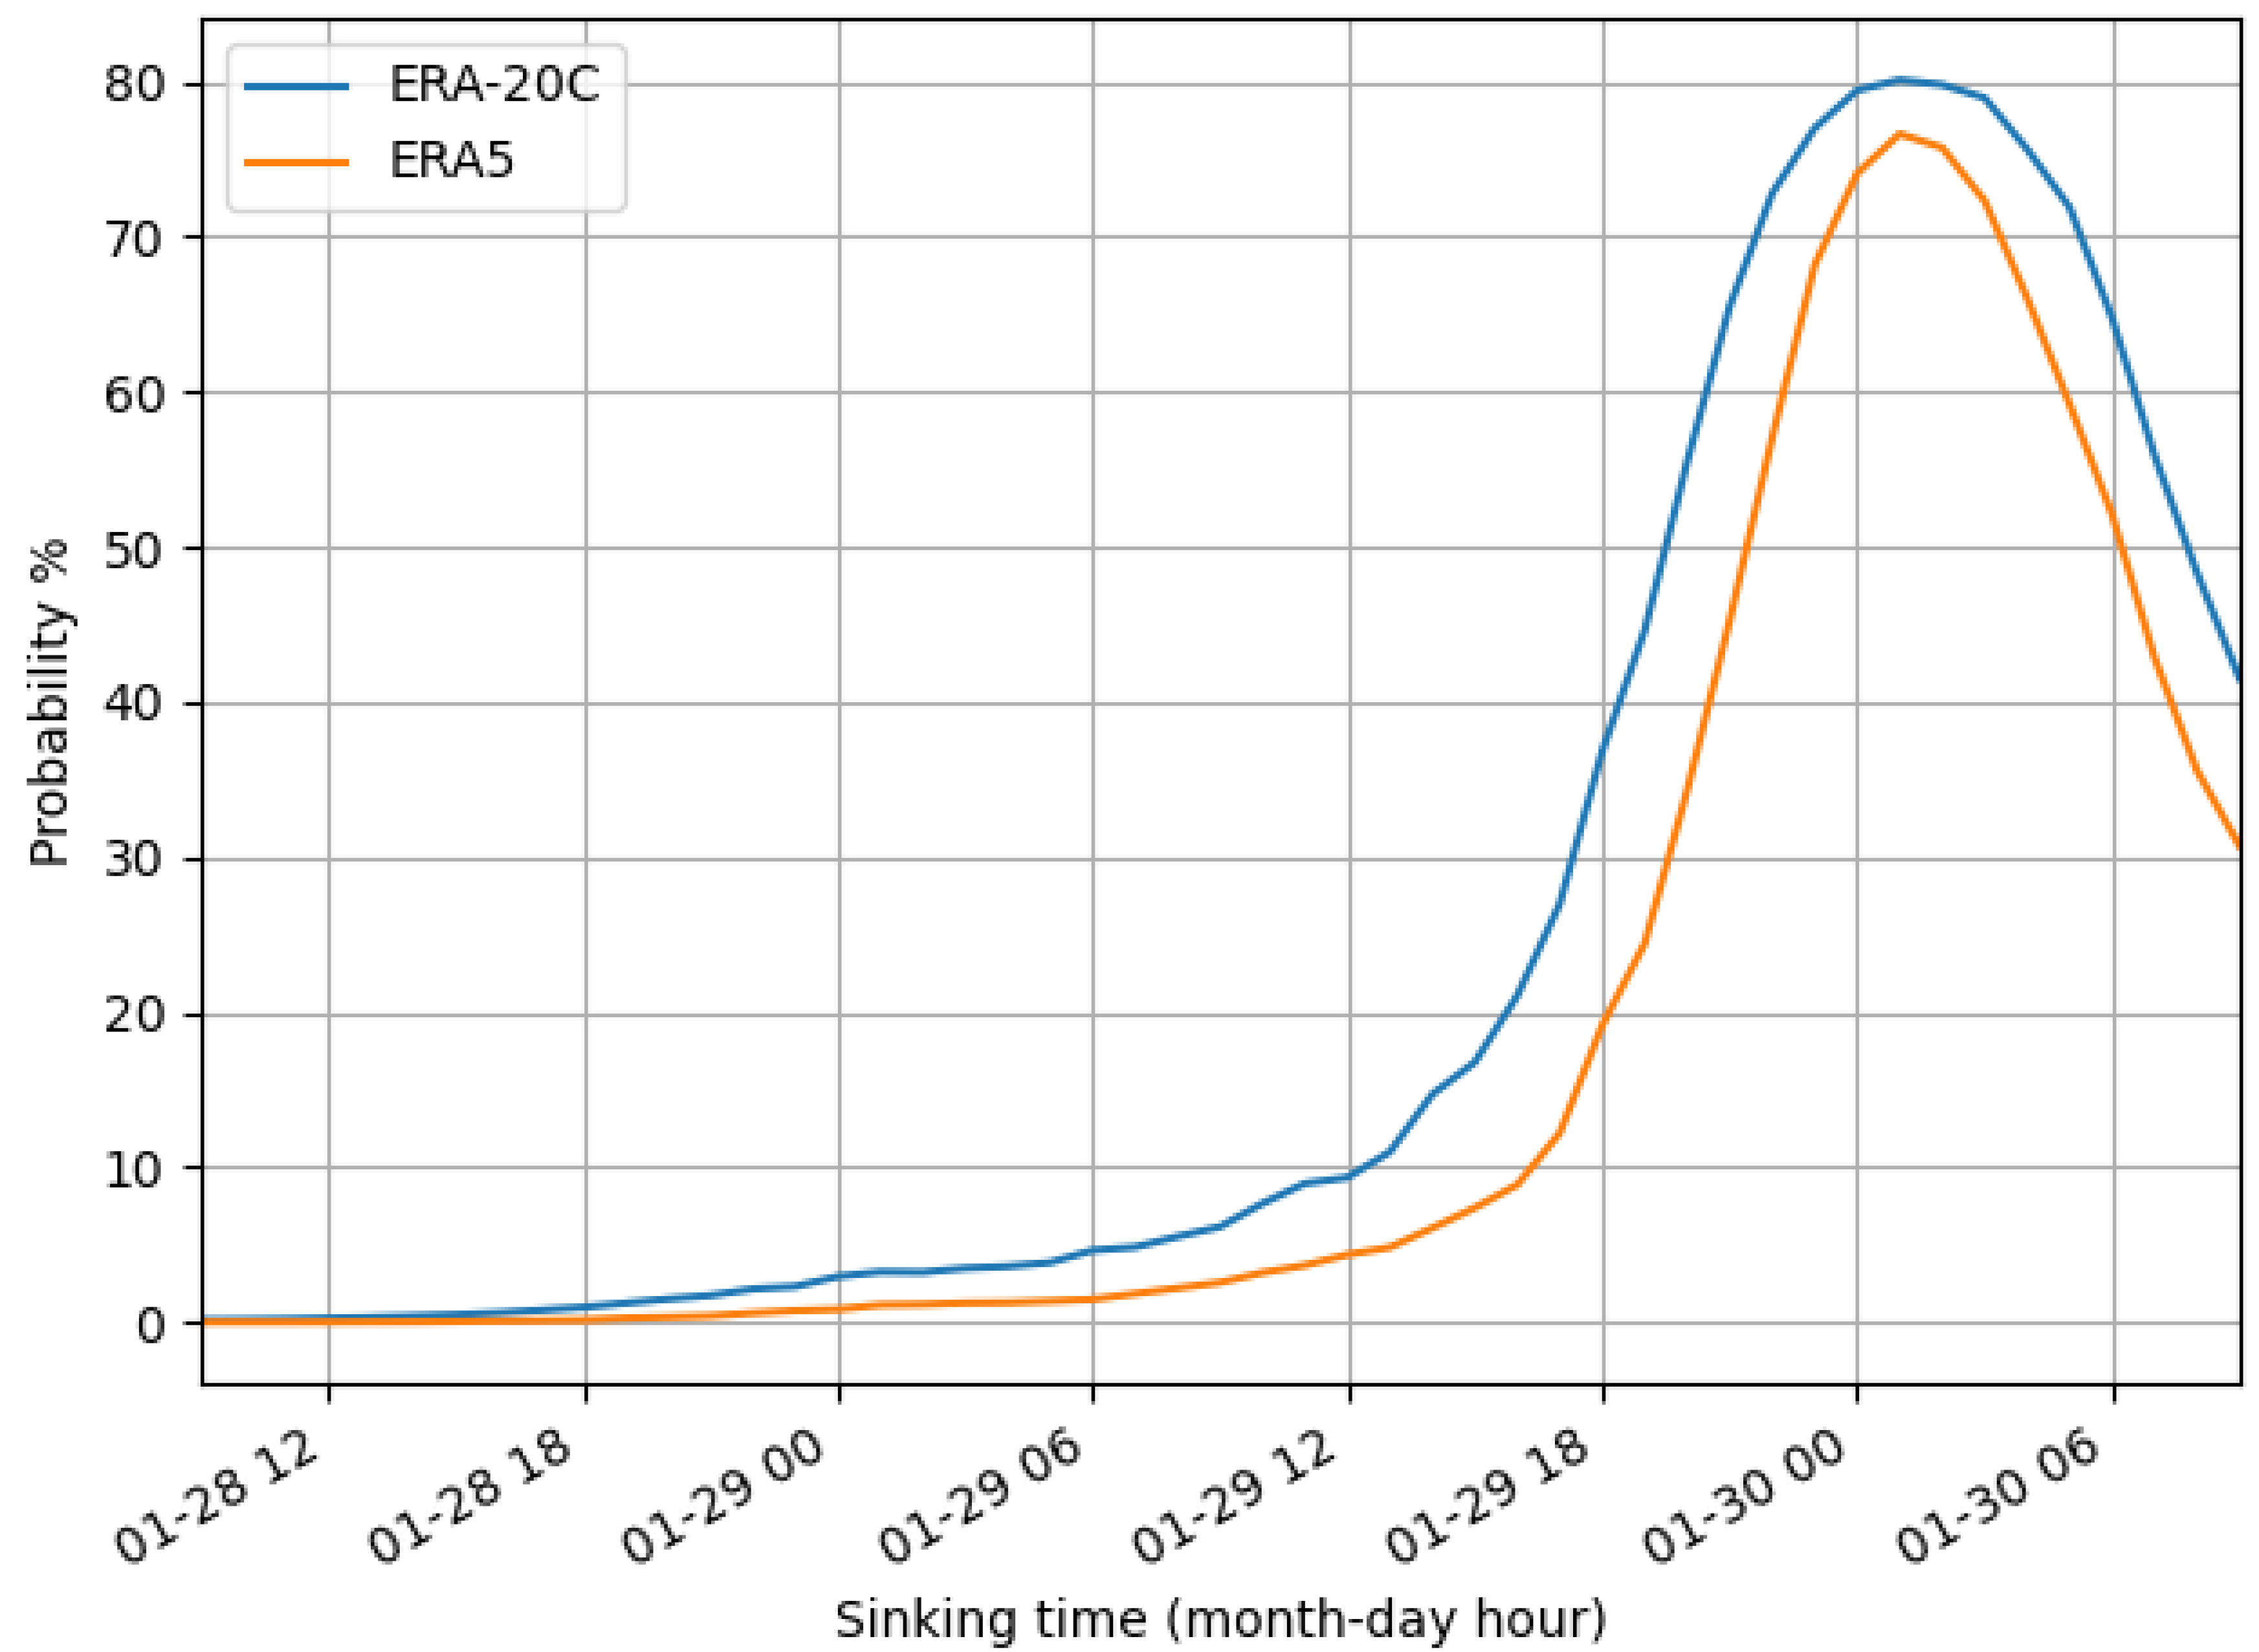
Figure 11.
Drift trajectories of debris released at the wreck site (green star) from 30 January at 01:00 to 31 January at 09:00, forced with ERA-20C (a) and ERA5 (b). Gray trajectories, terminating at black dots, represent simulations drifting to the left and right of the wind without tack changes. Colored regions show probabilistic drift envelopes that account for stochastic tack changes: red indicates 50% probability, red and orange together 66%, red, orange, and yellow 95%, and red, orange, yellow, and white 99%.
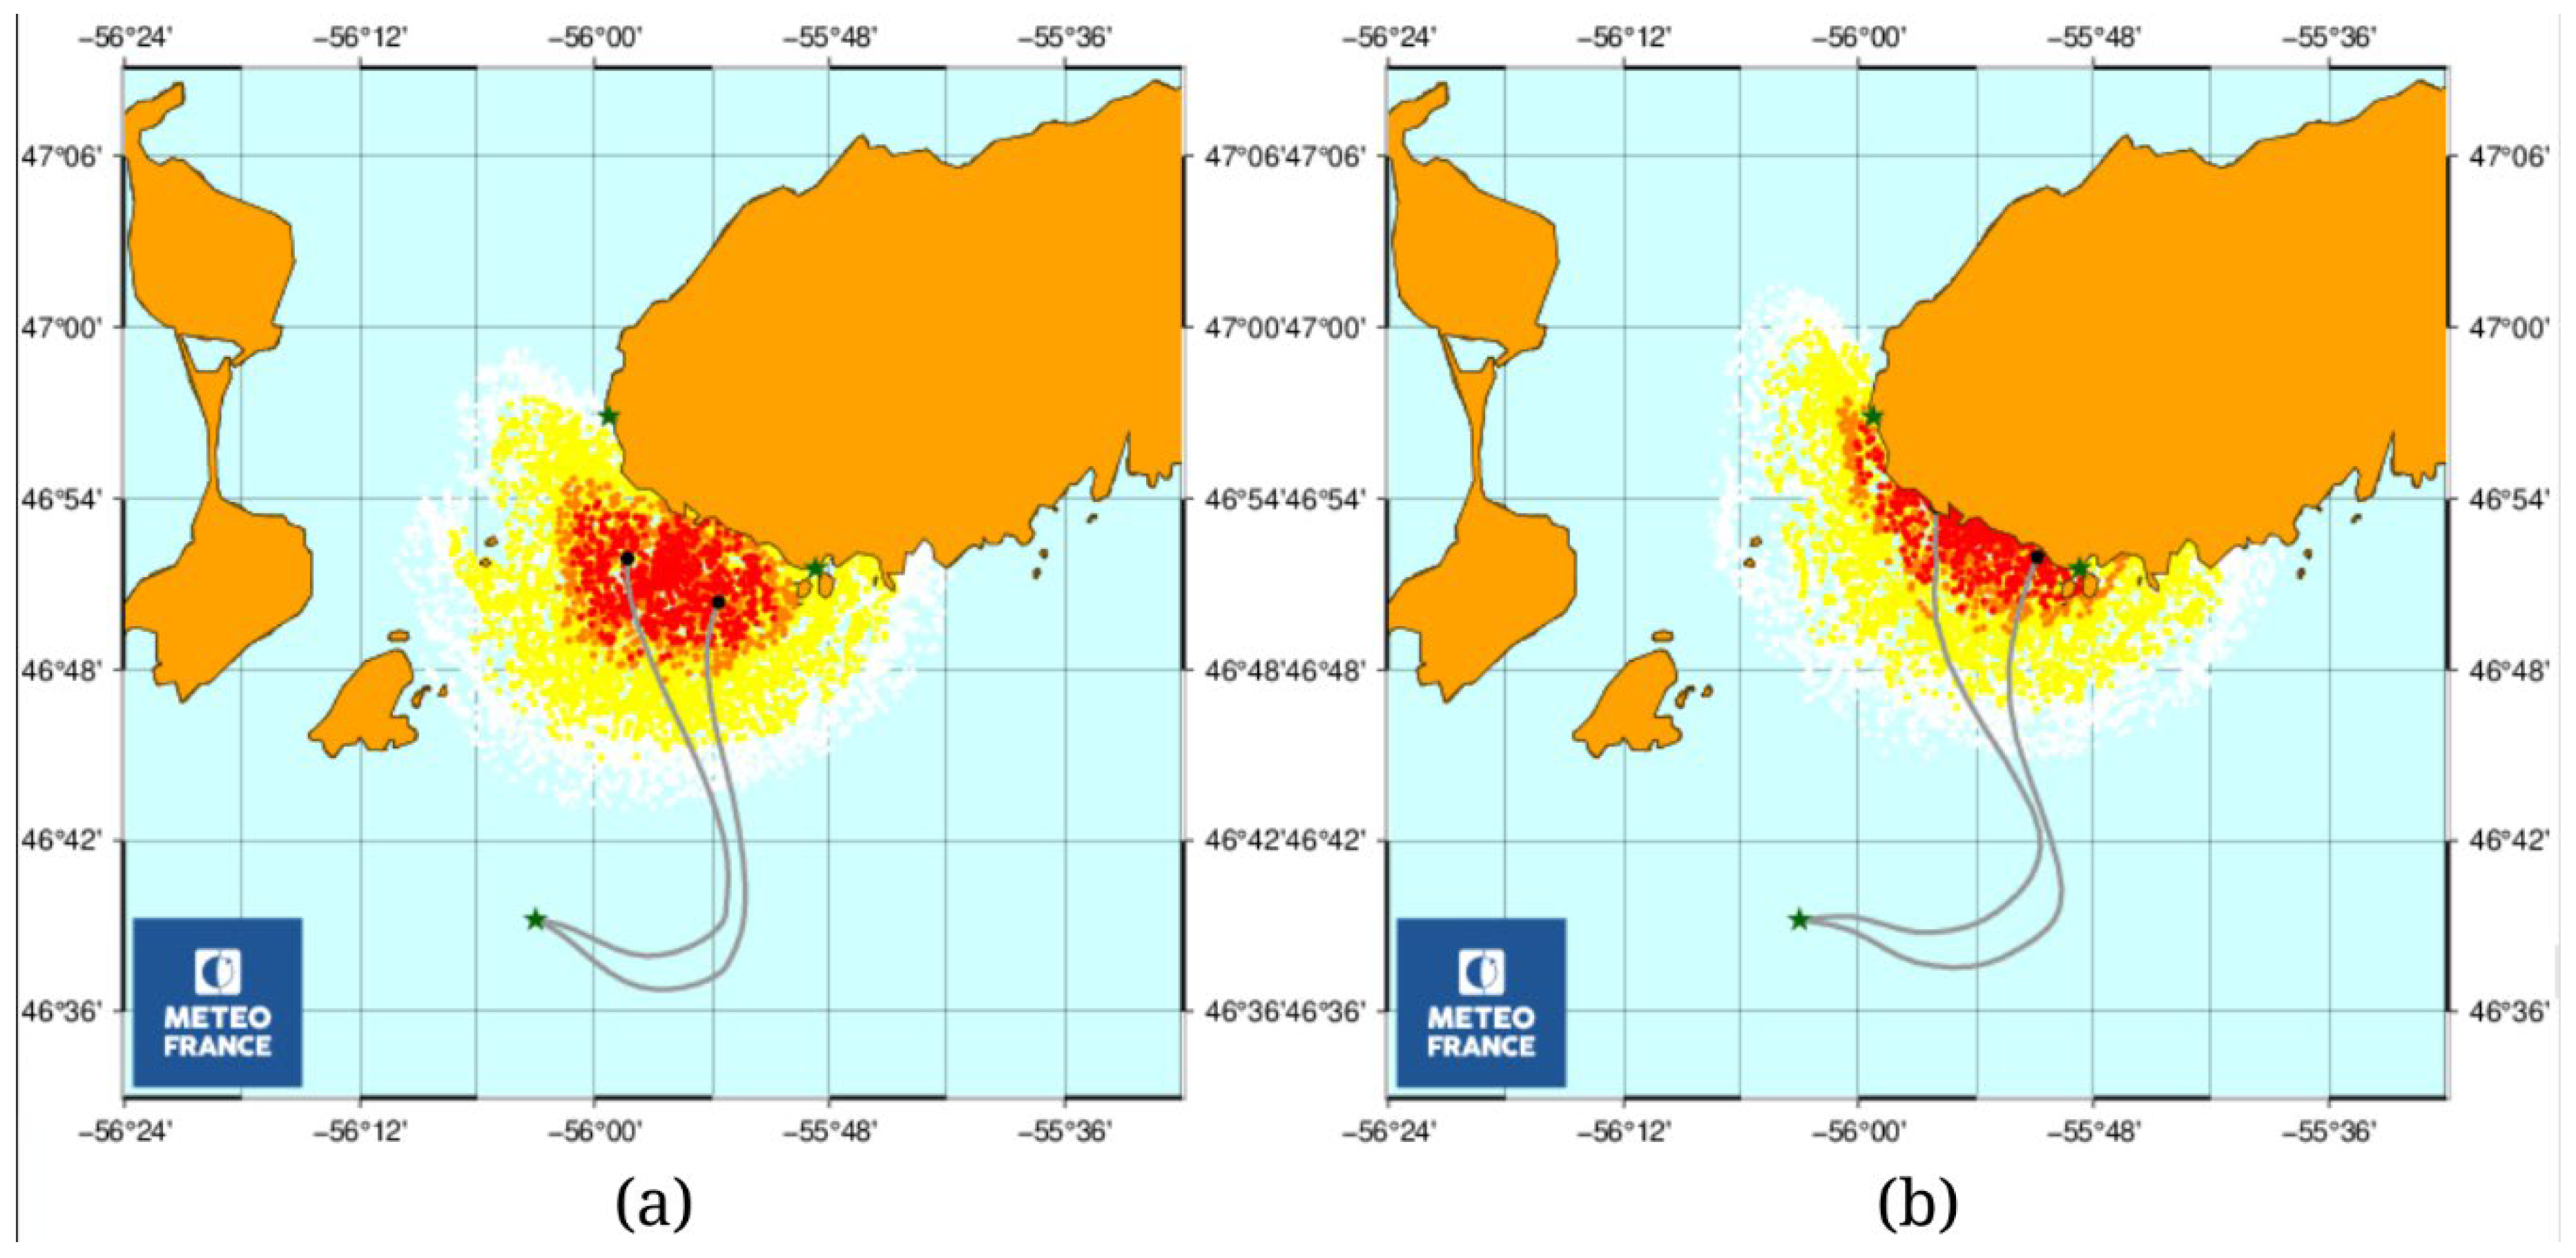
Figure 12.
Probability of debris coming ashore between Point Crewe and Lamaline as a function of time, using ERA-20C forcing (blue) and ERA5 forcing (red).
Figure 12.
Probability of debris coming ashore between Point Crewe and Lamaline as a function of time, using ERA-20C forcing (blue) and ERA5 forcing (red).
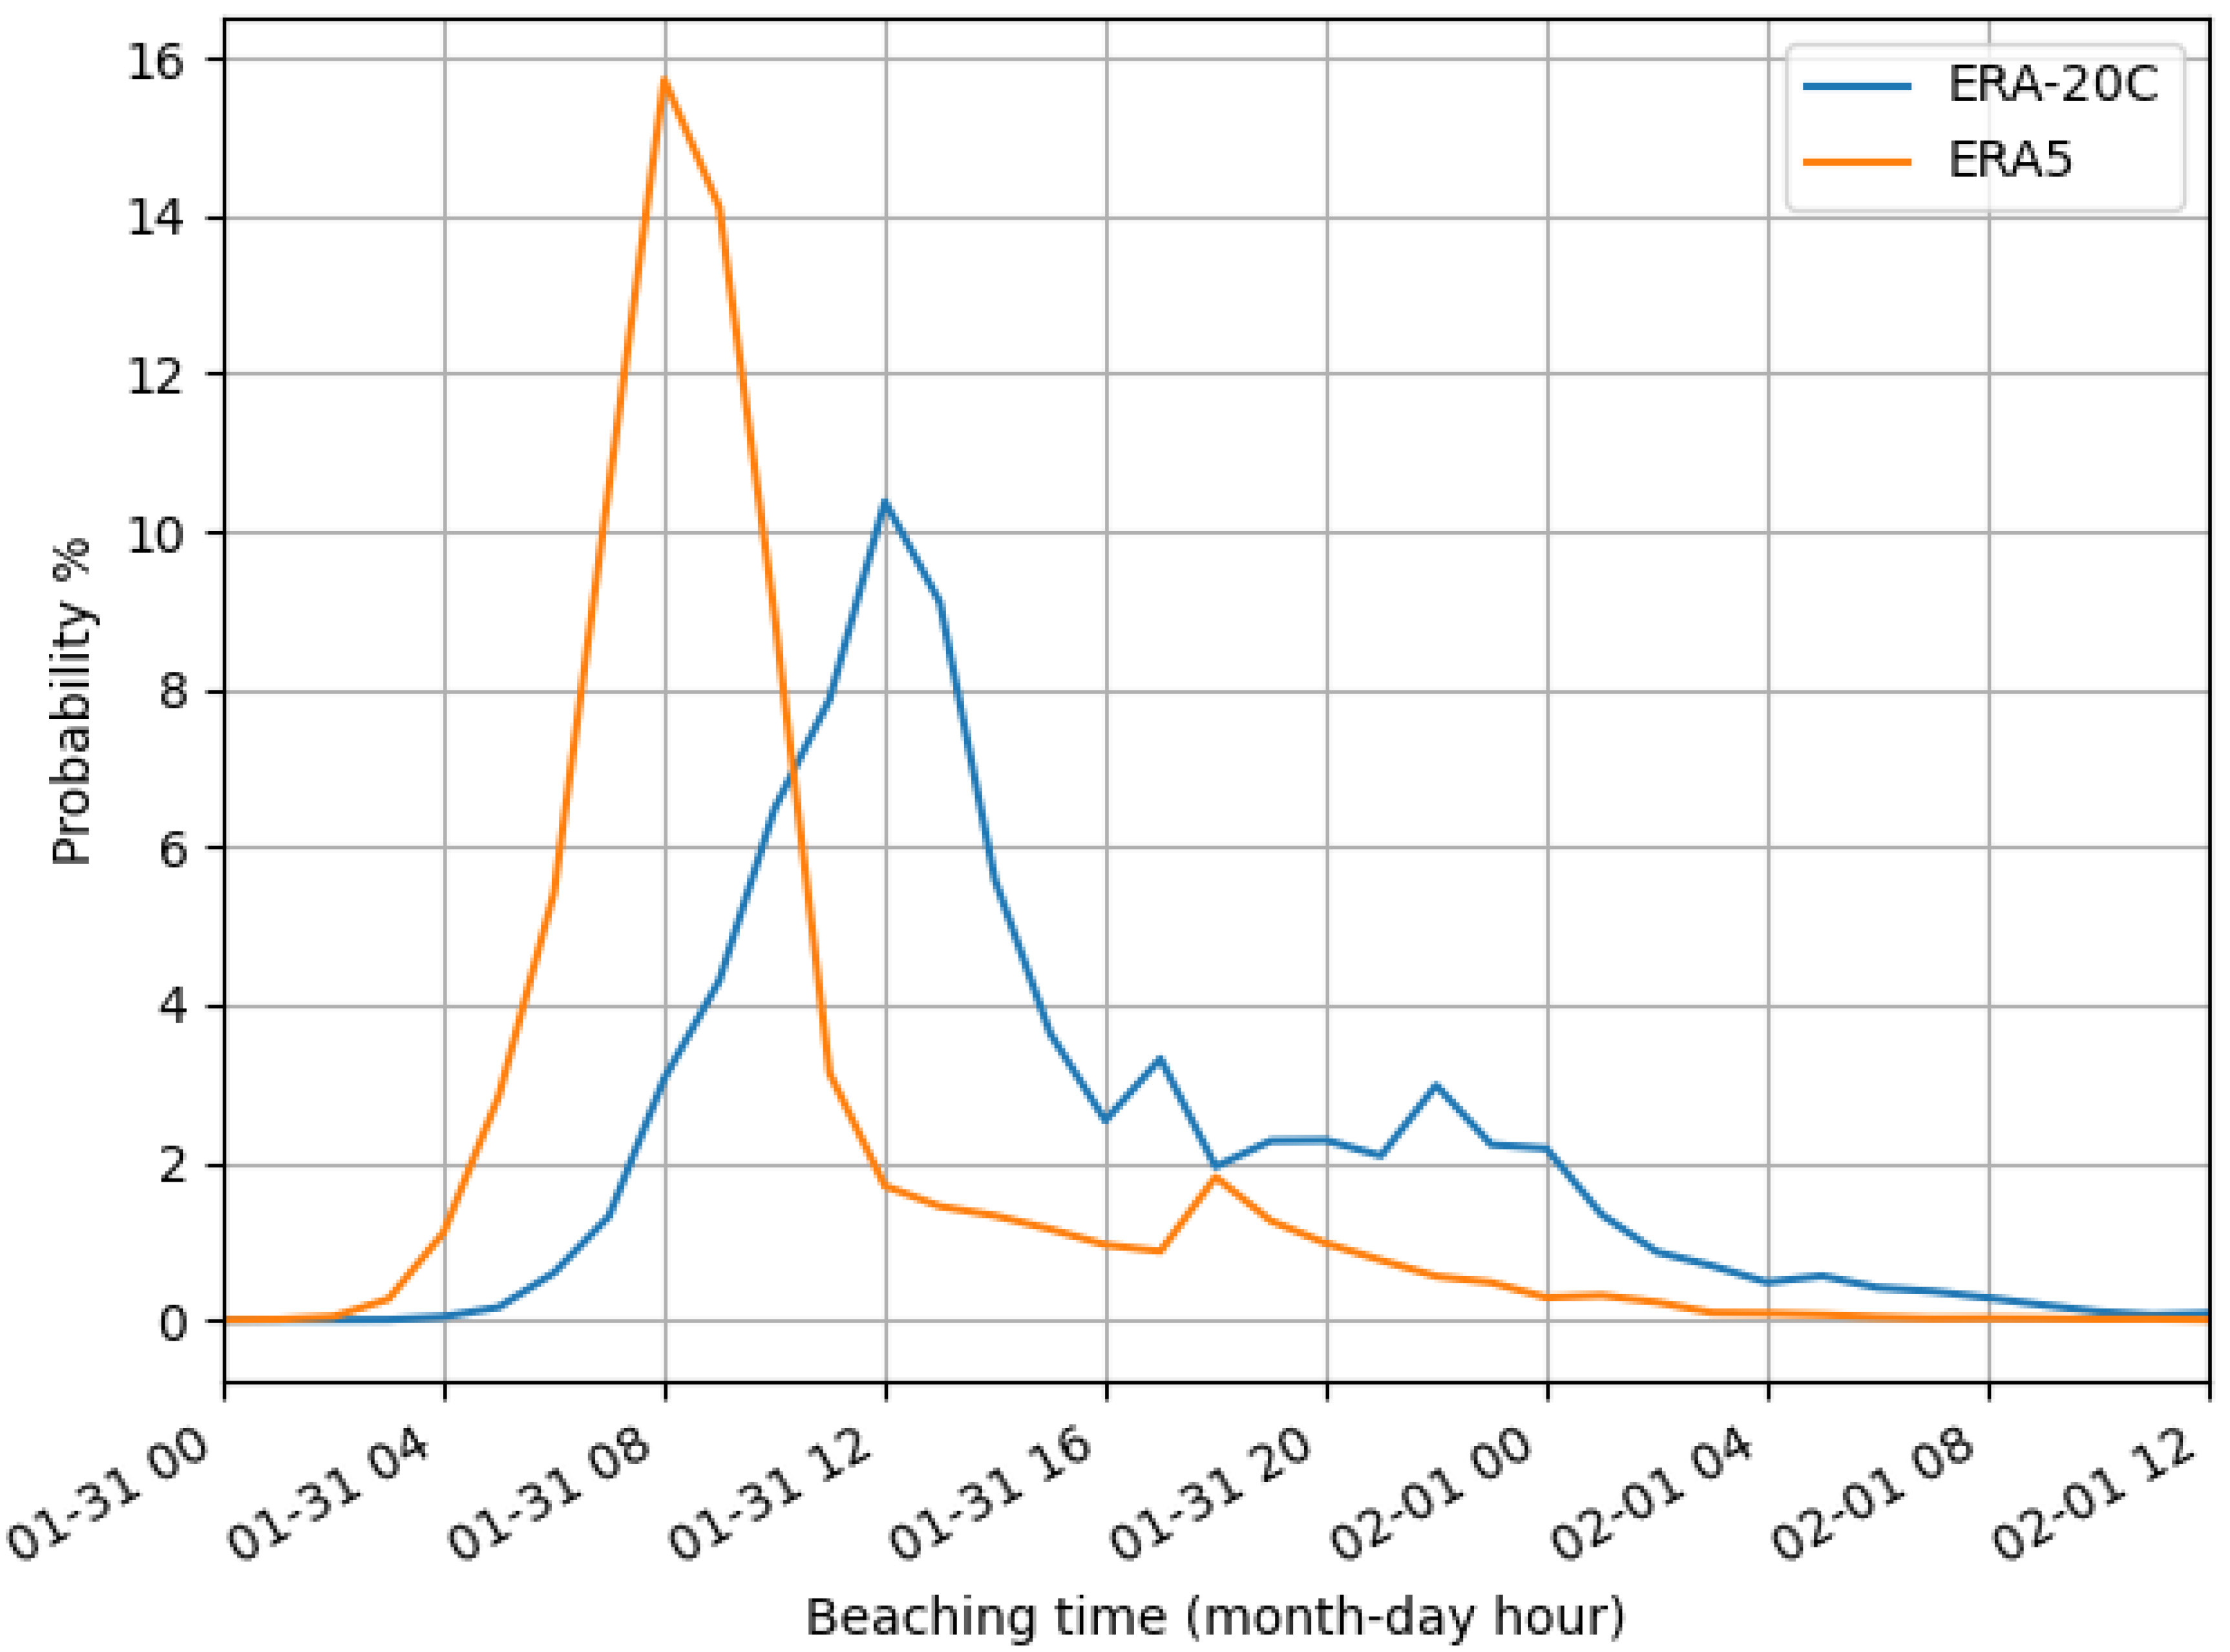
Figure 13.
Backward drift of an upside down fishing vessel from the wreck location (green star), traced back to 09:00 on 29 January, forced with ERA5. The gray trajectories, terminating at black dots, represent drift simulations to the left and right of the wind without changes in tack. The colored regions depict the probabilistic search areas that account for changes in tack: red indicates a 50% probability, red and orange together indicate 66%, red, orange, and yellow indicate 95%, and red, orange, yellow, and white indicate 99%.
Disclaimer/Publisher’s Note: The statements, opinions and data contained in all publications are solely those of the individual author(s) and contributor(s) and not of MDPI and/or the editor(s). MDPI and/or the editor(s) disclaim responsibility for any injury to people or property resulting from any ideas, methods, instructions or products referred to in the content. |
© 2026 by the authors. Licensee MDPI, Basel, Switzerland. This article is an open access article distributed under the terms and conditions of the Creative Commons Attribution (CC BY) license (http://creativecommons.org/licenses/by/4.0/).
Copyright: This open access article is published under a Creative Commons CC BY 4.0 license, which permit the free download, distribution, and reuse, provided that the author and preprint are cited in any reuse.


