Submitted:
30 January 2026
Posted:
03 February 2026
You are already at the latest version
Abstract
Background/Objectives: Subjective cognitive decline (SCD) is an early stage of dementia, although its risk factors remain unclear. We estimated prevalence of SCD and its associated dementia risk factors in Brazilian adults. Methods: Cross-sectional study based on data from the second wave (2019-2021) of The Brazilian Longitudinal Study of Aging (ELSI-Brazil), on a nationally representative sample of adults aged ≥50 years. Prevalence of SCD was estimated, defined as self-reported cognitive decline without objective impairment or dementia diagnosis, and adjusted odds ratios (OR) with 95% confidence intervals (CI) were estimated through logistic regression models. Results: Of 6,631 participants, 57.5% were women, 54.4% individuals of non-white race, with a mean age of 65.1 years (standard deviation: ±9.70). SCD prevalence was 19.7% (95%CI 18.6-20.9) for a total of 1,346 individuals. Significant higher odds of SCD emerged with increasing age (OR=1.57; 95%CI: 1.19-2.09 for the oldest ages; p-value for trend <0.01), non-white race (OR=1.53; 95%CI:1.30-1.79), lower education (OR=2.79; 95%CI: 2.02-3.85 for the lowest compared to the highest level, p for trend <0.01), lower income (OR=1.58; 95%CI:1.14-2.21 for the lowest compared to the highest level; p for trend <0.01), loneliness (OR=1.35; 95%CI:1.15-1.59), and sedentary lifestyle (OR=1.33; 95%CI: 1.13-1.59). SCD was also associated with multimorbidity (OR=1.40; 95%CI:1.06-1.84 for 3+ compared to none chronic diseases), diabetes (OR=1.25; 95% CI: 1.02-1.53), visual loss (OR=1.31; 95% CI:1.11-1.56), hearing loss (OR=2.29; 95% CI:1.93-2.71), and depressive symptoms (OR=1.30; 95%CI:1.05-1.60). Conclusions: Our findings highlight the need for strategies to address early cognitive decline and reduce health inequalities in vulnerable populations.
Keywords:
cognitive decline
; dementia
; risk factors
; middle income country
; Brazil
; observational study
; population-based study
1. Introduction
Cognitive decline is one of the most relevant health concerns in aging populations worldwide [1] and it range from self-perceived conditions, such as the subjective cognitive decline (SCD) [2], to an objective clinical change, including mild cognitive impairment (MCI) or dementia [3].
SCD is defined as a self-reported state of worsening cognitive capacity with normal age-, gender-, and education-adjusted performance on standardized cognitive tests [4]. This condition is confirmed in absence of other psychiatric disorders, such as major depression, which can influence the cognitive domains [4]. SCD is considered an early-stage of cognitive impairment [3], offering a window for prevention. A recent paper from the Framingham Heart Study estimated that individuals with SCD have a 57% higher risk of developing MCI over an average period of 4.6 years, and a nearly threefold higher risk of dementia over 6.8 years, even after adjusting for genetic factors [5]. Those who progress to cognitive disorders seem to have new onset of SCD within 20 years, which becomes more noticeable in the last 4 years before diagnosis. Those who do not progress to cognitive disorders report SCD since younger age with plausibly no worsening over time [6]. New monoclonal therapies underscore the need to define early cognitive trajectories.
In Brazil, around 29% of people aged 50 years and older are estimated to report SCD [7]. Data from several low-, middle- and high-income countries show an average SCD prevalence of almost 24%, with wide variability ranging from 6.1% to 52.7% [8,9]. This heterogeneity may be related to different classification methods or socioeconomic conditions [8]. However, the high prevalence of this condition highlights the need for prevention strategies to counteract its risk factors.
There is ongoing debate in the scientific literature regarding whether modifiable risk factors for dementia are also applicable to SCD [1], and whether some of these factors may play a more prominent role during the initial stages of the natural history of cognitive decline [1]. Indeed, the genetic framework for dementia prevention has still many gaps and modifiable risk factors seem to play a role also in genotypes with an increased risk of dementia development [10]. In addition, the impact of these risk factors may vary according to the social context, either due to the interactions between multilevel social determinants or differences in exposure intensity [1,11]. Therefore, It is essential to broaden the research on SCD beyond high-income regions. In countries like Brazil, factors such as economic instability, ethno-racial disparities, restricted access to formal education, and adverse working conditions can negatively affect cognitive reserve [12]. Understanding SCD risk factors in low- and middle-income countries (LMICs) helps inform public health policies [11]. Despite being an upper-middle-income country, Brazil shows internal disparities between regions [13]. Furthermore, Brazil is experiencing a rapid population aging process compared to countries with a stable demographic pattern [11]. Therefore, the aim of this study is to investigate the prevalence of SCD and its relationship with well-known risk factors for dementia - including sociodemographic, lifestyle and health-related factors - in a nationally representative sample of Brazilian adults.
2. Materials and Methods
Study Design and Study Population
This is a cross-sectional study based on The Brazilian Longitudinal Study of Aging (ELSI-Brazil), a Brazilian cohort study of subjects aged ≥50 years, collecting data in 2015-2016 (wave 1), and 2019-2021 (wave 2). This study is based on data collected in wave 2 on a total sample of 9,949 subjects [14]. The ELSI-Brazil is a nationally representative population-based longitudinal research initiative on human aging throughout Brazil carried out by the Federal University of Minas Gerais and the Oswaldo Cruz Foundation [14]. A multi-stage stratified sampling method ensured representativeness [14]. Sampling included stratified municipalities by size, followed by census and households.
ELSI-Brazil was approved by the Ethics Committee of the Oswaldo Cruz Foundation - Minas Gerais and the process is registered on the Brazil Platform (CAAE: 34649814.3.0000.5091). The participants signed separate informed consent forms for each of the research procedures and authorised access to the corresponding secondary databases [14].
Data Collection
ELSI-Brazil used face-to-face household and individual questionnaires, administered by trained interviews. In particular, the individual questionnaire included modules on sociodemographic characteristics, environment and neighbourhood conditions, discrimination experiences, life and health history, functionality, employment and retirement, family support, behaviours, general health aspects and diseases, and cognitive assessments. Among the medical conditions investigated, cardiovascular, metabolic, musculoskeletal and mental health diseases were assessed through self-reported responses.
Study Variables
The study outcome was the presence of SCD (yes; no), defined as self-perceived cognitive decline without objective cognitive alteration in psychometric tests and without a diagnosis of dementia. In details, SCD was determined based on a combination of two questions: the response “fair” OR “bad” to the question “Currently, how do you classify your memory?” AND the response “same” OR “worse” to the question “Comparing your memory to how it was 2 years ago, how do you think that your current memory is” [15]. To ensure the exclusion of individuals with possible objective cognitive decline, a verbal fluency test was used as an exclusion criterion. The test was based on the number of animal names recalled by the participant during a timed period. Cut-off points were adjusted for education level: <9 for illiterate individuals, <12 for those with 1–3 or 4–7 years of schooling, and <13 for those with 8 or more years of schooling.
Exposures of interest were selected based on known risk factors for dementia as established by Livingston et al. [1], along with sex, age, and ethnicity. In addition, variables were classified into social factors, lifestyle behaviours and health-related factors. Social factors included educational level according to the International Standard Classification of Education (ISCED) Classification[16] comprising four categories: no education (ISCED: 0), primary (ISCED: 1), lower secondary (ISCED: 2), upper secondary (ISCED: 3), tertiary or university degree (ISCED: 4-8). Per capita income was categorized according to the World Bank classification (low, low-mild, upper-mild, high), and loneliness based on self-reported frequency of feeling lonely (never, almost or always). Lifestyle variables included physical activity (sedentary, active) [17], smoking habit (never, former or current smoker), and alcohol abuse (no, yes) based on a consumption of more than 21 units of alcohol per week [17]. According to the World Health Organization’s recommendations [17], individuals were classified as “sedentary” if reporting doing vigorous activities for less than 75 minutes per week or moderate activities for less than 150 minutes per week. Health-related factors were based on self-reported prior medical diagnosis of chronic diseases, and a subset of them, known as risk factors for cognitive decline, were considered. These included hypertension, diabetes, hypercholesterolemia, hearing loss, visual loss, and obesity. Hearing loss was identified as self-reported hearing quality, i.e. answer “bad” or “very bad”, or difficulty listening to ambient sounds. Visual loss was defined as difficulty seeing near or far even with glasses, or a self-reported diagnosis of any eye disease. Obesity was defined as body mass index (BMI) ≥30 kg/m2. For each disease, participants were classified into three categories: i) no diagnosis; ii) diagnosis reported as the only chronic disease; iii) diagnosis reported with at least one additional chronic disease. Furthermore, a variable representing the total number of chronic diseases was created and used as a proxy for multimorbidity. Finally, depressive symptoms were considered, using the Centre for Epidemiological Studies Depression Scale 8-items (CES-D8). Participants were classified in two categories: no (CES-D8 <4) or “yes” (CES-D8 ≥4) [18].
Statistical Analysis
Weighted prevalence of SCD and 95% confidence intervals (CI) was estimated considering the whole study population and strata of sex and age group (i.e. 50-60, 60-79, 80+). Weighted percentages were used to describe the distribution of the variables of interest, overall and according to the study outcome (i.e., SCD). Differences between groups were verified through the chi-squared test for categorical variables or t-test for continuous ones.
To assess and quantify the association between the selected social, lifestyle, and health-related factors and SCD, odds ratios (ORs) and corresponding 95% CI were estimated through adjusted logistic regression models, using the quasi-binomial family to estimate the parameters. Two adjusted models were used: Model 1 adjusted for sex, age, ethnicity, and education level; Model 2 further adjusted for model 1 plus number of chronic diseases, physical activity, and loneliness.
Stratified analyses were performed by sex, age (<median; ≥median) and educational level (“low” combining together the categories no education and primary education; “middle/high” combining lower secondary or higher education levels). Heterogeneity between strata was evaluated by using the likelihood ratio test comparing models with and without the interaction terms between the exposure and stratification variable.
A sensitivity analysis was conducted using an alternative definition of SCD proposed by Borelli et al., excluding from the analysis individuals reporting moderate to severe depressive symptoms (i.e. CES-D8 ≥4). This aimed to verify the consistency of our findings when applying a more restrictive SCD definition that reduce the potential overlap between depressive symptoms and SCD.
In all analyses, a significance level of 5% was admitted minimizing possible type I errors. The data were analysed using the “survey” package from the R® software, version 2024.4.2.
3. Results
The study sample selection is reported in Figure 1. Out of the initial sample of 9,949 individuals: i) 2,319 were excluded due to the presence of cognitive impairment measured by a positive verbal fluency test and/or self-reported medical diagnosis of dementia; ii) 46 were excluded due to missing information on verbal fluency test; iii) 953 were excluded due to missing outcome data. Therefore, the final study sample included 6,631 individuals.
Table 1 gives the weighted prevalence and 95% CI of SCD overall, by sex and age group. Overall SCD prevalence was 19.7 (95% CI: 18.6-20.9), and this prevalence increased by age (28.8%; 95% CI: 24.6-33.0 at age 80+).
Table 2 gives the distribution of selected characteristics and potential associated factors in the study population, overall and by outcome. Overall, approximately 58% (n=3,864) of the whole study population were women, 54.4% (n=3,600) were of non-white race, and the average age was 65.1 years (standard deviation, SD: ±9.70 years). Individuals with SCD, compared to those without SCD, were more frequently older, of white race, and had lower educational and income levels. They also more frequently reported loneliness and a sedentary lifestyle. Regarding health-related factors, participants with SCD more often reported multimorbidity. Specifically, higher percentages of hypertension, diabetes, hypercholesterolemia, visual and hearing loss, as well as moderate to severe depressive symptoms were observed among participants with SCD. The distribution of each chronic disease in the whole study sample is shown in the Supplementary Figure S1.
Table 3 reports the ORs and corresponding 95% CI estimated from Model 1 and Model 2, and Supplementary Figure S2 summarised ORs from the Model 2 for variables significantly associated with SCD. Estimates from Model 2 indicated positive associations with SCD at increasing age (OR=1.57; 95% CI: 1.19-2.09 for the 80+ compared to the 50-60 age group), showing a significant linear trend (p-value for trend <0.01), as well as for non-white compared to white race (OR=1.53; 95% IC:1.30-1.79). Higher odds of SCD were also reported with decreasing education levels (OR=2.79 95% CI: 2.02-3.85 for the lowest compared to the highest level; p-value for trend <0.01), and decreasing income levels (OR=1.58; 95% CI: 1.14-2.21 for the lowest compared to the highest level; p-value for trend <0.01). Significant associations with SCD were also observed for loneliness (OR of 1.35; 95% CI: 1.15-1.59), and a sedentary lifestyle (OR=1.33; 95% CI:1.13-1.57). Among health-related factors, significant higher odds of SCD were reported for multimorbidity (OR= 1.40; 95% CI: 1.06-1.84 for 3+ compared to none chronic diseases), as well as for the following chronic diseases in the presence of comorbidities: diabetes (OR= 1.25; 95% CI: 1.02-1.53), visual loss (OR= 1.31; 95% CI: 1.11-1.56), and hearing loss (OR= 2.29; 95% CI: 1.93-2.71). Similarly, depressive symptoms were also significantly associated with higher odds of SCD, with an OR of 1.30 (95% CI: 1.05-1.60).
The results from stratified analyses by sex, age and education level are reported in Supplementary Table S1, however no significant heterogeneity was found.
Finally, the sensitivity analysis excluding individuals with moderate to severe depressive symptoms showed results consistent with those of the main analysis, except for hypertension and diabetes which were no longer associated (Supplementary Table S2).
4. Discussion
Our study, based on a large nationally representative sample of Brazilians aged 50 and older, estimated a SCD prevalence of 19.7% (95% CI: 18.6-20.9) in 2019-2021. Higher odds of SCD were observed with older age, non-white ethnicity, lower levels of education, lower income, loneliness, and sedentary lifestyle. Associations with higher odds of SCD were also observed with multimorbidity, as well as with specific chronic diseases - including diabetes, visual loss, hearing loss, depressive symptoms. No significant heterogeneity was found in the stratified analyses across sex, age group, and education variables, and findings remained consistent when applying an alternative outcome classification.
Prevalence of SCD in Brazil, affecting approximately one fifth of individuals aged 50 or more years, resulted almost 10% lower than in the first wave [7]. However, this prevalence should be interpreted taking into consideration of the exclusions applied in our study population. Indeed, an amount of individuals were excluded due to objective cognitive impairment identified by verbal fluent test or reported depression diagnosis, i.e. factors that may have been influenced by the COVID-19 pandemic. Notably, similar findings were observed in a Swiss population-based study, where SCD prevalence remained stable before and during the pandemic, despite increased mental health concerns and social isolation [9]. When compared with international estimates, the Brazilian SCD prevalence results comparable with the average in high-income countries [3,5].
While age is biologically expected to increase vulnerability to cognitive decline, our findings indicate that non-white individuals are often positively associated with SCD. This is in line with evidence from the United States showing ethnicity disparities in cognitive health outcomes [19]. These results highlight how structural inequities affect early cognitive impairment.
Among the known risk factors for dementia, educational level is considered one of the earliest in the life course [1] and among the most impactful [20]. Early-life education affects cognitive function in old age [21]. In addition to be a strong predictor of dementia, education also influences progression from SCD to MCI [22]. The association between lower education and SCD supports the need for public policies promoting early-life education to enhance cognitive reserve [22]. It is on this concept of cognitive reserve that public policies to promote the broad and prolonged education of young people in LMICs should be based.
Economic [11] and family contexts [23,24] may influence cognitive decline risk. However, this relationship does not appear to be direct between income and cognitive decline. Instead, income may play a role in shaping individual's functionality, facilitating or obstructing access to cognitive capacity developers, and modulating the chance of developing SCD [23]. Income was consistently associated with SCD across education and age, suggesting a link to cognitive decline before dementia onset [23].
Social isolation, typical of advancing ages, differs from loneliness [25]. Loneliness reflects perceived inadequacy of social networks [25]. Both social isolation and loneliness are linked to cognitive decline, with loneliness possibly mediated by depression [25]. Loneliness was linked to SCD even without depression diagnosis or symptoms, likely suggesting a distinct mediation mechanism in SCD [25].
It was estimated the effect of regular physical activity on SCD incidence in American adults, identifying running, weight lifting and aerobic exercises practiced from 240 minutes per week as sufficient to mitigate the onset of SCD, providing support for a potential causal relationship between physical activity and cognitive function [26]. Our findings support regular physical activity as a preventive factor for cognitive decline [26,27]. However, evidences suggest that the relationship between sedentary behaviour and SCD is mediated by depression [28], a pathway that could not be evaluated in the present study, as individuals with a confirmed diagnosis of depression were excluded from the SCD group.
Clinically, conditions like hypertension, diabetes, and visual loss are related to dementia [1]. However, there is disagreement about the relationship between SCD and various clinical conditions [29]. Multimorbidity is increasingly recognised as a clinical factor associated with SCD [28], especially in LMICs [30]. In this study, apart from hearing loss, no isolated association was found between dementia risk factors and SCD, such as hypertension, diabetes, hypercholesterolemia, obesity, depressive symptoms and visual loss. On the other hand, multimorbidity with three or more chronic diseases was associated with SCD. Multimorbidity leads to physical issues and poor self-care (e.g., polypharmacy), thus affecting cognition [27]. These aspects highlight the importance of identifying and monitoring multimorbidity among older individuals.
There is strong evidence that both subjective or objective hearing loss increase the incidence of SCD in high income countries [31]. Hearing loss mirrors brain changes associated with cognition and varies by severity [31]. Based on our findings, hearing loss was associated to SCD, indicating that hearing loss, as a modifiable factor for cognitive decline, requires specific preventive actions regardless of whether it is accompanied by organic or functional impediments [31]. This is crucial in LMICs, where low education and economic barriers limit access to hearing care.
This study has both strengths and limitations. Among the strengths, first, it uses ELSI-Brazil data from a large, representative sample of Brazilians aged 50+, ensuring generalizability. Second, data collection was conducted using standardized and harmonized instruments, aligned with International longitudinal ageing studies, ensuring comparability across countries. Third, ELSI-Brazil provides detailed individual-level data on multiple dimensions (i.e., sociodemographic, psychosocial, and clinical factors), enabling adjustment for known dementia risk factors.
Besides these strengths, some limitations should be taken into account when interpreting the results. First, due to the cross-sectional design, reverse causality cannot be ruled out, especially for more proximal factors in the natural history of cognitive decline, such as physical activity, which may be a consequence rather a cause of the outcome. In addition, the cross-sectional design limits the ability to distinguish between mediating and direct effects of the investigated factors on SCD. Another limitation is that ELSI-Brazil wave 2 data were collected during the COVID-19 pandemic, possibly affecting cognition and mental health. Lastly, like most population-based studies, self-reported data may introduce recall bias or misclassification.
5. Conclusions
Several dementia risk factors are associated with SCD in Brazil, including older age, non-white ethnicity, low educational level, low income, loneliness, sedentary, multimorbidity, and hearing loss. Other conditions, such as hypertension, diabetes and depressive symptoms, were not independently related to SCD. These population-based findings have important public health implications. SCD is associated with a multidimensional pattern of risk factors influenced by socio-economic context, behavioural and health factors. Public health action should focus on vulnerable populations. Future research should examine cognitive trajectories from SCD to MCI and dementia. These results will strengthen preventive interventions and foster the case finding strategies for pre-clinical Alzheimer’s Diseases and eligible individuals for the new therapies with anti-amyloid antibodies.
Supplementary Materials
The following supporting information can be downloaded at: https://www.mdpi.com/article/doi/s1, Supplementary Table S1: Estimates of associations (OR and 95% CI from stratified Model 2) between SCD and social, lifestyle and health-related factors, in subgroups of sex, age (below or above median) and education level; Supplementary Table S2: Results from sensitivity analysis (N = 5,285): estimates of associations (OR and 95% CI) between the presence of SCD and demographic, social, lifestyle and health-related factors. ELSI-Brazil, wave 2 – 2019-2021; Supplementary Figure S1: Percentages distribution of chronic diseases in the sample of participants; Supplementary Figure S2: Summary of the odds ratios (OR) and corresponding 95% confidence intervals (CI) resulted statistically significant from Model 2.
Author Contributions
JML, PB and AO conceived the study design and objectives. JML had full access to the data and performed the statistical analyses. JML and PB drafted the manuscript. LB and RV contributed to data interpretation and critical manuscript revision. PB and AO provided methodological guidance. AO supervised all stages of the project. All authors approved the final version of the manuscript.
Funding
This research was funded by FUNDAÇÃO DE AMPARO À PESQUISA DO ESTADO DA BAHIA (FAPESB) – Grant 4819/2024, and by EU funding within the NextGenerationEU-MUR PRIN PNRR 2022 (Project no. F53D23011590001, DOUBTS).
Informed Consent Statement
This study was approved by the Ethics Committee of the Oswaldo Cruz Foundation – Minas Gerais (CAAE: 34649814.3.0000.5091). All participants provided informed consent for data collection.
Data Availability Statement
Data are available upon reasonable request from the first author, Dr. Johnnatas Mikael Lopes.
Conflicts of Interest
The authors declare no conflicts of interest.
Abbreviations
The following abbreviations are used in this manuscript:
| BMI | Body Mass Index |
| CES-D | Centre for Epidemiological Studies Depression Scale |
| CIs | Confidence Intervals |
| ELSI-Brazil | The Brazilian Longitudinal Study of Aging |
| ISCED | International Standard Classification of Education |
| LMICs | Low- And Middle-Income Countries |
| MCI | Mild Cognitive Impairment |
| ORs | Odds Ratios |
| SCD | Subjective Cognitive Decline |
References
- Dementia Prevention, Intervention, and Care: 2024 Report of the Lancet Standing Commission - The Lancet. Available online: https://www.thelancet.com/journals/lancet/article/PIIS0140-6736(24)01296-0/fulltext (accessed on 29 May 2025).
- Jessen, F.; Amariglio, R.E.; van Boxtel, M.; Breteler, M.; Ceccaldi, M.; Chételat, G.; Dubois, B.; Dufouil, C.; Ellis, K.A.; van der Flier, W.M.; et al. A Conceptual Framework for Research on Subjective Cognitive Decline in Preclinical Alzheimer’s Disease. Alzheimers Dement 2014, 10, 844–852. [Google Scholar] [CrossRef]
- Jessen, F.; Wolfsgruber, S.; Kleineindam, L.; Spottke, A.; Altenstein, S.; Bartels, C.; Berger, M.; Brosseron, F.; Daamen, M.; Dichgans, M.; et al. Subjective Cognitive Decline and Stage 2 of Alzheimer Disease in Patients from Memory Centers. Alzheimers Dement 2023, 19, 487–497. [Google Scholar] [CrossRef]
- Molinuevo, J.L.; Rabin, L.A.; Amariglio, R.; Buckley, R.; Dubois, B.; Ellis, K.A.; Ewers, M.; Hampel, H.; Klöppel, S.; Rami, L.; et al. Implementation of Subjective Cognitive Decline Criteria in Research Studies. Alzheimers Dement 2017, 13, 296–311. [Google Scholar] [CrossRef]
- Kang, M.; Li, C.; Mahajan, A.; Spat-Lemus, J.; Durape, S.; Chen, J.; Gurnani, A.S.; Devine, S.; Auerbach, S.H.; Ang, T.F.A.; et al. Subjective Cognitive Decline Plus and Longitudinal Assessment and Risk for Cognitive Impairment. JAMA Psychiatry 2024, 81, 993–1002. [Google Scholar] [CrossRef] [PubMed]
- Liew, T.M. Distinct Trajectories of Subjective Cognitive Decline before Diagnosis of Neurocognitive Disorders: Longitudinal Modelling over 18 Years. The Journal of Prevention of Alzheimer’s Disease 2025, 12, 100123. [Google Scholar] [CrossRef] [PubMed]
- Borelli, W.V.; Zimmer, E.R.; Bieger, A.; Coelho, B.; Pascoal, T.A.; Chaves, M.L.F.; Amariglio, R.; Castilhos, R.M. Subjective Cognitive Decline in Brazil: Prevalence and Association with Dementia Modifiable Risk Factors in a Population-Based Study. Alzheimers Dement (Amst) 2022, 14, e12368. [Google Scholar] [CrossRef] [PubMed]
- Röhr, S.; Pabst, A.; Riedel-Heller, S.G.; Jessen, F.; Turana, Y.; Handajani, Y.S.; Brayne, C.; Matthews, F.E.; Stephan, B.C.M.; Lipton, R.B.; et al. Estimating Prevalence of Subjective Cognitive Decline in and across International Cohort Studies of Aging: A COSMIC Study. Alzheimers Res Ther 2020, 12, 167. [Google Scholar] [CrossRef]
- Schrempft, S.; Baysson, H.; Graindorge, C.; Pullen, N.; Hagose, M.; Zaballa, M.-E.; Preisig, M.; Nehme, M.; Guessous, I.; Stringhini, S.; et al. Biopsychosocial Risk Factors for Subjective Cognitive Decline among Older Adults during the COVID-19 Pandemic: A Population-Based Study. Public Health 2024, 234, 16–23. [Google Scholar] [CrossRef]
- Marino, C.; Malotaux, V.; Giudicessi, A.; Aguillon, D.; Sepulveda-Falla, D.; Lopera, F.; Quiroz, Y.T. Protective Genetic Variants against Alzheimer’s Disease. The Lancet Neurology 2025, 24, 524–534. [Google Scholar] [CrossRef]
- Borelli, W.V.; Leotti, V.B.; Strelow, M.Z.; Chaves, M.L.F.; Castilhos, R.M. Preventable Risk Factors of Dementia: Population Attributable Fractions in a Brazilian Population-Based Study. Lancet Reg Health Am 2022, 11, 100256. [Google Scholar] [CrossRef]
- Seyedsalehi, A.; Warrier, V.; Bethlehem, R.A.I.; Perry, B.I.; Burgess, S.; Murray, G.K. Educational Attainment, Structural Brain Reserve and Alzheimer’s Disease: A Mendelian Randomization Analysis. Brain 2023, 146, 2059–2074. [Google Scholar] [CrossRef]
- Síntese de Indicadores Sociais | IBGE. Available online: https://www.ibge.gov.br/estatisticas/sociais/saude/9221-sintese-de-indicadores-sociais.html (accessed on 29 May 2025).
- Lima-Costa, M.F.; de Melo Mambrini, J.V.; Bof de Andrade, F.; de Souza, P.R.B.; de Vasconcellos, M.T.L.; Neri, A.L.; Castro-Costa, E.; Macinko, J.; de Oliveira, C. Cohort Profile: The Brazilian Longitudinal Study of Ageing (ELSI-Brazil). Int J Epidemiol 2023, 52, e57–e65. [Google Scholar] [CrossRef]
- Jessen, F.; Amariglio, R.E.; Buckley, R.F.; van der Flier, W.M.; Han, Y.; Molinuevo, J.L.; Rabin, L.; Rentz, D.M.; Rodriguez-Gomez, O.; Saykin, A.J.; et al. The Characterisation of Subjective Cognitive Decline. Lancet Neurol 2020, 19, 271–278. [Google Scholar] [CrossRef]
- The International Standard Classification of Education (ISCED). Prospects 1975, 5, 283–284. [CrossRef]
- Bull, F.C.; Al-Ansari, S.S.; Biddle, S.; Borodulin, K.; Buman, M.P.; Cardon, G.; Carty, C.; Chaput, J.-P.; Chastin, S.; Chou, R.; et al. World Health Organization 2020 Guidelines on Physical Activity and Sedentary Behaviour. Br J Sports Med 2020, 54, 1451–1462. [Google Scholar] [CrossRef] [PubMed]
- Park, S.-H.; Yu, H.Y. How Useful Is the Center for Epidemiologic Studies Depression Scale in Screening for Depression in Adults? An Updated Systematic Review and Meta-Analysis✰. Psychiatry Res 2021, 302, 114037. [Google Scholar] [CrossRef]
- Gupta, S. Racial and Ethnic Disparities in Subjective Cognitive Decline: A Closer Look, United States, 2015-2018. BMC Public Health 2021, 21, 1173. [Google Scholar] [CrossRef]
- An, R.; Gao, Y.; Huang, X.; Yang, Y.; Yang, C.; Wan, Q. Predictors of Progression from Subjective Cognitive Decline to Objective Cognitive Impairment: A Systematic Review and Meta-Analysis of Longitudinal Studies. Int J Nurs Stud 2024, 149, 104629. [Google Scholar] [CrossRef]
- Breit, M.; Scherrer, V.; Tucker-Drob, E.M.; Preckel, F. The Stability of Cognitive Abilities: A Meta-Analytic Review of Longitudinal Studies. Psychol Bull 2024, 150, 399–439. [Google Scholar] [CrossRef] [PubMed]
- Kim, Y.; Stern, Y.; Seo, S.W.; Na, D.L.; Jang, J.-W.; Jang, H. Cognitive Reserve Research Group of Korea Dementia Association Factors Associated with Cognitive Reserve According to Education Level. Alzheimers Dement 2024, 20, 7686–7697. [Google Scholar] [CrossRef] [PubMed]
- Wang, A.-Y.; Hu, H.-Y.; Ou, Y.-N.; Wang, Z.-T.; Ma, Y.-H.; Tan, L.; Yu, J.-T. Socioeconomic Status and Risks of Cognitive Impairment and Dementia: A Systematic Review and Meta-Analysis of 39 Prospective Studies. J Prev Alzheimers Dis 2023, 10, 83–94. [Google Scholar] [CrossRef]
- Iskandar, M.; Martindale, J.; Bynum, J.P.W.; Davis, M.A. Association between Family Household Income and Cognitive Resilience among Older US Adults: A Cross-Sectional Study. J Prev Alzheimers Dis 2024, 11, 1406–1409. [Google Scholar] [CrossRef] [PubMed]
- Pecchinenda, A.; Yankouskaya, A.; Boccia, M.; Piccardi, L.; Guariglia, C.; Giannini, A.M. Exploring the Relationship between Perceived Loneliness and Subjective Cognitive Decline in Older Individuals. Aging Ment Health 2024, 28, 73–82. [Google Scholar] [CrossRef] [PubMed]
- Xu, P.; Zhang, F.; Cheng, J.; Huang, Y.; Ren, Z.; Ye, R.; Fan, J.; Li, L.; Gao, Y. The Relationship between Physical Activity and Subjective Cognitive Decline: Evidence from the Behavioral Risk Factor Surveillance System (BRFSS). J Affect Disord 2023, 328, 108–115. [Google Scholar] [CrossRef]
- Liu, Y.; Jiang, D. Multimorbidity Patterns in US Adults with Subjective Cognitive Decline and Their Relationship with Functional Difficulties. J Aging Health 2022, 34, 929–938. [Google Scholar] [CrossRef]
- Omura, J.D.; Brown, D.R.; McGuire, L.C.; Taylor, C.A.; Fulton, J.E.; Carlson, S.A. Cross-Sectional Association between Physical Activity Level and Subjective Cognitive Decline among US Adults Aged ≥45 Years, 2015. Prev Med 2020, 141, 106279. [Google Scholar] [CrossRef] [PubMed]
- de Havenon, A.; Stulberg, E.L.; Littig, L.; Wong, K.-H.; Sarpong, D.; Li, V.; Sharma, R.; Falcone, G.J.; Williamson, J.D.; Pajewski, N.M.; et al. Socioeconomic and Medical Determinants of State-Level Subjective Cognitive Decline in the United States. Alzheimers Dement 2024, 20, 7567–7579. [Google Scholar] [CrossRef]
- Koyanagi, A.; Smith, L.; Shin, J.I.; Oh, H.; Kostev, K.; Jacob, L.; Abduljabbar, A.S.; Haro, J.M. Multimorbidity and Subjective Cognitive Complaints: Findings from 48 Low- and Middle-Income Countries of the World Health Survey 2002-2004. J Alzheimers Dis 2021, 81, 1737–1747. [Google Scholar] [CrossRef]
- Curhan, S.G.; Willett, W.C.; Grodstein, F.; Curhan, G.C. Longitudinal Study of Hearing Loss and Subjective Cognitive Function Decline in Men. Alzheimers Dement 2019, 15, 525–533. [Google Scholar] [CrossRef]
Figure 1.
Flow chart of the study participants’ selection.
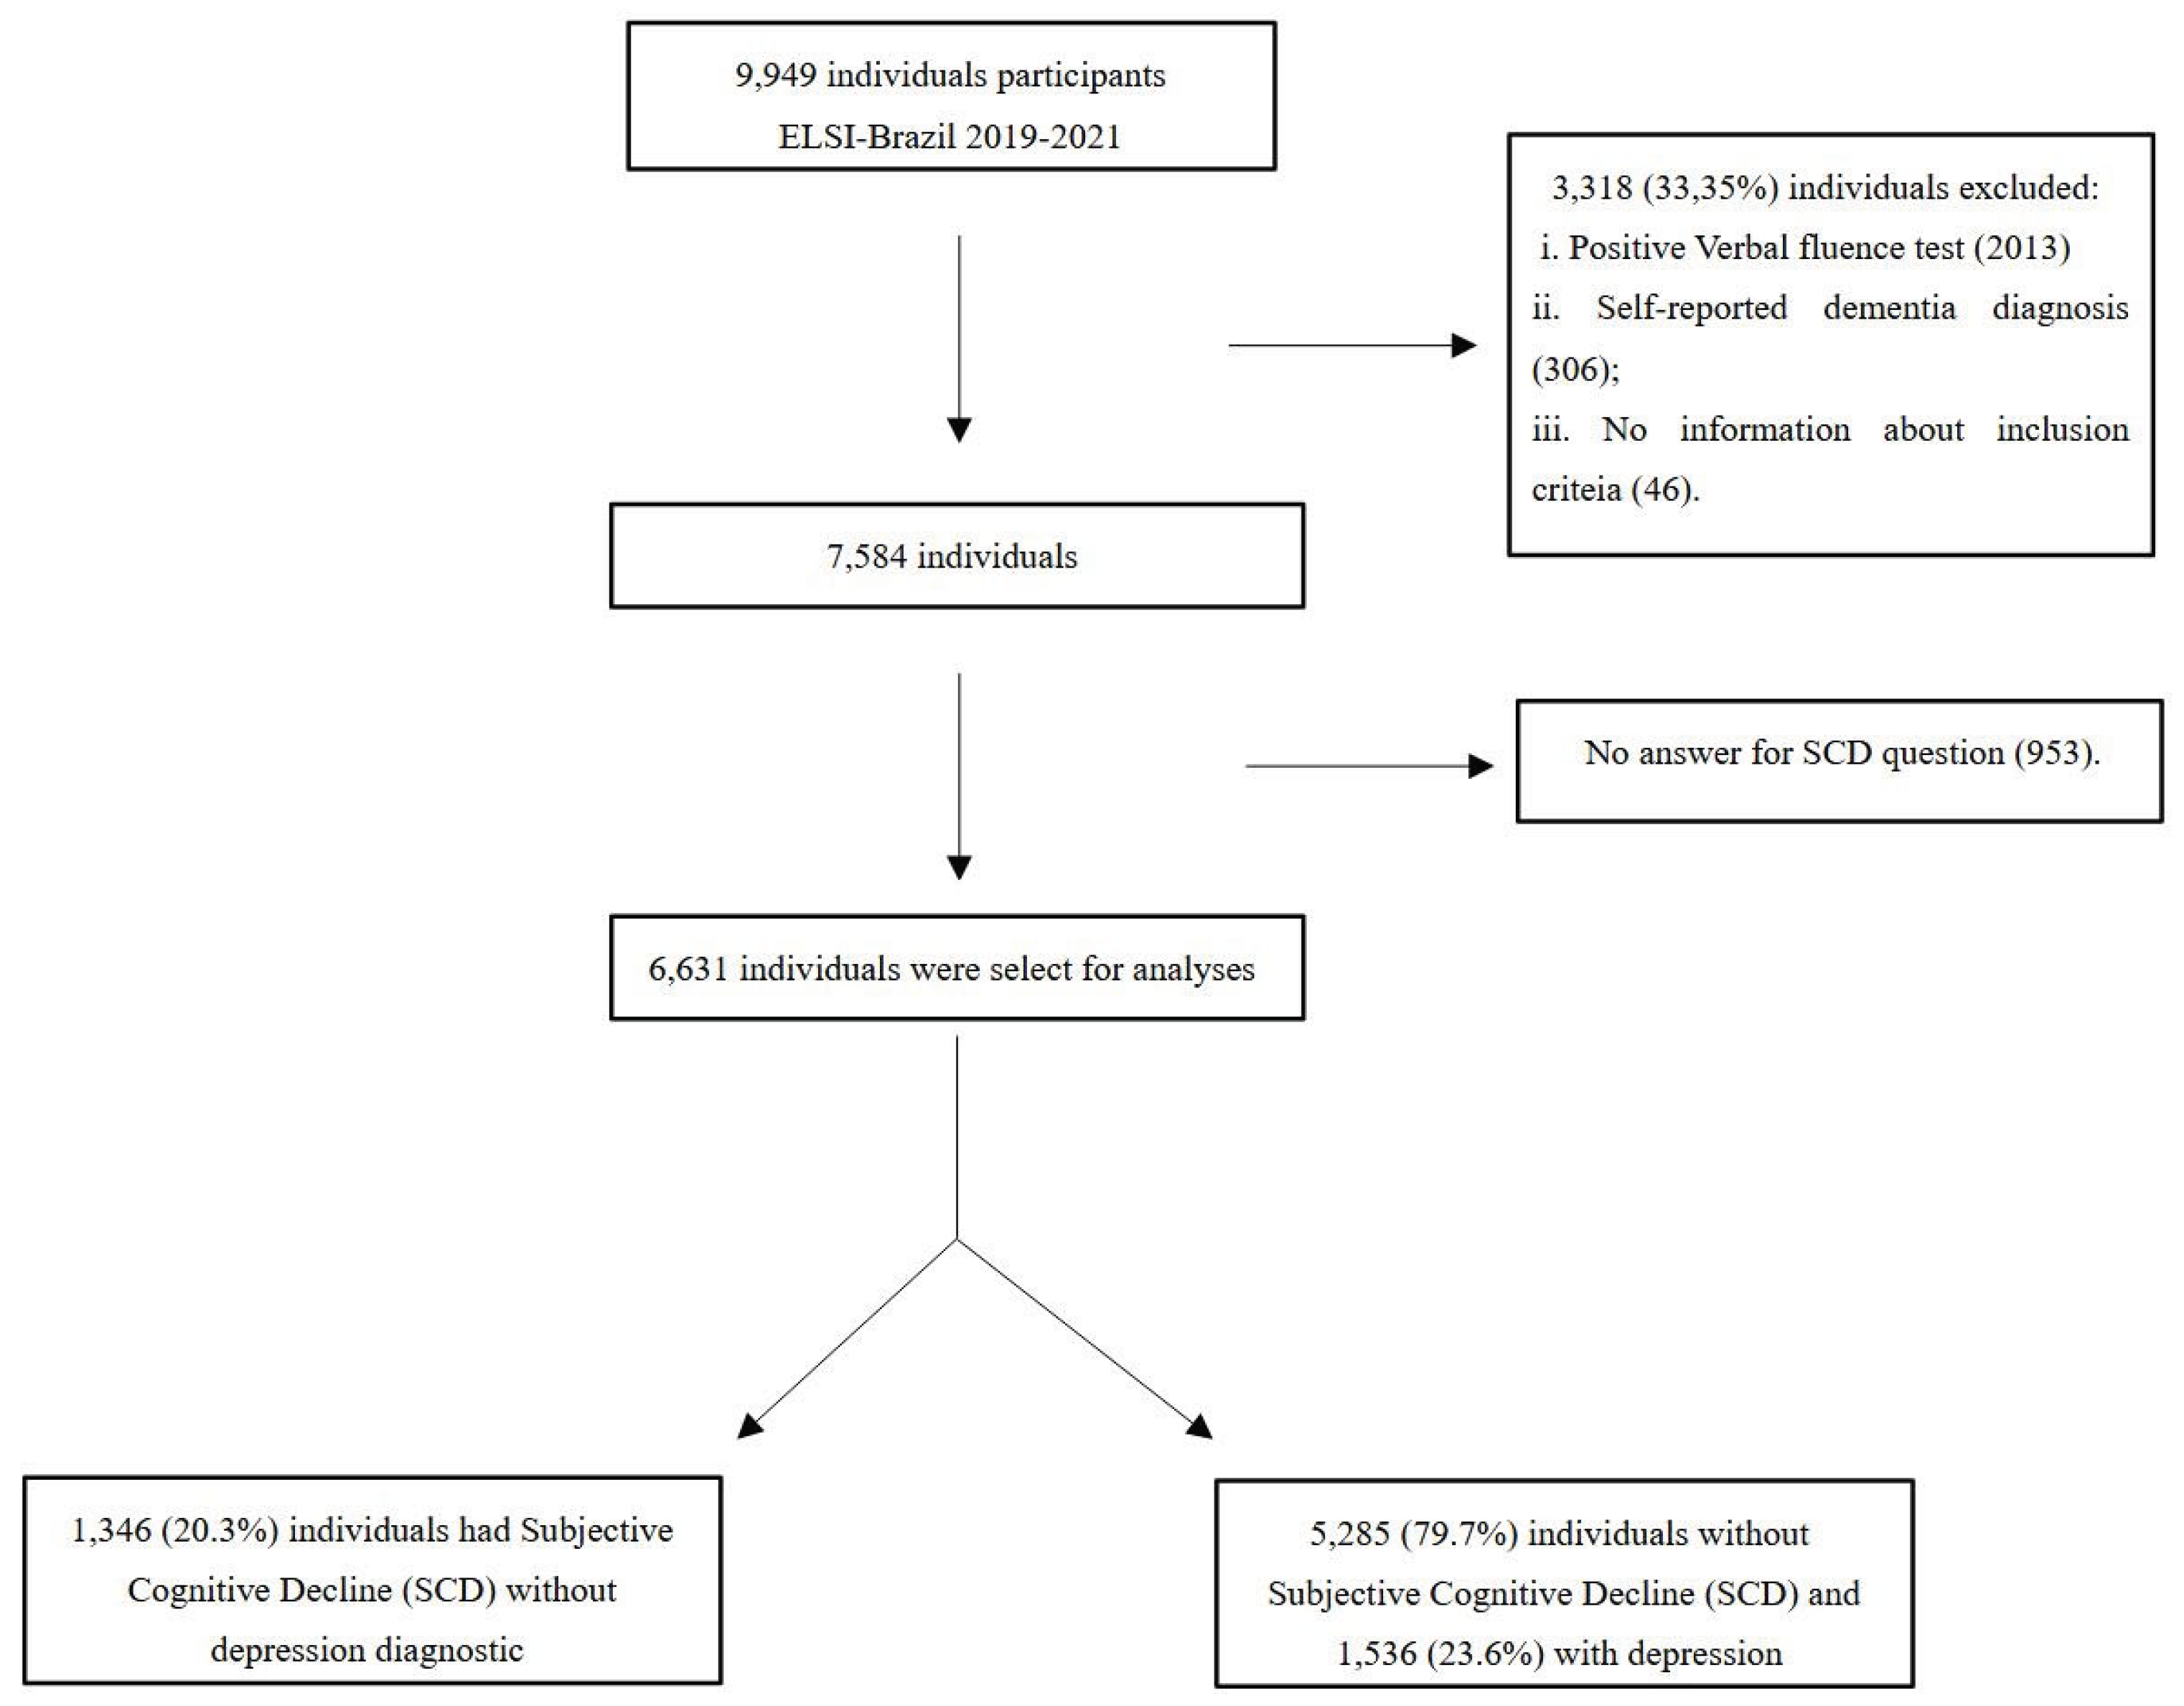

Table 1.
Weight Prevalence and 95% confidence intervals of SCD overall, by sex and age group. ELSI-Brazil – wave 2 – 2019-2021.
Table 1.
Weight Prevalence and 95% confidence intervals of SCD overall, by sex and age group. ELSI-Brazil – wave 2 – 2019-2021.
| Total N |
SCD n |
SCD Weighted Prevalence (95% CI) |
|
|---|---|---|---|
| Overall | 6631 | 1346 | 19.7 (18.6-20.9) |
| Males | 2767 | 538 | 20.2 (18.7-21.7) |
| Females | 3864 | 808 | 20.9 (19.6-22.2) |
| Age 50-60 | 2019 | 336 | 16.5 (14.5-18.4) |
| Age 60-79 | 3956 | 821 | 20.4 (18.9-21.9) |
| Age 80+ | 656 | 189 | 28.8 (24.6-33.0) |
Table 2.
Distribution (frequency and weighted percentage) of 6,631 Brazilian individuals aged 50 or older for demographic, social, lifestyle and health-related factors, overall and according to the study outcome. ELSI-Brazil, wave 2 – 2019-2021.
Table 2.
Distribution (frequency and weighted percentage) of 6,631 Brazilian individuals aged 50 or older for demographic, social, lifestyle and health-related factors, overall and according to the study outcome. ELSI-Brazil, wave 2 – 2019-2021.
| SCD | ||||||
|---|---|---|---|---|---|---|
| Total N (%) |
No N (%) |
Yes N (%) |
p-value* | |||
| Overall | 6,631 | 5,285 (80.3) | 1,346 (19.7) | |||
| Sex | ||||||
| Women | 3864 (57.5) | 3056 (79.8) | 808 (20.2) | 0.20 | ||
| Men | 2767 (42.6) | 2229 (80.9) | 538 (19.1) | |||
| Age [50-109 years] Mean (SD) |
65.1 (±9.7) | 65.0 (±9.7) | 65.2 (±9.8) | <0.01 | ||
| Ethnicity | ||||||
| Non-White | 3600 (54.4) | 2771 (76.9) | 829 (15.9) | <0.01 | ||
| White | 2968 (45.6) | 2454 (84.1) | 514 (23.1) | |||
| Educational Level | <0.01 | |||||
| No education | 676 (9.9) | 471 (69.3) | 205 (30.7) | |||
| Primary | 3404 (51.2) | 2618 (77.7) | 786 (22.3) | |||
| Lower secondary | 1292 (20.3) | 1065 (82.3) | 227 (17.7) | |||
| Upper secondary | 901 (14.3) | 802 (90.0) | 99 (10.0) | |||
| Tertiary/University degree | 279 (4.3) | 253 (88.10) | 26 (11.9) | |||
| Income level | <0.01 | |||||
| Low | 704 (11.5) | 540 (76.7) | 164 (23.3) | |||
| Low-Mild | 4424 (70.5) | 3420 (77.90) | 1004 (22.1) | |||
| Upper-Mild/High | 1121 (18.0) | 971 (87.1) | 150 (12.9) | |||
| Loneliness | <0.01 | |||||
| Never | 3990 (64.8) | 3260 (82.5) | 730 (17.5) | |||
| Sometimes/Always | 2231 (35.2) | 1697 (76.4) | 537 (23.6) | |||
| Physical Activity | <0.01 | |||||
| Active | 2646 (43.6) | 2198 (83.1) | 448 (16.9) | |||
| Sedentary | 3617 (56.4) | 2762 (77.0) | 855 (23.0) | |||
| Alcohol Abuse | 0.21 | |||||
| No | 6520 (98.0) | 5190 (80.1) | 1330 (19.9) | |||
| Yes | 111 (2.0) | 95 (86.4) | 16 (13.6) | |||
| Smoking Habits | 0.23 | |||||
| No | 5182 (68.0) | 3636 (68.7) | 904 (66.7) | |||
| Ex/Current | 2402 (32.0) | 1642 (31.3) | 442 (33.3) | |||
| Number of chronic diseases | <0.01 | |||||
| 0 | 849 (13.4) | 729 (86.6) | 120 (14.0) | |||
| 1 | 1141 (17.7) | 948 (83.6) | 193 (16.4) | |||
| 2 | 1152 (18.2) | 924 (80.8) | 228 (19.2) | |||
| ≥3 | 3333 (50.7) | 2552 (77.1) | 781 (22.9) | |||
| Hypertension | <0.01 | |||||
| No | 3029 (47.2) | 2480 (82.7) | 549 (17.3) | |||
| Yes (alone) | 426 (6.6) | 357 (84.8) | 69 (15.2) | |||
| Yes (with comorbidities) | 3020 (46.2) | 2316 (76.9) | 704 (23.1) | |||
| Diabetes | <0.01 | |||||
| No | 5298 (82.1) | 4240 (81) | 1049 (19.0) | |||
| Yes (alone) | 65 (1.1) | 59 (87.2) | 6 (12.85) | |||
| Yes (with comorbidities) | 1121 (16.9) | 854 (75.7) | 267 (24.3) | |||
| Hypercholesterolemia | 0.09 | |||||
| No | 4939 (76.5%0 | 3973 (80.9) | 960 (19.1) | |||
| Yes (alone) | 83 (1.3) | 64 (79.4) | 19 (20.6) | |||
| Yes (with comorbidities) | 1453 (22.3) | 1110 (77.7) | 343 (22.3) | |||
| Visual Problems | <0.01 | |||||
| No | 3731 (59.3) | 3092 (83.2) | 639 (16.8) | |||
| Yes (alone) | 82 (1.3) | 67 (83.9) | 15 (16.4) | |||
| Yes (with comorbidities) | 2653 (39.4) | 1985 (75.4) | 668 (24.6) | |||
| Hearing loss | <0.01 | |||||
| No | 4709 (73.7) | 3980 (84.8) | 729 (15.2) | |||
| Yes (alone) | 145 (2.3) | 103 (72.5) | 42 (27.5) | |||
| Yes (with comorbidities) | 1589 (24.1) | 1041 (66.6) | 548 (33.4) | |||
| Depressive symptoms† | <0.01 | |||||
| No | 4588 (77.8) | 3759 (82.4) | 829 (17.6) | |||
| Yes (alone) | 79 (1.5) | 61 (77.3) | 18 (22.7) | |||
| Yes (with comorbidities) | 1267 (21.3) | 923 (74.3) | 344 (25.7) | |||
| Obesity | 0.76 | |||||
| No | 2358 (42.1) | 1873 (80.0) | 485 (20.0) | |||
| Yes | 3215 (57.9) | 2536 (79.7) | 679 (20.3) | |||
| Caption: SCD: Subjective cognitive decline; SD: standard deviation; BMI: Body mass index. *p-value is for chi-squared test for categorical variables and t-test for continuous variables (i.e., age). †based on CES-D 8 scale. | ||||||
Table 3.
Estimates of associations (OR and 95% CI) between SCD and demographic, social, lifestyle and health-related factors. ELSI-Brazil, wave 2 – 2019-2021.
Table 3.
Estimates of associations (OR and 95% CI) between SCD and demographic, social, lifestyle and health-related factors. ELSI-Brazil, wave 2 – 2019-2021.
| OR Model 1* (95%CI) | OR Model 2† (95%CI) | |
|---|---|---|
| Sex (ref. male) | 0·91 (0·78-1·05) | 0·99 (0·84-1·16) |
| Age | ||
| 50-59 | 1 | 1 |
| 60-79 | 1·22 (1·02-1·45) | 1·22 (1·01-1·47) |
| 80+ | 1·72 (1·33-2·23) | 1·57 (1·19-2·09) |
| P for trend | <0·01 | 0·006 |
| Ethnicity (ref.white) | 1·56 (1·34-1·81) | 1·53 (1·30-1·79) |
| Educational Level | ||
| No education | 3·19 (2·35-4·33) | 2·79 (2·02-3·85) |
| Primary | 2·32 (1·81-2·97) | 2·14 (1·65 -2·77) |
| Lower secondary | 1·79 (1·34-2·37) | 1·67 (1·24-2·25) |
| Upper secondary or higher | 1 | 1 |
| P for trend | <0·01 | <0·01 |
| Income level | ||
| Low | 1·55 (1·13-2·12) | 1·58 (1·14-2·21) |
| Low-Mild | 1·44 (1·14-1·83) | 1·50 (1·17-1·92) |
| Upper-Mild/High | 1 | 1 |
| P for trend | <0·01 | <0·01 |
| Loneliness | ||
| Never | 1 | 1 |
| Sometimes/Always | 1·41 (1·20-1·65) | 1·35 (1·15-1·59) |
| Physical Activity | ||
| Active | 1 | 1 |
| Sedentary | 1·36 (1·17-1·60) | 1·33 (1·13-1·57) |
| Alcohol Abuse | ||
| No | 1 | 1 |
| Yes | 0·57 (0·29-1·14) | 0·60 (0·30 -1·20) |
| Smoking Habits | ||
| No | 1 | 1 |
| Ex/Current | 1·09 (0·93-1·27) | 1·08 (0·92-1·27) |
| Number of chronic diseases | ||
| 0 | 1 | 1 |
| 1 | 1·14 (0·84 -1·54) | 1·11 (0·81-1·52) |
| 2 | 1·30 (0·97-1·74) | 1·18 (0·87-1·61) |
| ≥3 | 1·47 (1·13-1·91) | 1·40 (1·06-1·84) |
| P for trend | <0·01 | <0·01 |
| Hypertension | ||
| No | 1 | 1 |
| Yes (alone) | 0·85 (0·61-1·17) | 0·93 (0·65-1·32) |
| Yes (with comorbidities) | 1·27 (1·08-1·49) | 1·17 (0·99-1·39) |
| Diabetes | ||
| No | 1 | 1 |
| Yes (alone) | 0·62 (0·25-1·54) | 0·67 (0·28-1·63) |
| Yes (with comorbidities) | 1·29 (1·07-1·56) | 1·25 (1·02-1·53) |
| Hypercholesterolemia | ||
| No | 1 | 1 |
| Yes (alone) | 1·46 (0·75-2·87) | 1·67 (0·82-3·40) |
| Yes (with comorbidities) | 1·15 (0·97-1·37) | 1·04 (0·87-1·25) |
| Visual Loss | ||
| No | 1 | 1 |
| Yes (alone) | 0·97 (0·49-1·92) | 0·87 (0·39-1·92) |
| Yes (with comorbidities) | 1·414 (1·21-1·64) | 1·31 (1·11-1·56) |
| Hearing Loss | ||
| No | 1 | 1 |
| Yes (alone) | 2·08 (1·31-3·32) | 2·11 (1·29-3·44) |
| Yes (with comorbidities) | 2·47 (2·11-2·90) | 2·29 (1·93-2·71) |
| Depressive symptoms‡ | ||
| No | 1 | 1 |
| Yes (alone) | 1·56 (0·79-3·09) | 1·58 (0·77-3·24) |
| Yes (with other diseases) | 1·55 (1·29-1·85) | 1·30 (1·05-1·60) |
| Obesity | ||
| No | 1 | 1 |
| Yes | 1·00 (0·85-1·18) | 1·00 (0·85-1·18) |
|
*Model 1: adjusted for the variables sex, age, ethnicity, and education level. †Model 2: further adjusted for number of chronic diseases, physical activity, and loneliness. ‡based on the Centre for Epidemiological Studies Depression Scale (CES-D 8) scale. Caption: OR: Odds ratio; CI: confidence interval; SCD: Subjective cognitive decline. | ||
Disclaimer/Publisher’s Note: The statements, opinions and data contained in all publications are solely those of the individual author(s) and contributor(s) and not of MDPI and/or the editor(s). MDPI and/or the editor(s) disclaim responsibility for any injury to people or property resulting from any ideas, methods, instructions or products referred to in the content. |
© 2026 by the authors. Licensee MDPI, Basel, Switzerland. This article is an open access article distributed under the terms and conditions of the Creative Commons Attribution (CC BY) license (http://creativecommons.org/licenses/by/4.0/).
Copyright: This open access article is published under a Creative Commons CC BY 4.0 license, which permit the free download, distribution, and reuse, provided that the author and preprint are cited in any reuse.


