
Submitted:
29 January 2026
Posted:
02 February 2026
You are already at the latest version
Abstract
Background: Blindness and visual impairment, disproportionately affecting low- and middle-income countries, remain critical global health challenges. Globally, an estimated 43 million people are blind, with unoperated cataracts accounting for half of all cases. Uganda, with strained healthcare systems and high poverty levels, faces significant inequities in accessing eye care, particularly for individuals with disabilities. This study aimed to estimate blindness and disability prevalence, identify causes, and explore their interplay among individuals aged 50 and above, emphasizing inclusive, disability-friendly health services to address barriers in low-resource settings. Methods: This descriptive cross-sectional study was conducted in five districts of Northern Uganda (Pader, Agago, Kitgum, Lamwo, and Amuru) in November–December 2023, targeting individuals aged 50 and above. A two-stage sampling method selected 76 clusters with 50 participants each, yielding a total sample size of 3,800. Data on visual impairment and disability were collected using RAAB7 software and the Washington Group methodology. Data analysis utilized RAAB7’s built-in tools with regular quality checks. Results: Among 3,662 examined participants (97.3% response rate), the overall blindness prevalence was 2.5% (95% CI: 1.7–3.4), higher in females (2.8%) than males (2.2%). Severe visual impairment (SVI) was 3.2% (95% CI: 2.2–4.1), and moderate visual impairment (MVI) was 9.3% (95% CI: 7.6–10.9). Untreated cataracts were the leading cause of blindness (51.3%). The prevalence of disability was 14.3%, with “difficulties with seeing” (11.5%) as the most reported. Among those with self-reported disabilities, 24.7% were blind versus 0.9% without disabilities. Effective Cataract Surgical Coverage (eCSC) was significantly lower in participants with disabilities, ranging from 6.9% (blind) to 25.8% (mild VI), highlighting inequities in surgical access. Conclusion: Disability and visual impairment are closely linked, with unoperated cataracts remaining the leading cause of blindness. People with disabilities experience lower cataract surgical coverage and inequitable healthcare access. Addressing these gaps requires disability-inclusive policies, targeted interventions, and stronger outreach. Integrating disability data into RAAB studies advances equity in eye care and supports global health efforts to reduce avoidable blindness among vulnerable populations.
Keywords:
blindness
; severe visual impairment
; refractive errors
; global eye-health
; RAAB
; cataract
; Uganda
; disability
; Washington group questionnaire
Background
Blindness and visual impairment represent significant global health challenges, disproportionately affecting low- and middle-income countries (LMICs) [1]. According to the World Health Organization (WHO) and a recent review in The Lancet Global Health, more than 2.2 billion people globally live with some form of vision impairment, and nearly half of these cases are preventable or remain unaddressed [2].
An estimated 43 million people are blind, 295 million have moderate visual impairment (MVI), and 33.6 million suffer from severe visual impairment (SVI). Among those aged 50 and above, approximately 501 million have near vision impairment caused by uncorrected presbyopia [1,3].
To address the burden of visual impairment (VI), the WHO introduced the global eye health resolution (Resolution WHA74.12: Integrated people-centered eye care, including preventable vision impairment and blindness), setting achievable global eye care targets for 2030 [4]. These targets focus on effective Refractive Error Coverage (eREC) and effective cataract surgery coverage (eCSC) [5,6]. Effective Refractive Error Coverage (eREC) refers to the proportion of individuals with refractive error who receive corrective lenses or treatment that restores their visual acuity to a functional level, emphasizing quality and impact rather than quantity of services [6,7]. Meanwhile, Effective Cataract Surgery Coverage (eCSC) represents the proportion of individuals with cataract-related vision impairment who undergo surgery that successfully restores functional vision. This measure highlights the importance of combining access to surgical services with optimal outcomes.
Sub-Saharan Africa, including Uganda, bears a significant portion of the global burden of VI due to limited access to quality eye care [8], inadequate healthcare infrastructure, and persistent socio-economic barriers [9]. Globally, the leading causes of blindness include cataracts, refractive errors, glaucoma, diabetic retinopathy, and age-related macular degeneration (ARMD) [10]. Cataracts alone account for approximately 51% of global blindness, but many regions, including Uganda, struggle to meet elimination targets set by initiatives such as WHO’s VISION 2020: The Right to Sight [11,12] and the current 2030 Eye Health agenda [4]. While these initiatives have achieved considerable progress globally, they remain underutilized in resource-constrained areas like Uganda, where access to care is still a major challenge.
The WHO recommends periodic population-based studies, such as the Rapid Assessment of Avoidable Blindness (RAAB) [13,14], to gather data essential for planning programs aimed at preventing avoidable blindness and VI. RAAB is a standardized methodology that provides reliable data specifically for individuals aged 50 and above, the age group with the highest prevalence of VI [13]. This approach ensures targeted strategies and resource allocation to reduce preventable blindness effectively.
Blindness and visual impairment are closely intertwined with broader global health challenges, including disability, poverty, and reduced quality of life [3,15]. The WHO recognizes blindness as both a cause and a consequence of poverty, particularly in regions like Northern Uganda, where widespread poverty exacerbates the economic and social vulnerability of those with visual impairments. Blindness limits individuals’ ability to work or care for their families, compounding their financial instability. Additionally, people with visual impairments frequently experience social stigma and exclusion, further limiting their opportunities for education, employment, and social integration [15].
The United Nations Convention on the Rights of Persons with Disabilities (UNCRPD) defines people with disabilities as those with “long-term physical, mental, intellectual, or sensory impairments, which in interaction with various barriers may hinder their full and effective participation in society on an equal basis.” [16,17,18] Disabilities, including those caused by reduced vision, are closely linked to socio-economic disparities, further marginalizing affected individuals. Evidence suggests that people with disabilities are less likely to access essential health services, underscoring the need to understand their specific barriers to eye care [19]. By strengthening eye care services and integrating them into broader health systems, the burden of disabilities related to visual impairment can be significantly alleviated, ensuring more equitable access and improved outcomes for all [20,21].
Measuring disability among individuals aged 50 and above in RAAB studies is an essential step toward understanding the complex interplay between aging, disability, and visual impairment [13]. As people age, they face an elevated risk of both functional disabilities and vision loss, conditions that frequently coexist and amplify the difficulties encountered in daily life and access to healthcare. Disability often intersects with other social determinants such as gender, poverty, and geographic location, creating additional layers of inequity [19,22]. By collecting data on functional difficulties in this age group, researchers can gain valuable insights into the specific barriers that hinder access to eye health services, such as physical mobility issues, limited social support, or stigma associated with disability. This data allows for the identification of vulnerable populations, such as women, rural dwellers, or individuals living in extreme poverty, who are disproportionately affected by these challenges [23].
Furthermore, understanding the extent and types of disabilities in this demographic enables the development of tailored, inclusive eye health programs that address these unique needs [24,25]. Inclusive strategies might involve improving community-based outreach, offering accessible transport to health facilities, or integrating disability-friendly services within primary eye care. Without systematically capturing data on disability, significant disparities in health outcomes and access to services are likely to persist, particularly in low-resource settings where health systems already face considerable strain. Addressing these gaps not only ensures more equitable service delivery but also aligns with global commitments to leave no one behind in efforts to reduce avoidable blindness and improve overall health equity [25,26].
Uganda, in Eastern Africa, with a population of approximately 46 million people, is highly underserved in terms of eye care, with just 1 ophthalmologist serving every 1 million people [8]. This critical shortage disproportionately affects individuals with disabilities, particularly those in rural areas, who often face compounded barriers such as limited mobility, stigma, and a lack of disability-inclusive health services. These challenges significantly exacerbate inequities in accessing timely and effective eye care, leaving many preventable cases of blindness and visual impairment unaddressed.
Northern Uganda, a region that has endured decades of conflict and socio-economic instability, is particularly vulnerable to blindness and visual impairment [8]. Poverty and displacement caused by past conflicts have left a legacy of underdevelopment, severely straining healthcare systems, including eye care services. The critical shortage of trained ophthalmologists, optometrists, and support staff in the region continues to hinder timely interventions for those in need. For many, sporadic and inadequately resourced outreach programs remain the only feasible access point for care. Moreover, comprehensive data on the prevalence of disabilities in the region is scarce, posing challenges to designing inclusive healthcare programs.
Although data on the prevalence and causes of blindness and visual impairment have been collected over the past decade, including from the last RAAB conducted in 2015 [27] across five districts in Northern Uganda, which estimated blindness prevalence at 6.0% (5.2–6.8), no information on general disability was captured. This omission highlights the growing need to integrate disability measurement within RAAB studies to generate data that can guide the planning of inclusive services addressing both visual impairment and broader disabilities.
The recent RAAB in Northern Uganda provided an opportunity not only to update data on eye health status and service coverage since the 2015 study but also to collect critical disability-related data. This addition was vital to ensure that future community programs are inclusive and cater to the needs of all people in the region, including those with disabilities, who often face the greatest barriers to care.
This study aimed to estimate the prevalence and causes of blindness and visual impairment, determine the prevalence of disability, and explore the relationship between disability and eye health among people aged 50 years and above in Northern Uganda.
Methods
Study Design and Location
This was a descriptive cross-sectional population-based study conducted in five districts in the Northern Province of Uganda (Pader, Agago, Kitgum, Lamwo, and Amuru), covering a total population of 1,066,000, between November and December 2023.
Study Population
The study population included individuals aged 50 years and above who resided in the aforementioned districts, had consented to participate, and had been ordinarily resident in their households for at least six months.
Sample Size
The sample size was calculated using the RAAB (version 7) [13] software package. Key inputs included total population, a prevalence estimate of blindness at 4.0% ± 20% with 95% confidence, a non-response rate of 10%, and a design effect of 1.5. This yielded a required sample size of 3,800 participants, obtained through 76 clusters of 50 adults aged 50 and above.
Sampling Method
A two-stage sampling method was employed. In the first stage, 76 primary sampling units (villages) were selected using probability proportionate to size methodology, based on population data from the Uganda Bureau of Statistics (UBOS). Villages were listed in the RAAB7 software [13], which facilitated random selection.
Within each village, 50 eligible participants were enrolled. A cluster informer visited the village a few days before the study team arrived and worked with local leaders to identify village boundaries. In villages with populations exceeding 500 inhabitants, the area was divided into smaller segments, and one segment was randomly selected. On the study day, the team began at the house nearest the main road and enumerated all eligible respondents, including those temporarily absent, revisiting households as needed. Basic data about absent participants was collected from family members or neighbors when possible.
Data Collection
Participants underwent initial visual examinations, followed by disability assessments using the open-access RAAB7 questionnaire [28]. Data was collected using an app on touchscreen smartphones, with village-level GPS coordinates recorded to facilitate geospatial analysis. Written consent was obtained from all participants, and illiterate participants provided a thumbprint, which was witnessed by an independent person.
Data was synced daily to a cloud server accessible only to the study team responsible for management and analysis. The RAAB7 app included built-in checks to minimize errors, and data quality was regularly reviewed by team members, with feedback provided to address inconsistencies.
Visual Examination
Each participant underwent a standardized ophthalmic assessment by trained team members, including:
- Presenting visual acuity measurement using the RAAB smartphone application, with pinhole testing for eyes presenting <6/12.
- Lens examination with a torch in a darkened room for all participants.
- Determination of the primary cause of visual impairment for each eye presenting <6/12.
- Questions regarding cataract surgery and, where applicable, reasons for non-surgery.
Minor ocular conditions were treated on-site, and participants needing further care were referred. Posterior-segment examination was performed using a direct ophthalmoscope for eyes with presenting visual acuity <6/12 when the cause was not attributable to refractive error, cataract, or corneal opacity, in line with the RAAB7 protocol. Participants with normal vision (≥6/12) were not routinely examined for posterior-segment changes, as the survey aimed to identify causes of existing visual impairment and blindness rather than subclinical disease.
Disability Definition and Tools
Disability in this study was defined in line with the United Nations Convention on the Rights of Persons with Disabilities (UN CRPD, 2006) as:
“Long-term physical, mental, intellectual or sensory impairments which, in interaction with various barriers, may hinder a person’s full and effective participation in society on an equal basis with others.”
To operationalize this concept, the survey applied the Washington Group Short Set (WGSS) methodology [29]—the global standard recommended by the UN Statistical Division and consistent with the International Classification of Functioning, Disability and Health (ICF). Rather than asking whether a person “has a disability,” the WGSS focuses on self-perceived difficulties across six functional domains:
1. Seeing (even if wearing glasses)
2. Hearing (even if using a hearing aid)
3. Walking or climbing steps
4. Remembering or concentrating
5. Self-care (such as washing or dressing)
6. Communicating (understanding or being understood)
Each domain has four response categories: no difficulty, some difficulty, a lot of difficulty, and cannot do at all. A respondent reporting a lot of difficulty or who cannot do at all in at least one domain was classified as having a disability.
The disability assessment included 12 questions derived from the Washington Group methodology, allowing nuanced analysis of impairment severity and type. The complete study tool is provided in Appendix 1.
Training
A certified RAAB trainer (KK) conducted a four-day training session, following the standard RAAB7 protocol. The training covered procedures for visual and disability assessments, with Days 1 and 2 focused on methodology and procedures, Day 3 on inter-observer variability (IOV) testing, and Day 4 on field practice. Teams were provided standardized instructions and reference materials, and retraining was conducted as needed until at least 60% agreement in IOV assessments was achieved.
Study Logistics
Five standardized teams collected data, each comprising an ophthalmologist as the team leader, an assistant (cataract surgeon or ophthalmic clinical officer), a cluster informer, a driver, and a village guide.
Data Management and Analysis
RAAB7 provided built-in analysis and prompts. Initial data cleaning was conducted by the trainer, with support from the International Centre for Eye Health (ICEH). Results were automatically generated within the RAAB7 software.
Ethical Considerations
The study was approved by two Internal Review Boards (IRBs): the Mulago Ethics Research Committee, and the Uganda National Council for Science and Technology. Written consent was obtained from all participants.
Results
Study sample and demographic characteristics
A total of 137, 532 persons aged 50 and above were in the area, among which 3972 participants were eligible, and 3662 (97.3%) were examined.
Table 1 shows Age and Sex distribution of those examined.
The demographic characteristics of the participants show a balanced gender distribution, with 51% female and 49% male respondents. The age–sex distribution of participants closely reflected the census population structure for adults aged ≥ 50 years in northern Uganda, though with a slight over-representation of women and the oldest age group (≥ 70 years), a pattern typical of household-based surveys in which older and more home-based individuals are more likely to be available for examination.
The mean age of participants was 63.5± 8.4 years, consistent with the age distribution expected among adults ≥ 50 years in the RAAB sampling frame, with almost half of the population aged 50 and above falling within the 50-59 age group. Women tend to be slightly more with increased age.
Table 2 shows the adjusted prevalence and extrapolated magnitude of blindness, severe, moderate and mild vision impairment.
The adjusted prevalence of blindness was 2.5% (95% CI 1.7–3.4), while severe and moderate visual impairment accounted for most of the burden. For visual impairment, 3.2% had severe visual impairment (SVI), and 9.3% had moderate visual impairment (MVI). Spectacle coverage was very low, with REC at 1.0% and eREC at 0.6%, far below WHO 2030 targets.
Table 3 examines the principal causes of blindness and visual impairment. Untreated cataracts accounted for 51.3% of blindness, followed by glaucoma (13%) and posterior segment disease (7.8%). For moderate and mild visual impairment, uncorrected refractive error was the most common cause, comprising 22% and 64.4% of cases, respectively.
Table 4 shows the crude prevalence of self-reported disability by functional domain, using the Washington Group Questions (WGQs).
In all domains (except for communication), there were more women than men. The most common reported form of disability was seeing (11.5%), seconded by mobility (5.1%). Women reported higher rates of disability across most domains compared to men.
Figure 1 shows prevalence of disability plotted against age
Disability prevalence commonly increases with age on account of many age-related conditions that can affect functioning (e.g., cataract, ARMD, arthritis, dementia).
Table 5 shows the adjusted prevalence of vision impairment by disability status
Blindness and visual impairment are highly associated with disabilities. Among participants with any disability, 24.7% were blind, compared to only 0.9% of those without disabilities. Similarly, severe and moderate visual impairment were significantly more prevalent among individuals with disabilities.
People without any other disability are less likely to be blind, or have severe, moderate or mild VI compared to those who are disabled.
Table 6 shows the adjusted effective cataract surgical coverage by disability status
Effective Cataract Surgical coverage (eCSC) was much higher in individuals without disabilities across all cataract thresholds, ranging from 6.9% for blindness to 25.8% for mild visual impairment. In contrast, participants with disabilities had significantly lower eCSC rates, indicating inequities in surgical access and outcomes.
Discussion
This study examined self-reported disability and its relationship with findings from the RAAB conducted in Northern Uganda. Using the RAAB methodology, the study integrated the Washington Group disability (WGS) [30] tool to assess self-perceived functional limitations across seven domains (seeing, hearing, mobility, communication, cognition, anxiety, and depression). We explored the relationship between disability and visual impairment, identified gaps in service provision, and provided recommendations for inclusive eye health programs.
The findings reveal significant insights into the link between disability and visual impairment. Women were slightly more represented in older age groups (Table 1). This higher representation highlights the need for gender-sensitive eye health and disability planning, proportionally targeting more women than men. Gender differences in blindness are well known, with more women affected than men [31,32,33,34].
Unoperated cataract remains the leading cause of blindness, accounting for 51.3% of cases (Table 3), consistent with trends observed in RAAB surveys across LMICs [3,35]. Cataract is treatable, and high proportions of untreated cases indicate weaknesses in the eye health system, resulting in low coverage of necessary services. Considering that among those who are blind or have severe visual impairment (Table 2), half have unoperated cataracts requiring surgery, the estimated number of unoperated cataracts in the surveyed province alone exceeds 3,900 cases.
The WHO launched SPECS 2030 [6], a global initiative to improve access to refractive error services, endorsed at the World Health Assembly in 2021. The strategy focuses on five key areas: improving Services, building Personnel capacity, enhancing Education, reducing Costs, and strengthening Surveillance. Despite this, the current RAAB survey found limited access to refractive error services, with uncorrected refractive error contributing to 22% of moderate and 64.4% of mild visual impairment cases. These findings indicate minimal progress in improving access to corrective eyewear.
The low effective coverage for refractive error highlights limited access to affordable vision correction in rural northern Uganda. Levels far below WHO 2030 targets reflect structural inequities, with vision-related disability concentrated among older adults and women. Strengthening primary eye care and community-based optical services is essential to advance universal eye health coverage and address broader health-system gaps in access and equity.
Additionally, two neglected tropical diseases (NTDs) targeted for elimination by 2030 [36]—trachoma and onchocerciasis—remain prevalent. Both require annual community-based mass drug administration with azithromycin and ivermectin, respectively. Posterior segment diseases, including glaucoma (13%), other retinal diseases (7.8%), and age-related macular degeneration (9.1%), collectively accounted for 29.1% of visual impairment. These conditions are particularly concerning as they are complex to treat, and minimal interventions exist in resource-limited settings.
The study also highlights the increasing prevalence of disability with age (Figure 1), which results from physiological decline, cumulative disease risk, and social factors. Age-related changes, including reduced muscle strength, chronic conditions like arthritis, sensory impairments, and neurodegenerative diseases, contribute significantly to functional limitations. Falls, fractures, and comorbidities further exacerbate disability risks, while limited healthcare access, poverty, and gender disparities compound these challenges, particularly in low-resource settings. Social and environmental barriers, cognitive decline, and mental health issues such as depression also play a role. Addressing these challenges requires age-friendly health systems, community-based interventions, and disability-inclusive policies.
The crude prevalence of self-reported disability by domain (Table 4) found “seeing” to be the most commonly reported disability (11.5%). This aligns with similar studies using the WGS tool, such as a recent study in western Uganda, which found a similar high prevalence [37]. The high prevalence is linked to the burden of age-related eye conditions such as cataracts, glaucoma, and uncorrected refractive errors, particularly in resource-limited settings. Since vision impairment directly affects daily activities, individuals are more likely to report it. Limited access to cataract surgery and glasses exacerbates the issue, while coexisting disabilities further impact quality of life.
There is a strong association between disability and visual impairment (Table 5). Persons with non-seeing disabilities are more likely to be blind or visually impaired due to shared risk factors, healthcare barriers, and increased vulnerability to injuries. Chronic conditions such as diabetes, stroke, and neurological disorders often contribute to both physical and visual impairments [19]. Limited mobility and reliance on caregivers can delay eye care access, worsening preventable vision loss [16,19]. Additionally, these individuals face higher risks of falls and trauma-induced eye injuries, further complicating their vision challenges. Cognitive impairments may contribute to undiagnosed vision problems, as affected individuals struggle to recognize or communicate their difficulties [19]. Socioeconomic factors, including poverty, gender, and stigma, further restrict access to care and rehabilitation services [17,31,32,33]. The strong association between disability and visual impairment underscores the need for integrated, disability-inclusive healthcare services that address both medical and structural determinants of inequity [20,24,25].
Disparities in Effective Cataract Surgical Coverage (eCSC) by disability status reveal significantly lower rates among individuals with disabilities (Table 6). This is likely due to multiple barriers, including mobility restrictions, inaccessible healthcare facilities, and financial constraints [16,17,19]. Socioeconomic disadvantages, such as poverty and unemployment, further reduce the ability to afford surgery [31,32,33]. Stigma and discrimination contribute to marginalization, while low awareness and misperceptions about cataract surgery delay care-seeking [17,32]. Additionally, coexisting health conditions may increase surgical risks, making providers hesitant to operate [19]. Without disability-inclusive healthcare policies, individuals with disabilities experience inequitable access to cataract surgery, leading to poorer visual outcomes and quality of life [20,24,25].
The findings highlight critical equity issues within the global eye health landscape. People with disabilities face significant disparities in accessing eye care services [38,39,40], reflecting broader systemic inequities. The lower rates of cataract surgical coverage and refractive error correction among participants with disabilities underscore the intersection of disability, poverty, and healthcare access. Globally, disability is both a cause and consequence of inequity, particularly in low-resource settings where social determinants such as income, education, and geography exacerbate healthcare barriers. In Northern Uganda, these disparities are compounded by a history of conflict and underdevelopment, leaving healthcare systems strained and inaccessible to many.
Recommendations
To address these disparities, integrating disability-inclusive strategies into national eye health programs is essential. Healthcare providers should receive training to accommodate the needs of individuals with disabilities, and eye care facilities must be made physically accessible. Outreach programs should target underserved populations, addressing barriers such as cost and transportation.
Efforts should also focus on improving cataract surgical coverage and refractive error correction among persons with disabilities through subsidized surgical programs and affordable corrective lenses. Community-based rehabilitation can support individuals with disabilities in accessing follow-up care and assistive devices.
Additionally, data collection should be expanded to include disability as a core component of RAAB surveys, ensuring accurate monitoring of progress and the development of evidence-based interventions. Collaboration with disability advocacy groups and local communities is crucial to ensure culturally sensitive and effective eye health programs. These measures will help establish an equitable eye care system that benefits all individuals.
Study Limitations
This study has several limitations. First, reliance on self-reported disability data may introduce bias, as perceptions of difficulty vary among individuals. Because participants underwent detailed eye examinations and were sensitized to vision-related questions, they may have been more likely to report vision problems than other functional limitations. This pattern likely reflects both the true burden of visual impairment and a degree of reporting bias arising from the survey’s vision-focused context. Second, the cross-sectional design precludes causal conclusions about the relationship between disability and visual impairment. Third, the study focused exclusively on individuals aged 50 years and above, excluding younger populations who may also experience significant disabilities and vision problems. Finally, logistical challenges in reaching remote areas may have affected sample representativeness. Despite these limitations, the study offers valuable insights into disability and visual health in Northern Uganda.
Conclusion
There is an urgent need for disability-inclusive approaches to eye health in Uganda. The findings highlight disparities in access and outcomes for people with disabilities, emphasizing the need for targeted interventions. By integrating disability data into RAAB studies, this research provides a model for addressing inequities in global eye health. Achieving equity will require collaboration among stakeholders, investment in inclusive healthcare systems, and a commitment to leaving no one behind. These efforts are crucial for reducing avoidable blindness and improving the quality of life for all.
Funding
The project was funded by Christian Blind Mission (CBM), Uganda Office.
Authors Contribution
K.K co-designed the project, conducted data analysis, interpretation of results, and wrote the initial draft; F.O, G.A, P.O, V.A, AI, A.G, DK, O.A, W.M, and O.T collected data. MS co-designed the project and supervised data collection. All authors read and approved the final manuscript.
Declarations
The study was approved by the Mulago Ethics Research Committee and the Uganda National Council for Science and Technology. The study adhered to the Declaration of Helsinki. Informed consent to participate in the study was obtained from all of the participants. Consent for publication: taken.
Availability of Data and Materials
The RAAB7 questionnaire used is available from the open-source framework [28]. De-identified data are available on request from https://www.raab.world/survey/uganda-northern-2023.
Acknowledgments
We extend our heartfelt gratitude to the RAAB team at the International Centre for Eye Health, London School of Hygiene and Tropical Medicine, UK, for providing access to RAAB7.We thank all the various participants in the project.
Competing Interests
The authors declare no competing interests.
Abbreviations
| ARMD | Age-Related Macular Degeneration |
| CBM | Christian Blind Mission |
| eCSC | Effective Cataract Surgical Coverage |
| eREC | Effective Refractive Error Coverage |
| ICEH | International Centre for Eye Health |
| IOV | Inter-Observer Variability |
| LMIC | Low- and Middle-Income Countries |
| MOH | Ministry of Health |
| MVI | Moderate Visual Impairment |
| NTD | Neglected Tropical Diseases |
| RAAB | Rapid Assessment of Avoidable Blindness |
| SPECS | Services, Personnel, Education, Cost, Surveillance |
| SVI | Severe visual impairment |
| UEHC | Universal Eye-Health Coverage |
| UBOS | Uganda Bureau of Statistics |
| UHC | Universal Health Coverage |
| UNCRPD | United Nations Convention on the Rights of Persons with Disabilities |
| VI | Visual Impairment |
| WGD | Washington Group Disability |
| WHO | World Health Organization |
References
- Bourne R, Adelson J, Flaxman S, et al. Trends in Prevalence of Blindness and Distance and Near Vision Impairment Over 30 Years and Contribution to the Global Burden of Disease in 2020. SSRN Electronic Journal. Published online 2020. [CrossRef]
- World Health Organization. World Report on Vision.; 2019. Accessed December 21, 2024. https://www.who.int/publications/i/item/world-report-on-vision.
- Burton MJ, Faal HB, Ramke J, et al. Announcing The Lancet Global Health Commission on Global Eye Health. Lancet Glob Health. 2019;7(12). [CrossRef]
- World Health Assembly. Resolution WHA74(12). Integrated people-centred eye care, including preventable vision impairment and blindness. In: Seventy-fourth World Health Assembly, Geneva, 24–31 May 2021. Geneva: World Health Organization; 2021. Published online 2021.
- World Health Organization. World Health Organization. (2022). Report of the 2030 targets on effective coverage of eye care. World Health Organization. Published online 2022.
- Stuart Keel, Andreas Mueller. WHO SPECS 2030 – a global initiative to strengthen refractive error care. Community Eye Health. 2024;37(122):6-7.
- McCormick I, Butcher R, Evans JR, et al. Effective cataract surgical coverage in adults aged 50 years and older: estimates from population-based surveys in 55 countries. Lancet Glob Health. 2022;10(12). [CrossRef]
- Magyezi J, Arunga S. Eye care where there are no ophthalmologists: the Uganda experience. Community Eye Health Journal. 2020;33(110).
- Naidoo K, Kempen JH, Gichuhi S, et al. Prevalence and causes of vision loss in sub-Saharan Africa in 2015: Magnitude, temporal trends and projections. British Journal of Ophthalmology. 2020;104(12). [CrossRef]
- Burton MJ, Ramke J, Patricia Marques A, et al. The Lancet Global Health Commission The Lancet Global Health Commission on Global Eye Health: vision beyond 2020 See Comment pages e383, e385, and e387 International Centre for Eye Health. Lancet Glob Health. 2021;9.
- Resnikoff S, Pararajasegaram R. Blindness prevention programmes: Past, present, and future. Bull World Health Organ. 2001;79(3).
- WHO. World Health Organisation. Global Initiative for the Elimination of Avoidable Blindness Action Plan 2006-2011; 2007. Bull World Health Organ. Published online 2007.
- McCormick I, Butcher R, Ramke J, et al. The Rapid Assessment of Avoidable Blindness survey: Review of the methodology and protocol for the seventh version (RAAB7). Wellcome Open Res. 2024;9. [CrossRef]
- Mactaggart I, Limburg H, Bastawrous A, Burton MJ, Kuper H. Rapid Assessment of Avoidable Blindness: Looking back, looking forward. British Journal of Ophthalmology. 2019;103(11). [CrossRef]
- Bassett H, Faal H, Burton M. The Lancet Global Health Commission on Global Eye Health: key findings. Community Eye Health Journal. 2021;34(111).
- Baart J, Elbers W, Schippers A. Who is disabled? On whether the functional definition of disability targets the same individuals as the subjective definition. Frontiers in Sustainability. 2023;4. [CrossRef]
- Mji G, MacLachlan M, Melling-Williams N, Gcaza S. Realising the rights of disabled people in Africa: An introduction to the special issue. Disabil Rehabil. 2009;31(1). [CrossRef]
- Chibaya G, Govender P, Naidoo D. United Nations Convention on the Rights of Person with Disabilities (UNCRPD) Implementation: Perspectives of Persons with Disabilities in Namibia. Occup Ther Int. 2021;2021. [CrossRef]
- Mitchell RJ, Ryder T, Matar K, Lystad RP, Clay-Williams R, Braithwaite J. An overview of systematic reviews to determine the impact of socio-environmental factors on health outcomes of people with disabilities. Health Soc Care Community. 2022;30(4). [CrossRef]
- Jolley E, Buttan S, Engels T, Gillani M, Jadoon MZ, Kabona G, et al. Prevalence of Visual Impairment and Coverage of Cataract Surgical Services: Associations with Sex, Disability, and Economic Status in Five Diverse Sites. Ophthalmic Epidemiol. 2020;27(6). [CrossRef]
- Witek-McManus S, Simwanza J, Msiska R, Mangawah H, Kalua K, Kuper H. Disability in childhood and the equity of health services: a cross-sectional comparison of mass drug administration strategies for soil-transmitted helminths in southern Malawi. BMJ Open. 2024 Sep 5;14(9):e083321. [CrossRef]
- Arciuli J, Emerson E. Type of disability, gender, and age affect school satisfaction: Findings from the UK Millennium Cohort Study. British Journal of Educational Psychology. 2020;90(3). [CrossRef]
- Mörchen M, Zambrano O, Páez A, et al. Disability-disaggregated data collection: Hospital-based application of the Washington group questions in an eye hospital in Paraguay. Int J Environ Res Public Health. 2019;16(17). [CrossRef]
- Senjam SS. Developing a disability inclusive model for low vision service. Indian J Ophthalmol. 2021;69(2). [CrossRef]
- Mörchen M, Bush A, Kiel P, Lewis D, Qureshi B. Leaving no one behind: Strengthening access to eye health programs for people with disabilities in 6 low- and middle-income countries. Asia-Pacific Journal of Ophthalmology. 2018;7(5). [CrossRef]
- Abualghaib O, Groce N, Simeu N, Carew MT, Mont D. Making visible the invisible: Why disability-disaggregated data is vital to “leave no-one behind.” Sustainability (Switzerland). 2019;11(11). [CrossRef]
- Ministry of Health. Rapid Assessment of Avoidable Blindness Dataset: Uganda, Northern, Karamoja. https://www.raab.world/survey/uganda-northern-karamoja-2015/data. Published online 2015.
- McCormick I: The Rapid Assessment of Avoidable Blindness survey: Review of the methodology and protocol for the seventh version (RAAB7). Open Science Framework. 2024. [CrossRef]
- Loeb M. Development of disability measures for surveys: the Washington Group Extended Set on Functioning. In: Altman B, editor. International Measurement of Disability. Cham: Springer; 2016. p. 97–122. [CrossRef]
- Madans JH, Loeb ME, Altman BM. Measuring disability and monitoring the UN Convention on the Rights of Persons with Disabilities: The work of the Washington Group on Disability Statistics. In: BMC Public Health. Vol 11. 2011. [CrossRef]
- Sanders A, Emerson P, Courtright P, Hooper PJ. Women and trachoma: why prioritising gender equity is essential to achieve vision for all. Community Eye Health Journal. 2023;36(119). [CrossRef]
- Lewallen S, Mousa A, Bassett K, Courtright P. Cataract surgical coverage remains lower in women. British Journal of Ophthalmology. 2009;93(3). [CrossRef]
- Ulldemolins AR, Lansingh VC, Valencia LG, Carter MJ, Eckert KA. Social inequalities in blindness and visual impairment: A review of social determinants. Indian J Ophthalmol. 2012;60(5). [CrossRef]
- Ulldemolins AR, Benach J, Guisasola L, Artazcoz L. Why are there gender inequalities in visual impairment? Eur J Public Health. 2019;29(4). [CrossRef]
- Kalua K, Lindfield R, Mtupanyama M, Mtumodzi D, Msiska V. Findings from a rapid assessment of avoidable blindness (RAAB) in Southern Malawi. PLoS One. 2011;6(4). [CrossRef]
- World Health Organization. Ending the Neglect to Attain the Sustainable Development Goals: A Road Map for Neglected Tropical Diseases 2021–2030.Geneva. World Health Organization;2020. License:CC BY-NC-SA 3.0IGO.; 2020. Accessed January 31, 2024. https://www.who.int/publications/i/item/9789240010352.
- Bondok M, Kasadhakawo M, Onyango J, Turya O, Kalua K. Prevalence and causes of blindness and vision impairment in Western Uganda: findings from a rapid assessment of avoidable blindness (RAAB) survey. PLoS One. 2025 Oct 13;20(10):e0334509.
- Tataryn M, Polack S, Chokotho L, et al. Childhood disability in Malawi: A population-based assessment using the key informant method. BMC Pediatr. 2017;17(1). [CrossRef]
- Murphy R, Jolley E, Lynch P, et al. Estimated prevalence of disability and developmental delay among preschool children in rural Malawi: Findings from “Tikule Limodzi,” a cross-sectional survey. Child Care Health Dev. 2020;46(2). [CrossRef]
- Banks LM, Hunt X, Kalua K, Nindi P, Zuurmond M, Shakespeare T. ‘I might be lucky and go back to school’: Factors affecting inclusion in education for children with disabilities in rural Malawi. Afr J Disabil. 2022;11. [CrossRef]
Figure 1.
Prevalence of disability plotted against age.
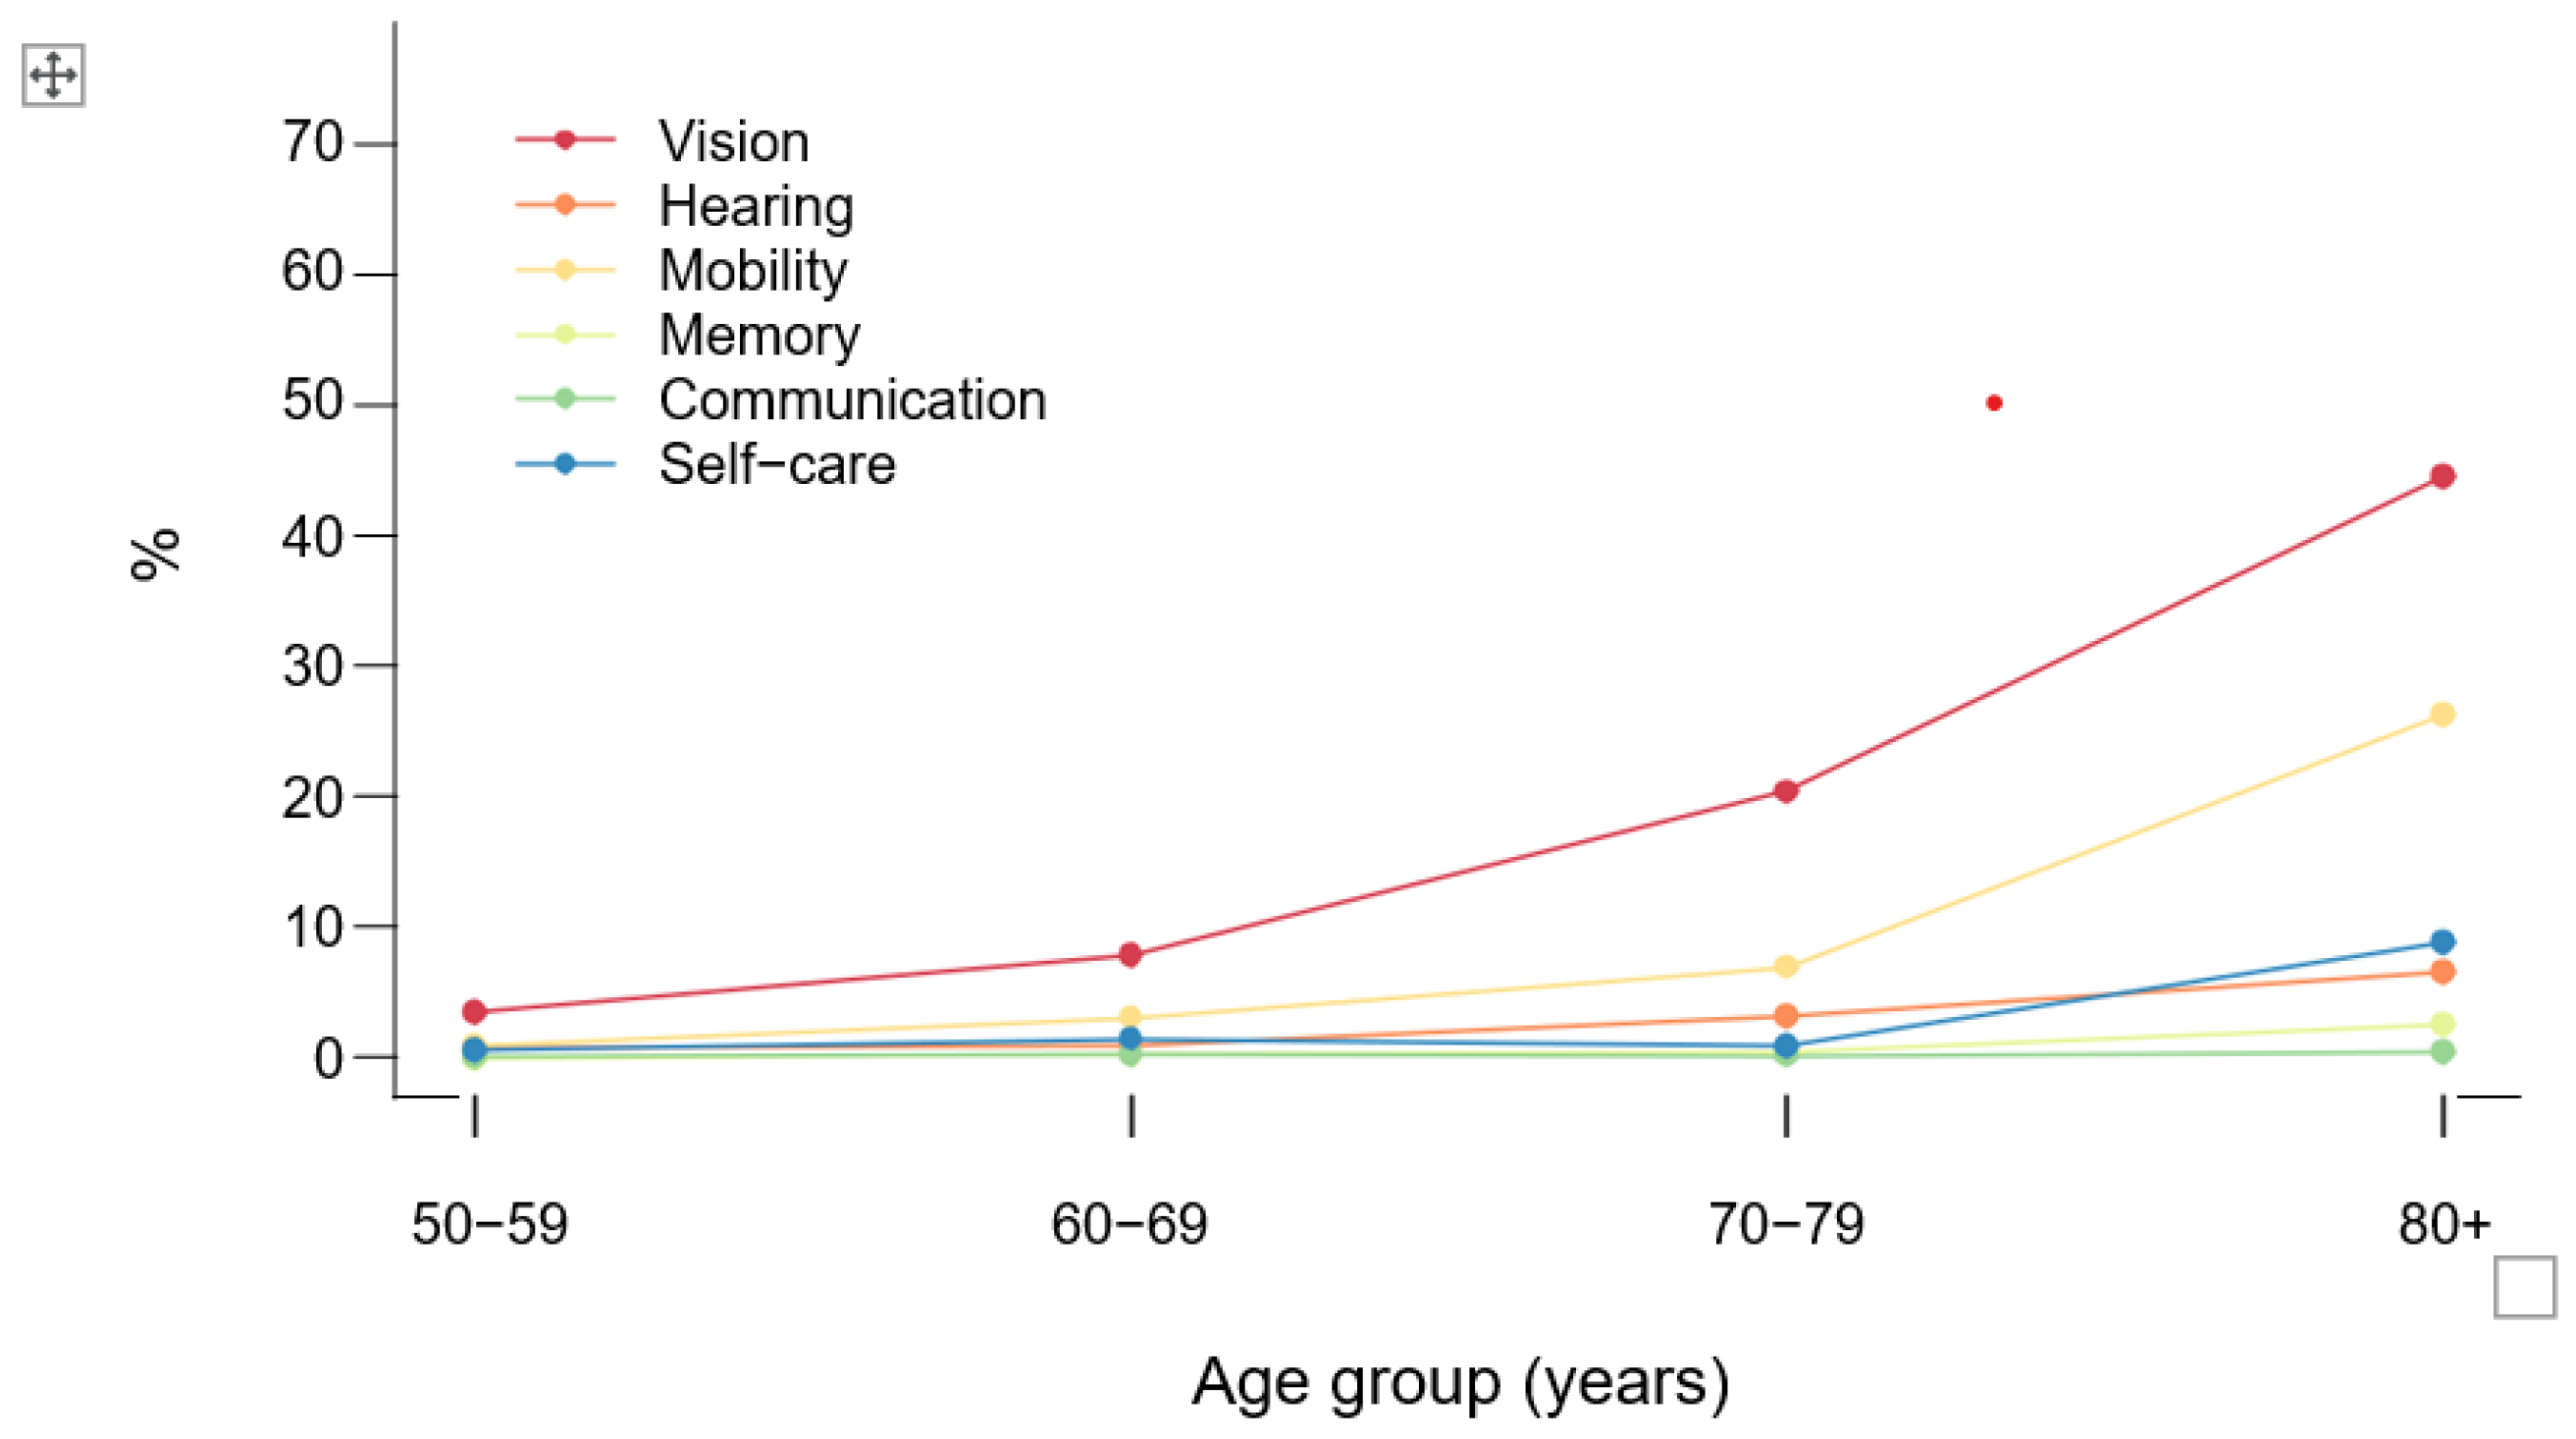

Table 1.
Age and Sex distribution.
| Age group | Female | Male | Total | |||
|---|---|---|---|---|---|---|
| Years | n | % | N | % | N | % |
| 50-59 | 838 | 44.9 | 955 | 53.2 | 1793 | 49.0 |
| 60-69 | 462 | 24.7 | 459 | 25.6 | 921 | 25.2 |
| 70-79 | 326 | 17.5 | 242 | 13.5 | 568 | 15.5 |
| 80+ | 241 | 12.9 | 139 | 7.7 | 380 | 10.4 |
| Total | 1867 | 100.0 | 1795 | 100.0 | 3662 | 100.0 |
Table 2.
Adjusted* prevalence and extrapolated magnitude of blindness, severe, moderate and mild vision impairment.
Table 2.
Adjusted* prevalence and extrapolated magnitude of blindness, severe, moderate and mild vision impairment.
| VI level | Female | Male | Total | ||||||
|---|---|---|---|---|---|---|---|---|---|
| Extrapolated Magnitude |
Extrapolated Magnitude |
Extrapolated Magnitude |
|||||||
| % | 95% CI | % | 95% CI | % | 95% CI | ||||
| Blind | 2.8 | 1.5-4.1 | 1953 | 2.2 | 1.3-3.1 | 1502 | 2.5 | 1.7-3.4 | 3455 |
| Severe | 3.2 | 1.8-4.5 | 2211 | 3.2 | 2.2-4.1 | 2126 | 3.2 | 2.2-4.1 | 4336 |
| Moderate | 8.9 | 6.8-11.1 | 6276 | 9.6 | 7.8-11.5 | 6477 | 9.3 | 7.6-10.9 | 12753 |
| Mild | 5.5 | 4.3-6.7 | 3866 | 4.2 | 3.2-5.2 | 2846 | 4.9 | 4.0-5.7 | 6712 |
*Adjusted for age and sex using the Uganda Bureau of Statistics (UBOS 2023) mid-year population projections for adults aged ≥ 50 years.
Table 3.
Principal cause of blindness, severe, moderate and mild vision impairment.
| Principal cause | Blind | Severe | Moderate | Mild | |||||
|---|---|---|---|---|---|---|---|---|---|
| n | % | N | % | N | % | n | % | ||
| 1. | Uncorrected refractive error | 0 | 0.0 | 9 | 5.0 | 105 | 22.0 | 145 | 64.4 |
| 2. | Uncorrected aphakia | 0 | 0.0 | 1 | 0.6 | 1 | 0.2 | 0 | 0.0 |
| 3. | Untreated cataract | 79 | 51.3 | 103 | 56.9 | 224 | 46.9 | 33 | 14.7 |
| 4. | Cataract surgical complications | 0 | 0.0 | 3 | 1.7 | 5 | 1.0 | 3 | 1.3 |
| 5. | Trachomatous corneal opacity | 9 | 5.8 | 6 | 3.3 | 6 | 1.3 | 1 | 0.4 |
| 6. | Other corneal opacity | 9 | 5.8 | 5 | 2.8 | 10 | 2.1 | 1 | 0.4 |
| 7. | Phthisis | 5 | 3.2 | 0 | 0.0 | 0 | 0.0 | 0 | 0.0 |
| 8. | Onchocerciasis | 2 | 1.3 | 2 | 1.1 | 4 | 0.8 | 1 | 0.4 |
| 9. | Glaucoma | 20 | 13.0 | 6 | 3.3 | 4 | 0.8 | 2 | 0.9 |
| 10. | Diabetic retinopathy | 0 | 0.0 | 0 | 0.0 | 1 | 0.2 | 0 | 0.0 |
| 11. | Age-related macular degeneration | 14 | 9.1 | 19 | 10.5 | 40 | 8.4 | 7 | 3.1 |
| 12. | Other posterior segment disease | 12 | 7.8 | 22 | 12.2 | 71 | 14.9 | 30 | 13.3 |
| 13. | Myopic degeneration | 0 | 0.0 | 0 | 0.0 | 0 | 0.0 | 0 | 0.0 |
| 14. | Other globe or CNS abnormalities | 4 | 2.6 | 5 | 2.8 | 7 | 1.5 | 2 | 0.9 |
| Total | 154 | 100.0 | 181 | 100.0 | 478 | 100.0 | 225 | 100.0 |
Table 4.
Crude prevalence of self-reported disability by functional domain.
| Domain | Female | Male | Total | |||
|---|---|---|---|---|---|---|
| N | % | N | % | N | % | |
| Seeing* | 245 | 13.1 | 176 | 9.8 | 421 | 11.5 |
| Hearing | 39 | 2.1 | 26 | 1.4 | 65 | 1.8 |
| Mobility | 119 | 6.4 | 67 | 3.7 | 186 | 5.1 |
| Memory | 12 | 0.6 | 3 | 0.2 | 15 | 0.4 |
| Communication | 4 | 0.2 | 3 | 0.2 | 7 | 0.2 |
| Self-care | 38 | 2.0 | 25 | 1.4 | 63 | 1.7 |
| Any domain | 299 | 16.0 | 225 | 12.5 | 524 | 14.3 |
| Any non-seeing domain | 154 | 8.2 | 89 | 5.0 | 243 | 6.6 |
*Higher reporting of vision difficulty may partly reflect the vision-focused nature of the RAAB survey.
Table 5.
Adjusted* prevalence of vision impairment by disability status.
| Any disability | Any non-seeing disability | No disability | ||||
|---|---|---|---|---|---|---|
| No. | Adj. % (95% CI) | No. | Adj. % (95% CI) | No. | Adj. % (95% CI) | |
| Blind | 129 | 24.7(20.1-29.3) | 77 | 31.6(23.9 - 39.3) | 28 | 0.9(0.5-1.3) |
| Severe | 91 | 17.4(13.8-21.0) | 24 | 9.7(6.4 - 13.1) | 88 | 2.8(2.1-3.6) |
| Moderate | 189 | 36.0(31.1 - 41.0) | 68 | 27.9(22.8 -33.1) | 286 | 9.1(7.8-10.4) |
| Mild | 38 | 7.2(4.7 - 9.6) | 22 | 9.1(5.1 - 13.1) | 195 | 6.2(5.4-7.1) |
*Adjusted for age and sex using the Uganda Bureau of Statistics (UBOS 2023) mid-year population projections for adults ≥ 50 years.
Table 6.
Adjusted effective cataract surgical coverage by disability status.
| Condition | Any disability | Any non-seeing disability | No disability | |||
|---|---|---|---|---|---|---|
| Adj. % | 95% CI | Adj. % | 95% CI | Adj. % | 95% CI | |
| Cataract surgical threshold <6/12 | ||||||
| eCSC* | 1.4 | 0.2-2.5 | 0.2 | 0.0-2.22 | 5.3 | 1.9-8.8 |
| Cataract surgical threshold <6/18 | ||||||
| eCSC | 1.5 | 0.2-2.9 | 0.2 | 0.0-2.6 | 6.4 | 1.9-11.0 |
| Cataract surgical threshold <6/60 | ||||||
| eCSC | 4.6 | 1.6-7.7 | 0.6 | 0.0-4.6 | 19.3 | 6.6-32.0 |
| Cataract surgical threshold <3/60 | ||||||
| eCSC | 6.9 | 2.5-11.3 | 0.7 | 0.0-5.8 | 25.8 | 10.2-41.3 |
*eCSC: Effective Cataract Surgical Coverage.
Disclaimer/Publisher’s Note: The statements, opinions and data contained in all publications are solely those of the individual author(s) and contributor(s) and not of MDPI and/or the editor(s). MDPI and/or the editor(s) disclaim responsibility for any injury to people or property resulting from any ideas, methods, instructions or products referred to in the content. |
© 2026 by the authors. Licensee MDPI, Basel, Switzerland. This article is an open access article distributed under the terms and conditions of the Creative Commons Attribution (CC BY) license (http://creativecommons.org/licenses/by/4.0/).
Copyright: This open access article is published under a Creative Commons CC BY 4.0 license, which permit the free download, distribution, and reuse, provided that the author and preprint are cited in any reuse.


