Submitted:
29 January 2026
Posted:
30 January 2026
You are already at the latest version
Abstract
Climatic conditions play an essential role in the vegetative growth and phenology of grapevines, significantly affecting yield and the compositional profile of the resulting wines. This study evaluates the adaptability of the Golia grape variety to variable climatic conditions over the 2020-2024 period and analyzes their impact on wine quality. The data show significant climatic variability, with warming trends causing earlier flowering and ripening by 11–13 days. Grape production varied depending on climatic conditions, with 2021 and 2024 recording the highest number of shoots per trunk and increased fertility in 2024. Low winter temperature values led to reduced bud viability and affected the overall health of the vines and harvest yields. Average annual precipitation, especially from growing season significantly influenced actual productivity, while higher annual temperatures and sunshine duration resulted in lower grape weight. Greater sugar concentrations accumulated in years with higher temperatures, while higher acidity levels registered at lower values. The physicochemical properties of the wines were shaped by the quality of the raw materials, reflecting the direct im-pact of climatic variability on grape composition and wine characteristics. The sensory profile of the wines exhibited major annual variation. Floral and fruity aromas were more pronounced in cooler years, while high temperatures led to the development of specific notes such as rose and exotic fruits. The perception of sweetness and honey aroma was linked to higher alcoholic strength (R²=0.8876) and dry extract (R²=0.7719), whereas the wines’ unctuosity was determined by winter precipitation (R²=0.8751).
Keywords:
climate change
; vine phenology
; oenological indicators
; wine quality
1. Introduction
Viticulture and winemaking have a significant socio-economic impact in many countries. Europe holds approximately 40% of vineyard area in the world, although significant regions have also developed in Asia, the USA and in Southern Hemisphere countries such as Argentina, Australia, Chile and South Africa. The largest wine-producing countries in the world are France, Italy and Spain, with China, however, recording the largest increases in wine production in recent years [1,2]. Climatic conditions like temperature, precipitation, evapotranspiration and sunshine duration are variable in time and space and represent essential factors for the physiological development of the grapevine (Vitis vinifera L.), phenology, production and, indirectly, for wine quality [3]. Climatic factors also determine the geographical location of vineyards and the variability of meteorological parameters leads to annual changes in productivity. Extreme weather events (hail, late frosts) are known for their negative impact [1,4,5].
Given the projected trajectories of climate change, a significant negative impact on viticulture and wine production is anticipated. Rising temperatures during the growing season represent a major threat, as temperature is a critical factor in regulating phenological development. Consequently, substantial warming will lead to an advancement of phenological phases, including earlier flowering. Thus, adjustments in agronomic and crop management practices are needed to maintain quality and yield [6,7,8].
In addition, pronounced warming during the ripening period will most likely affect wines’ characteristics and typicity. Extreme heat during this phase can reduce grapevine metabolism, affecting qualitative attributes. So, an increase in sugar concentration and a decrease in acidity are anticipated, increasing the risk of wine spoilage and resulting in wines lacking freshness and aromatic complexity [9,10,11,12,13].
These climatic changes are redefining the global viticultural potential, favoring cultivation in temperate regions previously limited by low temperatures, while warm and arid areas become less suitable [6,7,8]. The impact on viticulture is evaluated through crop models that integrate the effects of temperature, water availability and carbon dioxide concentration, the latter enhancing photosynthesis and reducing transpiration, indirectly modifying soil microbiology and drought resistance. Adaptation requires studying not only resistance traits but also the phenotypic plasticity of varieties in relation to environmental variables [5,12,14,15].
To counteract these effects, various adaptation strategies have been explored. These include water management techniques such as irrigation [16], the use of anti-transpirant agents [17], or adjustments to pruning and training systems. For instance, Semi-Minimal Pruned Hedge (SMPH) has been shown to be capable of delaying ripening and the onset of fungal diseases [18], representing a viable solution for adjusting to future higher temperatures. Furthermore, the exogenous application of growth regulators, such as (S)-cis-abscisic acid, has proven effective in increasing anthocyanin accumulation and color index under heat stress conditions [19].
Climatic variations directly influence the timing of phenological stages and berry composition, leading to earlier harvesting, increased sugar content and higher alcohol concentrations [20,21], thus affecting the typicity of wines. Research suggests that local varieties [22] and northern bioclimes or those with maritime influences [23] may be more resilient. In the Mediterranean region and Croatia, temperature changes and increased drought highlight an inadequacy of current viticultural zoning [16,24], necessitating the adoption of urgent adaptive measures. These include water management through irrigation [16], the use of agronomic practices (post-veraison pruning, leaf removal) to mitigate sugar levels [25,26], or the introduction of drought-tolerant varieties and rootstocks. In the context of Romania, a statistically significant increase in average temperatures and bioclimatic indices has been observed, indicating the need for acidification measures and a reevaluation of the vulnerability of vineyards in various regions [27,28]. Consequently, beyond immediate agronomic adjustments, the selection and validation of suitable varieties is imperative for ensuring the future sustainability of viticulture.
In the context of climate change in Romania, various authors have focused on analyzing the impact of climate change on the characteristics of grapes and wine obtained from varieties such as Sauvignon blanc [29,30,31], Pinot gris [29], Italian Riesling [30], Fetească albă [31,32], Aromat de Iași [33], Crâmpoșie [33], Fetească regală [30,34], Fetească neagră [30], Chasselas doré [32], Muscat Hamburg [32], Coarnă neagră selecționată [32], Pinot noir [30,35], Merlot [30,35] and Cabernet sauvignon [35,36]. However, research targeting the behavior of the Golia variety in the context of climate change is limited. This study addresses this knowledge gap by evaluating the specific effects of climatic conditions on Golia’s vine development and wine quality. By correlating specific climate indicators with qualitative parameters, this research aims to highlight the variety's potential for resilience and sustainability, offering novel insights crucial for optimizing viticultural planning in the context of current climate challenges.
2. Materials and Methods
2.1. Grapevine Cultivars and Growing Conditions
The study was conducted in the Iași vineyard, located in the northeast of the Moldavian Plateau (47º10’ N latitude and 27º35’ E longitude). It stretches along the Iași Hillside and includes major viticultural centers such as Copou-Șorogari, Bucium, Uricani, Comarna, Covasna, Galata and Bohotin [37,38,39]. The relief consists of the Moldavian Plain and the Central Moldavian Plateau, with a lithological substrate predominantly composed of marls and clays. The most favorable soils for viticulture are cambic chernozems and gray soils [39]. The hydrography is dominated by the Bahlui and Prut rivers and numerous artificial lakes used for irrigation [40]. The region features an excessive temperate-continental climate, characterized by cold and relatively dry winters, hot and arid summers, with frequent phenomena such as late frosts and recurrent droughts occurring at intervals of three to four years [39].
The biological materials consisted of the Golia grapevine variety, grafted onto SO4 rootstock (Vitis berlandieri×Vitis riparia). The vineyard was established with a planting density of 2.2×1.2 m, and the vines were trained using Guyot system with a semi-high trunk (80 cm). The experimental plot was managed under rain-fed conditions, with standard manual operations for pruning and weed control. For the purpose of this study, a randomized sample of 100 permanently marked vines served as biological replicates for longitudinal analysis.
Golia is a white grape variety obtained at the Iași Research and Development Station for Viticulture and Winemaking through the intraspecific hybridization of Sauvignon blanc and Șarba. It is predominantly cultivated in the Copou region (Moldavian Hills) and is suited for producing high-quality white wines [37]. Golia is a self-fertile variety characterized by medium growth vigor and a high rate of wood maturation [41]. Its clusters are cylindro-conical, with yellowish-green berries that generally reach maturity in the second half of September, offering an average yield of approximately 14 t/ha, with 180-195 g/L sugar content and a moderate acidity). Although it exhibits good frost tolerance, its resistance to drought and fungal diseases is classified as medium [37]. The resulting wine is appreciated for its fresh aromatic profile, featuring fruity and floral notes and is recommended for early consumption.
2.2. Wine Samples
The analyzed wines consisted of commercial Golia samples produced during the years 2020-2024 at the Iași Research and Development Station for Viticulture and Winemaking. The wines were obtained following the producer’s standard winemaking protocols for white wines, ensuring a consistent technological approach across the studied years to minimize processing variables.
2.3. Climatic Parameters
Several key climate parameters such as soil temperature (ºC), sunshine duration (hours), precipitation level (mm) and soil hygroscopicity (%) were analyzed over five consecutive years (from 2020 to 2024) using an AgroExpert® station (Metrilog Systems, Bucharest, Romania) located in the Iași-Copou vineyard at 191 m altitude [42]. Soil surface temperature was monitored using a temperature sensor placed at ground level to assess the thermal microclimate surrounding the cluster zone. For this research, monthly averages were presented. Sunshine duration refers to the cumulative hours of bright sunshine, essential for optimizing photosynthesis and berry ripening. Additionally, precipitation amounts were measured to assess water availability and seasonal distribution, and soil hygroscopicity was evaluated to characterize the soils’ water retention status [42].
2.4. Grapevine Adaptation
The impact of climatic variability on the grapevine was assessed by monitoring the phenological development, fertility, productivity and quality characteristics of the Golia variety. The key phenological stages recorded were bud break, flowering, veraison and full maturity. Fertility was estimated by measuring the following parameters: total shoots per vine, fertile shoots per vine, percentage of fertile shoots and number of inflorescences, followed by the calculation of the absolute (AF) and relative fertility (RF) coefficients. Productivity was quantified at harvest by monitoring the average cluster weight, absolute and relative productivity indices, number of berries per cluster and actual yield (kg/vine). Quality assessment included the determination of cluster parameters (cluster weight and volume, berry and rachis weights). Additionally, the mechanical composition of the berry was analyzed using a 100-berry sample to determine pulp, skin and seed weights [43,44].
2.5. Chemical Analyses
The study involved determining the chemical composition of the must at harvest, such as sugar content (g/L), total acidity (g/L) C4H6O6 and pH. Furthermore, key physicochemical parameters of the wine were analyzed, including alcoholic strength (% alc. vol.), total (g/L C4H6O6) and volatile acidity (g/L C2H4O2), free and total SO2 content (mg/L), reducing sugar level (g/L), relative density and non-reducing dry extract (g/L). All analyses were performed in triplicate according to the regulations established by International Organization of Vine and Wine [45].
2.6. Wine Sensory Profile
The tasting session was organized according to the guidelines established in the current standards [46,47,48]. Samples were analyzed in the first part of the day at a wine temperature of 10–12 °C. The sensory profile of the wines was evaluated by a panel of 23 qualified tasters (represented by 13 men and 10 women) from the Iași University of Life Sciences. The participants were classified as ‘qualified’ based on their active professional involvement in the wine industry and routine engagement in sensory analysis. The panel included academic staff teaching oenology and viticulture, researchers in the beverage sector, O.I.V. experts, and authorized Romanian tasters. All tasters were of legal age and were fully informed regarding the nature of the samples. The study was conducted in strict adherence to the ethical code of Iași University of Life Sciences, with all participants providing informed consent.
Sensory evaluation involved monitoring key attributes specific to the Golia variety (mineral, vegetal, elderflower, jasmine flower, grapevine flower, roses, linden flower, basil, citrus, pear, peach, green apple, exotic fruits, green pepper, honey, sweet, acid, bitter, phenolic, unctuous, persistence). Scores from 0 to 10 were assigned based on the perceived intensity of each attribute. The results were centralized and the arithmetic mean was calculated.
2.7. Statistics
Statistical processing was performed using XLStat (Lumivero, Denver, CO, USA). To identify the relationship between climatic parameters (independent variables) and key oenological indices (dependent variables), Pearson correlation matrices were generated with significance established at α=0.05. The strength and direction of the relationship between variables were evaluated based on the correlation coefficient (r). Additionally, the influence of climatic factors on dependent variables was visualized using scatter plots with linear trendlines, and the proportion of explained variance was quantified using the coefficient of determination (R2).
3. Results and Discussions
3.1. Climatic Data
3.1.1. Air Temperature and Sunshine Duration
Air temperature data is presented in Figure 1. In general, the annual minimum temperature was recorded in January (-8.4 °C in 2020, -16.3 °C in 2021, -11.6 °C in 2022 and -15.5 °C in 2024). In 2023, the minimum temperature of -13.1 °C was recorded in February. On the other hand, maximum temperatures have increased over the last four analyzed years, from 34.5 °C in July 2021, 36.5 °C in June 2022, to 38.2 °C in August 2023 and 39.6 °C in July 2024.
A significantly increasing trend in maximum temperatures is observed during the summer months, frequently reaching values over 36°C. Furthermore, minimum temperatures during the summer months are relatively high, indicating the presence of warm nights. In the winter months, minimum temperatures are variable, with negative values, reflecting freezing conditions.
The annual average temperature varies between 10.1 and 12.6°C, with significant monthly fluctuations. The results indicate a general increasing trend in both average and maximum temperatures, especially during the summer months. The maximum temperatures in July and August have been continuously increasing, from 36.2°C in 2020 up to values of 39.6°C in 2024. Thus, in 2024, the average annual temperature was 12.6°C, which is 2.2°C higher compared to the average temperature recorded by Filimon et al. [42] for 2014 (10.4°C) in the Iași-Copou vineyard. Similar results were also presented by Droulia et al. [49], indicating the frequent presence of temperatures above 30°C in recent years in the Croatian region.
From Figure 2, it is observed that the highest sunshine duration values were recorded in 2020 and 2024 (2144.8 hours and 2138.3 hours, respectively).
3.1.2. Soil Temperature Assessment
Soil temperature directly influences the growth and development of grapevine roots. During periods of high temperatures (June–July), active plant development is favored, while low values during winter can slow down biological processes and affect root survival. The results show typical seasonal changes, with significant variations from one month to another (Figure 3). For example, during the spring period, considerable increases in soil temperature are observed, which corresponds to the active vegetation period. Soil temperatures are high in the summer months, proportional to the air temperature level. Thus, the maximum temperature was reached in July 2024 (64.2°C).
Analyzing the monthly average values in the summer period, they range between 24.1°C in June 2021 and 30.5°C in July 2022, indicating significant heat exposure during this period. In the winter months, minimum temperatures fluctuated between -7°C (in 2020) and -25.2°C (in 2024). The results indicate an upward trend in the annual average values of soil temperature (Figure 3) in the last 3 years.
3.1.3. Soil Hygroscopicity
According to the data, 2021 recorded the highest soil moisture retention capacity (71%), corresponding to a year with higher precipitation (Figure 4). On the other hand, 2022 was characterized by the lowest annual average hygroscopicity (64%) due to the pronounced drought conditions, which led to a high degree of soil water evaporation.
3.1.4. Precipitation
Recorded precipitation varied significantly (Figure 5), with 2024 being characterized by the highest level (657.4 mm), with a maximum value recorded in September (150.2 mm). 2022 was the driest year (416.8 mm), with a maximum of 73.6 mm in April. In addition, 2023 was characterized by the highest precipitation in April (157.7 mm), represented by heavy snowfall.
3.2. Influence of Climatic Variability on the Grapevine
Phenological variations indicate an essential role of the climate in the development of the grapevine, which is fundamental for the harvesting strategy and the type of wine. The results (Figure 6) shows a changing trend in phenological development in recent years. It is observed that in 2024, a very early bud break occurred (April 7), indicating a warm spring favorable for vegetation. On the other hand, the latest bud break was in 2021 (April 30). Veraison set in earliest in 2024 (August 2) and latest in 2021 (August 20). The data highlights distinct trends over the analyzed period, with faster onset of the main phenophases. Thus, the flowering and ripening stages occurred up to 11–13 days earlier in 2024, compared to 2022 and 2023.
Filimon et al. [42] reported an earlier harvest for the Fetească albă, Fetească regală, Aligoté and Muscat Ottonel varieties cultivated in the Iași-Copou vineyard by 11–14 days during the 1981–2020 period, with changes being significant, especially after 2000. Also, Irimia et al. [35] presented significant increases in the average annual temperature in Eastern Romania over the years, highlighting changes in grapevine cultivation (0.47°C between 1961 and 2013) and an increased potential for introduction of new grape varieties. Similarly, Xu et al. [50] anticipated that these phenological stages will occur 8–12 days earlier in the region of France (Burgundy) over the next 30 years. Also, scenarios presented by Alikadic et al. [51] predict the faster beginning of all phenological stages by up to 3 weeks in the Italian region.
According to Table 1, 2021 and 2024 had the highest number of shoots per vine (54), but their fertility is variable. Thus, in 2021, only 35 shoots were fertile (64.81%), whereas in 2024, 43 fertile shoots were counted, representing 79.63%. The highest proportion of fertile shoots was obtained in 2023 (85.71%), although the total number of shoots was lower (35). 2022 recorded the lowest fertility rate (53.84%), which may indicate a negative effect of climatic conditions on the grapevine.
Regarding the number of inflorescences, a higher value is observed in 2024 (54), followed by 2020 (43), 2021 and 2023 (42) and the lowest value was obtained in 2022 (27).
The level of Relative Fertility (RF) was the highest in 2023 (1.20), with the results being relatively proportional to the initially determined number of inflorescences. The reduced value of fertility indicators in 2022 could be linked to the low precipitation and extreme temperatures, which negatively affected the formation of fertile buds. Although the initial number of fertile shoots was high in 2021, an imbalance between vegetative and reproductive growth is observed, indicated by low relative and absolute fertility (RF=0.77, AF=1.20).
Table 2 also presents data related to grapevine productivity during the analyzed period. The Relative Productivity Index (RPI), which reflects the number of grapes reported to the number of fertile shoots, showed the highest value in 2023 (148.8). Based on the Absolute Productivity Index (API, which also includes grape weight), good fruiting capacity was observed in the last two study years. Although the clusters were smaller in 2024, the results show that the highest quantitative value was obtained (5.73 kg/vine). Although 2022 recorded the highest grape weight, the actual yield was the lowest, indicating a possible reduction in crop load. In general, the results emphasize a good capacity for adaptation to climatic conditions, with stable productivity and the possibility of regulating the crop load through pruning and growth management practices.
An increasing trend in grape and berry weight is observed during the 2020–2023 period, followed by a minor decrease in 2024, which may indicate a lower production or the presence of unfavorable climatic conditions. Given that 2022 had the highest values for cluster weight and volume, as well as high berry weight, it suggests a productive year with favorable conditions. The cluster had the highest weight in 2021 (9.17 g), with the lowest recorded in 2024. This may indicate a difference in cluster formation and compactness.
According to Figure 7, 20–30% of the variability in grapes actual yield is explained by the annual average temperatures. Winter conditions (severe frost, deficiency of a dormant period) significantly affect productivity. A major impact was observed between winter temperatures and actual yield (R2=0.9294). Thus, bud viability and vine health post-winter are identified as essential yield factors. Average temperatures during spring and summer have a smaller but important impact (23–38%), with other factors significantly contributing to yield variations (such as precipitation, fertilization, sunshine duration, winds, disease attacks, water stress etc.).
From Figure 8, over 80% of the variability in actual yield is explained by the average annual precipitation.
The amount of water available during the growth and ripening period is essential for the final yield (water deficit induces water stress and reduces actual yield, while excess moisture can favor fungal diseases). 73.78% of the variability in actual yield is explained by the level of precipitation recorded from veraison to harvest (April–October). Summer precipitation (June–August) did not show a major impact on actual yield (4.5%), indicating that previously accumulated water is sufficient for development. Winter precipitation has a moderate impact on production (46.92% of yield variation is explained by winter precipitation), suggesting that soil water storage for the grapevine is important in the following season. To establish the optimal harvest time, parameters such as the 100–berry weight, grape sugars and total acidity were determined.
Regarding the first parameter (100–berry weight), a descending trend has been recorded in recent years, corroborated with an increase in the annual average temperature (R2=0.78) and sunshine duration value (R2=0.925). Furthermore, the results (Figure 9) revealed a week association with average precipitation (R2=0.1261) and a moderate impact of soil temperature (R2=0.6185).
The grapes physicochemical properties (sugars, total acidity, pH) at the time of harvest (Table 4) provide information about the grape ripening potential and the resulting wine quality. The sugar content ranged between 220 g/L (in 2024) and 230 g/L (in 2021). The reduction in sugar content in 2023 may have been determined by climatic conditions or a higher yield. The highest acidity value was shown by the grapes harvested in 2023 (7 g/L C4H6O6), suggesting a slower maturation or the presence of low temperatures. Conversely, the lowest acidity was recorded in 2022 (4.6 g/L C4H6O6), which is attributed to the increased temperatures that favored sugar accumulation and acidity reduction. 2024 presents balanced values for sugar content and total acidity. pH ranged between 2.84 (2021) and 3.67 (in 2024). The high pH level in 2024 (3.67) reflects a lower microbiological stability potential. The results indicate a weak but positive correlation between the average temperature recorded in the summer months and the accumulation of sugars in the grapes. According to Figure 10, approximately 30% of the variability in sugar content is explained by the temperature value during the analyzed period. Sugar accumulation is, therefore, also dependent on other factors such as sun exposure, soil type, water regime etc.
On the other hand, only 0.41% of the total acidity variation is explained by the temperatures recorded during the summer period. This highlights that this parameter is not directly affected by summer temperatures, which may indicate that other factors such as precipitation, soil type, or vine management have a greater impact.
3.3. Impact of Climatic Conditions on Physicochemical Parameters of Wine
The physicochemical quality of wines is determined by the quality of the raw material used and by the winemaking conditions. In general, the analyzed wines were dry (Table 2), presenting a reducing sugar content ranging from 0.86 g/L (in 2020) to 2.80 g/L (in 2021). From Figure 11, a negative correlation (values vary inversely) is observed between the reducing sugar content of the wine and the average soil temperature (r=-0.880).
The analyzed samples showed an alcoholic strength ranging between 12.4 % alc. vol. (in 2023) and 13.4 % alc. vol. (in 2020). The obtained values that are proportional to the sugar content of Golia grapes (r=0.988) and to the higher temperatures recorded at the beginning of the studied period (2020 and 2021). A higher alcoholic concentration ensures increased biological stability [39].
Total acidity ranged from 4.42 g/L (in 2022) to 6.10 g/L C4H6O6 (in 2023), being strongly correlated (r=0.975) with the grapes acidity, as well as with wine density (r=0.858). This parameter is essential for ensuring stability and defining the sensory profile of wines. SO2 level was higher in the last two years of the study, highlighting the need to increase wine stability. Regarding density, minor variations were recorded (0.9902 in 2020 and 0.9914 in 2023), in correlation with the alcoholic strength and the non-reducing dry extract. The volatile acidity of the analyzed wines showed values inversely proportional to the grapes acidity level (r=-0.960).
3.4. Impact of Climatic Conditions on the Sensory Characteristics of Wine
The analyzed samples showed significant differently sensory profiles (Figure 12). The 2020 variant exhibited distinct honey notes, a moderate level of acidity, a slightly phenolic taste and medium persistence. Delicate notes of green apples, linden flowers and jasmine were also highlighted. In contrast, the 2021 sample showed a higher level of sweetness, with fruity (like green apples, citrus) and floral notes, predominantly linden flowers.
The acidic character was most intense in the 2022 sample, which was described by predominant notes of green apples, citrus fruits and grapevine flowers. The wine produced in 2023 was distinguished by floral notes (linden flowers, jasmine, elderflower), as well as green apples and pears aromas. The 2024 sample was the sweetest, being characterized by delicate notes of citrus fruits, green apples and linden flowers; it also showed the greatest persistence.
The results indicate a variable impact of climatic conditions on the sensory characteristics of wines (Figure 13 and Figure 14). The values of annual average temperatures show a significantly negative correlation with the notes of roses, basil, but also with the aroma of exotic fruits, the greatest influence being highlighted in the spring-summer period.
According to Shmuleviz et al. [52], the compounds responsible for fruity and floral notes in wines (such as monoterpenes and norisoprenoids) require heat to be synthetized, with spring and summer being critical periods for the accumulation of aromatic precursors. However, these components are better preserved at moderate temperatures. Higher temperatures can accelerate vine metabolism, reducing the optimal period for the accumulation of aromatic precursors and promoting the degradation of some of them before harvest. In addition, the activity of certain enzymes involved in the formation of terpenes and norisoprenoids may be reduced at high temperature values. Positive relationship were identified between unctuosity and precipitation levels, with the greatest influence observed during the winter season (R2=0.8751). Wines that generally showed higher reducing sugar contents were characterized by better mouthfeel and longer persistence.
Figure 15 and Figure 16 illustrate how much of the variation in sensory characteristics can be explained by physicochemical parameters and climatic conditions. In this regard, the pairs showing the highest degree of dependence were selected. Thus, the variability of honey note intensity is best explained by the recorded alcoholic strength (R²=0.8876), as well as by the dry extract value (R²=0.7719). According to Liu et al. [53], the presence of ethanol at higher concentrations significantly affect the perception of sensory characteristics by enhancing the solubilization and release of certain volatile compounds. Moreover, the dry extract contributes to defining wine body, intensifying the perception of sweet sensations characteristic of honey notes.
The grapevine flower note is strongly negatively influenced by the dry extract value (R²=0.9688), whereas other floral notes (linden flowers, elderflower) are most strongly linked to density (R²>0.75). Thus, a higher dry extract may induce a more pronounced body, diminishing the perception of delicate floral notes in favor of fruity or sweet notes.
Regarding the impact of climatic conditions, the results indicate a strong negative relationship between fruity notes (exotic fruits) and the average air temperature (R²=0.8842), as well as with sunshine duration (R²=0.886). Mean soil temperature values moderately impacted the fruity notes of the wines (peach and exotic fruits, R²>0.64). Sweet taste was perceived more intensely by the tasters in samples obtained in years with lower precipitation levels (R²=0.7147). Conversely, acid (R²=0.6799) and bitter (R²=0.8454) tastes received higher scores in samples from wetter years.
4. Conclusions
The study highlights the major impact of climatic variability on the Golia variety in the Iași vineyard. Extreme weather conditions, such as high temperatures of 2024 (max. 39.6°C) and the severe drought in 2022 significantly influenced vine fertility and productivity. A marked advancement in phenological stages was observed, particularly in 2024, signaling an intensification of climate change effects comparable to shifts previously recorded over decades. Climatic conditions dictated the quantitative and qualitative potential of the harvest. While the abundant precipitation in 2021 supported vegetative growth, low winter temperatures and water deficits in subsequent years limited bud viability and yield. The physicochemical profile of the grapes showed high plasticity; elevated temperatures favored sugar accumulation and acidity degradation, whereas cooler years preserved higher acidity levels, crucial for the freshness of white wines. In terms of winemaking potential, the sensory profile of Golia wines exhibited distinct interannual variations. Cooler years enhanced floral and fruity notes, while higher thermal regimes diminished specific aromas like rose and exotic fruits, instead promoting perceived sweetness and honeyed notes due to higher alcohol and dry extract. Notably, a negative correlation was identified between reducing sugars and average soil temperature, while winter precipitation appeared to influence the wines' mouthfeel. Despite these challenges, Golia demonstrated a capacity to produce quality wines, suggesting that adaptive vineyard management strategies are essential to mitigate the impact of increasingly frequent climate extremes.
Author Contributions
Conceptualization, A.S. and L.C.C.; methodology, R.V.F.; software, E.C.S. and C.E.L.; validation, L.C.C., C.E.L. and L.R.; formal analysis, R.V.F.; investigation, A.S. and L.R.; resources, V.C. and R.M.F.; data curation, R.V.F.; writing—original draft preparation, A.S. and E.C.S.; writing—review and editing, A.S. and E.C.S.; visualization, E.C.S.; supervision, V.C. and L.C.C.; project administration, V.C.; funding acquisition, V.C. All authors have read and agreed to the published version of the manuscript.
Funding
This research was funded by “Ion Ionescu de la Brad” Iași University of Life Sciences.
Institutional Review Board Statement
The wine tasting sessions followed the ethical guidelines established by “Ion Ionescu de la Brad” Iași University of Life Sciences. According to the university’s Code of Ethics and Deontology, explicit approval for tasting commercially accessible alcoholic beverages is not a prerequisite for research initiation. The study was restricted to the sensory assessment of commercial Golia wines by professional tasters. All participants were informed of the study's scope, confirmed they were over the legal drinking age, and consented to the procedures.
Informed Consent Statement
Informed consent was obtained from all subjects involved in the study.
Data Availability Statement
The raw data supporting the conclusions of this article will be made available by the authors on request.
Conflicts of Interest
The authors declare no conflicts of interest.
Abbreviations
The following abbreviations are used in this manuscript:
| H | Soil hygroscopicity |
| T°C soil | Average annual soil temperatures |
| T°C | Average annual air temperatures |
| Pp | Precipitation |
| Sun | Sunshine duration |
| AY | Actual yield |
| W100 | 100-berry weight |
| GS | Grape sugar |
| SO2 | Sulfur dioxide |
| AS | Alcoholic strength |
| GTA | Grape total acidity |
| WTA | Wine total acidity |
| WVA | Wine volatile acidity |
| RS | Reducing sugar |
| D | Density |
| C4H6O6 | Tartaric acid |
| C2H4O2 | Acetic acid |
| OIV | International Organization of Vine and Wine |
References
- Fraga, H. Viticulture and winemaking under climate change. Agronomy 2019, 9(12), 783. [Google Scholar] [CrossRef]
- International Organization of Wine and Vine. Statistical report on world vitiviniculture. Paris, France, 2019. Available online: https://www.oiv.int/public/medias/6782/oiv-2019-statistical-report-on-world-vitiviniculture.pdf (accessed on 11 January 2026).
- Novello, V.; de Palma, L. Climate, soil and grape/wine quality/typicity in different zones or terroirs. In Proceedings of the XIVth international GESCO viticulture congress; Schultz, H., Ed.; Geisenheim: Germany, 2007; pp. 62–73, în. [Google Scholar]
- Costa, R.; Fraga, H.; Fonseca, A.; de Cortazar-Atauri, I.G.; Val, M.C.; Carlos, C.; Reis, S.; Santos, J.A. Grapevine phenology of cv. Touriga franca and Touriga nacional in the Douro wine region: modelling and climate change projections. Agronomy 2019, 9(4), 210. [Google Scholar] [CrossRef]
- Costa, R.; Fraga, H.; Malheiro, A.C.; Santos, J.A. Application of crop modelling to portuguese viticulture: Implementation and added-values for strategic planning. Ciênc. Téc. Vitiviníc. 2015, 30, 29–42. [Google Scholar] [CrossRef]
- Mosedale, J.R.; Abernethy, K.E.; Smart, R.E.; Wilson, R.J.; Maclean, I.M. Climate change impacts and adaptive strategies: Lessons from the grapevine. Glob. Chang. Biol. 2016, 22(11), 3814–3828. [Google Scholar] [CrossRef]
- Hannah, L.; Roehrdanz, P.R.; Ikegami, M.; Shepard, A.V.; Shaw, M.R.; Tabor, G.; Zhi, L.; Marquet, P.A.; Hijmans, R.J. Climate change, wine, and conservation. Proc. Natl. Acad. Sci. U.S.A. 2013, 110(17), 6907–6912. [Google Scholar] [CrossRef]
- Moriondo, M.; Jones, G.V.; Bois, B.; Dibari, C.; Ferrise, R.; Trombi, G.; Bindi, M. Projected shifts of wine regions in response to climate change. Clim. Change 2013, 119, 825–839. [Google Scholar] [CrossRef]
- Parker, A.; García de Cortázar-Atauri, I.; Chuine, I.; Barbeau, G.; Bois, B.; Boursiquot, J.M.; Cahurel, J.Y.; Claverie, M.; Dufourcq, T.; Gény, L.; Guimberteau, G.; Hoffmann, R.W.; Jacquet, O.; Lacombe, T.; Monamy, C.; Ojeda, H.; Panigai, L.; Payan, J.C.; Lovellea, B.R.; Rouchaud, E.; van Leeuwen, C. Classification of varieties for their timing of flowering and é using a modelling approach: A case study for the grapevine species Vitis vinifera L. Agric. For Meteorol. 2013, 180, 249–264. [Google Scholar] [CrossRef]
- Orduna, R.M. Climate change associated effects on grape and wine quality and production. Food Res. Int. 2010, 43(7), 1844–1855. [Google Scholar] [CrossRef]
- Fraga, H.; García de Cortázar Atauri, I.; Santos, J.A. Viticultural irrigation demands under climate change scenarios in Portugal. Agric. Water Manag. 2018, 196, 66–74. [Google Scholar] [CrossRef]
- van Leeuwen, C.; Destrac-Irvine, A.; Dubernet, M.; Duchêne, E.; Gowdy, M.; Marguerit, E.; Pieri, P.; Parker, A.; de Rességuier, L.; Ollat, N. An update on the impact of climate change in viticulture and potential adaptations. Agronomy 2019, 9(9), 514. [Google Scholar] [CrossRef]
- Pons, A.; Allamy, L.; Schuttler, A.; Rauhut, D.; Thibon, C.; Darriet, P. What is the expected impact of climate change on wine aroma compounds and their precursors in grape? OENO One 2017, 51(2), 141–146. [Google Scholar] [CrossRef]
- Rolli, E.; Marasco, R.; Vigani, G.; Ettoumi, B.; Mapelli, F.; Deangelis, M.L.; Gandolfi, C.; Casati, E.; Previtali, F.; Gerbino, R.; Cei, F.P.; Borin, S.; Sorlini, C.; Zocchi, G.; Daffonchio, D. Improved plant resistance to drought is promoted by the root-associated microbiome as a water stress-dependent trait. Environ. Microbiol. 2015, 17(2), 316–331. [Google Scholar] [CrossRef]
- Chitwood, D.H.; Rundell, S.M.; Li, D.Y.; Woodford, Q.L.; Yu, T.T.; Lopez, J.R.; Greenblatt, D.; Kang, J.; Londo, J.P. Climate and developmental plasticity: Interannual variability in grapevine leaf morphology. Plant Physiol. 2016, 170(3), 1480–1491. [Google Scholar] [CrossRef]
- Santillán, D.; Garrote, L.; Iglesias, A.; Sotes, V. Climate change risks and adaptation: new indicators for Mediterranean viticulture. Mitig. Adapt. Strateg. Glob. Chang. 2019, 25(5), 881–899. [Google Scholar] [CrossRef]
- Di Vaio, C.; Marallo, N.; di Lorenzo, R.; Pisciotta, A. Anti-Transpirant effects on vine physiology, berry and wine composition of cv. Aglianico (Vitis vinifera L.) grown in south Italy. Agronomy 2019, 9(5), 244. [Google Scholar] [CrossRef]
- Molitor, D.; Schultz, M.; Mannes, R.; Pallez-Barthel, M.; Hoffmann, L.; Beyer, M. Semi-minimal pruned hedge: a potential climate change adaptation strategy in viticulture. Agronomy 2019, 9(4), 173. [Google Scholar] [CrossRef]
- Shahab, M.; Roberto, S.R.; Ahmed, S.; Colombo, R.C.; Silvestre, J.P.; Koyama, R.; de Souza, R.T. Anthocyanin accumulation and color development of ’Benitaka’ table grape subjected to exogenous abscisic acid application at different timings of ripening. Agronomy 2019, 9(4), 164. [Google Scholar] [CrossRef]
- Zoecklein, B.W. Viognier wine balance. Wines Vines 2013, February, 66–70. [Google Scholar]
- Champy, B. Climate change field reports. J. Wine Econ. 2016, 11(1). [Google Scholar] [CrossRef]
- Dobrei, A.; Dobrei, A.G.; Nistor, E.; Iordanescu, O.A.; Sala, F. Local grapevine germplasm from western of Romania - an alternative to climate change and source of typicity and authenticity. Agric. Sci. Procedia 2015, 6, 124–131. [Google Scholar] [CrossRef]
- Bucur, G.M.; Dejeu, L. Climate change trends in some Romanian viticultural centers. AgroLife Sci. J. https://agrolifejournal.usamv.ro/index.php/agrolife/article/view/130. 2016, 5(2). [Google Scholar]
- Omazić, B.; Prtenjak, M.T.; Prša, I.; Vozila, A.B.; Vučetić, V.; Karoglan, M.; Kontić, J.K.; Prša, Ž.; Anić, M.; Šimon, S.; Güttler, I. Climate change impacts on viticulture in Croatia: Viticultural zoning and future potential. Int. J. Clim. 2020, 40(13), 5634–5655. [Google Scholar] [CrossRef]
- Caccavello, G.; Giaccone, M.; Scognamiglio, P.; Forlani, M.; Basile, B. Influence of intensity of post-veraison defoliation or shoot trimming on vine physiology, yield components, berry and wine composition in Aglianico grapevines. Aust. J. Grape Wine Res. 2017, 23(2), 226–239. [Google Scholar] [CrossRef]
- Filippetti, I.; Movahed, N.; Allegro, G.; Valentini, G.; Pastore, C.; Colucci, E.; Intrieri, C. Effect of post-veraison source limitation on the accumulation of sugar, anthocyanins and seed tannins in Vitis vinifera cv. Sangiovese berries. Aust. J. Grape Wine Res. 2015, 21(1), 90–100. [Google Scholar] [CrossRef]
- Bucur, G.M.; Dejeu, L. Researches on situation and trends in climate change in south part of Romania and their effects on grapevine. Sci. Pap. Ser. B Hortic. 2017, LXI, 243–247. [Google Scholar]
- Ungureanu, G.; Boghita, E.; Ignat, G.; Costuleanu, C.L.; Sandu, A.V.; Bejinariu, C.; Vintu, C.R. Effect of climate change on pedological modifications and soil aridity process in vineyards. Rev. Chim. 2017, 68(11), 2662–2671. [Google Scholar] [CrossRef]
- Nistor, E.; Dobrei, A.G.; Camen, D. Growing season climate variability and its influence on Sauvignon Blanc and Pinot Gris berries and wine quality: study case in Romania (2005–2015). S. Afr. J. Enol. Vitic. 2018, 39(2). [Google Scholar] [CrossRef]
- Onache, A.; Sumedrea, D.I.; Florea, A.; Tănase, A. The influence of climatic conditions on oenological parameters of some wine cultivals from different Romanian vineyard. Rom. J. Hortic. 2020, 1, 103–110. [Google Scholar] [CrossRef]
- Răcoare, H.S.; Tomoioagă, L.L.; Comșa, M.; Muntean, D.M.; Botea, V.; Florean, A.V.; Sîrbu, A.D.; Chedea, V.S. Influence of the climatic conditions of the year 2022 on the grapevine phenology at SCDVV Blaj. Bull. Univ. Agric. Sci. Vet. Med. Cluj-Napoca 2022, 80(1). [Google Scholar] [CrossRef]
- Popescu, A.; Enache, V.; Simion, C.; Ene, D.; Donici, A.; Tabaranu, G. Researches concerning production planning in viticulture under the climate change. Economie 2010, 25(1). [Google Scholar]
- Bucur, G.M.; Dejeu, L. Phenological and some eno-carpological traits of thirteen new romanian grapevine varieties for white wine (Vitis vinifera L.) in the context of climate change. Sci. Pap. Ser. B Hortic. 2024, LXVIII(1), 254–263. [Google Scholar]
- Bucur, G.M.; Dejeu, L. Influence of climate variability on growth, yield and quality of grapes in the south part of Romania. Sci. Pap. Ser. B Hortic. 2014, LVIII, 133–138. [Google Scholar]
- Irimia, L.M.; Patriche, C.V.; Murariu, O.C. The impact of climate change on viticultural potential and wine grape varieties of a temperate wine growing region. Appl. Ecol. Environ. Res. 2018, 16(3), 2663–2680. [Google Scholar] [CrossRef]
- Dușa, D.Ș.; Heizer, R.T.; Heizer, M.G.; Baniță, S.I.; Călugăr, A.; Constantinescu, D.G.; Dobrei, A; Bunea, C.I. Cabernet Sauvignon variety behavioural analysis in Romanian vineyards areas under the climate change influences. Sci. Pap. Ser. B Hortic. 2024, LXVIII(2), 300–307. [Google Scholar]
- Rotaru, L. Soiuri de viţă de vie pentru struguri de vin; Editura Ion Ionescu de la Brad: Iaşi, Romania, 2009. [Google Scholar]
- Cotea, V.D.; Barbu, N.; Grigorescu, C.C.; Cotea, V.V. Podgoriile și vinurile României; Editura Academiei Române: Bucharest, Romania, 2003. [Google Scholar]
- Scutarașu, E.C. Studii privind influenţa folosirii unor preparate enzimatice în tehnologia de obţinere a vinurilor albe în podgoria Iaşi. Doctoral thesis, USV Iași, Romania, 2021. [Google Scholar]
- Cotea, V.D.; Barbu, N.; Grigorescu, C.; Cotea, V.V. Podgoriile și vinurile României; Editura Academiei Române: Bucharest, Romania, 2000. [Google Scholar]
- Cimpoi, V.I. Cercetări privind comportarea în pepinieră a unor soiuri noi de viță de vie obținute la Stațiunea de Cercetare Dezvoltare pentru Viticultură și Vinificație Iași. Doctoral Thesis, USV Iași, Romania, 2021. [Google Scholar]
- Filimon, R.M.; Bunea, C.I.; Filimon, R.V.; Bora, F.D.; Damian, D. Long-therm evolution of the climatic factors and its influence on grape quality in northeastern Romania. Horticulturae 2024, 10(7), 705. [Google Scholar] [CrossRef]
- International Organization of Wine and Vine. Guidelines for studying climate variability on vitiviniculture in the context of climate change and its evolution, Paris, France, 2015a. Available online: https://www.oiv.int/node/3224 (accessed on 11 January 2026).
- International Organization of Wine and Vine. 3rd edition of "OIV Descriptor list of grape vine varieties and Vitis species", Dijon, France, 2023.
- International Organization of Wine and Vine. Compendium of International methods of wine and must analysis, Dijon, France, 2025.
- International Organization of Wine and Vine. Review document on sensory analysis of wine, Paris, France, 2015b. Available online: https://www.oiv.int/public/medias/3307/review-on-sensory-analysis-of-wine (accessed on 11 January 2026).
- ISO 3591: 1977; Sensory Analysis. Apparatus. Wine-Tasting Glass. ISO: Geneva, Switzerland, 1977.
- ISO 8589: 2007; Sensory Analysis. General Guidance for the Design of Test Room. ISO: Geneva, Switzerland, 2007.
- Droulia, F.; Charalampopoulos, I. Future climate change impacts on European Viticulture: A review on recent scientific advances. Atmosphere 2021, 12(4), 495. [Google Scholar] [CrossRef]
- Xu, Y.; Castel, T.; Richard, Y.; Cuccia, C.; Bois, B. Burgundy regional climate change and its potential impact on grapevines. Clim. Dyn. 2012, 39, 1613–1626. [Google Scholar] [CrossRef]
- Alikadic, A.; Pertot, I.; Eccel, E.; Dolci, C.; Zarbo, C.; Caffarra, A.; de Filippi, R.; Furlanello, C. The impact of climate change on grapevine phenology and the influence of altitude: A regional study. Agric. For. Meteorol. 2019, 271, 73–82. [Google Scholar] [CrossRef]
- Shmuleviz, R.; Amato, A.; Commisso, M.; D’Incà, E.; Luzzini, G.; Ugliano, M.; Fasoli, M.; Zenoni, S.; Tornielli, G.B. Temperature affects organic acid, terpene and stilbene metabolisms in wine grapes during postharvest dehydration. Front. Plant Sci. 2023, 14. [Google Scholar] [CrossRef] [PubMed]
- Liu, J.; Zhu, X.; Ullah, N.; Tao, Y. Aroma glycosides in grapes and wine. J. Food Sci. 2017, 82(2), 248–259. [Google Scholar] [CrossRef] [PubMed]
Figure 1.
Dynamics of air temperature in the Iași-Copou vineyard (2020–2024). I–XII–months of the year; Avg–monthly average air temperature; Max–maximum air temperature; Min–minimum air temperature; Red dots–Annual average air temperature.
Figure 1.
Dynamics of air temperature in the Iași-Copou vineyard (2020–2024). I–XII–months of the year; Avg–monthly average air temperature; Max–maximum air temperature; Min–minimum air temperature; Red dots–Annual average air temperature.
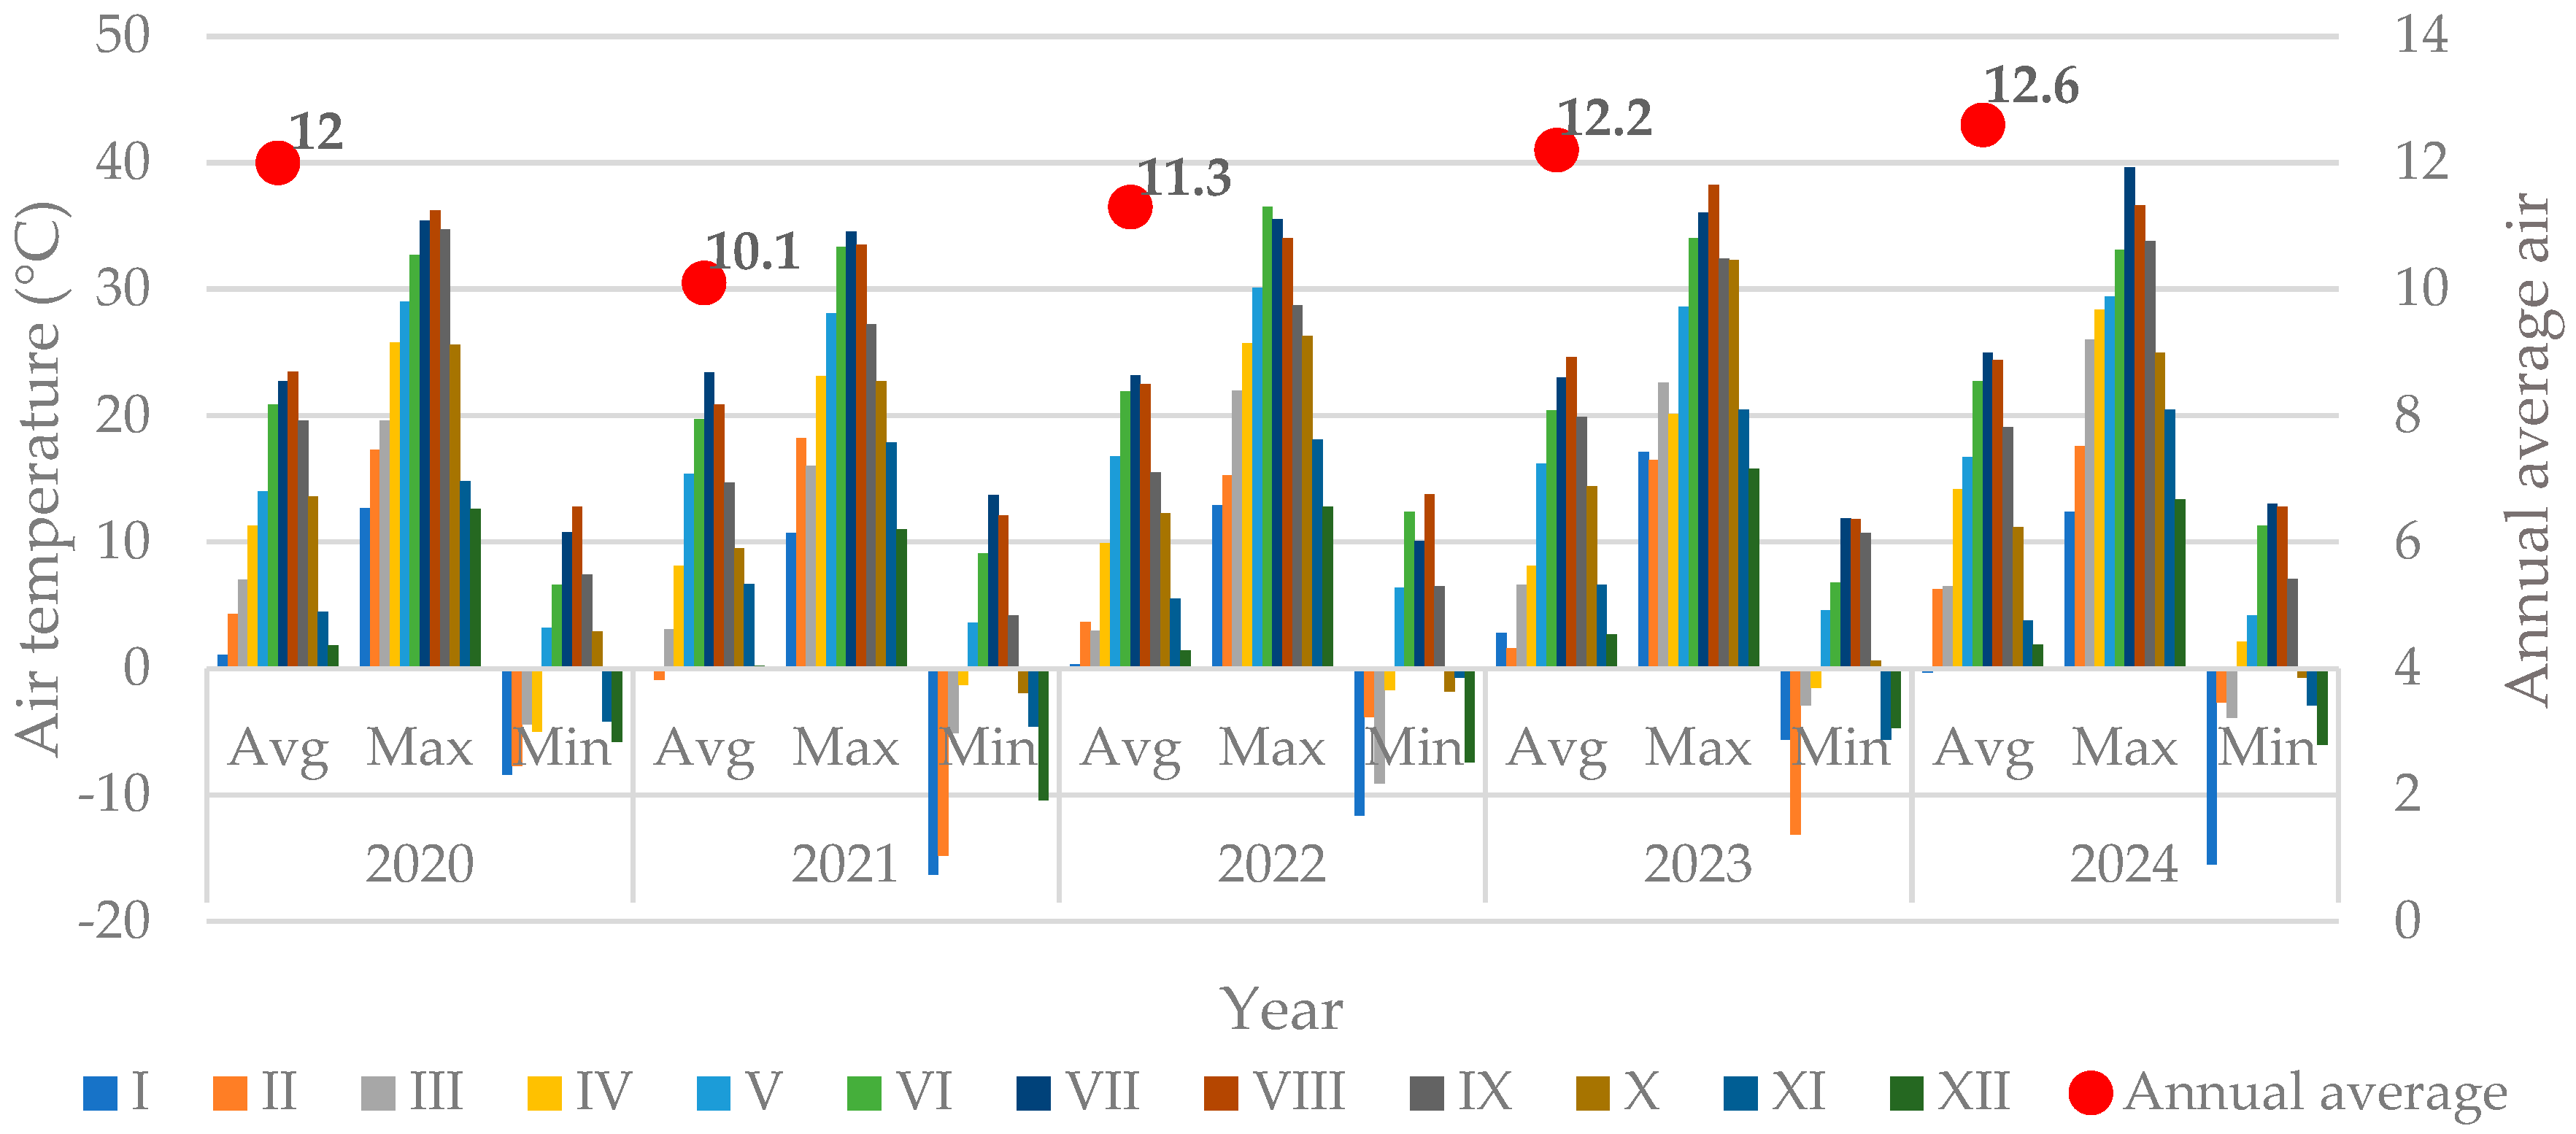
Figure 2.
Evolution of sunshine duration (hours) in the Iași-Copou vineyard (2020–2024). I–XII–months of the year; Sum–total hours of sunshine duration.
Figure 2.
Evolution of sunshine duration (hours) in the Iași-Copou vineyard (2020–2024). I–XII–months of the year; Sum–total hours of sunshine duration.
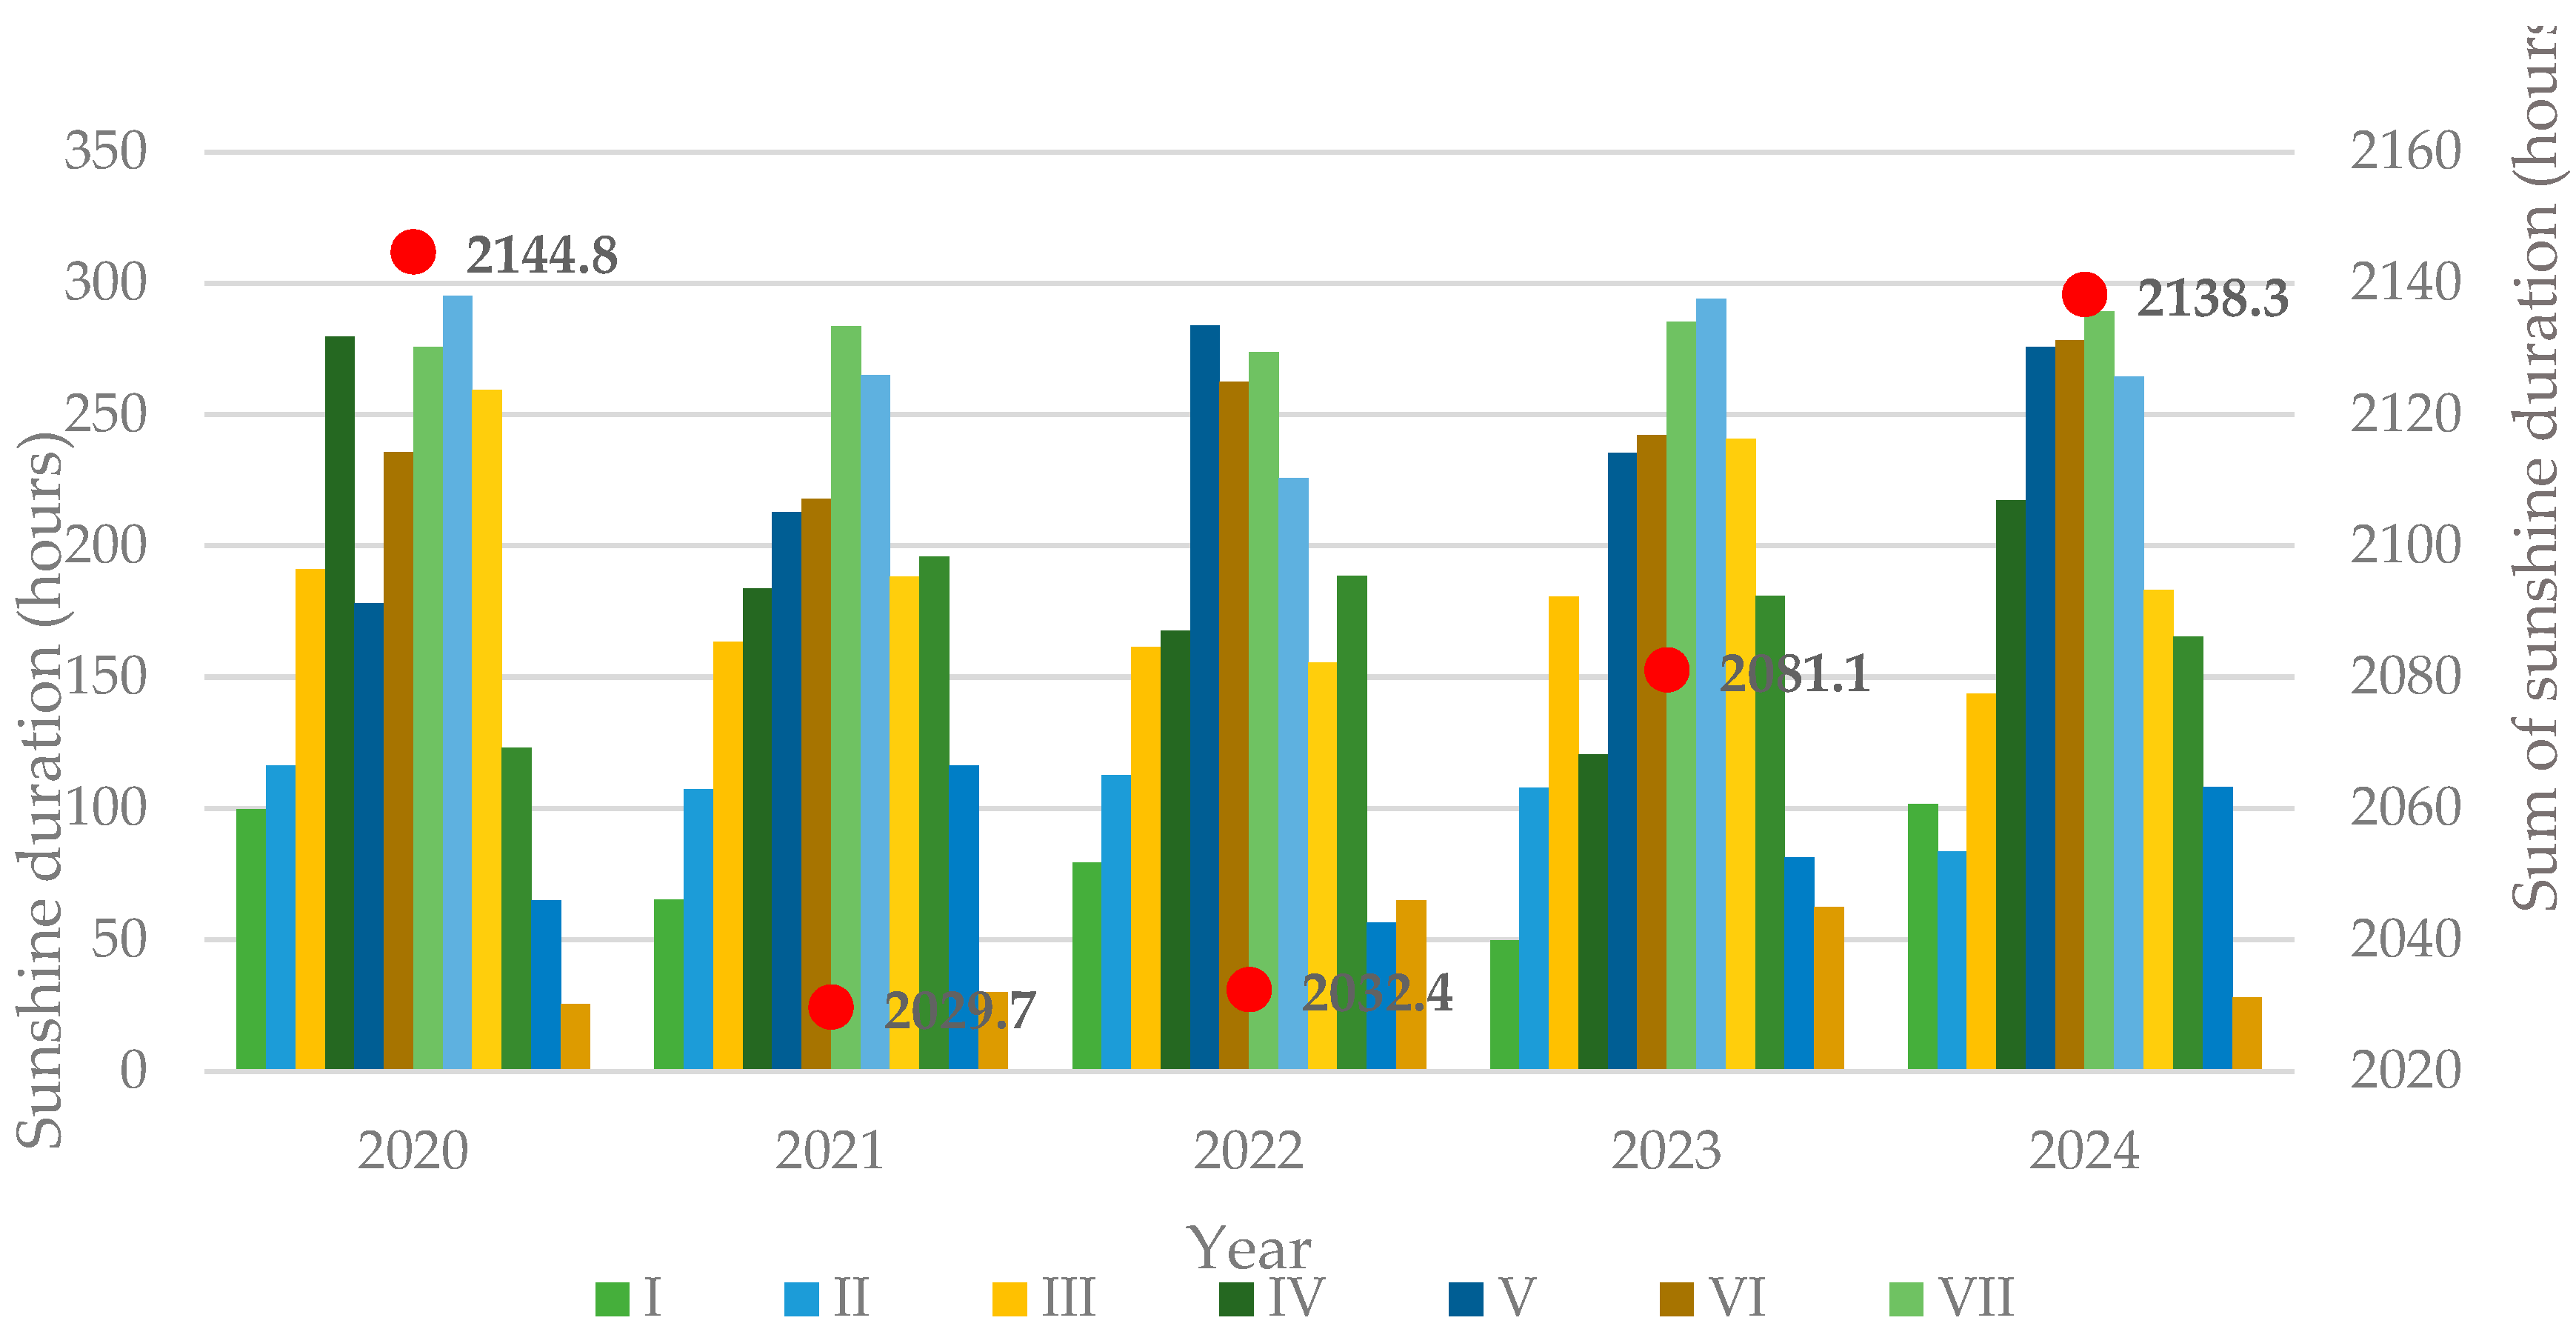
Figure 3.
Variation of soil temperatures in the Iași-Copou vineyard (2020–2024). I–XII–months of the year; Avg–monthly average air temperature; Max–maximum air temperature; Min–minimum air temperature; Red dots–Annual average soil temperature.
Figure 3.
Variation of soil temperatures in the Iași-Copou vineyard (2020–2024). I–XII–months of the year; Avg–monthly average air temperature; Max–maximum air temperature; Min–minimum air temperature; Red dots–Annual average soil temperature.
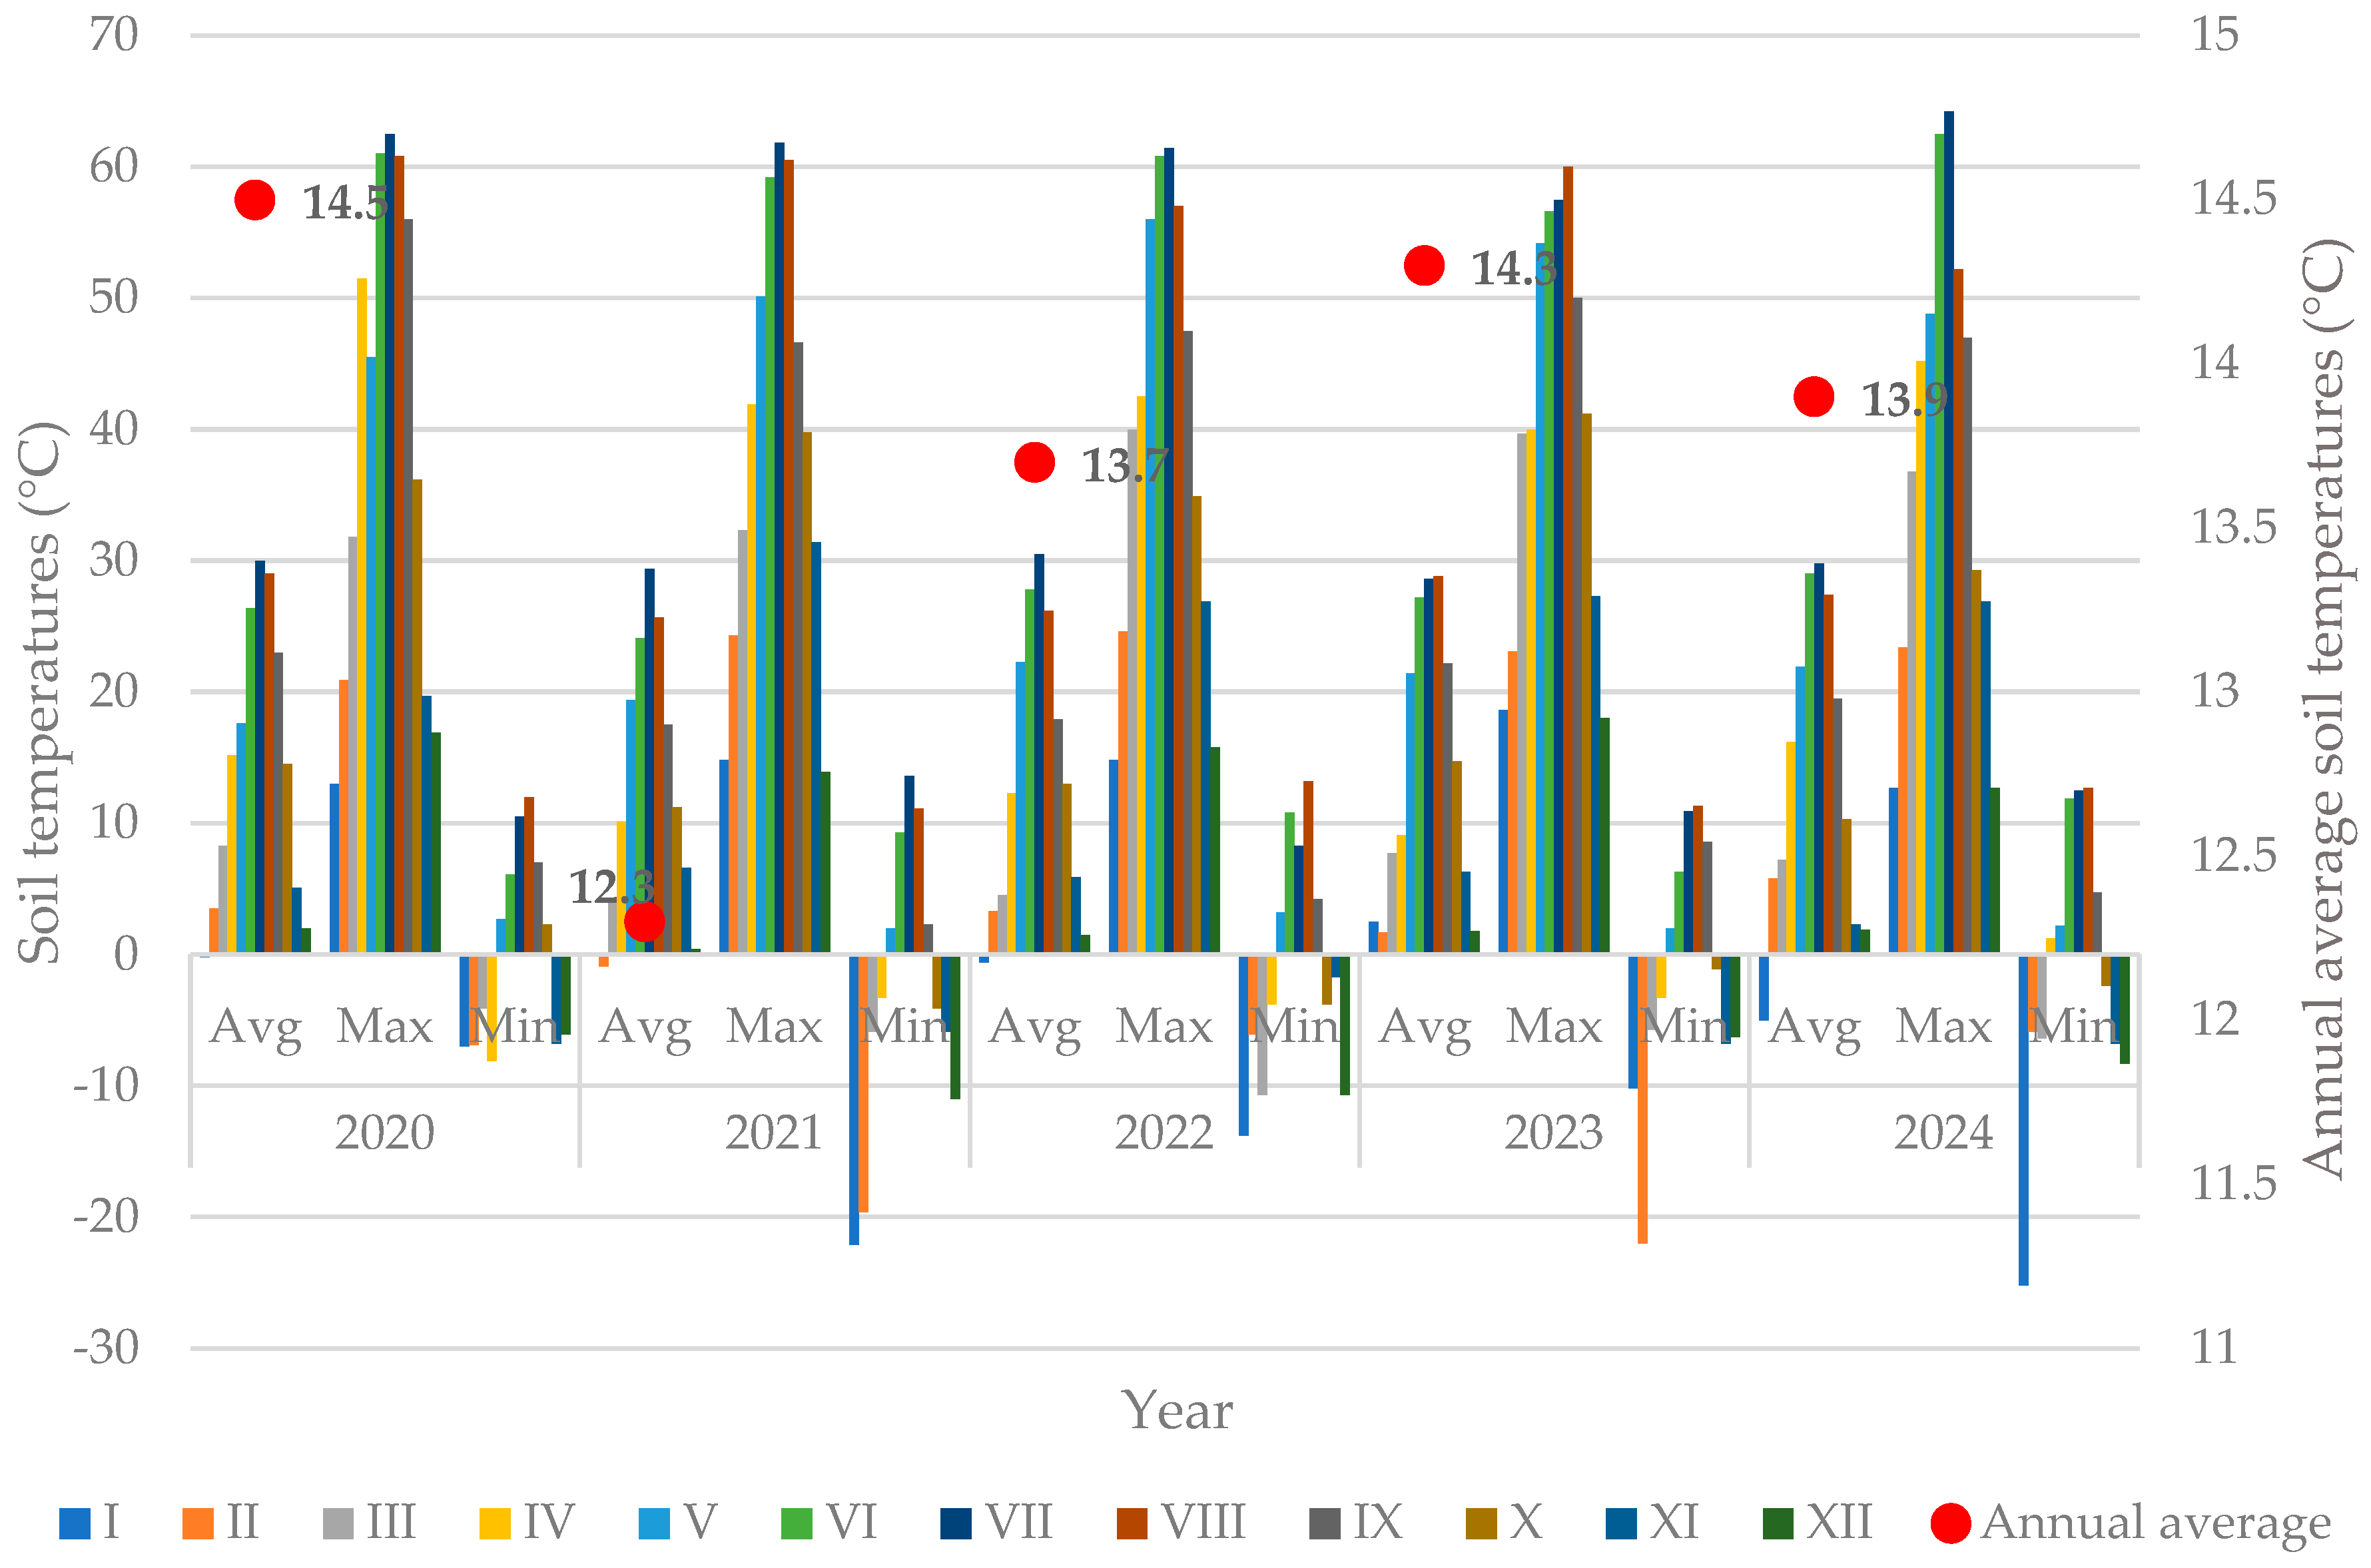
Figure 4.
Soil hygroscopicity levels recorded in the Iași-Copou vineyard (2020–2024). I–XII–months of the year; Red dots–Annual average hygroscopicity.
Figure 4.
Soil hygroscopicity levels recorded in the Iași-Copou vineyard (2020–2024). I–XII–months of the year; Red dots–Annual average hygroscopicity.
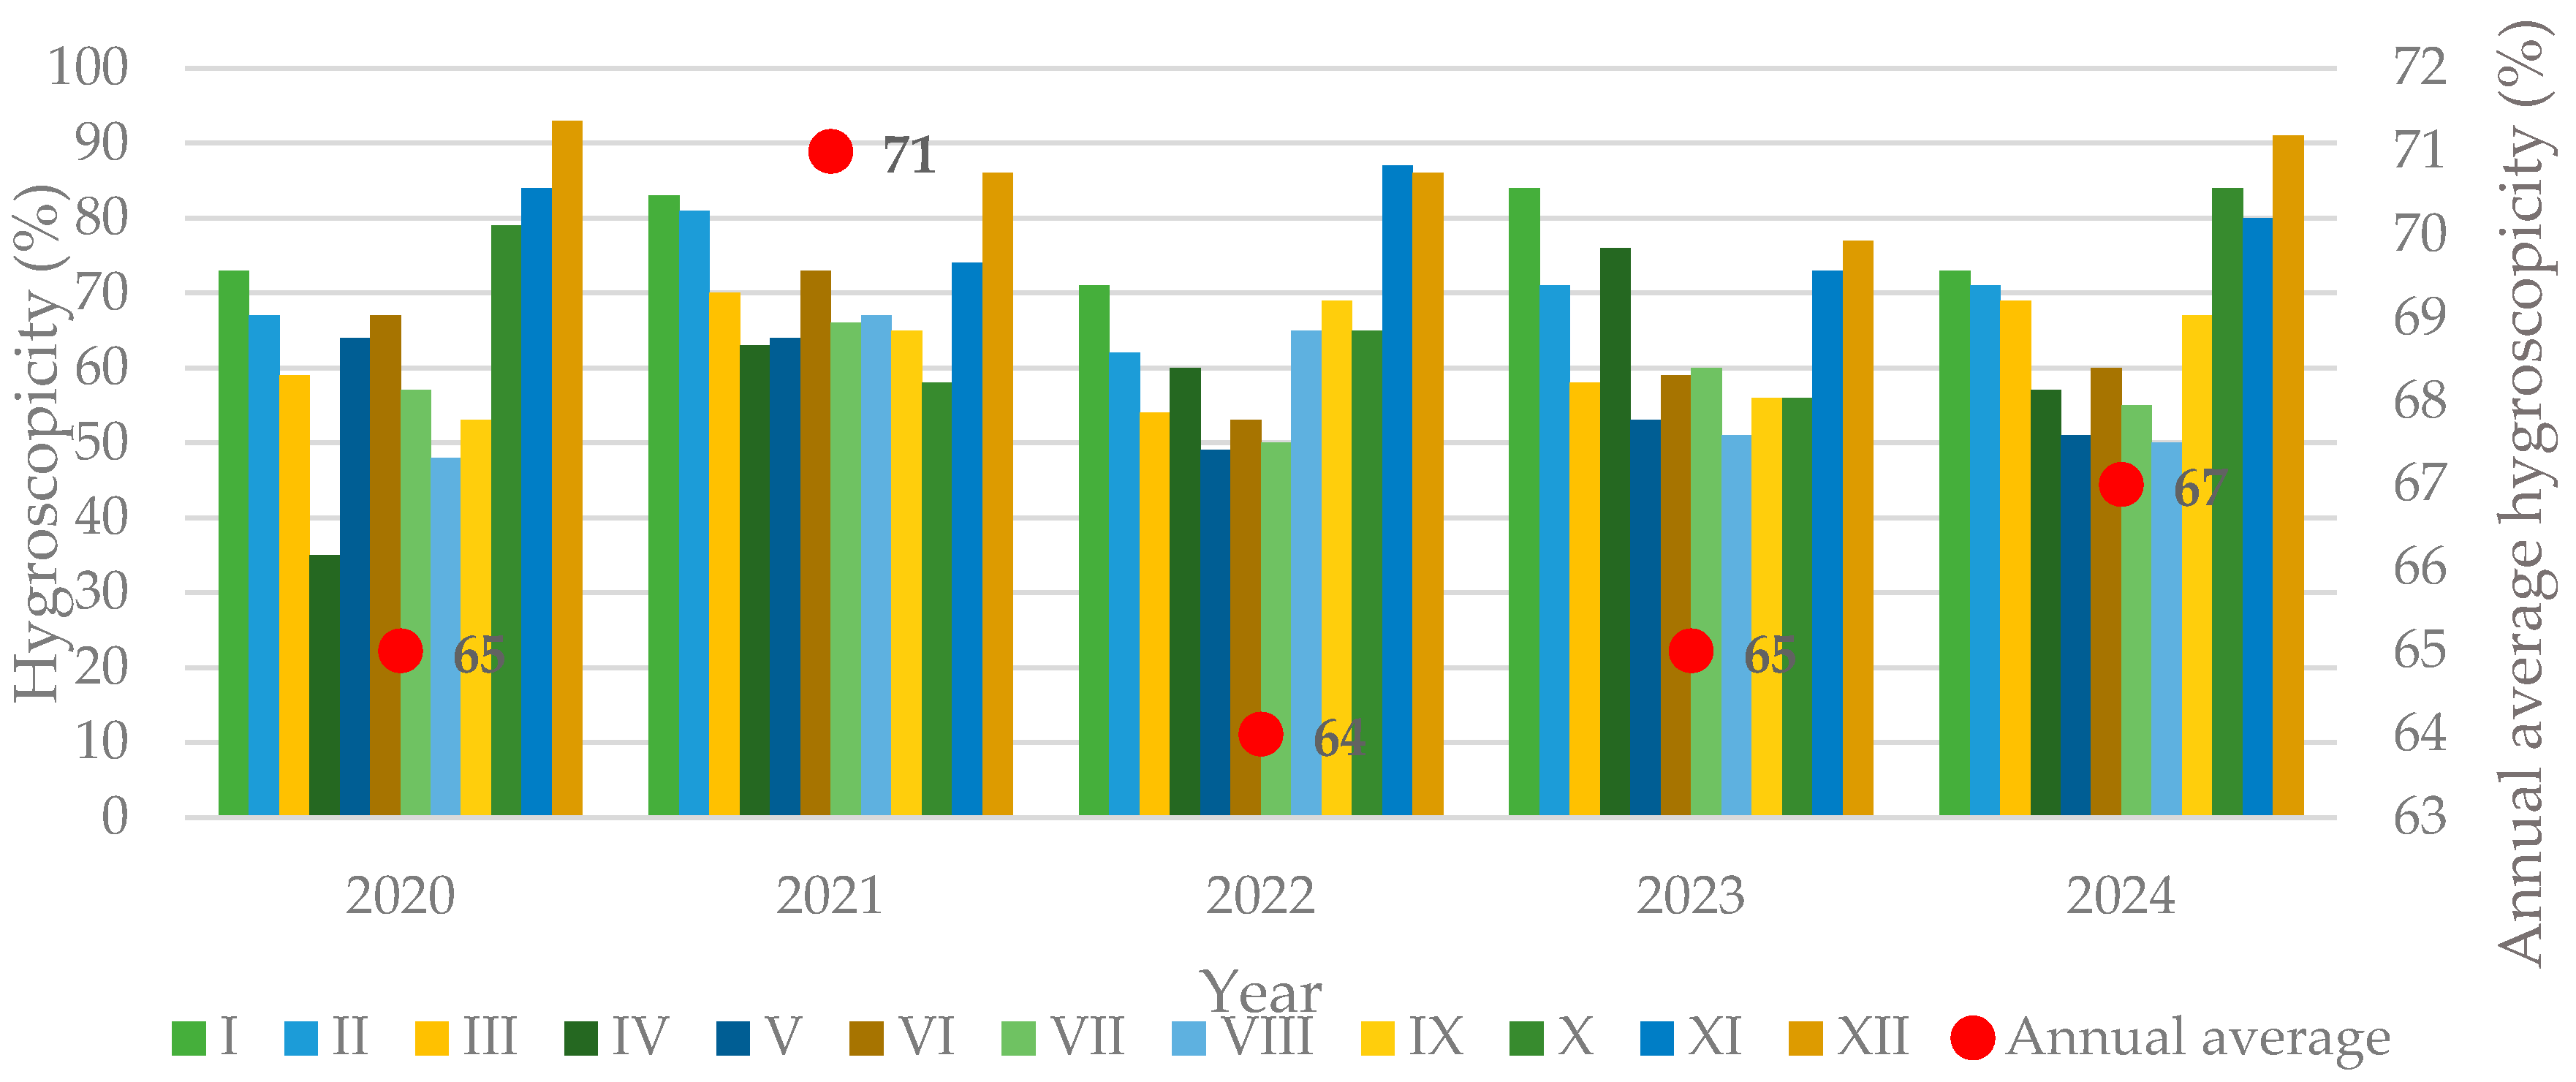
Figure 5.
Precipitation regime recorded in the Iași-Copou vineyard (2020–2024). I–XII–months of the year; Sum–total annual precipitation.
Figure 5.
Precipitation regime recorded in the Iași-Copou vineyard (2020–2024). I–XII–months of the year; Sum–total annual precipitation.
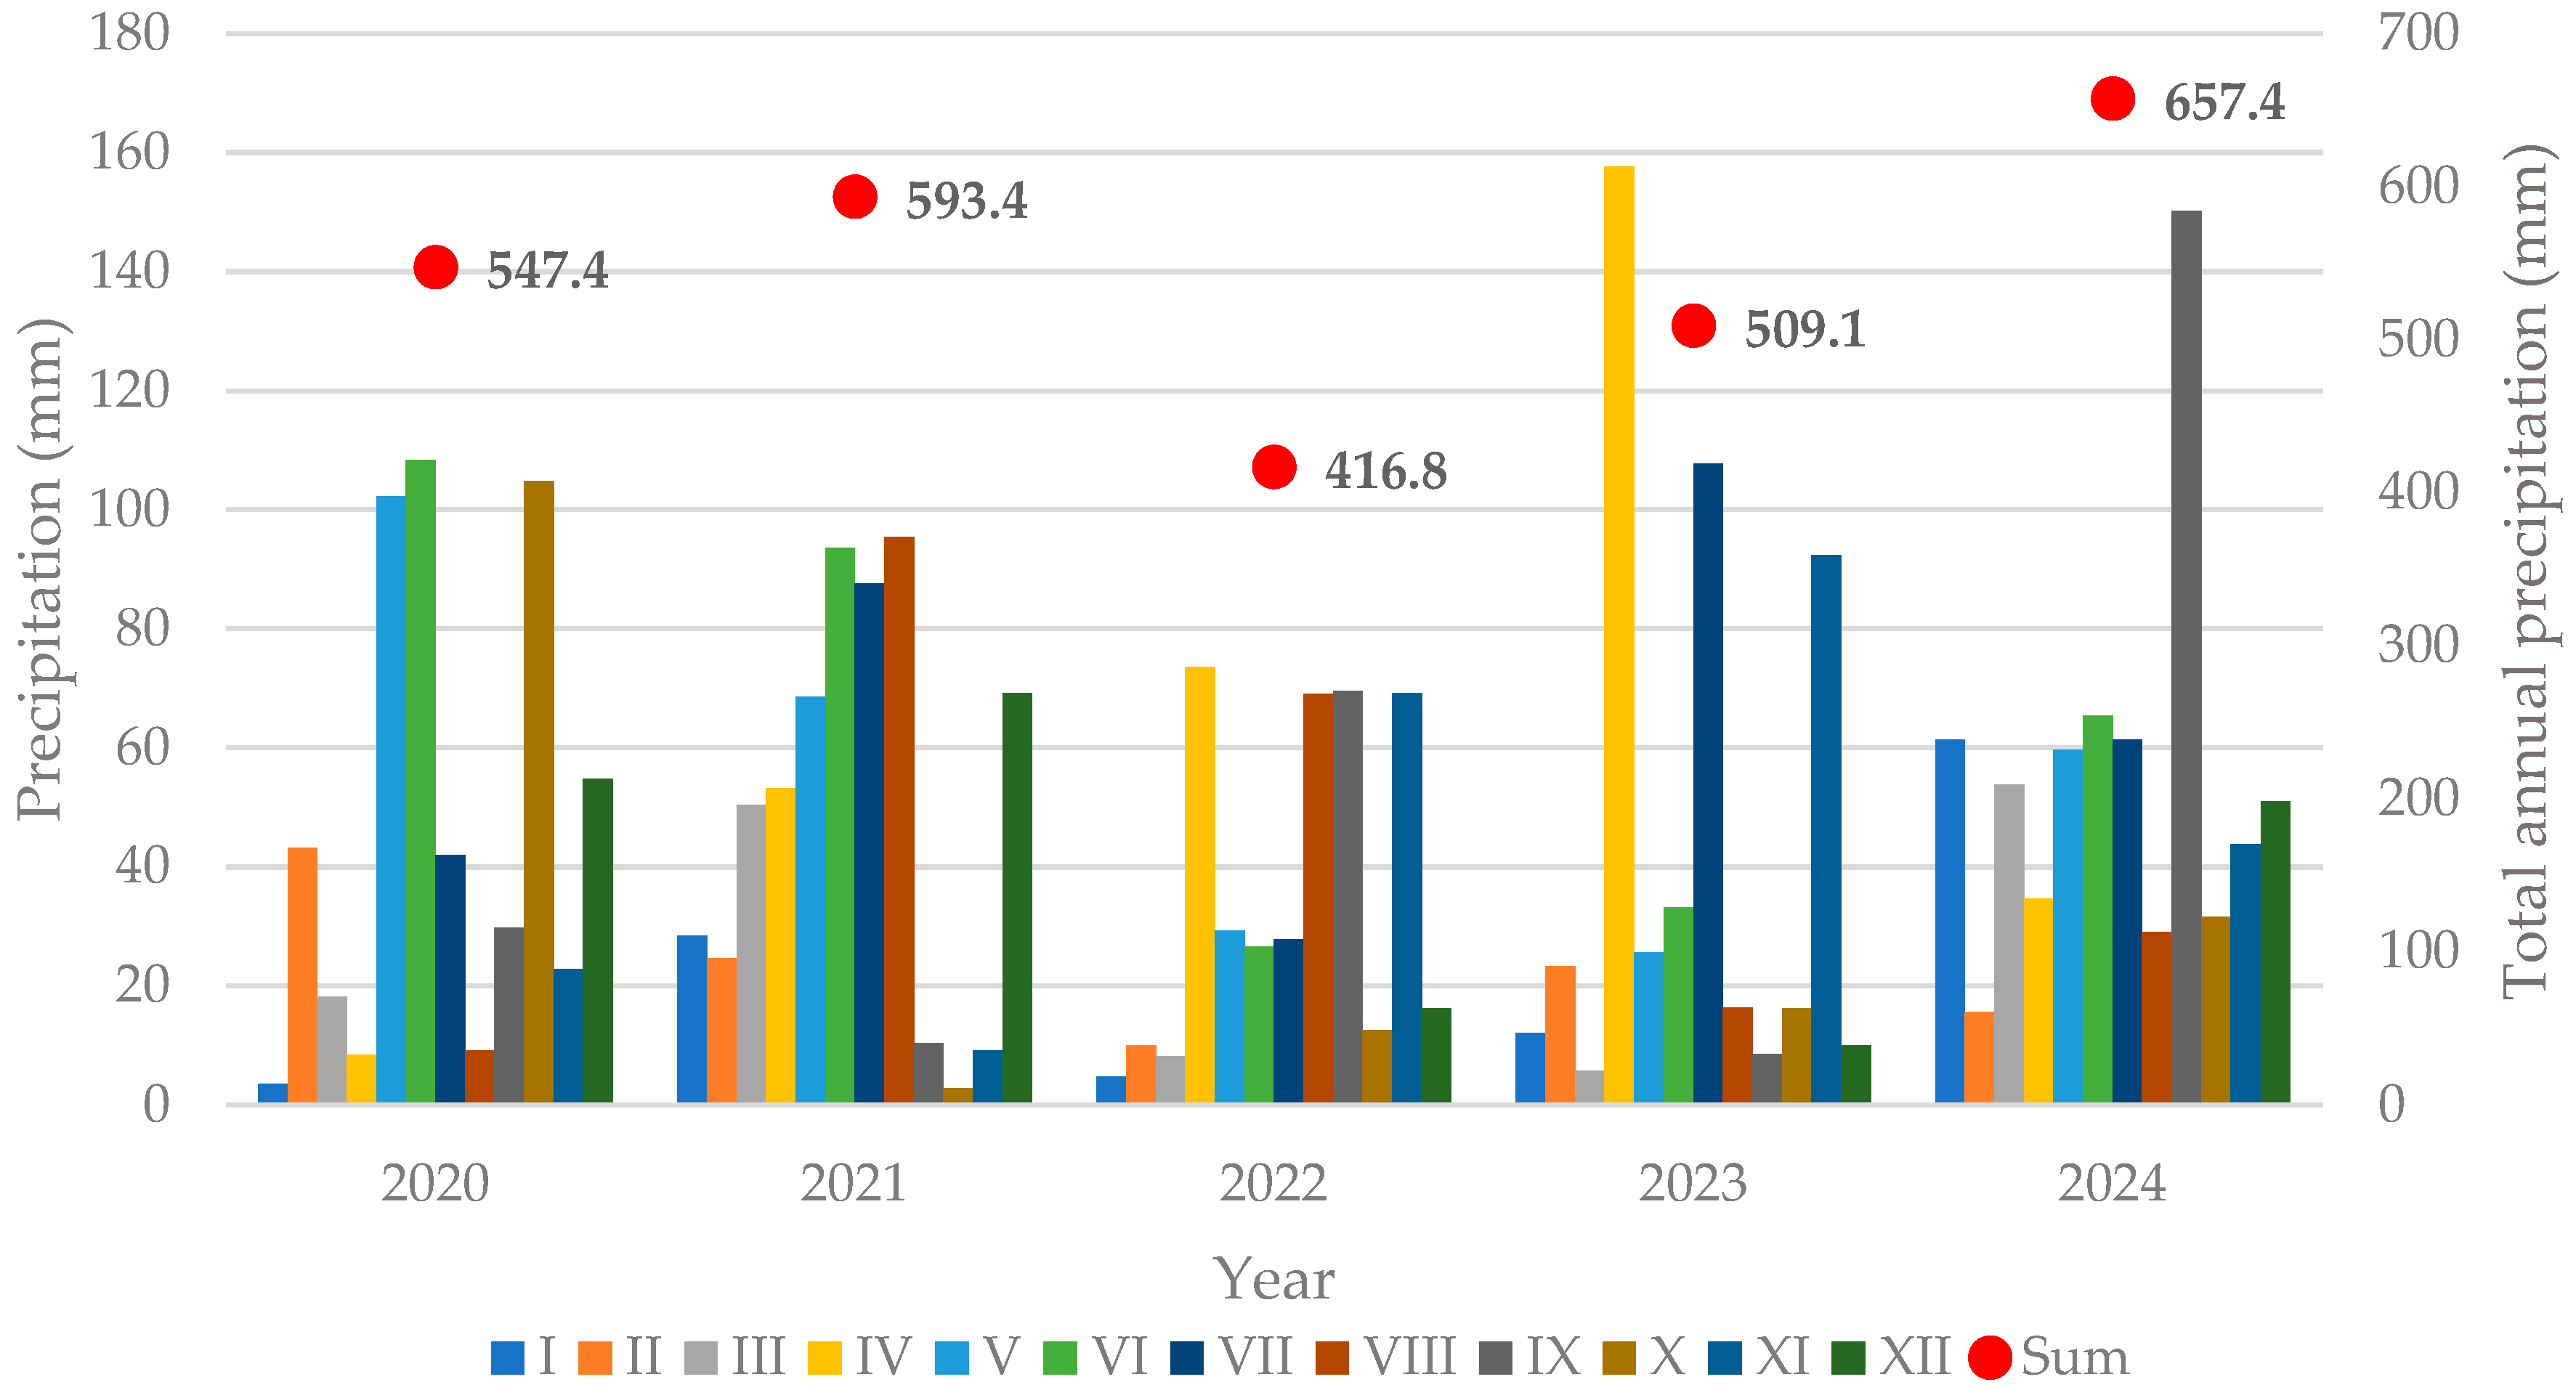
Figure 6.
Phenological timeline of Golia variety (2020–2024), illustrating dates of onset and duration (in days) for each growth stage.
Figure 6.
Phenological timeline of Golia variety (2020–2024), illustrating dates of onset and duration (in days) for each growth stage.
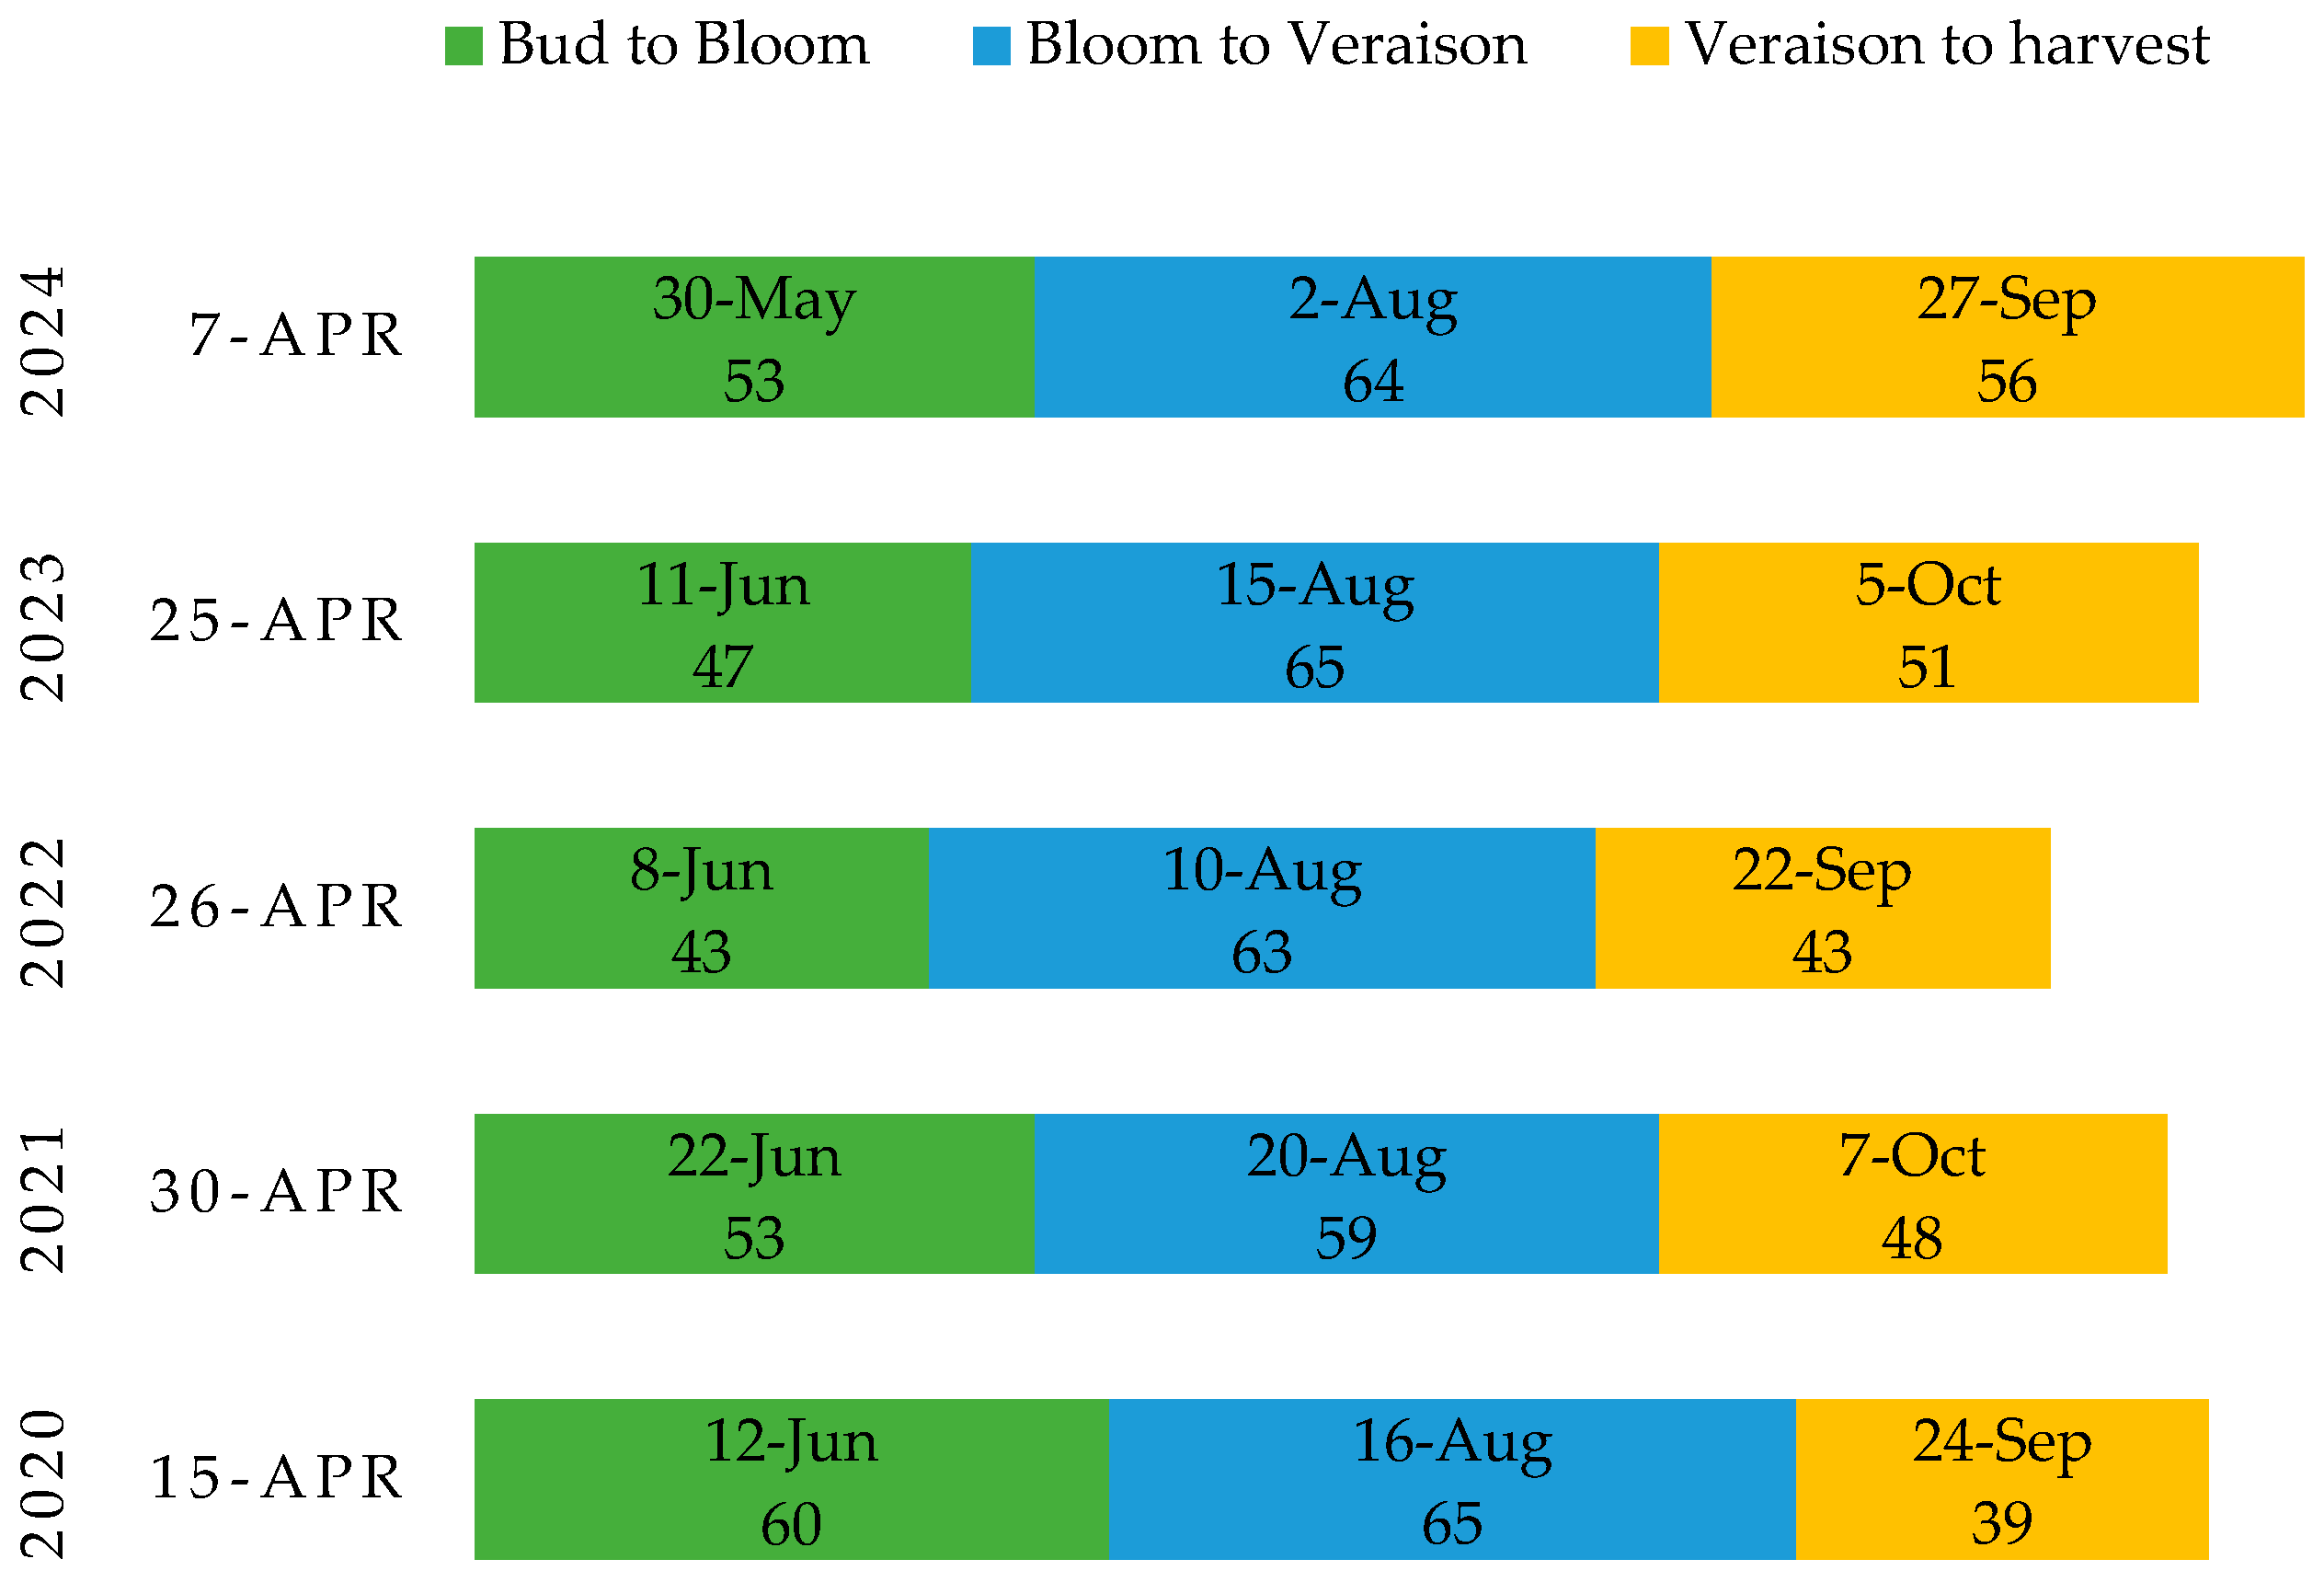
Figure 7.
Variation of grape actual yield according to average recorded air temperatures. Average annual temperatures (a); average temperatures in the spring months (b); average temperatures during the grape ripening period (c); average temperatures in the summer months (d); average temperatures in the winter months (e); R2–coefficient of determination.
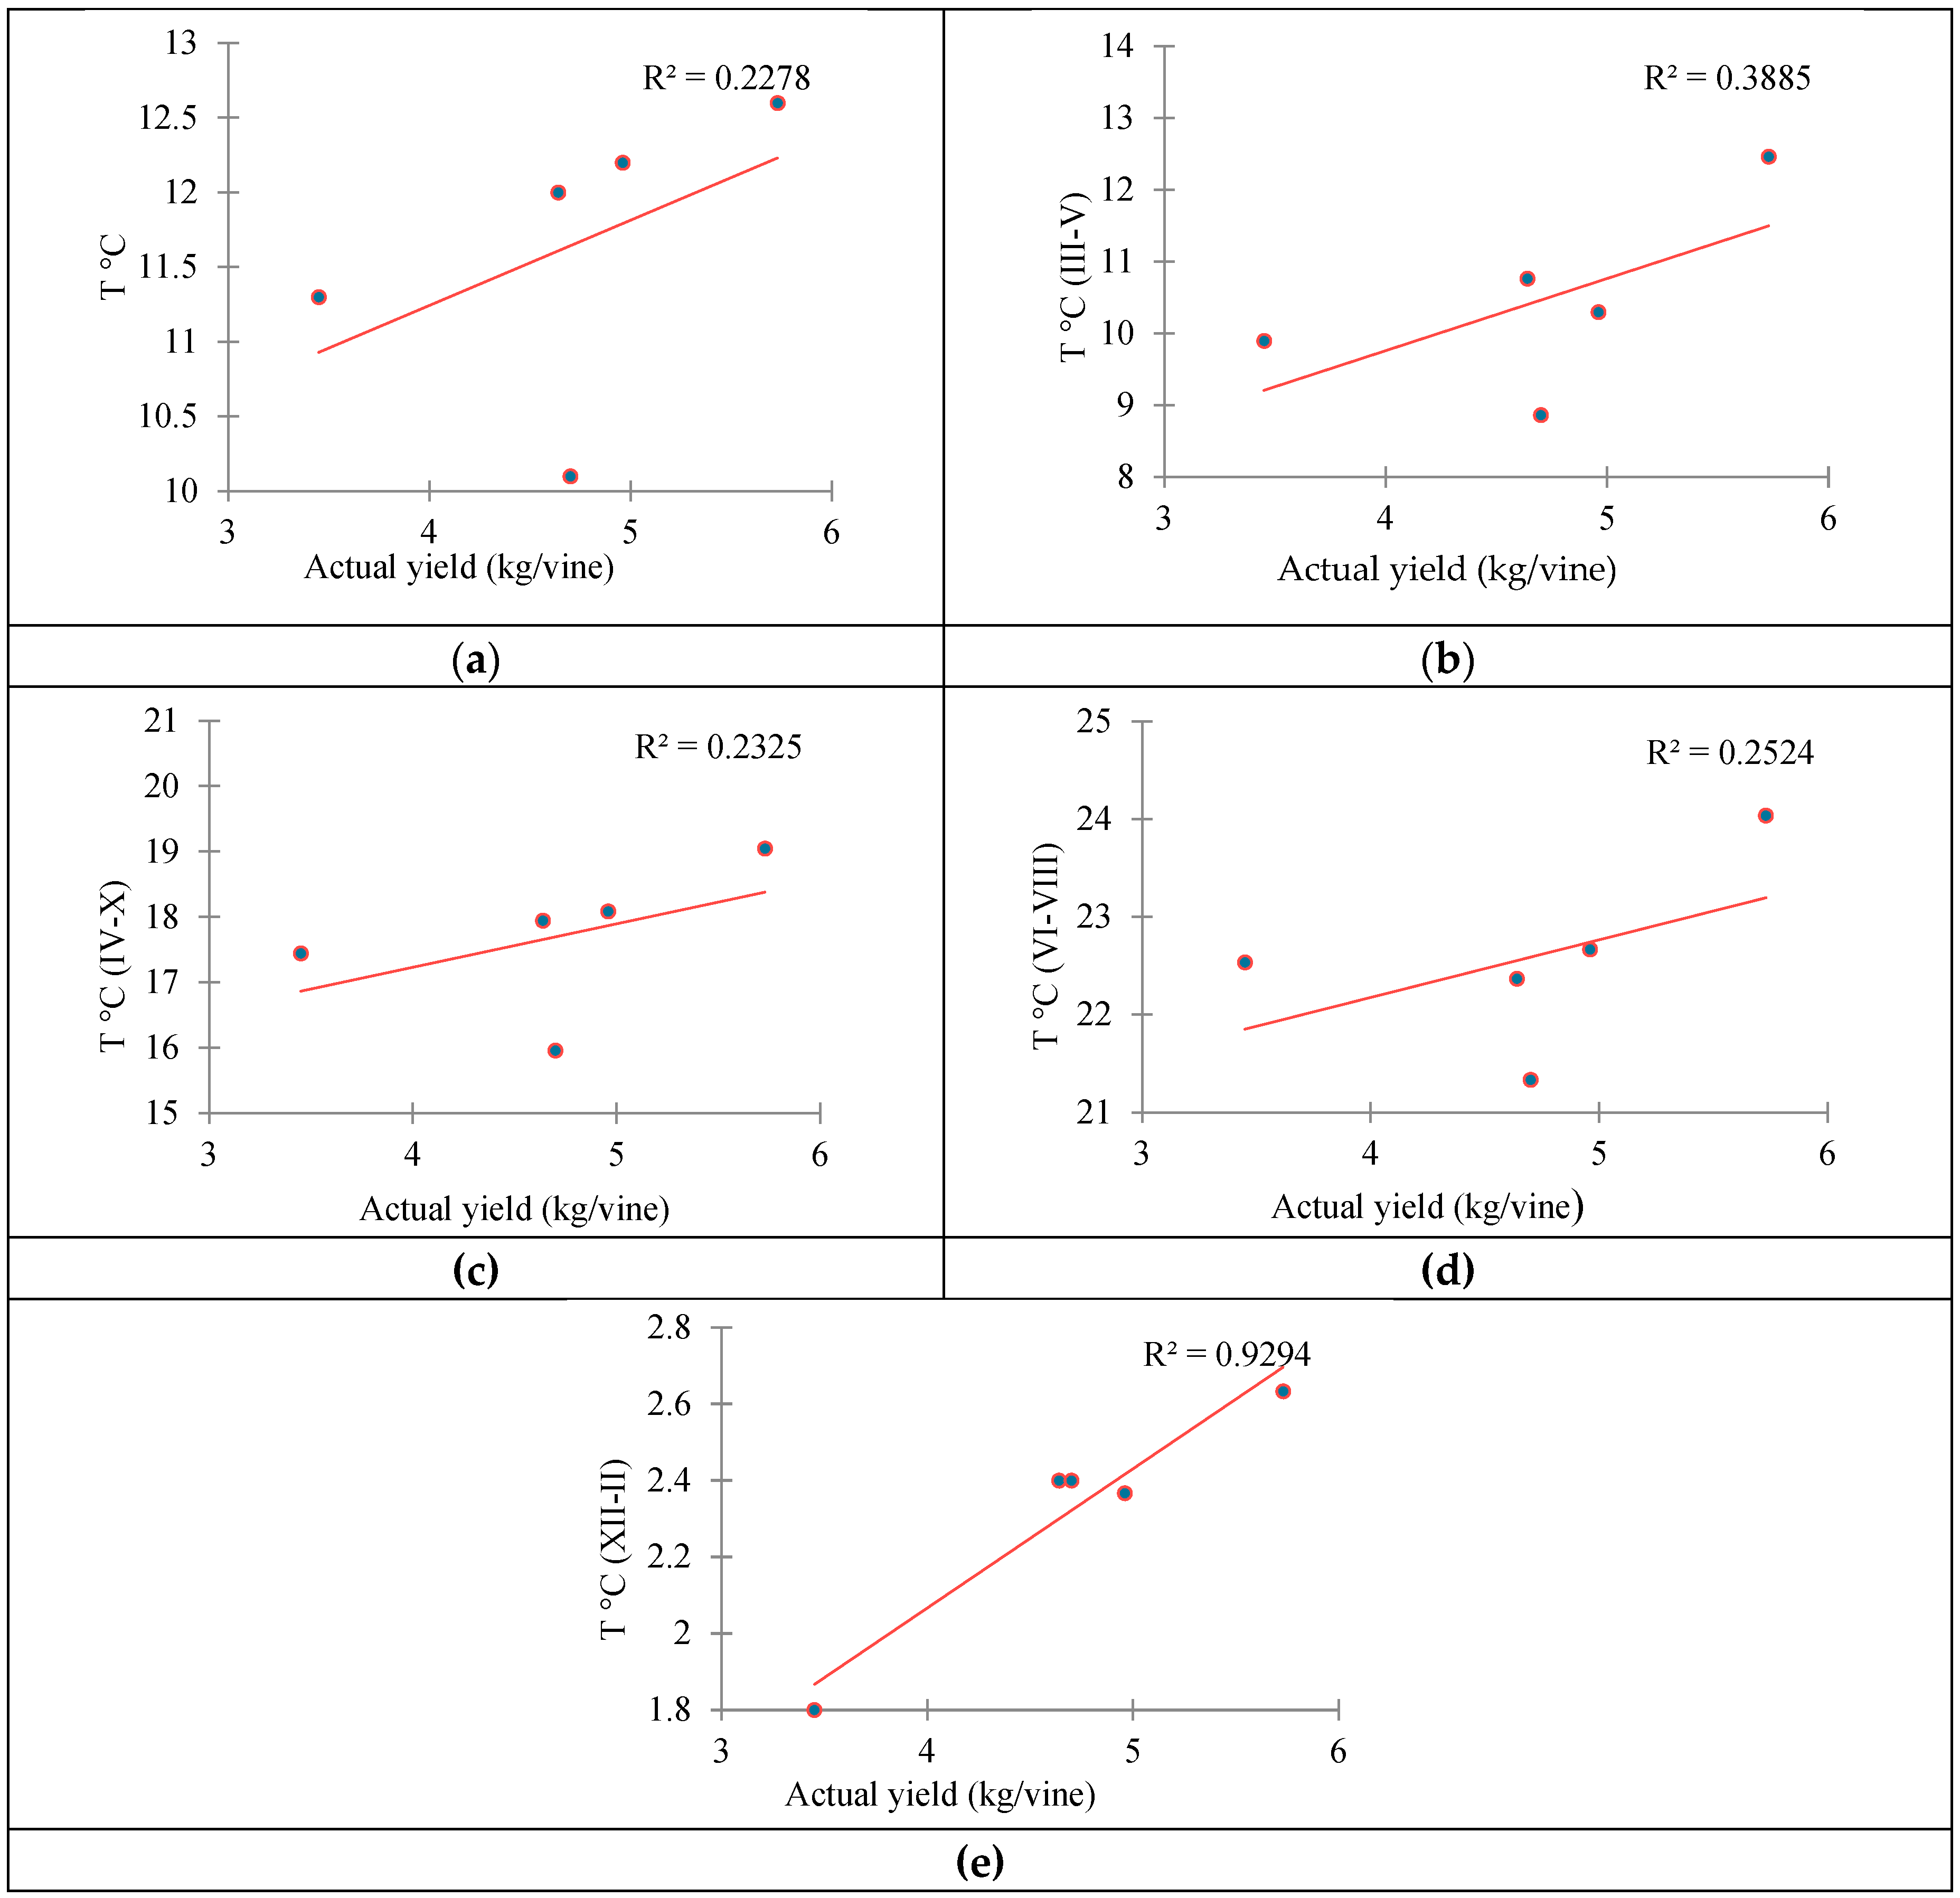
Figure 8.
Variation of grapes actual yield according to precipitation. Average annual precipitation (a); average precipitation in the spring months (b); average precipitation during the grape ripening period (c); average precipitation in the summer months (d); average precipitation in the winter months (e); R2–coefficient of determination.
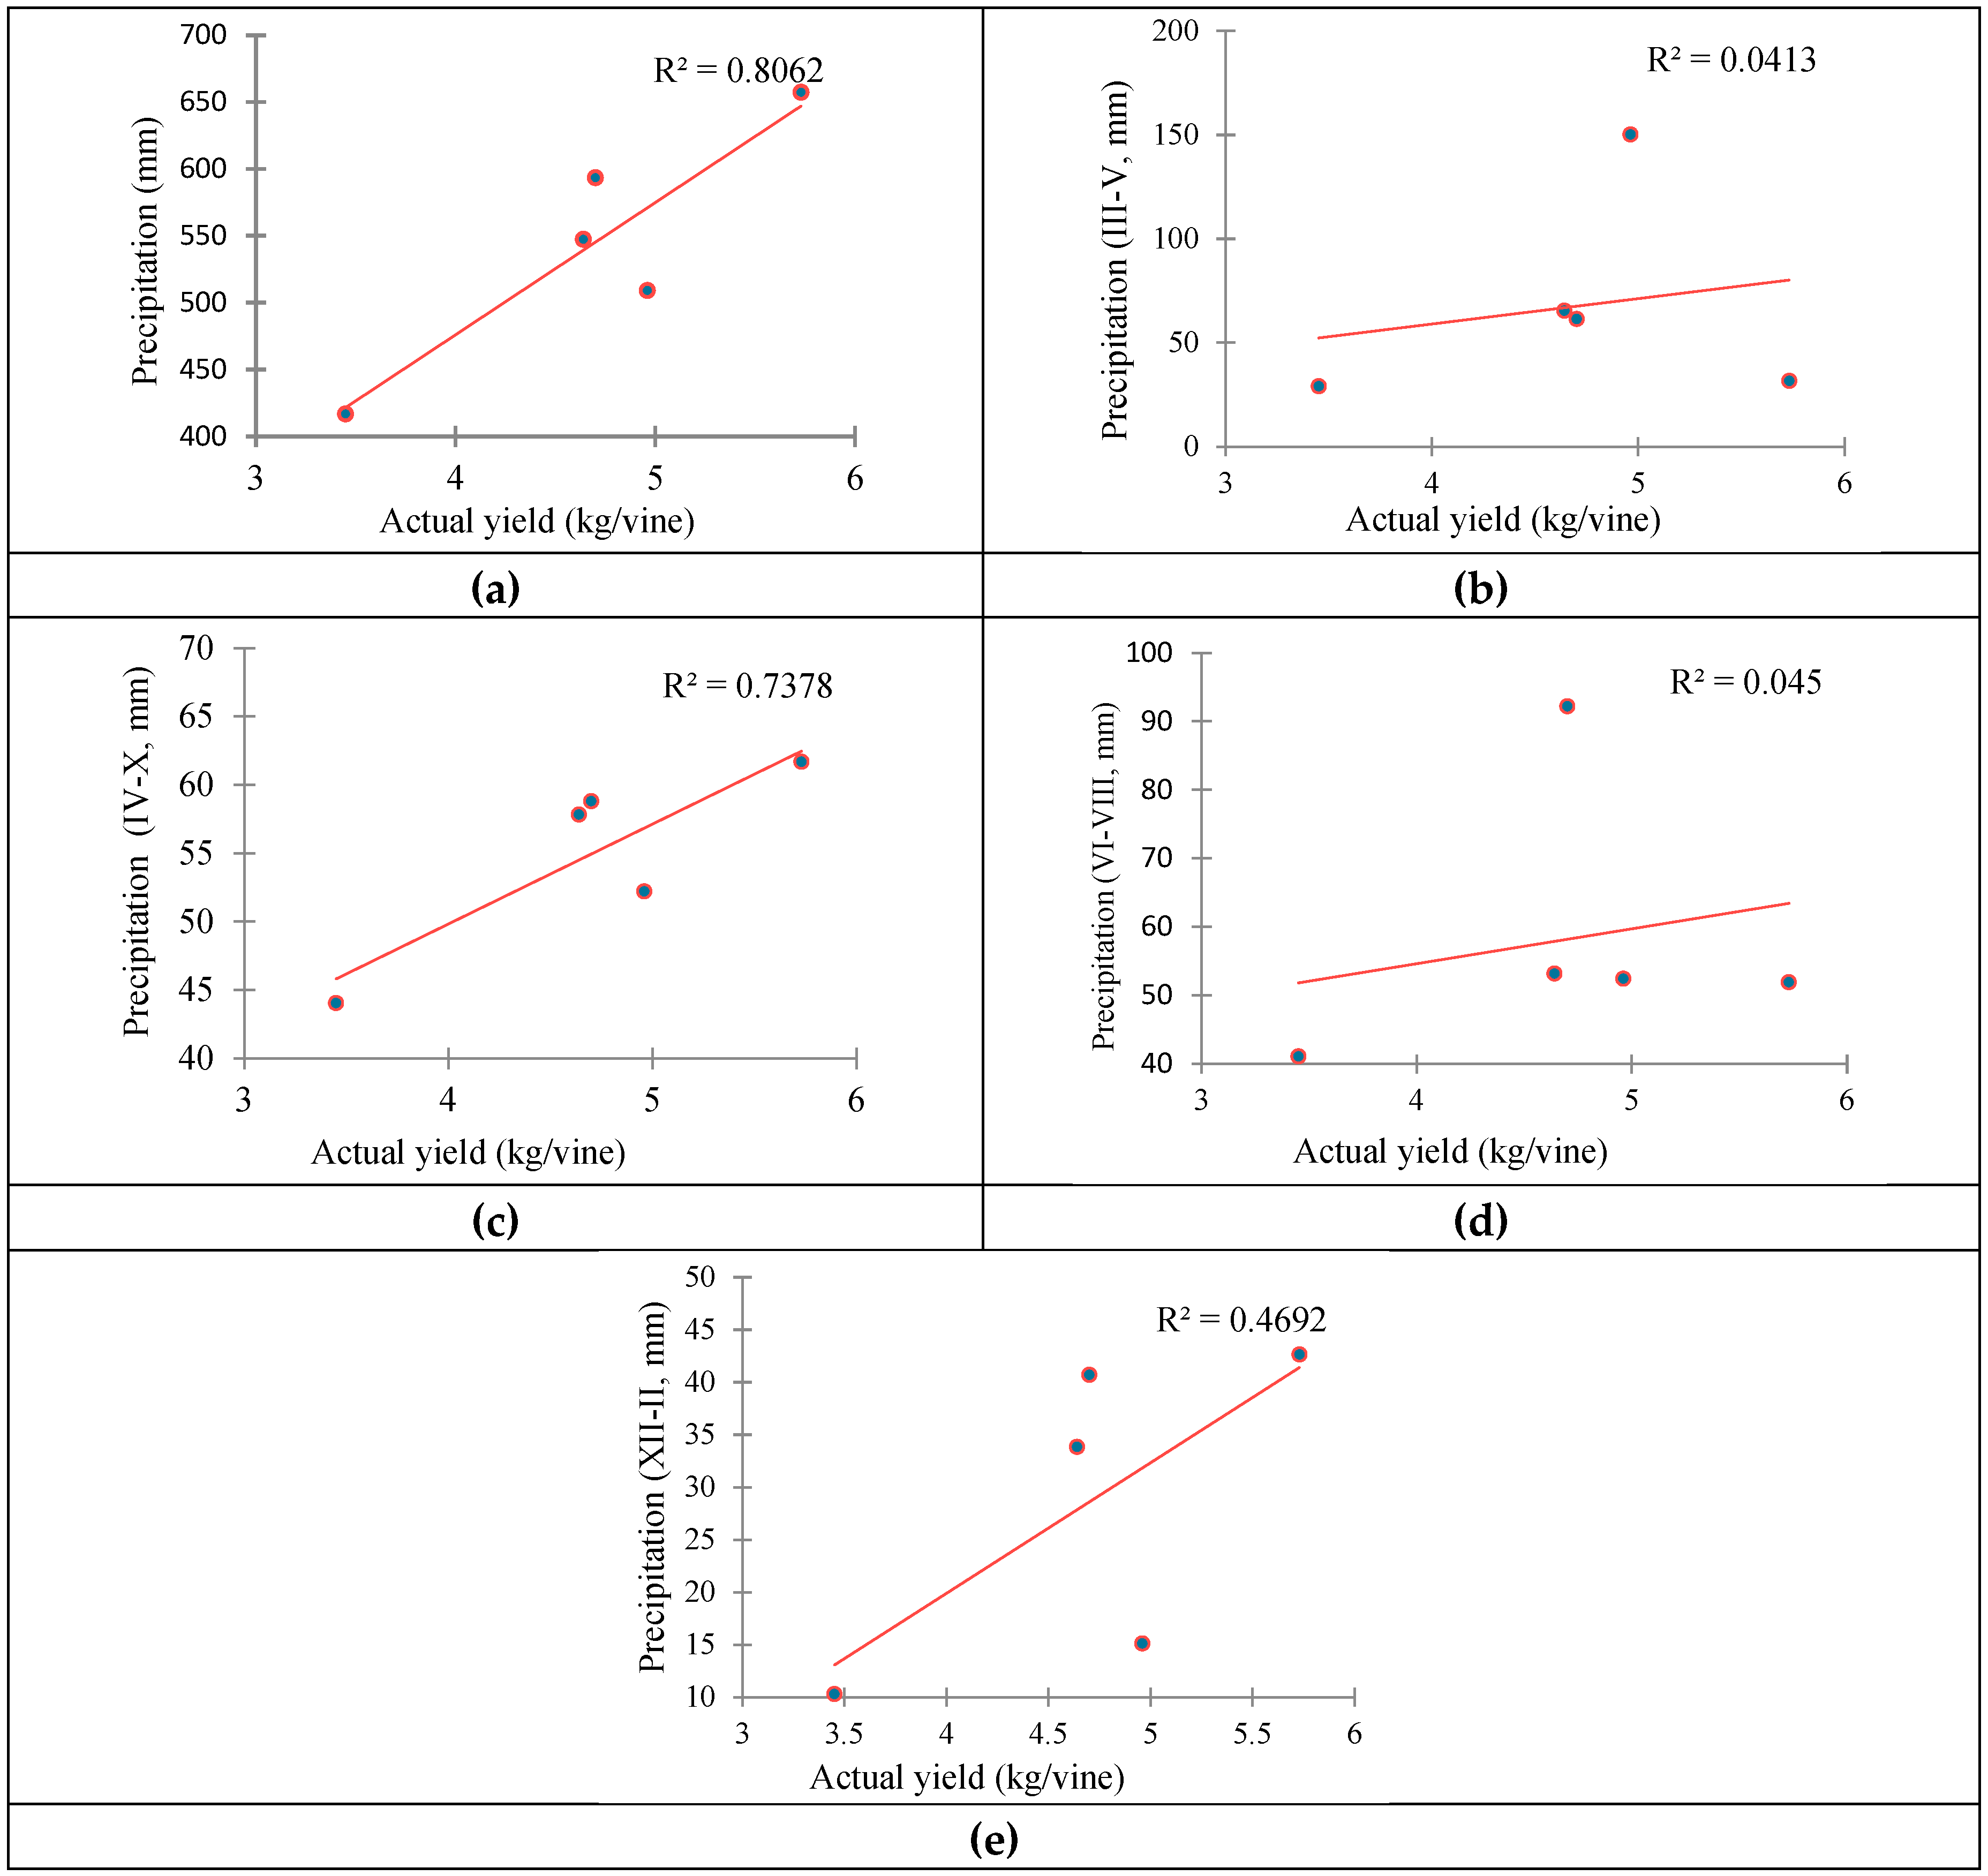
Figure 9.
Variation of 100–berry weight depending on climatic conditions. Average annual soil temperatures (a); average annual air temperatures (b); average annual precipitation (c); sunshine duration (d); R2–coefficient of determination.
Figure 9.
Variation of 100–berry weight depending on climatic conditions. Average annual soil temperatures (a); average annual air temperatures (b); average annual precipitation (c); sunshine duration (d); R2–coefficient of determination.
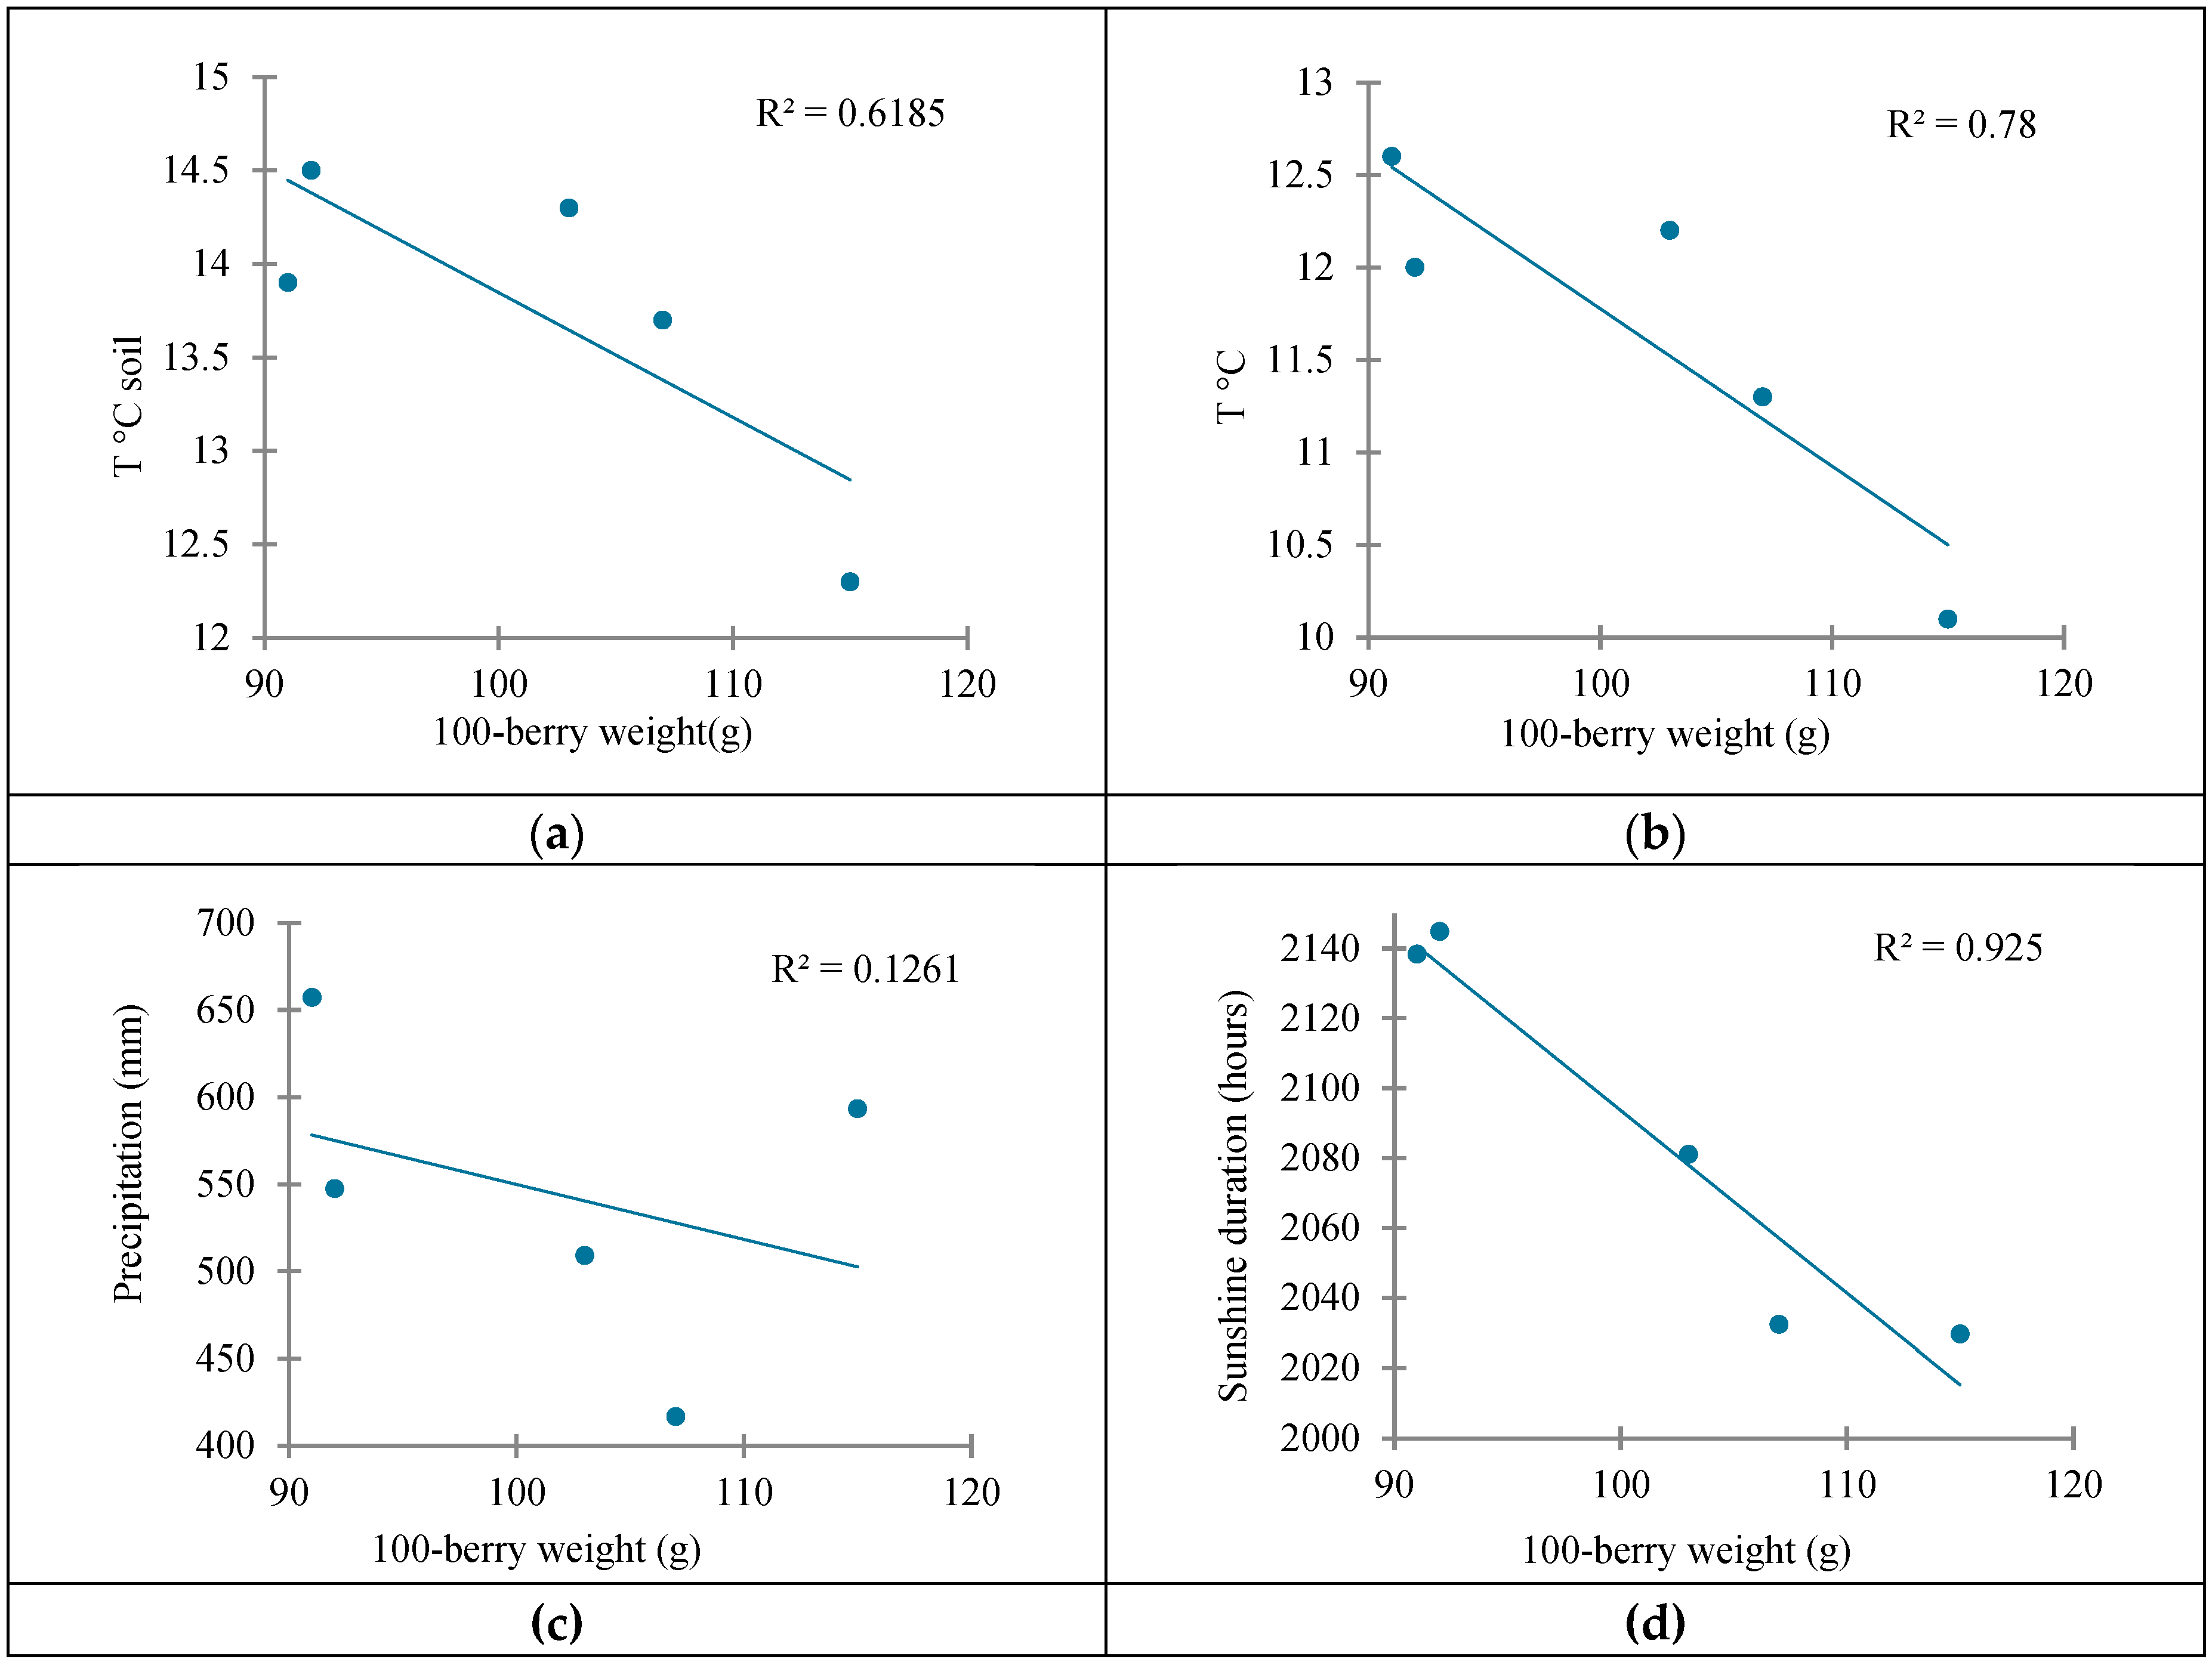
Figure 10.
Variation in sugar content (a) and grapes total acidity (b) depending on average temperatures recorded in the warm season; R2–coefficient of determination.
Figure 10.
Variation in sugar content (a) and grapes total acidity (b) depending on average temperatures recorded in the warm season; R2–coefficient of determination.
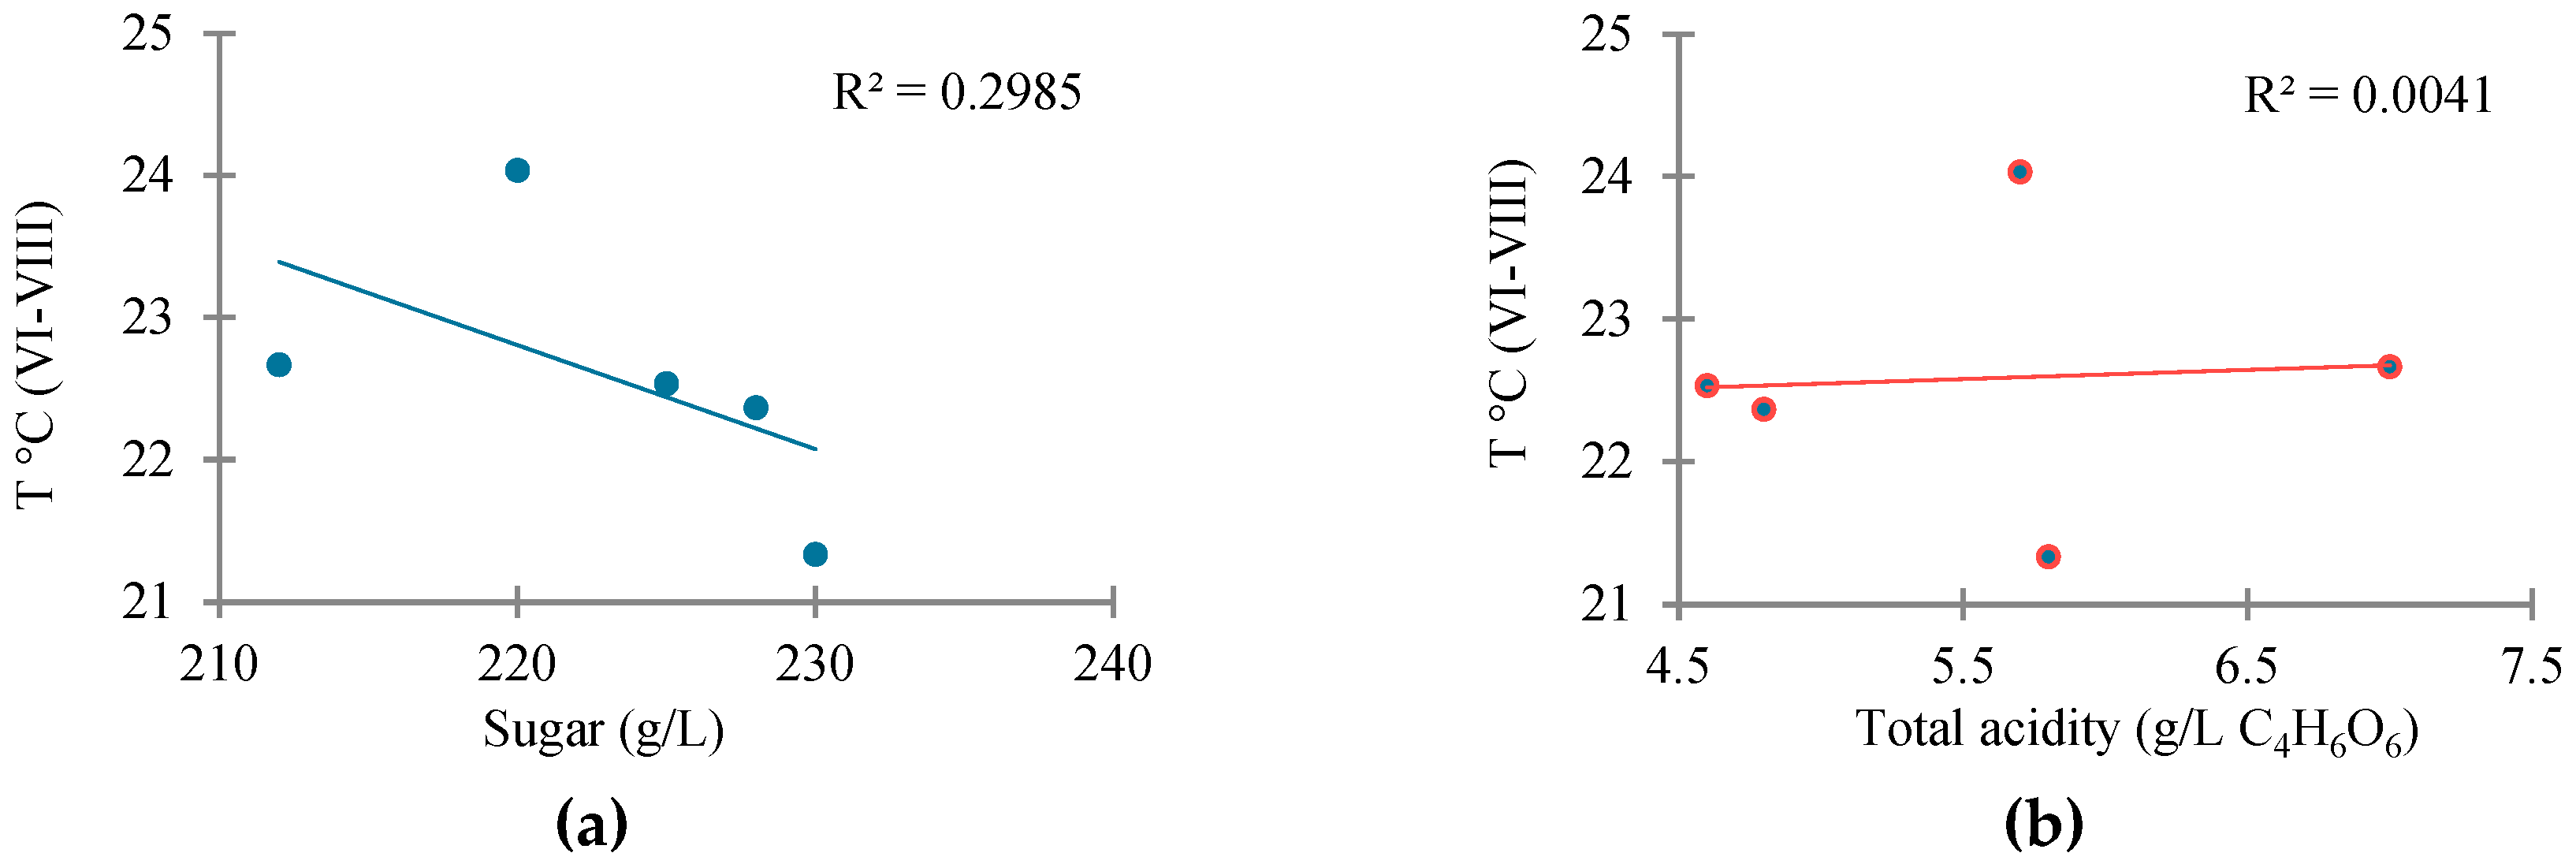
Figure 11.
Correlations between climatic conditions and the main physicochemical parameters. H–soil hygroscopicity; T°C soil–average annual soil temperatures; T°C–average annual air temperatures; Pp–average annual precipitation; Sun–sunshine duration; AY–Actual yield; GTA–total acidity of grapes; W100–100-berry weight; GS–grapes sugar; AS–wines alcoholic strength; DE–dry extract of wines; WTA–wines total acidity; WVA–wines volatile acidity; D–density; RS–reducing sugars.
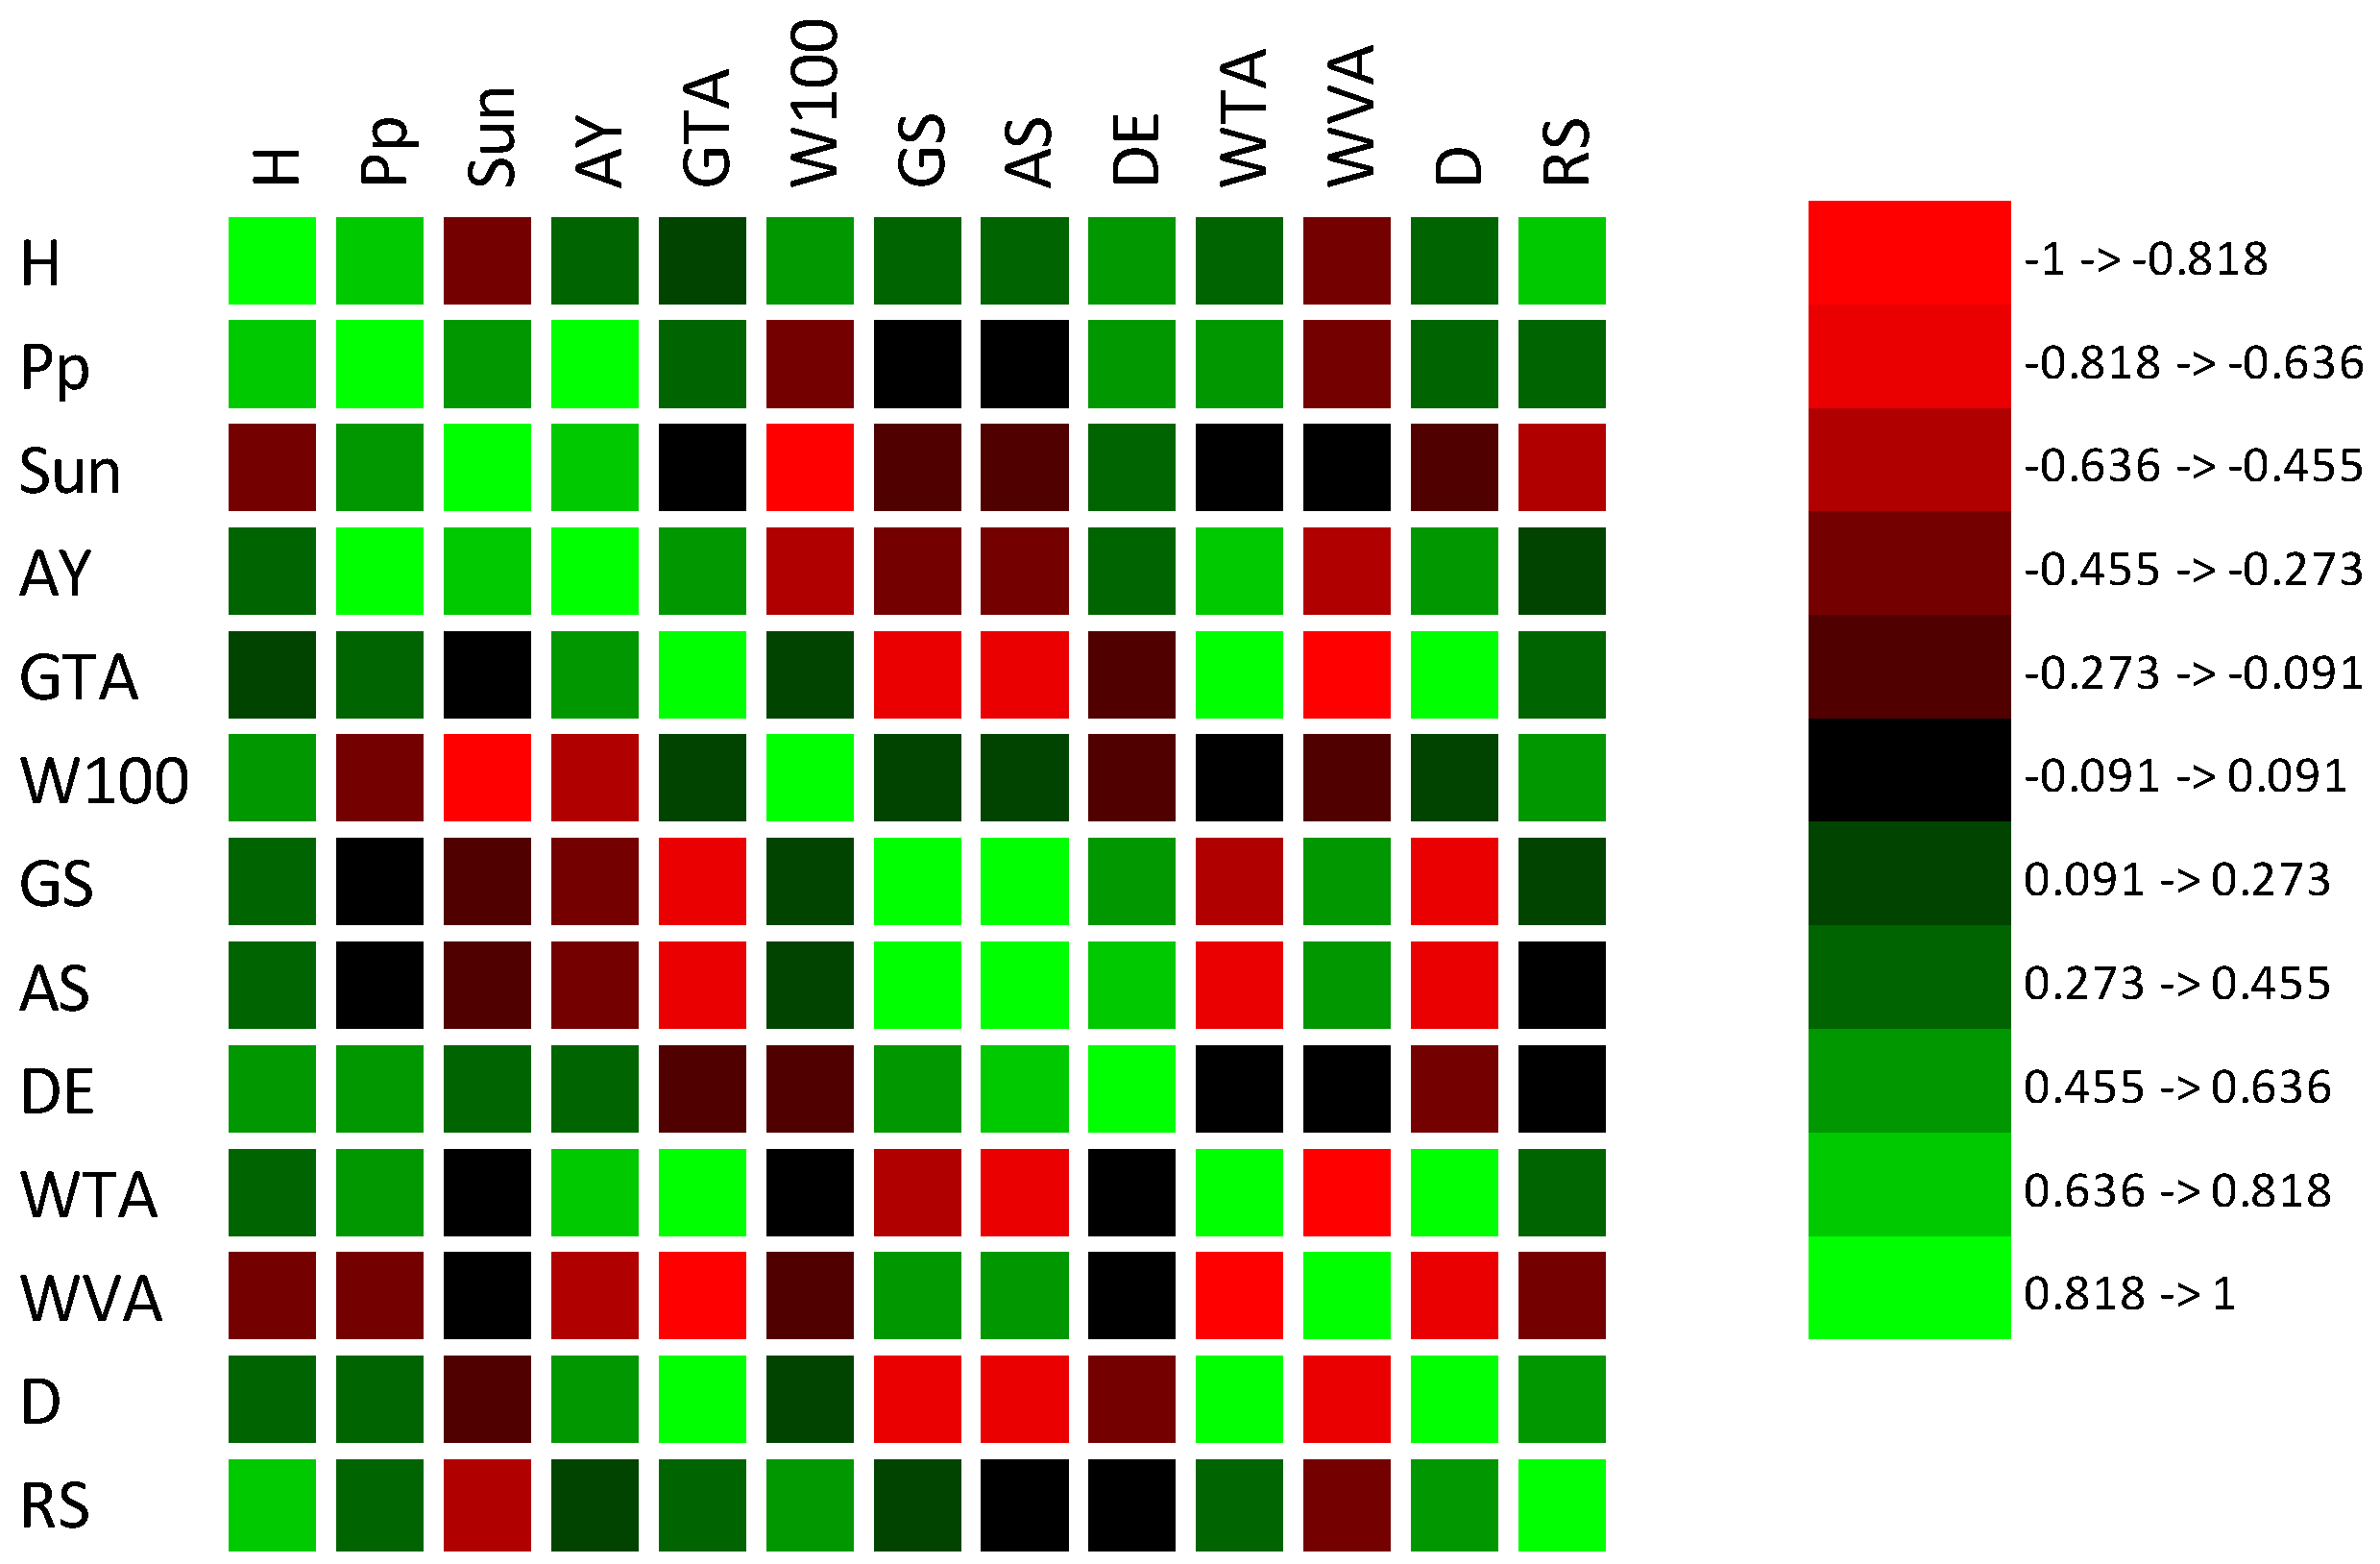
Figure 12.
Sensory profile of the analyzed Golia wines.
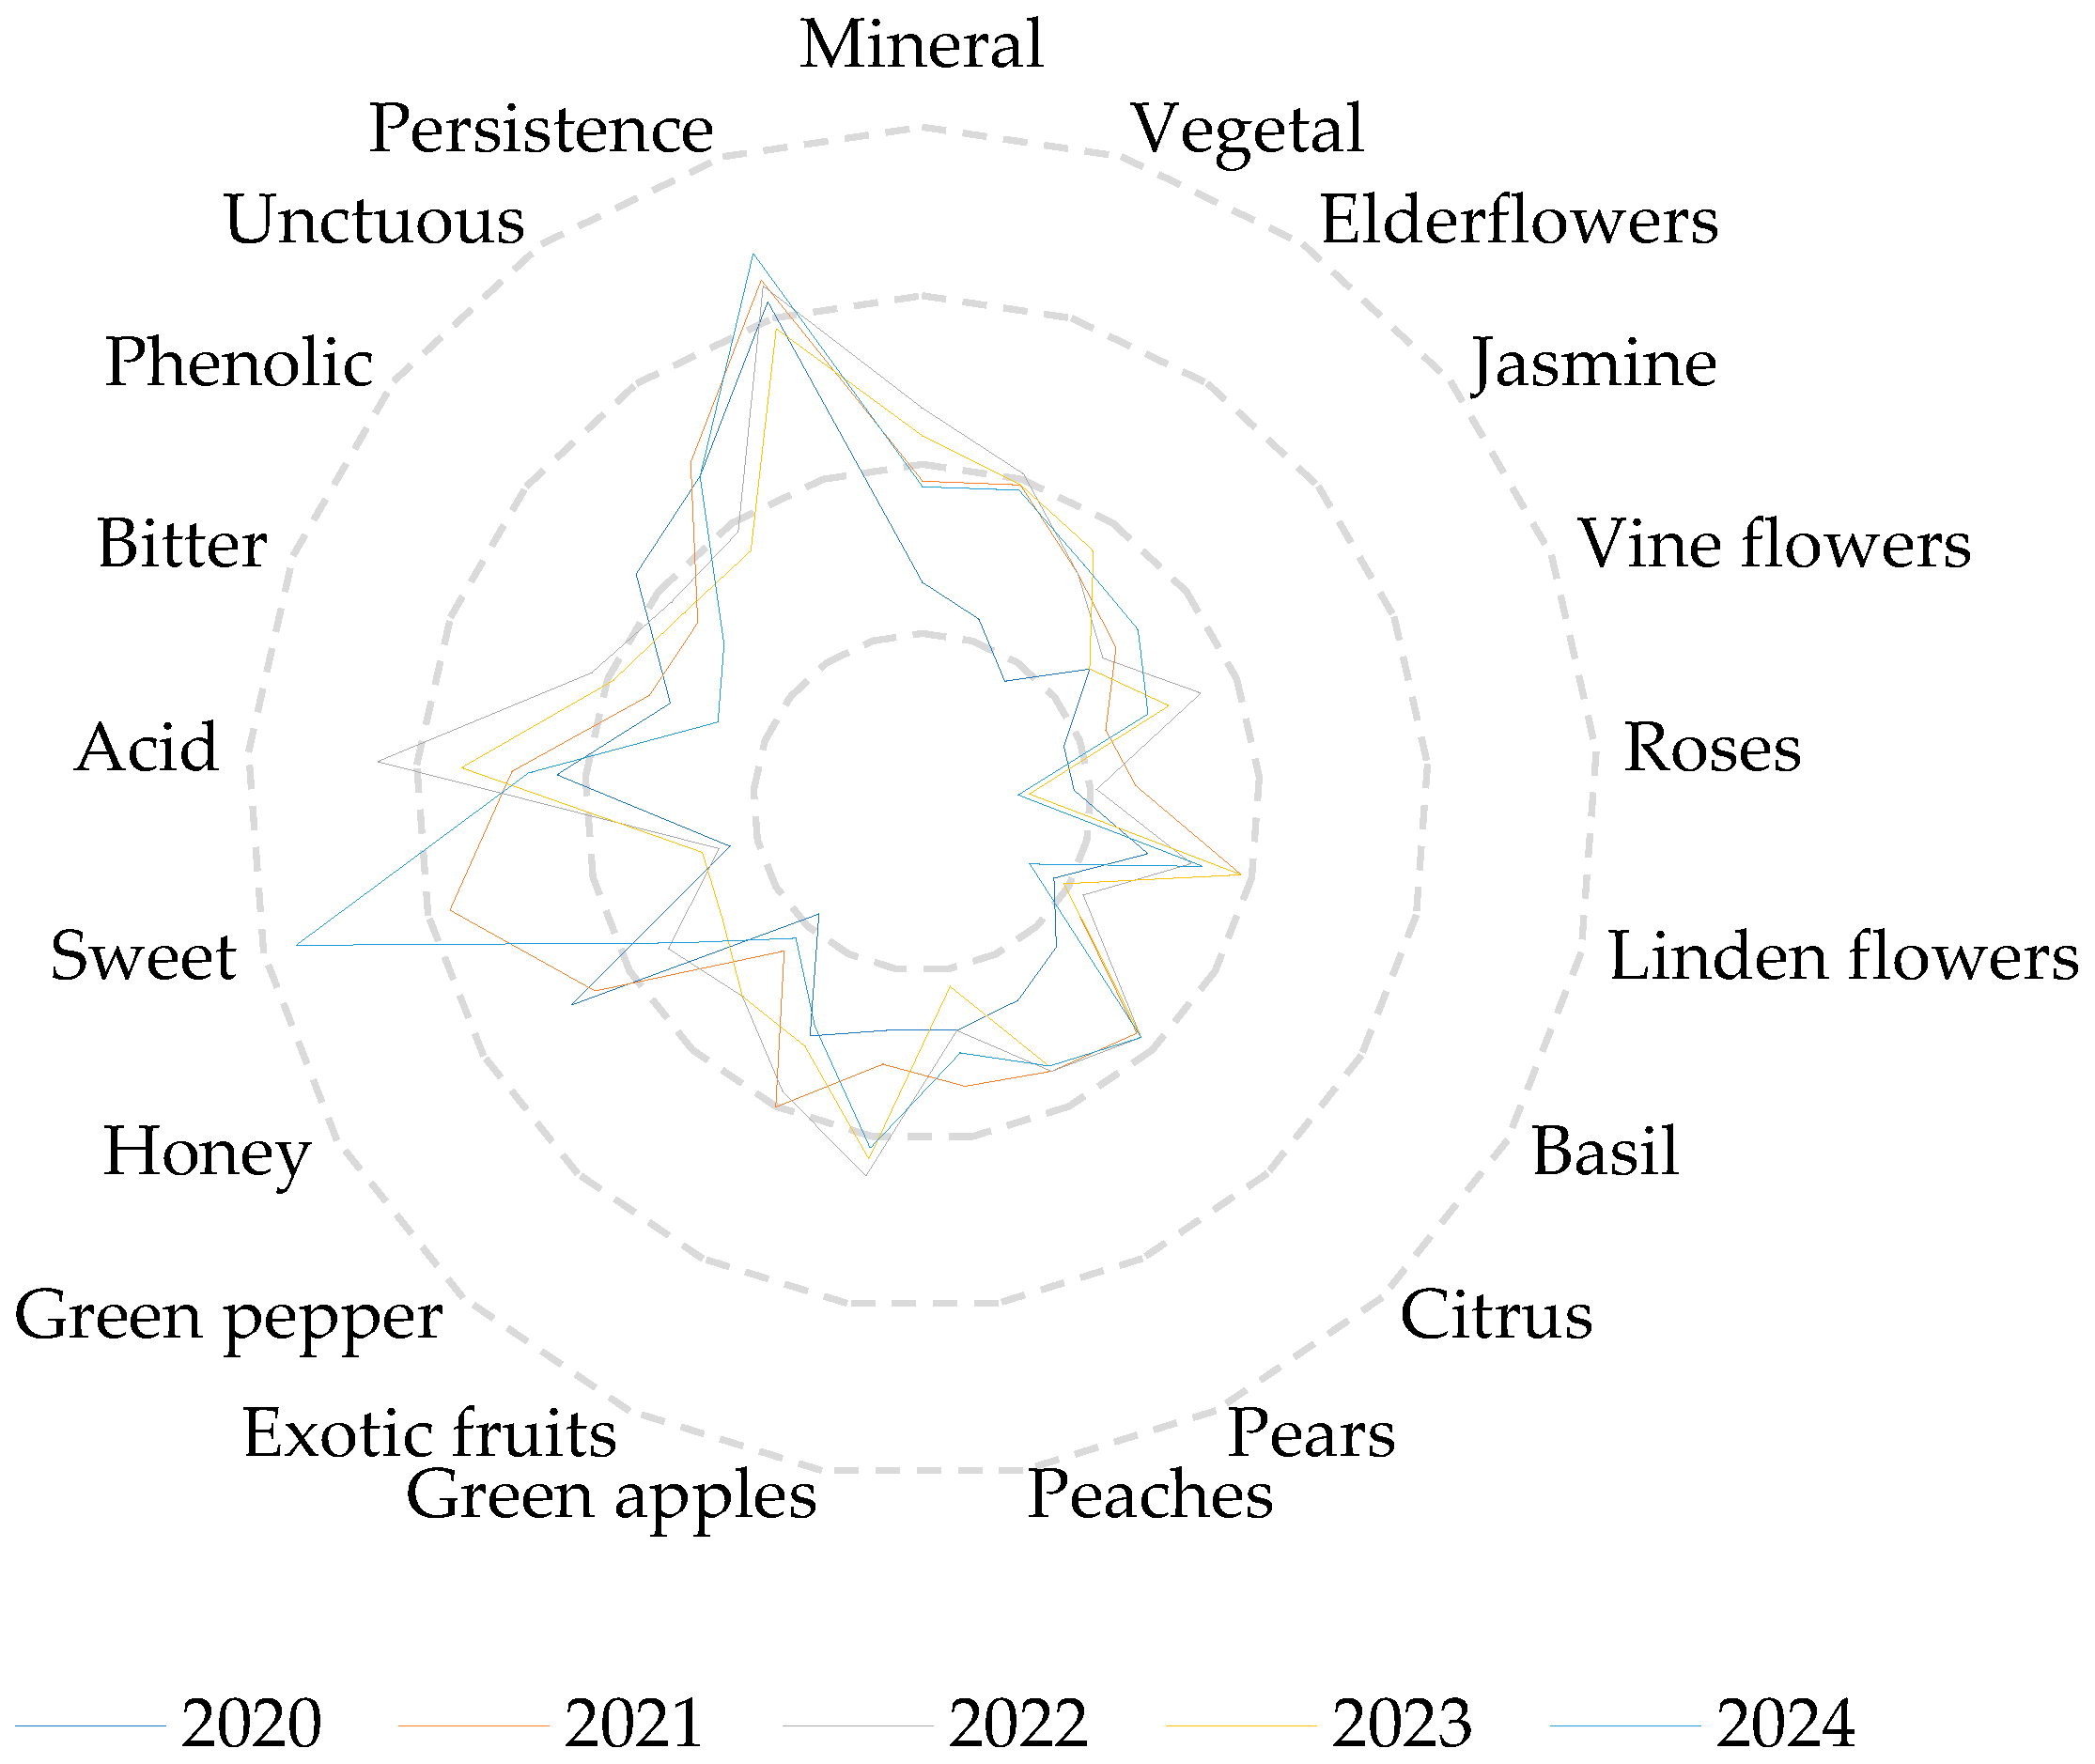
Figure 13.
Correlations between physicochemical parameters and sensory characteristics of the analyzed wines. D1–mineral; D2–vegetable; D3–elderflower; D4–jasmine; D5–grapevine; D6–roses; D7–linden flowers; D8–basil; D9–citrus; D10–pears; D11–peaches; D12–green apples; D13–exotic fruits; D14–green pepper; D15–honey; D16–sweet; D17–acid; D18–bitter; D19–phenolic; D20–unctuous; D21–persistence; H–soil hygroscopicity; T°C soil–average annual soil temperatures; T°C–average annual air temperatures; Pp–average annual precipitation; AS–alcoholic strength; DE–dry extract; WTA–wine total acidity; WVA–volatile acidity of wines; D–density; RS–reducing sugars.
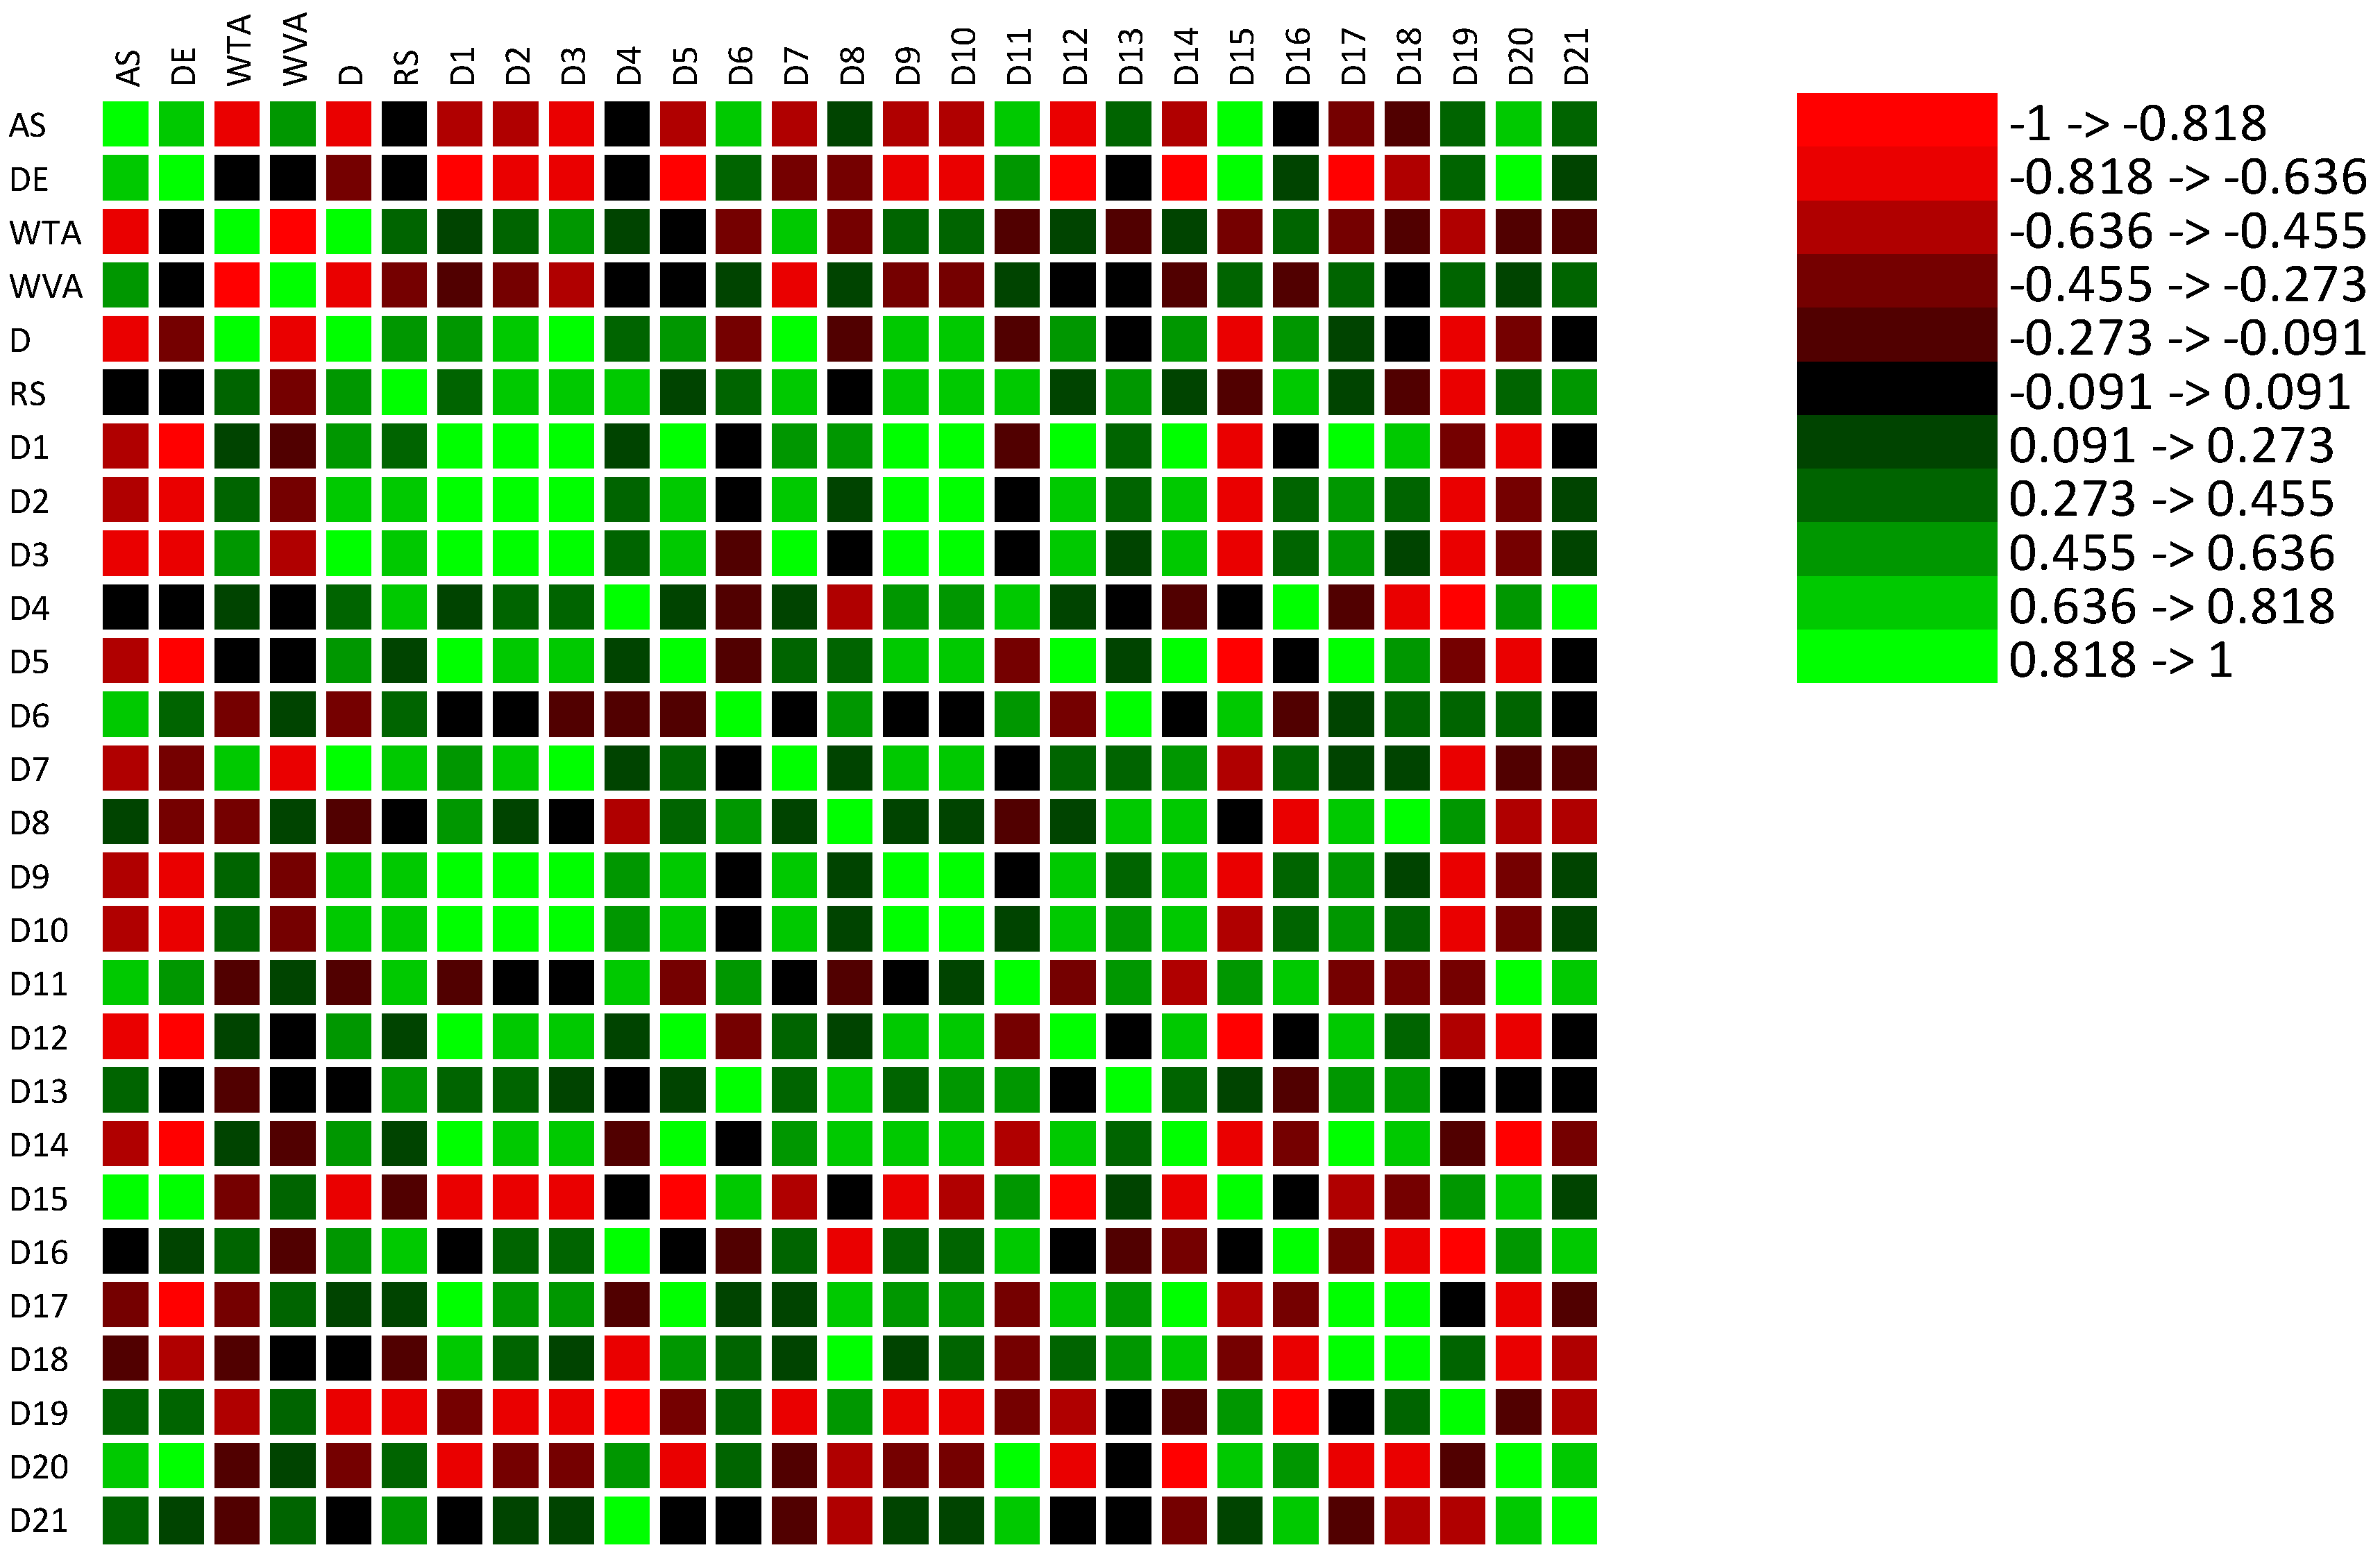
Figure 14.
Correlations between climatic conditions and sensory characteristics of the analyzed wines. D1–mineral; D2–vegetable; D3–elderflowers; D4–jasmine flowers; D5–grapevine flowers; D6–roses; D7–linden flowers; D8–basil; D9–citrus; D10–pears; D11–peaches; D12–green apples; D13–exotic fruits; D14–green pepper; D15–honey; D16–sweet; D17–acid; D18–bitter; D19–phenolic; D20–unctuous; D21–persistence; T°C soil–average annual soil temperatures; T°C–average annual air temperatures; Pp–average annual precipitation; Sun–sunshine duration.
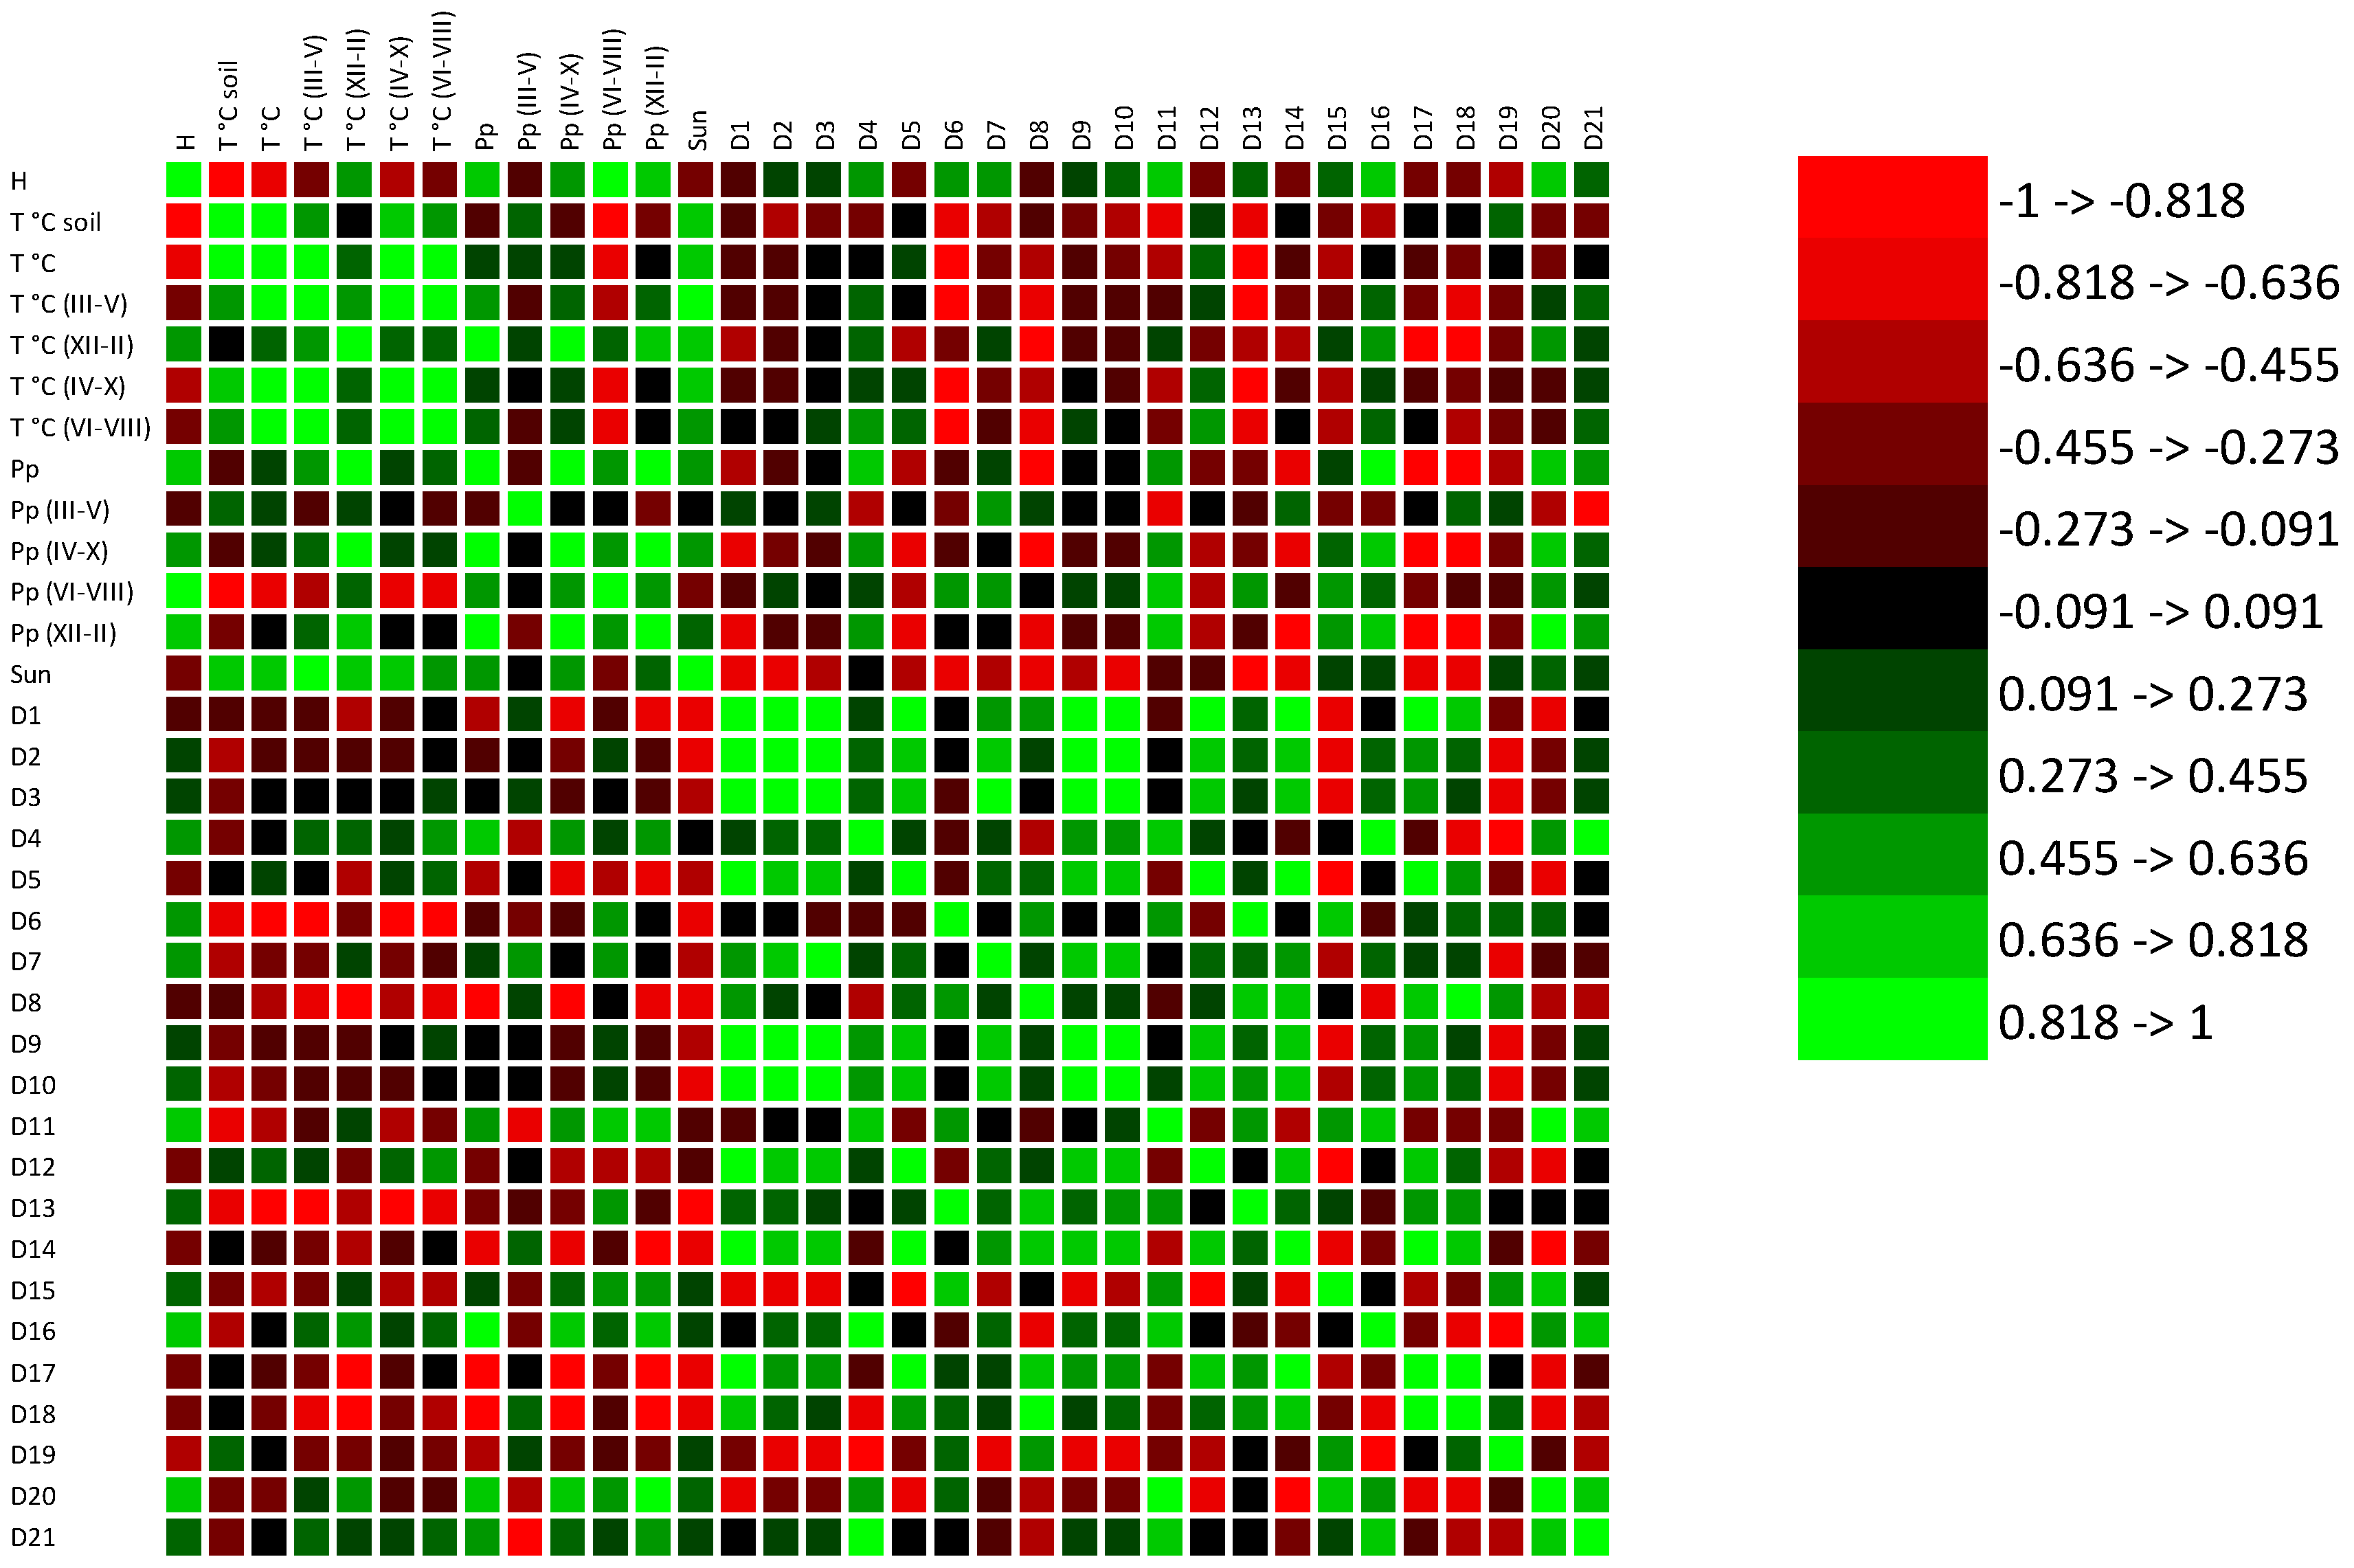
Figure 15.
Dependence of key sensory descriptors in relation to the physicochemical parameters of Golia wines (2020–2024): honey vs alcoholic strength (a), grapevine flowers vs dry extract (b), green pepper vs dry extract (c), honey vs dry extract (d), elderflowers vs density (e), linden flowers vs density (f); R2–coefficient of determination. Red color highlights a positive relationship, while blue color means negative correlation.
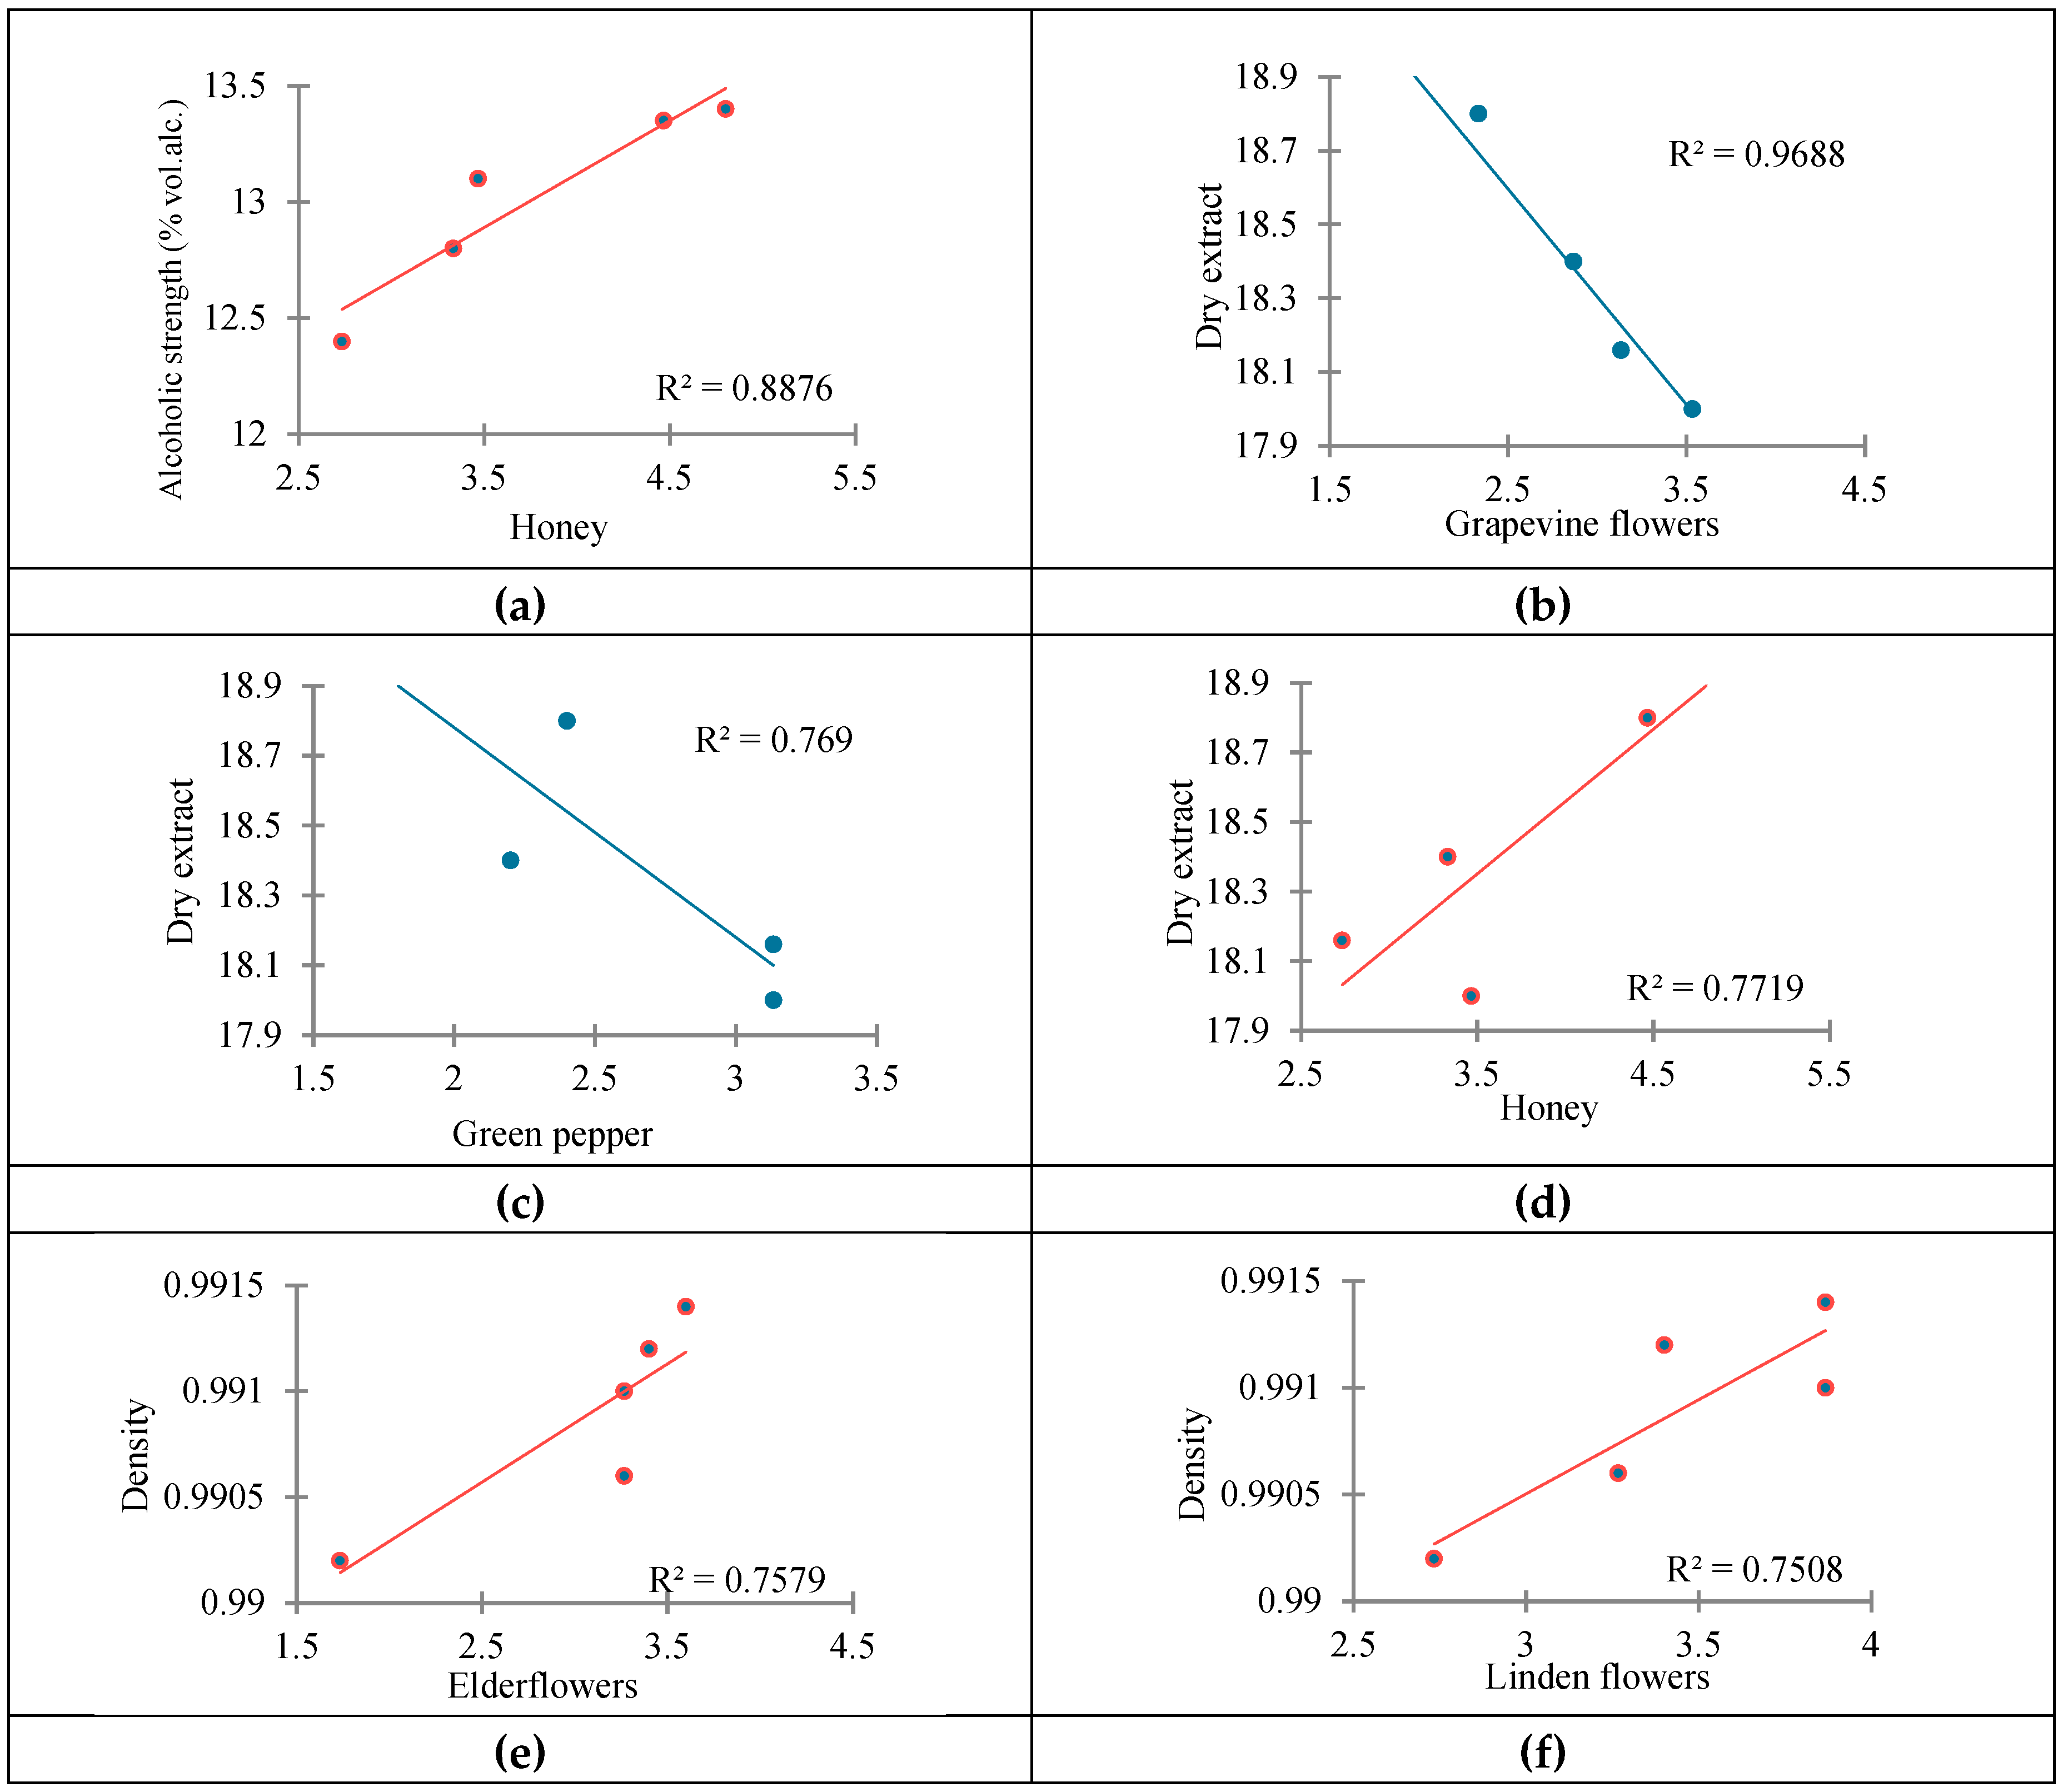
Figure 16.
Variability of key sensory descriptors for Golia wines under the climatic conditions of 2020–2024: exotic fruits vs average annual soil temperature (a), peaches vs average annual soil temperature (b), roses vs average annual air temperature (c), exotic fruits vs average annual air temperature (d), sweet vs average annual precipitation (e), acid vs average annual precipitation (f), bitter vs average annual precipitation (g), exotic fruits vs sunshine duration (h); R2–coefficient of determination. Red color highlights a positive relationship, while blue color means negative correlation.
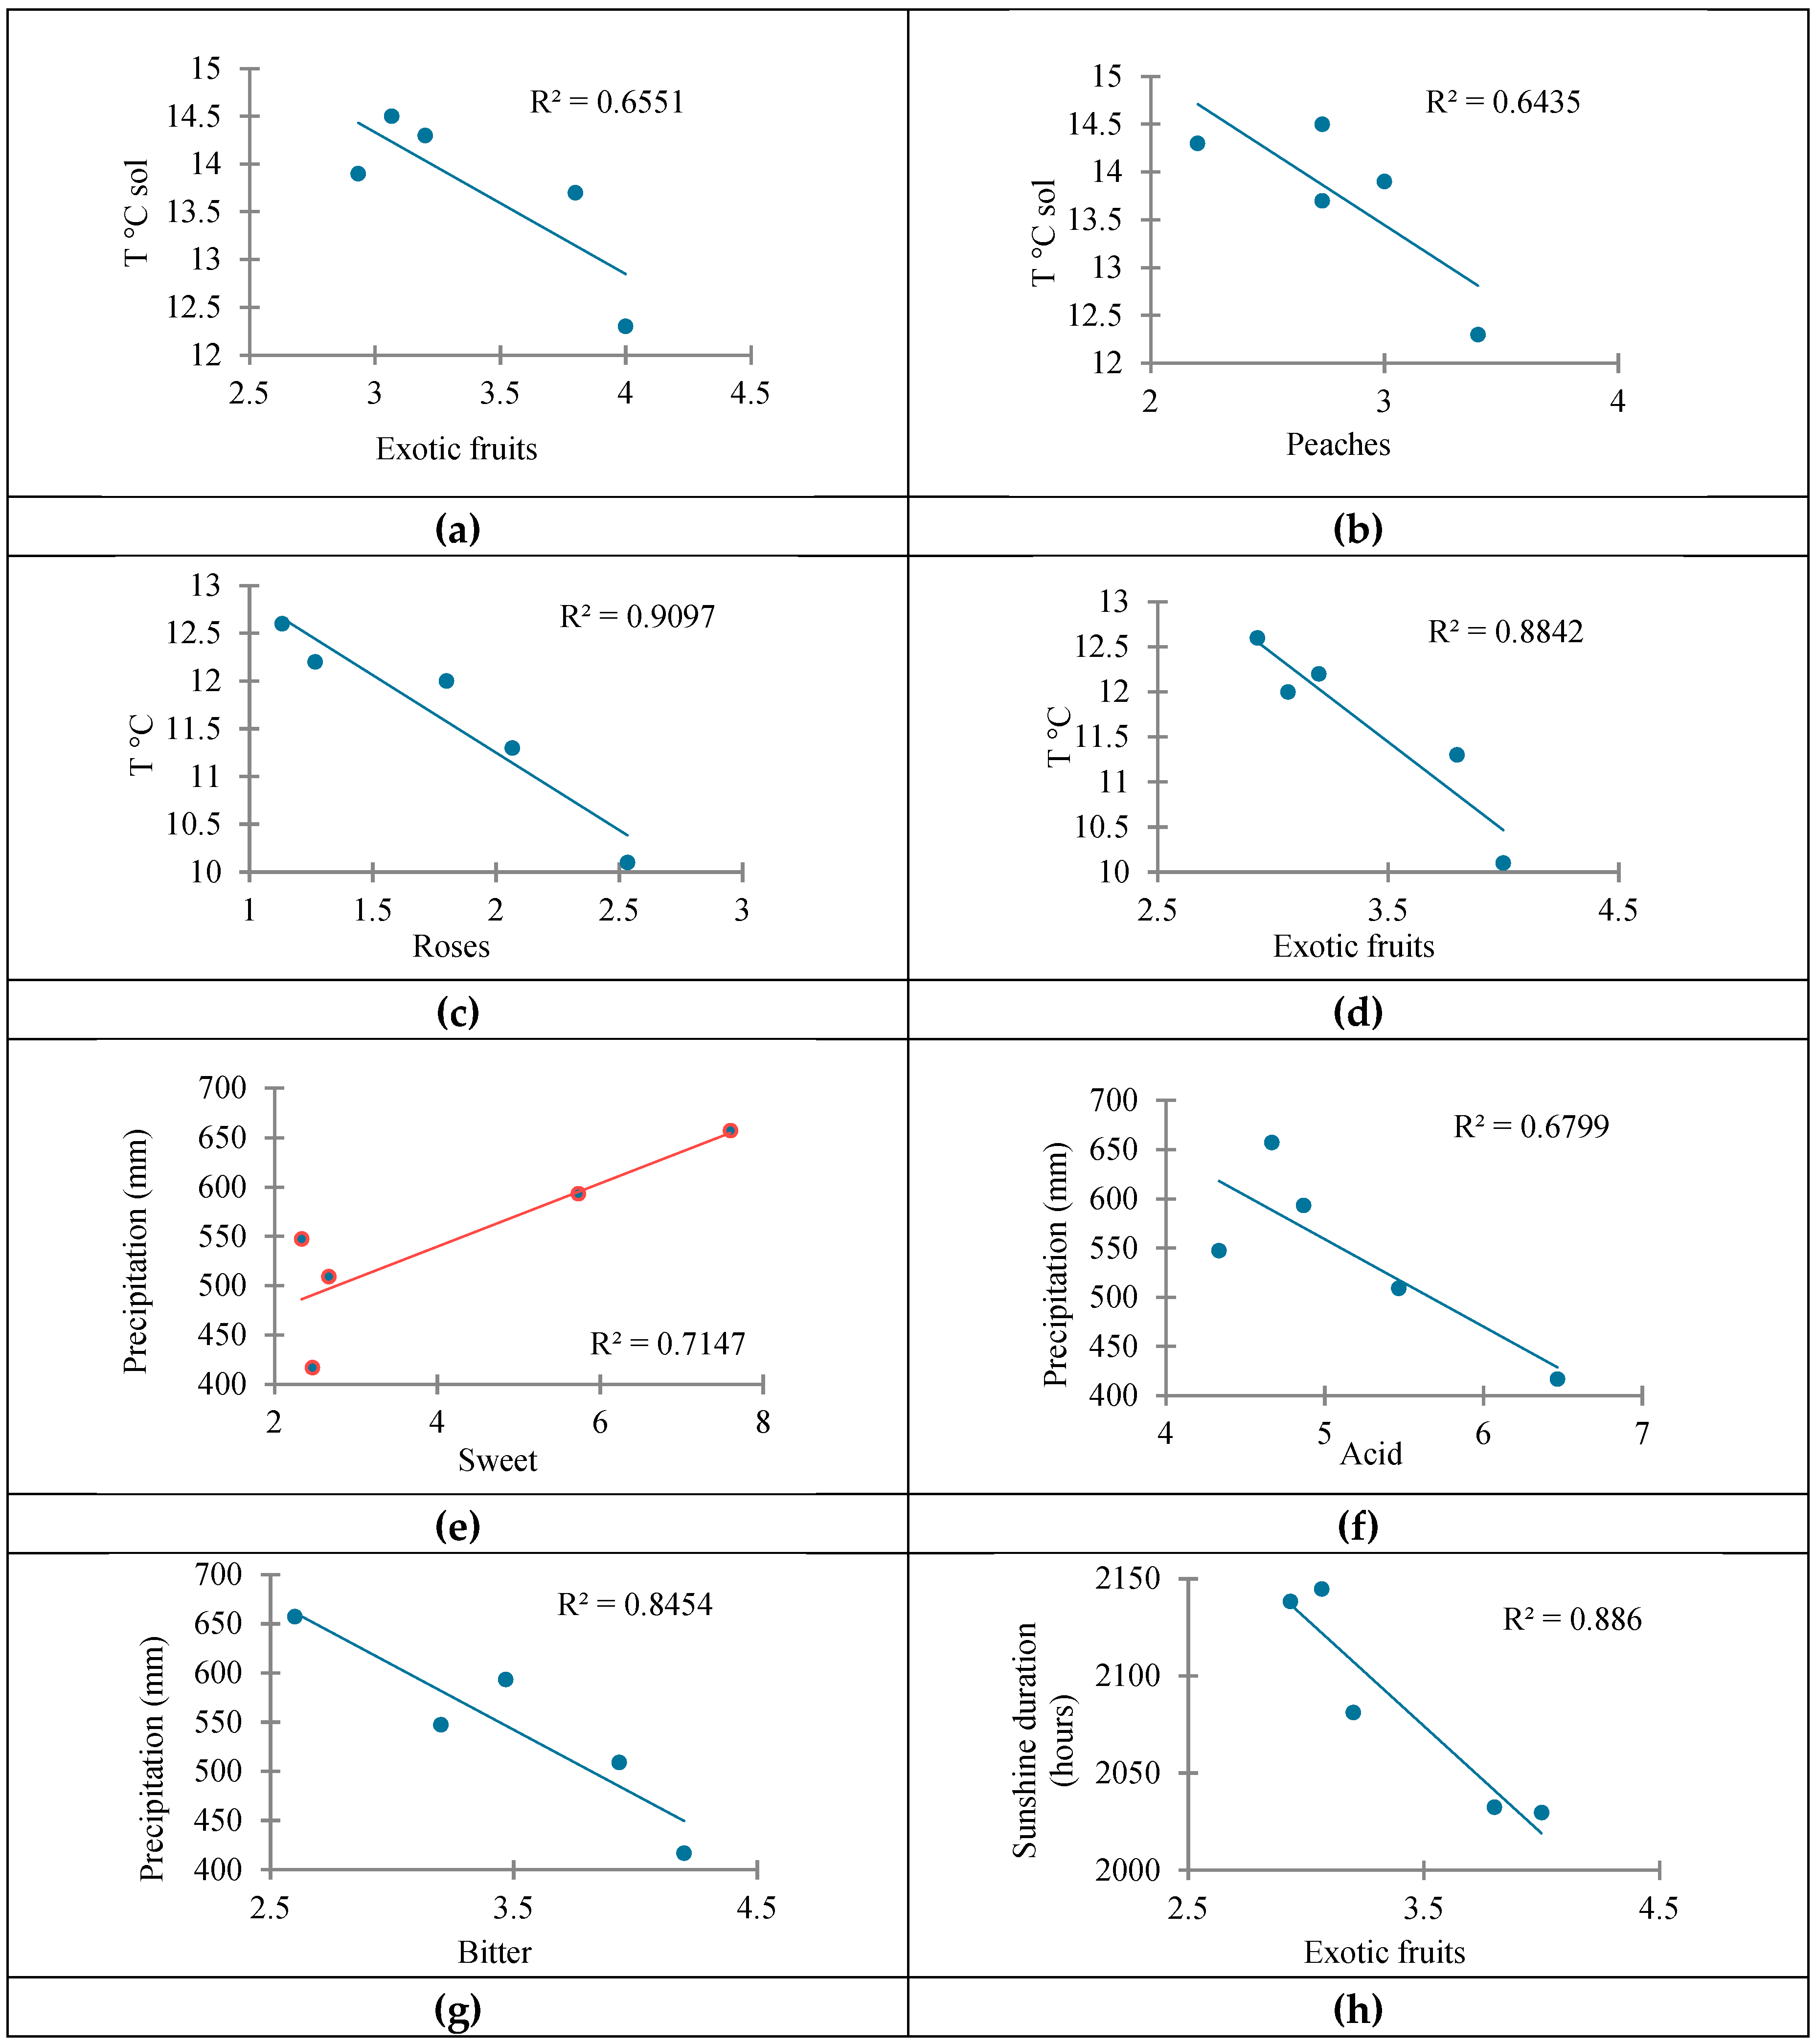

Table 1.
Fertility, productivity and grape quality parameters of the Golia variety (2020–2024).
| Key parameters | Year | |||||
|---|---|---|---|---|---|---|
| 2020 | 2021 | 2022 | 2023 | 2024 | ||
| Fertility | Total shoots/vine | 39 | 54 | 39 | 35 | 54 |
| Fertile shoots/vine | 32 | 35 | 21 | 30 | 43 | |
| Fertile shoots (%) | 82.05 | 64.81 | 53.84 | 85.71 | 79.63 | |
| Number of inflorescences | 43 | 42 | 27 | 42 | 54 | |
| Fertility coeficients: | ||||||
| RF | 1.1 | 0.77 | 0.69 | 1.2 | 1 | |
| AF | 1.34 | 1.2 | 1.29 | 1.4 | 1.26 | |
| Productivity | Average cluster weight (g) | 108 | 112 | 128 | 124 | 117 |
| Productivity indices: | ||||||
| RPI | 118.8 | 86.24 | 81.92 | 148.8 | 117 | |
| API | 144.72 | 134.4 | 135.12 | 173.6 | 146.93 | |
| Number of clusters/vine | 43 | 42 | 27 | 40 | 49 | |
| Actual yield (kg/vine) | 4.64 | 4.7 | 3.45 | 4.96 | 5.73 | |
| Grape quality | Physical characteristics: | |||||
| Cluster volume (mL) | 100 | 100 | 116 | 115 | 110 | |
| Weight of berries/cluster (g) | 99.52 | 102.83 | 118.96 | 115.7 | 109.45 | |
| Rachis weight/cluster (g) | 8.48 | 9.17 | 9.04 | 8.3 | 7.55 | |
| Mechanical composition: | ||||||
| 100-Berry weight (g) | 92 | 115 | 107 | 103 | 91 | |
| Pulp (g) | 73.7 | 96 | 84.08 | 81.23 | 73 | |
| Skin (g) | 10.86 | 11.5 | 12.11 | 12.37 | 10.13 | |
| Seeds (g) | 7.44 | 7.5 | 10.81 | 9.4 | 7.87 | |
| Must composition | Sugar (g/L) | 228 | 230 | 225 | 212 | 220 |
| Total acidity (g/L C4H6O6) | 4.8 | 5.8 | 4.6 | 7 | 5.7 | |
| pH | 3.2 | 2.84 | 3.1 | 3.38 | 3.67 | |
RF–relative fertility; AF–absolute fertility; RPI–relative productivity index; API–absolute productivity index; C4H6O6–tartaric acid.
Table 2.
Physicochemical characteristics of Golia wines (2020–2024).
| Year | AS (% alc. vol.) |
TA (g/L C4H6O6) |
VA (g/L C2H4O2) |
Free SO2 (mg/L) |
Total SO2 (mg/L) |
RS (g/L) | D | DE (g/L) |
|---|---|---|---|---|---|---|---|---|
| 2020 | 13.40±0.00 | 4.80±0.02 | 0.32±0.01 | 18±0.00 | 94±0.00 | 0.86±0.02 | 0.9902±0.00 | 18.94±0.01 |
| 2021 | 13.35±0.00 | 5.52±0.01 | 0.28±0.00 | 21±0.00 | 88±0.00 | 2.80±0.01 | 0.9910±0.00 | 18.80±0.00 |
| 2022 | 13.10±0.01 | 4.42±0.00 | 0.34±0.00 | 26±0.00 | 90±0.02 | 1.80±0.00 | 0.9906±0.01 | 18.00±0.00 |
| 2023 | 12.40±0.00 | 6.10±0.02 | 0.26±0.00 | 24±0.00 | 112±0.01 | 1.64±0.00 | 0.9914±0.00 | 18.16±0.01 |
| 2024 | 12.80±0.01 | 5.50±0.00 | 0.30±0.00 | 20±0.00 | 117±0.00 | 2.20±0.01 | 0.9912±0.01 | 18.40±0.00 |
| p-value | <0.0001* | <0.0001* | 0.000* | <0.0001* | <0.0001* | <0.0001* | 1.000 | <0.0001* |
AS–alcoholic strength; TA–total acidity; VA–volatile acidity; RS–reducing sugar; D–density; DE–dry extract;*–statistically significant (p<0.05).
Disclaimer/Publisher’s Note: The statements, opinions and data contained in all publications are solely those of the individual author(s) and contributor(s) and not of MDPI and/or the editor(s). MDPI and/or the editor(s) disclaim responsibility for any injury to people or property resulting from any ideas, methods, instructions or products referred to in the content. |
© 2026 by the authors. Licensee MDPI, Basel, Switzerland. This article is an open access article distributed under the terms and conditions of the Creative Commons Attribution (CC BY) license (http://creativecommons.org/licenses/by/4.0/).
Copyright: This open access article is published under a Creative Commons CC BY 4.0 license, which permit the free download, distribution, and reuse, provided that the author and preprint are cited in any reuse.


