
Submitted:
29 January 2026
Posted:
30 January 2026
You are already at the latest version
Abstract
Visualization techniques for seismicity have advanced, but their effective application requires experience and region specific interpretation because earthquake susceptibility varies spatially. We examine the Noto Peninsula, a seismically active region, by analysing earthquake catalogues and mesh based magnitude parameters for events in 2023–2024. Temporal changes in the magnitude locator and scale, together with spatial patterns of shallow seismicity, reveal anomalous behaviour in the offshore area west of Noto—characterised by persistently high locator values and locally reduced scale—that resembles precursory patterns observed in volcanic settings. The 5 May 2023 (M6.5) and 1 January 2024 (M7.6) sequences illustrate how such combined signals may precede large events and how aftershock decay and resurgence complicate post event energy assessment. These findings suggest the possible influence of submarine volcanic or volcano related structures and ongoing orogenic deformation, and they support continued, targeted monitoring of epicentral activity in the region.
Keywords:
earthquake prediction
; seismic visualization
; magnitude locator
; scale
; shallow seismicity
1. Introduction
Using the mesh-based visualization method [1] together with three-dimensional inspection of seismicity [2] provides two complementary perspectives for monitoring earthquake activity. These approaches have enabled the identification of precursory patterns associated with earthquakes above a certain magnitude [3]. Nevertheless, practical experience is often required to interpret these signals reliably. A key challenge is the strong regional variability in seismic behavior. I have not proposed a universal criterion for anomaly detection because such a standard is unlikely to be valid across Japan’s diverse tectonic environments. If all regions shared identical geological structures, a single threshold might be feasible. In reality, however, some areas are inherently more prone to large earthquakes than others, making uniform criteria inappropriate.
One such region is the Noto Peninsula. Although located far from major plate boundaries, Noto lies above a complex interaction zone involving the Eurasian Plate, the Pacific Plate, and the Philippine Sea Plate. In particular, the shallow seismic zone associated with the Sanriku–Oki segment of the Pacific Plate’s subduction extends beneath this region. This zone is interpreted as an area where compressive stress accumulates as the Pacific Plate pushes horizontally against the overriding Eurasian Plate. Such stress transfer is thought to generate a near-surface environment favorable for frequent shallow earthquakes [2]. Although the main plate boundary lies at depth, the mechanical coupling between the subducting and overriding plates may transmit stress upward into the crust, creating a persistent seismogenic zone beneath Noto.
In 2023, this region exhibited a marked increase in the magnitude locator, accompanied by a rise in event scale (Figure 1A–B). Because earthquake magnitudes follow an approximately normal distribution [1], it is straightforward to track temporal variations in its two parameters: the mean (μ), represented by the locator, and the standard deviation (σ), represented by the scale [2]. An increase in both parameters is typically associated with heightened potential for large earthquakes [4]. Indeed, a magnitude 6.5 earthquake struck the area on 5 May 2023.
During the period from October to December 2023—after the aftershock sequence had largely decayed—the locator remained elevated, although the scale had decreased (Figure 1C–D). Shortly thereafter, on 1 January 2024, a magnitude 7.6 earthquake occurred. If the persistently high locator had been disregarded, this event would have appeared unpredictable. How should this pattern be interpreted? The following sections examine this question in detail.
2. Material and Methods
The analysis followed an exploratory data analysis framework, which is well suited for identifying structural patterns in scientific datasets [5,6]. Earthquake data were obtained from the catalogues published by the Japan Meteorological Agency (JMA) [7], and the most recent entries were downloaded daily from the same source [8]. All computations were conducted using the R statistical environment [9]. The full R code used in this study is available from Zenodo [10].
3. Results and Discussion
Figure 2A shows that following the earthquake on 5 May 2023, the number of aftershocks decayed with a characteristic half-life, a behaviour commonly observed in other major earthquakes [2]. However, in typical large events, the magnitude locator increases by approximately 2–4 units and then decays rapidly with a short half-life. In the present case, this pattern was scarcely observed. The figure displays hourly averages; when the window is extended to 12 hours, the transient increase nearly disappears. Instead, the locator rose again around September–October, exceeding the level observed on 5 May (corresponding to the anomaly in Figure 1C). This behaviour is unusual.
Both earthquake frequency [1] and earthquake energy [4] follow log-normal distributions, implying that they are governed by the multiplicative interaction of several underlying factors. However, the half-lives associated with these two quantities differ [2]. Consequently, the final factor that triggers an earthquake differs between the phenomenon governing whether an earthquake occurs and the phenomenon governing its magnitude. For the 5 May event, the factors regulating earthquake occurrence appear to have been sufficiently aligned, whereas the factors contributing to larger magnitude growth were not [3]. This suggests that the seismic energy released during the 5 May earthquake may have been insufficient to fully relax the accumulated stress.
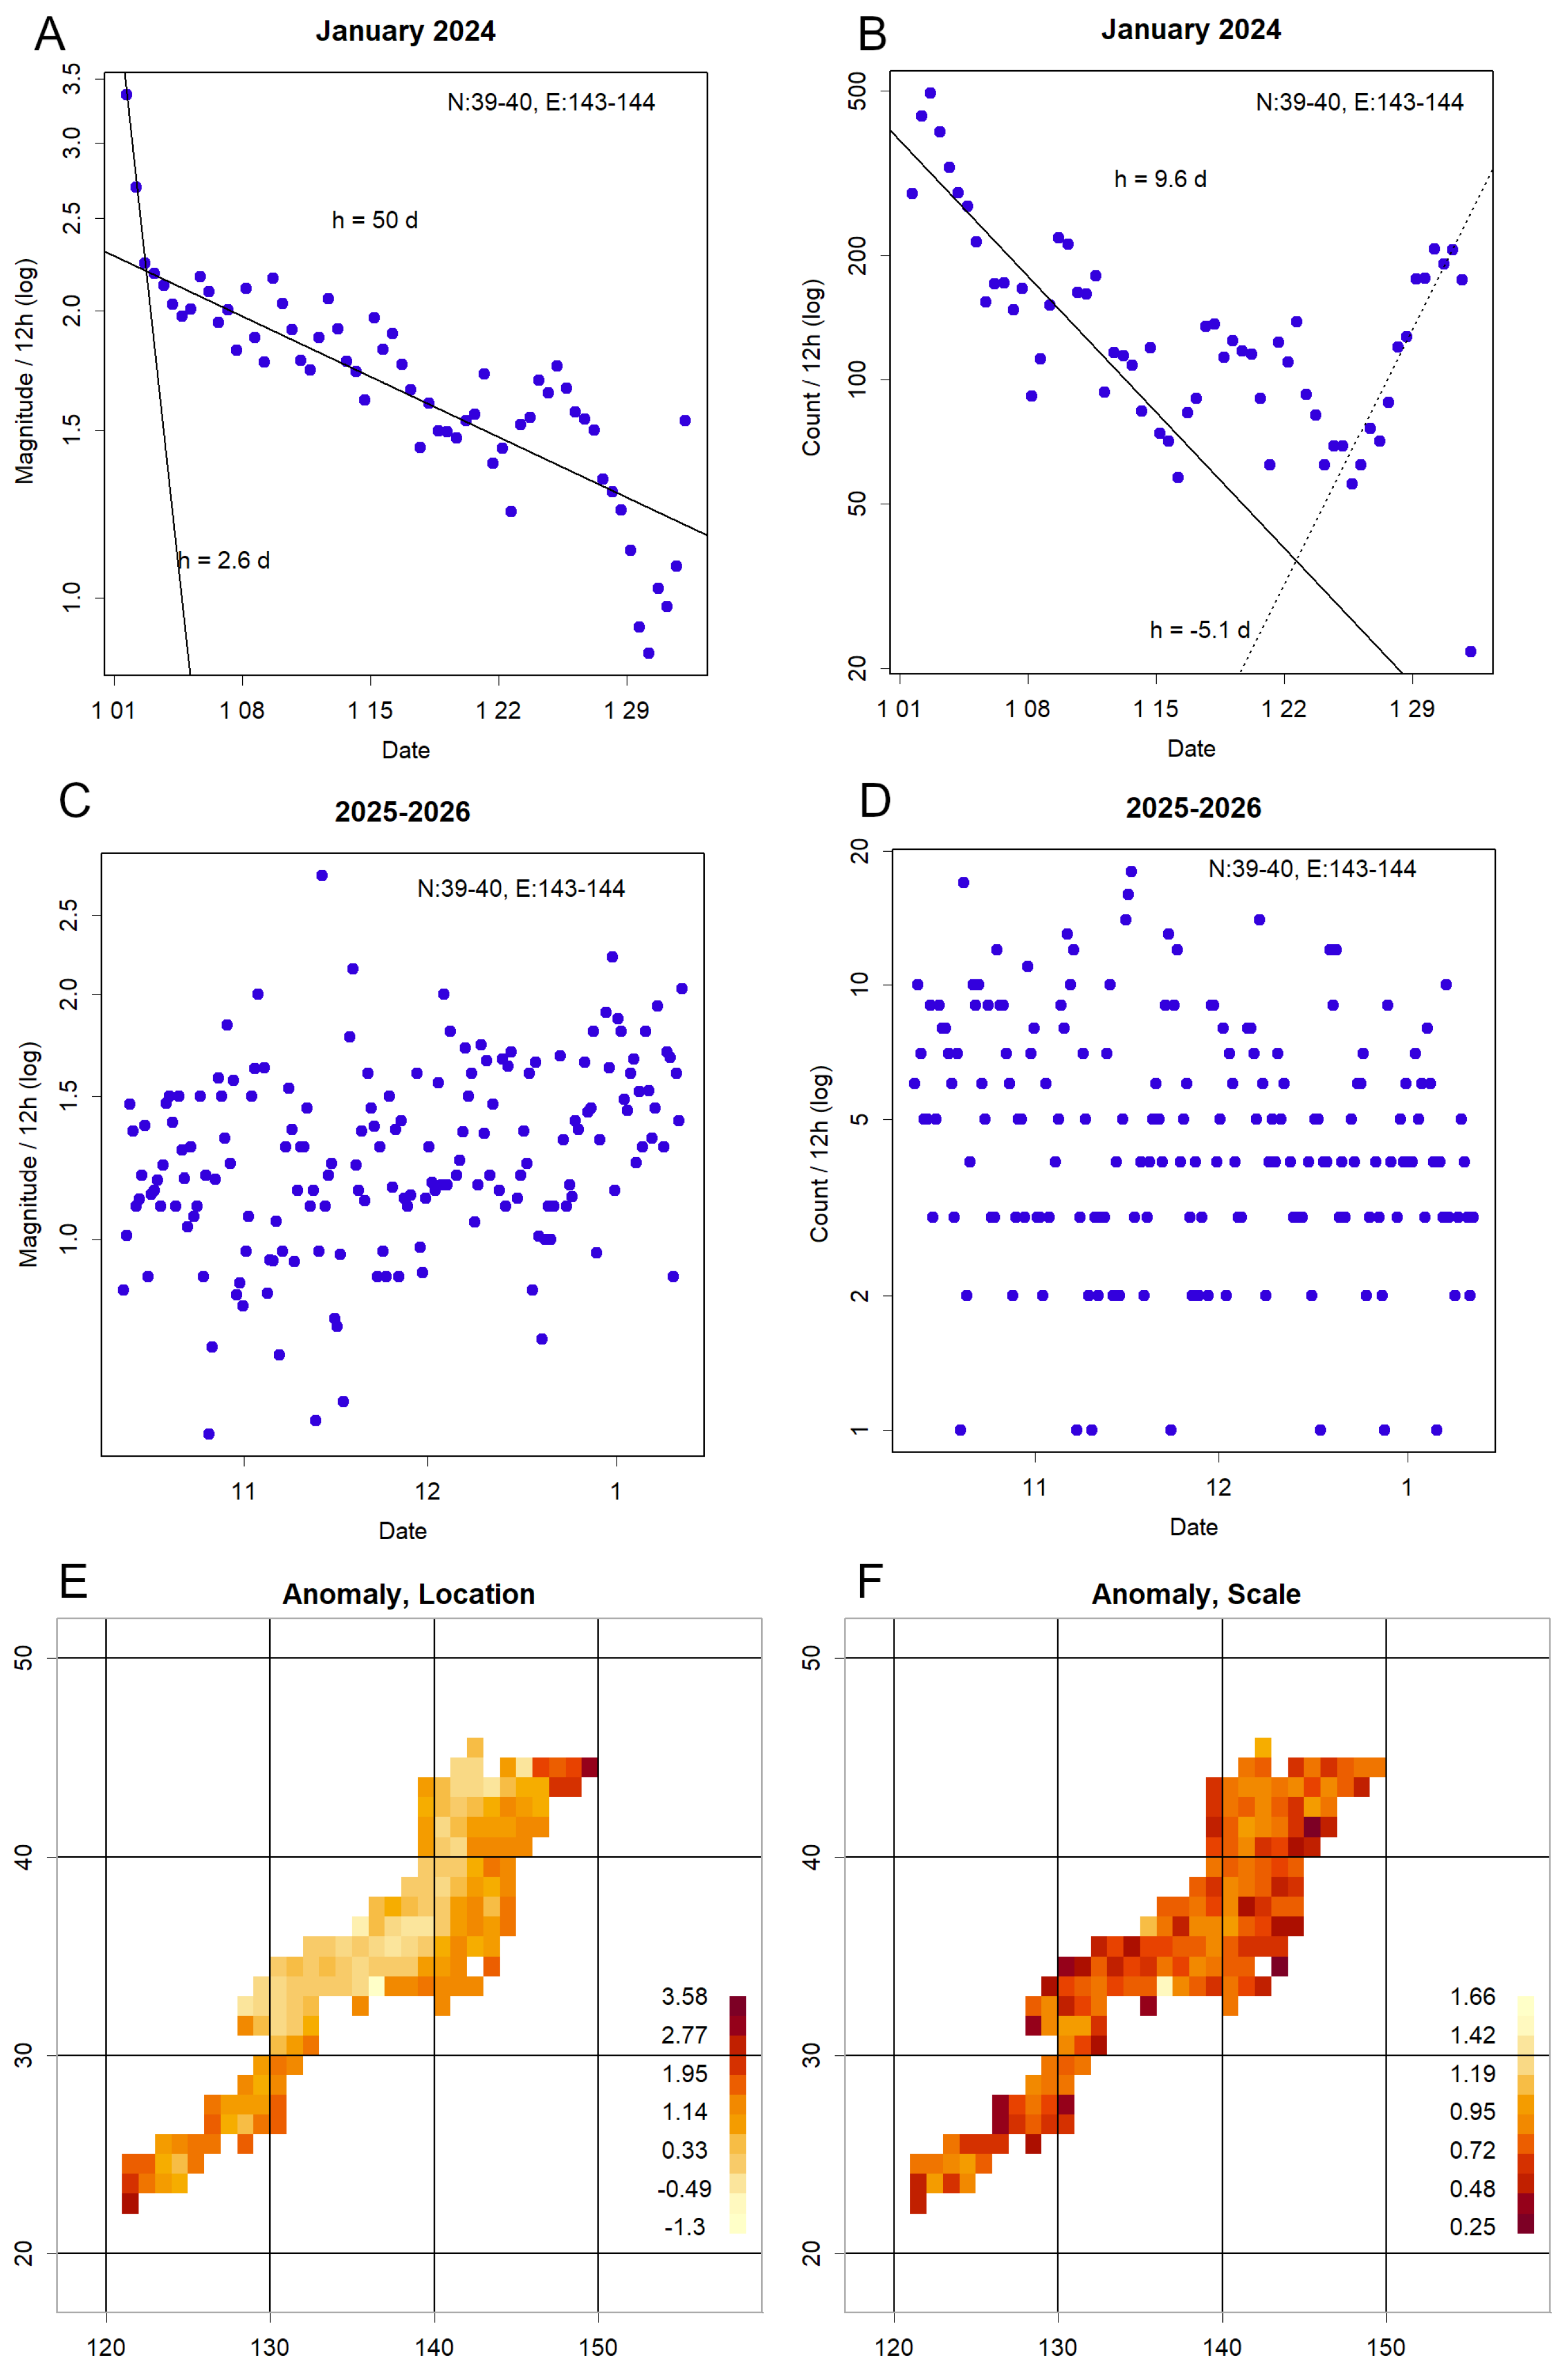
A rare sequence of earthquakes similar to the Noto case occurred recently in a different region. These events took place near the northernmost end of the Sanriku boundary, slightly offset toward the subducting Pacific Plate rather than directly on the boundary itself (Figure S1). Two earthquakes occurred in adjacent areas on 9 November 2025 (M6.9) and 8 December 2025 (M7.5). This region has long been characterised by elevated locator values, yet because it lies offshore, the available data are sparse and often overlooked. As a result, these earthquakes occurred without any clearly identifiable anomalies beforehand.
Although the aftershocks of these events decayed with a half-life (Figure S1C–D), the increase and subsequent decay in magnitude parameters were not particularly pronounced (Figure S1E–F). When averaged over longer time intervals, these changes become almost undetectable. Given the extremely short half-life, the estimated values are not especially precise. It is possible that the hypocentres have not yet fully released the accumulated energy. In this sense, the sequence may represent a precursor swarm preceding a larger mainshock. Because the events already reached substantial magnitudes, any subsequent mainshock could potentially be very large.
Figure 3A shows a regional map of the study area based on the Ministry of Land, Infrastructure, Transport and Tourism dataset [11]. The map spans a 2 degree grid in both latitude and longitude, matching the scale used in Figure 3 and Figure 4. The peninsula shown is Noto, and the island in the upper right is Sado Island, separated from Honshu. Figure B–F show annual distributions of earthquake epicentres. Green symbols indicate events with magnitudes M > 4. An increase in seismicity is evident near the eastern tip of the Noto Peninsula beginning around 2020. The year 2023 shows a particularly high number of events due to the M6.5 earthquake on 5 May and its subsequent aftershocks.
Following the earthquake on 1 January 2024, the spatial pattern of seismicity changed markedly. Epicentres expanded from the entire Noto Peninsula westward into the offshore region (Figure 4A). The triggering M7.6 earthquake occurred at the tip of the peninsula at 16:10, but within an hour, seismic activity had already propagated westward into the ocean. Notably, this offshore area corresponds to the epicentral region of the M6.9 earthquake that occurred on 25 March 2007 (Figure 4B).
Both in 2007 and throughout the period up to 2023, earthquakes in this region have been shallow, typically occurring at depths of around 20 km and at most reaching the depth of the Mohorovičić discontinuity (Figure 4C–D). The deeper seismicity corresponds to the Sanriku boundary. The relationship between this boundary and the earthquakes in 2023 and 2024 remains unclear. No large earthquakes have been recorded along the boundary itself, and the number of events does not appear to have increased significantly. These earthquakes are therefore interpreted as originating within the shallow seismic zone [2], reflecting stress accumulation associated with the horizontal thrusting of the Pacific Plate.
A characteristic feature of the offshore region west of the Noto Peninsula is the frequent occurrence of relatively high locator values. Although this tendency is more pronounced on the Pacific side, where the onshore portion of the plate boundary lies, this particular area on the Sea of Japan side stands out for exhibiting exceptionally high locator values and elevated event frequency (Figure 5A–C). In contrast, the scale in this region is often very low (Figure 5D). Figure 5D corresponds to the same data shown in Figure 1B but with inverted colouring to highlight areas of low scale.
The combination of high earthquake frequency and low scale resembles the precursory patterns observed prior to volcanic activity in the Tokara Islands [12], Miyakejima, and Mount Aso [3]. These regions commonly exhibit swarms of small earthquakes when magma or hydrothermal fluids begin to migrate. Such processes generate frequent low-magnitude events, and in some cases, larger earthquakes can occur without clear warning [3].
Bathymetric data indicate that the seafloor in the offshore area adjacent to the Noto Peninsula is only about 100 metres deep, suggesting the possible presence of a submarine volcanic structure or a similar geological feature. Although direct evidence is limited, the seismic characteristics in this region are consistent with those typically associated with volcanic-type activity, such as a bank of fine silt and low Bouguer anomalies [15].
It is therefore plausible that the 1 January 2024 earthquake occurred when unreleased tectonic stress at the tip of the Noto Peninsula was triggered at a time when the surrounding offshore region was experiencing an elevated level of volcanic-type seismicity. The coincidence of these two conditions may have contributed to the generation of a large and damaging earthquake.
In this sense, the combination of a high locator in Figure 1C and a low scale in Figure 5D should have been noted as a potentially important signal. Although unconfirmed, the Noto region may also harbour volcanic hazards. It should be noted, however, that the reverse relationship does not always hold: some volcanic regions, such as Sakurajima, exhibit active volcanism without a corresponding decrease in scale.
Shallow seismic zones form discontinuous bands, a pattern that becomes particularly clear when analysis is restricted to very shallow hypocentres. Figure 6 displays earthquakes shallower than 5 km, thereby emphasising primarily volcanic type events (for example, Cape Erimo in the Kurils; Mount Akita Komagatake; the Hida Mountains including Mount Norikura and Mount Ontake; Miyakejima; Mount Aso; and the Tokara Islands). The offshore sources shown in Figure S1 are also visible because they occurred during the same interval. A band immediately south of these features follows the Pacific coastline. These shallow seismic zones lie closer to the Pacific Plate side than the surface tangent to the Sanriku boundary, suggesting that similar structures can form on the advancing plate as well.
At plate boundaries, contact and friction generate earthquake energy when frictional resistance is overcome. By contrast, shallow seismic zones appear to be regions where plate pressure is not readily released; instead, energy accumulates through crustal deformation. Several such shallow bands run roughly parallel to the line where crustal blocks overlap across the boundary.
Also apparent is a line extending from the Noto Peninsula to Sado Island. This feature may represent a distinct, unusually shallow segment among the shallow seismic zones and could accommodate Pacific Plate thrusting more readily than adjacent zones. The cause of this behaviour is unclear; one possibility is that it marks a marginal segment of the Eurasian Plate analogous to the Amur Plate [13,14]. A long, active fault is known along the northern coast of the Noto Peninsula [15], and seismic activity in the region has been associated with uplift of the peninsula [16,17]. Such plate driven orogenic processes contribute to the formation of the Japanese archipelago. Alternatively, continued uplift could eventually extend Noto eastward toward Sado Island. Historical precedent exists: an 1804 earthquake on the same Sea of Japan coast produced a 25 km wide uplifted strip at Kisakata that remains a notable landscape feature today [18].
In the 2024 event, the locator rose prior to declining with a characteristic half life (Figure 7A), a behaviour commonly observed following mainshocks [2], suggesting substantial energy release. The subsequent aftershock sequence, however, displays an unusual trajectory. After an initial decay consistent with a half life, the rate of aftershocks ceased declining after roughly two weeks and, unexpectedly, began to increase again. The cause of this resurgence is unknown, and no contemporaneous large earthquake has been identified to account for it. As of 2026, magnitudes remain relatively low (Figure 7C), and although aftershocks continue, their activity appears to have partially stabilized (Figure 7D). No clear small scale or high/low locator patterns have been detected (Figure 7E–F). Nevertheless, the region remains susceptible to major earthquakes and may be undergoing ongoing orogenic processes; continued vigilant monitoring is therefore warranted.
4. Conclusion
Although advanced visualization methods for seismicity have been developed, effective use of these tools requires experience. Regional variability in seismic behaviour is evident, and there are geodynamic reasons why some areas are more earthquake prone than others. In this study we examined the frequent seismicity of the Noto Peninsula and assessed potential avenues for short term indication. The offshore region west of Noto may host previously undetected submarine volcanic or volcano related structures; this possibility, together with evidence for ongoing orogenic deformation, argues for continued, ideally annual, monitoring of epicentral activity. Moreover, following any large event it is essential to verify whether accumulated energy has been sufficiently released. In this respect, the recent sequence off the Sanriku coast merits sustained attention.
Supplementary Materials
The following supporting information can be downloaded at the website of this paper posted on Preprints.org, Figure S1: Two recent earthquakes at Sanriku boundary.
Funding
This research received no external funding.
Data Availability Statement
Conflicts of Interest
The authors declare no conflicts of interest.
Abbreviations
The following abbreviations are used in this manuscript:
| JMA | Japan Meteorological Agency |
References
- Konishi, T. Identifying Seismic Anomalies through Latitude-Longitude Mesh Analysis. Preprints 2025. [Google Scholar] [CrossRef]
- Konishi, T. Visualising Earthquakes: Plate Interfaces and Seismic Decay. Preprints 2025, 189197. [Google Scholar] [CrossRef]
- Konishi, T. Exploratory Statistical Analysis of Precursors to Moderate Earthquakes in Japan. GeoHazards 2025, 6, 82. [Google Scholar] [CrossRef]
- Konishi, T. Seismic pattern changes before the 2011 Tohoku earthquake revealed by exploratory data analysis. Interpretation 2025, T725–T735. [Google Scholar] [CrossRef]
- Tukey, J.W. Exploratory data analysis; Addison-Wesley Pub. Co.: Reading, Mass.; London, 1977. [Google Scholar]
- SEMATECH, NIST/. e-Handbook of Statistical Methods. Available online: http://www.itl.nist.gov/div898/handbook (accessed on 28 January 2026).
- JMA. Earthquake Monthly Report (Catalog Edition). Available online: https://www.data.jma.go.jp/eqev/data/bulletin/hypo.html (accessed on 28 January 2026).
- JMA. List of epicenter location. Available online: https://www.data.jma.go.jp/eqev/data/daily_map/index.html (accessed on 28 January 2026).
- R Core Team, R: A language and environment for statistical computing; R Foundation for Statistical Computing: Vienna, 2025.
- Konishi, T. R-codes used in Earthquake-studies. Available online: https://zenodo.org/records/17983156 (accessed on 28 January 2026).
- Geospatial Information Authority of Japan (GSI). Standard map. Available online: https://maps.gsi.go.jp/.
- Konishi, T. Earthquake Swarm Activity in the Tokara Islands (2025): Statistical Analysis Indicates Low Probability of Major Seismic Event. GeoHazards 2025, 6, 52. [Google Scholar] [CrossRef]
- Bird, P. An updated digital model of plate boundaries. Geochemistry, Geophysics, Geosystems 2003, 4. [Google Scholar] [CrossRef]
- Malyshev, Y.F.; Podgornyi, V.Y.; Shevchenko, B.F.; Romanovskii, N.P.; Kaplun, V.B.; Gornov, P.Y. Deep structure of the Amur lithospheric Plate border zone. Russian Journal of Pacific Geology 2007, 1, 107–119. [Google Scholar] [CrossRef]
- Geological Survey of Japan. Seamless geoinformation of coastal zone “Northern coastal zone of Noto Peninsula”. Available online: https://www.gsj.jp/researches/project/coastal-geology/results/s-1.html (accessed on 28 January 2026).
- JMA. Related information on the 2024 Noto Peninsula Earthquake. Available online: https://www.jma.go.jp/jma/menu/20240101_noto_jishin.html (accessed on 28 January 2026).
- Fujiwara, K. Coastal uplift and topographic changes caused by the Noto Peninsula earthquake. Available online: https://rebootsuzu.com/noto/20250303/ (accessed on 28 January 2026).
- Hirano, S.; Nakata, T.; Imaizumi, T. Crustal Shin-ichi Deformation Earthquake Sea Coast, Associated of with the 1804 on the Japan Northeast Japan. The Quaternary Research 1979, 18, 17–30. [Google Scholar] [CrossRef]
- National Research Institute for Earth Science and Disaster Resilience. J-SHIS Japan Seismic Hazard Information. Available online: https://www.j-shis.bosai.go.jp/map/?lang=en (accessed on 28 January 2026).
Figure 1.
A–B. Magnitude-based anomaly metrics for all earthquakes in 2023 [1]. A. Locator. B. Scale. Both parameters show elevated values around the Noto Peninsula (approx. 37°N, 137°E). C–D. Data from October 2023 onward, after aftershocks from the May 2023 earthquake had largely subsided. C. Locator. D. Scale. The locator remains elevated, whereas the scale appears to have returned to normal levels.
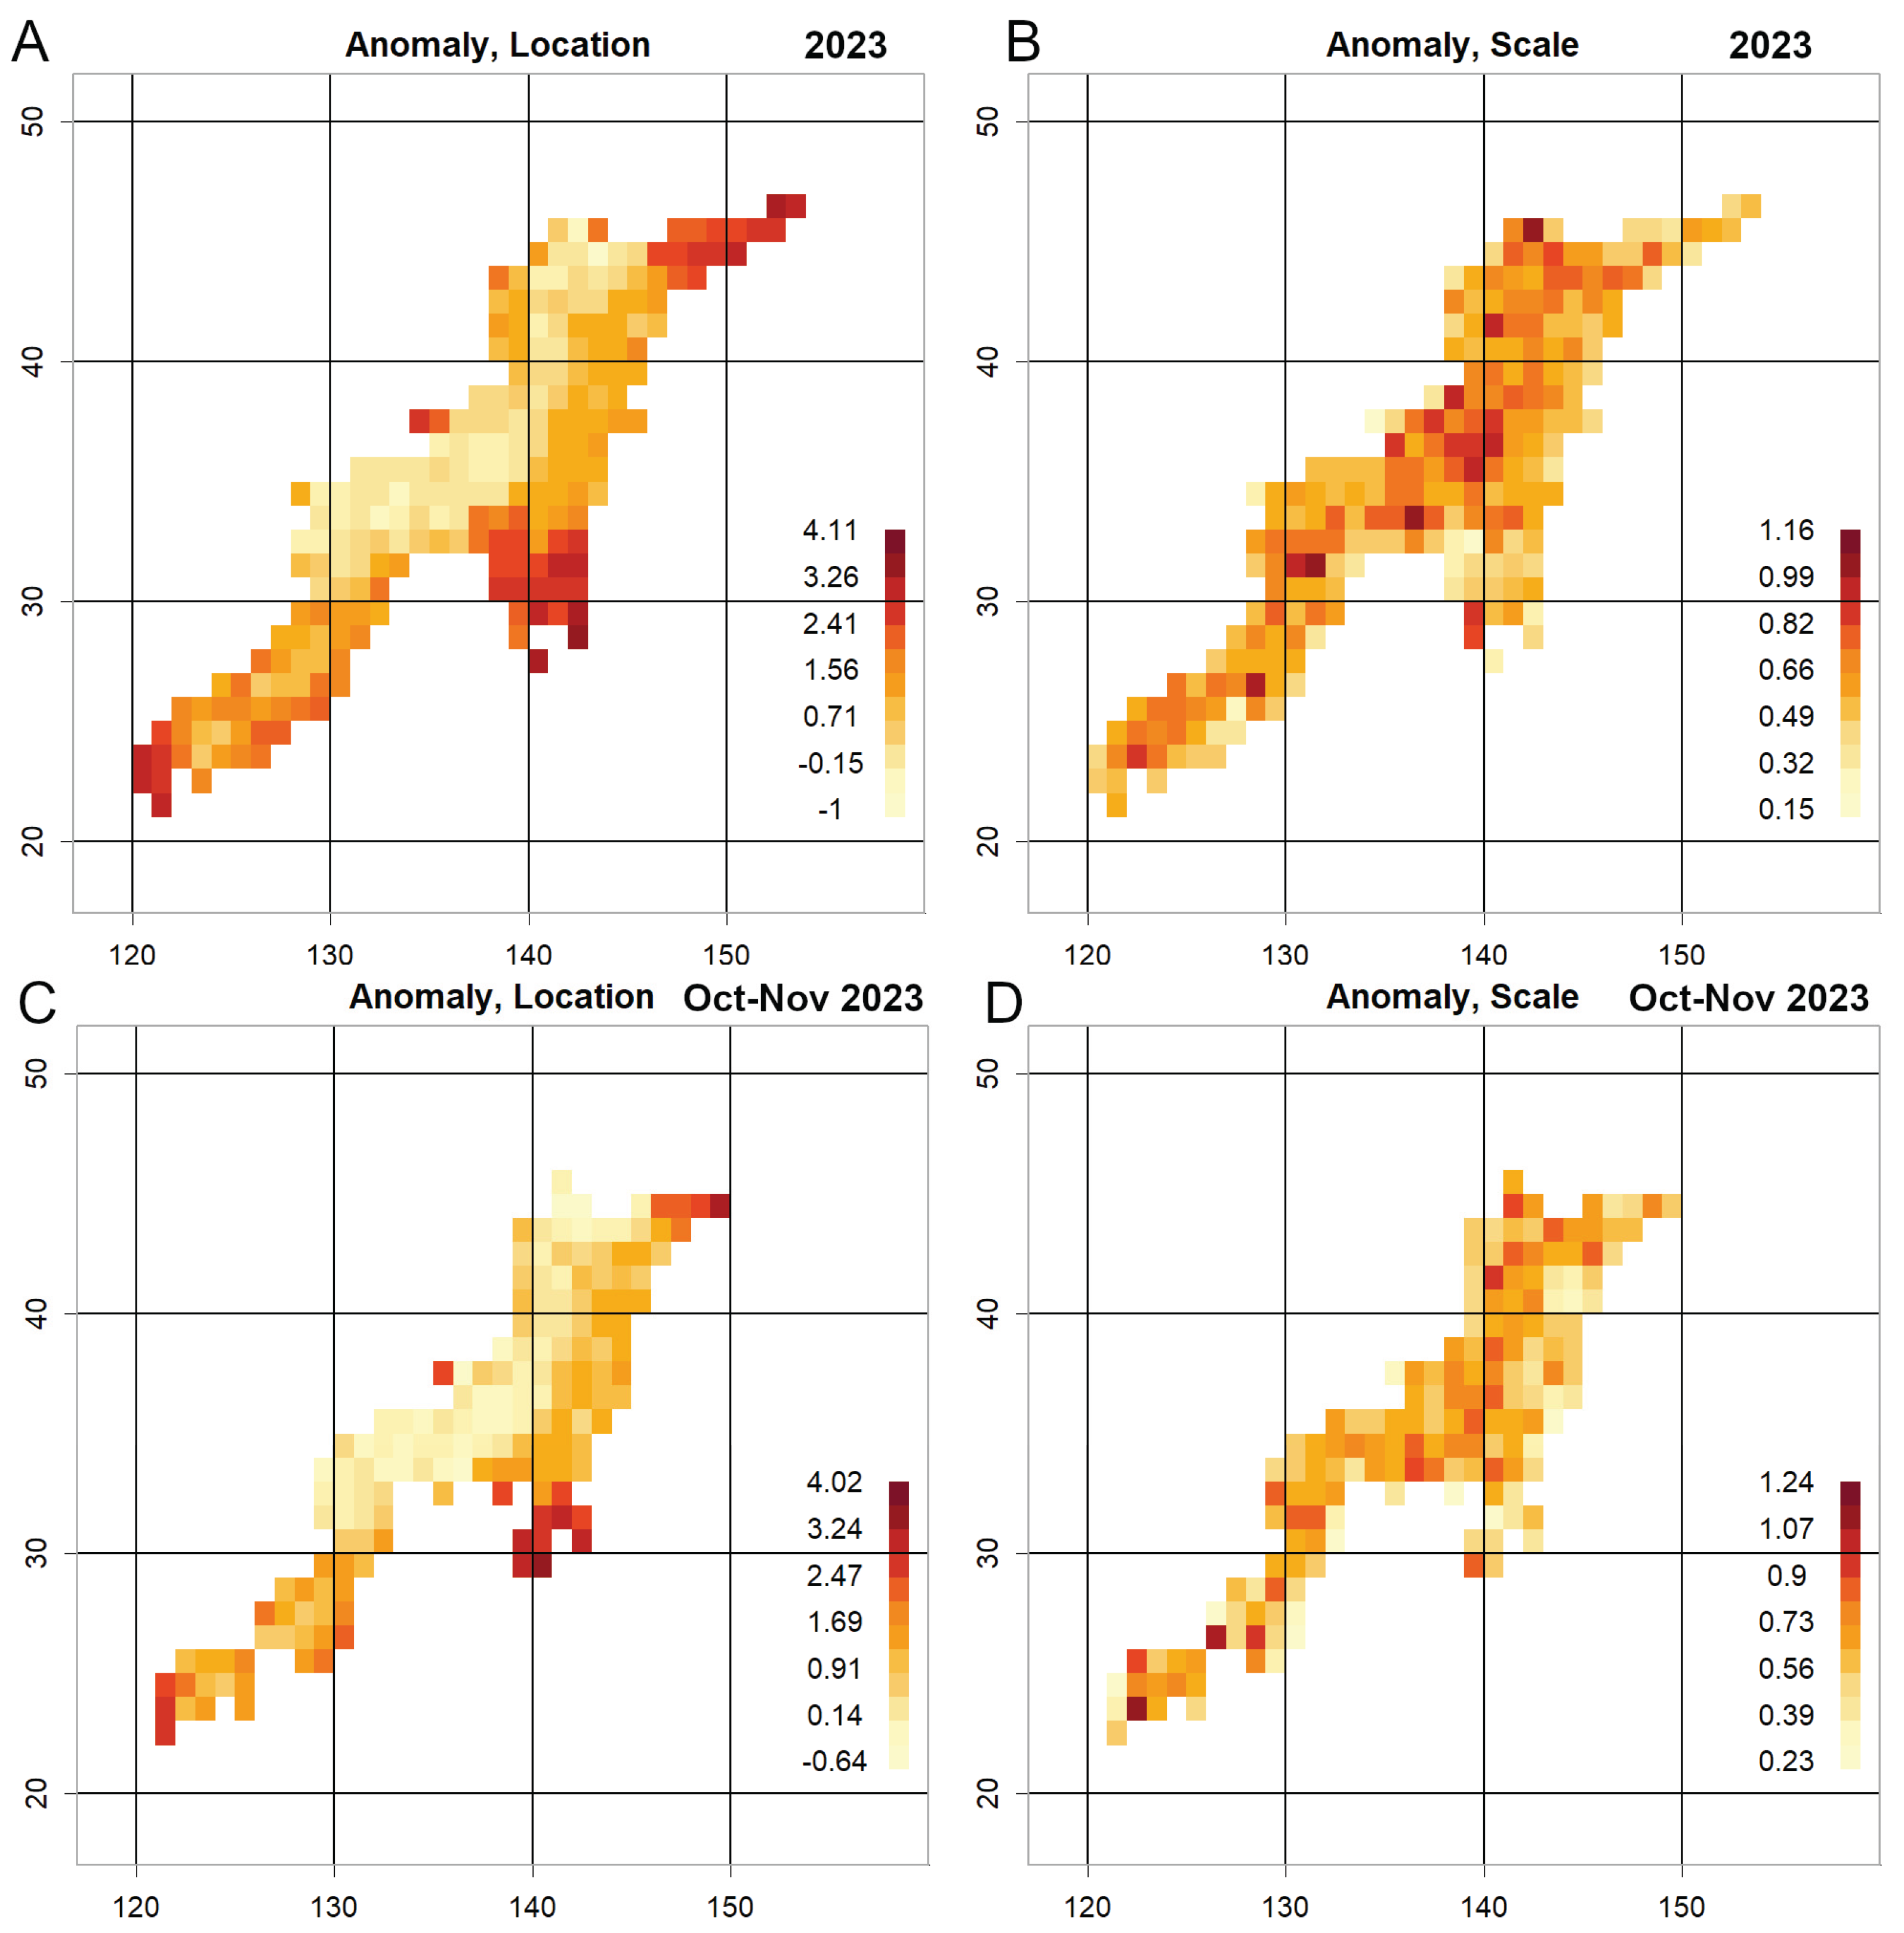
Figure 2.
A. Number of aftershocks observed in 12 hour intervals. The semi logarithmic plot exhibits an approximately linear decay, consistent with previously reported half life behaviour [2]. B. Hourly estimates of the magnitude parameters. The locator shows only a brief and very small increase immediately after the 5 May event, returning to baseline within a short period. In contrast, the increase observed from September onward is more pronounced and persistent.
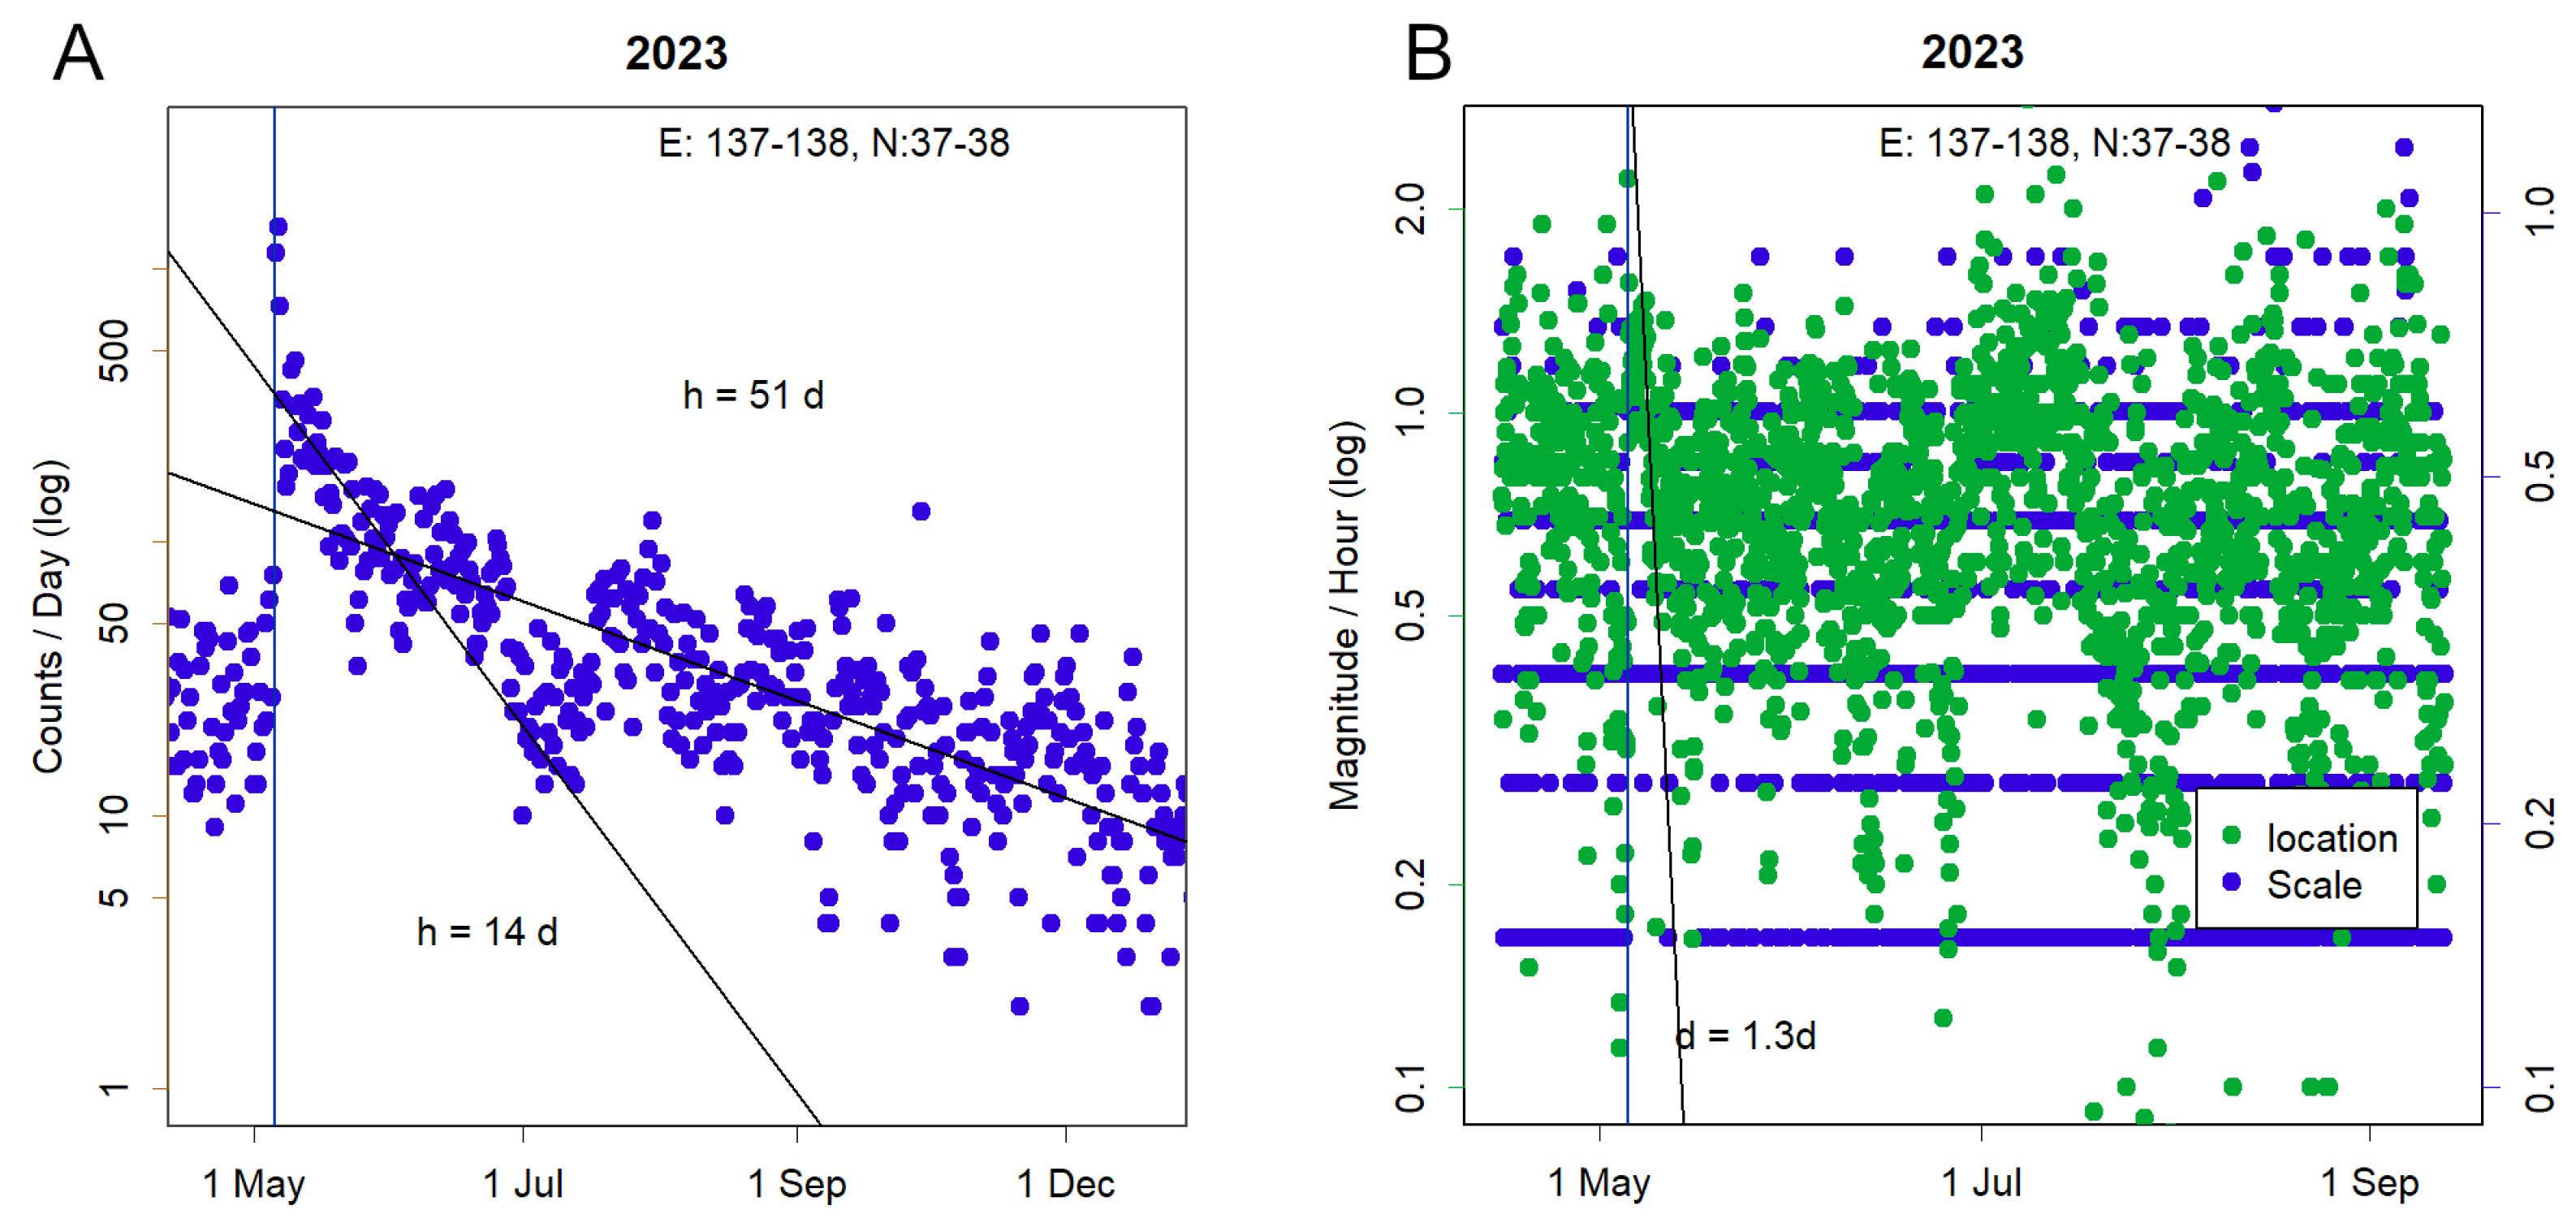
Figure 3.
A. Standard map from the Ministry of Land, Infrastructure, Transport and Tourism [11]. Although shown at the same scale as the subsequent panels, it covers a slightly wider area due to its larger original size. The regions depicted in panels B–F are positioned almost entirely within this map. B–F. Annual distributions of earthquake epicentres. Green symbols denote events with magnitudes M > 4. A progressive increase in seismicity is evident near the tip of the Noto Peninsula. In panel F (2023), the elevated number of epicentres reflects the M6.5 earthquake on 5 May and its subsequent aftershocks.
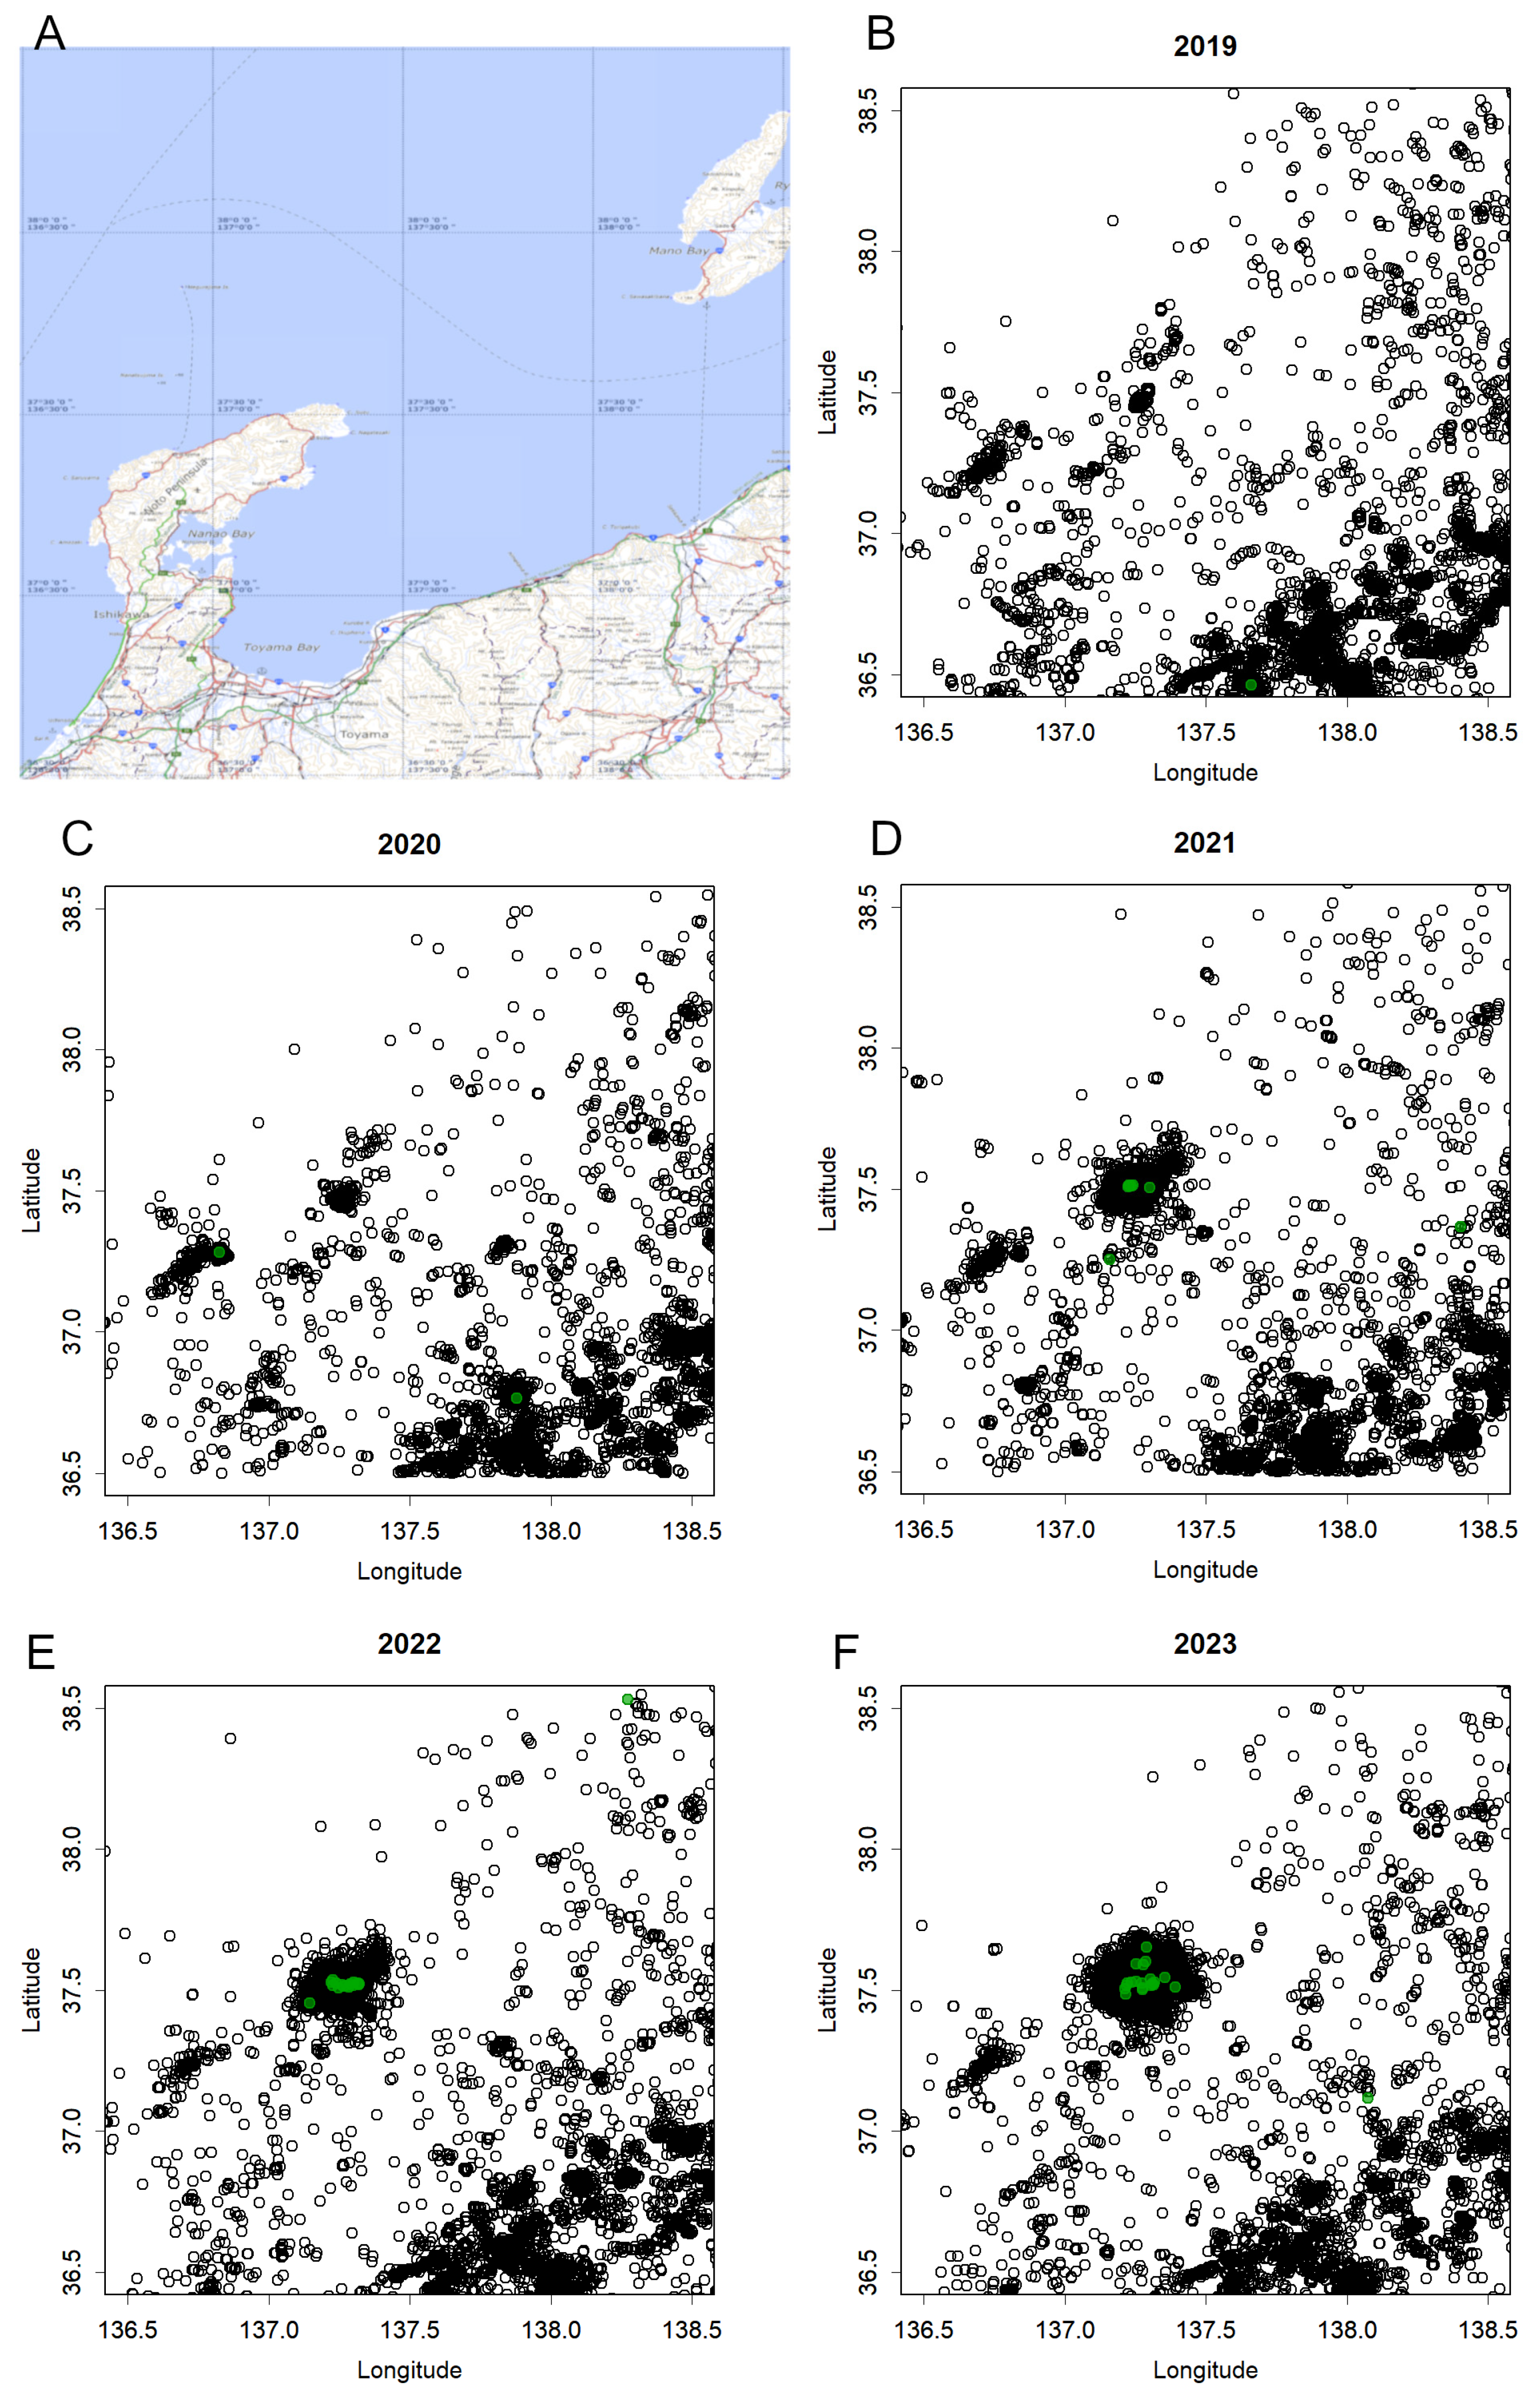
Figure 4.
A. Immediately after the M7.6 earthquake on 1 January 2024, seismic activity expanded into the offshore region west of the Noto Peninsula, forming the pattern shown in panel A within one month. B. This offshore area corresponds to the epicentral region of the 25 March 2007 M6.9 earthquake. C–D. Epicentres. They are fundamentally shallow, typically occurring above ~20 km depth. Events deeper than 200 km are limited to those located along the Sanriku boundary. Along the boundary itself, neither the number of earthquakes nor the occurrence of large events has increased.
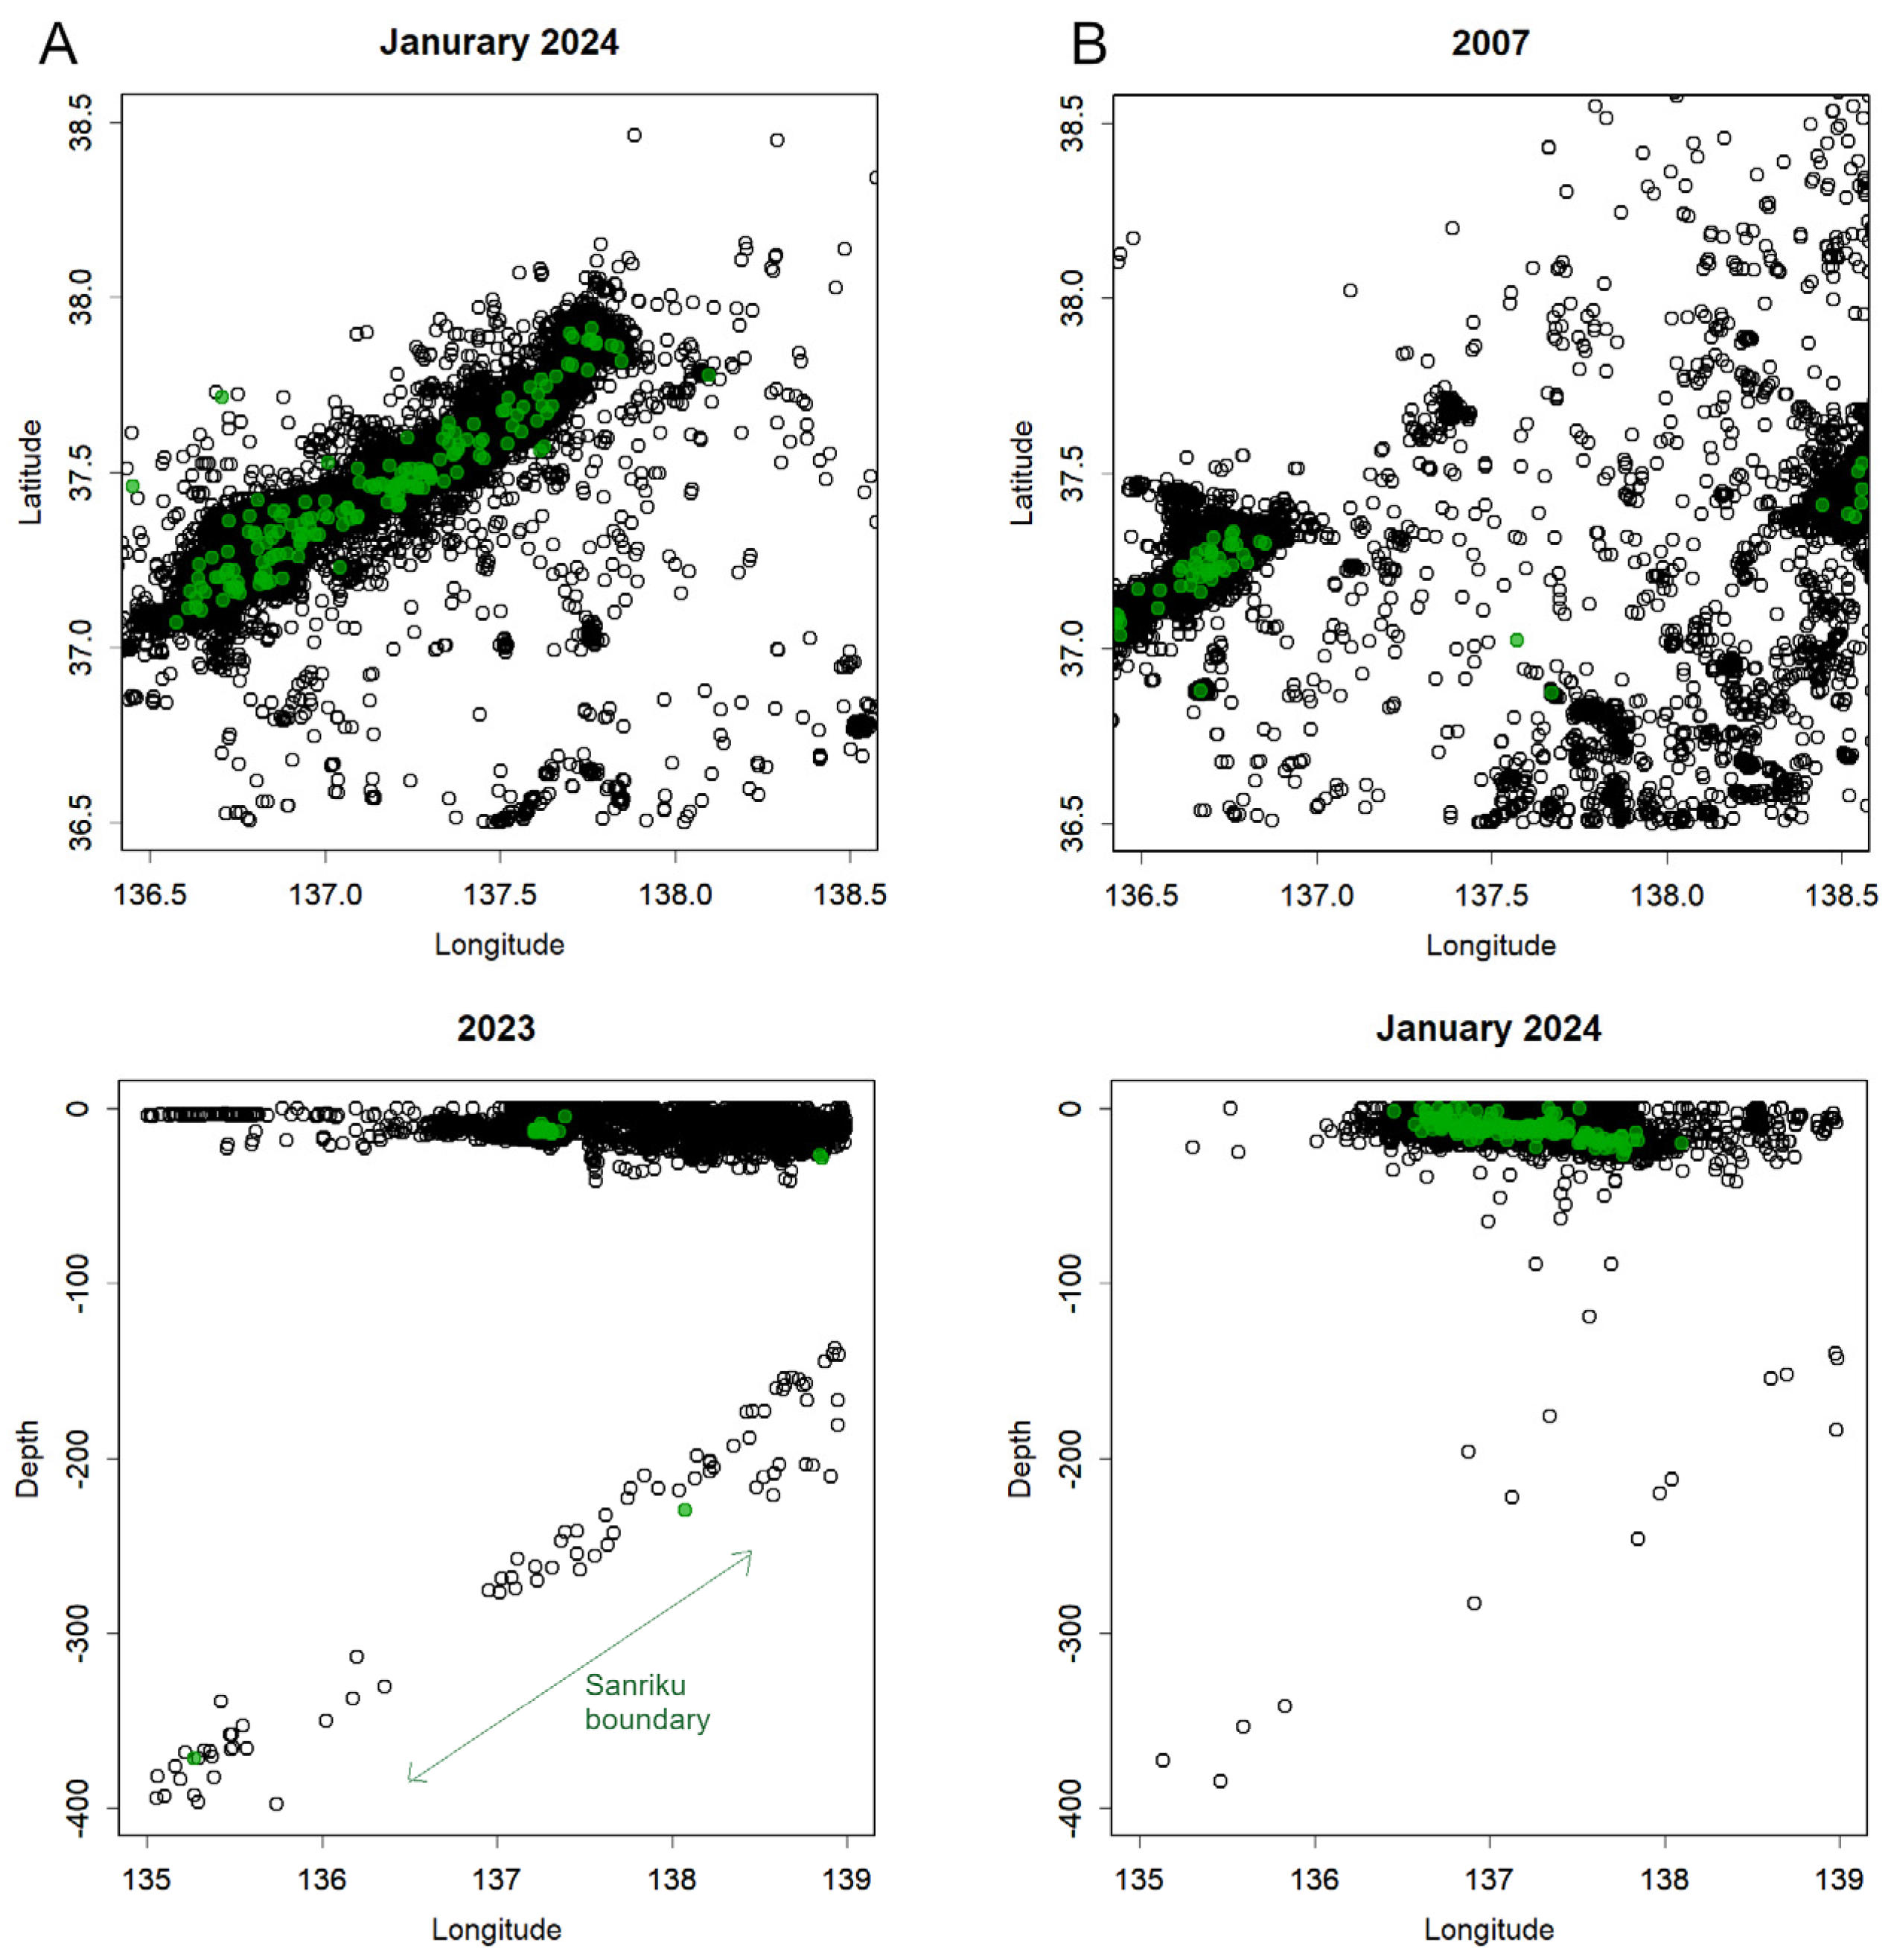
Figure 5.
A–C. The offshore region west of the Noto Peninsula frequently exhibits elevated magnitude locator values, a tendency more pronounced here than in other areas on the Sea of Japan side [3]. D. In 2023, the scale in this region became extremely low. This panel shows the same data as Figure 1B but with inverted colouring to highlight low scale areas. A combination of high earthquake frequency and low scale is characteristic of seismic patterns observed in volcanic regions during periods of heightened volcanic activity [1,3,12].
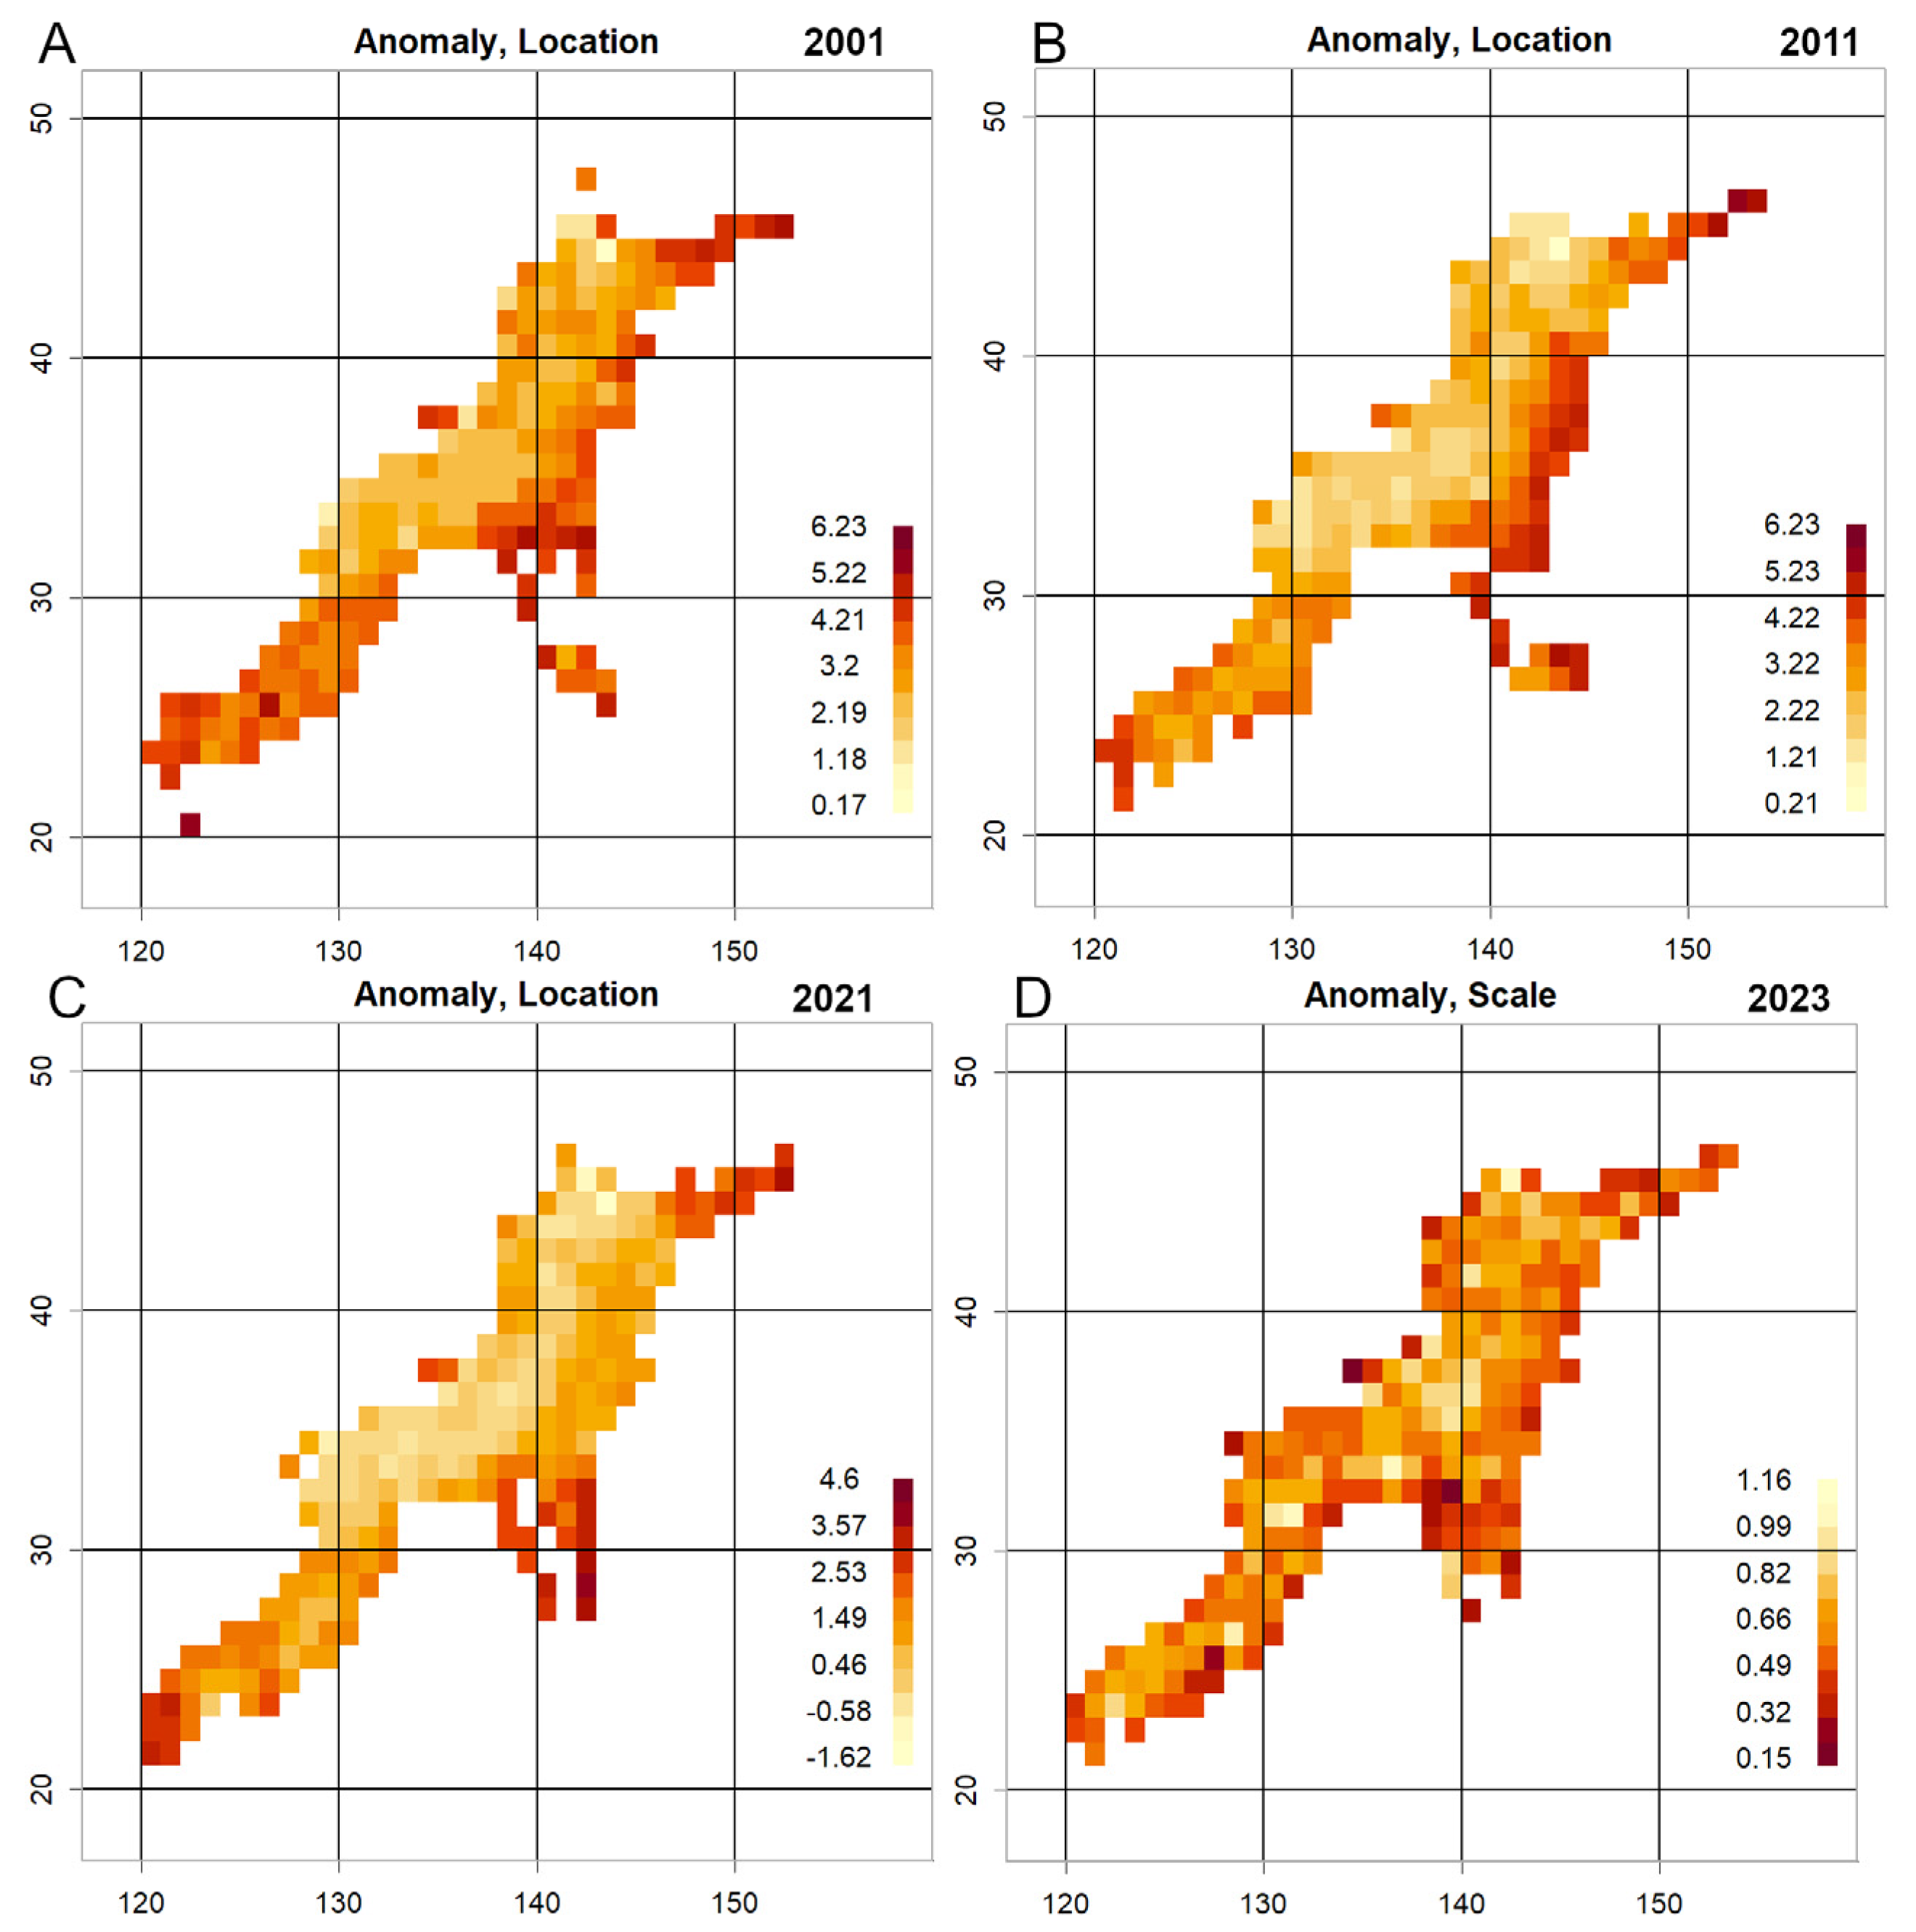
Figure 6.
A. Epicentres shallower than 5 km (data from October 2025 to January 2026). Shallow events are concentrated where volcanic activity has been reported; the offshore clusters shown in Figure S1 are also visible because they occurred during the same interval. A shallow band immediately south of these features follows the Pacific coastline and corresponds to the shallow seismicity highlighted in Figure S1. The line extending from the Noto Peninsula to Sado Island lies on the Eurasian Plate and is subject to compressive loading; under the present filtering this segment appears unusually dominated by very shallow earthquakes. B. J-SIS Japan Seismic Hazard Information: shallow earthquakes and active faults [19], shown at the same scale as panel A. Inset (green outlines). Left outline: area shown in Figure 3; right outline: approximate extent of Figure S1.
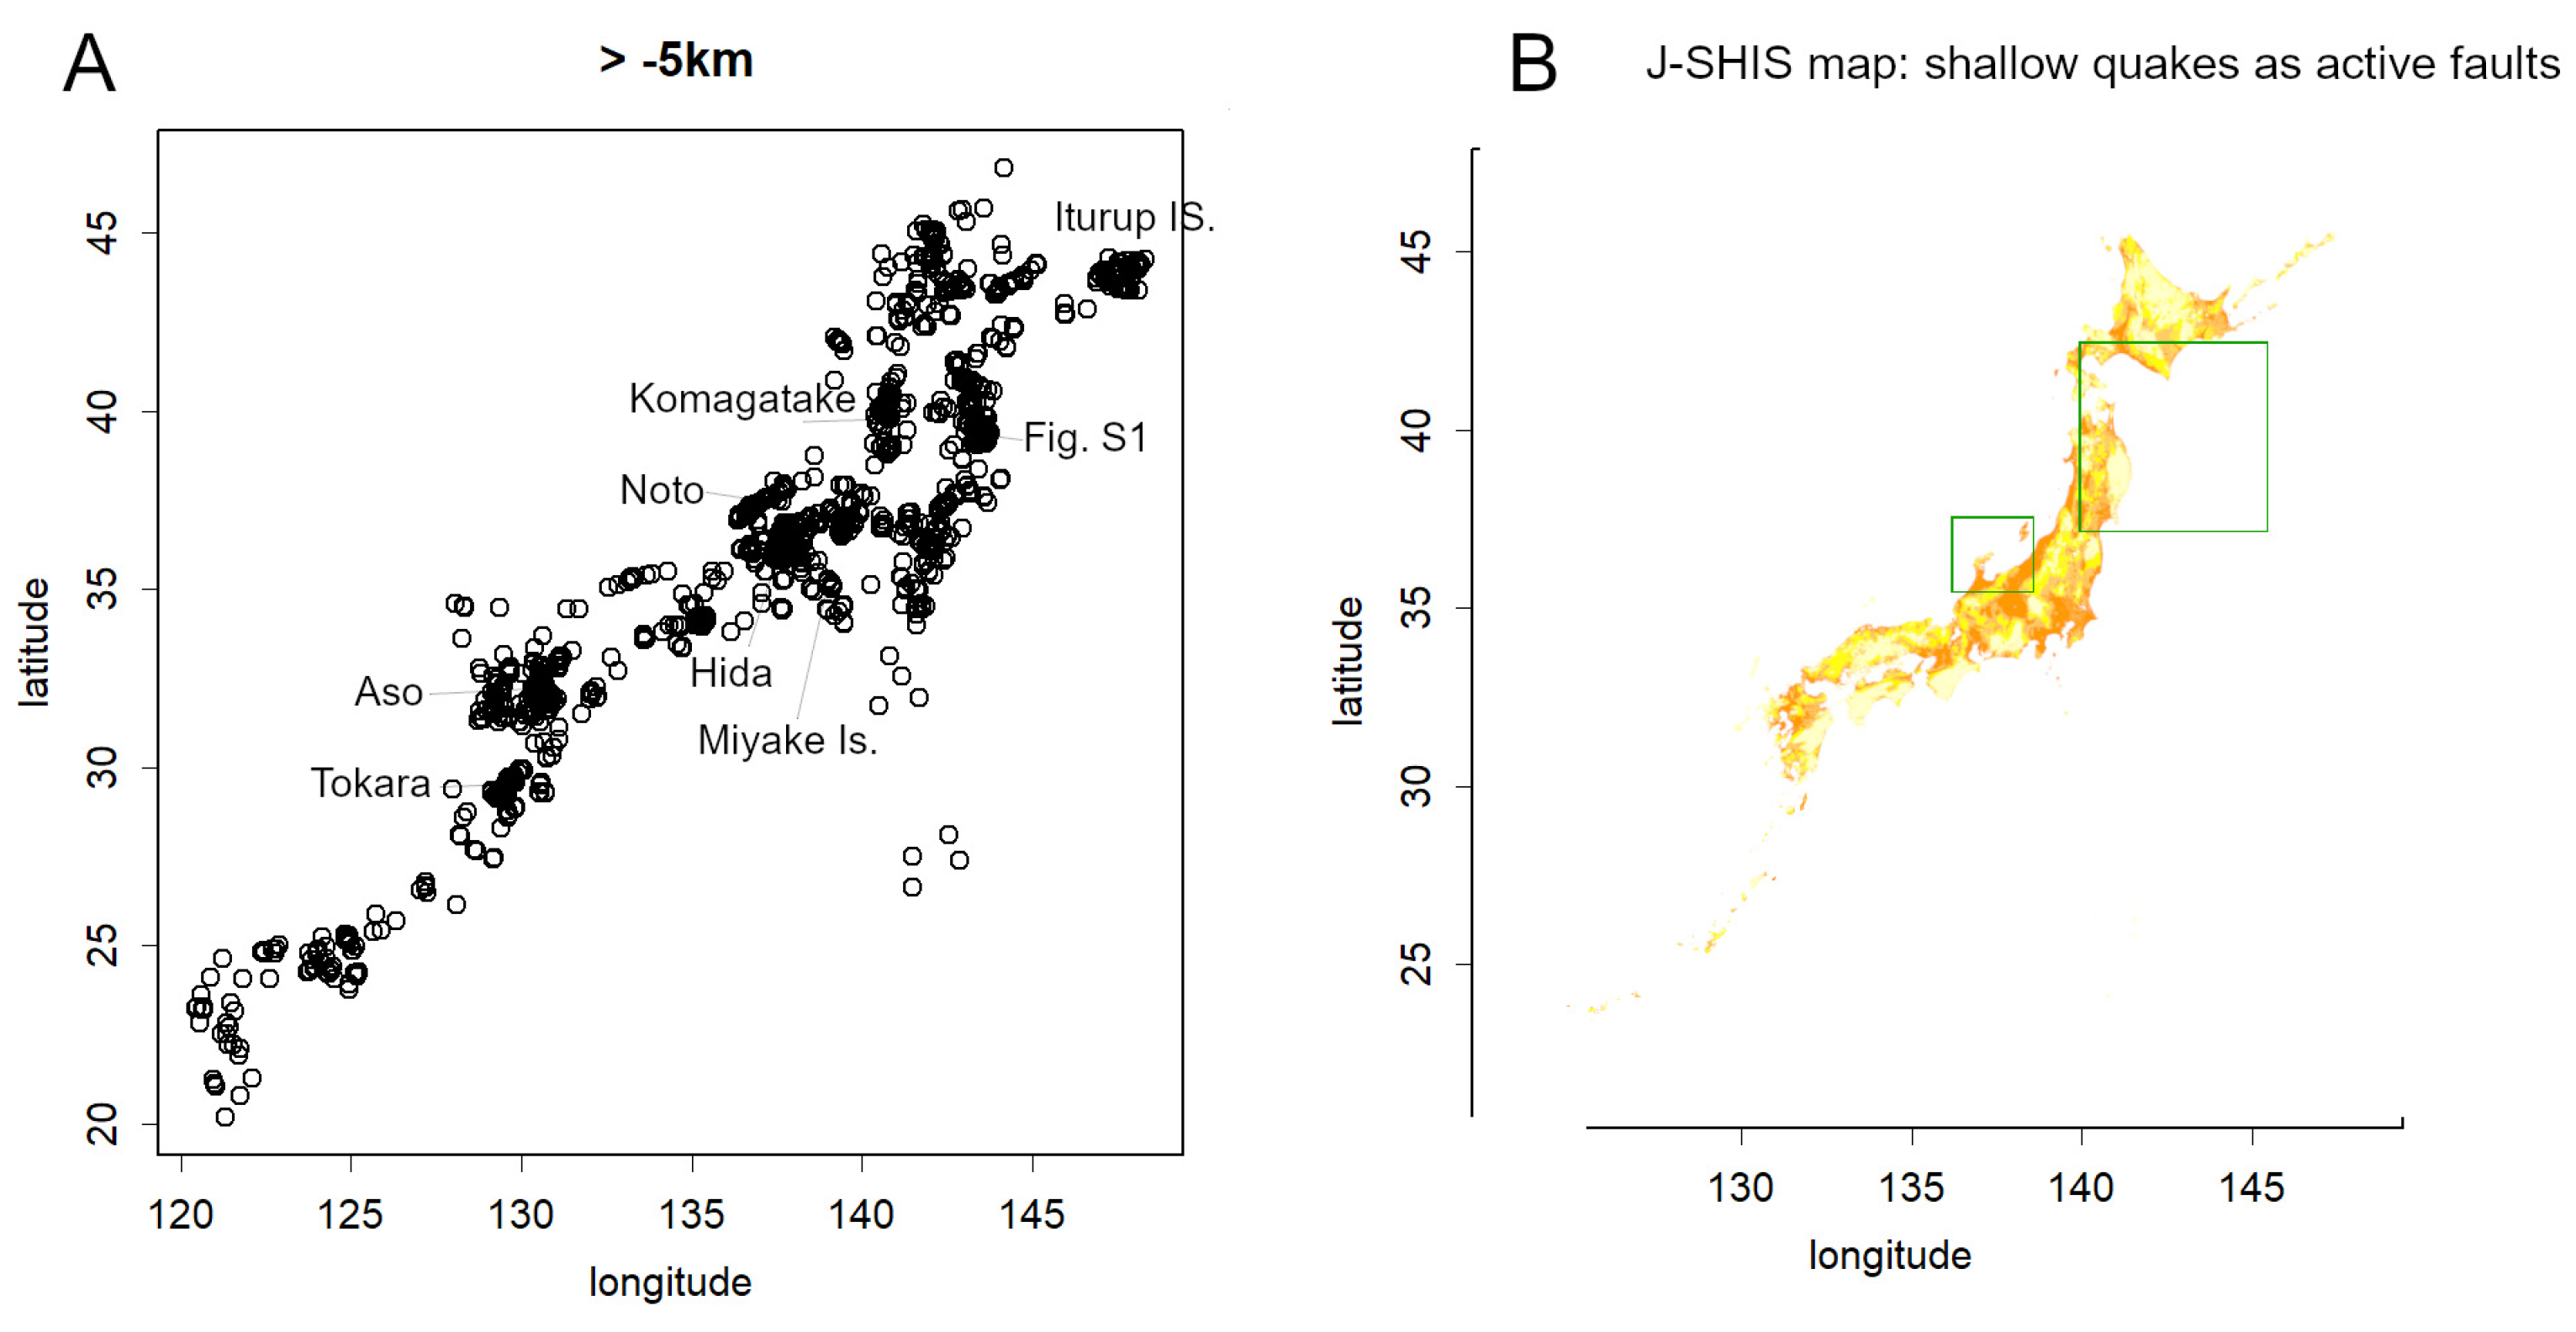
Figure 7.
A. Twelve hour average magnitude during the M7.6 earthquake on 1 January 2024. Magnitudes are clearly elevated during the mainshock and then decline approximately linearly, a trend more pronounced than that shown in Figure 2B. B. Aftershock counts (12 hour intervals). After an initial linear decrease, the aftershock rate ceased declining after roughly three weeks and subsequently increased—an unusual pattern that contrasts with the behaviour in Figure 1A. C–D. Twelve hour average magnitude and aftershock data for October 2025 to January 2026. Both metrics remain at low levels during this interval. E–F. Mesh derived locator and scale data for 2025–2026. Locator values near Noto are not elevated, and no decrease in scale is observed.
Disclaimer/Publisher’s Note: The statements, opinions and data contained in all publications are solely those of the individual author(s) and contributor(s) and not of MDPI and/or the editor(s). MDPI and/or the editor(s) disclaim responsibility for any injury to people or property resulting from any ideas, methods, instructions or products referred to in the content. |
© 2026 by the authors. Licensee MDPI, Basel, Switzerland. This article is an open access article distributed under the terms and conditions of the Creative Commons Attribution (CC BY) license (http://creativecommons.org/licenses/by/4.0/).
Copyright: This open access article is published under a Creative Commons CC BY 4.0 license, which permit the free download, distribution, and reuse, provided that the author and preprint are cited in any reuse.


