1. Introduction
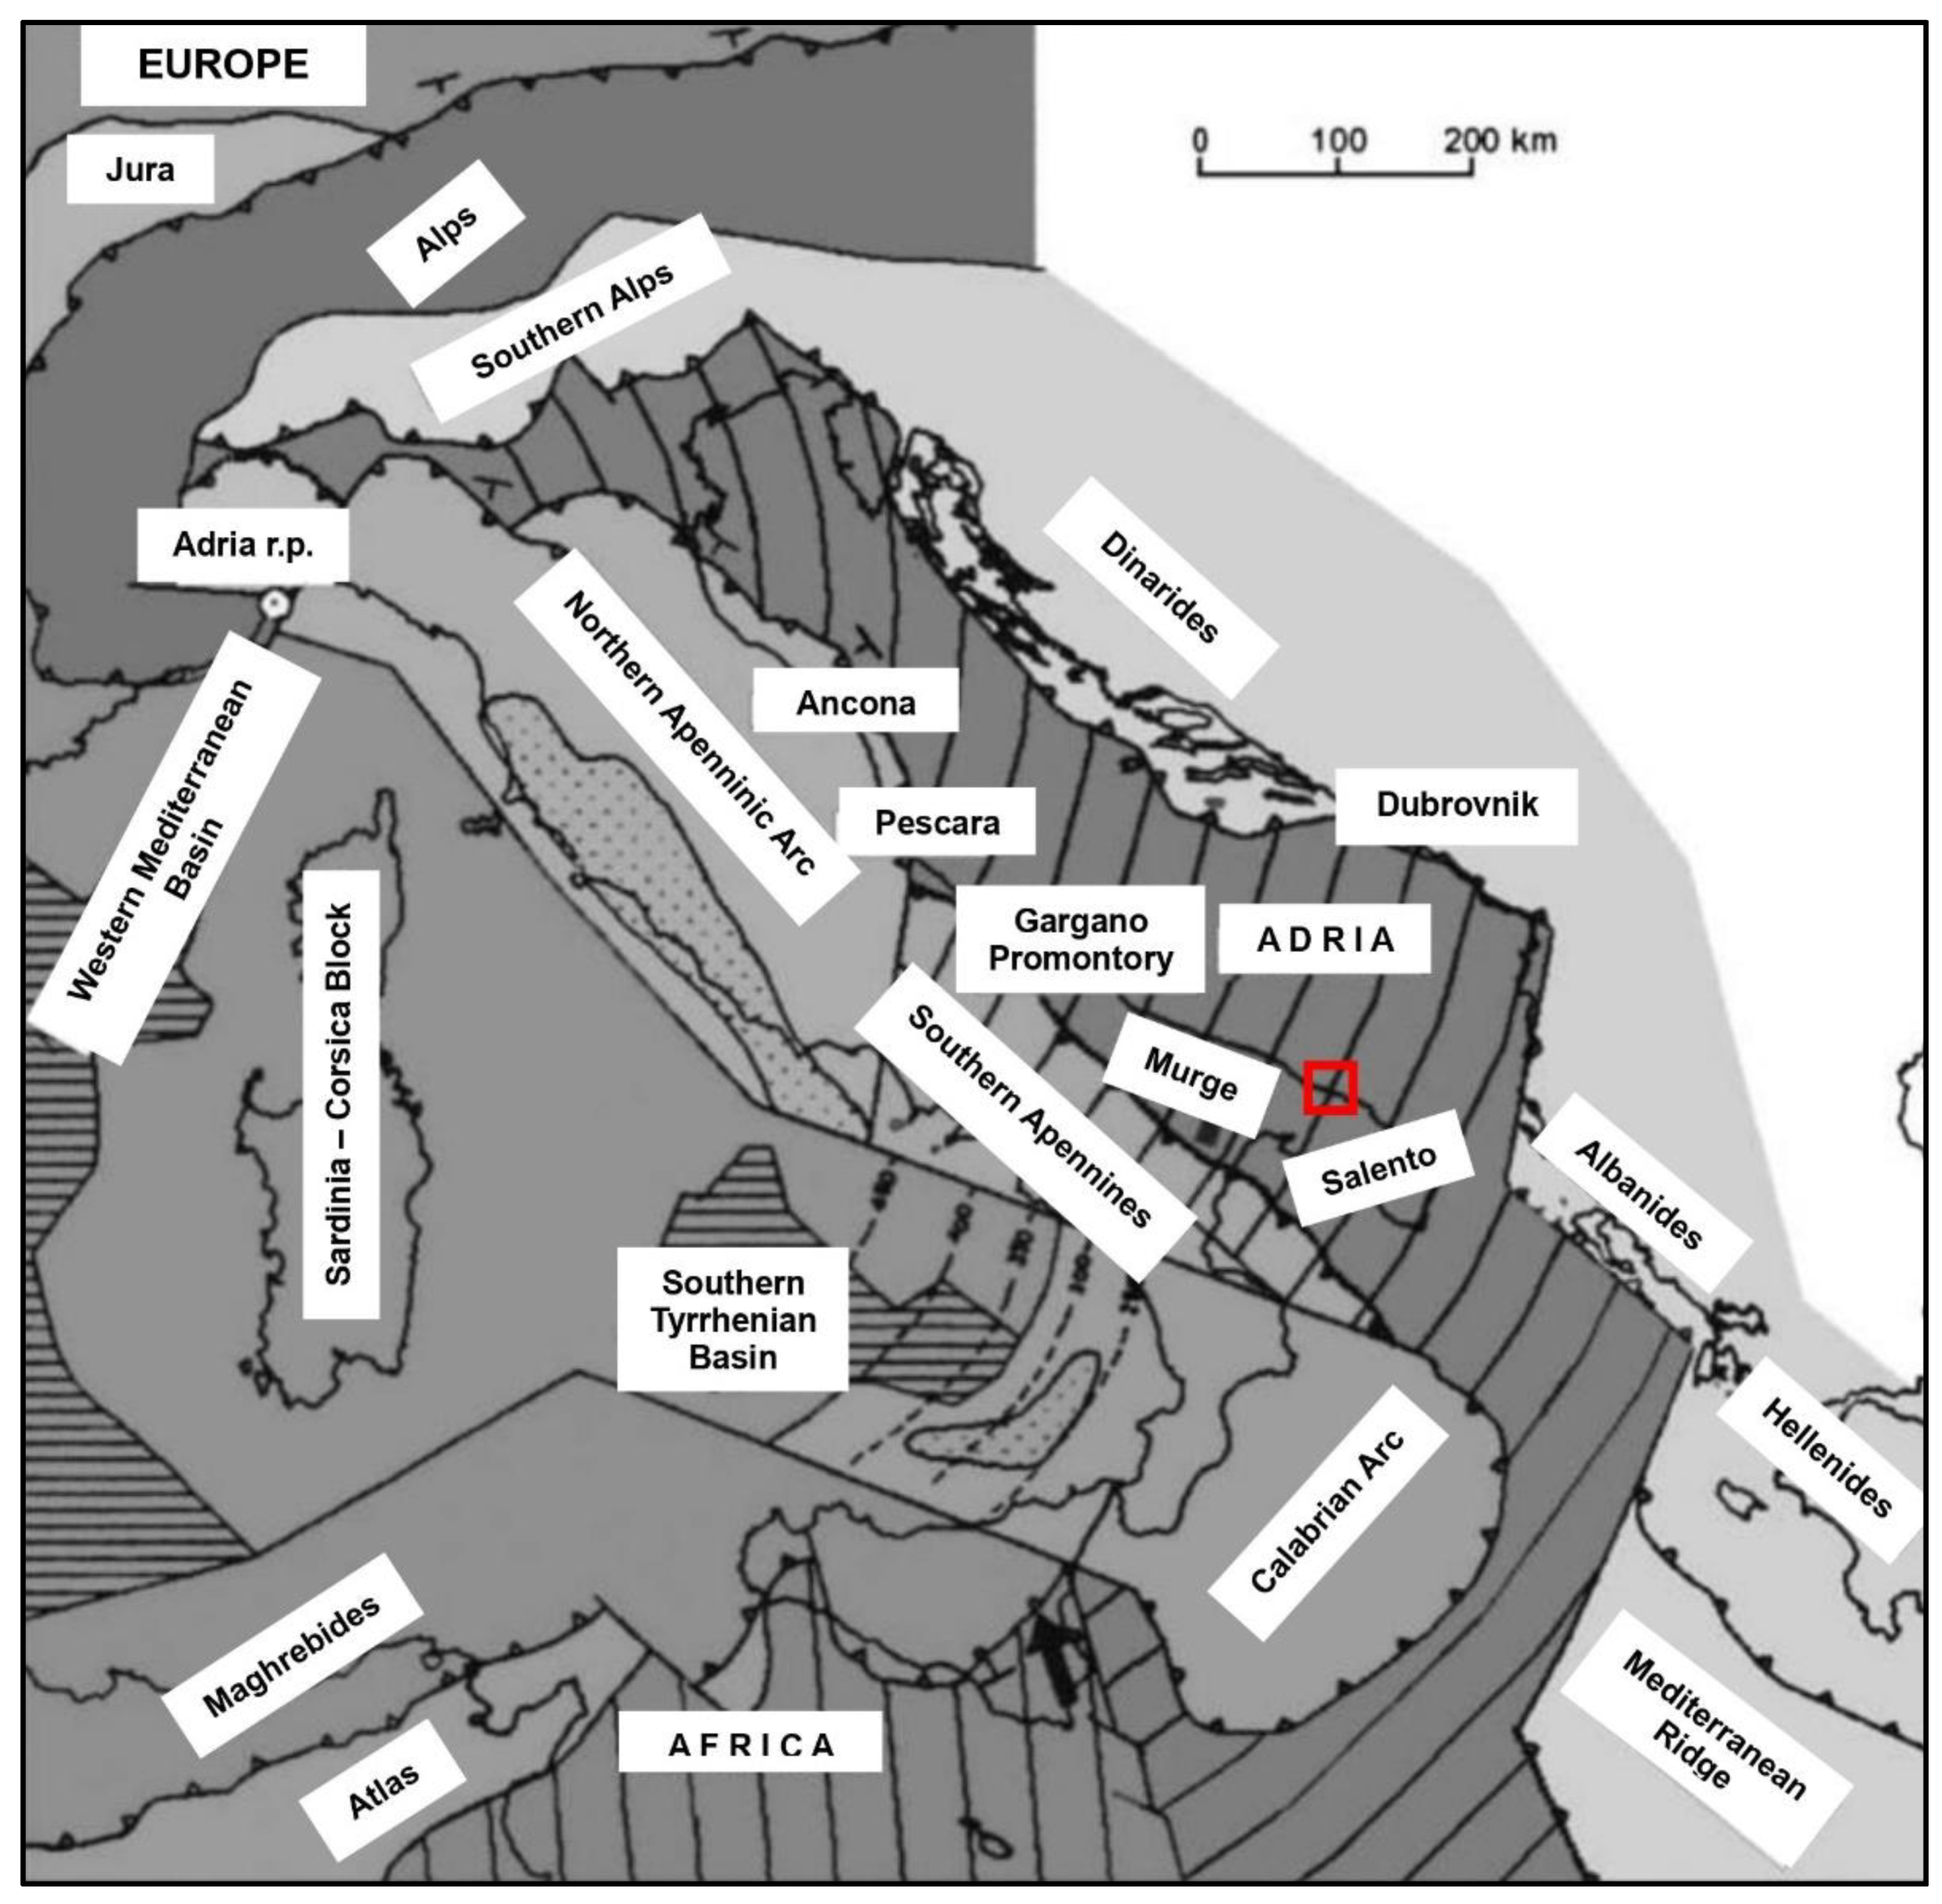
Apulia region, in southern Italy, is part of the Adria plate, a microplate whose tec-tonic evolution is dominated by the collision with two major plates, Eurasia and Africa. Two subduction zones in opposite directions are recognized: at the western side, the subduction is considered still active beneath the northern Apennine and the Calabrian arc [
1]; at the eastern side, beneath the Dinarides the subduction is considered extinct, while it is considered still active in the Hellenic arc [
2]. This complex tectonics involves the collision toward northwest with Eurasia plate, where Adria is the upper plate, involving a counterclockwise rotation in the Western Alps [
3] whose Euler pole of rotation is still debated (refer to the discussion in Le Breton et al. [
4]). In
Figure 1 we show a schematic framework of the Adria plate and surroundings, according to the seismotectonic model proposed by Meletti et al. [
5].
All the boundaries of Adria plate are characterized by an intense seismic activity, that can be also very deep (as Wadati-Benioff zone in the Hellenic and Calabrian arcs) [
1,
6]. The inner part of Adria, where Apulia is located, is characterized by a modest recent seismic activity, if compared to the adjacent areas of the Apennine or of Albania and Greece, although it has been the site of strong earthquakes in the past. The Apulia region has different characteristics of seismicity moving from the North to the South. The historical seismicity of northern Apulia was analyzed in detail by using data of the CPTI Working Group [
7]. They report 22 events with magnitude Mw > 5.2 [
8], demonstrating that the seismogenic structures of northern Apulia can generate damaging earthquakes. Central Apulia is characterized by low and sporadic seismicity due to a tensional stress regime, possibly related to both Apennine and northern Apulia seismogenetic activity [
9]. However, it suffers from a lack of seismological knowledge as a consequence of a relatively poor spatial and temporal coverage of seismic monitoring.
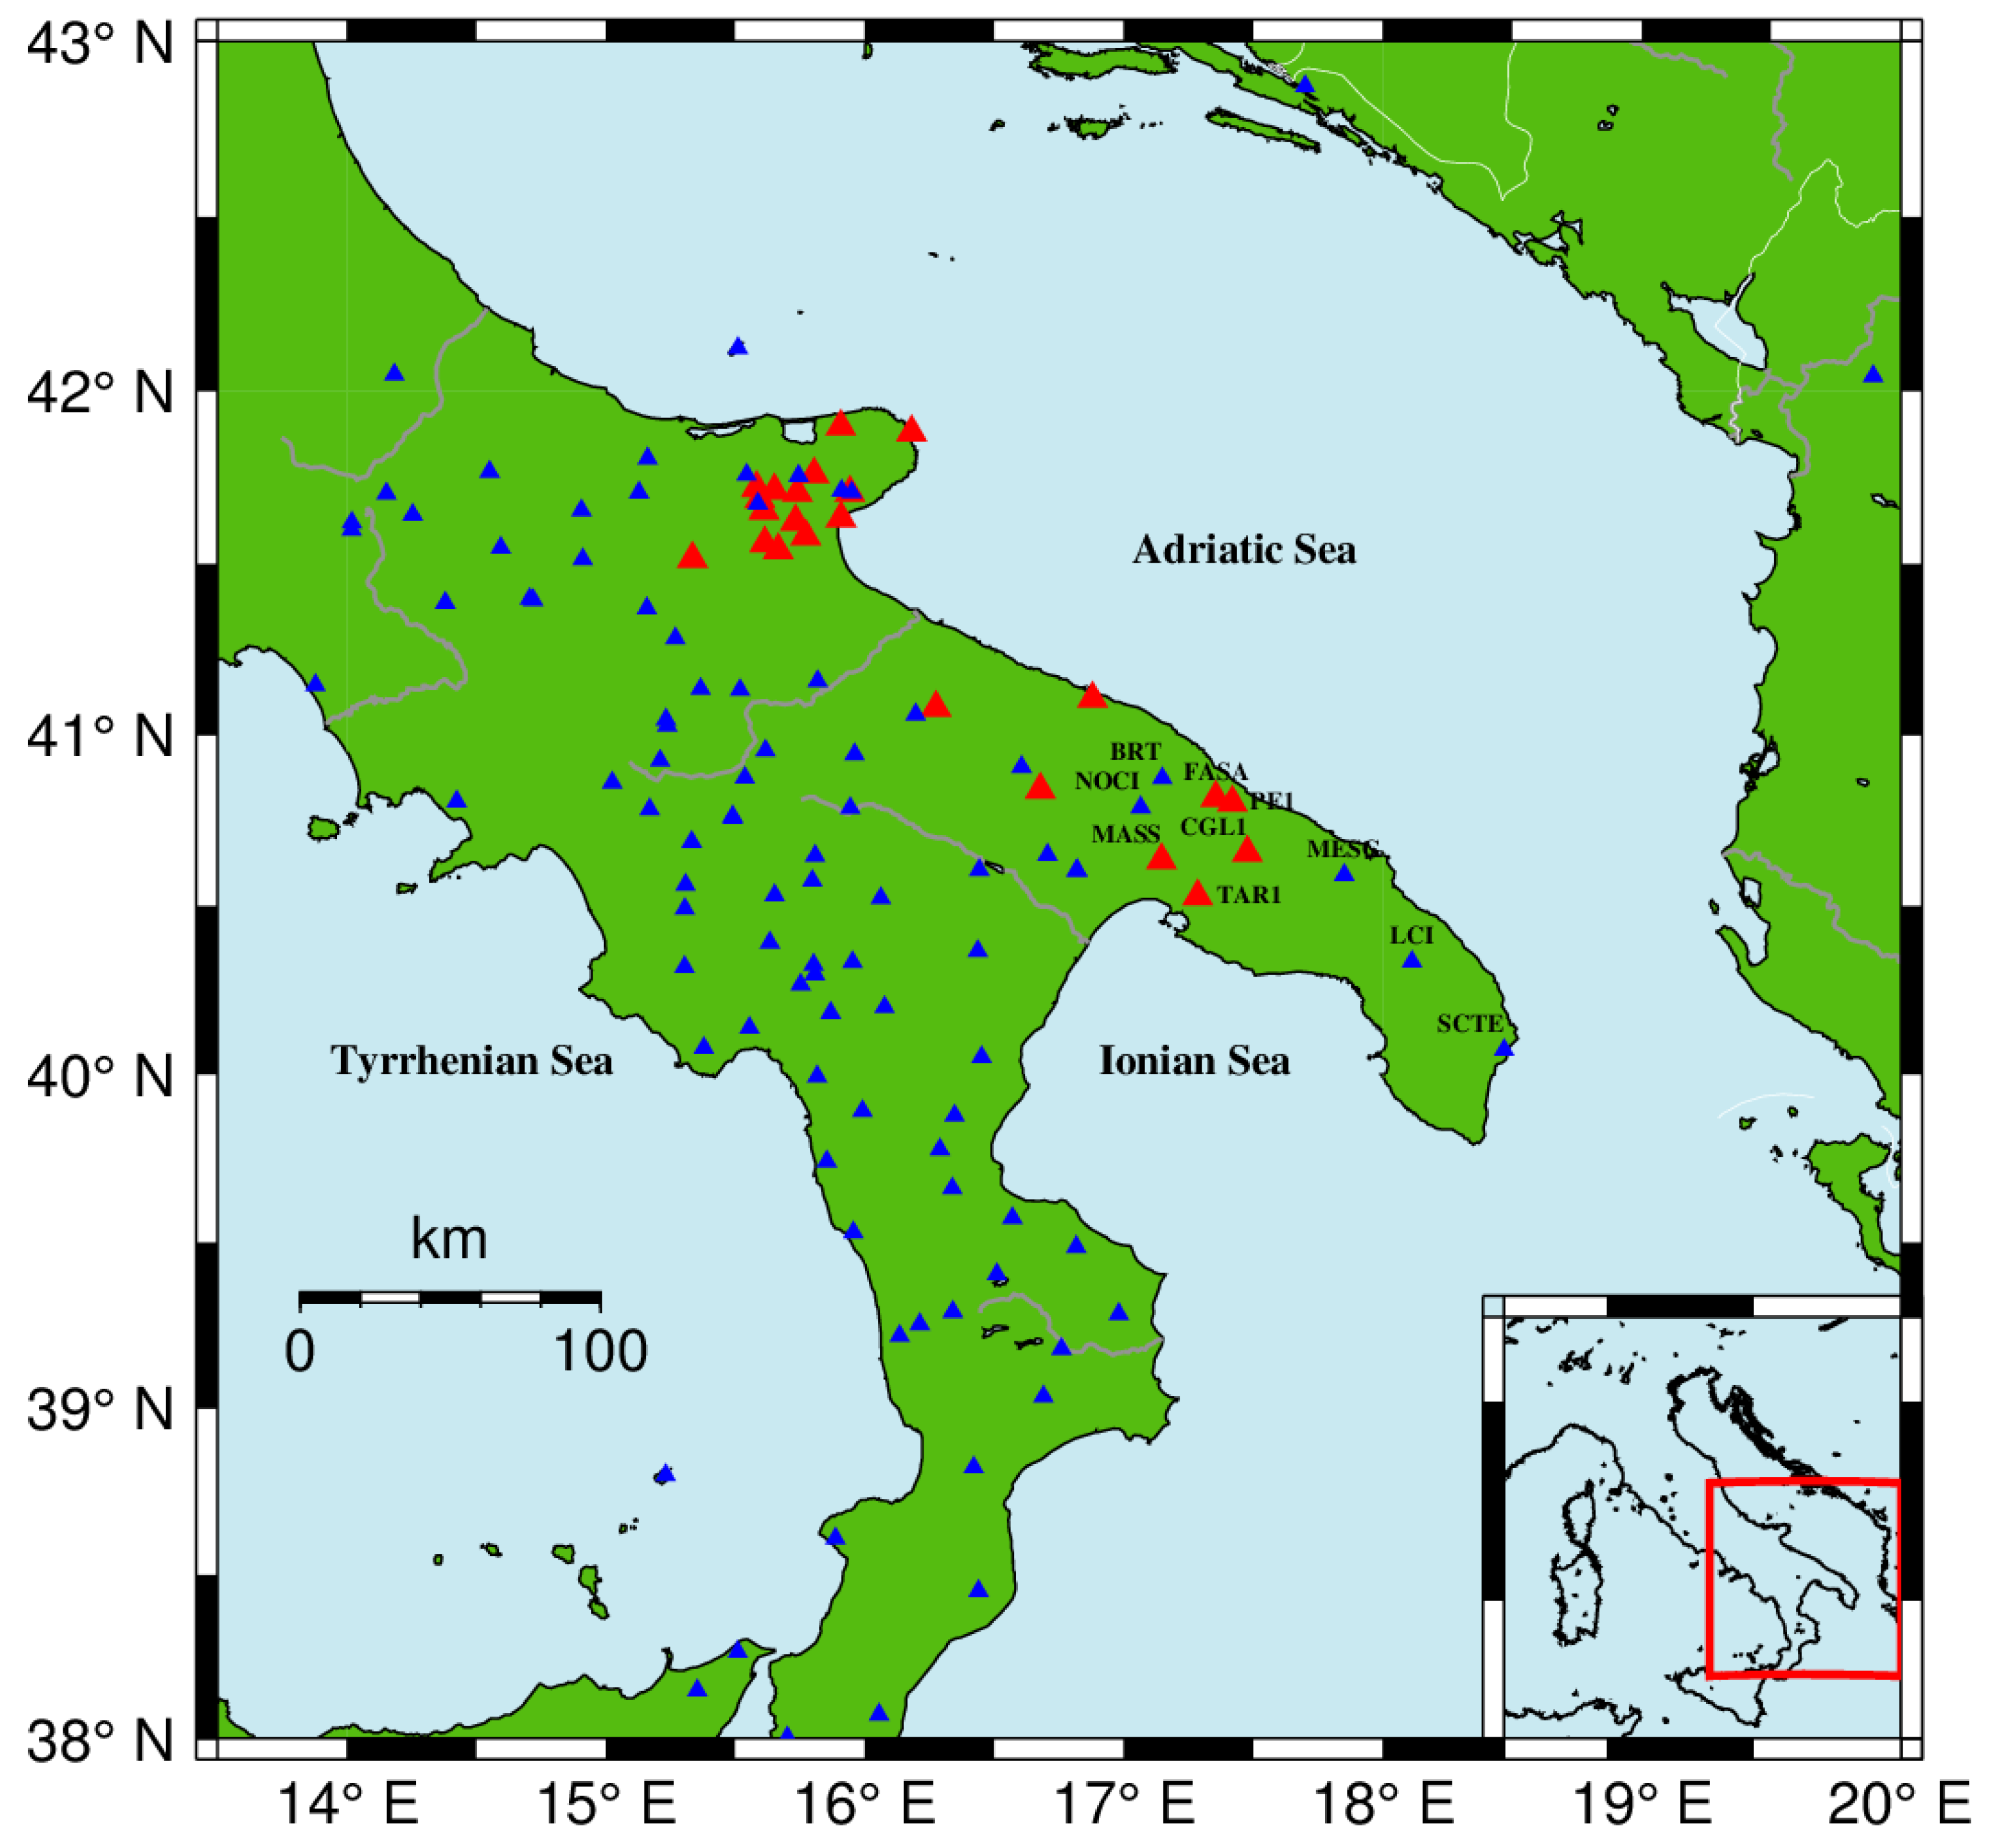
Seismic monitoring in Italy is managed by the National Institute of Geophysics and Volcanology (Istituto Nazionale di Geofisica e Vulcanologia - INGV) through the National Seismic Network (“Rete Sismica Nazionale” – RSN), whose code, within the International Federation of Digital Seismograph Networks – FDSN – is IV. At present, this network has only 3 seismic stations (NOCI, MESG, SCTE) operational in Southern Apulia, after the closure of two other stations (LCI, BRT) in 2006. In recent years, the seismic monitoring of this region has been supported by 5 seismic stations (TAR1, MASS, FASA, CGL1, PE1) managed by the Seismologic Observatory of the University of Bari (OSUB). The recordings of this network, in conjunction with those of the RSN, allowed the detection of several low energy earthquakes, such as the ML 2.8 event of May 5th, 2012, which occurred near Ostuni and was felt by many inhabitants.
To improve the seismic monitoring of the Apulian territory, in 2013, thanks to a European project INTERREG and in collaboration with INGV, University of Bari (UniBa) installed a local seismic network covering the entire territory of Apulia, the OTRIONS network (FDSN code OT). OT network incorporated also some stations already operating in southern Apulia, previously managed by OSUB (
Figure 2). The details on the operation of OT network from 2013 to 2019 are described in the work of Filippucci et al. [
10]. Since 2021, other stations have been added and in 2024 some sensors have been replaced (for further details, see the page
https://www.fdsn.org/networks/detail/OT/). From May 2019, the OT registrations are available also on EIDA (European Integrated data Archive) INGV node and can be used to detect earthquakes on Italian territory. As a result, the OT network has improved the detection of earthquakes throughout the territory of Apulia and southern Italy, as demonstrated by the earthquakes listed on ONT (National Earthquake Observatory) section of the INGV website.
The most energetic event ever recorded by seismic networks in central-southern Puglia occurred on March 23
rd, 2018, with M
w = 3.7 and M
L = 3.9; this earthquake occurred in the southeast Murge Adriatic offshore, at the transition between the Apulian Foreland and the Dinarides-Albanides foredeep domains, about 10 km from the town of Ostuni, one of the most touristy and populated municipalities in the province of Brindisi. This event was analyzed in a previous work by Festa et al. [
11] to retrieve the geometry of the seismogenic structure responsible for this earthquake but the authors used the information as downloaded from ONT, before the OT network was integrated into the RSN.
Due to the lack of seismicity and of seismic monitoring, no information is available on the tectonic stress regime for the Apulia foreland area in the Italian Present-day Stress Indicators database [
12] (IPSI,
https://ipsi.rm.ingv.it/). Furthermore, no potential seismogenic faults capable of producing significant permanent tectonic deformation at the surface (capable faults) are reported for this area in the Database of Individual Seismogenic Sources [
13] and in the database of active capable faults of the Italian territory [
14]. The lack of knowledge of the seismogenic potential of the Italian territory has led in the recent past to an underestimation of the hazard of northern Apulia. The 2002 Molise Mw 5.7 earthquake surprised the Italian seismological scientific community as it occurred in an area considered to be of low seismic hazard, despite the fact that Molise is located between regions characterized by significant historical seismicity, such as the Gargano promontory and the Molise Apennine ridge [
15]. This earthquake also caught the local community off guard, as an entire class of schoolchildren was killed by the collapse of a primary school building.
The aim of this paper is to integrate all the seismic data available on the ONT with the OT registrations and to obtain a more robust catalog of earthquakes that occurred in central-southern Apulia during the last 25 years. The data used in this paper are available upon request from the authors. We also computed the focal mechanisms and stress field to improve the knowledge of the seismogenic structures in central-southern Apulia.
2. Structural Setting
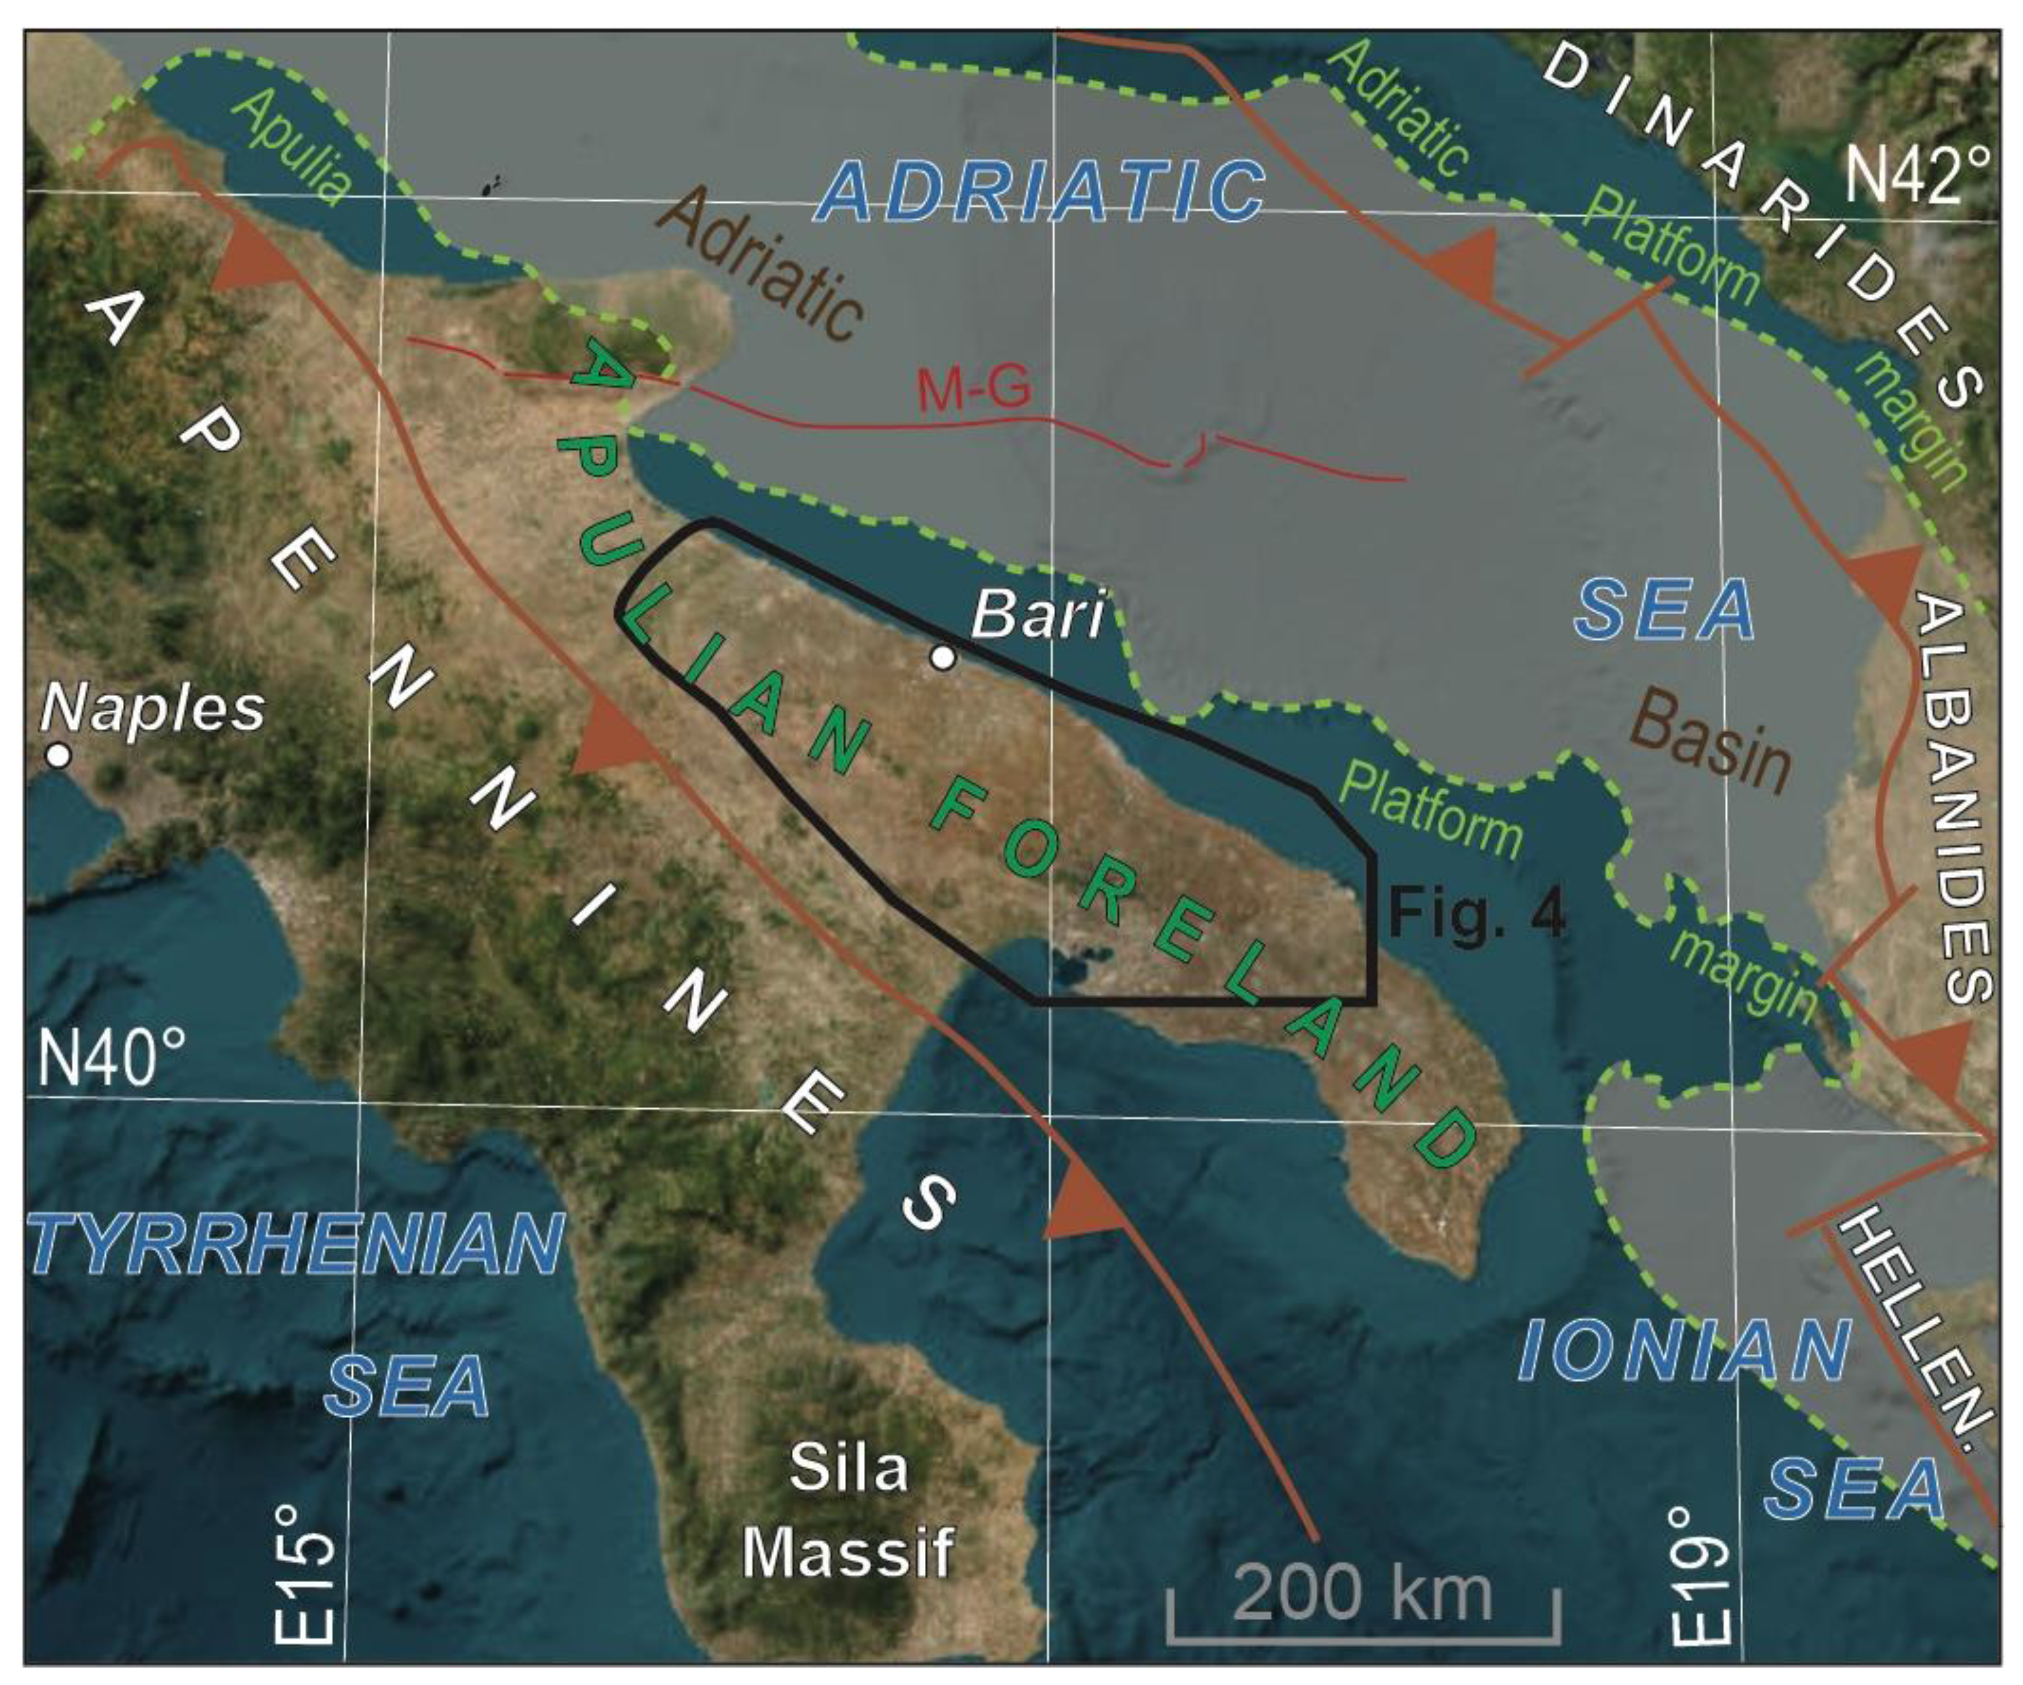
In the framework of the Adria plate geodynamics, the southern Adriatic Sea area represents the Oligocene - Quaternary foreland basin of the Dinarides-Albanides-Hellenides orogen’s portion [
16,
17,
18,
19] (
Figure 3). During the orogenic growth of the Dinarides-Albanides-Hellenides, the Mesozoic-Eocene Adriatic Basin was gradually involved to the west in the foreland basin, whose tectonic subsidence came to affect the south-eastern part of the adjacent Apulia Platform as well [
19]. To the west, the Apulia Platform progressively subsided, eastwards, in the Neogene - Quaternary foredeep domain of the southern Apennines [
20,
21,
22]. Therefore, a remnant of the Apulia Platform dominates the Apulian Foreland, i.e., the Plio-Pleistocene foreland shared by Apennines and Dinarides-Albanides-Hellenides [
20,
23] (
Figure 3).
The uplift since the Middle Pleistocene of the Apulian Foreland occurred in relation to a NW-SE striking regional, gentle buckle fold of the Adria plate, which occurred due to the difficult eastward roll-back of the continental lithosphere during Apennines subduction [
21].
In its upper part, the Apulian Foreland is chiefly represented by a sedimentary cover lying above a Variscan crystalline basement [
20], whose closest rock-types, with similar ages and compositions, crop out in the Sila Massif [
24] (
Figure 3). From the bottom to the top, the sedimentary cover consists of Permo-Triassic continental deposits belonging to the Verrucano Fm (up to ca. 1000 m thick), Upper Triassic limestones/dolostones and anhydrites of the Burano Fm (up to ca. 2500 m in thickness) and Lower Jurassic limestones of the Calcare Massiccio Fm (up to ca. 1000 m thick); moreover, the Middle Jurassic - Upper Cretaceous inner platform carbonates, belonging to the Apulia Platform, are widely exposed in the Apulian Foreland with a thickness of ~4 km [
20,
25,
26,
27].
The Apulia Platform-basin transition and adjacent Adriatic Basin (
Figure 3) are testified by marginal and pelagic carbonates (both cropping out and drilled), respectively [
28,
29]. Similar deposits, moreover, occupied during Upper Cretaceous narrow intra-platform basins governed by extensional faults [
29,
30,
31,
32].
Figure 3.
Schematic structural map of the region around the southern Adriatic Sea (modified after [
33]); M-G = Mattinata-Gondola fault; HELLEN. = Hellenides; the solid black line encloses the Murge area and the northern Salento.
Figure 3.
Schematic structural map of the region around the southern Adriatic Sea (modified after [
33]); M-G = Mattinata-Gondola fault; HELLEN. = Hellenides; the solid black line encloses the Murge area and the northern Salento.
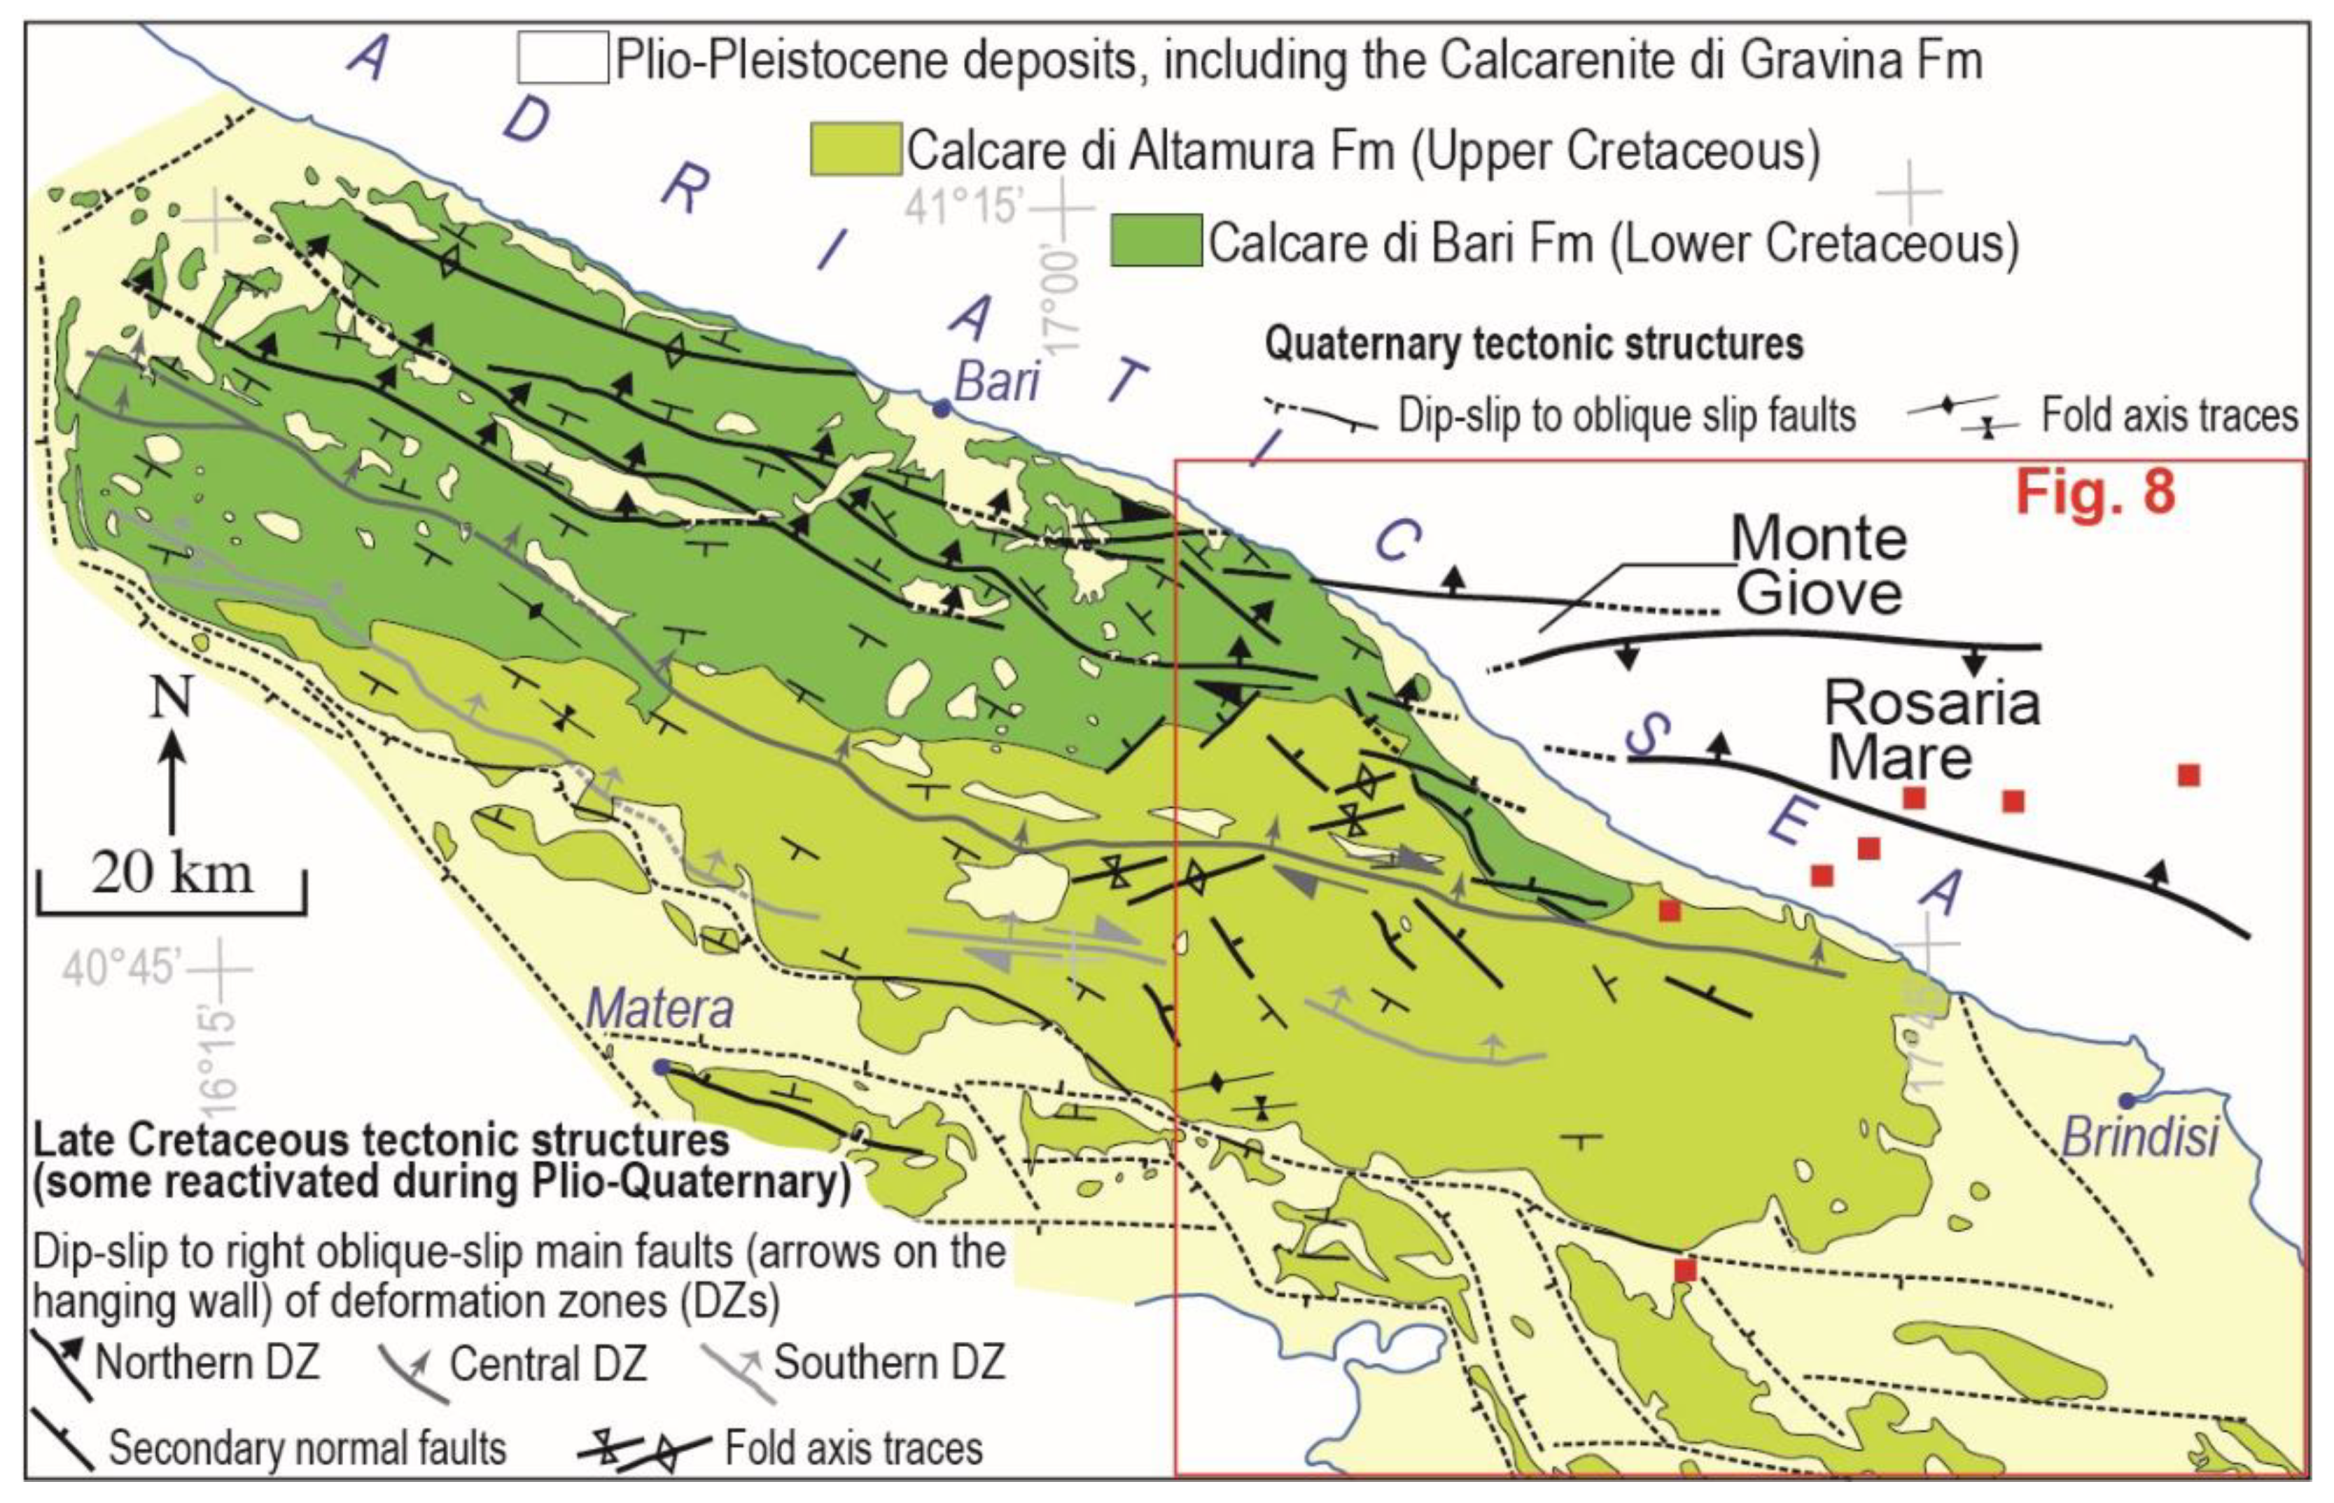
The central sector of the emerged Apulian Foreland is represented by the Murge (
Figure 4), a morpho-structural high where the exposed carbonates of the Apulia Platform have been grouped in the “Calcare di Bari” Fm (Lower Cretaceous) and the overlying “Calcare di Altamura” Fm (Upper Cretaceous) [
25] (
Figure 4). Thin Plio-Pleistocene sedimentary bodies made of calcarenites, which in turn belong to the “Calcarenite di Gravina” Fm, unconformably rest on the Cretaceous carbonates, and they crop out in some inner places and especially on the flanks and of the Murge high [
25], the latter controlled by normal faults [
34,
35,
36] (
Figure 4). Normal faults striking from NW-SE to W-E, towards the Adriatic Sea coastline, and dipping from the NE to N, respectively, characterize the Quaternary tectonics of the Murge area [
35,
36], and together with associate faults dipping in the opposite direction, gave rise to narrow grabens [
35]. According to Festa [
37], these tectonic structures composed a system of faults (deformation zones) with normal and right transtensional kinematics that were active during the deposition of the limestones of the “Calcare di Altamura” Fm (
Figure 4).
Oligocene-Quaternary deposits unconformably overlie the Mesozoic-Eocene the platform and basin carbonates in the Adriatic Sea offshore Murge [
29], and they exhibit a thickness increasing toward the inner Albanides foreland basin [
16,
17,
18,
29,
30,
38]. Dominant extensional faults affected the platform-basin transition in the south-eastern Murge [
39] and its Adriatic Sea offshore where, moreover, they were active during Neogene as well [
30]. Here, the Monte Giove, a narrow E-W-submarine relief, and its adjacent Rosaria Mare intra-platform basin [
29,
30] (
Figure 4) occurred by the activity of faults belonging active up to the Quaternary [
33]. In this respect, the southern fault bordering Monte Giove relief, at the transition with Rosaria Mare basin, exhibits evidence of present-day activity, representing the possible seismogenic source of the March 23, 2018 event [
11].
3. Analysis of the Historical and Instrumental Seismicity
The area of central and southern Apulia is historically characterised by low seismicity [
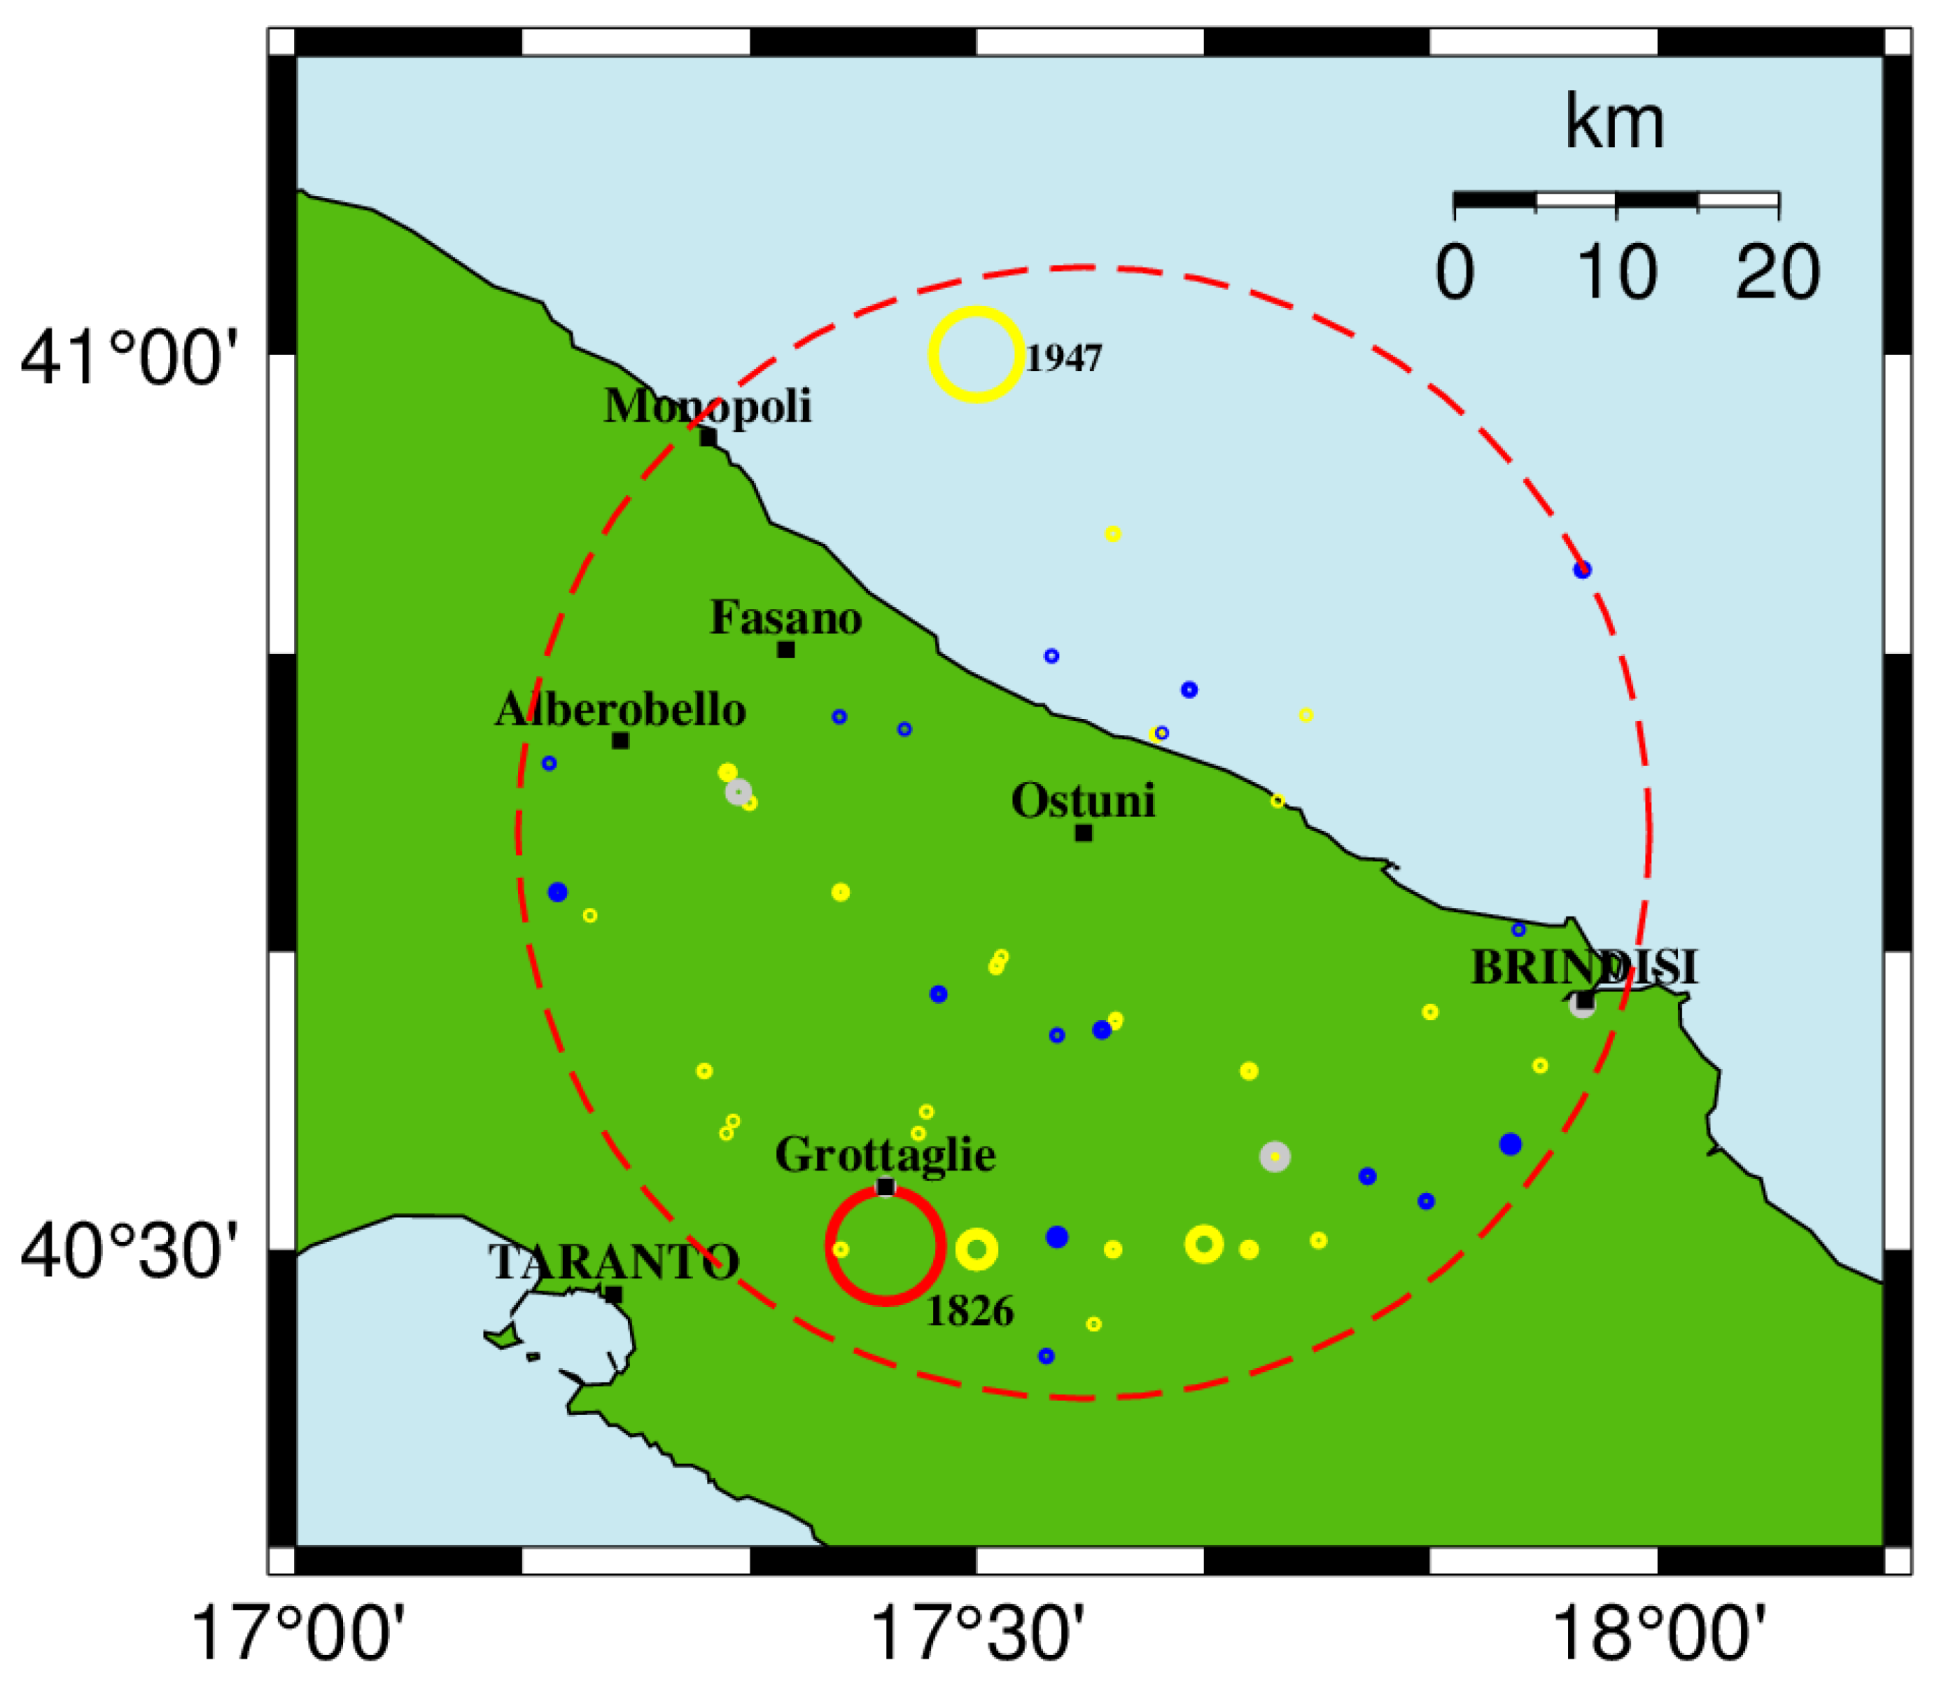
40] and is classified as a low seismic hazard area. In
Figure 5 the historical seismicity collected by different catalogs and extracted in the red dashed area is plotted on map with circles representing the focal volumes, according to Bath and Duda formula [
41].
It can be observed that only 1 large magnitude earthquake occurred, on 26/10/1826, with Mw = 5.22 and macroseismic intensity VI-VII MCS, near Grottaglie (see red circle, data from Parametric Catalogue of Italian Earthquakes, CPTI15 v. 4.0 [
42,
43]).
In the CFTI5MED [
44,
45], however, this event is not present; yet 4 other earthquakes are selected (grey circles), all based on "a single location" and therefore not considered in the previous catalog because they are relatively less reliable and of lower magnitude.
From the PFG catalog [
46], drawn up within the Geodynamic Finalized Project, 16 events are extracted (yellow circles), often with unreliable locations, of which only 4 with I ≥ VI MCS; of these one event is that extracted in CPTI15 (occurred in 1826), other two are events of M 4.1 occurred in 1833 in the same coordinates and the fourth is the earthquakes occurred on 26 February 1947, located in the offshore Adriatic, but in the CPTI15 catalog the epicentre is even "moved" to the Tyrrhenian Sea.
Considering the instrumental seismicity, the map in
Figure 5 shows with blue circles the earthquakes occurred around the town of Ostuni between 1981 and 1999 (when the network was not digital) (source CSI catalogue [
47]). Only 17 earthquakes are present in the analyzed area, with M
max = 3.2.
The seismic history of Ostuni, obtained by consulting the DBMI15 database [
48], shows that one only event has caused effects of slight damage (VII MCS), due of the strong Salento earthquake occurred on February 20, 1743; it was also seen that only other 11 earthquakes were felt in Ostuni and always with perceived effects, with a maximum of V MCS on the occasion of the disastrous Irpinia earthquake of 23 November 1980.
4. Data Selection and Hypocenter Re-Location
We extracted from the ONT web-catalog (
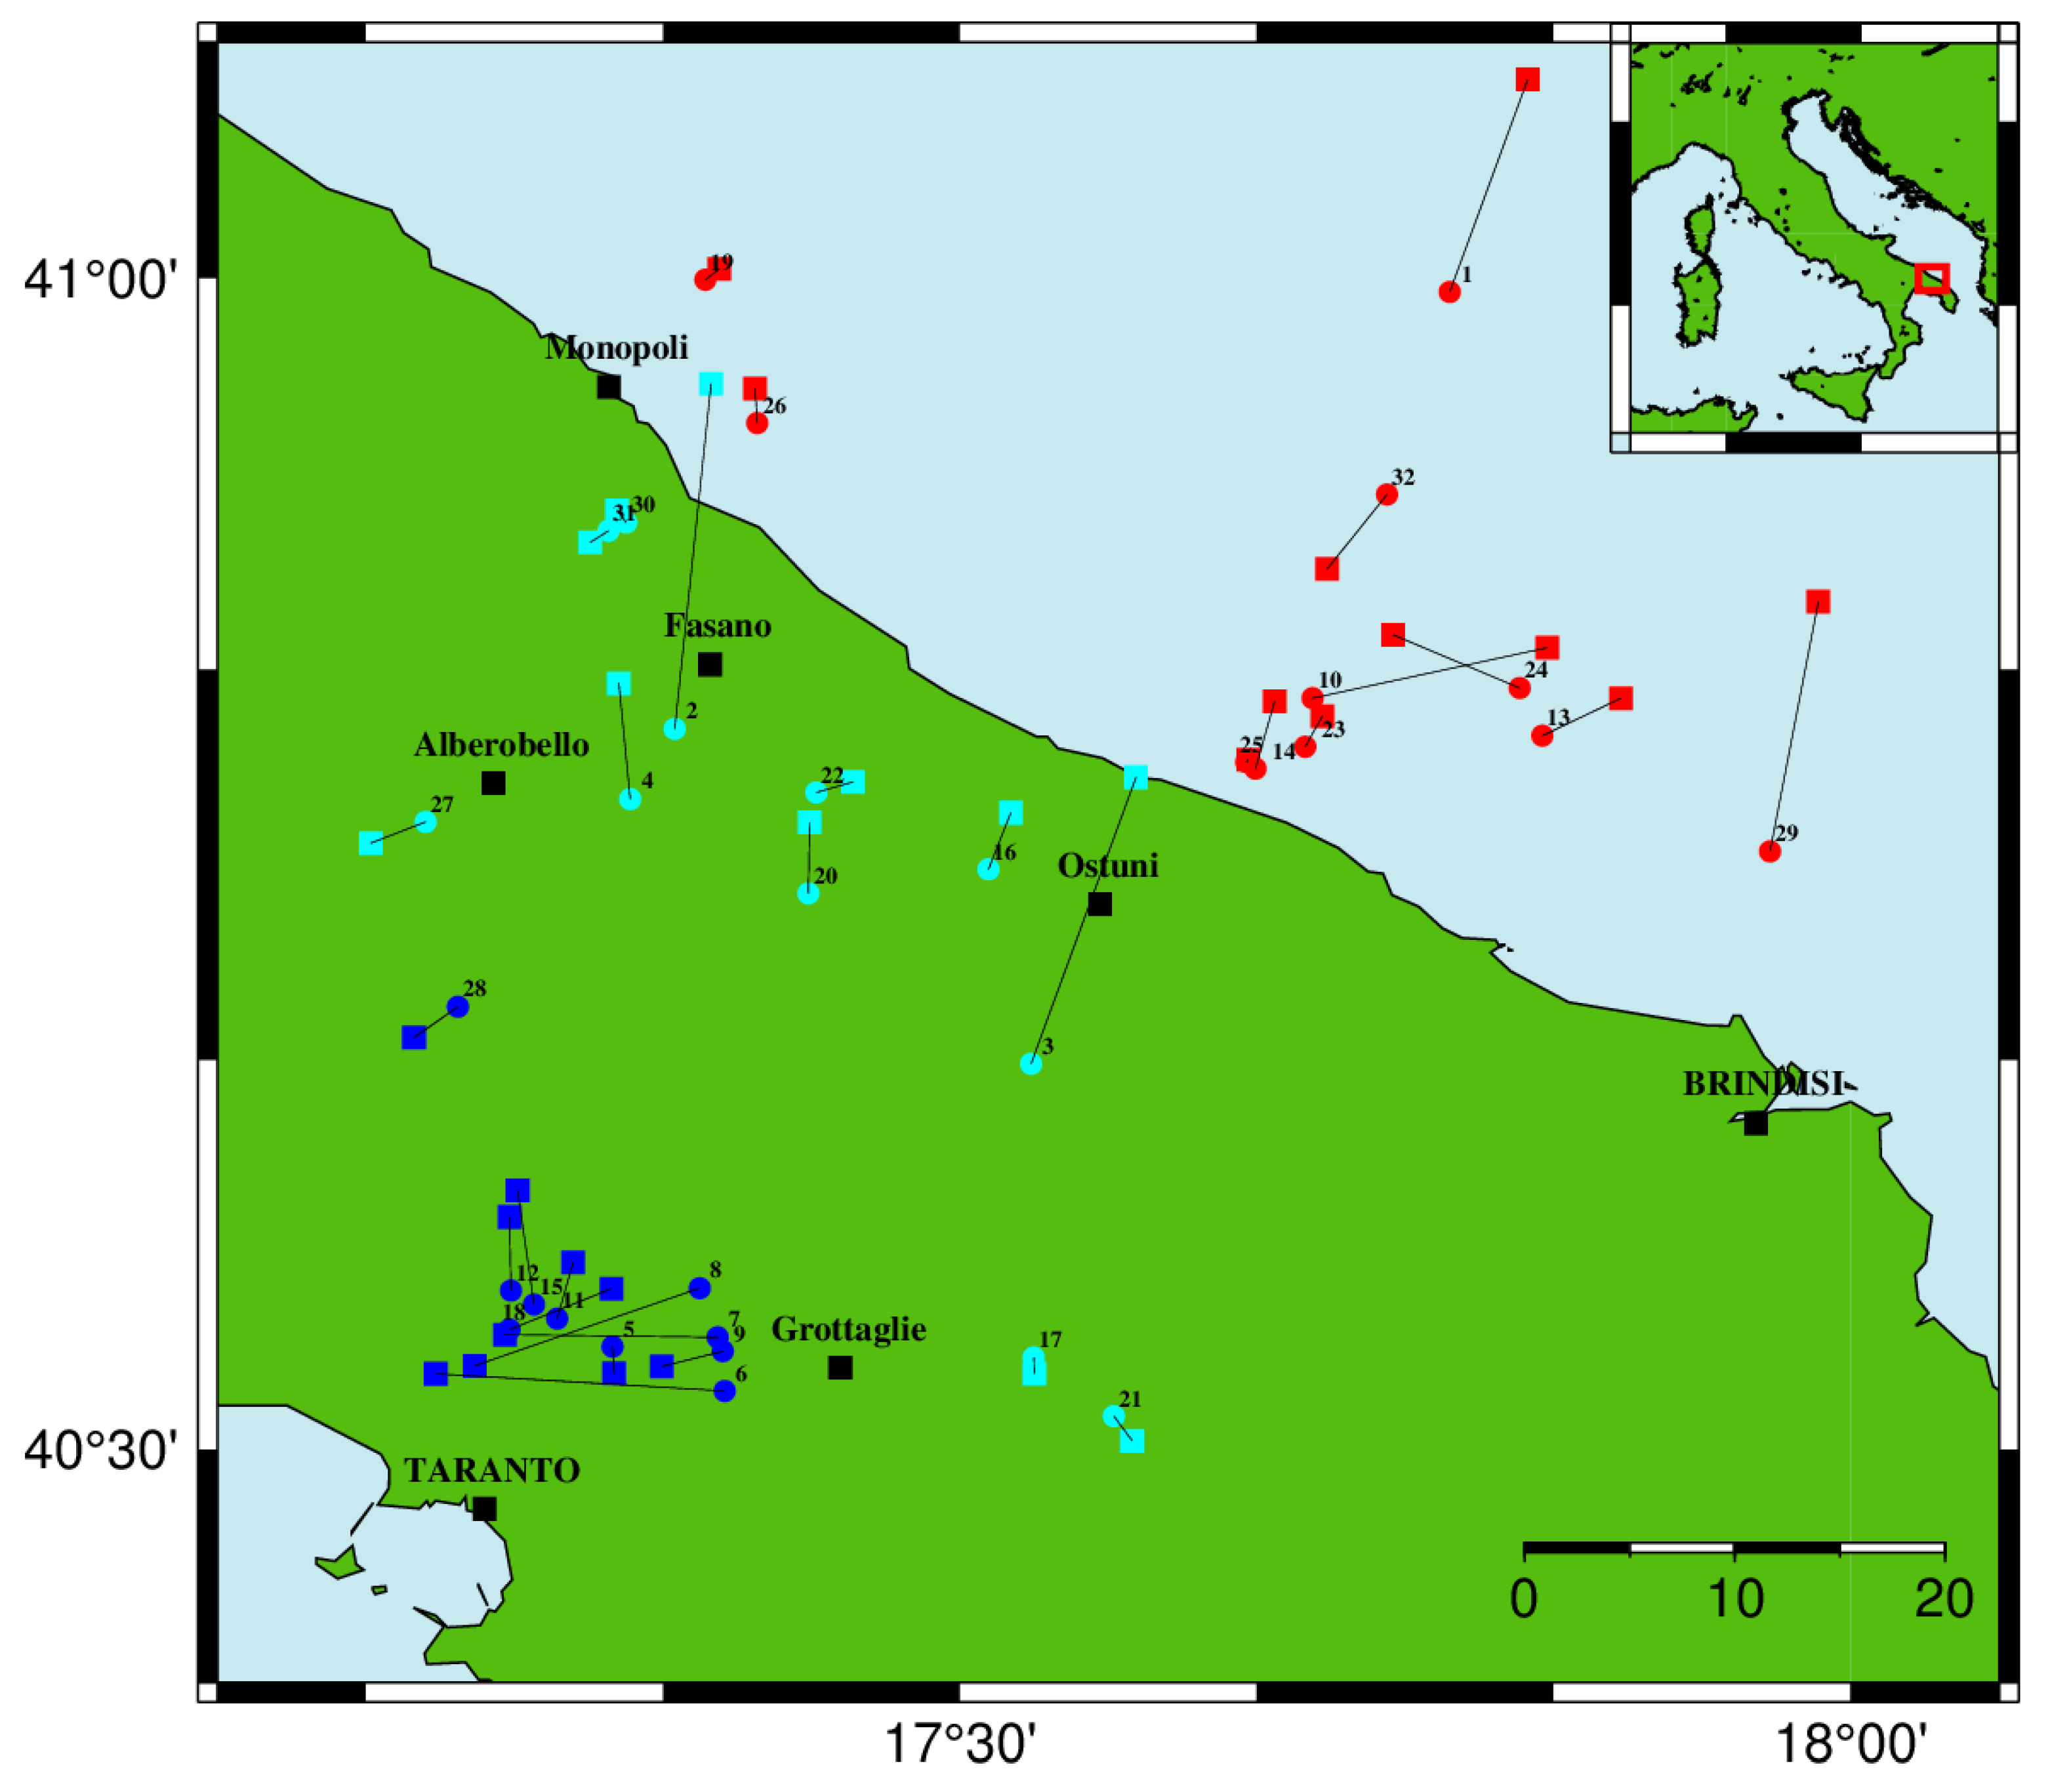
https://terremoti.ingv.it/) a dataset consisting of earthquakes that occurred within a radius of 35 km from the town of Ostuni (lat. 40.7332 N – long. 17.5786 E). The extraction covers a period from January 2000 to September 2024, which coincides with the era of the seismic network digitization in Italy. There are a total of 32 events in the ONT web-catalog, which are listed in
Table 1 and mapped in
Figure 6. The magnitude (
or
) ranges from 2.0 to 3.7 with an average value
=2.4.
Of these 32 events, the RSN recordings from 2008 onwards are available for repicking, while for those up to 2007 we used the time picks provided by INGV. When possible, the picking procedure of P and S waves was carried out manually, by visual inspection. These data were integrated with the recordings of both the OSUB and OT networks. So, the dataset was collected as follows:
from January 2000 to December 2007: time picks of P and S waves were downloaded from the INGV web-service (
https://terremoti.ingv.it/?timezone); recordings from the OSUB network are stored in the OSUB laboratory of UniBa and available upon request;
from January 2008 to March 2013: recordings were downloaded from the INGV web-service (
https://terremoti.ingv.it/?timezone); recordings of the OSUB network are stored in the OSUB laboratory of UniBa and available upon request;
from April 2013 to April 2019: recordings of the IV network were downloaded from the INGV web-service ((
https://terremoti.ingv.it/?timezone); recordings from the OT network are stored in the OTRIONS laboratory of UniBa and available upon request;
The relocation of the 32 events with the above-described new recordings and new added phase pickings was done using HYPOELLIPSE code [
49]. 7 different velocity models were tested: those commonly adopted by the INGV, CSTI, AK135, PREM, in addition to the specific models for the area proposed by Calcagnile and Panza [
50], Costa et al. [
51] and Venisti et al. [
52]; besides different values of the
ratio were tested.
The results of all these relocations indicate that the best model for this area in terms of travel-time residuals and hypocenter location errors is that of Calcagnile and Panza [
50] with
. The parameters of relocation of the 32 events are reported in
Table 2 and plotted on the map in
Figure 6. The velocity model is shown in
Table 3.
Some of the events in
Table 2 had already been localized by Pierri et al. [
53] (ID: 10, 13, 16, 17, 19) who analyzed the seismicity in the "Penisola Salentina" seismic district, an area much larger than that analyzed in this paper. Regarding the seismicity around the city of Taranto, some earthquakes (for example the one with ID 9) are probably quarry blast (according to Pierri et al. [
53]).
We observe a reduction in the hypocentral errors (generally less than 5 km) and in the minimum epicentral distance (Dmin), which is reflected in the lower value of the RMS (on average from 0.37 s to 0.26 s) with respect to the ONT catalog; instead, we do not observe a relevant improvement in the azimuthal gap since the geometry of the network has not changed. The variations in the epicentral location are almost always less than 5 km: only for events 2 and 3 the variations are greater than 15 km, but for these events no repickings were carried out.
Analyzing the relocation parameters, a clear improvement can be observed from the first 19 events that occurred up to 2012 to the other 13 that occurred since 2013: the number of phases recorded by the UniBa and INGV stations (on average equal to 6 and 18, respectively) increases from 4 to 10 and from 12 to 27, the number of stations used in total (on average equal to 15) increases from 9 to 25, the azimuthal gap (on average equal to 212°) decreases from 245° to 163°, the minimum distance (on average equal to 27 km) decreases from 29 to 24 km.
Figure 6.
Circles (with ID number) and squares indicate the INGV epicenters and re-locations, respectively, of the 32 events examined in this work. In red the events occurred offshore in the Adriatic Sea, in light blue the events occurred on land and in blue the events occurred near Taranto, some of which are likely quarry blast (according to [
53]).
5. Focal Mechanisms
Information on the orientation of the seismogenic structures can be derived from the determination of focal mechanisms. These are also necessary to calculate the stress field to which the area is subjected, since it is well inside the Adria microplate, which is highly deformed at the edges, not too far from the area under study (as discussed in
Section 1 and shown in
Figure 1).
We computed focal mechanisms by using P-wave polarities and the FPFIT code [
54]. Since the magnitude of the earthquakes selected for this study is generally low, it is not easy to correctly distinguish polarities from the signal noise in a sufficient number to determine the focal mechanisms. P-wave polarities were determined manually and picked on the raw seismograms only for the events from 2008 onwards, since seismograms for the earlier period are not available, as discussed in
Section 4.
The velocity model used for the computation of take-off angles is the same as that used for location [
50]. Fault plane solutions were considered well constrained only if derived using a minimum of 10 clearly readable polarities homogeneously distributed on the focal sphere. This quality criterion has led us to accept the focal mechanism solution for only 7 earthquakes (ID 10, 16, 17, 23, 24, 25, 29) out of the initial 32.
For each of these events we have chosen from the multiple solutions proposed by FPFIT, the one that minimized the distance of the nodal planes from the mismatching polarity data points. To better constrain the FPFIT inversion, we assigned a weight to the polarity from 0 to 2 (following the picking weighting used by the SAC software). Assigning weights to the polarity data used in the FPFIT inversion resulted in a reduction of the misfit F. The best fit solution of each event was determined by minimizing the residual between the observed and theoretical amplitudes, exploring a search grid of values of strike φ, dip δ, and rake λ spaced at 5°.
The results are shown in
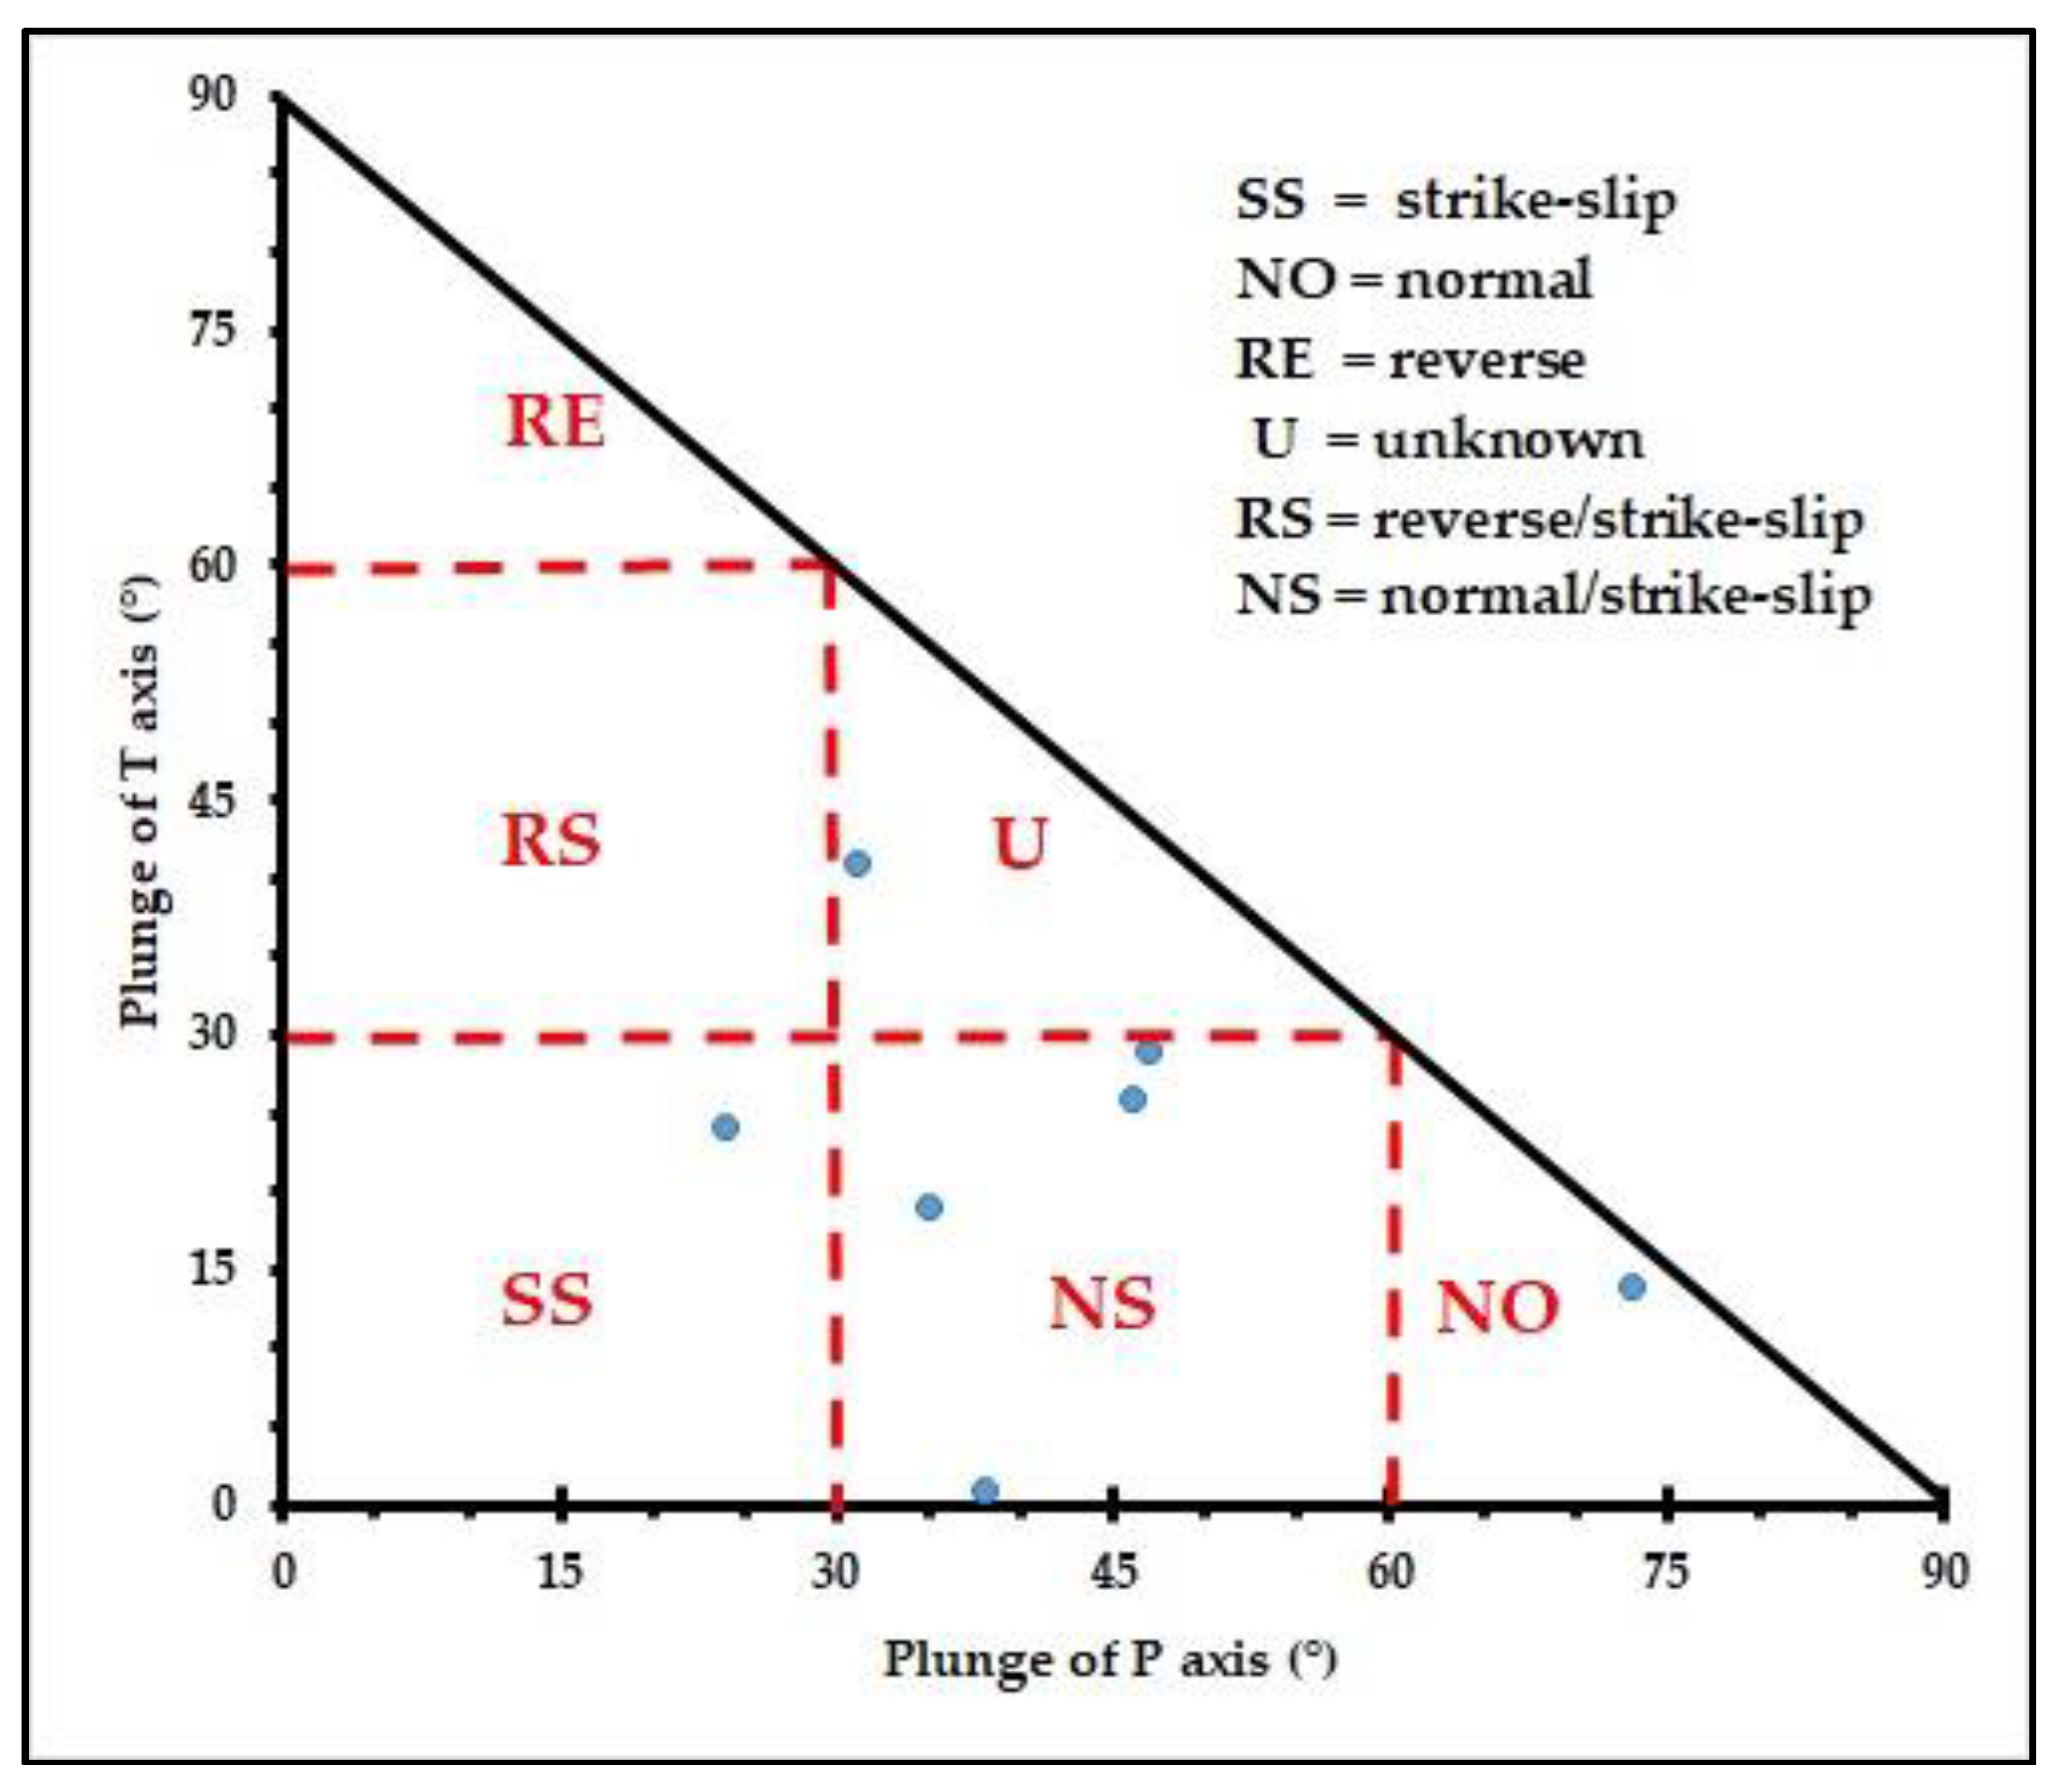
Table 4, where we labelled with the subscripts 1 and 2 the two nodal planes of the double couple solution in terms of φ, δ and λ; we also reported the P and T axes orientation as the plunge (inclination measured downward relative to the horizontal plane) and trend (azimuth measured in the direction of the plunge) angles. The P and T axes represent the directions of the maximum σ1 and the minimum σ3 principal stress axes, respectively. The fault type (FT in
Table 4), can be identified, as proposed by Frepoli et al. [
55], by plotting the combination of T and P plunges: based on the position of the point representing the fault plane solution on this graph, the fault type can be defined according to the diagram legend as shown in
Figure 7.
In
Table 4, Npol is the number of polarities matching with the focal solution compared to the total number of polarities Ntot available for each event. The quality of the solution is expressed by the quality factors Qf and Qp. Qf gives information about the solution misfit F of the polarity data and assumes values that depend on F; Qp reflects the solution uniqueness in terms of the 90% confidence region for the three angular parameter uncertainties ∆φ, ∆δ and ∆λ. Qf and Qp range from class A to class C for decreasing quality according to
Table 5.
We can observe that 4 (ID = 10, 17, 24, 29) of the selected focal mechanisms represent normal/strike-slip faults, whereas only 1 (ID = 16) is a pure strike-slip mechanism and 1 (ID=25) is a pure normal fault.
The focal mechanism of the strongest event (ID = 23) has an uncertain character, as it is of type U; the mechanism found is quite similar to that obtained by INGV using the Time Domain Moment Tensor (TDMT) technique [
56], also of type U calculated with eight stations (
https://terremoti.ingv.it/event/18504011.
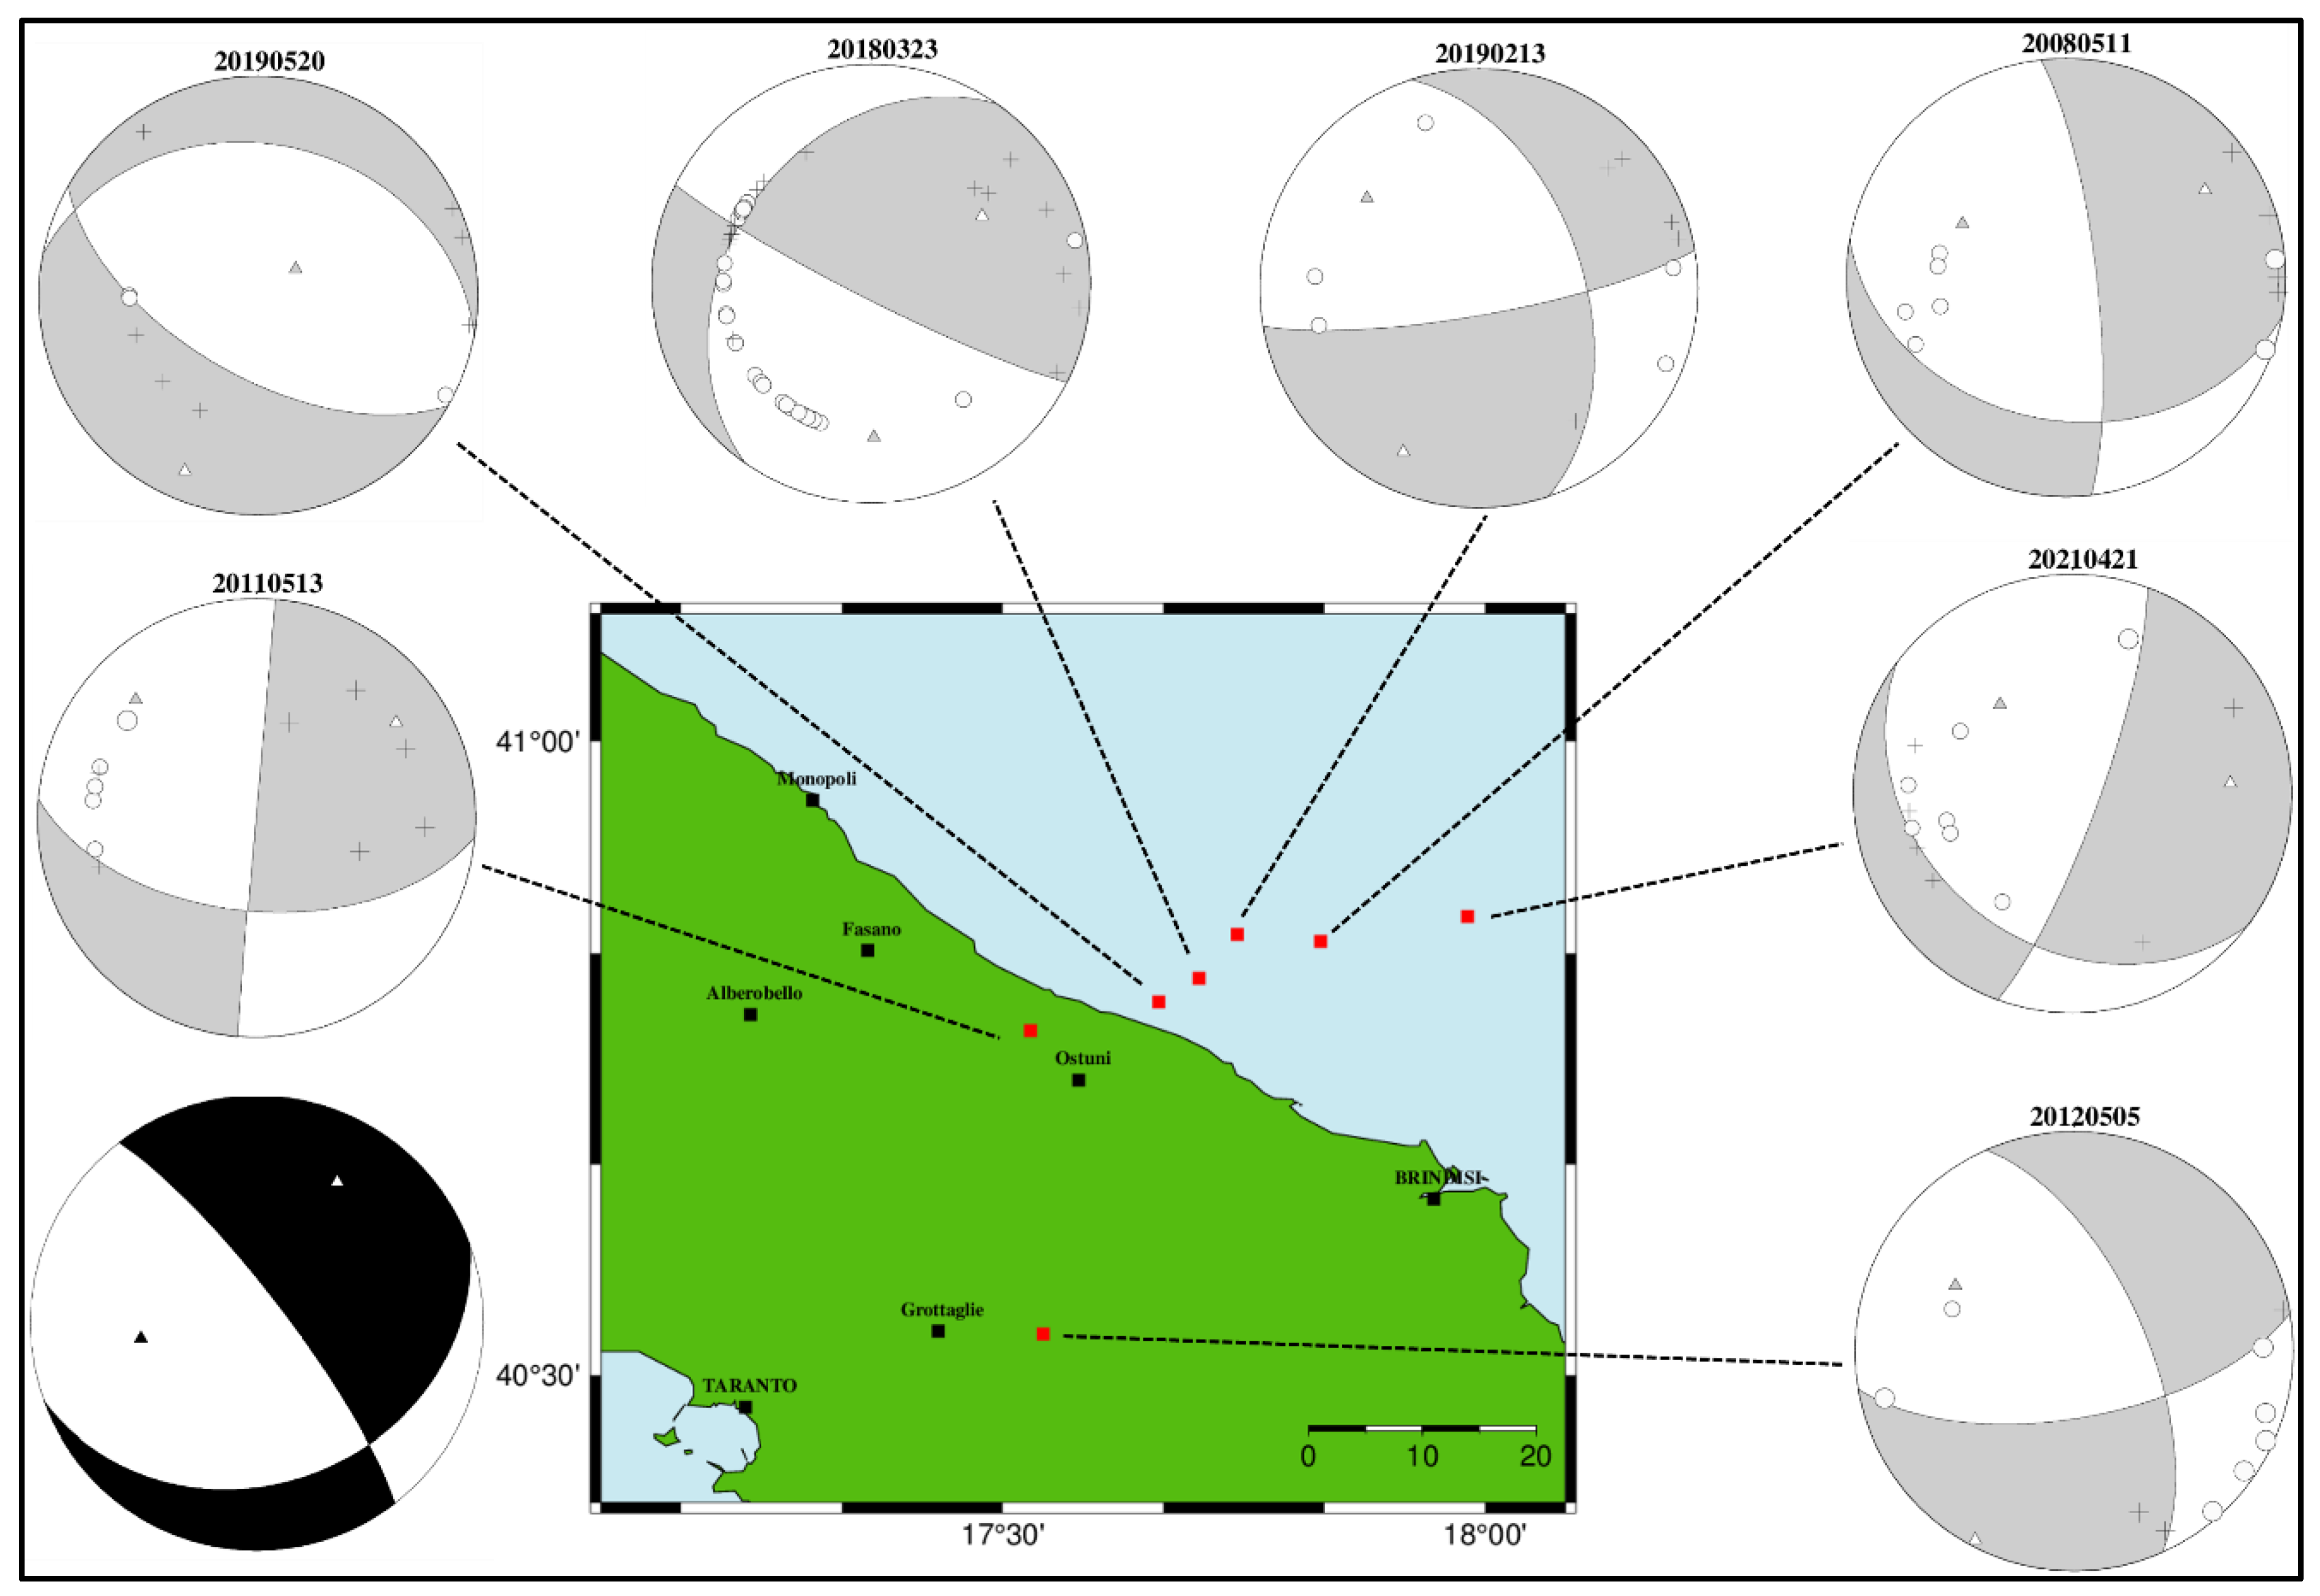
For most events (see
Figure 8), the best solution has a pressure axis P with a trend of about 300˚ and a plunge of about 40˚, whereas the tension T axis has a trend of about 60˚ (NE-SW direction) and a plunge of 20˚. These events reveal normal/strike-slip faulting mechanisms along approximately E-W striking planes and in particular the best constrained mechanism of the 5 May, 2012 earthquake (ID=17) is well representative of this kind of solution.
Figure 8.
Focal mechanisms of single events (grey/white beach balls) computed in this study and relative epicentral relocation (red square); for each beach-ball, polarities (open circles for distensive and little crosses for compressive polarities) and stress axes (grey triangle for P-axis and white triangle for T-axis) are shown. Composite focal mechanism solution is shown as black/white beach ball.
A composite fault plane solution has been also obtained by combining the 115 P-onset polarities of these 7 events; in
Figure 8 the beach-ball is shown with black and white quadrants; the composite solution, of normal/strike-slip type, shows similar trend and plunge of T and P axis.
Analysis of the T-axis orientations of normal and normal/strike-slip solutions suggests a widespread NE-SW extensional regime.
6. Stress Regime
As we discussed in the introduction, information on stress field orientation and seismogenic sources for southern Apulia is lacking in the Italian catalogs, and an effort is needed to fill this gap. A crucial parameter that provides information about regional tectonics and deformation mechanisms is the stress axis orientation, which can be retrieved using different techniques that use focal mechanisms as input data.
To obtain an estimate of the orientation of the stress tensor, we performed the inversion of stress field orientation by applying the FMSI (Focal Mechanism Stress Inversion) code developed by Gephart and Forsyth [
57,
58]. This inversion method can retrieve four of the six independent components of the stress tensor, commonly represented by the directions of the three principal stress axes (σ1, σ2, σ3) and a dimensionless parameter R = (σ2 − σ1) / (σ3 – σ1), which constrains the shape of the stress ellipsoid and ranges between 0 and 1. The angular difference between the shear stress on the fault plane, computed by the stress tensor inversion, and the observed slip direction on the same fault plane, obtained by focal mechanisms, measures the discrepancy (or misfit) between the data and the model.
The dataset consists of the trend and plunge angles of the T and P axes as obtained by FPFIT inversion. To better constrain the stress values obtained by the stress inversion, we adopted a weighting scheme given by the weight W, which is detailed below. The value of W takes into account the quality of the focal mechanism solution, described by Qf and Qp, and the event magnitude (taken as reported in
Table 1). Qf and Qp of each focal mechanism solution (
Table 4) are converted from letters to number according to
Table 6. Earthquake magnitude is included in the value of W on the hypothesis that the regional stress should be better represented by main earthquakes since small earthquakes may represent stress accommodation near the seismogenic source of the main event. We chose W so that it decreases as the quality factors of the focal mechanism inversion decrease and increases as the earthquake magnitude increase. We then assigned a weight W to each fault plane solution in
Table 4, as a function of the total quality factor Qt = Qf + Qp + M, according to
Table 7.
We followed the procedure of Lu et al. [
59], based on the simultaneous satisfaction of two different acceptance criteria to decide whether the stress inversion solution can be considered homogeneous and acceptable. The first is the solution acceptability criterion which requires that the 95% confidence intervals of σ1 and σ3 must not overlap. The second is the homogeneity criterion which accounts for the degree of heterogeneity of the investigated medium, requiring that the misfit angle must be under a certain threshold (misfit < 6°).
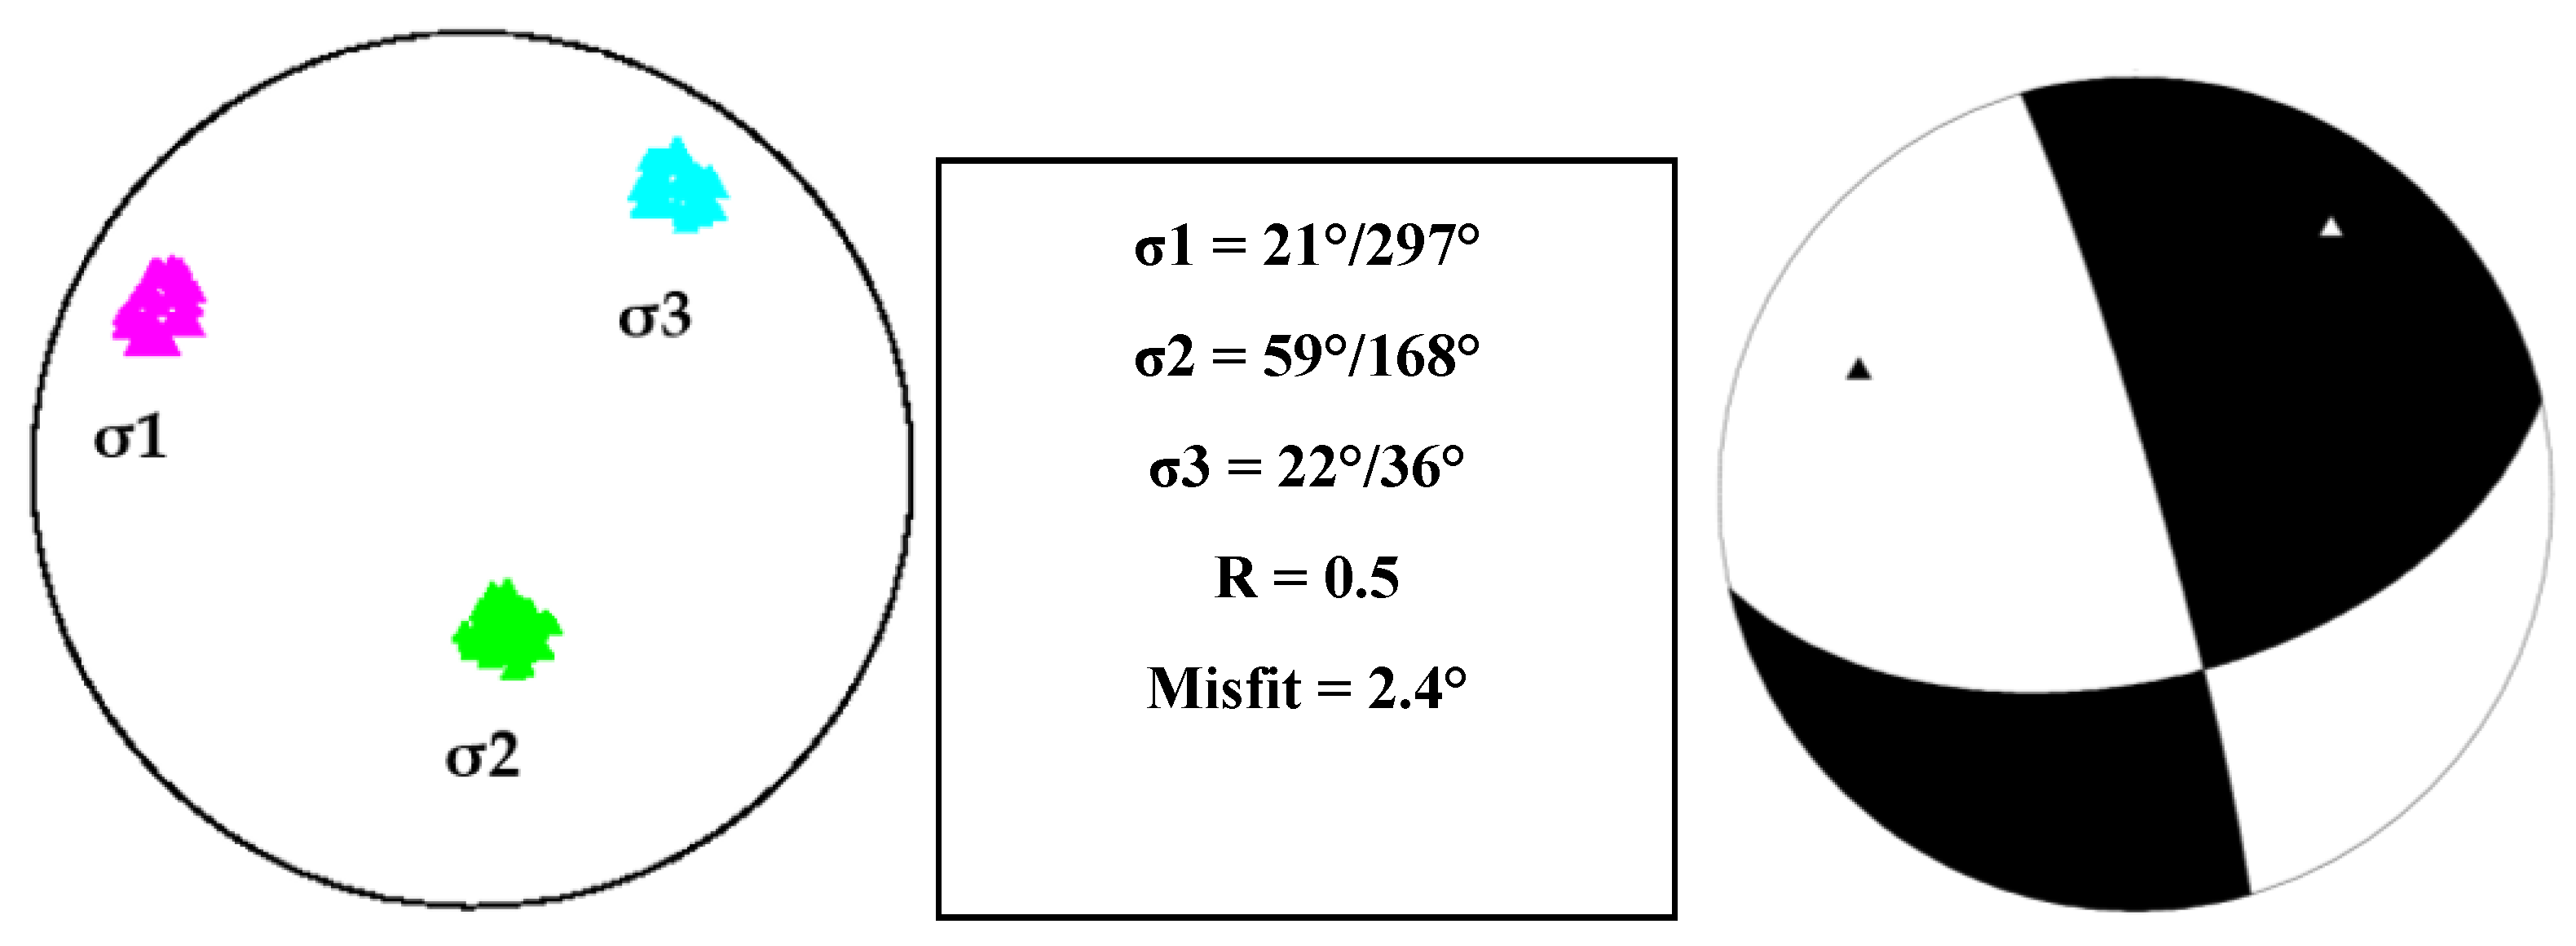
The result is shown in
Figure 9. The 95% confidence interval of the solution is very narrow and the misfit = 2.4° indicates homogeneity of the medium. The stress ratio R = 0.5 indicates that σ2 has a value exactly intermediate and the misfit = 2.4° indicates a high degree of homogeneity of the solution. Following the notation of the stress regime assignment for earthquake focal mechanism data [
60] in World Stress Map, we have that:
σ3, corresponding to the minimum horizontal stress Shmin, is sub-horizontal and oriented as the trend of T axes, 36°N;
σ1, corresponding to the maximum horizontal stress Shmax, is approximately sub-horizontal and oriented normal to Shmin;
σ2, corresponding to the vertical stress or pure lithostatic pressure, Sv, is quite vertical.
In
Figure 9 the double-couple focal mechanism corresponding to the mean stress tensor solution is also shown; between the 2 nodal planes, having strike approximately N-S and E-W, the hypothetical fault plane is most likely the one having strike = 77° (dip = 53° and rake =-175), according to Gambini and Tozzi [
61], Pieri et al. [
62] and ZS9 [
63].
This result is remarkable and reflects the general dominance of a right-lateral strike-slip regime with approximately N-S / E-W nodal planes.
7. Discussion and Conclusion
In the present paper, the seismicity of southeastern Murge was reconsidered and analyzed. Thanks to the registration of the OSUB and OTRIONS seismic networks, new registrations from stations close to the epicenters were retrieved, improving the quality of the relocations in terms of Dmin and location uncertainty. The seismic activity is sporadic, as evidenced by the very low number of significant events recorded (only 32 earthquakes with M ≥ 2.0 in 25 years).
The collected earthquakes, distributed over a horizontal distance of ~ 50 km, range in foci depth from 4.5 km to 27 km, indicate that the whole Earth crust is involved in this sporadic seismic activity.
The retrieved focal mechanisms, although only 7, are quite well constrained by P wave polarities and homogeneous, as can be observed in
Figure 8. All the focal solutions have a common nodal plane in the approximately E-W direction, as shown by the
φ1 values, which range between 80°N and 127°N (see
Table 4). This is the same direction along which earthquake epicenters tend to align (
Figure 6) neglecting the earthquakes in the neighboring of Taranto city, so, between the two nodal planes of the mechanism solution, the plane 1 should correspond to the actual fault plane. It should be noted that this E-W fault striking fits the seismogenic zonation of Italy [
63] very well.
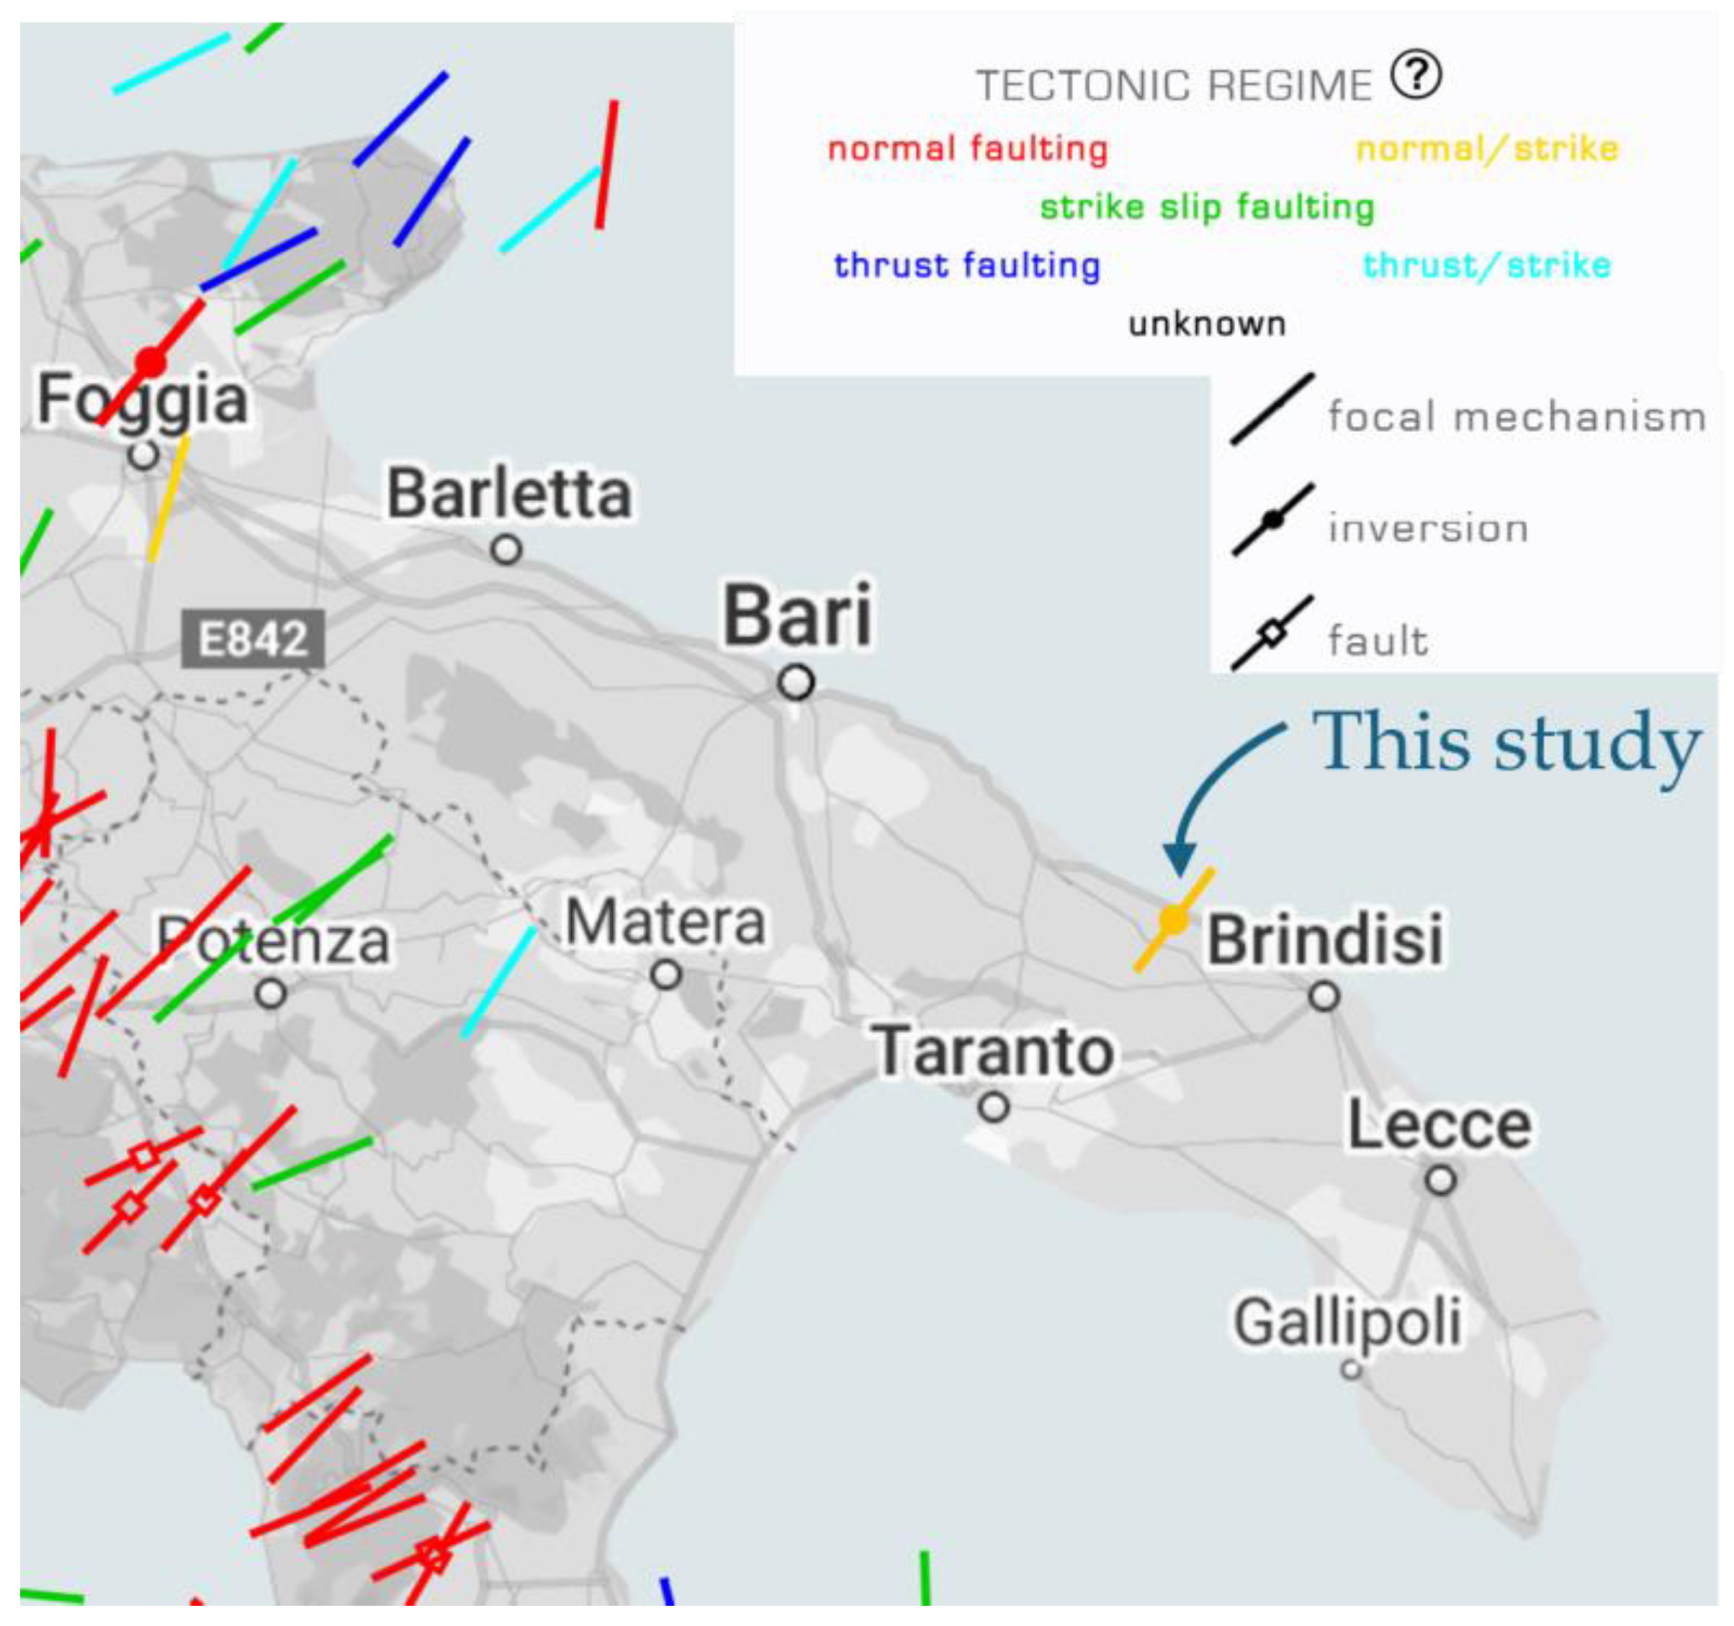
The stress regime inferred in this study indicates that seismicity, even if of low frequency and magnitude, occurs according to right-lateral transtensional kinematics of the seismogenic faults. The homogeneity of the focal plane solutions provided a high-quality stress inversion solution. The orientation of Shmin, according to the direction of the trend of the σ3 axis (36°N), agrees with the results of the Shmin in adjacent areas (as shown in
Figure 10 modified from Mariucci and Montone [
12]), indicating that this region is subject to a regional stress regime that controls the tectonics of the Adria plate.
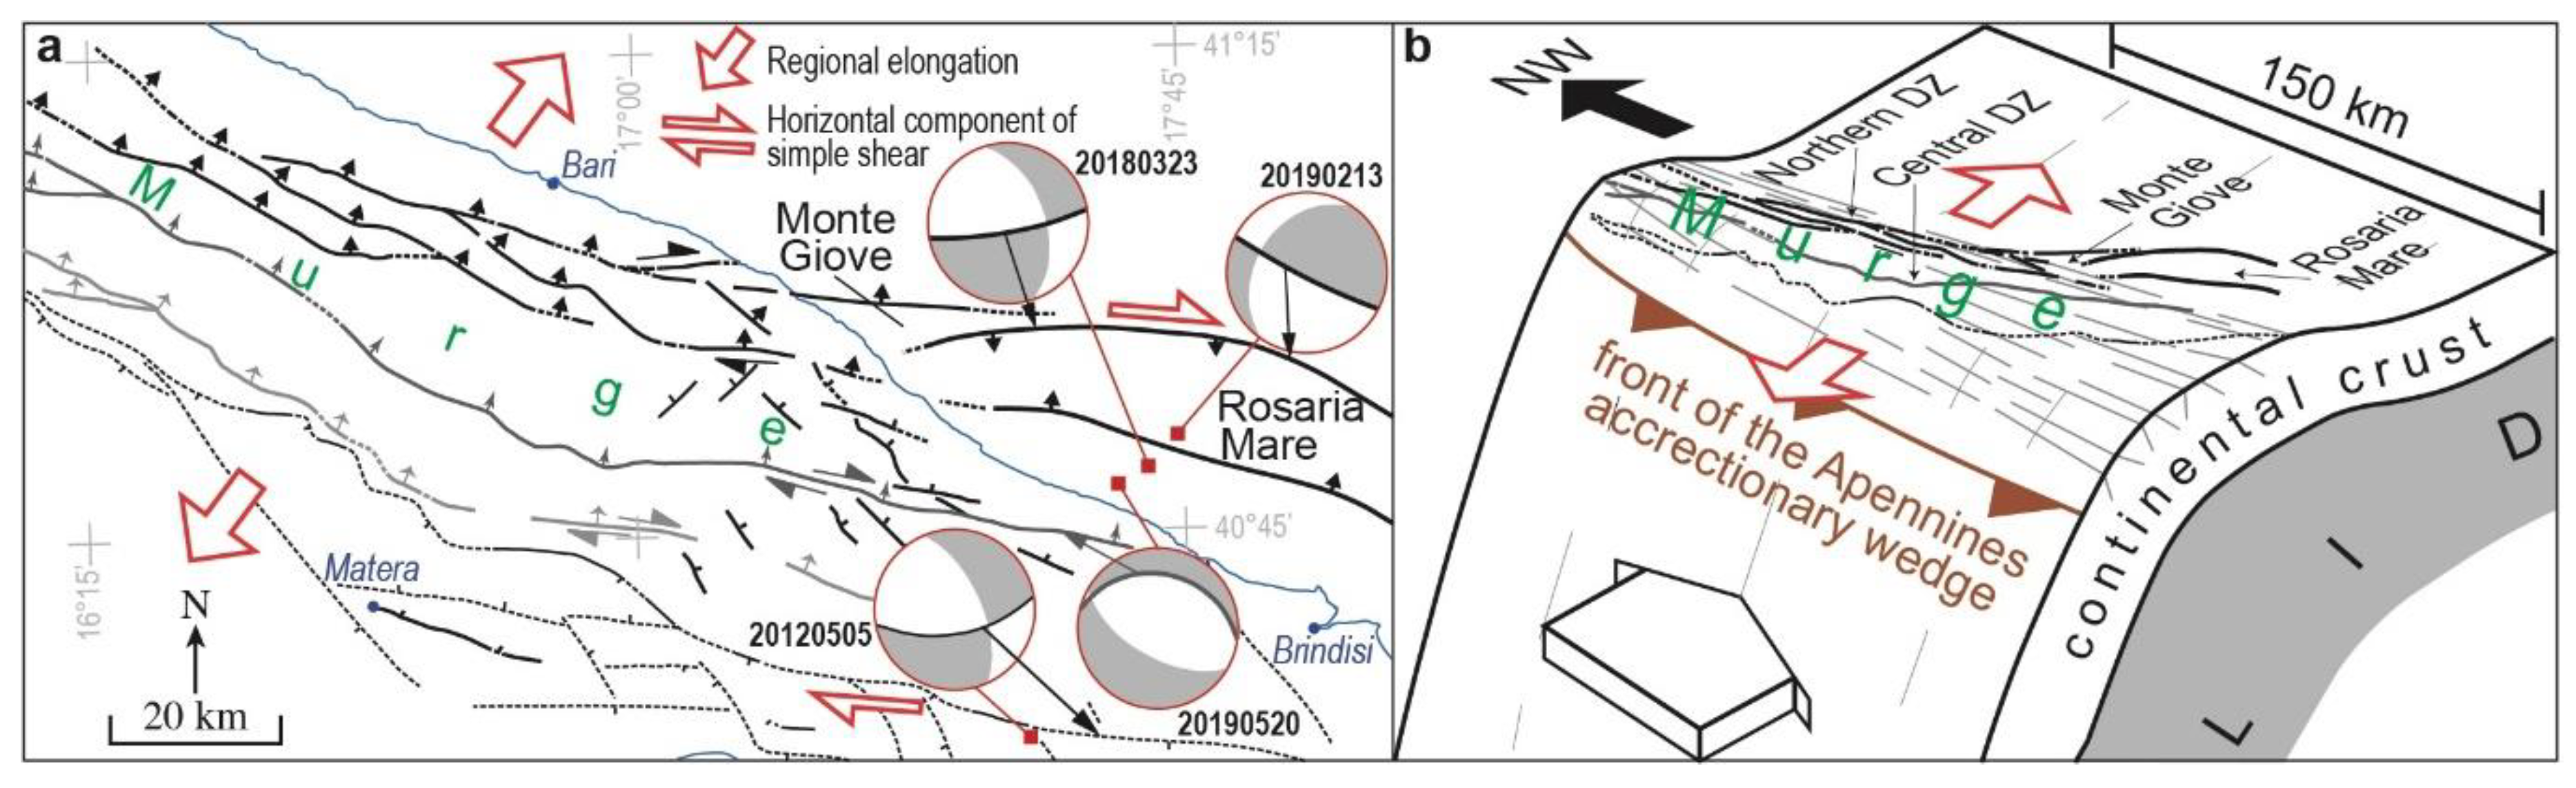
In the attempt to correlate earthquakes and their seismogenic structures we selected the most constrained seismic events (20120505, 20180323, 20190213 and 20190520) since they were recorded by a more recent and denser network of seismographs and because the quality factor Qf is A or B. In agreement with Festa et al. [
11], a good correlation exists among the seismic event 20180323 and the western branch of the fault bounding the Monte Giove structural high and the adjacent Rosaria Mare basin (
Figure 11a). Moreover, the eastern branch of this fault seems the seismogenic source for the seismic event 20190213 (
Figure 11a). A good correlation is also shown between the eastern branch of the fault belonging to the Central DZ (
Figure 4) and the seismic event 20190520. Finally, there is some correlation between the seismic event 20120505 and the fault striking from WNW (near the town of Matera) to ESE (south of the town of Brindisi), bounding the southern Murge (
Figure 11a). In the southeastern Murge area, the ca. NE-SW regional elongation occurred since Middle Pleistocene [
64]. Accordingly, such a feature of the regional strain field is coherent with the obtained stress field (
Figure 9), that would have determined, in the southeastern Murge, the reactivation of ca. E-W striking ancient faults (at least of the late Cretaceous) with a right horizontal component of simple shear (
Figure 11a).
Such a stress field is, moreover, tectonically coherent with the outer NW-SE striking lithospheric buckle fold of the Adria plate, which occurred during Apennines subduction and determined the uplift of the Apulian Foreland since the Middle Pleistocene (
Figure 11b) [
21].
It could be expected that improving the seismic monitoring by increasing the density of the seismic network could lower the minimum magnitude and increase the number of detected events with the benefit of enriching the knowledge of seismicity characteristics in this area of the Italian southern territory.
Author Contributions
Conceptualization, P.P., M.F. V.F.; methodology, P.P; validation, V.D.G., A.T.; formal analysis, P.P., M.F., N.V.; investigation, P.P, V.F.; resources, P.P, V.D.G., A.T.; data curation, P.P, M.F., N.V.; writing—original draft preparation, P.P, M.F, V.F.; writing—review and editing, X.X.; visualization, P.P., M.F., N.V.,V.F.; funding acquisition, V.F. All authors have read and agreed to the published version of the manuscript.
Funding
This study was carried out within the RETURN Extended Partnership and received funding from the European Union — NextGenerationEU (National Recovery and Resilience Plan—NRRP, Mission 4, Component 2, Investment 1.3—D.D. 1243 2/8/2022, PE0000005).
Data Availability Statement
Data of UniBa (from the seismic networks OSUB and OTRIONS) described in
Section 4, for the period preceding 2019, are available upon request.
Acknowledgments
Some figures were obtained by employing the GMT freeware package by Wessel and Smith [65] and subsequent versions by the Google Earth Pro, Google, Inc. California.
Conflicts of Interest
The authors declare no conflicts of interest.
References
- Faccenna, C.; Becker, T.W. Topographic expressions of mantle dynamics in the Mediterranean. Earth. Sci. Rev. 2020, 209, 103327. [CrossRef]
- Handy, M.R.; Ustaszewski, K.; Kissling, E. Reconstructing the Alps-Carpathians-Dinarides as a key to understanding switches in subduction polarity, slab gaps and surface motion. Int J Earth Sci (Geol Rundsch) 2015, 104, 1-26. [CrossRef]
- Serpelloni, E.; Anzidei, M.; Baldi, P.; Casula, G.; Galvani, A. Crustal velocity and strain-rate fields in Italy and surrounding regions: new results from the analysis of permanent and non-permanent GPS networks. Geophys. J. Int. 2005, 161(3), 861-880. [CrossRef]
- Le Breton, E.; Handy, M.R.; Molli, G.; Ustaszewski, K. Post-20 Ma motion of the Adriatic plate: new constraints from surrounding Orogens and implications for crust-mantle decoupling. Tectonics 2017, 36, 3135-3154. [CrossRef]
- Meletti, C.; Patacca, E.; Scandone, P. Construction of a seismotectonic model: the case of Italy. Pageoph 2000, 157, 11-35. [CrossRef]
- Ninivaggi, T.; Selvaggi, G.; Mazza, S.; Filippucci, M.; Tursi, F.; Czuba, W. Nature and origin of an undetected seismic phase in waveforms from Southern Tyrrhenian (Italy) intermediate-depth and deep earthquakes: first evidence for the phase-A in the subducted uppermost lithospheric mantle? Tectonophysics 2023, 860, 229919. [CrossRef]
- CPTI Working Group (ING; GNDT; SGA; SSN). Catalogo parametrico dei terremoti italiani. Editrice Compositori, Bologna, 2004, pp. 88. https://emidius.mi.ingv.it/CPTI/home.html.
- Del Gaudio, V.; Pierri, P.; Frepoli, A.; Calcagnile, G.; Venisti, N.; Cimini, G.B. A critical revision of the seismicity of Northern Apulia (Adriatic microplate – Southern Italy) and implications for the identification of seismogenic structures. Tectonophysics 2007, 436, 9-35. [CrossRef]
- Del Gaudio, V.; Pierri, P.; Calcagnile, G.; Venisti, N. Characteristics of the low energy seismicity of central Apulia (southern Italy) and hazard implications. J. Seismol. 2005, 9, 39-59. [CrossRef]
- Filippucci, M.; Miccolis, S.; Castagnozzi, A.; Cecere, G.; de Lorenzo, S.; Donvito, G.; Falco, L.; Michele, M.; Nicotri, S.; Romeo, A.; Selvaggi, G.; Tallarico, A. Seismicity of the Gargano promontory (Southern Italy) after 7 years of local seismic network operation: data release of waveforms from 2013 to 2018. Data in Brief 2021, 35, 106783. [CrossRef]
- Festa, V.; De Giosa, F.; Del Gaudio, V.; Moretti, M.; Pierri, P. In search of the seismogenic source of the March 23rd 2018 earthquake (Mw 3.7) near Brindisi (Puglia, Southern Italy). Geologia Croatica 2019a, 72(2), 137-144. [CrossRef]
- Mariucci M.T.; Montone P. IPSI 1.6, Database of Italian Present-day Stress Indicators. Istituto Nazionale di Geofisica e Vulcanologia (INGV). 2024. [CrossRef]
- DISS Working Group. Database of Individual Seismogenic Sources (DISS), Version 3.3.0: A compilation of potential sources for earthquakes larger than M 5.5 in Italy and surrounding areas. Istituto Nazionale di Geofisica e Vulcanologia (INGV). 2021. [CrossRef]
- ITHACA Working Group. ITHACA (ITaly HAzard from CApable faulting), a database of active capable faults of the Italian territory. Version December 2019. ISPRA Geological Survey of Italy. https://sgi2.isprambiente.it/ithacaweb/Mappatura.aspx.
- Latorre, D.; Amato, A.; Chiarabba, C. High-resolution seismic imaging of the Mw 5.7, 2002 Molise, southern Italy, earthquake area: evidence of deep fault reactivation. Tectonics 2010, 29, TC4014 https://doi.org/10.1029/2009TC002595.
- de Alteriis, G.; Aiello, G. Stratigraphy and tectonics offshore of puglia (Italy, southern Adriatic Sea). Mar. Geol., 1993, 113, 233-253. [CrossRef]
- Bertotti, G.; Picotti, V.; Chilovi, C.; Fantoni, R.; Merlini, S.; Mosconi, A. Neogene to quaternary sedimentary basins in the south adriatic (central mediterranean): foredeeps and lithospheric buckling. Tectonics 2001, 20, 771-787. [CrossRef]
- Fantoni, R.; Franciosi, R. Tectono-sedimentary setting of Po Plain and Adriatic foreland. Rend. Lincei-Sci. Fis., 2010, 21/1, 197-209. [CrossRef]
- Cicala, M.; Festa, V.; Sabato, L.; Tropeano, M.; Doglioni, C. Interference between Apennines and Hellenides foreland basins around the Apulian swell (Italy and Greece). Marine and Petroleum Geology 2021, 133, 105300. [CrossRef]
- Ricchetti, G.; Ciaranfi, N.; Luperto Sinni, E.; Mongelli, F.; Pieri, P. Geodinamica ed evoluzione sedimentaria e tettonica dell’Avampaese Apulo. Mem. Soc. Geol. It. 1988, 41, 57-82.
- Doglioni, C.; Mongelli, F.; Pieri, P. The Puglia uplift (SE Italy): an anomaly in the foreland of the Apenninic subduction due to buckling of a thick continental lithosphere. Tectonics, 1994, 13, 1309-1321. [CrossRef]
- Onofrio, V.; Tropeano, M.; Festa, V.; Moretti, M.; Sabato, L. Quaternary transpression and lacustrine sedimentation in the San Lorenzo area (Sant’Arcangelo Basin, Italy). Sedimentary Geology 2009, 222, 78-88. [CrossRef]
- Selli, R. Il Paleogene nel quadro della geologia dell’Italia meridionale. Mem. Soc. Geol. It., 1962, 3, 737-790.
- Festa, V.; Caggianelli, A.; Kruhl, J.H.; Liotta, D.; Prosser, G.; Gueguen, E.; Paglionico, A. Late-Hercynian shearing during crys tallization of granitoid magmas (Sila massif, southern Italy): regional implications. Geodinamica Acta 2006, 19, 185-195. [CrossRef]
- Ciaranfi, N.; Pieri, P.; Ricchetti, G. Note alla Carta Geologica delle Murge e del Salento (Puglia centromeridionale). Mem. Soc. Geol. It., 1988, 41, 449-460.
- Spalluto, L.; Pieri, P.; Ricchetti, G. Le facies carbonatiche di piattaforma interna del Promontorio del Gargano: implicazioni paleoambientali e correlazioni con la coeva successione delle Murge. Boll. Soc. Geol. It., 2005, 124, 675-690.
- Festa, V.; Fregola, R.A.; Acquafredda, P.; De Giosa, F.; Monno, A.; Ventruti, G. The enigmatic ascent of Ca-sulphate rocks from a deep dense source layer: evidences of hydration diapirism in the Lesina Marina area (Apulia, southern Italy). International Journal of Earth Sciences 2019b, 108, 1897-1912. [CrossRef]
- Borgomano, J.R.F. The Upper Cretaceous carbonates of the Gargano-Murge region, southern Italy: a model of platform-to-basin transition. AAPG Bulletin, 2000, 84, 1561-1588. [CrossRef]
- Nicolai, C.; Gambini, R. Structural architecture of the Adria Platform-and-Basin System. Boll. Soc. Geol. It. 2007, Special Issue, 7, 21-37.
- de’ Dominicis, A.; Mazzoldi, G. Interpretazione geologico-strutturale del margine orientale della Piattaforma Apula. Mem. Soc. Geol. It., 1987, 38, 163-176.
- Mastrogiacomo, G.; Moretti, M.; Owen, G.; Spalluto, L. Tectonic triggering of slump sheets in the Upper Cretaceous carbonate succession of the Porto Selvaggio area (Salento peninsula, southern Italy): synsedimentary tectonics in the Apulian Carbonate Platform. Sediment. Geol., 2012, 269-270, 15-27. [CrossRef]
- Festa, V.; Sabato, L.; Tropeano, M. 1:5,000 geological map of the upper Cretaceous intraplatform-basin succession in the “Gravina di Matera” canyon (Apulia Carbonate Platform, Basilicata, southern Italy). Italian Journal of Geosciences, 2018, 137, 3-15. [CrossRef]
- Cicala, M.; De Giosa, F.; Festa, V.; Lisco S.; Moretti, M. The northern fault of the onshore-offshore Monte Giove relief in the southern Adriatic Sea, Italy: implications for tectonic reactivation in the Apulian Foreland. Geological Quarterly 2023, 67, 11. [CrossRef]
- Martinis, B. Sulla tettonica delle Murge Nord-Occidentali. Acc. Naz. Lincei, Rend. Sc. Fis. Mat. Nat., 1961, s. VIII, 31(5), 299-305.
- Iannone, A.; Pieri, P. Caratteri neotettonici delle Murge. Geologia Applicata e Idrogeologia 1982, 17, 147-159.
- Tropeano, M.; Pieri, P.; Moretti, M.; Festa, V.; Calcagnile, G.; Del Gaudio, V.; Pierri, P. Quaternary tectonics and seismotectonic features of the Murge area (Apulian foreland, SE Italy). Il Quaternario 1997, 10/2, 543-548.
- Festa, V. Cretaceous structural features of the Murge area (Apulian Foreland, Southern Italy). Eclogae Geol. Helv., 2003, 96, 11-22. [CrossRef]
- de Alteriis, G. Different foreland basins in Italy: examples from the central and southern Adriatic Sea. Tectonoph. 1995, 252, 349-373. [CrossRef]
- Pieri, P.; Laviano, A. Tettonica e sedimentazione nei depositi senoniani delle Murge sud-orientali (Ostuni). Boll. Soc. Geol. Ital., 1989, 108, 351-356.
- Del Gaudio, V.; Festa, V; Ripa, R.R.; Iurilli, V.; Pierri, P.; Calcagnile, G.; Moretti, M.; Pieri, P.; Tropeano, M. Evidence of Apulian crustal structures related to low energy seismicity (Murge - Southern Italy). Ann. Geophys. 2001, 44(5/6), 1049-1066. [CrossRef]
- Bath, M.; Duda, S.J. Earthquake volume, fault plane area, seismic energy, strain, deformation and related quantities. Ann. Geofis. 1964, 17(3), 353-368. [CrossRef]
- Rovida, A.; Locati, M.; Camassi, R.; Lolli, B.; Gasperini, P. The Italian earthquake catalogue CPTI15. Bull. Earthq. Eng. 2020, 18(7), 2953-2984. [CrossRef]
- Rovida, A.; Locati, M.; Camassi, R.; Lolli, B.; Gasperini, P.; Antonucci, A. Catalogo Parametrico dei Terremoti Italiani (CPTI15), versione 4.0 [Data set]. 2022. Istituto Nazionale di Geofisica e Vulcanologia (INGV). [CrossRef]
- Guidoboni, E.; Ferrari, G.; Mariotti, D.; Comastri, A.; Tarabusi, G.; Sgattoni, G.; Valensise, G. CFTI5Med, Catalogo dei Forti Terremoti in Italia (461 a.C.-1997) e nell’area Mediterranea (760 a.C.-1500). 2018. Istituto Nazionale di Geofisica e Vulcanologia (INGV). [CrossRef]
- Guidoboni, E.; Ferrari, G.; Tarabusi, G.; Sgattoni, G.; Comastri, A.; Mariotti, D.; Ciuccarelli, C.; Bianchi, M.G.; Valensise, G. CFTI5Med, the new release of the catalogue of strong earthquakes in Italy and in the Mediterranean area. Scientific Data 2019, 6, Article number: 80. [CrossRef]
- Postpischl, D. Catalogo dei Terremoti Italiani dall’anno 1000 al 1980. C.N.R. - Progetto Finalizzato Geodinamica - Quaderni della Ricerca Scientifica 1985, 114 2B, Bologna, 239 p.
- Castello, B., Di Stefano, R. Catalogo della Sismicità Italiana (CSI): fasi (Version 2) [Data set]. Istituto Nazionale di Geofisica e Vulcanologia (INGV) 2022. [CrossRef]
- Locati, M.; Camassi, R.; Rovida, A.; Ercolani, E.; Bernardini, F.; Castelli, V.; Caracciolo, C.H.; Tertulliani, A.; Rossi, A.; Azzaro, R.; D’Amico, S.; Antonucci, A. Database Macrosismico Italiano (DBMI15), versione 4.0 [Data set]. Istituto Nazionale di Geofisica e Vulcanologia (INGV). 2022. [CrossRef]
- Lahr, J.C. HYPOELLIPSE/Version 2.0: a computer program for determining local earthquakes hypocentral parameters, magnitude, and first-motion pattern. US Geol. Surv. 1989, Open-File Rep. n. 89-116, 95 pp. [CrossRef]
- Calcagnile, G; Panza, G.F. The main characteristics of the lithosphere-asthenosphere system in Italy and surroundings regions. Pageoph 1980, 119(4), 865-879. [CrossRef]
- Costa, G.; Panza, G.F.; Suhadolc, P.; Vaccari, F. Zoning of the Italian territory in terms of expected peak ground acceleration derived from complete synthetic seismograms. J. Appl. Geophys. 1993, 30, 149-160. [CrossRef]
- Venisti, N.; Calcagnile, G.; Panza, G.F.; Pontevivo, A. Surface-wave and body-wave-tomography combined study of the Apulian Plate. Pure Appl. Geophys. 2005, 162, 1-19.
- Pierri, P.; de Lorenzo, S.; Calcagnile, G. Analysis of the low-energy seismic activity in the Southern Apulia (Italy). Open J. Earthq. Res. 2013, 2(4), 91-105. [CrossRef]
- Reasenberg, P.; Oppenheimer, D. FPFIT, FPPLOT and FPPAGE: FORTRAN computer programs for calculating and displaying earthquake fault plane solutions. U.S. Geol. Surv. 1985, Open File Rep. n. 85-739, 109 pp. [CrossRef]
- Frepoli, A.; Cimini, G.B.; De Gori, P.; De Luca, G.; Marchetti, A.; Monna, S.; Montuori, C.; Pagliuca, N.M. Seismic sequences and swarms in the Latium-Abruzzo-Molise Apennines (central Italy): new observations and analysis from a dense monitoring of the recent activity. Tectonoph. 2017, 712-713, 312-329. [CrossRef]
- Scognamiglio, L.; Tinti, E.; Michelini, A. Real-time determination of seismic moment tensor for Italian region. Bull. Seism. Soc. Am. 2009, 99(4), 2223-2242. [CrossRef]
- Gephart, J.W. FMSI: a Fortran program for inverting fault/slickenside and earthquake focal mechanism data to obtain the regional stress tensor. Comput. Geosci. 1990, 16, 953-989. [CrossRef]
- Gephart, J.W.; Forsyth, D.W. An improved method for determining the regional stress tensor using earthquake focal mechanism data: application to the San Fernando earthquake sequence. J. Geophys. Res. 1984, 89 (B11), 9305-9320. [CrossRef]
- Lu, Z.; Wyss, M.; Pulpan, H. Details of stress directions in the Alaska subduction zone from fault plane solutions. J. Geophys. Res. 1997, 102(B3), 5385-5402. [CrossRef]
- Heidbach, O.; Rajabi, M.; Reiter, K.; Ziegler, M. World Stress Map 2016 [Dataset]. GFZ Data Services. 2016. [CrossRef]
- Gambini, R.; Tozzi, M. Tertiary geodynamic evolution of Southern Adria Microplate. Terra Nova, 1996, 8(6), 593-602. [CrossRef]
- Pieri, P.; Festa, V.; Moretti, M.; Tropeano, M. Quarternary tectonic activity of the Murge area (Apulian Foreland-Southern Italy). Ann. Geophys. 1997, 40(5), 1395-1404. [CrossRef]
- Meletti, C.; Valensise, G. Zonazione sismogenetica ZS9 - App. 2 al Rapporto Conclusivo. Gruppo di Lavoro per la Redazione della mappa di pericolosità sismica prevista dall’Ordinanza PCM 3274 del 20 marzo 2003 - Istituto Nazionale di Geofisica e Vulcanologia, 2004, 38 pp.
- Di Bucci, D.; Caputo, R.; Mastronuzzi, G.; Fracassi U.; Selleri, G.; Sansò, P. Quantitative analysis of extensional joints in the southern Adriatic foreland (Italy), and the active tectonics of the Apulia region. J. Geodyn., 2011, 51, 141-155. [CrossRef]
- Wessel, P.; Smith, W.H.F. New, Improved Version of Generic Mapping Tools Released. Eos, Transactions American Geophysical Union 1998, 79(47), 579 pp. [CrossRef]
|
Disclaimer/Publisher’s Note: The statements, opinions and data contained in all publications are solely those of the individual author(s) and contributor(s) and not of MDPI and/or the editor(s). MDPI and/or the editor(s) disclaim responsibility for any injury to people or property resulting from any ideas, methods, instructions or products referred to in the content. |
© 2024 by the authors. Licensee MDPI, Basel, Switzerland. This article is an open access article distributed under the terms and conditions of the Creative Commons Attribution (CC BY) license (http://creativecommons.org/licenses/by/4.0/).