Submitted:
28 January 2026
Posted:
29 January 2026
You are already at the latest version
Abstract
Melanoma is one of the deadliest cancers and remains a major clinical challenge, especially in advanced stages where conventional therapies often show limited effectiveness. For example, one of the issues that melanoma patients face in clinics is acquired resistance to BRAF inhibitor therapy. We have previously reported that targeting spliceosomal proteins with small molecules results in apoptosis in melanomas. In the present study, the antimelanoma efficacy of our lead compounds 2155-14 and 2155-18 was evaluated by testing them in BRAF inhibitor-resistant A375R cell-line xenograft in nude athymic mice. Both compounds significantly decreased the growth of A375R tumors, which was comparable to vemurafenib/cobimetinib. Additionally, by using an immunocompetent B16 mouse melanoma model, we detected increased numbers of several immune cell types in tumors, suggesting that the two compounds also increase antimelanoma immune response. In conclusion, these results demonstrate the therapeutic potential of targeting spliceosomal proteins hnRNPH1 and H2 as monotherapy or in combination with immunotherapy.
Keywords:
melanoma
; drug discovery
; spliceosomal inhibition
; BRAFi resistance
; cell line xenograft
; immunotherapy
1. Introduction
Melanoma is the deadliest form of skin cancer, responsible for more than 7,000 deaths a year in the US alone [1]. Before the approval of immunotherapy, the 5-year survival rate of melanoma patients with metastatic disease was below 20% [2]. Anti-PD-1 immunotherapy agent pembrolizumab has 5-year survival rate for patients with advanced melanoma is 22% [3]. Combination immunotherapy (nivolumab with ipilimumab) alone or in combination with small molecule BRAF and MEK inhibitors improved overall 5-year survival to 50% with approximately 40% of patients responding to the therapy [4,5]. However, there are adverse effects to immunotherapy in ~25% of melanoma patients [6,7,8]. Additionally, a portion of the patients who initially respond to the therapy eventually acquire resistance [9]. Based on these considerations, novel approaches to melanoma therapy are urgently needed.
We previously reported the discovery of spliceosome-binding small molecules active against melanoma in vitro [10,11], non-toxic to mice [12], and efficacious in a BRAF-mutant cell-derived xenograft (CDX) melanoma mouse model [13]. These molecules, named 2155-14 and 2155-18, were discovered via a mixture-based phenotypic high-throughput screen (HTS) using multiple cancer and non-cancer cell lines [11]. Both compounds demonstrated low micromolar EC50 values for inhibition of viability in multiple melanoma cell lines while sparing viability of several cell lines representative of other cancer types and non-cancer cell lines. We demonstrated that the mechanism of action of these molecules involves binding to hnRNP H1 and H2 which are RNA-binding proteins (RBPs) with a role in pre-mRNA splicing [14]. RBPs have attracted attention as targets for cancer drug discovery due to their overexpression in many cancers [15]. There have been multiple reports of RBP inhibitors (RBPIs) targeting various RBPs. For example, several small molecules targeting eIF4A have been reported by others [15]. Most pertinent to the present study, DMDA-Pat A, a structural analogue of the marine natural product pateamine A, demonstrated in vivo activity against MDA-MB-435 cell-derived melanoma xenograft (CDX) at 0.9 mg/kg bw in mice [16]. Small molecule 4EGI-1, an inhibitor of RBP eIF4E/G with Ki of 25 µM, inhibited growth of CRL-2813 melanoma mouse CDX at 25 and 75 mg/kg q.d. [17]. Remarkably, neither inhibitor exhibited overt toxicity at the tested doses.
Both eIF4A and eIF4E/G are involved in mRNA translation; however, there are examples of small molecules targeting other RNA-related processes. Small molecules E7107, Spliceostatin A, and H3B-8800 target mRNA splicing by modulating Splicing Factor 3B1 (SF3B1). E7107 demonstrated efficacy in a pre-clinical model of NSCLC at 20 mg/kg; however, it exhibited dose-dependent toxicity in two Phase I clinical trials [18,19] (MTD = 4mg/m2) which led to the discontinuation of this trial. H3B-8800 treatment was associated with mostly low-grade adverse effects after 1-40 mg once-daily dose [20] in Phase I dose escalation trial in patients with myelodysplastic syndromes (MDS), chronic myelomonocytic leukemia (CMML), and secondary acute myeloid leukemia (AML) arising from MDS.
In the present study, we demonstrate the anti-melanoma efficacy of two small molecules that bind and downregulate spliceosomal proteins hnRNP H1 and H2 in a cell-derived xenograft mouse model of BRAF inhibitor-resistant (BRAF/NRAS double mutant) melanoma. Additionally, we report the effects of spliceosomal modulation on the increased infiltration of immune cell types into melanomas.
2. Materials and Methods
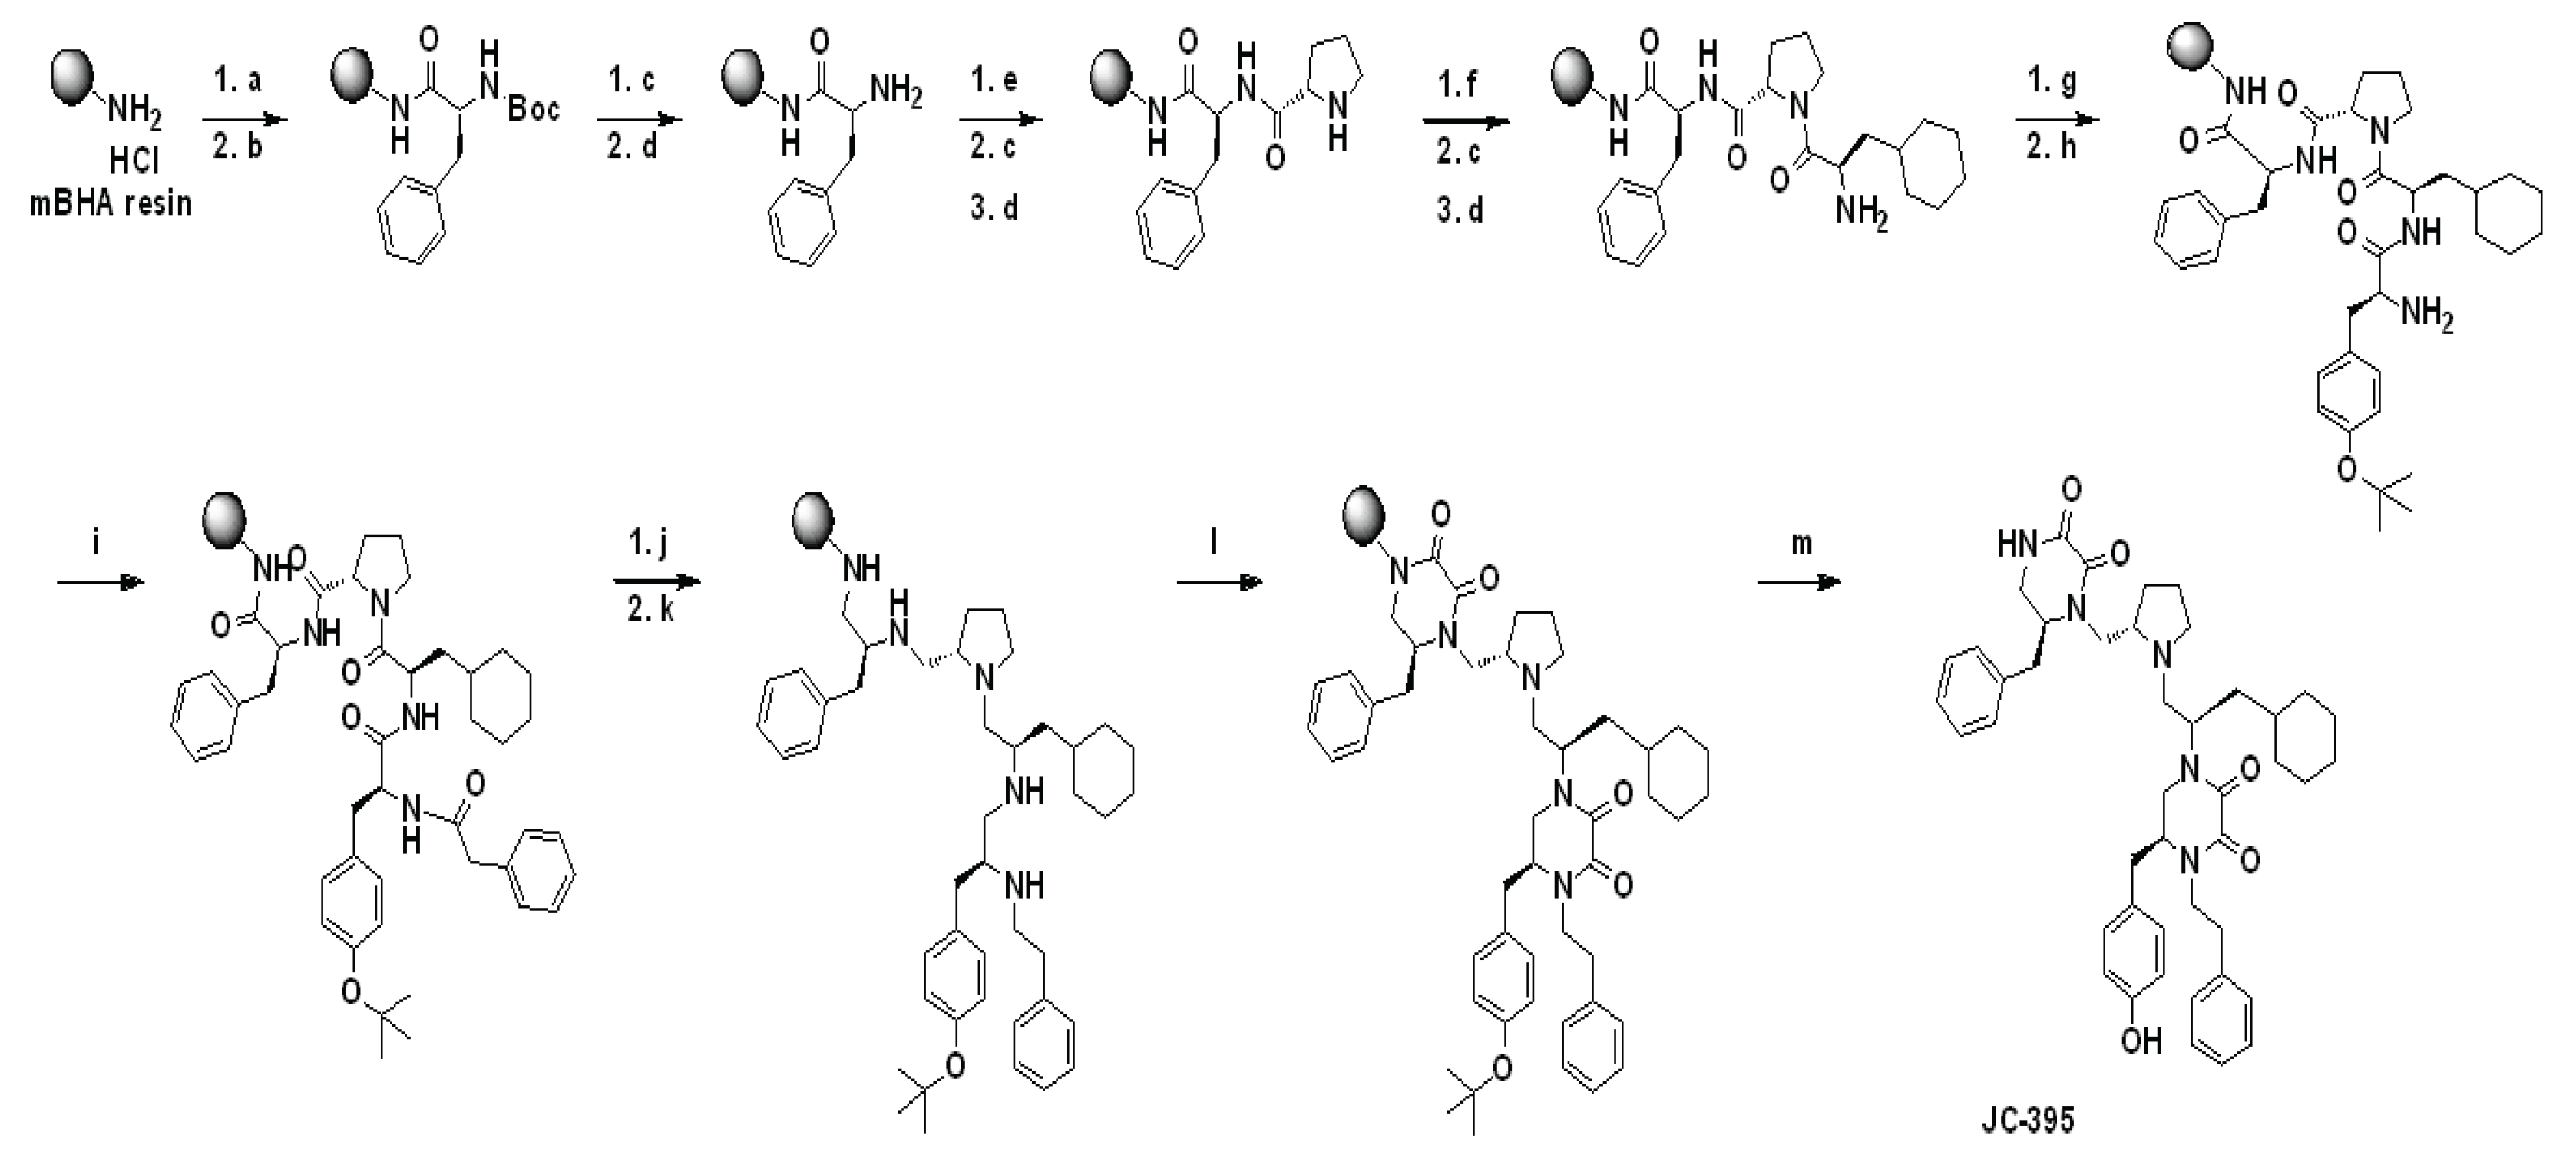
Procedure for the synthesis of 2155-14 (JC-395) and 2155-18 (JC-408). Pyrrolidine-bis-diketopiperazine JC-395 and JC-408 (Fig. 1A) were synthesized by modifying the previously published method [11]. Both compounds were synthesized via solid-phase methodology (Scheme 1) on 4-methylbenzhydrylamine hydrochloride resin (MBHA) (1.4 mmol/g, 100-200 mesh). To a syringe with a solid filter at the bottom was added MBHA resin (150 mg, 1 eq.), which was swelled and neutralized using 10% diisopropylethylamine (DIEA)/dimethylformamide (DMF) (v/v) (4 mL) at 25 °C for 20 min. After draining the swelling solution, the resin was washed with DCM (2x), Methanol (2x), DMF (2x), then DCM (2x). [Coupling reaction with amino acid] To an empty glass vial were added Boc-protected amino acid (Boc-Phe-OH, 4 eq.), 1-[Bis(dimethylamino)methylene]-1H-1,2,3-triazolo[4,5-b]pyridinium 3-oxide hexafluorophosphate (HATU, 4 eq.), and hydroxybenzotriazole hydrate (HOBt, 4 eq), and 10% DIEA/DMF was added to the mixture, which was shaken for 15 min for pre-activation. The pre-activated solution was added to the syringe containing the neutralized resin, and the syringe was shaken for 4 h at 25 °C. The solution was drained from the syringe, and the resin was washed with DCM (2x), Methanol (2x), DMF (2x), and DCM (2x). Around 10-15 beads of resin were taken for the Kaiser test. [Boc deprotection and neutralization] Boc protecting groups were removed with 55% trifluoroacetic acid (TFA)/45% dichloromethane (DCM) (1x, 4 mL, 30 min) and subsequently neutralized with 10% diisopropylethylamine (DIEA)/90% DCM (3x, 5 min). The steps for the coupling reaction with amino acid, Boc-deprotection, and neutralization were repeated with different amino acids such as Boc-Pro-OH, Boc-β-cyclohexyl-D-alanine-OH (or Boc-Phe-OH for JC-408), and Fmoc-Tyr(OtBu)-OH in sequence: the reaction time for coupling with amino acids was 2 h. The terminal Fmoc group was deprotected with 20% piperidine in DMF (4 mL) by shaking at 25 °C for 30 min. After drain the solution and wash the resin with DCM (2x), Methanol (2x), DMF (2x), then DCM (2x), phenylacetic acid (4 eq.) or 2-(Adamantan-1-yl)acetic acid (4 eq.) for compound 18, HATU, (4 eq.), HOBt (4 eq.) in 10%DIEA/90%DMF (4 ml) were pre-activated in a glass vial for 15 min and added to the syringe for shaking at 25 °C for 2 h. After the washing step, the resin was transferred to a microwave vial, and Borane-THF (1M, 6 mL, ~30 eq.) was added to the vial. The reaction mixture was heated under microwave irradiation at 70 °C for 6 h, and the solution was poured off. Piperidine (6 mL) was added to the microwave vial containing the resin, which was heated under microwave irradiation at 70 °C for 30 min. Piperidine was poured off, and the resin was transferred to a clean syringe, which was washed with DCM (2x), Methanol (2x), DMF (2x), then DCM (2x). Diketopiperazine cyclization was performed under anhydrous conditions. The resin in the syringe was placed in a pressure relief scintillation vial and a solution of 1,1’-oxalyldiimidazole (5x for each cyclization site) in anhydrous DMF (4 mL) was added to the vial, which was stirred at 25 °C for 48 h. After draining the solution, the resin was washed with DCM (2x), Methanol (2x), DMF (2x), then DCM (2x). Completion of cyclization was checked by cleaving a control sample, which was analyzed by LC. The compounds were then cleaved from the resin with trifluoroacetic acid (TFA)/trifluoromethanesulfonic acid (TFMSA) (9:1, 4 mL). The cleavage solution was collected and removed by blowing out N2 gas. The crude samples were diluted with MeOH (4 mL) and filtered for HPLC purification as described below to produce the title compound (JC-395 or JC-408) as a white powdery solid with 98% or 99% purity, respectively. 1H NMR and Mass spectroscopic data were matched with those in previous report [11].
Compound purification and characterization. The final compounds were purified using preparative HPLC with a dual pump Shimadzu LC-20AP system equipped with a SunFire C18 preparative column (19 x 250 mm, 10 micron) at λ = 220 nm, with a mobile phase of (A) H2O (0.1% TFA)/(B) methanol (MeOH)/acetonitrile (ACN) (3:1) (0.1% TFA), at a flow rate of 60 mL/min with 10%(B) for 30 sec, a gradient up to 90%(B) for 9.5 min, and 90%(B) for 3 min. 1H NMR and 13C NMR spectra were recorded in DMSO-d6 on a Bruker Ascend 400 MHz spectrometer at 400.14 and 100.62 MHz, respectively, and mass spectra were recorded using an Advion Mass Express. The purities of the synthesized compounds were confirmed to be greater than 95% by liquid chromatography on a Shimadzu LC-20AD instrument with SPD-20A. The mobile phase of (A) H2O (0.1% formic acid)/(B) ACN (0.1% formic acid) was used with a gradient of 5-95% over 7 min followed by 3 min rinse and 3 min equilibration.
Animal protocol with xenograft model in nude mice. This study used 5- to 7-week-old male and female athymic Nu/Nu mice (The Jackson Laboratory, Bar Harbor. ME). The mice were housed in the standard mouse shoe-box cages and maintained in a 12-hr light/12-hr dark cycle, with 50% humidity and 20 ± 3°C. The mice had free access to a standard pellet diet (Certified PicoLab® Rodent Diet 20, Lab Diet) and water ad libitum. The study was conducted in accordance with the guidelines of the Nova Southeastern University (NSU) Institutional Animal Care and Use Committee (NSU IACUC protocol 2019.12.DM4).
The animals were allowed to acclimate after delivery. The animals were randomly divided into 5 groups, with each group containing 12 mice (6 male and 6 female). Group 1: non-tumor control mice; Group 2: animals were injected S.C. with a vehicle control (10%/90% DMSO/sterile water, USP sterile injectable grade); Group 3: animals were injected with vemurafenib/cobimetinib (10 mg/kg body weight each); Group 4: animals were injected with 2155-14 (25 mg/kg body weight); Group 5: animals were injected with 2155-18 (25 mg/kg body weight) three times/week.
To establish a cell line-derived xenograft (CDX), NRAS/BRAF mutant (NRASQ61K; BRAFV600E) A375R cells (ATCC® CRL-1619IG-2 ™, ATCC, Manassas, MD, USA) were cultured in DMEM media supplemented with 10% FBS, 1% Pen/Strep. On the day of a xenograft implantation, the cells were harvested at 70-80% confluency and suspended in 10 ml of sterile PBS (USP grade, sterile for injection) so that 200 µl contained the required number of cells per injection and kept on ice. 2.0 x 10⁶ cells/0.2mL were injected into the right flanks of appropriate groups of mice using 1 ml insulin syringes with 26-gauge needles.
Once tumors were palpable, the digital caliper was used to measure the width and length of the tumors. Tumor volumes were calculated using the following equation:
Volume = (width)2 x length/2
Compounds (vemurafenib/cobimetinib, 2155-14, or 2155-18) were prepared in 10% DMSO/H2O (both USP injectable grade) fresh for each treatment day. Vemurafenib, cobimetinib, 2155-14, and 2155-18 were weighed into autoclaved 1.5 mL Eppendorf vials using analytical scales. USP grade DMSO was added to each vial under aseptic conditions and vortexed. USP grade injectable sterile H2O was then added to each vial and again vortexed. 1 ml insulin syringes with a 26-gauge needle were filled with 0.2 mL of the compound and delivered to the vivarium in the closed carrier for animal treatment. For the vehicle control group, syringes were filled with 0.2 mL of 10% DMSO/H2O (USP injectable grade). All compounds were injected subcutaneously (sc).
During the experimental period, body weights were measured, and mice were observed for signs of distress daily. More specifically, mice were observed for posture, vocalization, ease of handling, lacrimation, chromodacryorrhea, salivation, coat condition, unsupported rearing, arousal, piloerection, motor movements, diarrhea, tail pinch reaction, and constipation.
When tumors reached 2,000 mm3, the mice were euthanized, tumors excised, weighed, and their volumes were measured again.
The excised tumors were placed in either 10% neutral buffered formalin for paraffin embedding or in -80°C for cryo sectioning for tumor histopathology. The tissues were processed via standard tissue processing to produce H&E slides. All H&E slides were reviewed blind to the treatment group. The tumors have also been fluorescently stained for hnRNPH1/H2 (to confirm target modulation), M1 and M2 macrophages, B cells, and NK cells.
Statistical significance was set at p < 0.05. All data were analyzed using one-way ANOVA to compare means, and significant differences were further analyzed by Tukey’s multiple comparisons using Prism (version 8.0, GraphPad Inc, San Diego, CA).
Immunofluorescence staining. Fresh tumor tissues were embedded in Tissue-Tek optimal cutting temperature (OCT) compound (Sakura 4583) and rapidly freeze at -80°C. Sections of 10µm thickness were cut using the Leica CM1850 UV Cryostat. Sections were rehydrated in PBS for 10 min at RT. Sections were fixed with 10% formalin for 15 minutes and then treated with 0.1% sodium borohydride in PBS for 10 min, permeabilized in 0.3% Triton X-100 in PBS for 5min at RT and washed in 0.1% Tween20 in TBS. Sections were incubated in blocking buffer (1%BSA, 10% Goat serum, 0.3% triton X100 in PBS) for 1h at RT. The primary antibody for hnRNP H (rabbit monoclonal, 1:250, abcam ab289974) was incubated overnight at 4°C in antibody diluent. Sections were washed three times using 0.1% Tween20 in PBS at RT and incubated with secondary antibody (goat anti-rabbit IgG conjugated to Alexa Fluor 647 (ab150079, abcam) diluted 1:400 in antibody diluent for 1h at RT. Antibodies for M1 (anti-CD80, Biolegend cat#104718, Alexa Fluor® 647 anti-mouse) and M2 (anti-CD206, Biolegend cat#141710, Alexa Fluor® 688 anti-mouse) macrophages, dsRNA (primary - J2, Exalpha Biologicals Inc cat#10010200, secondary goat anti-mouse IgG (H+L) cross-adsorbed secondary antibody, , Alexa Fluor™ 647, Invitrogen cat# A21235), B cells (anti-CD45 Pacific Blue™ anti-mouse antibody, Biolegend cat#103125), and NK cells (anti-CD161 PE/Cyanine7 anti-mouse NK-1.1 antibody, Biolegend cat#108713) were diluted 1:250 in 10% goat serum and incubated in a dark humid chamber at 37°C for 1 hr. Sections were washed three times for 5 min at RT in PBS and mounted in VECTASHIELD Antifade Mounting Medium with DAPI for fluorescence (VECTOR). Images were taken using Evos (Life Technologies) automated microscope. Total immunofluorescence intensity was quantified using three different sections from the same tumor for each treatment group using ImageJ software.
Animal protocol with syngeneic B16-F10 mouse melanoma model. 7-week-old female C57BL/6J mice (The Jackson Laboratory, ME, USA) were used. All mice were housed in a controlled vivarium environment with access to food and water ad libitum, following the guidelines of laboratory animal use and care. After 3 days of acclimatization following their arrival in the vivarium, the fur on the injection site was removed, and B16-F10 melanoma cells (100,000 cells/mouse) were injected subcutaneously (SQ) into the left flank of each mouse. Once tumors became palpable, tumor length and width were measured every other day using a digital caliper, and tumor volume was calculated using the formula:
Tumor Volume = (length ×width^2)/2
After tumors became palpable, mice were randomly assigned to three groups (n = 5 per group): 10%/90% DMSO/H2O (vehicle) group, 2155-14-treated group (25 mg/kg), and 2155-18-treated group (25 mg/kg). Mice received SQ injections every other day for ten days in a total of five doses. The final dose was administered intratumorally (IT) to maximize drug concentration within the tumor microenvironment (TME). On the day following the final treatment, mice were euthanized using CO₂ exposure, and tumors were excised for further analysis.
Once mice were euthanized, the tumors were collected, and the tumors were divided into two parts. The first part was dissociated into single-cell suspension for flow cytometry, and the second part was fixed in 10% formalin to preserve tissue structure and cellular components for IHC/IF analysis. Tumor tissues were dissociated using a mouse tumor dissociation kit (Miltenyi Biotec, Gaithersburg, MD, USA) according to the manufacturer's instructions. The dissociated cells were then counted and aliquoted at 5,000,000 – 20,000,000 tumor cells for flow cytometry analysis. After fixation, the tumor tissue was embedded in an optimal cutting temperature (OCT) compound and frozen at -80°C. Later, frozen tumor tissues were sectioned using a cryostat (Leica Biosystem, Buffalo Grove, IL, USA). The slide sections were stored at -80°C for future Immunohistochemistry analysis.
In the follow-up experiments, 10 mice were used and randomly assigned into two groups (n = 5 per group), 10%/90% DMSO/H2O (vehicle) and 2155-18-treated or 2155-14-treated group (25 mg/kg). Mice were treated daily for 7-10 days, with the total dose divided between two dosage forms: 50 µl administered IT and 150 µl administered SQ simultaneously each day. After the treatment period, the mice were euthanized, and tumors along with the spleen were collected. Tumors were then fixed and dissociated. Next, the entire resected tumor tissue was dissociated as described above.
Flow cytometry.
Single-cell suspensions were prepared from tumor tissues, and the number of viable cells was counted. To quantify intratumoral immune cells, samples were stained with a mixture of antibodies for either surface or intracellular staining. For intracellular IFNγ staining, additional steps were performed: samples were treated with Brefeldin A at a final concentration of 3 µg/ml and incubated at 37°C in a 5% CO₂ incubator for 4 hours prior to antibody staining. Samples were then centrifuged at 2,000 RPM for 5 minutes at 4°C, and the supernatant was discarded. Cell pellets were subsequently resuspended in 400 -500 µl of live/dead stain in PBS (1 ml PBS with 1 µl live/dead stock solution) and incubated on ice for 15-20 minutes in the dark. Then, 1 ml PBS was added, followed by centrifugation and removal of the supernatant. Antibody master mixes were prepared separately for both surface and intracellular staining. Each sample was stained with 150 µl MACS buffer, 50 µl brilliant buffer, 4 µl of FC block, and appropriate antibody mixture: for antibodies used at a 1:100 dilution, 2 µl was added. For those used at 1:200 dilutions, 1 µl per sample was added. For surface antigen staining, cells were incubated with the antibody mix listed in supplementary Tables 1 and 2. For intracellular antigen staining, Cells were stained with the antibody mix listed in supplementary Tables 3, 4, and 5. Subsequently, 200 µl of the appropriate master staining mix was added to each tube, followed by incubation on ice for 1 hour protected from light. Cells were then centrifuged under the same conditions, and the pellets were resuspended in 400 µl MACS buffer, followed by centrifugation. Finally, cells were resuspended in 800 µl MACS buffer prior to flow cytometry analysis. Compensation samples were prepared with beads as follows: unstained beads (600 µl MACS buffer + 2 drops of positive/negative beads), and single stain (600 µl MACS buffer + 2 drops of positive/negative beads + 2 µl of one antibody each sample). Flow cytometry data analysis was performed using FlowJo software.
3. Results
Synthesis and characterization of 2155-14 and 2155-18. The pyrrolidine diketopiperazine compounds, 2155-14 (JC-395) and 2155-18 (JC-408), were synthesized by standard solid phase synthesis with MBHA resins. Amino acids were coupled to amine on the resin using Boc-AA-OH or Fmoc-AA-OH (4 eq), HOBt (4 eq), and HATU (4 eq) in DMF containing 10% DIEA at 25 °C, and the Boc or Fmoc group was deprotected by 55% TFA in DCM or 20% piperidine in DMF at 25 °C, respectively. After coupling reactions with four amino acids and phenylacetic acid or 2-(adamantan-1-yl)acetic acid, five amide groups were reduced with borane in THF (~30 eq) at 70 °C under μwave irradiation for 6 hours. The reduced 2° amine groups were coupled with 1,1’-oxalyldiimidazole in anhydrous DMF, and diketopiperazine moieties were formed in the agent on the resin. TFA/TFMSA (9/1) was used to cleave the resin, and the final compounds were obtained by preparative HPLC purification with over 98% purity confirmed by the analytical LC. The structures of the final compounds were confirmed by 1H NMR and Mass spectroscopic analysis, which were matched with the previous report [11].
In vivo efficacy study in A375R BRAF/NRAS CDX in nude mice. In the previous study we reported antimelanoma activity of 2155-14 and 2155-18 in A375 BRAF mutant CDX model [13]. In the present study, we utilized the A375R BRAF/NRAS double mutant CDX model, which is a melanoma resistance model to BRAF inhibitors (BRAFi).
Figure 1.
Summary of 2155-14 and 18 testing in A375R BRAF/NRAS CDX melanoma model. (A) Combined male and female tumor volumes. (B) Tumor volumes of female mice. (C) Tumor volumes of male mice. (D) Weights of excised tumors from both males and females confirm the efficacy of leads. (E) Weights of excised tumors from both males and females confirm the efficacy of leads. (E) Weights of excised tumors from female mice confirm efficacy of leads. (F) Weights of excised tumors from male mice confirm the efficacy of leads. Black arrows - day of the first treatment. Non-parametric student test was used. ns - no significance. * - p < 0.05, ** - p < 0.01, *** - p < 0.005, **** - p-value < 0.0001 (n=11). The mice were allowed to acclimate after the delivery. Mice were treated three times per week using subcutaneous injections.
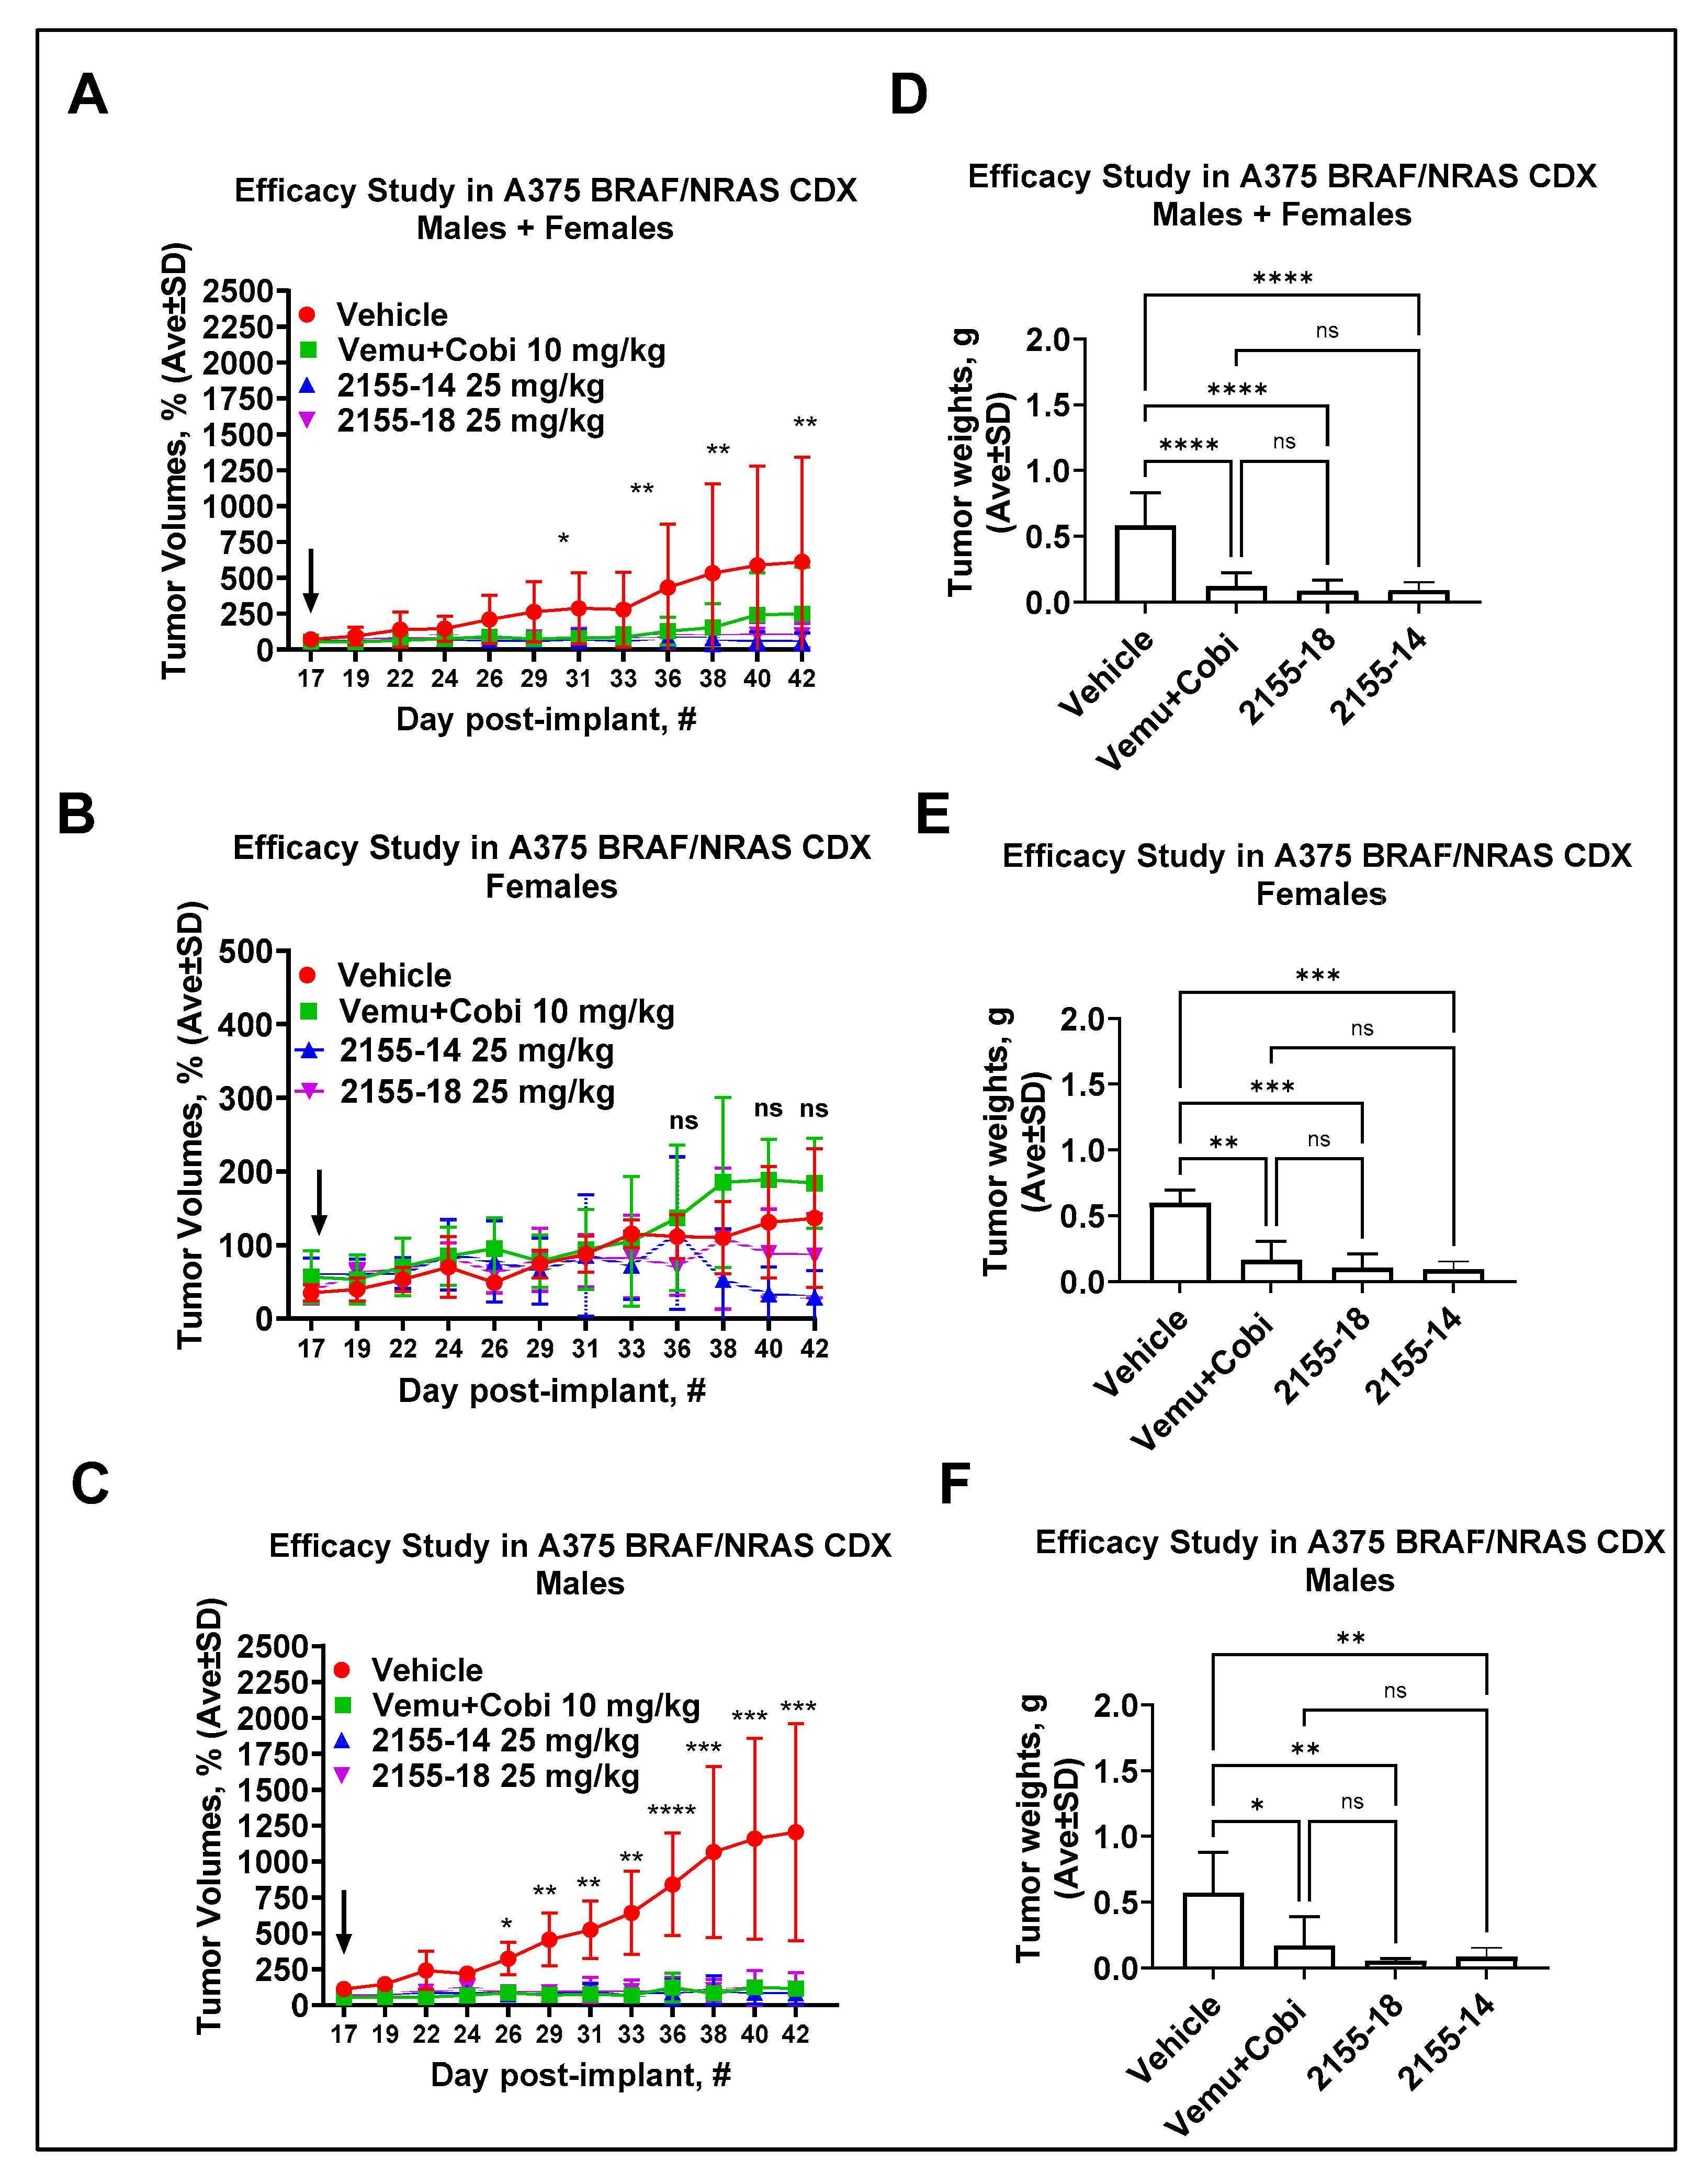
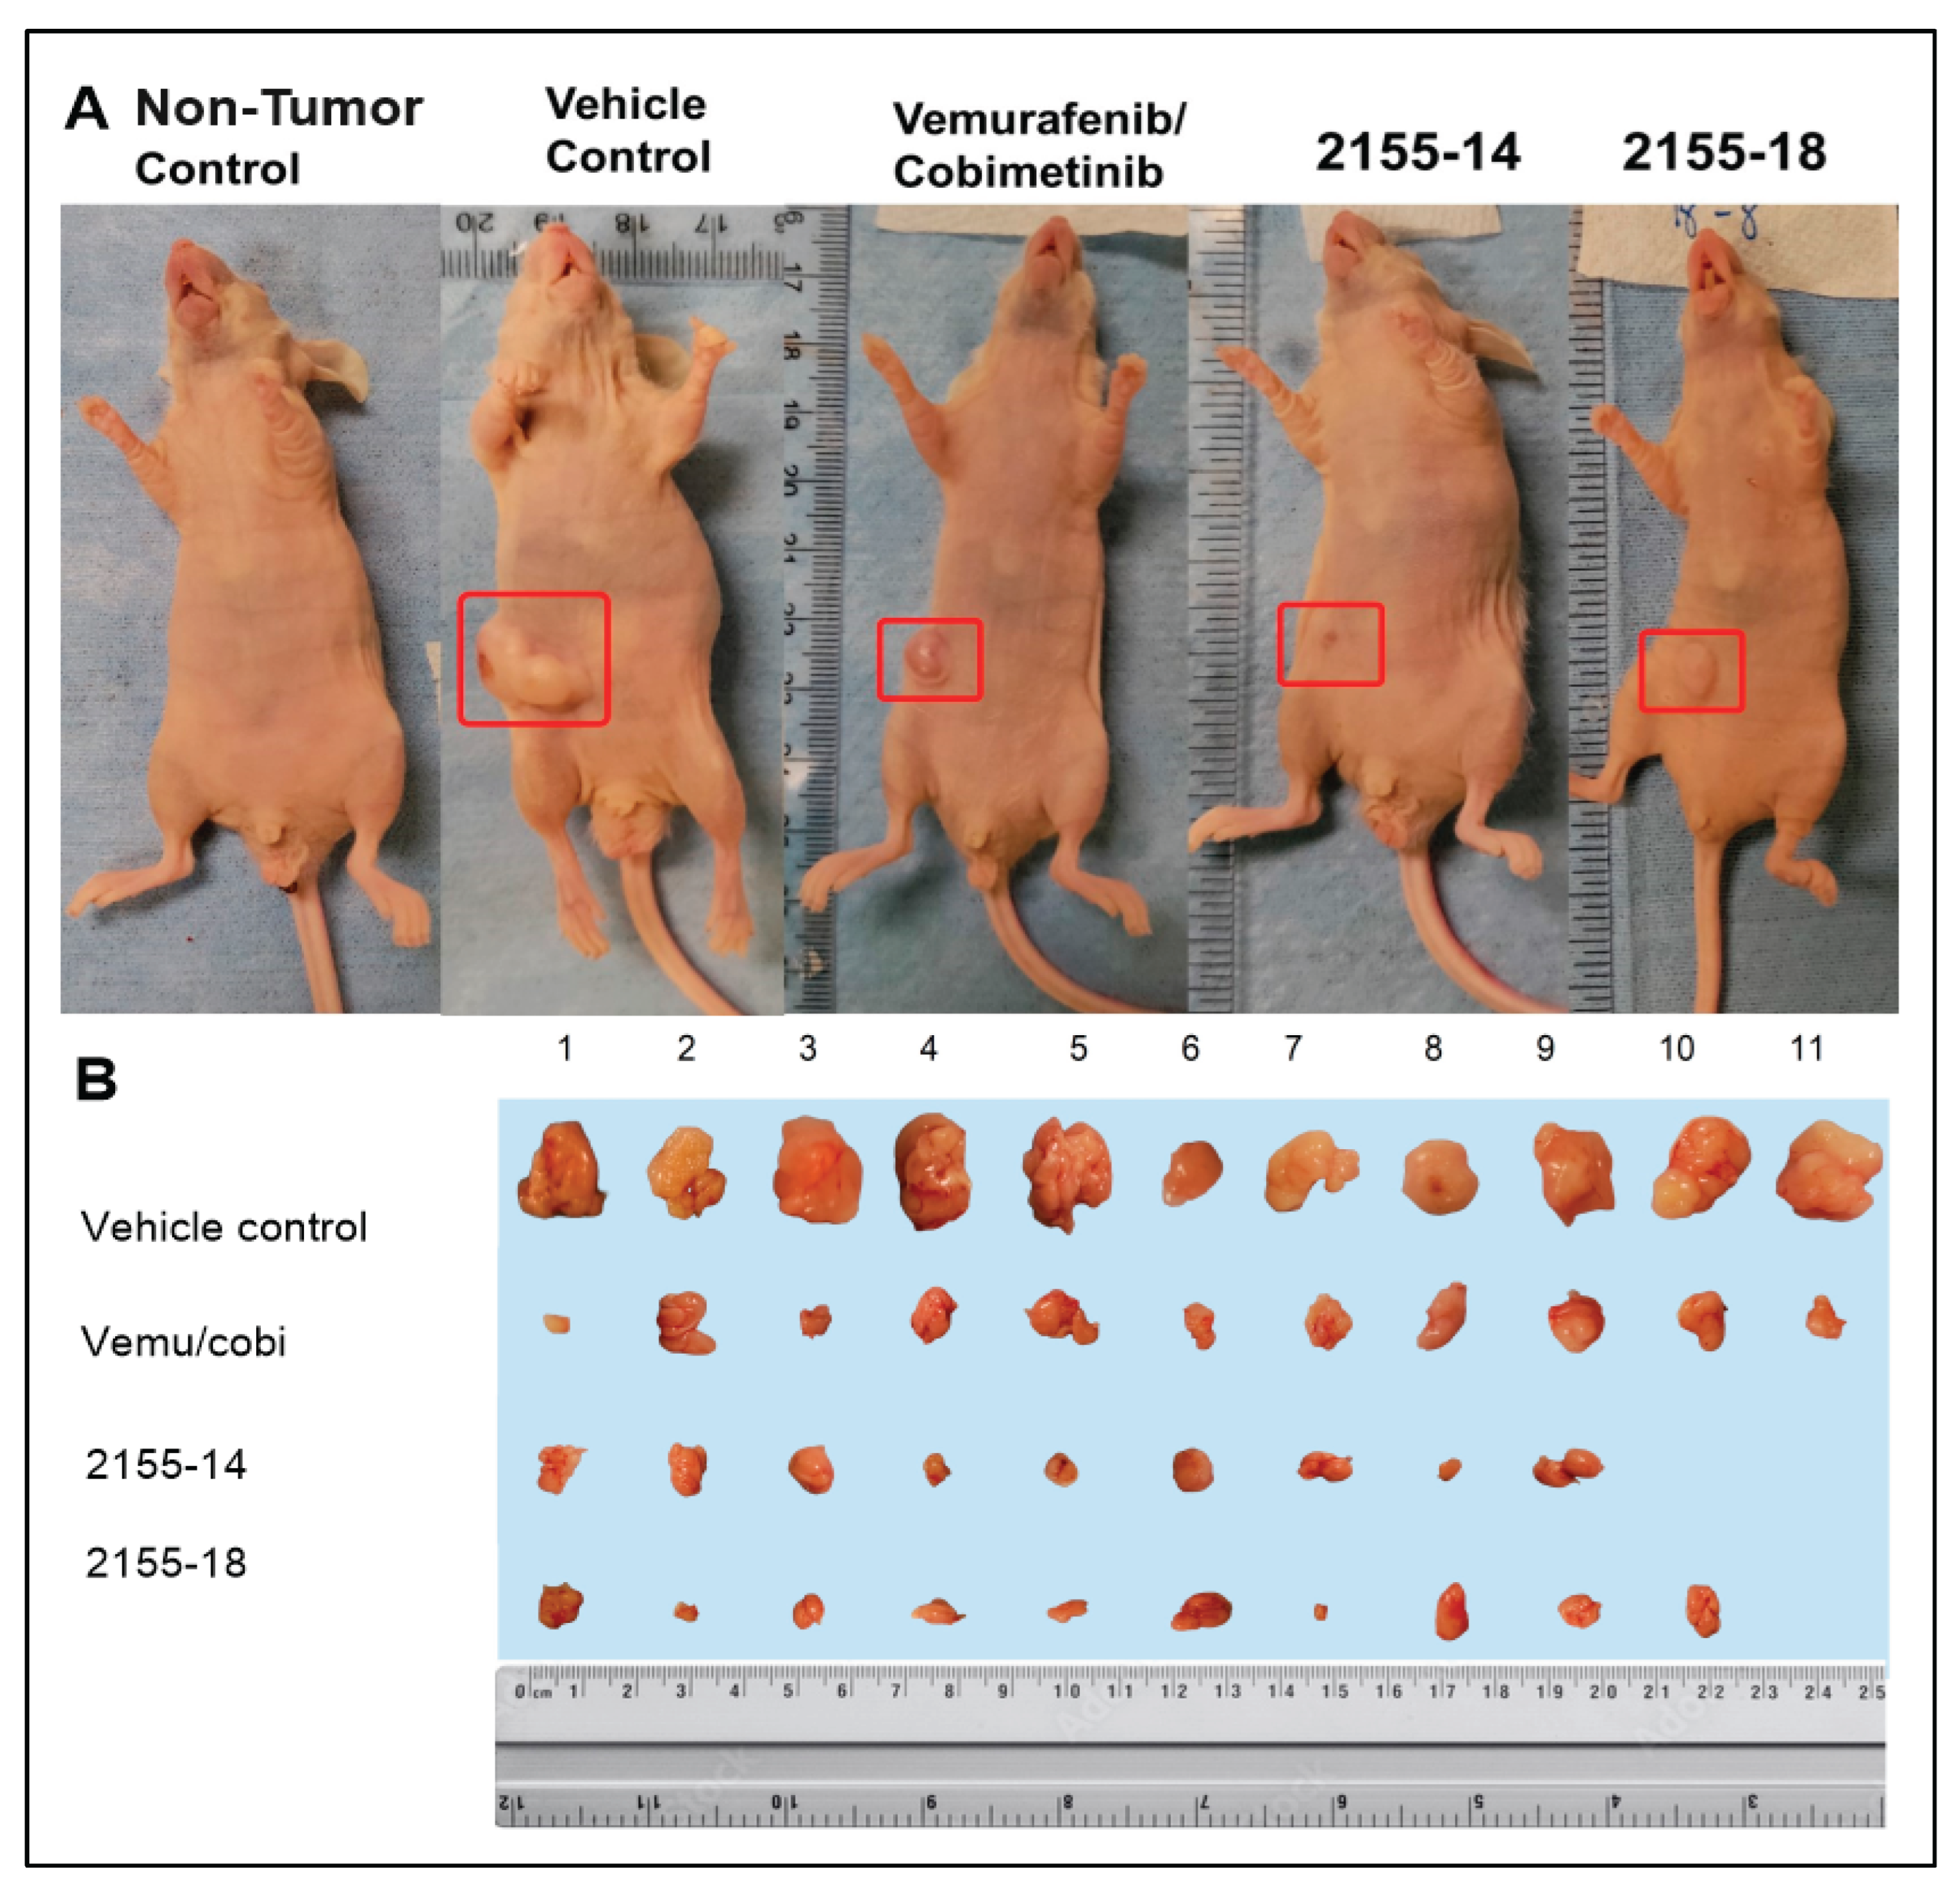
A375R BRAF/NRAS-mutant CDXs were established by injection of A375R BRAF/NRAS-mutant cells into the right flank of the animals. The tumors reached 100 mm3 on day 17, after which we commenced the treatment. The combined male and female tumor volume measurements exhibited significant variability, leading to large standard deviations (Fig. 1A). When plotted separately, the graph of tumor volumes in female mice (Fig. 1B) suggested that tumors did not grow as significantly as in males (Fig. 1C), and the treatment appeared to be ineffective in females. However, when excised and weighed, the treated tumors were found to be considerably smaller than the vehicle control, regardless of sex (Fig. 1DEF). Visual examination of tumor-bearing mice (Fig. 2A) and excised tumors (Fig. 2B) revealed that some of the tumors were irregularly shaped and of non-uniform size, which could account for the high variability of tumor volume measurements. Also, in the case of animals treated with 2155-14 and 18 tumors were very small and, in some animals, were not found.
Figure 2.
2155-14 and 18 are efficacious in the A375R BRAF/NRAS CDX melanoma model. (A) Representative animals from each treatment group. (B) Excised tumors of treated animals are significantly smaller than those of untreated controls and, in some animals, undetectable. The mice were allowed to acclimate after the delivery. Mice were treated with 25 mg/kg bw three times per week using subcutaneous injections.
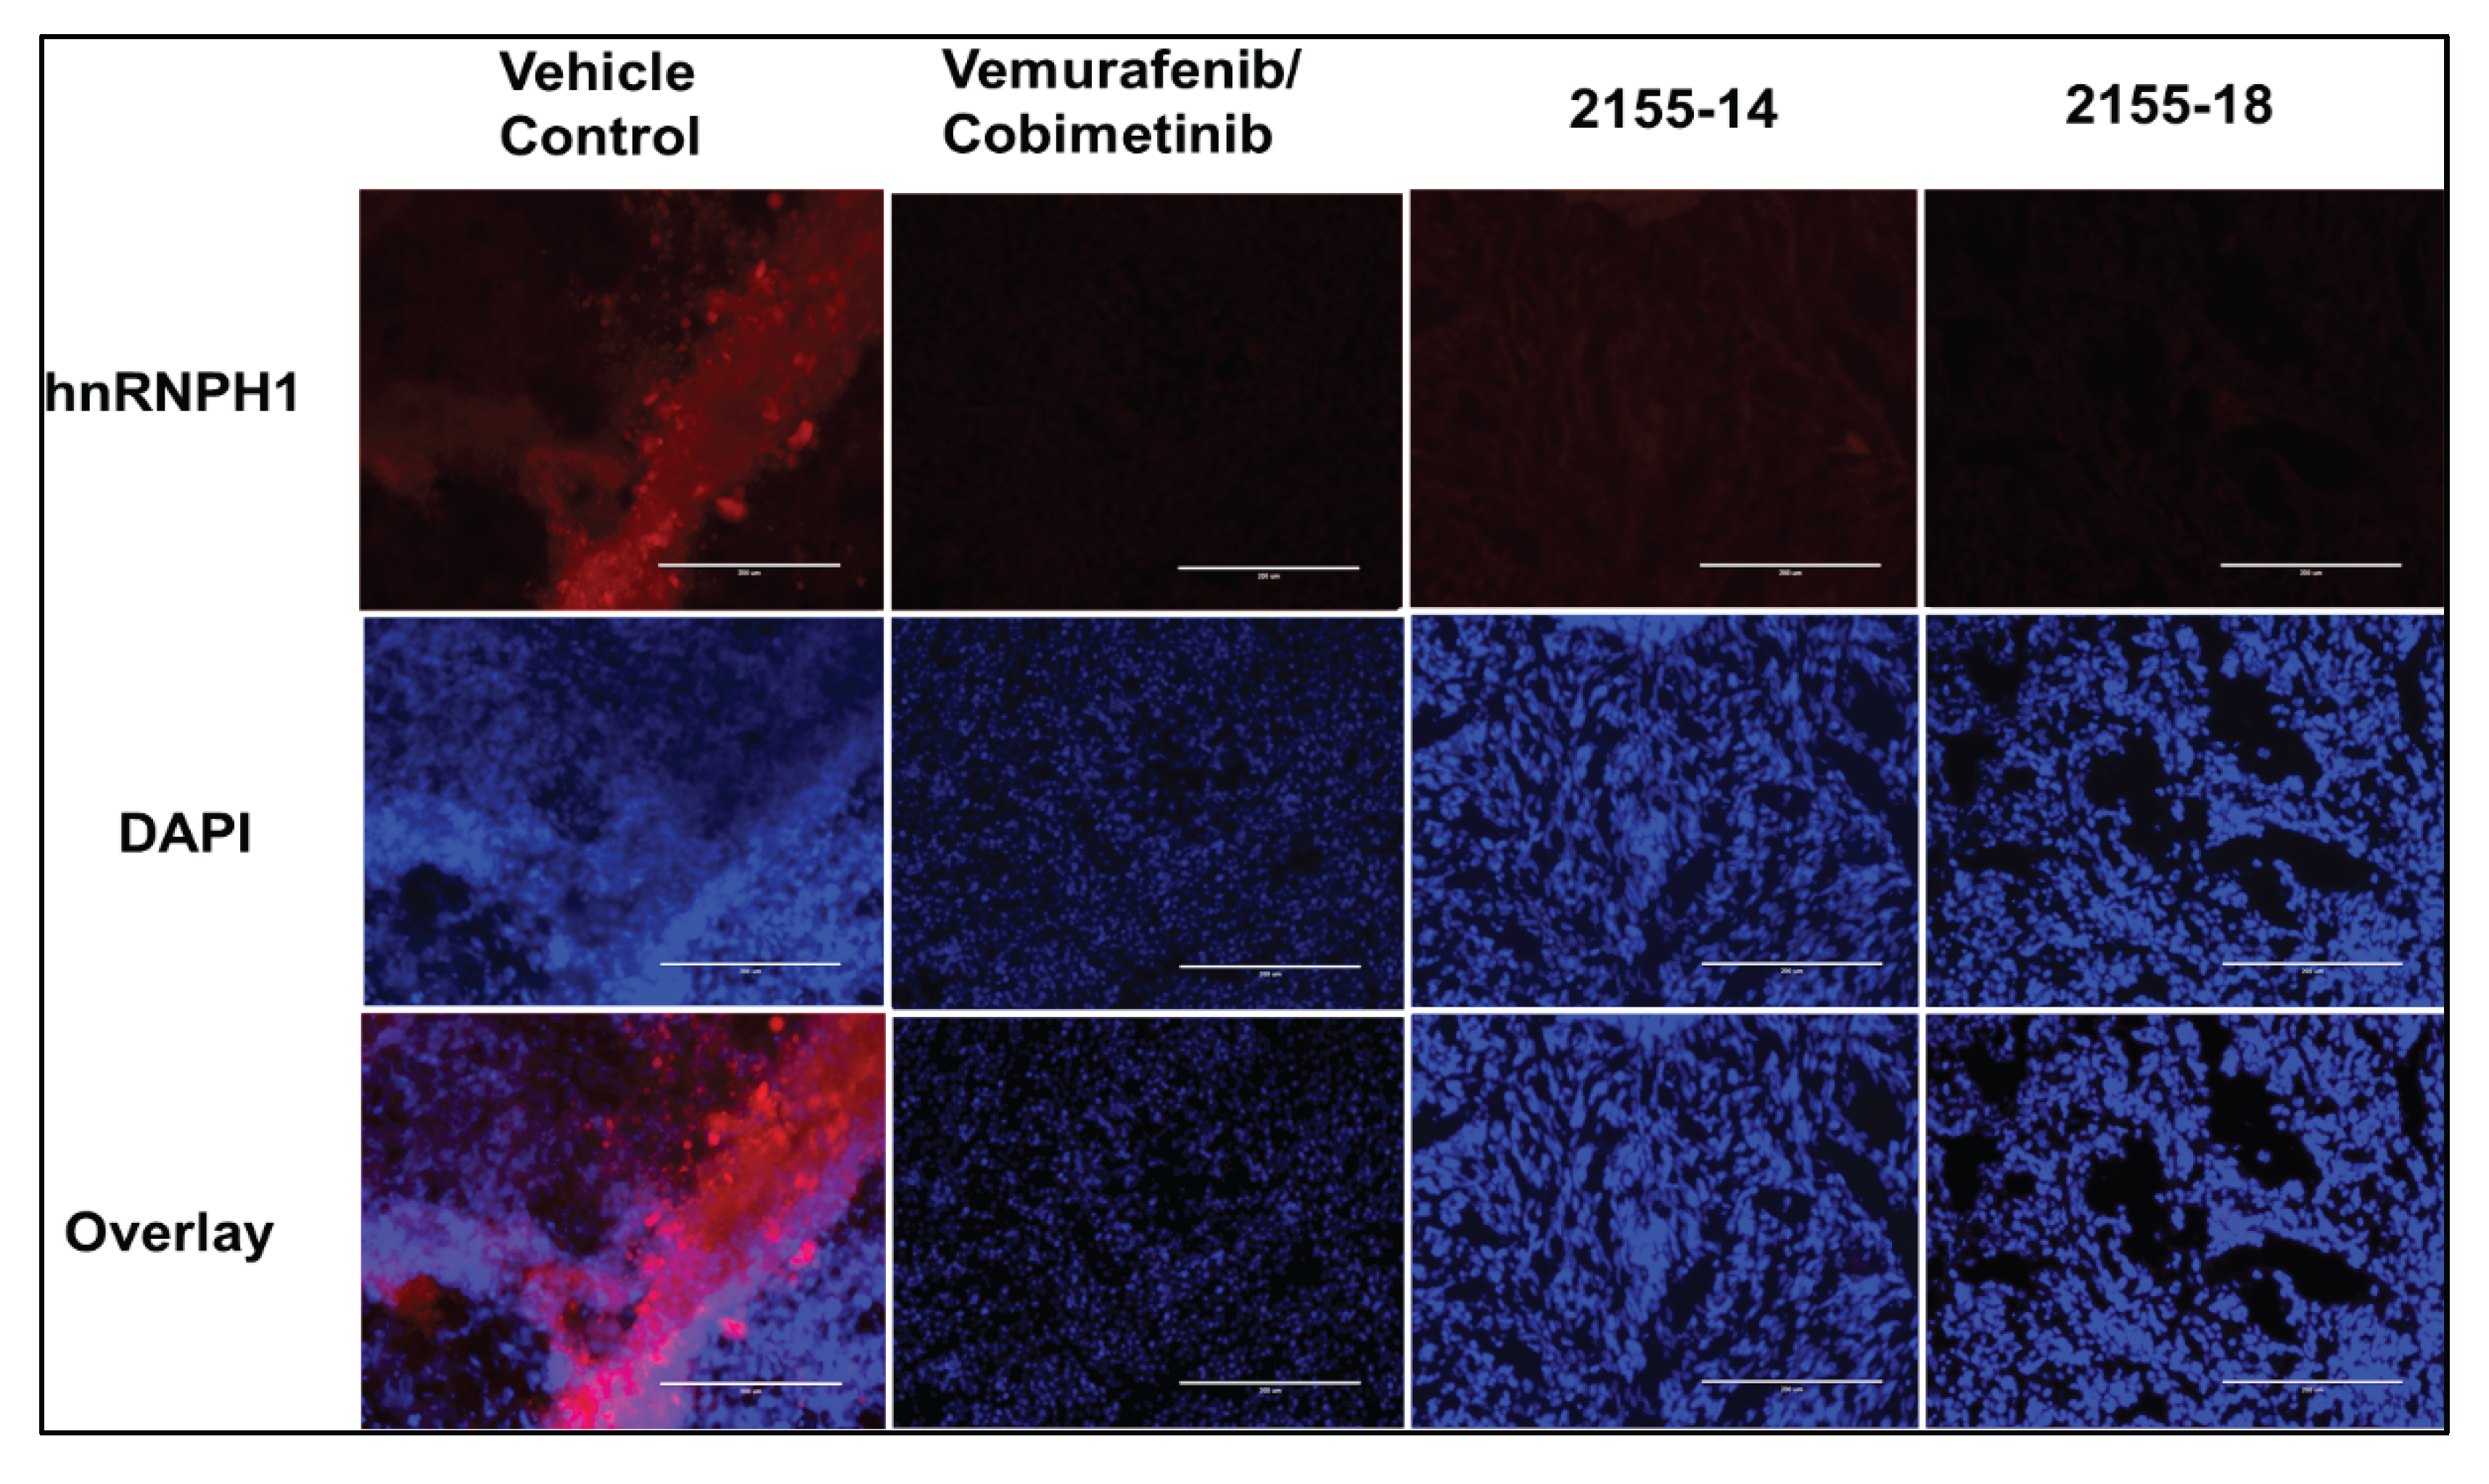
Immunofluorescence. To confirm target modulation, we stained tumors for hnRNPH1/H2. As evident from Fig. 3, all treated groups exhibited downregulation of the target protein in agreement with previously reported observations in the A375R BRAF mutant CDX model [13]. Immunofluorescent staining of tumors demonstrated the total loss of staining of hnRNPH1/H2 in all treated groups (Fig. 3), which agrees with our A375 BRAF-mutant CDX model study [13].
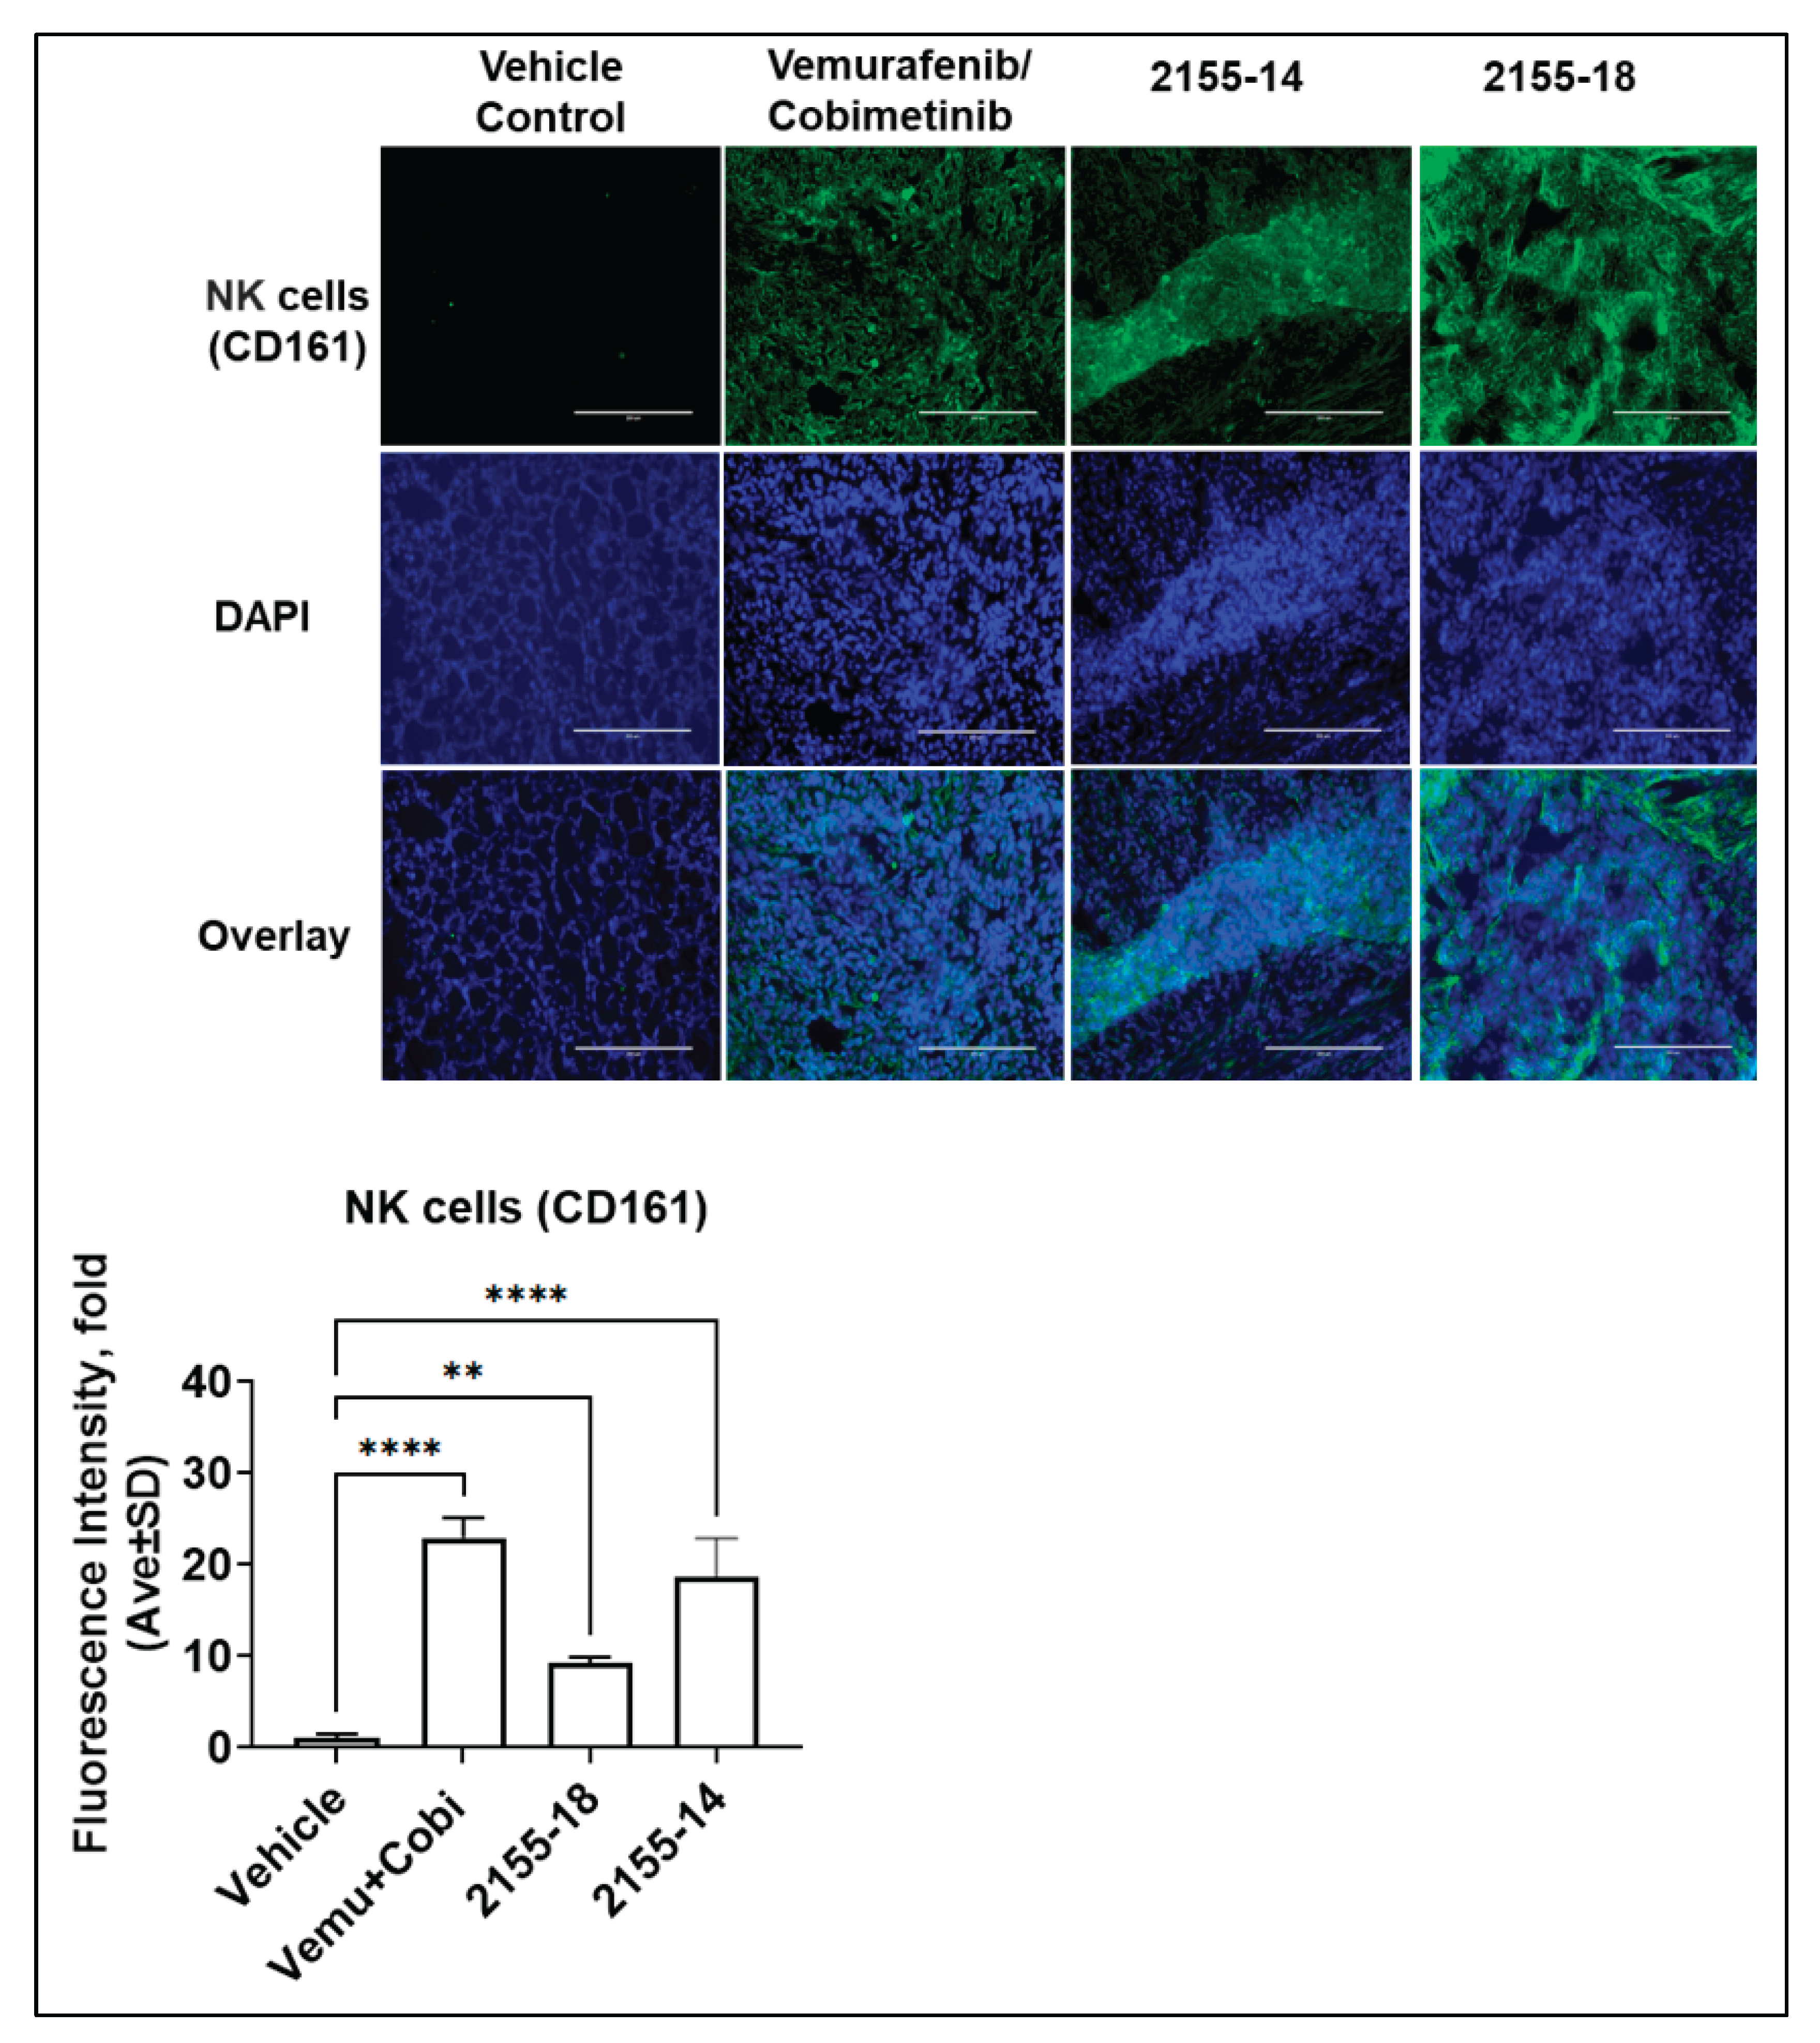
We utilized nude athymic mice (nu/nu) for this and the A375 BRAF mutant CDX model [13] study that is T-cell deficient [21]; however, they have partially functional B cells, functional NK cells, and macrophages; therefore, a contribution of the immune system to the anti-tumor activity of 2155-14 and 2155-18 cannot be ruled out at this stage. To determine whether immune cells can contribute to compounds’ anti melanoma activity, we immunostained tissue sections for markers of macrophages, B cells, and NK cells. Fig. 4 and 5 demonstrate that tumors treated by 2155-14 and 18 are infiltrated by M1 and M2 macrophages, respectively. We also observed increased infiltration by B cells and NK cells (Figs. 6 and 7, respectively)
Figure 3.
Immunofluorescence staining for hnRNP H1/H2 demonstrates its downregulation in tumors treated with 2155-14 and 2155-18 and vemurafenib/cobimetinib mixture (n = 3). Images are captured by the Evos microscope, and representative images are shown. Note the lack of staining in the Cy5 channel corresponding to the lack of hnRNP H1/H2 protein expression in tumors treated with 2155-14 and 2155-18. Scale bars: 200 μm.
To confirm our hypothesis that 2155-14 and 2155-18 efficacy is also dependent on the immune system, we used immunocompetent C57BL/6J mice to establish a B16F10 syngeneic model, which is widely used in immunotherapy efficacy studies [22].
As evident from Fig. 8A-C, treatment with 2155-18 increased tumor presence of macrophages, dendritic cells (DCs), and total B cells, whereas treatment with 2155-14 resulted in increased presence of CD4+ T cells (Fig. 8D).
To further investigate the immunomodulatory effects of 2155-18, intracellular IFNγ staining was performed on CD8 T cells and monocyte-derived suppressor cells (MDSCs) and CD4 T cells isolated from tumors of syngeneic mice treated daily for 7 days were quantified. The expression levels of CD3+CD4+CD62+, CD3+CD4+CD25+, and CD3+CD4+CD44+ cells were not significantly different between the vehicle and treated groups (Fig. 9A-C), indicating a lack of activation of CD4 T cells. Furthermore, immunosuppressive CD11b+ cells expressing Ly6G and Ly6C were not significantly affected by 2155-18 treatment. Finally, there was no increase in M1 and M2 macrophages (Fig. 9HI). However, treatment with 2155-18 led to a significant increase in IFN-γ expression in CD8⁺ T cells (Fig. 9D), indicating activation of cytotoxic T cells due to 2155-18 treatment.
Figure 4.
Immunofluorescence staining demonstrates tumor infiltration by M1 macrophages in tumors treated with 2155-14 and 2155-18 (n = 3). Non-parametric student test was used. ns - no significance. * - p < 0.05, ** - p < 0.01, *** - p < 0.005, **** - p-value < 0.0001 (n=3). Images are captured by the Evos microscope, and representative images are shown. Scale bars: 200 μm.
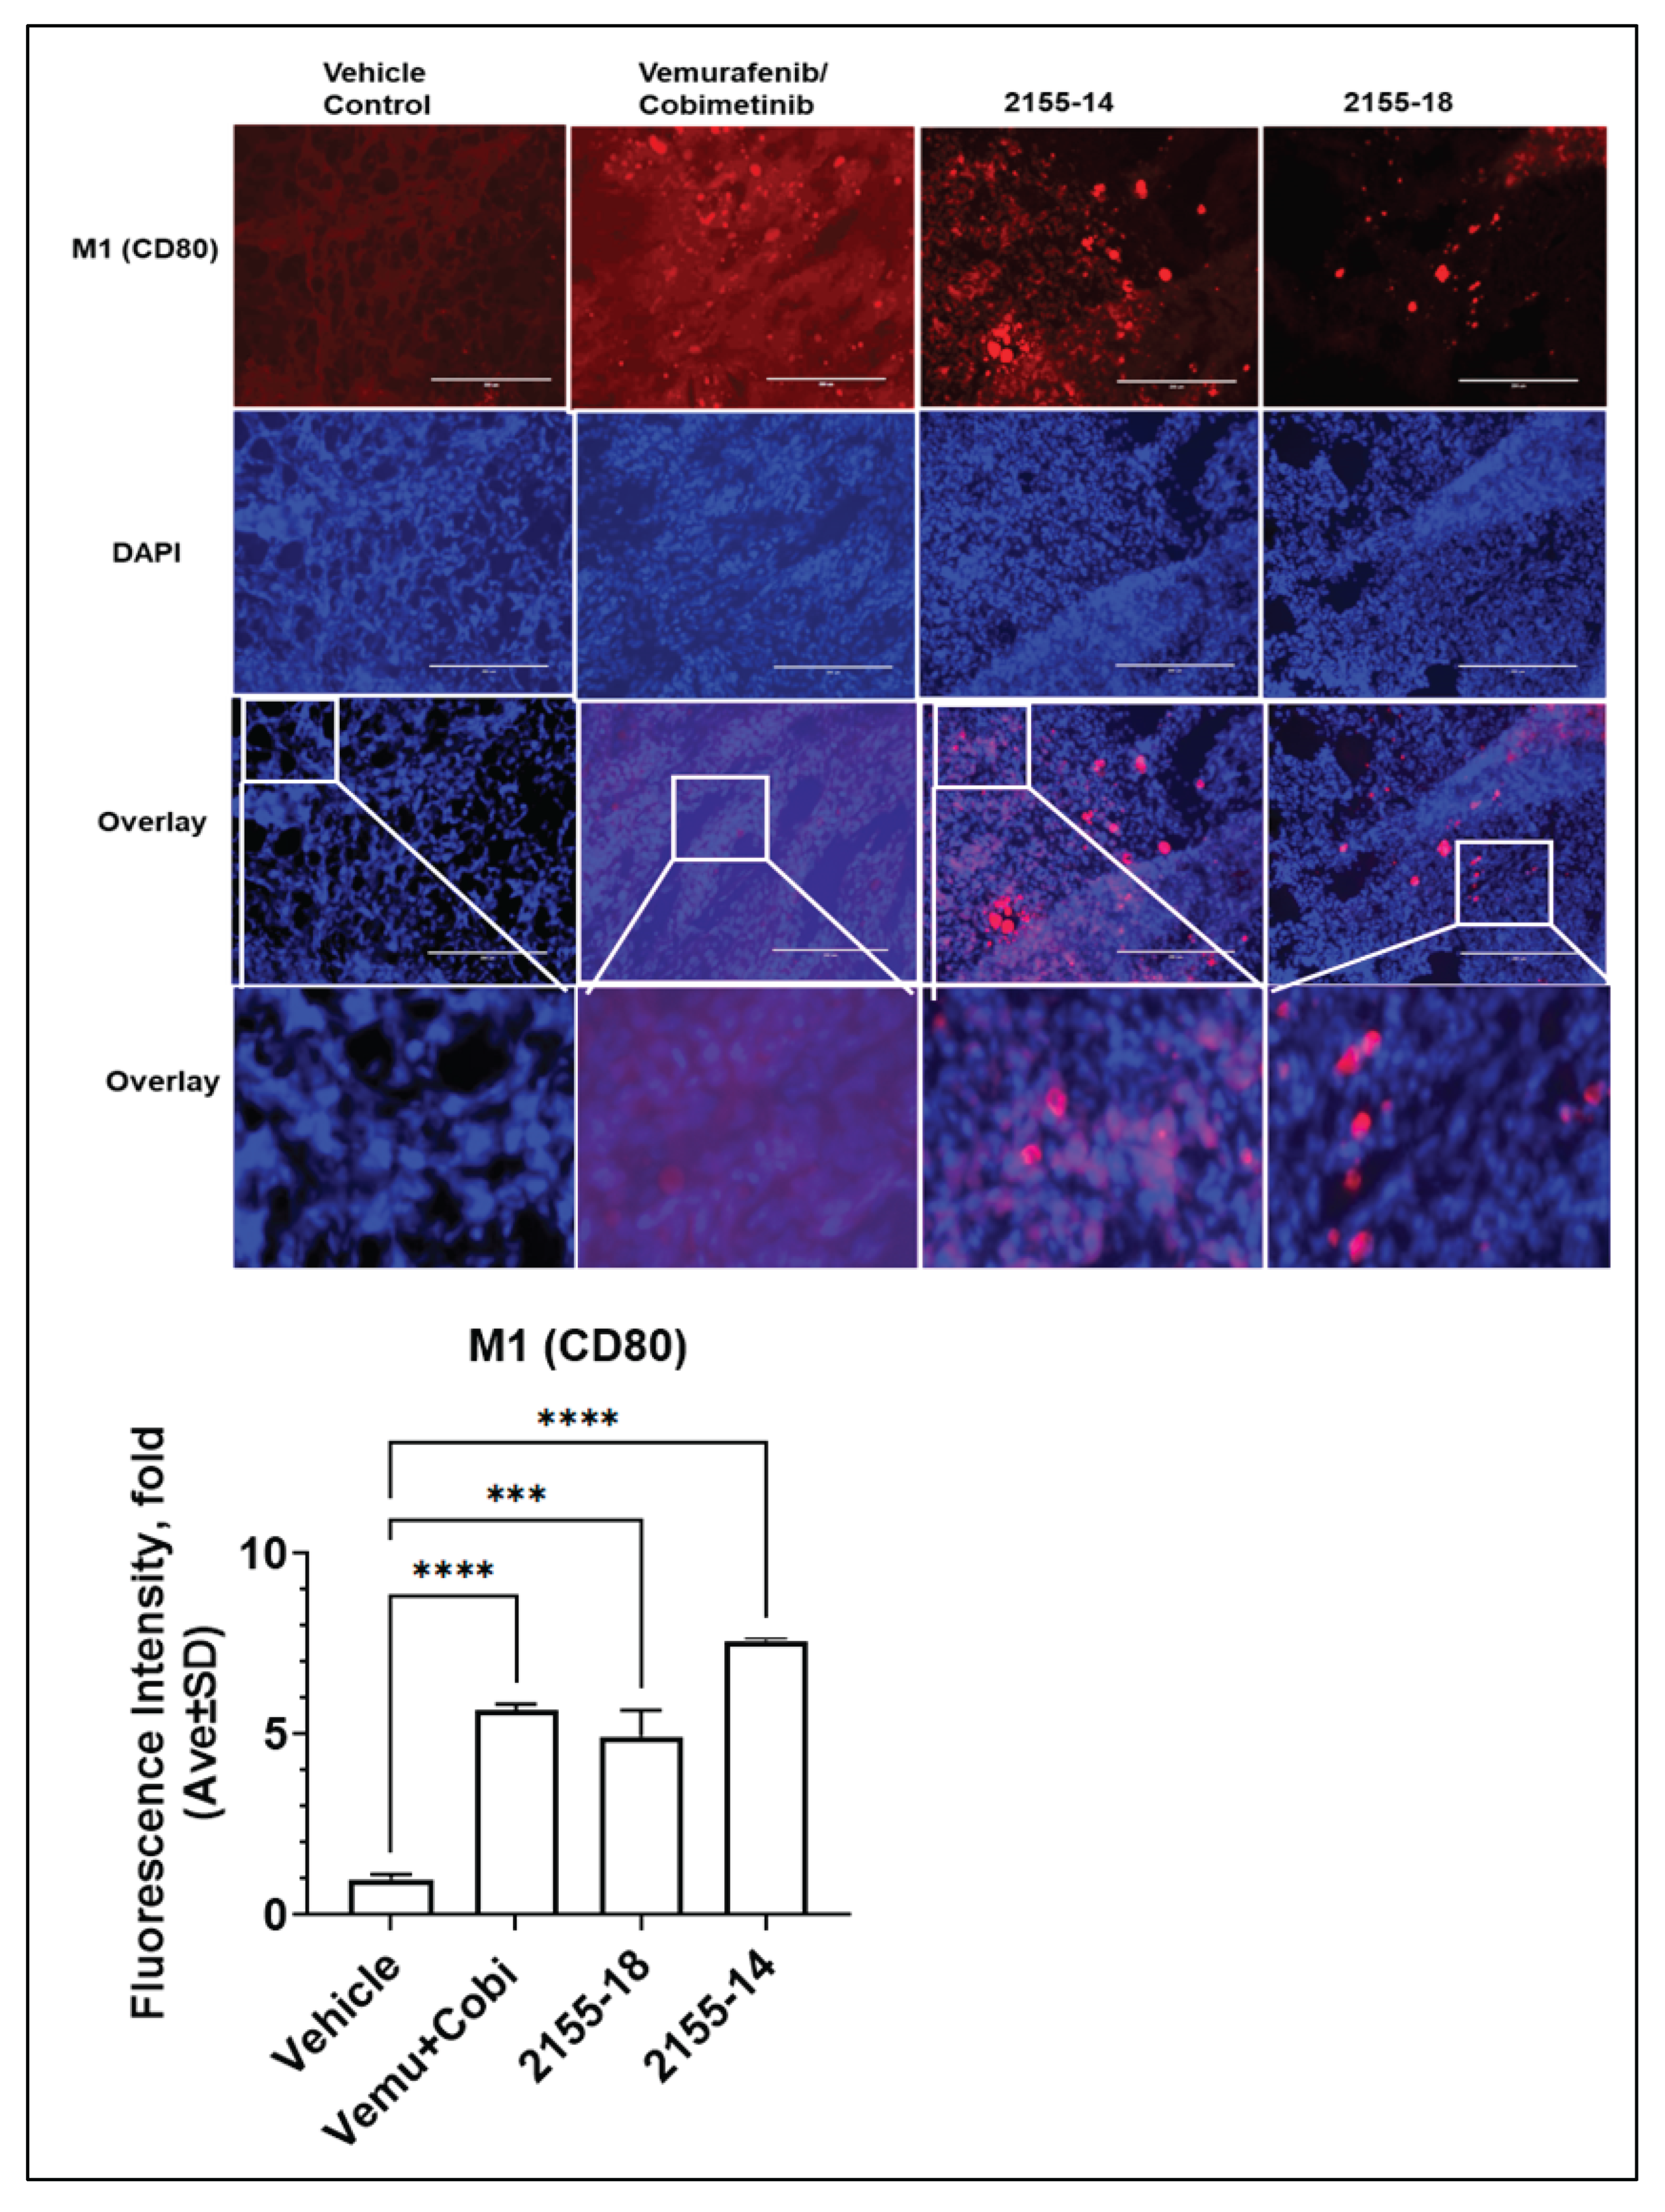
Figure 5.
Immunofluorescence staining demonstrates tumor infiltration by M2 macrophages in tumors treated with 2155-14 and 2155-18 (n = 3). Non-parametric student test was used. ns - no significance. * - p < 0.05, ** - p < 0.01, *** - p < 0.005, **** - p-value < 0.0001 (n=3). Images are captured by the Evos microscope, and representative images are shown. Scale bars: 200 μm.
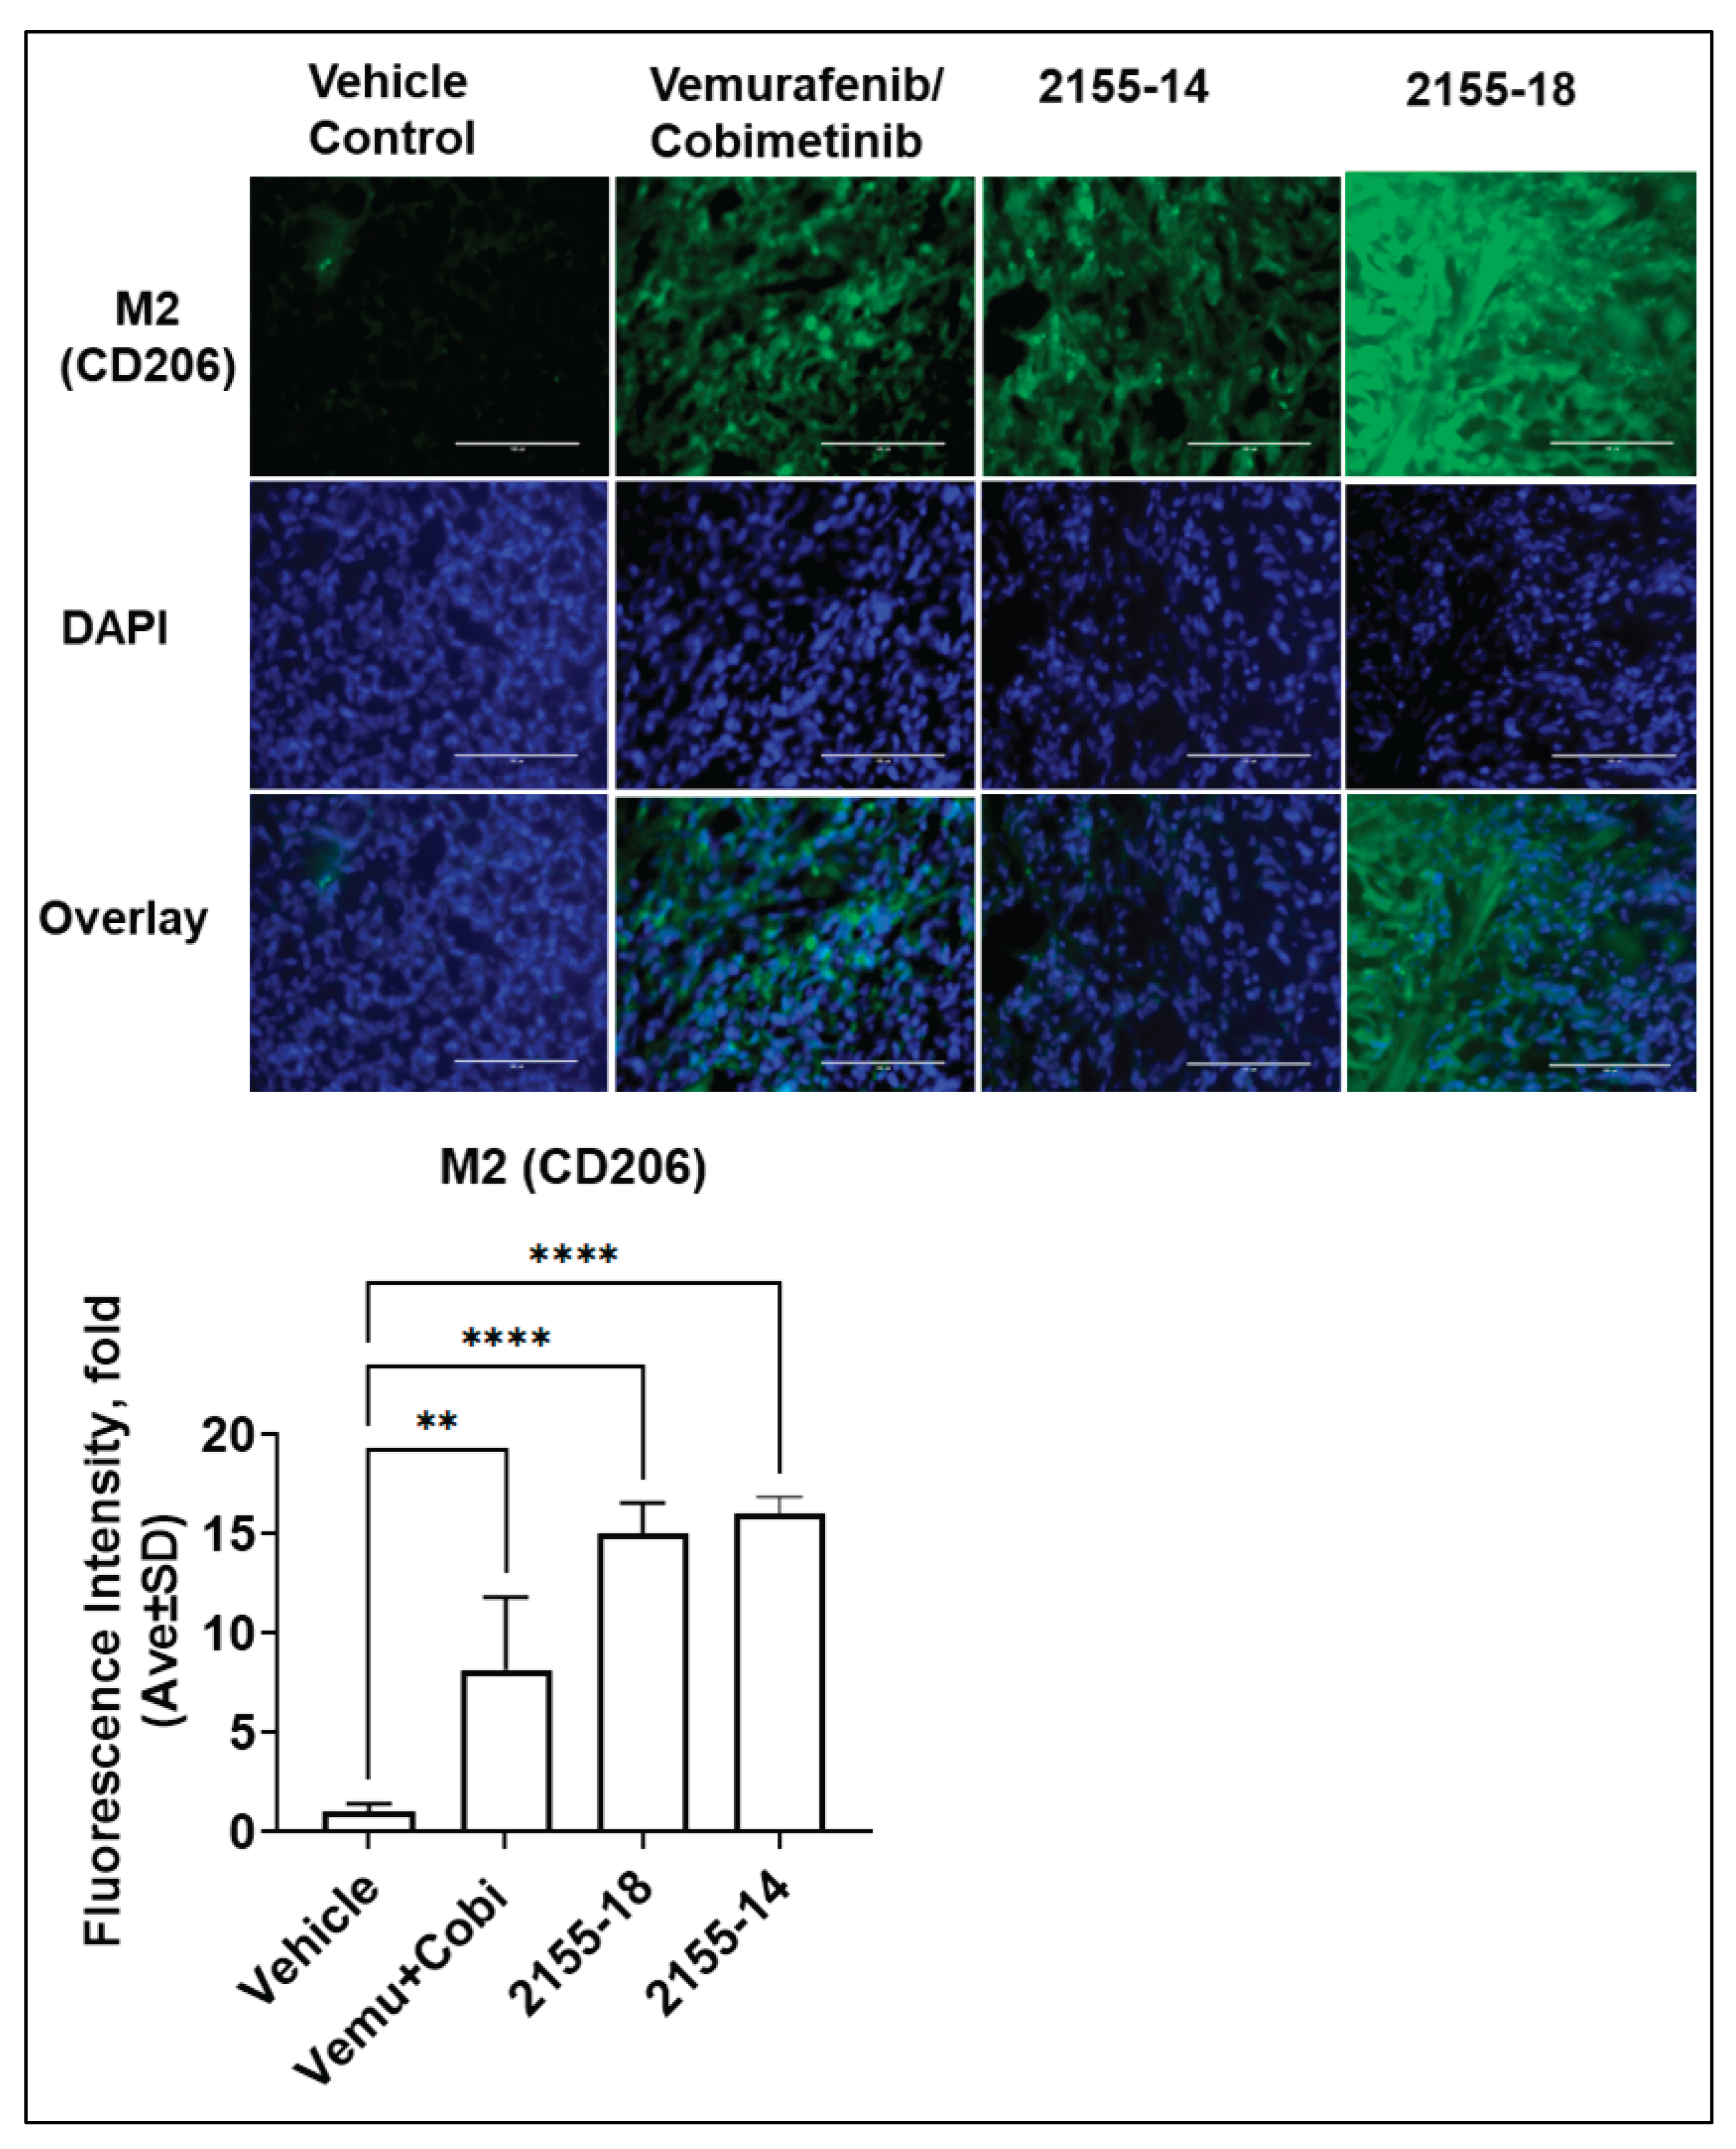
Figure 6.
Immunofluorescence staining for B cells demonstrates their infiltration in tumors treated with 2155-14 and 2155-18 (n = 3). Non-parametric student test was used. ns - no significance. * - p < 0.05, ** - p < 0.01, *** - p < 0.005, **** - p-value < 0.0001 (n=3). Images are captured by the Evos microscope, and representative images are shown. Scale bars: 200 µm.
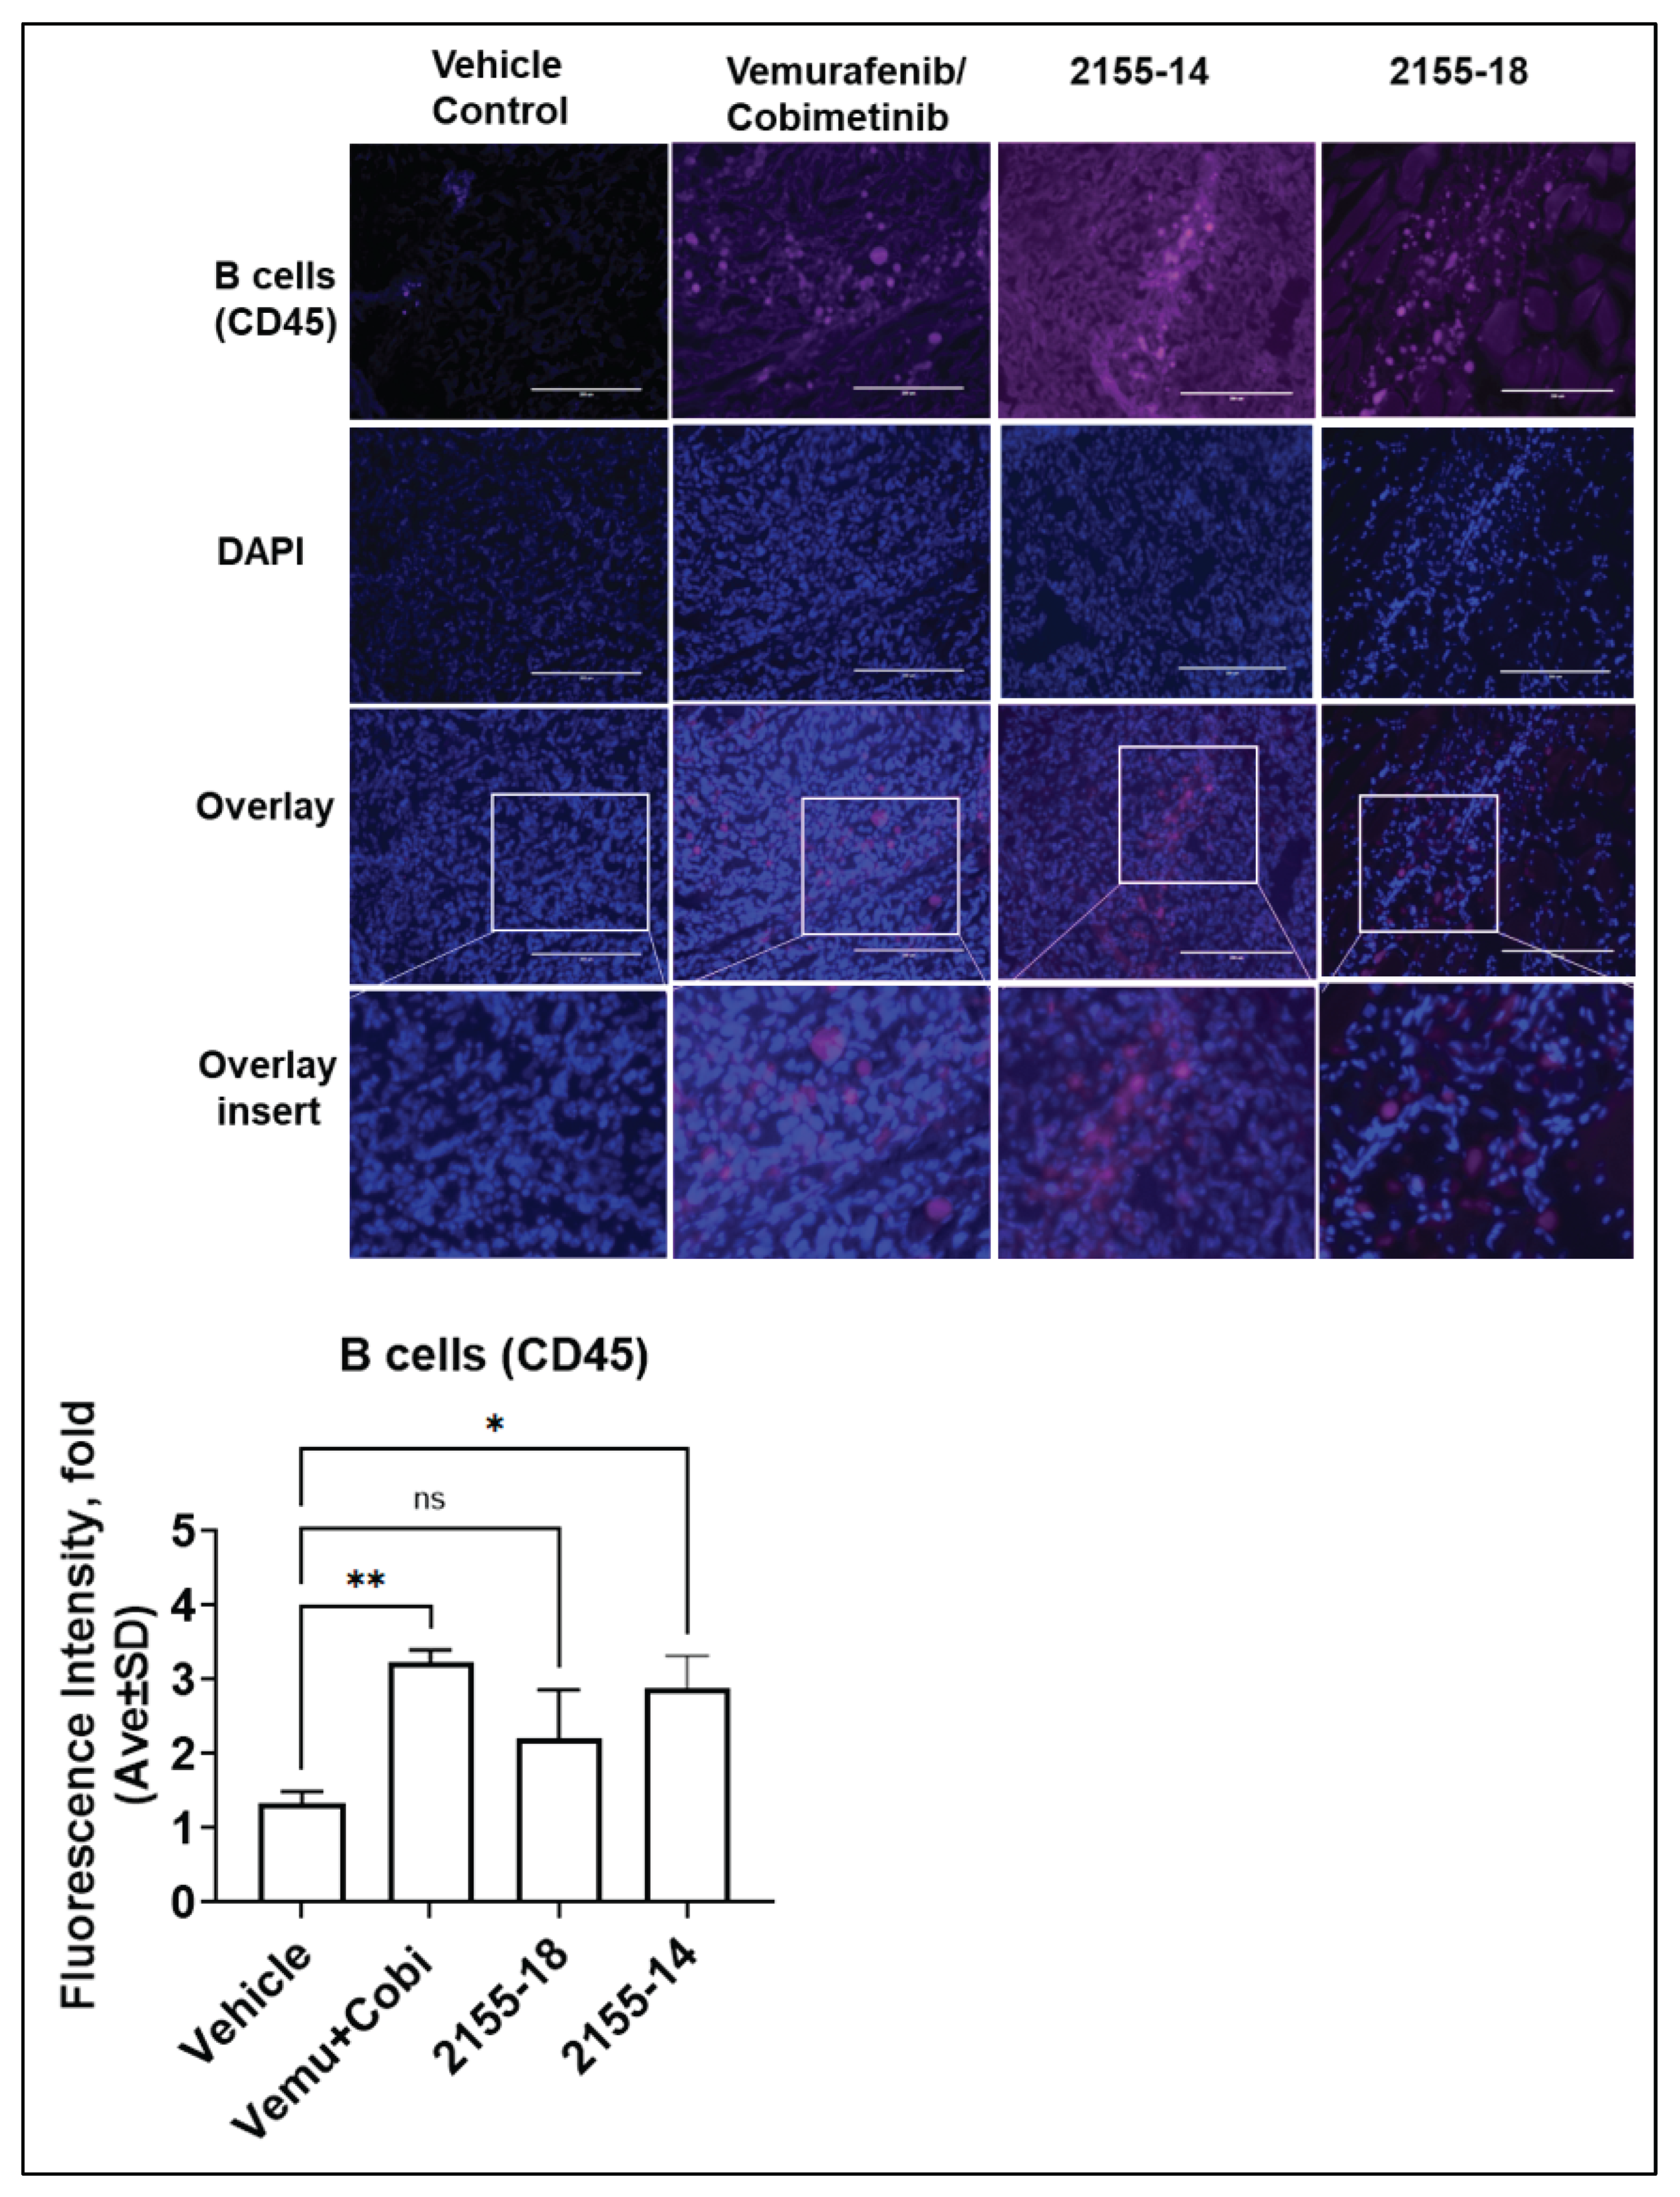
Figure 7.
Immunofluorescence staining for NK cells demonstrates their infiltration in tumors treated with 2155-14 and 2155-18 (n = 3). Non-parametric student test was used. ns - no significance. * - p < 0.05, ** - p < 0.01, *** - p < 0.005, **** - p-value < 0.0001 (n=3). Images are captured by the Evos microscope, and representative images are shown. Scale bars: 200 µm.
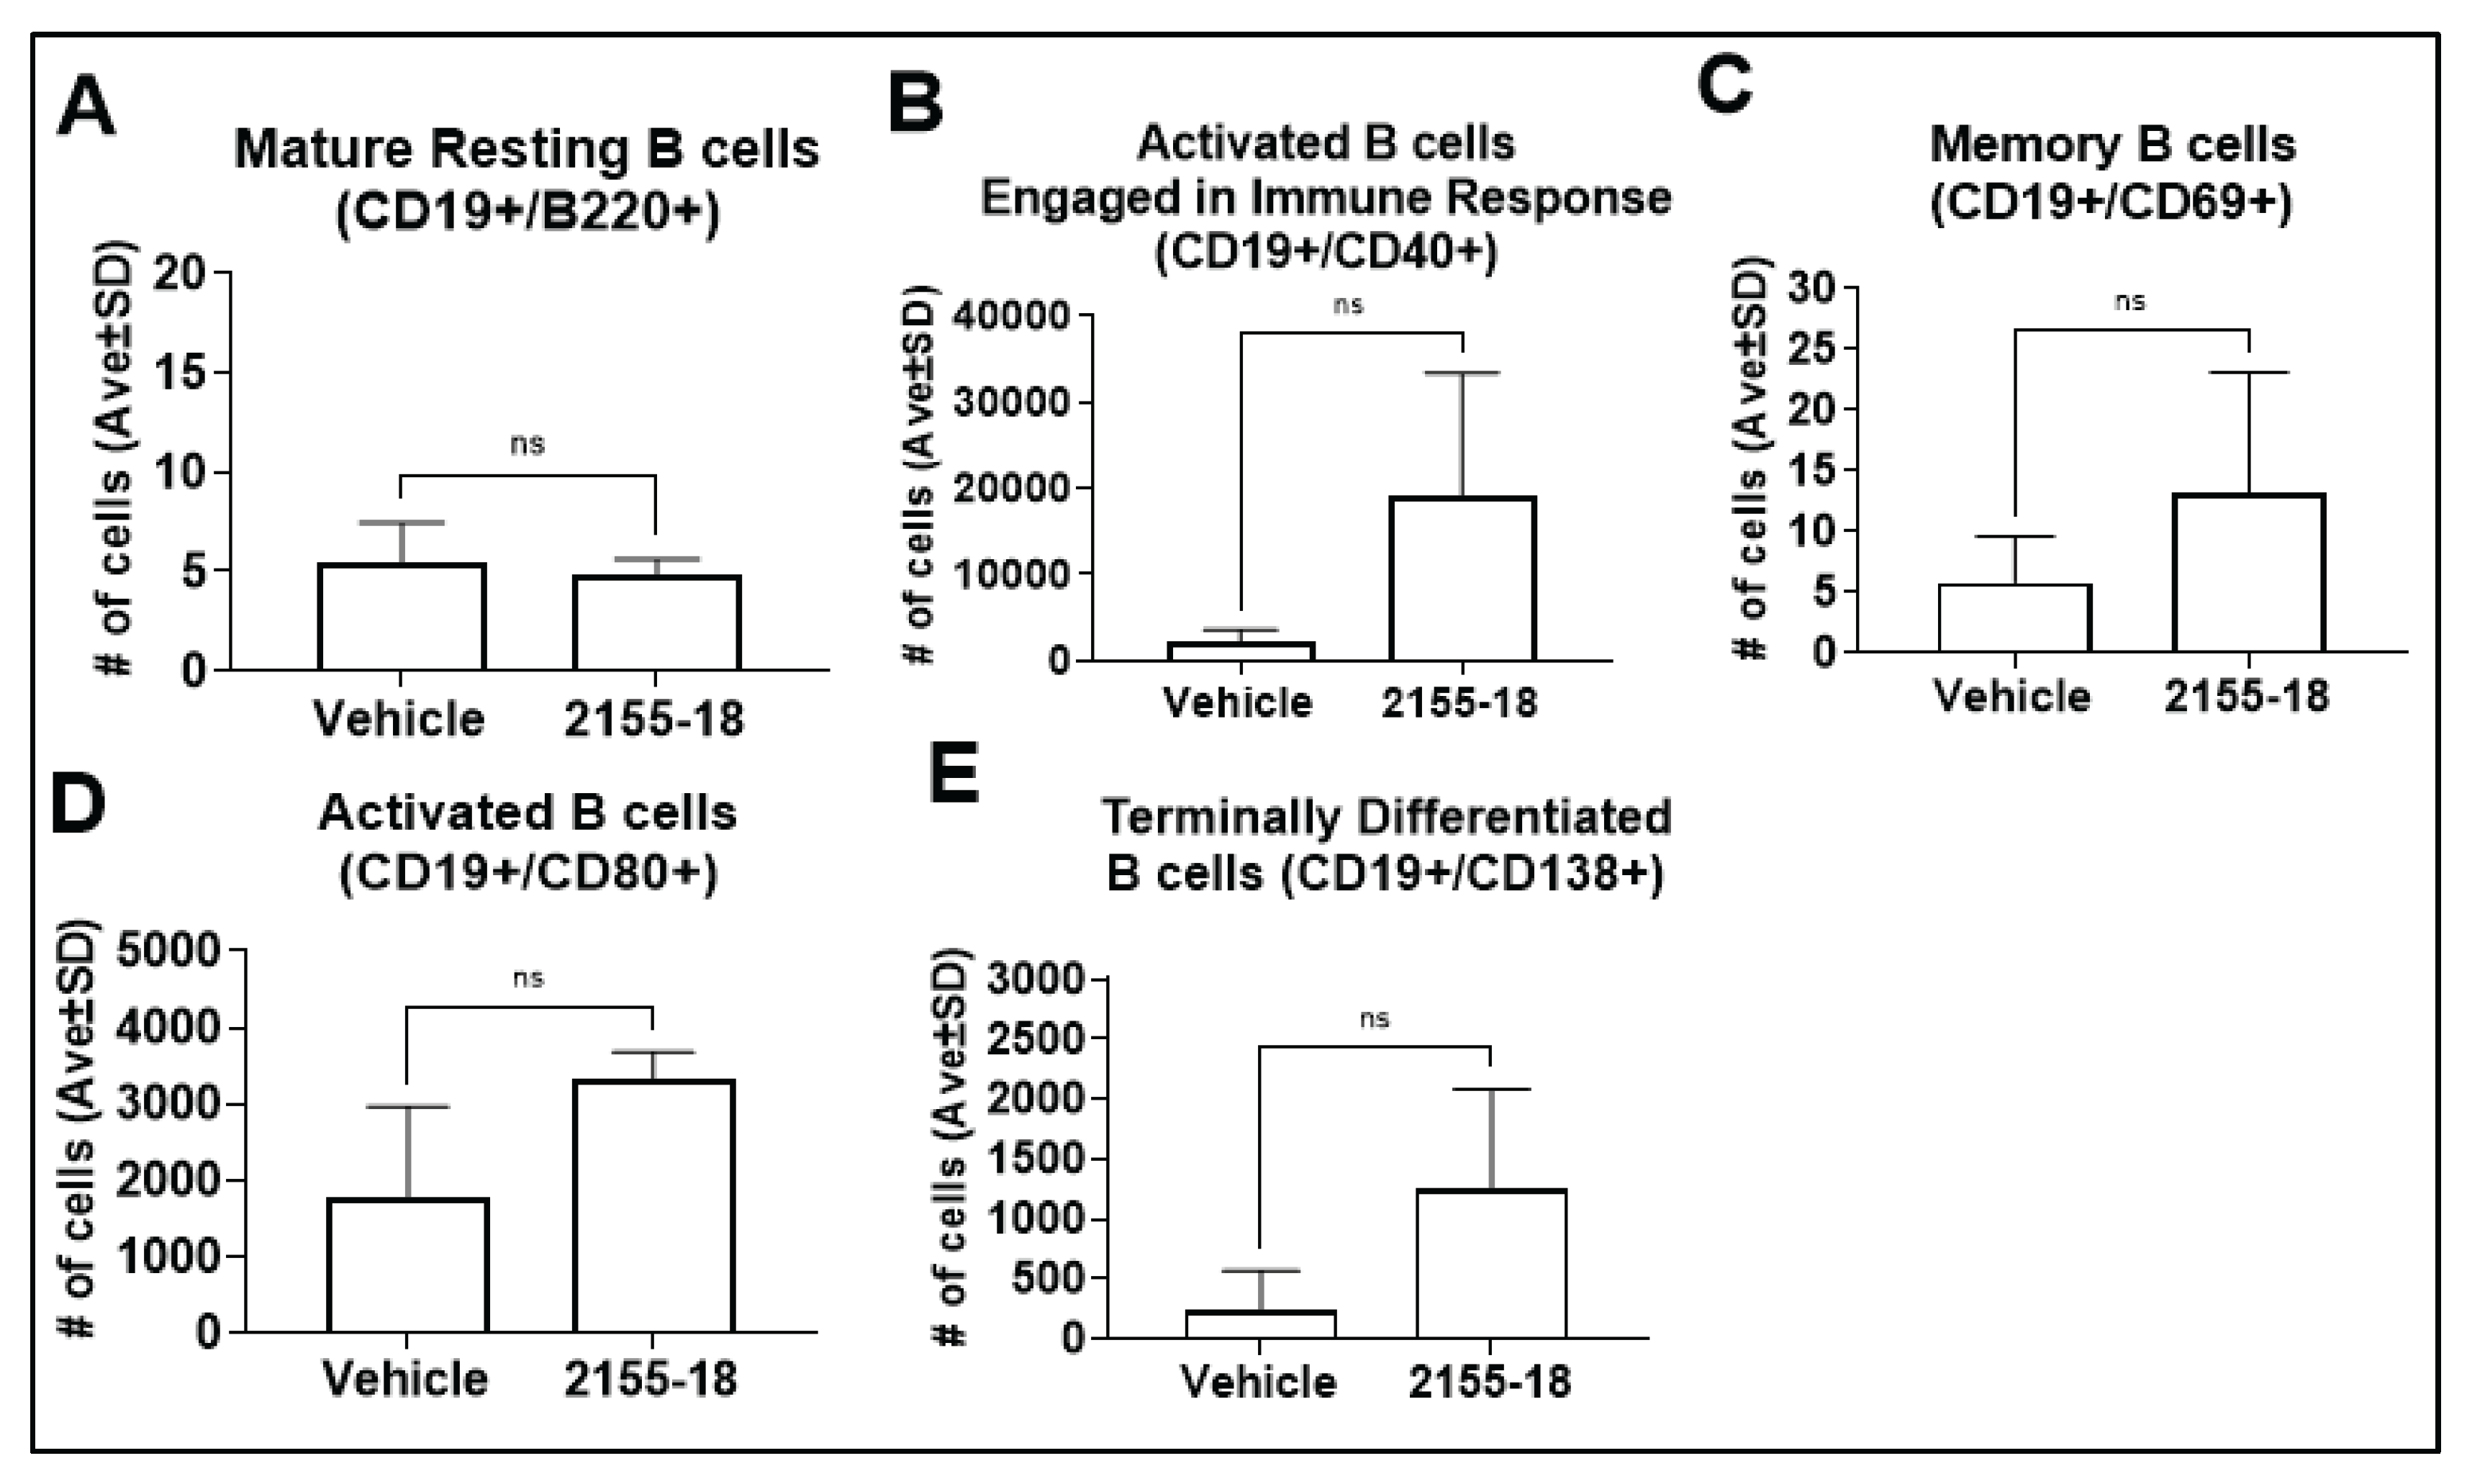
Despite an increase of B cell infiltration of tumors after 2155-18 treatment (Fig. 8C), we did not observe a statistically significant increase of CD19+B220+ (mature resting B cells), C19+CD40+ (activated B cells engaged in immune response), CD19+CD69+ (memory B cells), CD19+CD80+ (activated B cells), or CD19+CD138+ (terminally differentiated B cells) (Fig. 10).
Figure 8.
Flow cytometry quantification of immune cell presence in B16F10 tumors after treatment with 2155-14 or 2155-18. One-way analysis of variance (ANOVA) was used, followed by a Dunnett post hoc test. The data shown are the mean ± SD, n=5. ** - p < 0.01, * - p < 0.05, ns - no significance. 25mg/kg of 2155-14 and 2155-18 were used for 10 days to treat the mice.
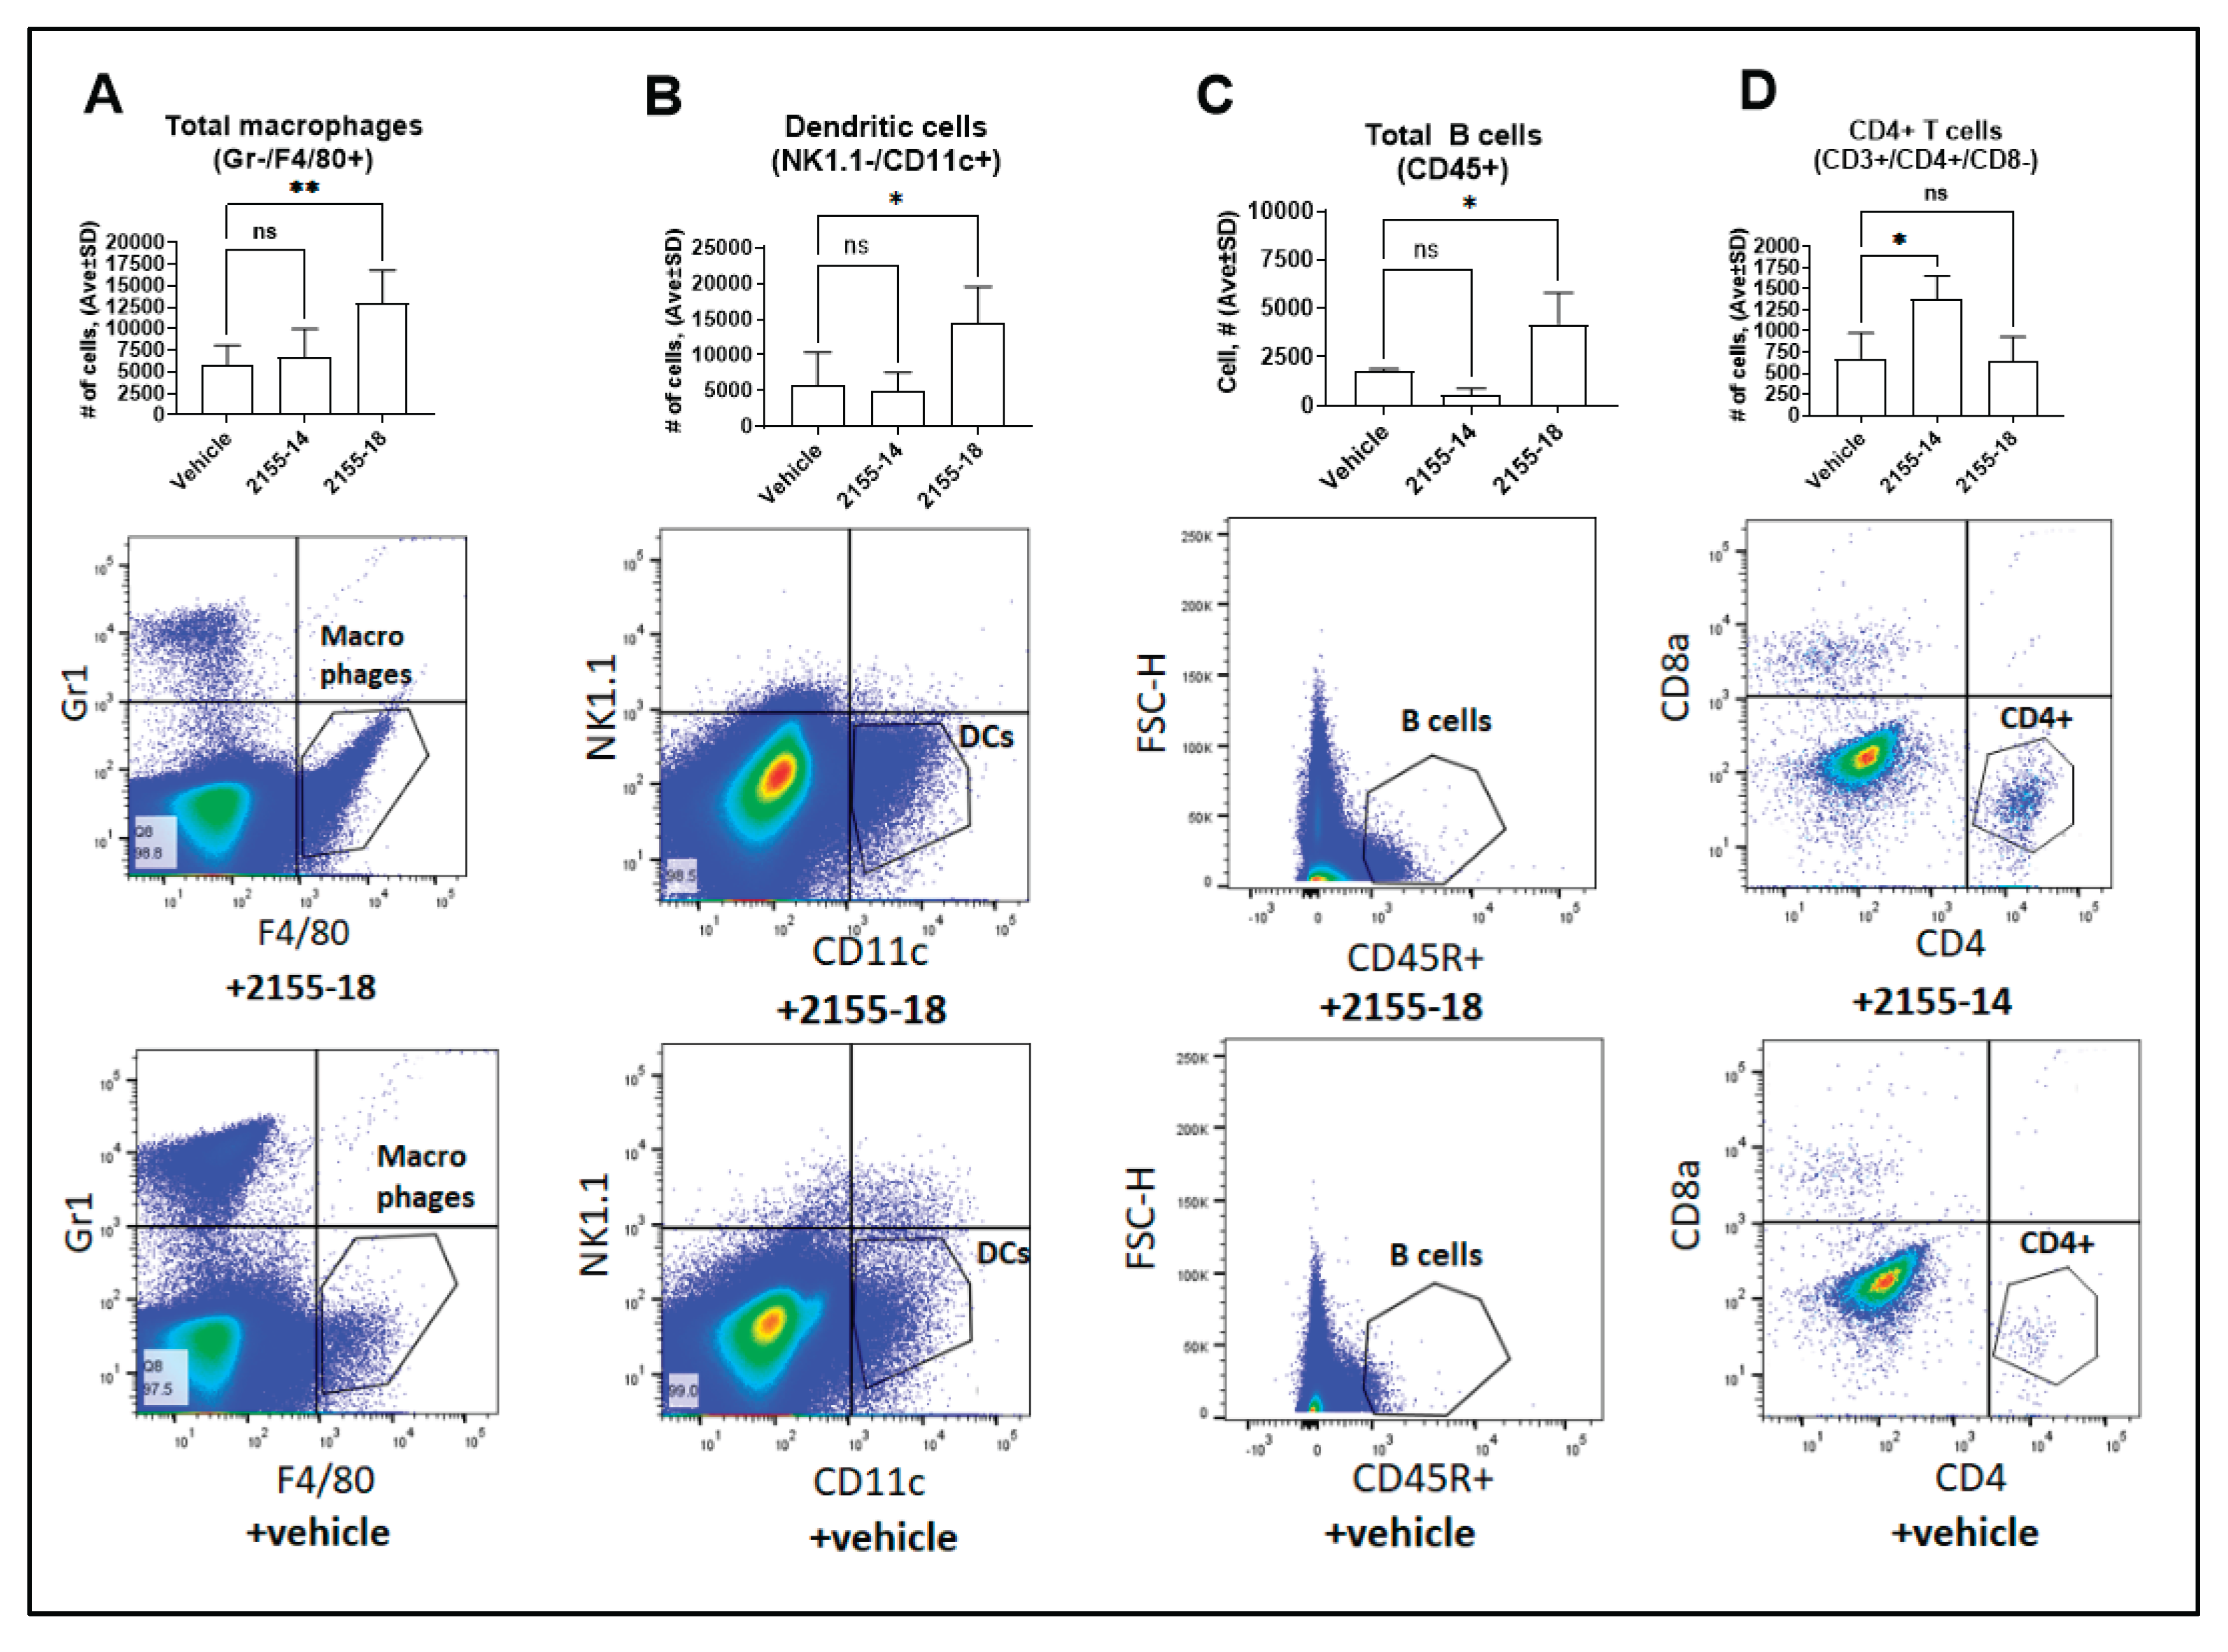
Figure 9.
Enumeration of B16F10 mouse melanoma-infiltrating immune cells based on the expression markers as indicated on the graphs above. The vehicle and 2155-18 treatment groups are indicated below bar graphs. Non-parametric student test was used. The data shown are the mean ± SD, n=5. * - p < 0.05, ns - no significance. 25mg/kg of 2155-18 was used for 10 days to treat the mice.
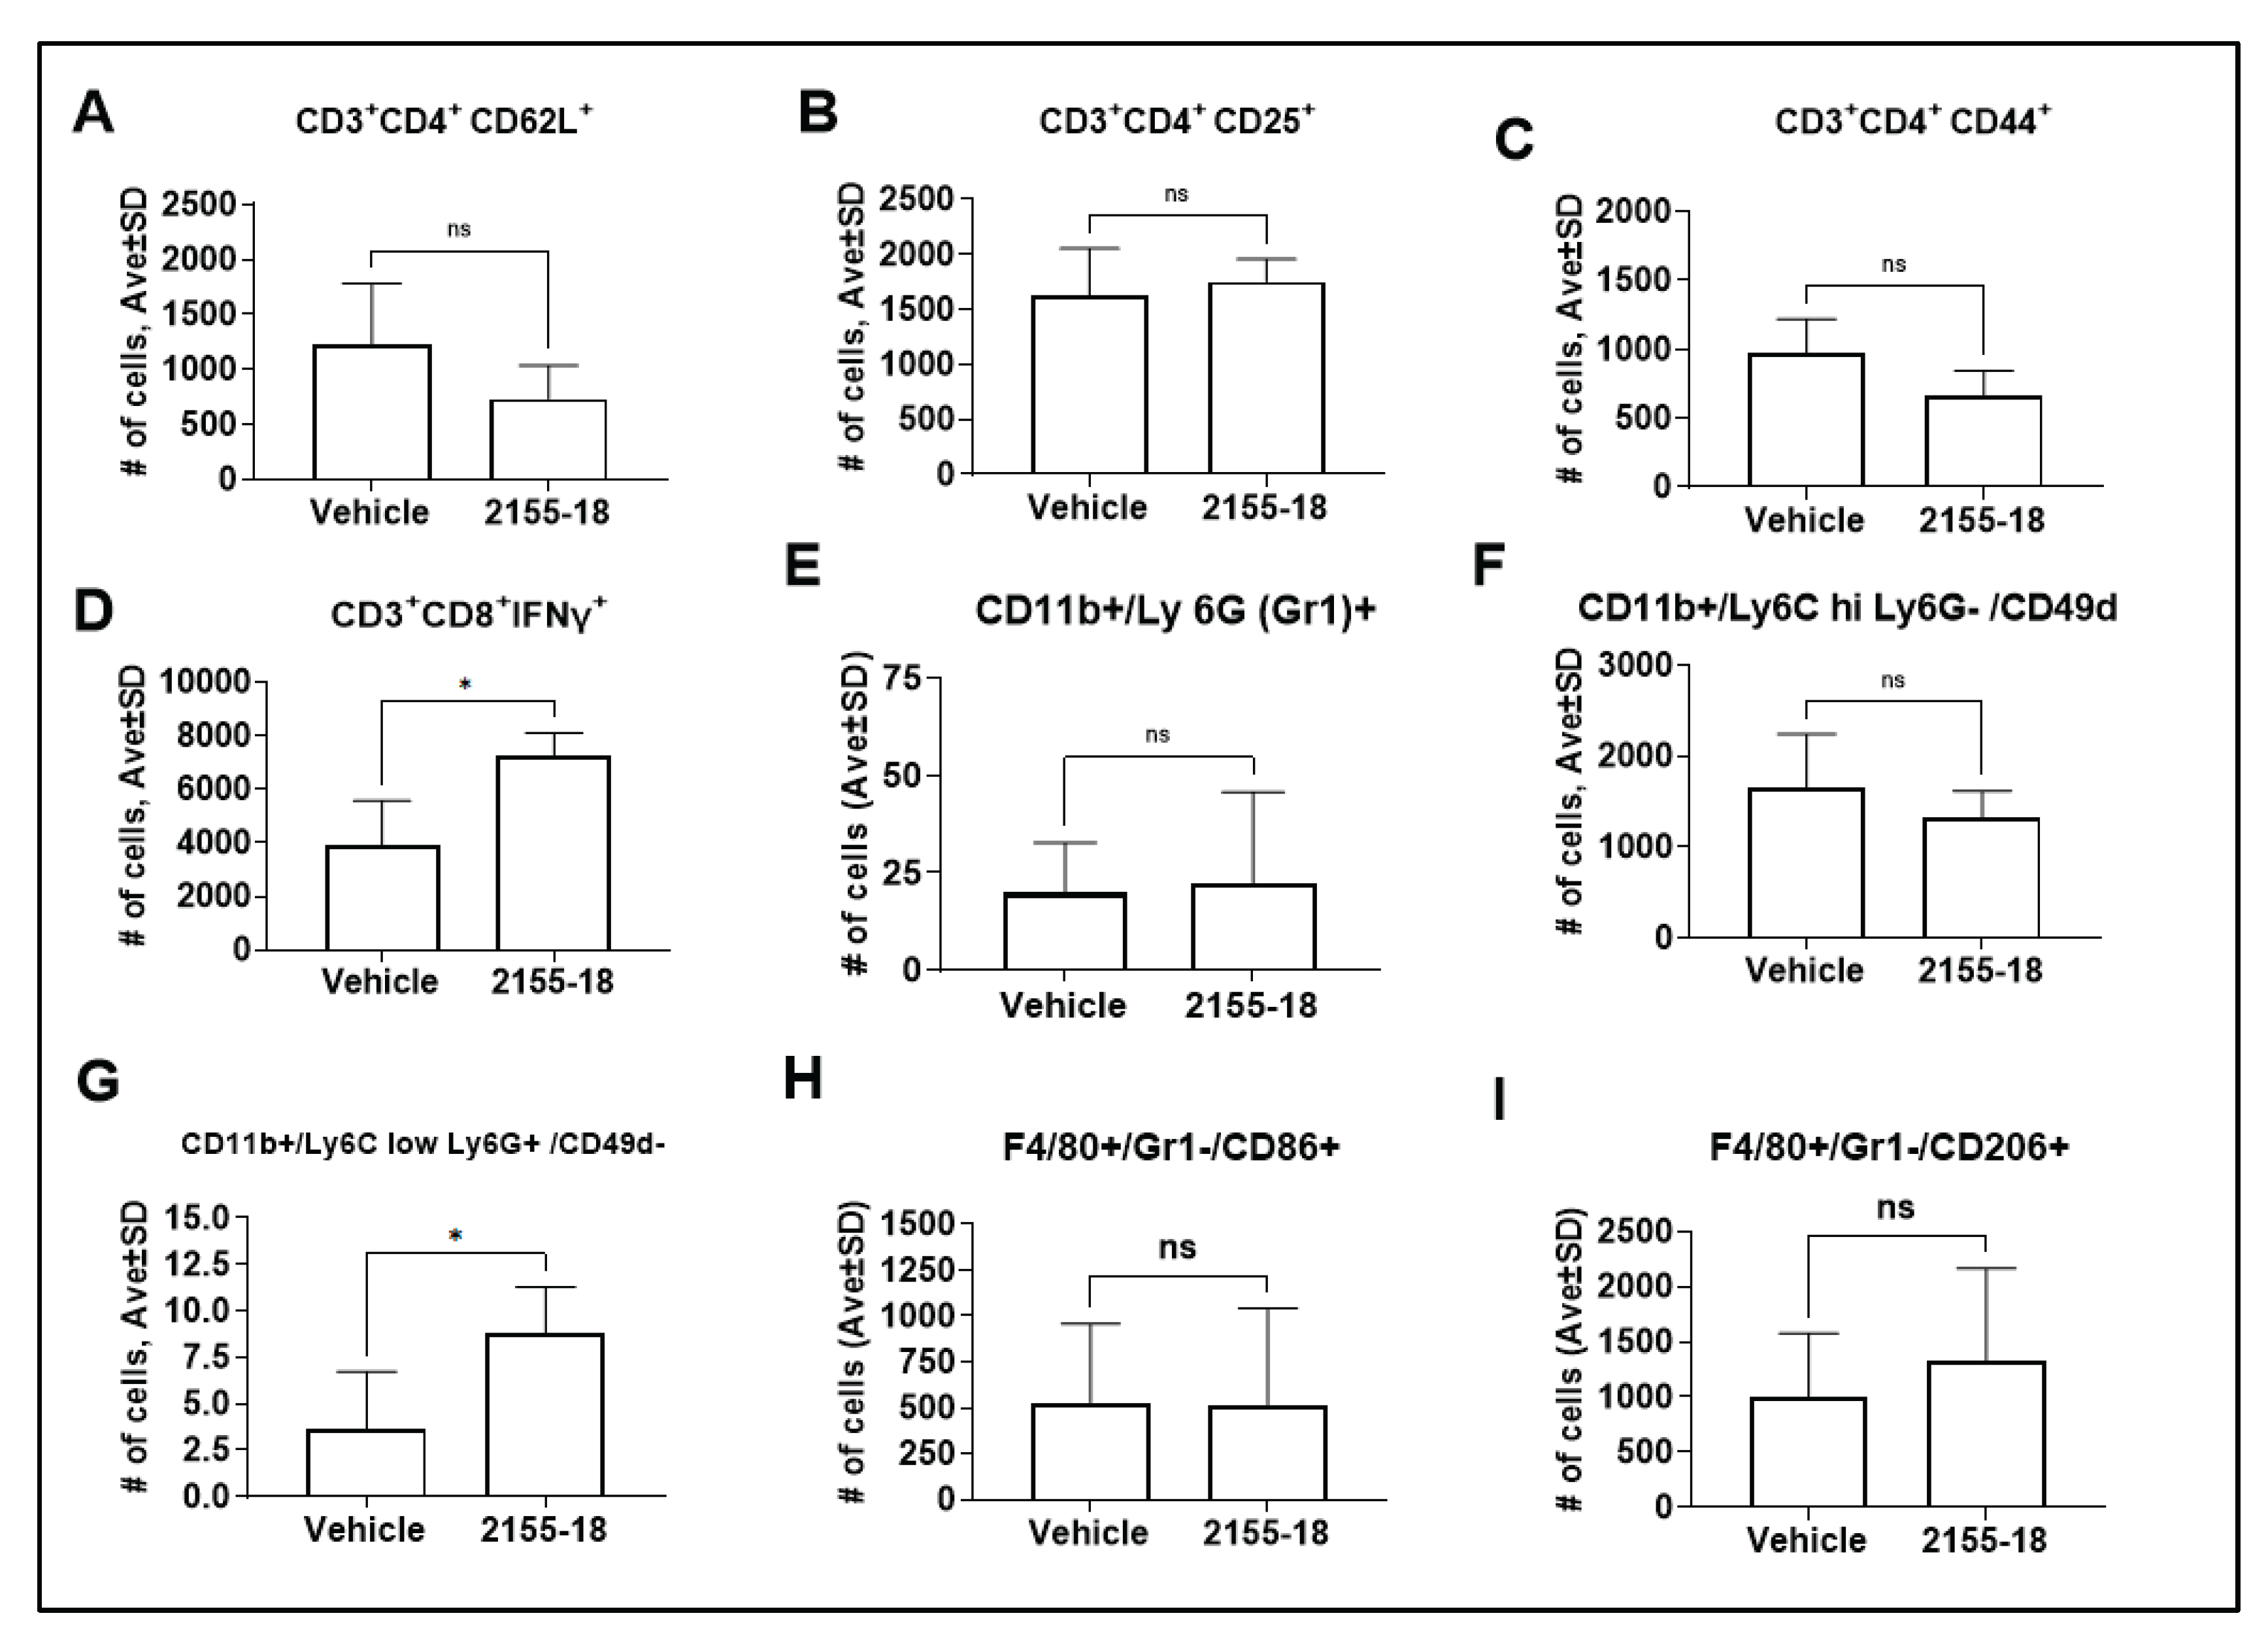
Figure 10.
Enumeration of B16F10 mouse melanoma-infiltrating B cells based on the expression markers as indicated on the graphs above. The vehicle and 2155-18 treatment groups are indicated below bar graphs. Non-parametric student test was used. The data shown are the mean ± SD, n=5, ns - no significance. 25mg/kg of 2155-18 was used for 10 days to treat the mice.
2155-18 treatment did not affect the expression of immune checkpoints BTLA, LAG3, PD-1, TIGIT, and TIM3 on CD8+ T cells (Fig. 11A,C,D,E,F, respectively), however, CTLA-4 was increased (Fig. 11B). There was no effect on any of the immune checkpoints on CD4+ cells (Fig. 11G-M).
2155-14 treatment did not affect the expression levels of CD3+CD4+CD62+, CD3+CD4+CD25+, and CD3+CD4+CD44+ cells (Fig. 12A-C), indicating a lack of activation of CD4 T cells. Also, there was no increase in IFN-γ expression in CD4⁺ T cells (Fig. 12D), indicating no activation of cytotoxic T cells due to 2155-14 treatment despite an increase in total CD4+ T cells (Fig. 8D). The immunosuppressive CD11b+ cells expressing Ly6G and Ly6C were not significantly affected by 2155-14 treatment (Fig. 12E-G). Much like in the case with 2155-18, treatment with 2155-14 did not affect M1 or M2 numbers (Fig. 12H and I, respectively). However, ratio of M1/M2 decreased after 2155-14 treatment and increased after 2155-18 treatment (Fig. 12J).
Figure 11.
Enumeration of immune checkpoints on B16F10 mouse melanoma-infiltrating T cells based on the expression markers as indicated in the graphs above. The vehicle and 2155-18 treatment groups are indicated below bar graphs. Non-parametric student test was used. The data shown are the mean ± SD, n=5, ns - no significance. 25mg/kg of 2155-18 was used for 10 days to treat the mice.
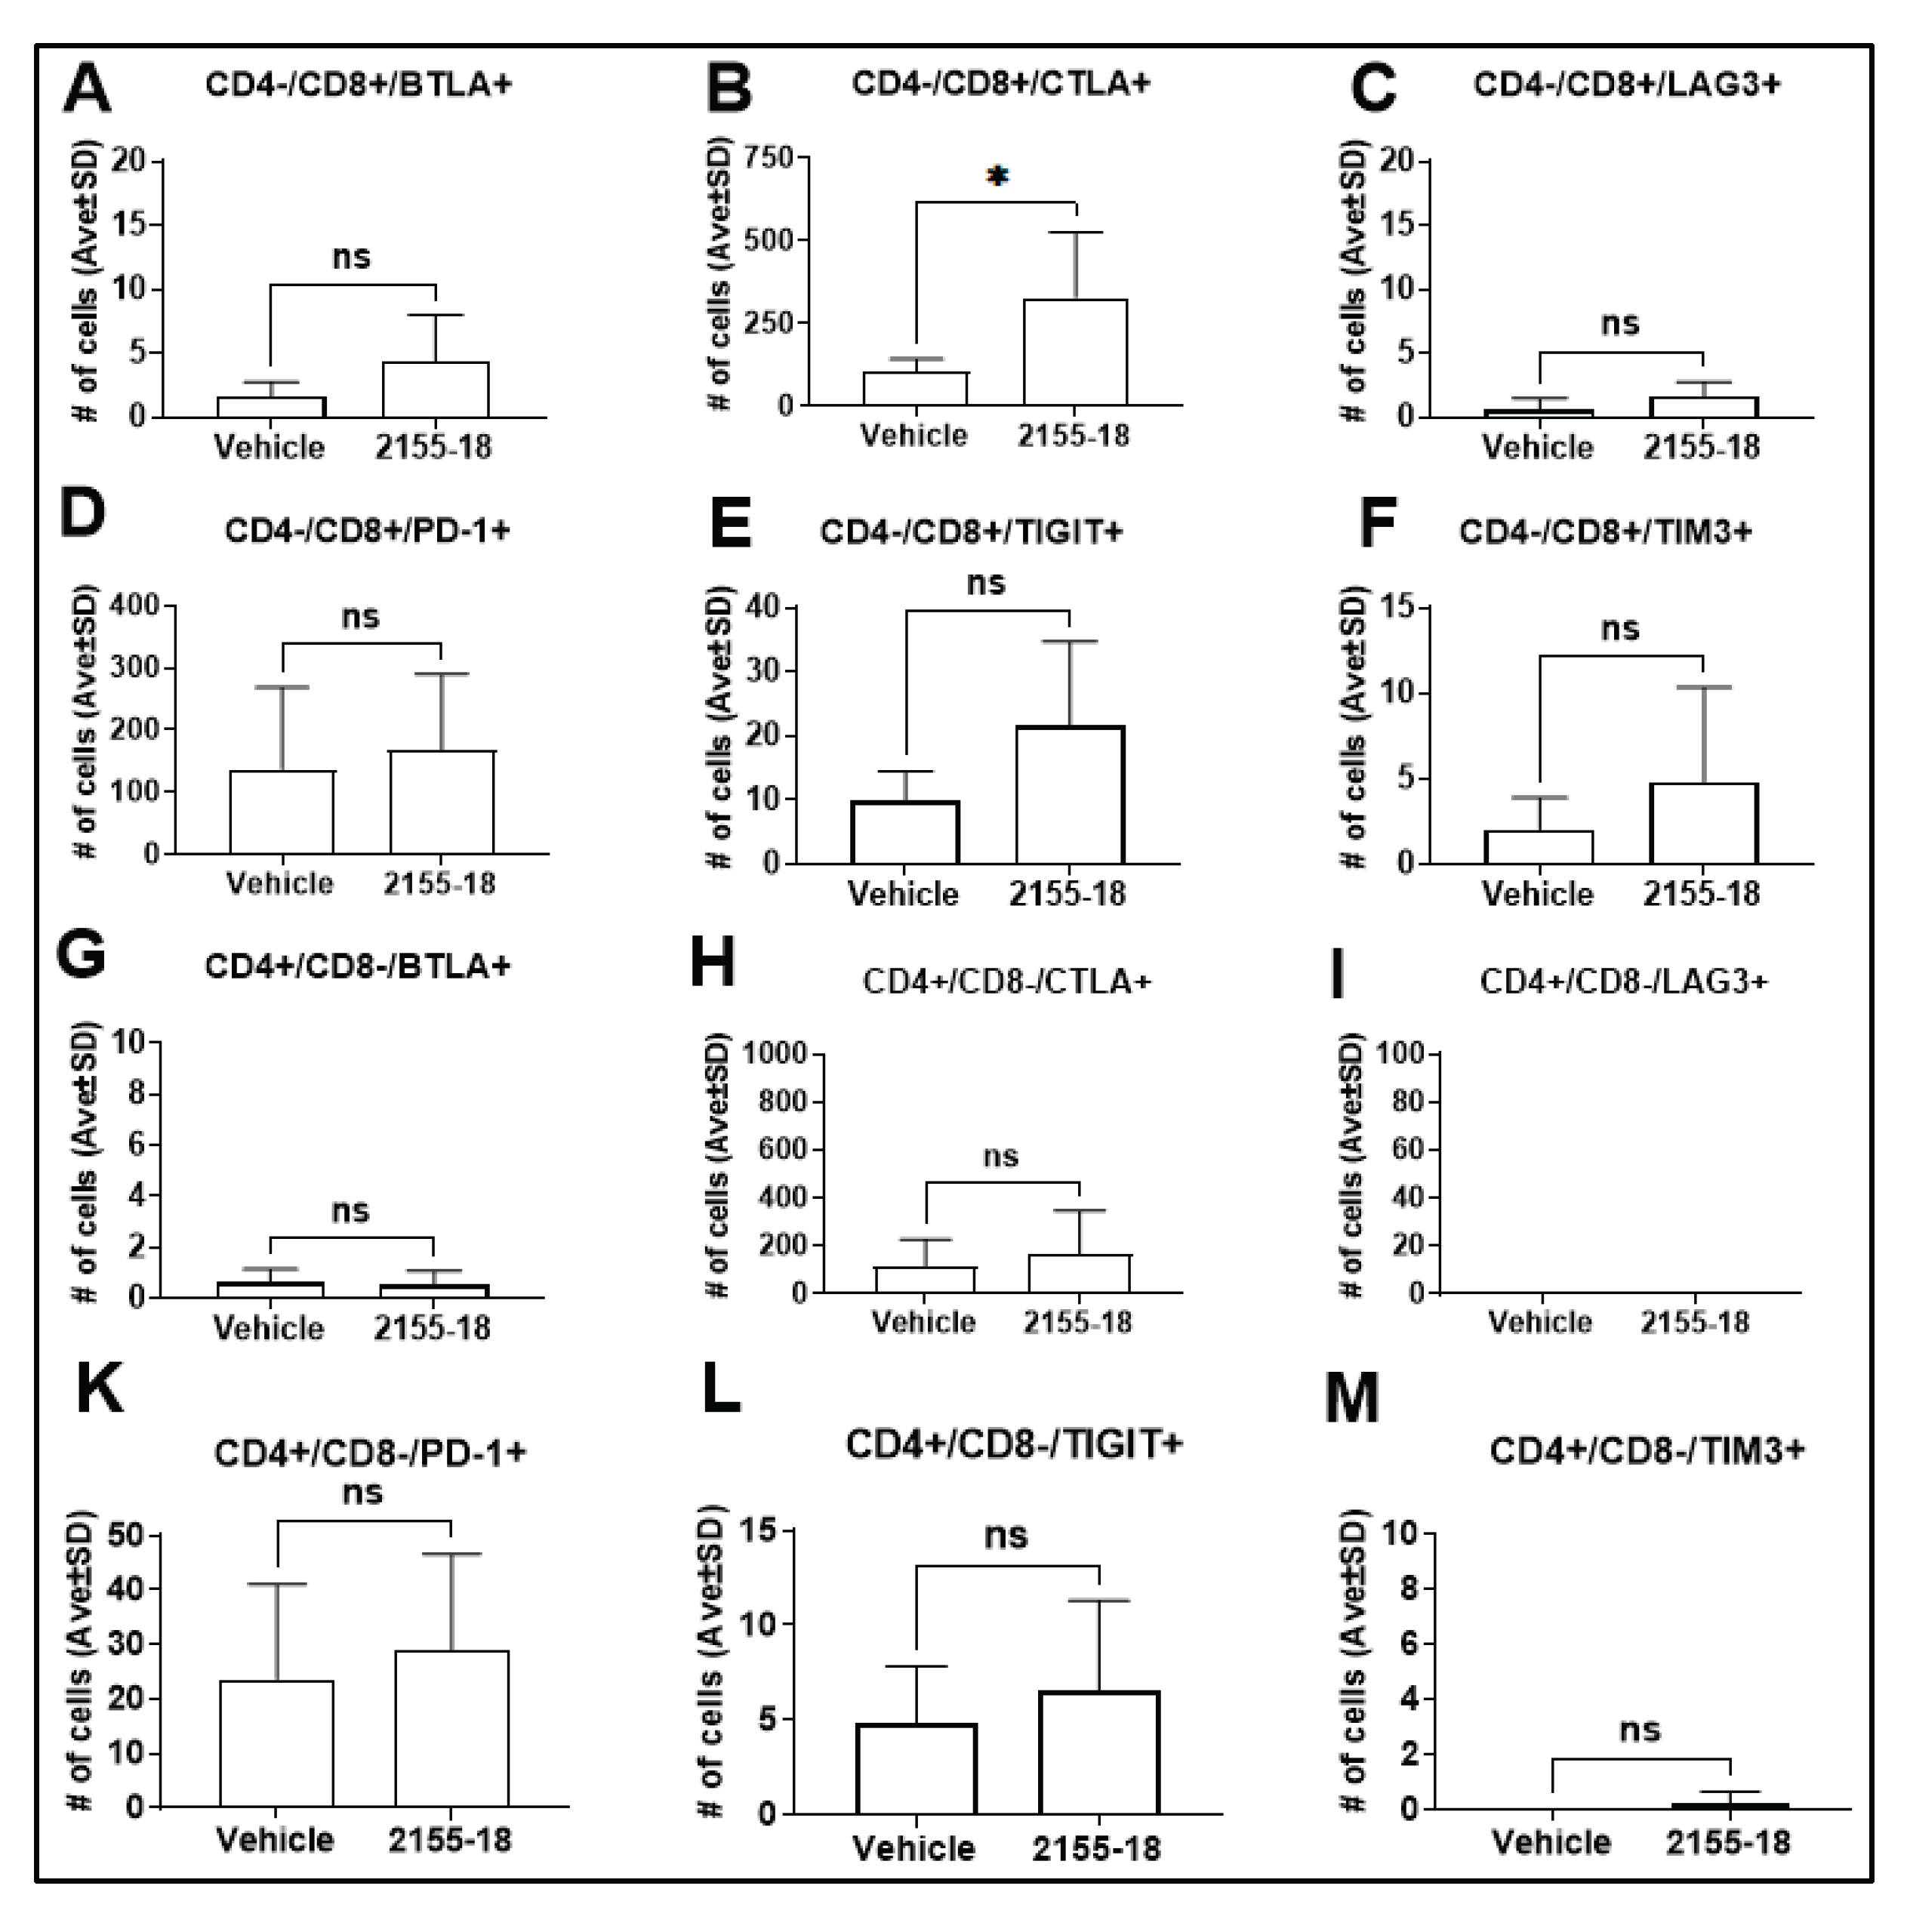
Figure 12.
Enumeration of B16F10 mouse melanoma-infiltrating immune cells based on the expression markers as indicated on the graphs above. The vehicle and 2155-14 treatment groups are indicated below bar graphs. Non-parametric student test was used. The data shown are the mean ± SD, n=5. * - p < 0.05, ns - no significance. 25mg/kg of 2155-14 was used for 10 days to treat the mice.
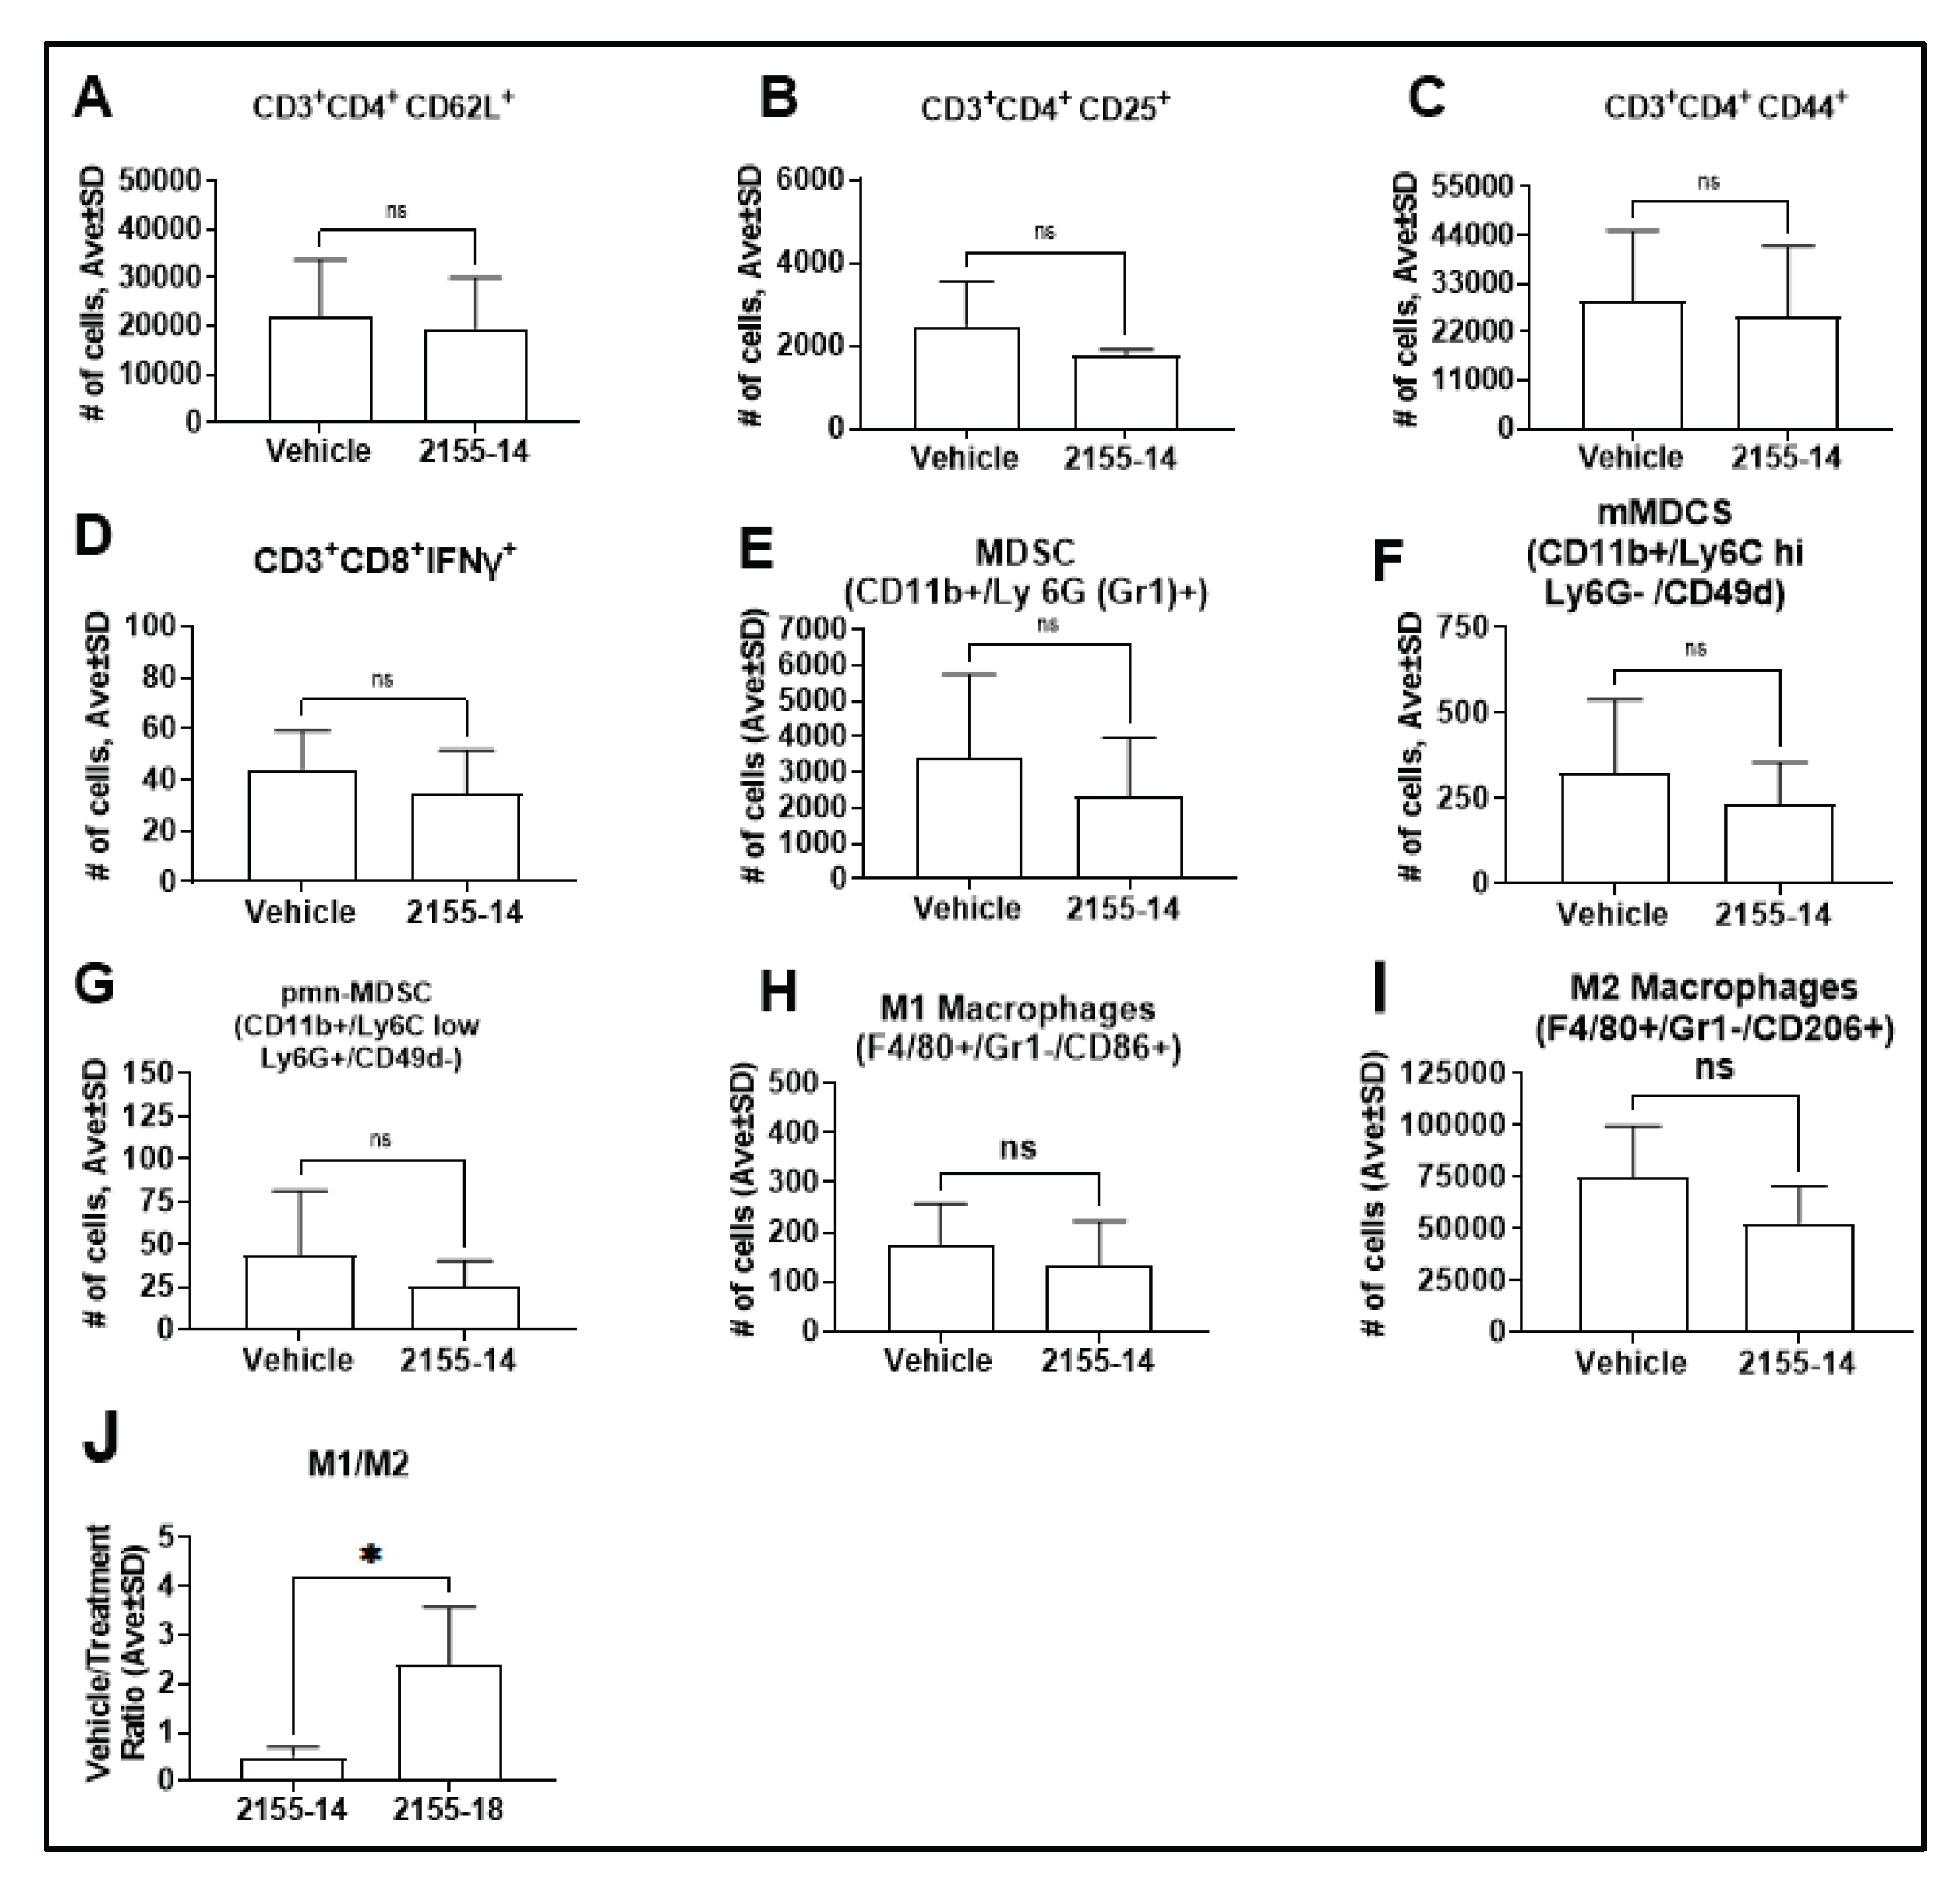
Figure 13.
Enumeration of B16F10 mouse melanoma-infiltrating B cells based on the expression markers as indicated on graphs above. The vehicle and 2155-14 treatment groups are indicated below bar graphs. Non-parametric student test was used. The data shown are the mean ± SD, n=5, ns - no significance. 25mg/kg of 2155-14 was used for 10 days to treat the mice.
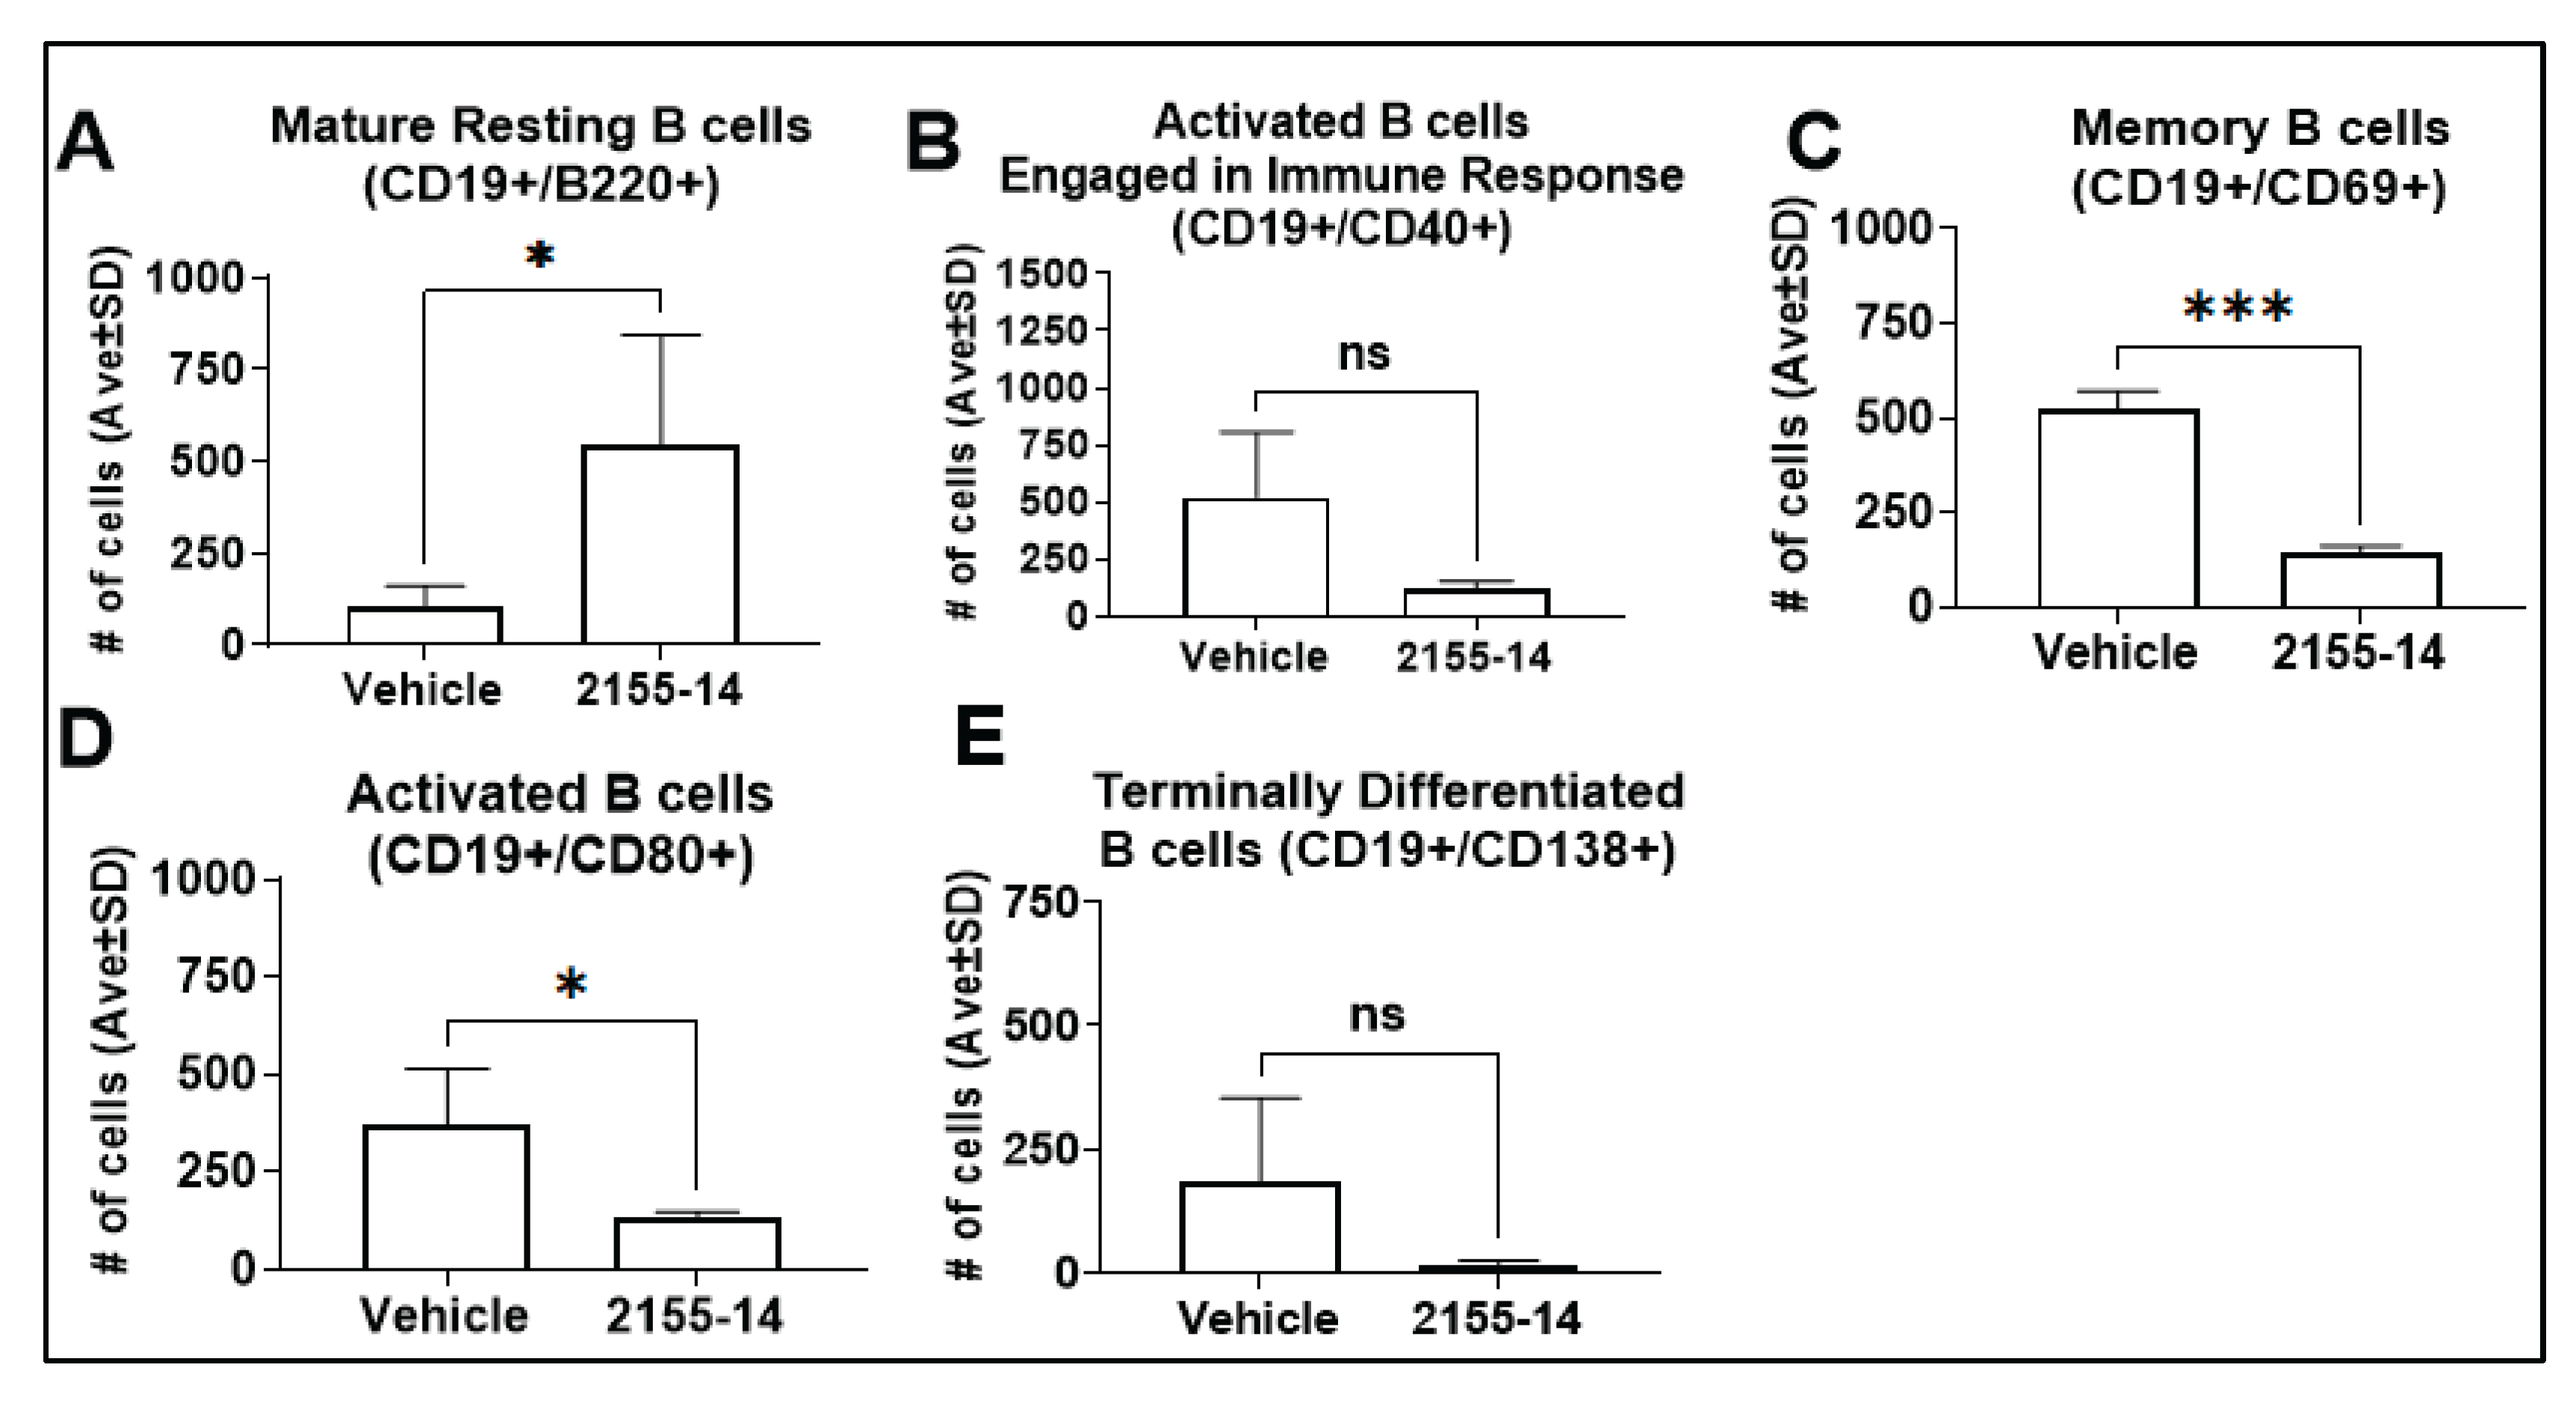
We observed a statistically significant increase of CD19+B220+ (mature resting B cells, Fig. 13A), CD19+CD69+ (memory B cells, Fig. 13C), and CD19+CD80+ (activated B cells, Fig. 13D), C19+CD40+ (activated B cells engaged in immune response), or CD19+CD138+ (terminally differentiated B cells) were not affected (Fig. 13B and E, respectively).
Figure 14.
Enumeration of immune checkpoints on B16F10 mouse melanoma-infiltrating CD4 T cells based on the expression markers as indicated in the graphs above. The vehicle and 2155-14 treatment groups are indicated below bar graphs. Non-parametric student test was used. The data shown are the mean ± SD, n=5, ns - no significance. 25mg/kg of 2155-14 was used for 10 days to treat the mice.
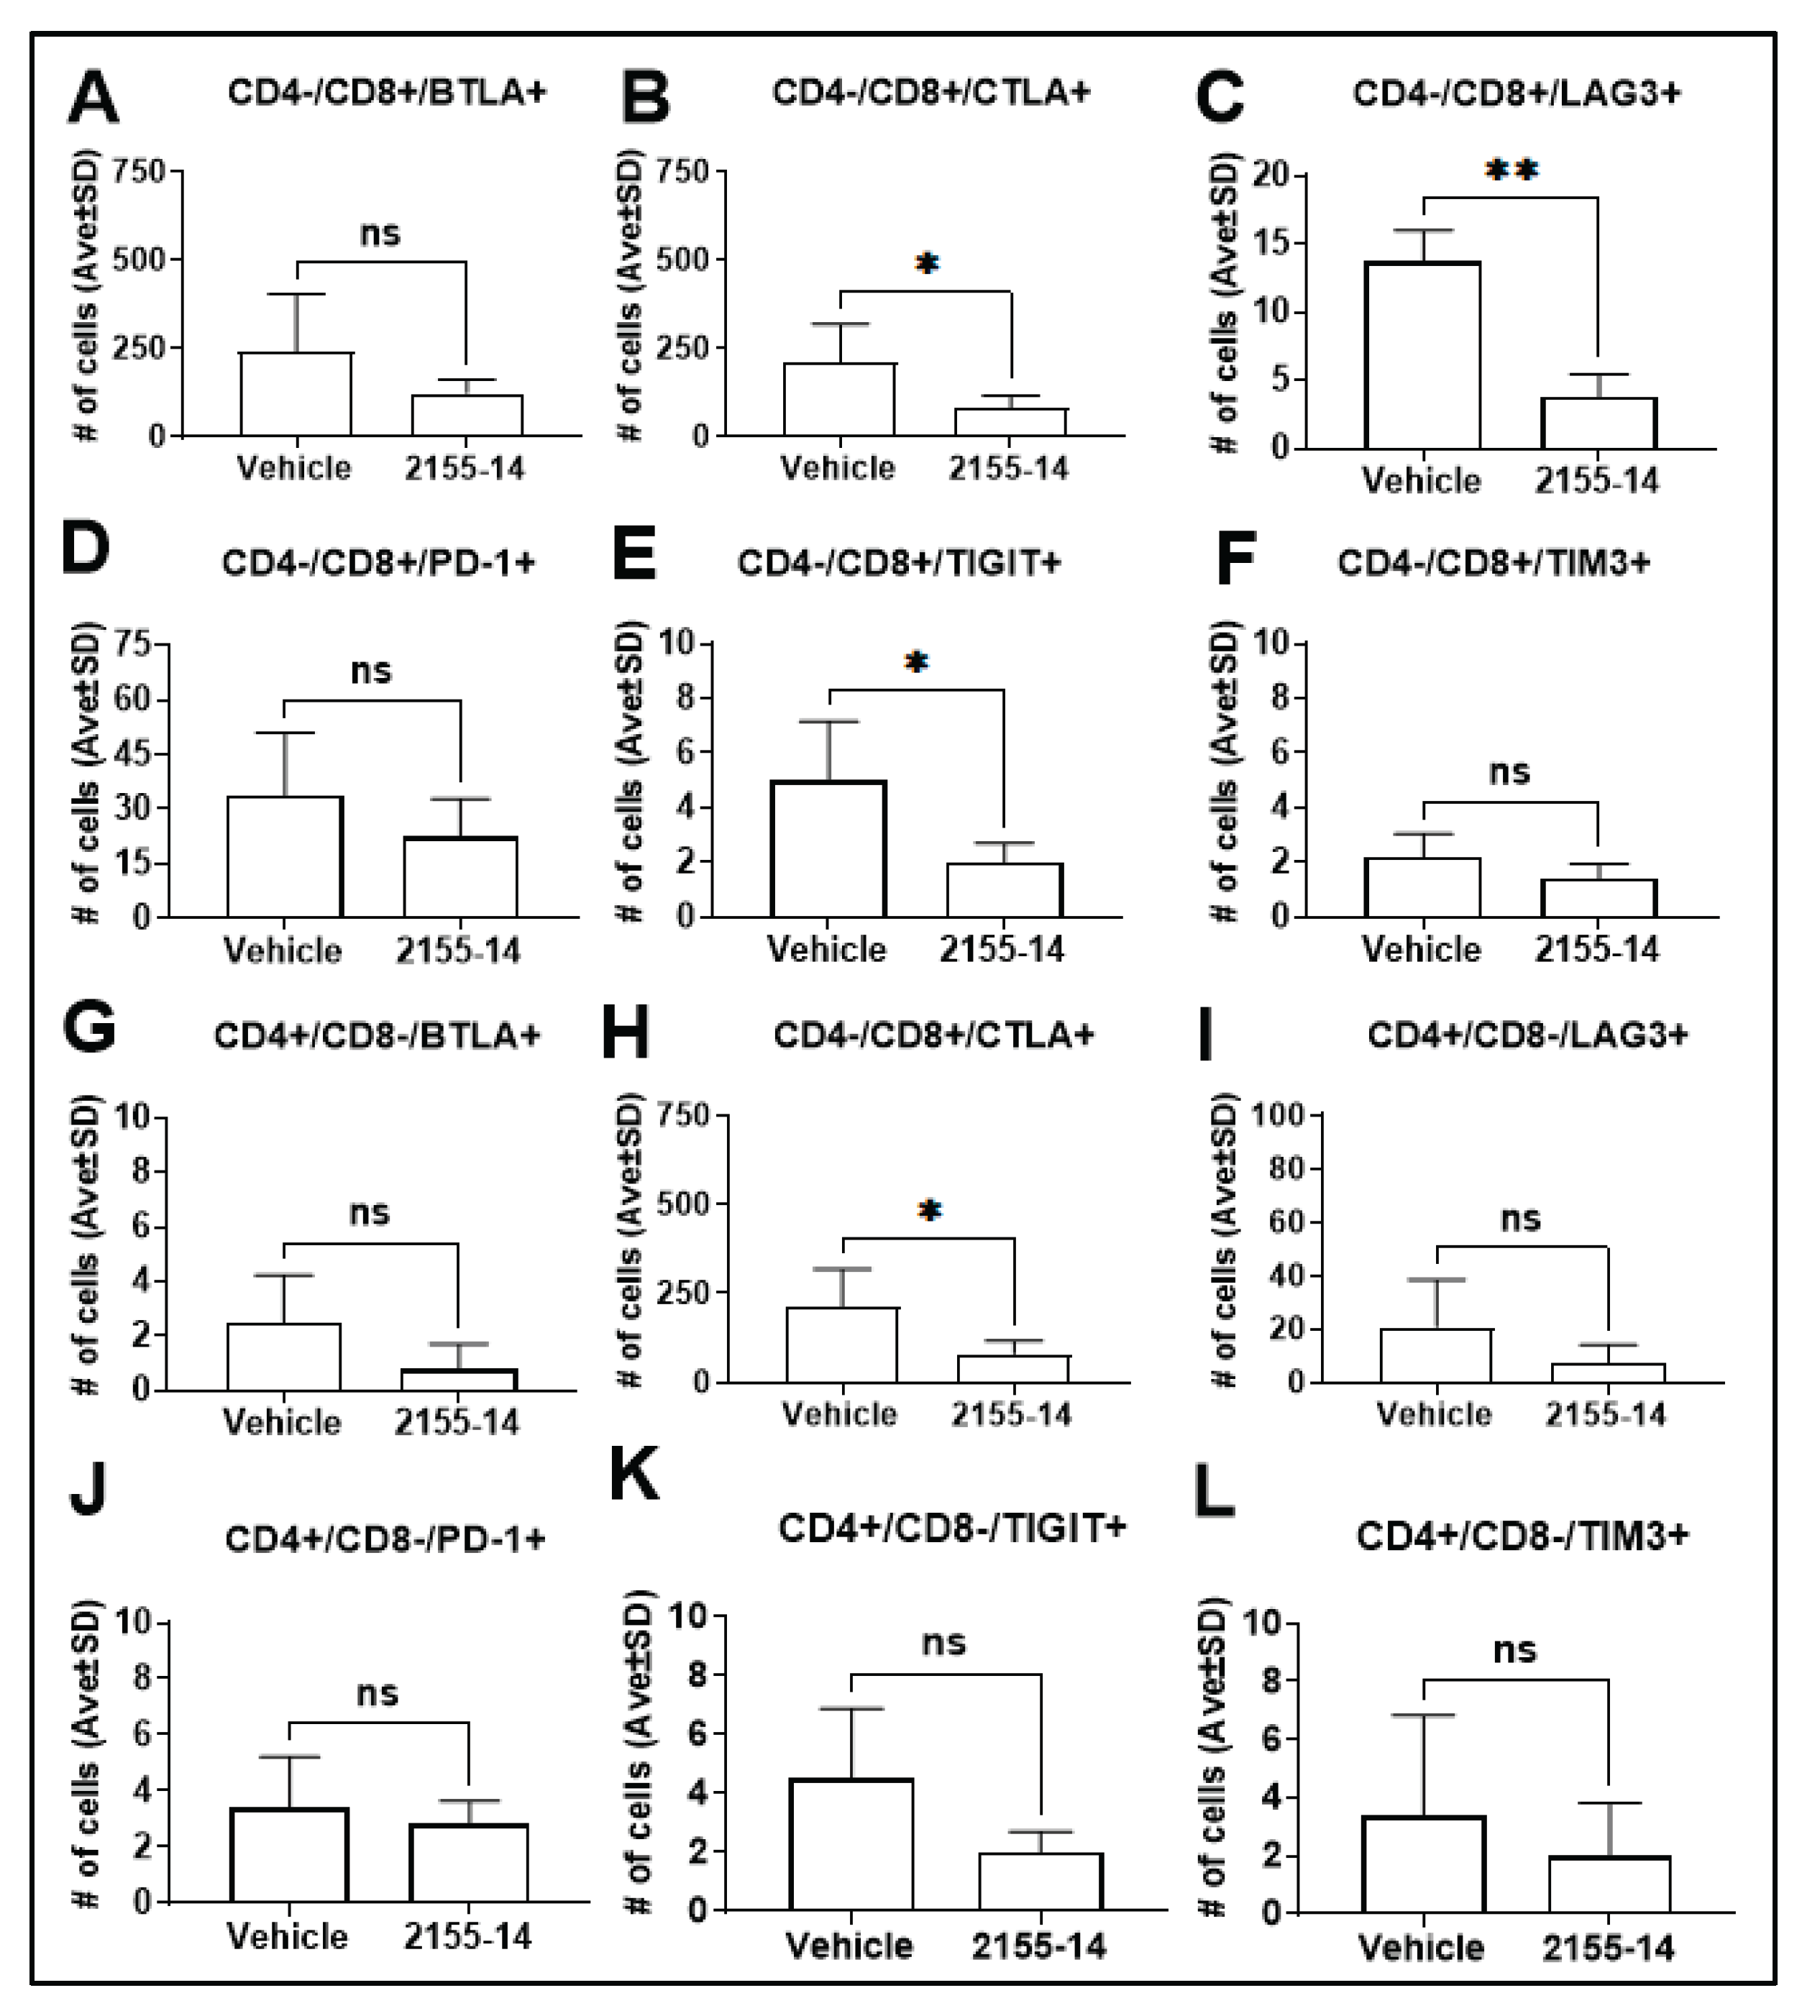
2155-14 treatment decreased the expression of CTLA-4, LAG-3, and TIGIT on CD8+ T cells (Fig. 14B, C, and D, respectively), and CTLA-4 on CD4+ T cells (Fig. 14H).
4. Discussion
The results presented in this study demonstrate the efficacy of two novel anti-melanoma compounds, 2155-14 and 2155-18, in A375R BRAFi-resistant cell line-derived xenograft model. Additionally, treatment of the syngeneic B16F10 melanoma model led to changes in the profile of immune cell types in tumor tissues. Tumor-infiltrating B cells (TIL-B) are believed to be prognosticators of positive responses to melanoma immunotherapy [23] because they can modulate T cell activity. However, some of the subsets of B cells correlate with immune-related adverse events (irAEs). 2155-14 and 2155-18 demonstrated differences in their effects on B cells. 2155-14 increased mature resting B cells, while decreasing memory and activated B cells. This immune profile is not considered beneficial for melanoma patients and is typically associated with late-stage melanoma [23]. While the 2155-18 effect did not reach statistical significance, there was an increase in activated, memory, and terminally differentiated B cells, which is linked to a stronger anti-tumor immune response and is often linked to a more favorable prognosis and improved outcomes from immunotherapy [23].
Treatment with 2155-18, but not 2155-14, increased infiltration of macrophages. It is known that M1 macrophages have anti-tumor activity while M2 macrophages have pro-tumor activity; therefore, M1/M2 ratio is a useful parameter to estimate the effect of macrophages on tumor microenvironment (TME) [24]. M1/M2 ratio for the tumors treated with 2155-14 was 0.5, suggesting an overall pro-tumor anti-inflammatory effect of macrophages. In case of 2155-18, M1/M2 ratio was 2.4, suggesting an overall anti-tumor pro-inflammatory effect of macrophages.
Expression of immune checkpoints was mostly unaffected by the treatment with 2155-18 with the exception of an increase of CTLA-4 on CD8+ T cells. Interestingly, we also observed an increase in CD8+ activated T cells (Fig. 9D). Considering that an increase of an immune checkpoint is generally linked with weakened anti-tumor immunity, this suggests that 2155-18 can be used synergistically in combination with anti-CTLA-4 immunotherapy.
2155-14 had an opposite effect from 2155-18 on immune checkpoints, whereby it decreased CTLA-4, LAG-3, and TIGIT on CD8+ T cells, and CTLA-4 on CD4+ T cells. This suggests that 2155-14 can act as an activator of T cells alone or in combination with anti-CTLA-4, anti-LAG-3, and anti-TIGIT immune checkpoint inhibitors. 2155-14 did not affect the activity of CD4+ or CD8* T cells (Fig. 12A-D), which could be due to the low dose of 2155-14. Additional studies are needed to determine the mechanism behind the decrease in immune checkpoints.
Neither 2155-14 nor 2155-18 significantly affects myeloid immunosuppressive cells (Fig. 12E-G and 9E-G, respectively) except for an increase of pmn-MSDCs in the case of 2155-18 (Fig. 9G). However, the total number of pmn-MSDCs was very low and, therefore, unlikely to have a significant effect on the tumor immune microenvironment.
Overall, despite belonging to the same chemotype and having similar levels of anti-tumor activity, the mechanisms of 2155-14 and 2155-18 activity appear to be different as far as immune cells are concerned. Further studies are needed to ascertain these mechanisms.
The connection of H1/H2 or hnRNPs to the immune system has not been well-studied thus far. hnRNPL knockdown reduced the expression of PDL-1 in prostate cancer, thus enhancing anti-PD-1 therapy [25]. hnRNPC-activated Tregs promote the progression of prostate cancer [26]. Targeting of hnRNPA2/B1, a binding partner of H1/H2 [27], switched the macrophage phenotype from immunosuppressive M2 to immunopermissive M1 [28]. Indiana vesiculovirus (VSV) infection resulted in hnRNPA2/B1-mediated initiation and amplification of the innate immune response to DNA viruses[29]. hnRNPH2 is also an inhibitor of chicken MDA5-mediated Type I Interferon response [30].
Both 2155-14 and 18 exhibited anti-melanoma activity against BRAFi-resistant A375 tumors. While multiple known causes of acquired BRAFi resistance have been reported [31], in this study, we used the model, which is resistant due to the secondary NRAS mutation often occurring after monotherapy using BRAF inhibitors such as vemurafenib [32]. Interestingly, once BRAFi resistance develops, it results in changes in the tumor microenvironment, leading to a low immunogenic state, with fewer (and functionally impaired) infiltrating T cells and NK cells [33] and more of myeloid-derived suppressor cells (MDSC) [34]. Additionally, BRAFi resistance causes the production of programmed cell death ligand-1 (PD-L1) [35], galectin-1 [36], and CD47 [37] by tumor cells, which protects them from cytotoxic T-cells and macrophages. Overall, BRAFi resistance makes melanoma less susceptible to immunotherapy. With this in mind, the anti-tumor activity of spliceosomal inhibitors 2155-14 and 18 is promising as it potentially works by two different mechanisms: (1) via activating intracellular immune signaling in melanoma cells [38], which leads to melanoma apoptosis, and (2) by recruiting and activating immune cells to the melanoma tumors. Our future efforts will be focused on ascertaining the contribution of immune cells to anti-tumor activity.
5. Conclusions
The results of this study, combined with our previous results indicating a lack of in vivo toxicity [12] and efficacy in the BRAF-mutant model of melanoma [13], suggest that 2155-14 and 2155-18 can be used as drug development leads for broad-spectrum and BRAFi-resistant melanoma therapy and in vivo and in vitro probes for melanoma research. Additionally, targeting hnRNP H1 and H2 represents a feasible approach to melanoma therapy, both as monotherapy and as an adjuvant to immunotherapy.
Supplementary Materials
Antibodies used in flow cytometry experiments.
Author Contributions
DM, VB, and KSMS designed the study. DM obtained funding and wrote the manuscript. ER, SV, NMN, and MS performed animal protocol, histology, and immunostaining, and co-wrote the manuscript. NMN, JL, and KS performed immunofluorescence studies. NMG, MS, SS, TD, and SD performed the animal protocol. SV, MS, NMN, and VB performed FC studies. VB analyzed FC results. JYC co-wrote the manuscript, and AS and RS synthesized and characterized the compounds for the study.
Funding
This work was supported by NIH grant R15CA249788 and Florida Department of Health grant 22B09 (PI - DM). JYC and RS were supported by an NIH SC2 award (SC2GM130470).
Institutional Review Board Statement
Animal experiments conform to internationally accepted standards and have been approved by the NSU IACUC.
Data Availability Statement
Not applicable.
Conflicts of Interest
The authors declare no conflict of interest.
References
- Society, A.C. Key Statistics for Melanoma Skin Cancer. 2023. [Google Scholar]
- Bomar, L.; Senithilnathan, A.; Ahn, C. Systemic Therapies for Advanced Melanoma. Dermatol Clin 2019, 37, 409–423. [Google Scholar] [CrossRef]
- Ribas, A.; Hamid, O.; Daud, A.; Hodi, F.S.; Wolchok, J.D.; Kefford, R.; Joshua, A.M.; Patnaik, A.; Hwu, W.J.; Weber, J.S.; et al. Association of Pembrolizumab With Tumor Response and Survival Among Patients With Advanced Melanoma. JAMA 2016, 315, 1600–1609. [Google Scholar] [CrossRef] [PubMed]
- Robert, C.; Schachter, J.; Rutkowski, P.; Mackiewicz, A.; Lichinitser, M.; Dummer, R.; Grange, F.; Chiarion-Sileni, V.; Drucis, K.; Krajsova, I.; Hauschild, A.; Legos, J.; Schadendorf, D. Two Year Estimate of Overall Survival in COMBI-v, a Randomized, Open-Label, Phase III Study Comparing the Combination of Dabrafenib (D) and Trametinib (T) with Vemurafenib (Vem) as First-Line Therapy in Patients (Pts) with Unresectable or Metastatic. Eur. J. Cancer 2015, 51, s663. [Google Scholar]
- Wolchok, J.D.; Chiarion-Sileni, V.; Gonzalez, R.; Rutkowski, P.; Grob, J.J.; Cowey, C.L.; Lao, C.D.; Wagstaff, J.; Schadendorf, D.; Ferrucci, P.F.; et al. Overall Survival with Combined Nivolumab and Ipilimumab in Advanced Melanoma. N Engl J Med 2017, 377, 1345–1356. [Google Scholar] [CrossRef]
- Hodi, F.S.; Chesney, J.; Pavlick, A.C.; Robert, C.; Grossmann, K.F.; McDermott, D.F.; Linette, G.P.; Meyer, N.; Giguere, J.K.; Agarwala, S.S.; et al. Combined nivolumab and ipilimumab versus ipilimumab alone in patients with advanced melanoma: 2-year overall survival outcomes in a multicentre, randomised, controlled, phase 2 trial. The Lancet Oncology 2016, 17, 1558–1568. [Google Scholar] [CrossRef]
- Larkin, J.; Chiarion-Sileni, V.; Gonzalez, R.; Grob, J.J.; Cowey, C.L.; Lao, C.D.; Schadendorf, D.; Dummer, R.; Smylie, M.; Rutkowski, P.; et al. Combined Nivolumab and Ipilimumab or Monotherapy in Untreated Melanoma. New England Journal of Medicine 2015, 373, 23–34. [Google Scholar] [CrossRef]
- Watson, A.S.; Goutam, S.; Stukalin, I.; Ewanchuk, B.W.; Sander, M.; Meyers, D.E.; Pabani, A.; Cheung, W.Y.; Heng, D.Y.C.; Cheng, T.; et al. Association of Immune-Related Adverse Events, Hospitalization, and Therapy Resumption With Survival Among Patients With Metastatic Melanoma Receiving Single-Agent or Combination Immunotherapy. JAMA Netw Open 2022, 5, e2245596. [Google Scholar] [CrossRef]
- Sharma, P.; Hu-Lieskovan, S.; Wargo, J.A.; Ribas, A. Primary, Adaptive, and Acquired Resistance to Cancer Immunotherapy. Cell 2017, 168, 707–723. [Google Scholar] [CrossRef]
- Palrasu, M.; Knapinska, A.M.; Diez, J.; Smith, L.; LaVoi, T.; Giulianotti, M.; Houghten, R.A.; Fields, G.B.; Minond, D. A Novel Probe for Spliceosomal Proteins that Induces Autophagy and Death of Melanoma Cells Reveals New Targets for Melanoma Drug Discovery. Cell Physiol Biochem 2019, 53, 656–686. [Google Scholar] [CrossRef] [PubMed]
- Onwuha-Ekpete, L.; Tack, L.; Knapinska, A.; Smith, L.; Kaushik, G.; Lavoi, T.; Giulianotti, M.; Houghten, R.A.; Fields, G.B.; Minond, D. Novel pyrrolidine diketopiperazines selectively inhibit melanoma cells via induction of late-onset apoptosis. J Med Chem 2014, 57, 1599–1608. [Google Scholar] [CrossRef] [PubMed]
- Velayutham, S.; Seal, T.; Danthurthy, S.; Zaias, J.; Smalley, K.S.M.; Minond, D. In Vivo Acute Toxicity Studies of Novel Anti-Melanoma Compounds Downregulators of hnRNPH1/H2. Biomolecules 2023, 13. [Google Scholar] [CrossRef] [PubMed]
- Velayutham, S.; Seerattan, R.; Sultan, M.; Seal, T.; Danthurthy, S.; Chinnappan, B.; Landi, J.; Pearl, K.; Singh, A.; Smalley, K.S.M.; et al. Novel Anti-Melanoma Compounds Are Efficacious in A375 Cell Line Xenograft Melanoma Model in Nude Mice. Biomolecules 2023, 13. [Google Scholar] [CrossRef] [PubMed]
- Penumutchu, S.R.; Chiu, L.Y.; Meagher, J.L.; Hansen, A.L.; Stuckey, J.A.; Tolbert, B.S. Differential Conformational Dynamics Encoded by the Linker between Quasi RNA Recognition Motifs of Heterogeneous Nuclear Ribonucleoprotein H. J Am Chem Soc 2018, 140, 11661–11673. [Google Scholar] [CrossRef]
- Bertoldo, J.B.; Muller, S.; Huttelmaier, S. RNA-binding proteins in cancer drug discovery. Drug Discov Today 2023, 103580. [Google Scholar] [CrossRef]
- Kuznetsov, G.; Xu, Q.; Rudolph-Owen, L.; Tendyke, K.; Liu, J.; Towle, M.; Zhao, N.; Marsh, J.; Agoulnik, S.; Twine, N.; et al. Potent in vitro and in vivo anticancer activities of des-methyl, des-amino pateamine A, a synthetic analogue of marine natural product pateamine A. Mol Cancer Ther 2009, 8, 1250–1260. [Google Scholar] [CrossRef]
- Chen, L.; Aktas, B.H.; Wang, Y.; He, X.; Sahoo, R.; Zhang, N.; Denoyelle, S.; Kabha, E.; Yang, H.; Freedman, R.Y.; et al. Tumor suppression by small molecule inhibitors of translation initiation. Oncotarget 2012, 3, 869–881. [Google Scholar] [CrossRef] [PubMed]
- Eskens, F.A.; Ramos, F.J.; Burger, H.; O'Brien, J.P.; Piera, A.; de Jonge, M.J.; Mizui, Y.; Wiemer, E.A.; Carreras, M.J.; Baselga, J.; et al. Phase I pharmacokinetic and pharmacodynamic study of the first-in-class spliceosome inhibitor E7107 in patients with advanced solid tumors. Clin Cancer Res 2013, 19, 6296–6304. [Google Scholar] [CrossRef]
- Hong, D.S.; Kurzrock, R.; Naing, A.; Wheler, J.J.; Falchook, G.S.; Schiffman, J.S.; Faulkner, N.; Pilat, M.J.; O'Brien, J.; LoRusso, P. A phase I, open-label, single-arm, dose-escalation study of E7107, a precursor messenger ribonucleic acid (pre-mRNA) splicesome inhibitor administered intravenously on days 1 and 8 every 21 days to patients with solid tumors. Invest New Drugs 2014, 32, 436–444. [Google Scholar] [CrossRef]
- Steensma, D.P.; Wermke, M.; Klimek, V.M.; Greenberg, P.L.; Font, P.; Komrokji, R.S.; Yang, J.; Brunner, A.M.; Carraway, H.E.; Ades, L.; et al. Phase I First-in-Human Dose Escalation Study of the oral SF3B1 modulator H3B-8800 in myeloid neoplasms. Leukemia 2021, 35, 3542–3550. [Google Scholar] [CrossRef]
- Flanagan, S.P. 'Nude', a new hairless gene with pleiotropic effects in the mouse. Genet Res 1966, 8, 295–309. [Google Scholar] [CrossRef]
- Kuzu, O.F.; Nguyen, F.D.; Noory, M.A.; Sharma, A. Current State of Animal (Mouse) Modeling in Melanoma Research. Cancer Growth Metastasis 2015, 8, 81–94. [Google Scholar] [CrossRef]
- Willsmore, Z.N.; Harris, R.J.; Crescioli, S.; Hussein, K.; Kakkassery, H.; Thapa, D.; Cheung, A.; Chauhan, J.; Bax, H.J.; Chenoweth, A.; et al. B Cells in Patients With Melanoma: Implications for Treatment With Checkpoint Inhibitor Antibodies. Front Immunol 2020, 11, 622442. [Google Scholar] [CrossRef] [PubMed]
- Noonepalle, S.K.R.; Gracia-Hernandez, M.; Aghdam, N.; Berrigan, M.; Coulibaly, H.; Li, X.; Zevallos-Delgado, C.; Pletcher, A.; Weselman, B.; Palmer, E.; et al. Cell therapy using ex vivo reprogrammed macrophages enhances antitumor immune responses in melanoma. J Exp Clin Cancer Res 2024, 43, 263. [Google Scholar] [CrossRef] [PubMed]
- Zhou, X.; Zou, L.; Liao, H.; Luo, J.; Yang, T.; Wu, J.; Chen, W.; Wu, K.; Cen, S.; Lv, D.; et al. Abrogation of HnRNP L enhances anti-PD-1 therapy efficacy via diminishing PD-L1 and promoting CD8(+) T cell-mediated ferroptosis in castration-resistant prostate cancer. Acta Pharm Sin B 2022, 12, 692–707. [Google Scholar] [CrossRef] [PubMed]
- Cheng, Y.; Li, L.; Wei, X.; Xu, F.; Huang, X.; Qi, F.; Zhang, Y.; Li, X. HNRNPC suppresses tumor immune microenvironment by activating Treg cells promoting the progression of prostate cancer. Cancer Sci 2023, 114, 1830–1845. [Google Scholar] [CrossRef]
- Biology, M.a.L.o.C.S. Pathway Commons Protein-Protein Interactions. 2024. [Google Scholar]
- Wei, K.; Zhang, H.; Yang, S.; Cui, Y.; Zhang, B.; Liu, J.; Tang, L.; Tan, Y.; Liu, S.; Chen, S.; et al. Chemo-drugs in cell microparticles reset antitumor activity of macrophages by activating lysosomal P450 and nuclear hnRNPA2B1. Signal Transduct Target Ther 2023, 8, 22. [Google Scholar] [CrossRef]
- Wang, L.; Wen, M.; Cao, X. Nuclear hnRNPA2B1 initiates and amplifies the innate immune response to DNA viruses. Science 2019, 365. [Google Scholar] [CrossRef]
- Lin, X.; Yu, S.; Mao, H.; Ren, P.; Jin, M. hnRNPH2 as an Inhibitor of Chicken MDA5-Mediated Type I Interferon Response: Analysis Using Chicken MDA5-Host Interactome. Front Immunol 2020, 11, 541267. [Google Scholar] [CrossRef]
- Proietti, I.; Skroza, N.; Bernardini, N.; Tolino, E.; Balduzzi, V.; Marchesiello, A.; Michelini, S.; Volpe, S.; Mambrin, A.; Mangino, G.; et al. Mechanisms of Acquired BRAF Inhibitor Resistance in Melanoma: A Systematic Review. Cancers (Basel) 2020, 12. [Google Scholar] [CrossRef]
- Turner, E.; Chen, L.; Foulke, J.G.; Gu, Z.; Tian, F. CRISPR/Cas9 Edited RAS & MEK Mutant Cells Acquire BRAF and MEK Inhibitor Resistance with MEK1 Q56P Restoring Sensitivity to MEK/BRAF Inhibitor Combo and KRAS G13D Gaining Sensitivity to Immunotherapy. Cancers (Basel) 2022, 14. [Google Scholar] [CrossRef]
- Bellmann, L.; Cappellano, G.; Schachtl-Riess, J.F.; Prokopi, A.; Seretis, A.; Ortner, D.; Tripp, C.H.; Brinckerhoff, C.E.; Mullins, D.W.; Stoitzner, P. A TLR7 agonist strengthens T and NK cell function during BRAF-targeted therapy in a preclinical melanoma model. Int J Cancer 2020, 146, 1409–1420. [Google Scholar] [CrossRef] [PubMed]
- Steinberg, S.M.; Shabaneh, T.B.; Zhang, P.; Martyanov, V.; Li, Z.; Malik, B.T.; Wood, T.A.; Boni, A.; Molodtsov, A.; Angeles, C.V.; et al. Myeloid Cells That Impair Immunotherapy Are Restored in Melanomas with Acquired Resistance to BRAF Inhibitors. Cancer Res 2017, 77, 1599–1610. [Google Scholar] [CrossRef] [PubMed]
- Atefi, M.; Avramis, E.; Lassen, A.; Wong, D.J.; Robert, L.; Foulad, D.; Cerniglia, M.; Titz, B.; Chodon, T.; Graeber, T.G.; et al. Effects of MAPK and PI3K pathways on PD-L1 expression in melanoma. Clin Cancer Res 2014, 20, 3446–3457. [Google Scholar] [CrossRef] [PubMed]
- Gorniak, P.; Wasylecka-Juszczynska, M.; Lugowska, I.; Rutkowski, P.; Polak, A.; Szydlowski, M.; Juszczynski, P. BRAF inhibition curtails IFN-gamma-inducible PD-L1 expression and upregulates the immunoregulatory protein galectin-1 in melanoma cells. Mol Oncol 2020, 14, 1817–1832. [Google Scholar] [CrossRef]
- Liu, F.; Jiang, C.C.; Yan, X.G.; Tseng, H.Y.; Wang, C.Y.; Zhang, Y.Y.; Yari, H.; La, T.; Farrelly, M.; Guo, S.T.; et al. BRAF/MEK inhibitors promote CD47 expression that is reversible by ERK inhibition in melanoma. Oncotarget 2017, 8, 69477–69492. [Google Scholar] [CrossRef]
- Maab Sultan, J.D.; Smalley, Keiran S.M.; Beljanski, Vladimir; Nathanson, Lubov; Minond, Dmitriy. Downregulation of Spliceosomal Proteins hnRNPH1 and H2 in WM266-4 Melanoma Cells Induces Immune Signaling. In Proceedings of the Annual Meeting of American Association of Cancer Research, Orlando, Fl, April 15-19, 2023. [Google Scholar]
Scheme 1.
Schemes for the synthesis of 2155-14 (JC-395) and 2155-18 (JC-408). Reagents and Conditions: a) 10% DIEA/DMF, 25 °C, 20 min; b) Boc-L-Phe-OH/HATU/HOBt (4 eq), 10% DIEA/DMF, 25 °C, 4 h; c) 55% TFA/DCM, 25 °C, 30 min; d) 10% DIEA/DCM 25 °C, 5 min (3x); e) Boc-L-Pro-OH/HATU/HOBt (4 eq), 10% DIEA/DMF, 25 °C, 2 h; f) Boc-β-cyclohexyl-D-alanine-OH/HATU/HOBt (4 eq), 10% DIEA/DMF, 25 °C, 2 h; g) Fmoc-L-Tyr (OtBu)-OH/HATU/HOBt (4 eq), 10% DIEA/DMF, 25 °C, 2 h; h) 20% Piperidine/DMF, 25 °C, 30 min; i) Phenylacetic acid/HATU/HOBt (4 eq), 10% DIEA/DMF, 25 °C, 2 h; j) Borane-THF, 70 °C (μwave), 6 h; k) Piperidine, 70 °C (μwave), 30 min; l) 1,1’-Oxalyldiimidazole (8 eq), DMF, 25 °C, 48 h; m) TFA/TFMSA (9/1), 25 °C, 1.5 h; Synthetic schemes for JC-395 is present as a representative. For the synthesis of JC-408, the following conditions were applied: f) Boc-Phe-OH/HATU/HOBt (4 eq), 10% DIEA/DMF, 25 °C, 2 h; i) 2-(Adamantan-1-yl)acetic acid/HATU/HOBt (4 eq), 10% DIEA/DMF, 25 °C, 2 h.
Disclaimer/Publisher’s Note: The statements, opinions and data contained in all publications are solely those of the individual author(s) and contributor(s) and not of MDPI and/or the editor(s). MDPI and/or the editor(s) disclaim responsibility for any injury to people or property resulting from any ideas, methods, instructions or products referred to in the content. |
© 2026 by the authors. Licensee MDPI, Basel, Switzerland. This article is an open access article distributed under the terms and conditions of the Creative Commons Attribution (CC BY) license (http://creativecommons.org/licenses/by/4.0/).
Copyright: This open access article is published under a Creative Commons CC BY 4.0 license, which permit the free download, distribution, and reuse, provided that the author and preprint are cited in any reuse.


