
Submitted:
29 January 2026
Posted:
29 January 2026
You are already at the latest version
Abstract
This study evaluates the feasibility of using two affordable thermal cameras (UNI-T UTi260M and UTi260T), which are not designed as automotive sensors, for observing pedestrians and warm objects during night-time driving under low-illumination conditions. The experimental setup includes mounting the camera on the vehicle body (e.g., side-mirror area/roof), recording road scenes in urban and rural environments, and selecting representative frames for qualitative and quantitative analysis. The study assesses: (i) observable pedestrian detectability in unlit road sections and under oncoming headlight glare, where visible cameras often lose contrast; (ii) the influence of low ambient temperature and strong cold wind on image appearance (including “whitening”/contrast shifts); and (iii) workflow differences, where UTi260M relies on a smartphone application for streaming/recording, while UTi260T supports PC-based image analysis and temperature-profile visualization. In addition, a calibration-based geometric method is proposed for approximate pedestrian distance estimation from single frames using silhouette pixel height and a regression model based on 1/h_px, valid for a specific mounting configuration and a known subject height. Results indicate that both cameras can highlight warm objects relative to the background and support visual pedestrian identification at low illumination, including in the presence of oncoming headlights, with UTi260M showing more stable behaviour in part of the tests. This work is a feasibility study and does not claim ADAS functionality; it outlines limitations, repeatability considerations, and a minimal set of metrics and procedures for future extension. All quantitative indicators derived from exported frames are explicitly treated as image level proxy metrics not as physical sensor characteristics.
Keywords:
thermal imaging
; night-time road monitoring
; pedestrian detectability
; long-wave infrared
; consumer thermal cameras
; glare
; proxy image metrics
; distance estimation
1. Introduction
Road traffic safety during the dark part of the day remains a persistent challenge, largely driven by limited scene illumination, headlight glare, and reduced conspicuity of vulnerable road users such as pedestrians and cyclists. Conventional forward-looking visible-spectrum cameras strongly depend on ambient illumination and scene contrast. In unlit or poorly lit road sections—common not only in rural areas but also in peripheral urban streets—camera-based perception may degrade substantially, especially when dynamic range limitations and flare reduce effective contrast in the region of interest [1,2].
Thermal infrared (IR) imaging provides a different sensing cue: it captures emitted radiation related to surface temperature and emissivity rather than reflected visible light. Consequently, thermal imaging can remain informative under low illumination and can be less sensitive to visible headlight glare, since it does not rely on the visible-light intensity distribution [3]. Glare is also a safety-relevant factor because it can reduce visual performance and cause temporary visual impairment/discomfort [4,5,6,7].
In parallel with automotive-grade solutions, the market offers low-cost handheld thermal cameras intended primarily for industrial inspection, building diagnostics, and maintenance. Although such devices are not designed as automotive perception sensors, their affordability and accessibility motivate a feasibility-level investigation: can consumer-grade thermal cameras support meaningful detectability of pedestrians/vehicles in unlit road segments, including challenging scenarios with oncoming headlight glare? If feasible, such a setup could serve as a low-cost research platform and a proof-of-concept for night-time situational awareness, especially for educational and experimental purposes.
Prior work has discussed thermal and night-vision approaches for pedestrian detection [8], as well as thermal-camera use cases and limitations for transportation safety and road-user protection [3]. The broader context includes comparisons of thermal and regular cameras across lighting and visibility conditions and the need for “around-the-clock” video-based sensing [9,10], along with advances in computer vision methods mostly developed for regular RGB video [11,12,13]. However, it remains non-trivial to assess what can be achieved using consumer handheld cameras that apply internal automatic gain control (AGC), palette mapping, compression, and overlays.
This study evaluates feasibility of using two consumer thermal cameras (UTi260M and UTi260T) in a road environment. The focus is pedestrian detectability in unlit or poorly lit urban and rural road sections, robustness under oncoming headlight glare, stability under cold ambient conditions, and practical workflow differences between smartphone-based acquisition (UTi260M) and PC-oriented post-processing (UTi260T)
Main contributions are: feasibility evaluation of two consumer thermal cameras in night-time road scenarios (urban and rural, lit and unlit); qualitative evidence of pedestrian and vehicle detectability under low illumination and in the presence of oncoming headlights; workflow-oriented comparison between UTi260M (smartphone streaming/recording) and UTi260T (PC analysis tools); A simple calibration-based method to approximate pedestrian distance from single frames using pixel-height measurements, explicitly stated as mounting-specific.
1.1. Visible and Thermal Imaging
Visible-spectrum sensing covers the range to which the human eye is sensitive (photopic vision in daylight and scotopic vision at low light levels). Under night-time conditions, visible cameras can suffer from low signal, high dynamic range, saturation from strong local light sources, and glare. Infrared radiation lies beyond the visible band. For practical sensing, mid-wave IR (MWIR,~3–5 ) and long-wave IR (LWIR, ~8–14 ) are commonly considered. is particularly relevant for passive thermal imaging of objects near ambient temperatures because it captures emitted thermal radiation without requiring external illumination [14,15,16].
1.2. Thermal Vision Systems
Thermal imaging systems generate images based on thermal radiation. Uncooled microbolometer sensors have become widely used due to reduced cost and compactness. In road scenes at night, pedestrians and vehicles often present measurable thermal contrast due to body heat and warmed surfaces (e.g., engine and exhaust areas), supporting detectability in unlit road sections [3,8]. Thermal imaging is also considered relatively robust against some visual limitations (e.g., low illumination and visible glare), and is frequently discussed as a complementary modality in automotive applications [17,18]. The approach can be further optimized, as discussed in related experimental and system integration studies [19,20].
At the same time, it is important to distinguish automotive-grade sensors from consumer handheld devices. Consumer devices often apply internal AGC, palette mapping, and overlays that affect the final exported image. Therefore, when such cameras are used in road experiments, quantitative metrics computed from screenshots/JPG/PNG must be interpreted as image-level proxy measures, not as physical sensor noise parameters or lab-measured .
Unlike automotive grade night vision systems, study deliberately focuses on consumer handheld thermal devices and evaluates what level of pedestrian detectability and geometric reasoning as feasible under real road conditions.
2. Materials and Methods
2.1. Aim and Research Questions
The aim is to evaluate whether affordable (consumer-grade) thermal cameras can support night-time road-scene monitoring, including: (i) detectability and/or visual separation of pedestrians under low illumination; (ii) behaviour under oncoming headlights (glare), where visible cameras often lose usable contrast; (iii) stability of thermal visualization at low temperatures and adverse conditions (strong cold wind); and (iv) practical-use differences between UTi260M and UTi260T.
2.2. Equipment Used
Two low-cost LWIR thermal cameras were used:UTi260M and UTi260T. UTi260M: operated via a smartphone application; recording/streaming through the phone; used for field observations of the road scene and for highlighting warm objects. UTi260T: supports PC software for post-processing and analysis; depending on configuration, can provide tools such as spot/line analysis and temperature profiles.
2.3. Mounting Configuration and Observation Geometry
To reduce influence from vehicle heat sources, the cameras were mounted outside the engine compartment and oriented toward the road lane and environment ahead.
UTi260T was mounted on the vehicle roof at approximately 1.7 m height in a horizontal orientation to capture the road environment (Figure 4a, position 1).
UTi260M was mounted near the side mirror at approximately ~1 m height (Figure 4a, position 2).
In the reported tests, the practical observation range was approximately ~200 m for high-contrast thermal targets, with a capture cone angle of approximately 56° (horizontal). UTi260T transmitted images wirelessly to a smartphone (after obtaining a functional application/connection), while UTi260M was connected to the smartphone through its supported interface.
2.4. Functional Verification of the System
Before road measurements, correct image transmission and thermal response were verified using a controlled heat source inside the vehicle (e.g., HVAC outlet). This step confirmed stable streaming/recording and baseline thermal responsiveness prior to analysing road scenes.
2.5. Frame Preparation for Analysis
Recordings were collected in urban and rural environments under night-time conditions. Representative frames were selected for analysis and assigned Case IDs. For each case, metadata were recorded: camera (UTi260M/UTi260T), scenario (urban/rural; lit/unlit; glare/no-glare), and notes on environmental conditions (cold wind; sky in frame). The UTi260T provides two synchronized image modalities acquired during the same scene: (i) a thermal image used for target-to-background temperature contrast assessment, and (ii) a conventional visible-light frame used for contextual interpretation (lane geometry, surrounding objects, and lighting conditions). During post-processing, the manufacturer software allows the two channels to be displayed separately (side-by-side) or inspected sequentially, enabling direct qualitative comparison between thermal detectability and visible-scene readability under identical conditions. In this study, the thermal channel was used for detectability assessment (presence/absence of a warm target, contrast, and proxy noise/uniformity metrics), while the visible channel served as a reference to document illumination conditions (e.g., glare from headlights, unlit road segments, and background clutter) and to support figure annotation.
To minimize visual clutter, UI overlays (e.g., brand/date stamps) were removed by cropping where necessary, without altering the thermal palette or intensity values beyond the exported image’s native representation.
2.6. Extraction of Temperature Information
When radiometric raw data are unavailable, temperature-related information can only be extracted approximately from exported images. Where the interface provides numeric markers (e.g., min/max/spot values), those values were used as reference. Otherwise, a palette/legend mapping can be used to build an approximate colour–temperature relationship for the displayed image, with the understanding that the result is dependent on the device’s AGC and palette settings.
2.7. Metrics for Thermal Image Quality and Detectability
Quantitative evaluation was performed using regions of interest (ROIs) over: (i) an object region (e.g., pedestrian torso or hottest vehicle area) and (ii) a homogeneous background region (e.g., asphalt/road surface).
2.8. Proxy Thermal Image Quality Metrics (8-bit) and Non-Uniformity Indicators
The following procedure provides image-level proxy indicators for noise and non-uniformity computed from exported thermal frames (e.g., JPG/PNG/screenshot). The method does not attempt to recover the sensor’s physical noise characteristics; instead, it quantifies the stability and spatial consistency of the final displayed image, which is influenced by internal AGC, palette mapping, compression, and overlays. The adopted indicators follow common IR quality-analysis ideas (noise, uniformity, structured artefacts) and are adapted for a feasibility dataset with non-radiometric exports [21,22,23,24].
1. Temperature mapping method (display-based, optional)
When radiometric raw data are unavailable, a pixel-wise temperature proxy can be obtained from the displayed frame by: (i) extracting the colour legend (scale bar), (ii) building a colour–temperature mapping from the legend, and (iii) applying nearest-neighbour colour matching to each pixel in the thermal region. This enables approximate quantitative comparisons of thermal variations, while explicitly remaining dependent on the display settings (palette, AGC, and min–max scaling of the frame).
2. Spatial noise estimation (local standard deviation)
Spatial noise is computed as the standard deviation within a local window centred at pixel:
where is local spatial-noise estimate for the window centered at pixel ;
--тemperature of the -th pixel inside a local analysis window. Index enumerates all pixels within the window, i.e. =1,2,…,.
--local mean temperature computed over the same analysis window:
This metric quantifies local thermal fluctuations and is the primary indicator of sensor stability in a single still frame.
3. Global noise level
A global noise proxy is defined as the mean of local noise values across the image (or across the analysed thermal region):
The global noise level is defined as the mean of all local noise values across the image:
where is image height and is image width.
4. Noise distribution (histogram)
A histogram of values is used to describe the distribution of local noise magnitudes. This helps identify whether the noise is approximately Gaussian, skewed, multimodal, or dominated by structured components (e.g., banding or fixed-pattern artefacts).
5. Vertical noise profile (row-wise)
Row-wise behaviour is summarized by the mean local noise per row:
6. Horizontal noise profile (column-wise)
Similarly, the column-wise profile is:
7. Local noise variability (window size sensitivity)
Local noise is computed using small window sizes (e.g., 5×5 or 7×7). This exposes variations between homogeneous regions (asphalt/background) and areas affected by gradients, edges, interpolation, or compression artefacts.
8. Uniformity Index (UI)
To characterize frame-level uniformity in a simple way, the following index is used:
where is maximum temperature in the analyzed frame;
- is minimum temperature in the analyzed frame.
9. Fixed-pattern noise (FPN)
Fixed-pattern artefacts are assessed through variability of row/column means (banding-like structure). In the context of exported non-radiometric images, FPN is interpreted as a structured non-uniformity proxy that can originate from sensor non-uniformity and/or the display pipeline (AGC/NUC mapping).
10. Estimated NETD (proxy)
NETD typically requires radiometric temporal measurements. When only single exported frames are available, an approximate indicator may be defined from the global spatial noise:
where is a scaling factor dependent on the colour–temperature mapping and display scaling. In this work, is reported only as a proxy and is not interpreted as a sensor specification.
11. Signal-to-noise ratio (SNR)
For detectability assessment, SNR is defined as:
where is the mean value of the selected object-related signal (or object ROI) and is the global noise proxy.
2.9. Distance-to-Pedestrian Estimation from a Single Frame (Monocular, Height-Based)
A simple monocular distance-estimation approach is considered for feasibility analysis using a known subject height. The inputs are: real subject height measured subject pixel height , (px) for each frame; and frame dimensions , , (px).
For calibration, the real distance from the camera to the person is measured in the field, together with the person’s height . For each calibration frame, the subject pixel is extracted (e.g., from a bounding box). A convenient normalized ratio is , where is the vertical resolution of the frame in pixels.
The approach uses the following relationships.
Calibration from real measurements (deriving an effective pixel focal length):
where is the distance from the camera to the person/object (m);
is the measured object height in pixels;
is the real height of the person/object (m);
is the effective focal length expressed in pixels.
The distance model must first be calibrated using initial pairs and the corresponding measured . Once calibrated for a fixed mounting configuration and processing settings, the method can be used to estimate distance only under the same setup and for objects/persons consistent with the assumed height model.
Distance estimation (operational use):
2.10. Pixel Footprint and Percentage Occupancy (POR)
From each selected frame, an approximate pedestrian silhouette is obtained by segmentation (thresholding by intensity/contrast followed by morphological operations). Then the bounding-box height is measured, together with bounding-box width and area:
The percentage occupancy is computed as , where is the total frame area in pixels.
This yields a measurable dependency: as distance increases, both and decrease, which can be used as an additional geometric cue and as a consistency check for the distance-estimation procedure.
3. Results
3.1. Qualitative Observations: Detectability Under Low Illumination and Glare
The analysed frames show that thermal visualization enables clear separation of a pedestrian from the background in unlit/poorly lit road sections where the visible camera provides low contrast. Under oncoming headlights, the thermal image remains informative because it does not rely on visible-light intensity distribution; the pedestrian remains distinguishable as a warmer region relative to the environment.
In the performed tests, UTi260M showed more stable behaviour in motion up to approximately 60 (observationally), while UTi260T provided stronger post-processing tools (spot/line/graph instruments). Under field conditions, UTi260T performance is more sensitive to workflow factors (connection/app/modes), while UTi260M benefits from a simpler smartphone-based pipeline.
3.2. Issues and Artefacts Observed at Low Temperatures
Sky influence on . When a large portion of the sky is included in the frame, very low apparent temperatures (radiative sky) can affect and contrast distribution. Consequently, the scene may appear contrast-shifted relative to road objects (Figure 6).
Strong cold wind artefact. Under strong cold wind, degradation of the thermal image (“whitening”/reduced clarity) was observed. Likely causes include cooling of the housing/front optics, condensation/frost, or sensor thermal stability triggering adaptations.
3.3. Proxy Noise and Uniformity Analysis (8-bit)
A quantitative proxy analysis was conducted on homogeneous regions of the scene (typically asphalt/background) to evaluate fluctuation level and spatial non-uniformity of the displayed thermal output. The analysis is based on 8-bit exported images; therefore, results are reported in (digital numbers) and describe the final visualized frame (including compression, , and overlay elements), not microbolometer physical noise or sensor specification parameters such as .
To ensure comparability, a homogeneous in the road/background region was selected for each frame, avoiding text overlays, graphical elements, and bright thermal objects. The following proxy metrics were computed: intensity standard deviation (), noise range, noise mode, row/column non-uniformity indicators (), uniformity index (), and a proxy estimate of fixed-pattern noise ( proxy). These metrics are suitable for comparative assessment across scenes/devices under the same procedure and dataset, but must not be interpreted as absolute thermographic sensor characteristics.
Representative UTi260T frames and corresponding software views used for visualization and analysis are shown in Figure 7 and Figure 8. The paired visible frames clarify whether limited detectability in the visible domain is caused by low ambient illumination, glare, or scene complexity. In several night scenes, oncoming headlights substantially reduced the usability of the visible frame (local overexposure and loss of contrast), while the thermal frame retained a stable depiction of warm objects with clear separation from the colder background. This dual-channel evidence supports the main feasibility claim: consumer thermal imaging can complement conventional visibility when the latter is compromised by glare or insufficient street lighting, provided that the thermal device remains within its operational constraints (mounting stability, wind/cooling effects, and limited resolution).
3.4. Comparative Analysis of Thermal Frames Captured with UTi260M versus UTi260T
Figure 9 presents a thermal frame recorded with the UTi260M via a smartphone application under night-time/low-illumination conditions. In contrast to the UTi260T (), where a PC-based workflow enables more structured image inspection and presentation of thermal and visible channels, the UTi260M workflow is primarily oriented toward mobile viewing and recording, with more limited options for extracting radiometric information and conducting detailed post-processing.
Qualitative comparison (key observations):
Thermal contrast and “hot object” highlighting. The UTi260M clearly highlights objects with higher apparent temperature (e.g., parts of a vehicle), which is useful as a rapid visual cue when driving through poorly lit road sections. Under such conditions, the thermal view is less affected by oncoming headlights than a visible-light camera, which is typically impacted by glare and blooming.
Automatic gain/contrast (AGC) and the effect of cold regions (sky/open horizon). A typical behavior is observed: when the scene contains very cold regions (e.g., sky), the automatic scaling redistributes the dynamic range and may reduce local contrast on the roadway, visually perceived as “whitening” or grayscale compression. This dependence on scene composition is an important limitation for consistent visual interpretation across different environments.
Geometry/resolution and effective thermal detail. Although the smartphone-recorded output may have a higher pixel resolution due to screen capture, scaling, or video encoding, the effective thermal spatial detail remains limited by the sensor class (e.g., 256×192). This must be considered for any quantitative inference based on object size in pixels, edge sharpness, or fine structural details.
Software environment and traceability. The UTi260T provides a more transparent analysis workflow (point/line tools, statistics, paired visible frame, curves/plots), which supports repeatability and reporting. In the UTi260M case, the analysis is more practical “in-field,” but repeatability is harder to demonstrate when relying mainly on screen-recordings and frames with overlays.
Outcome of the comparison.
The UTi260M is more suitable for operational, real-time visual screening and mobile monitoring in low-illumination conditions, whereas the UTi260T is more suitable for documentation and post-analysis, where a structured software workflow and clearer traceability of measurement markers are required. In this study, no ADAS functionality is claimed; the work is positioned as a feasibility assessment of low-cost thermal devices as an auxiliary information source for detecting warm targets under low illumination.
Table 3 summarizes proxy noise and uniformity metrics for UTi260T and UTi260M thermal frames and for a control night frame from a visible camera. The lowest is observed for UTi260M (0.488 DN), while UTi260T values are higher (1.113–1.363 DN) for the analysed scenes. UI is high for thermal frames (0.962–0.996), consistent with a more stable displayed background under low illumination. In contrast, the night visible frame shows substantially lower UI (0.601), reflecting the adverse impact of low signal and strong local light sources on uniformity and usable contrast. The SNR proxy, computed only for thermal frames, is highest for the scene with a clearly expressed pedestrian (561.77), supporting good detectability of a warm object relative to the background in unlit road sections.
3.5. Geometric Measurements from UTi260M Frames (Pedestrian Height 195 cm)
For a sequence of UTi260M frames, pedestrian pixel height was extracted by silhouette segmentation and bounding-box measurement. Using relationships (8) and (9), a mounting-specific distance-estimation function can be obtained after calibration with measured distances, shown in Table 4 and Figure 11.
3.6. Practical Observation Range
Both UTi260M and UTi260T showed a similar practical observation range of approximately ~200 m under the reported conditions and a capture cone angle of approximately 56° (Figure 12). Vehicle silhouettes, buildings, pedestrians, and other warm objects were distinguishable in the thermal imagery.
4. Discussion and Limitations
4.1. Interpretation of Results and Applicability
The results indicate that both thermal sensors (UTi260M and UTi260T) can provide informative night-time road imagery, where pedestrians and other warm objects stand out relative to the background via thermal contrast. This is particularly relevant for (i) unlit or poorly lit sections where visible imagery has low contrast and (ii) oncoming headlights where visible cameras are sensitive to glare and local saturation. Thermal visualization, being independent of visible illumination, preserves the ability to separate warm objects from the background and supports subsequent frame analysis.
UTi260M offers a more practical field workflow due to direct smartphone visualization and recording. UTi260T provides stronger post-processing instruments (temperature profiles, analysis tools), but under field conditions the workflow depends more strongly on app/software stability and data handling.
The high SNR proxy values reflect the strong visual separability of warm targets in the display thermal image rather than a physical sensor level signal to noise ratio.
4.2. Environmental Effects and Observed Artefacts
At low ambient temperature, two effects were observed: (i) inclusion of a large sky region can produce very low apparent temperatures and alter AGC, affecting road-region visibility; and (ii) strong cold wind can degrade image clarity (“whitening”), likely due to housing/optics cooling, condensation/frost, or internal compensation (NUC/AGC). These findings motivate stabilization measures (protective housing, airflow reduction near optics, condensation control) and procedural standardization (fixed pose, limited sky in frame) for future work.
4.3. Limitations of Data and Methodology
This feasibility study includes limitations restricting generalization: non-radiometric images and proxy metrics. Proxy indicators (, UI, FPN proxy, SNR proxy) depend on compression, palette, AGC, and overlays; they must not be interpreted as physical NETD or sensor specifications; limited meteorological conditions. Tests do not cover rain/fog/snow/wet asphalt reflectance comprehensively; limited number of scenes and standardization. Some analyses use static frames because certain workflows do not reliably accept frames extracted from video; no ADAS claims. The work reports detectability/visual separability only; automotive-grade ADAS would require multi-sensor integration, calibration, functional safety, and large-scale validation; mounting-specific distance estimation. Pixel-height distance estimation requires calibration, consistent processing, and error reporting (e.g., MAE/RMSE); frames with partial occlusion or unstable segmentation should be excluded.
5. Conclusions
This work evaluated the feasibility of using two affordable thermal cameras (UTi260M and UTi260T) for night-time road monitoring, focusing on pedestrian detectability in unlit urban and rural road sections and robustness under oncoming headlights. The observations indicate that thermal visualization can remain informative in scenarios where visible cameras suffer from low contrast or glare, and pedestrians can remain distinguishable relative to the background under low ambient temperatures.
Given the non-radiometric nature of exported frames, a set of image-level proxy metrics (, UI, FPN proxy, SNR proxy) was used to characterize the displayed image and enable comparisons across devices and scenes. A calibration-based geometric approach was also proposed to estimate pedestrian distance from single frames using pixel-height measurements for a fixed mounting configuration.
The study does not claim an automotive-certified system and should be interpreted as feasibility-level evidence. Future work should include controlled tests under rain/fog/snow, broader temperature ranges, a larger and more repeatable dataset, and publication of frames and scripts as supplementary material to support reproducibility.
Author Contributions
Conceptualization, Conceptualization, Y.S.; methodology, Y.S.; investigation, Y.S.; data curation, Y.S.; formal analysis, Y.S.; visualization, Y.S.; writing—original draft preparation, Y.S.; writing—review and editing, Y.S., A.T., P.M.; supervision, A.T.; resources, A.T., P.M.; project administration, Y.S. All authors have read and agreed to the published version of the manuscript.
Funding
This research was funded by the European Regional Development Fund within the OP “Research, Innovation and Digitalization Programme for Intelligent Transformation 2021-2027”, Project № BG16RFPR002-1.014-0005 Center of competence “Smart Mechatronics, Eco- and Energy Saving Systems and Technologies”.
Institutional Review Board Statement
Ethical review and approval were waived for this study due to its retrospective character and the fact that it only involved contactless collected data. The study did not have a medical purpose and therefore does not fall under the jurisdiction of the ethics committee.
Acknowledgments
The authors would like to thank the European Regional Development Fund within the OP “Research, Innovation and Digitalization Programme for Intelligent Transformation 2021-2027 ”, Project № BG16RFPR002-1.014-0005 Center of competence “Smart Mechatronics, Eco- and Energy Saving Systems and Technologies”.
Abbreviations
The following abbreviations are used in this manuscript:
| MWIR | Mid-Wave Infrared |
| IR | Infrared |
| LWIR | Long-wave Infrared |
| AGC | Automatic Gain Control |
| NUC | Non-Uniformity Correction |
| ADAS | Advanced Driver Assist Systems |
| NEDT | Noise-Equivalent Temperature Difference |
| ROI | Region of Interest |
| DN | Digital Numbers |
| FPN | Fixed Pattern Noise |
| SNR | Signal-to-Noise Ratio |
| POR | Pixel Occupancy Ratio |
| FOV | Field of View |
| HVAC | Heating, Ventilation and Air Conditioning |
References
- Alldieck, T.; Bahnsen, C.; Moeslund, T. Context-Aware Fusion of RGB and Thermal Imagery for Traffic Monitoring. Sensors 2016, 16 1947. [Google Scholar] [CrossRef] [PubMed]
- Pettirsch, A.; Garcia-Hernandez, A. New generation thermal traffic sensor: A novel dataset and monocular 3D thermal vision framework. Knowledge-Based Systems, Volume Volume 315(2025), 113334. [CrossRef]
- DONA, R.; MATTAS, K.; VASS, S.; DELUBAC, G.; MATIAS, J. Thermal Cameras and Their Safety Implications for Pedestrian Protection: A Mixed Empirical and Simulation-Based Characterization. In TRANSPORTATION RESEARCH RECORD, 2679; SAGE PUBLICATIONS INC; Volume 3, 2025, pp. 404–421. Available online: https://data.europa.eu/doi/10.1177/03611981241278346.
- Wessapan, T; Rattanadecho, P. Influence of ambient temperature on heat transfer in the human eye during exposure to electromagnetic fields at 900 MHz. International Journal of Heat and Mass Transfer 2014, 70, 378–388. [Google Scholar] [CrossRef]
- Kulacki, Francis A. Handbook of Thermal Science and Engineering; (print and electronic bundle); ISBN 978-3-319-26694-7 ISBN 978-3-319-26695-4 (eBook) ISBN 978-3-319-28573-3. [CrossRef]
- Hall, John E.; Hall, Michael E. GUYTON AND HALL TEXTBOOK OF MEDICAL PHYSIOLOGY; 2026; ISBN 978-0-443-11101-3. ISBN: 978-0-443-28109-9. [Google Scholar]
- Tasgaonkar, P.P.; Garg, R.D.; Garg, P.K. Vehicle Detection and Traffic Estimation with Sensors Technologies for Intelligent Transportation Systems. In Sensing and Imaging; 2020; p. 21. [Google Scholar] [CrossRef]
- Ankit Dilip Yawale*, P. V. B. R. PEDESTRAIN DETECTION BY VIDEO PROCESSING USING THERMAL AND NIGHT VISION SYSTEM. INTERNATIONAL JOURNAL OF ENGINEERING SCIENCES & RESEARCH TECHNOLOGY 2017, 6(1), 29–38. [CrossRef]
- Yoneyama, A.; Yeh, C.-H.; Kuo, C.-C. J. Robust vehicle and traffic information extraction for highway surveillance. EURASIP Journal on Advances in Signal Processing 2005, vol. 2005(Article ID 912501), 2305–2321. [Google Scholar] [CrossRef]
- Iwasaki, Y.; Kawata, S.; Nakamiya, T. Vehicle detection even in poor visibility conditions using infrared thermal images and its application to road traffic flow monitoring. In Emerging Trends in Computing, Informatics, Systems Sciences, and Engineering; Sobh, T., Elleithy, K., Eds.; Springer Science+Business Media: New York, NY, USA, 2013; pp. 997–1009. [Google Scholar]
- Casado-Sanz, N.; Guirao, B.; Lara Galera, A.; Attard, M. Investigating the Risk Factors Associated with the Severity of the Pedestrians Injured on Spanish Crosstown Roads. Sustainability 2019, 11, 5194. [Google Scholar] [CrossRef]
- Zangenehpour, S.; Miranda-Moreno, L. F.; Saunier, N. Automated classification based on video data at intersections with heavy pedestrian and bicycle traffic: methodology and application. Transportation Research Part C: Emerging Technologies 2015, vol. 56, 161–176. [Google Scholar] [CrossRef]
- Fu, Ting; et al. Automatic Traffic Data Collection under Varying Lighting and Temperature Conditions in Multimodal Environments: Thermal versus Visible Spectrum Video-Based Systems. Journal of Advanced Transportation 2017, 2017, 1–15. [Google Scholar] [CrossRef]
- Available online: https://2012books.lardbucket.org/books/beginning-psychology/s08-02-seeing.html.
- Faundez-Zanuy, Marcos; Mekyska, Jiří; Espinosa-Duró, Virginia. On the focusing of thermal images. Volume 2011, Volume 32(Issue 11), 1548–1557. [Google Scholar] [CrossRef]
- Available online: https://www.icnirp.org/en/frequencies/infrared/index.html.
- Beg, M. S.; Ismail, M. Y.; Badrulhisam, N. H.; Siswanto, I.; Gunadi, G. “Improving Vehicle Assistance Systems: Evaluation of Augmented Capabilities through Infrared Thermal Camera Integration”. Int. J. Automot. Mech. Eng. 2025, vol. 22(no. 1), 12236–12252. [Google Scholar] [CrossRef]
- Farooq, M. A.; Shariff, W.; O’Callaghan, D.; Merla, A.; Corcoran, P. On the Role of Thermal Imaging in Automotive Applications: A Critical Review. In IEEE Access; Crossref, 2023; Vol. 11, pp. 25152–25173. [Google Scholar]
- Tashev, A.; Dimitrov, E. Investigation of LPG influence on cylinder pressure of VW 1.9D diesel engine operating in dual-fuel mode. AIP Conf. Proc. vol. 3274(060003), 2025. [CrossRef]
- P. Mitev “Development of a Training Station for the Orientation of Dice Parts with Machine Vision”. Eng. Proc. 2024, vol. 70, no.1, https://doi.org/10.3390/engproc2024070057HYQUIP Limited, A4FM Series 10 & 30 Size 71 to 1000: https://hyquip.co.uk/fixed-displacement-motors/4147-bosch-rexroth-fixed-displacementmotors- a4fm.html. [CrossRef]
- Wolf, A.; Pezoa, J.E.; Figueroa, M. Modeling and Compensating Temperature-Dependent Non-Uniformity Noise in IR Microbolometer Cameras. Sensors 2016, 16, 1121. [Google Scholar] [CrossRef] [PubMed]
- König, S.; Gutschwager, B.; Taubert, R. D.; Hollandt, J. : Metrological characterization and calibration of thermographic cameras for quantitative temperature measurement. J. Sens. Sens. Syst. 9, 425–442. [CrossRef]
- Igual, J. Photographic Noise Performance Measures Based on RAW Files Analysis of Consumer Cameras. Electronics 2019, 8, 1284. [Google Scholar] [CrossRef]
- Lee, H.; Kang, M.G. Infrared Image Deconvolution Considering Fixed Pattern Noise. Sensors 2023, 23, 3033. [Google Scholar] [CrossRef] [PubMed]
Figure 1.
UTi260M thermal imager.
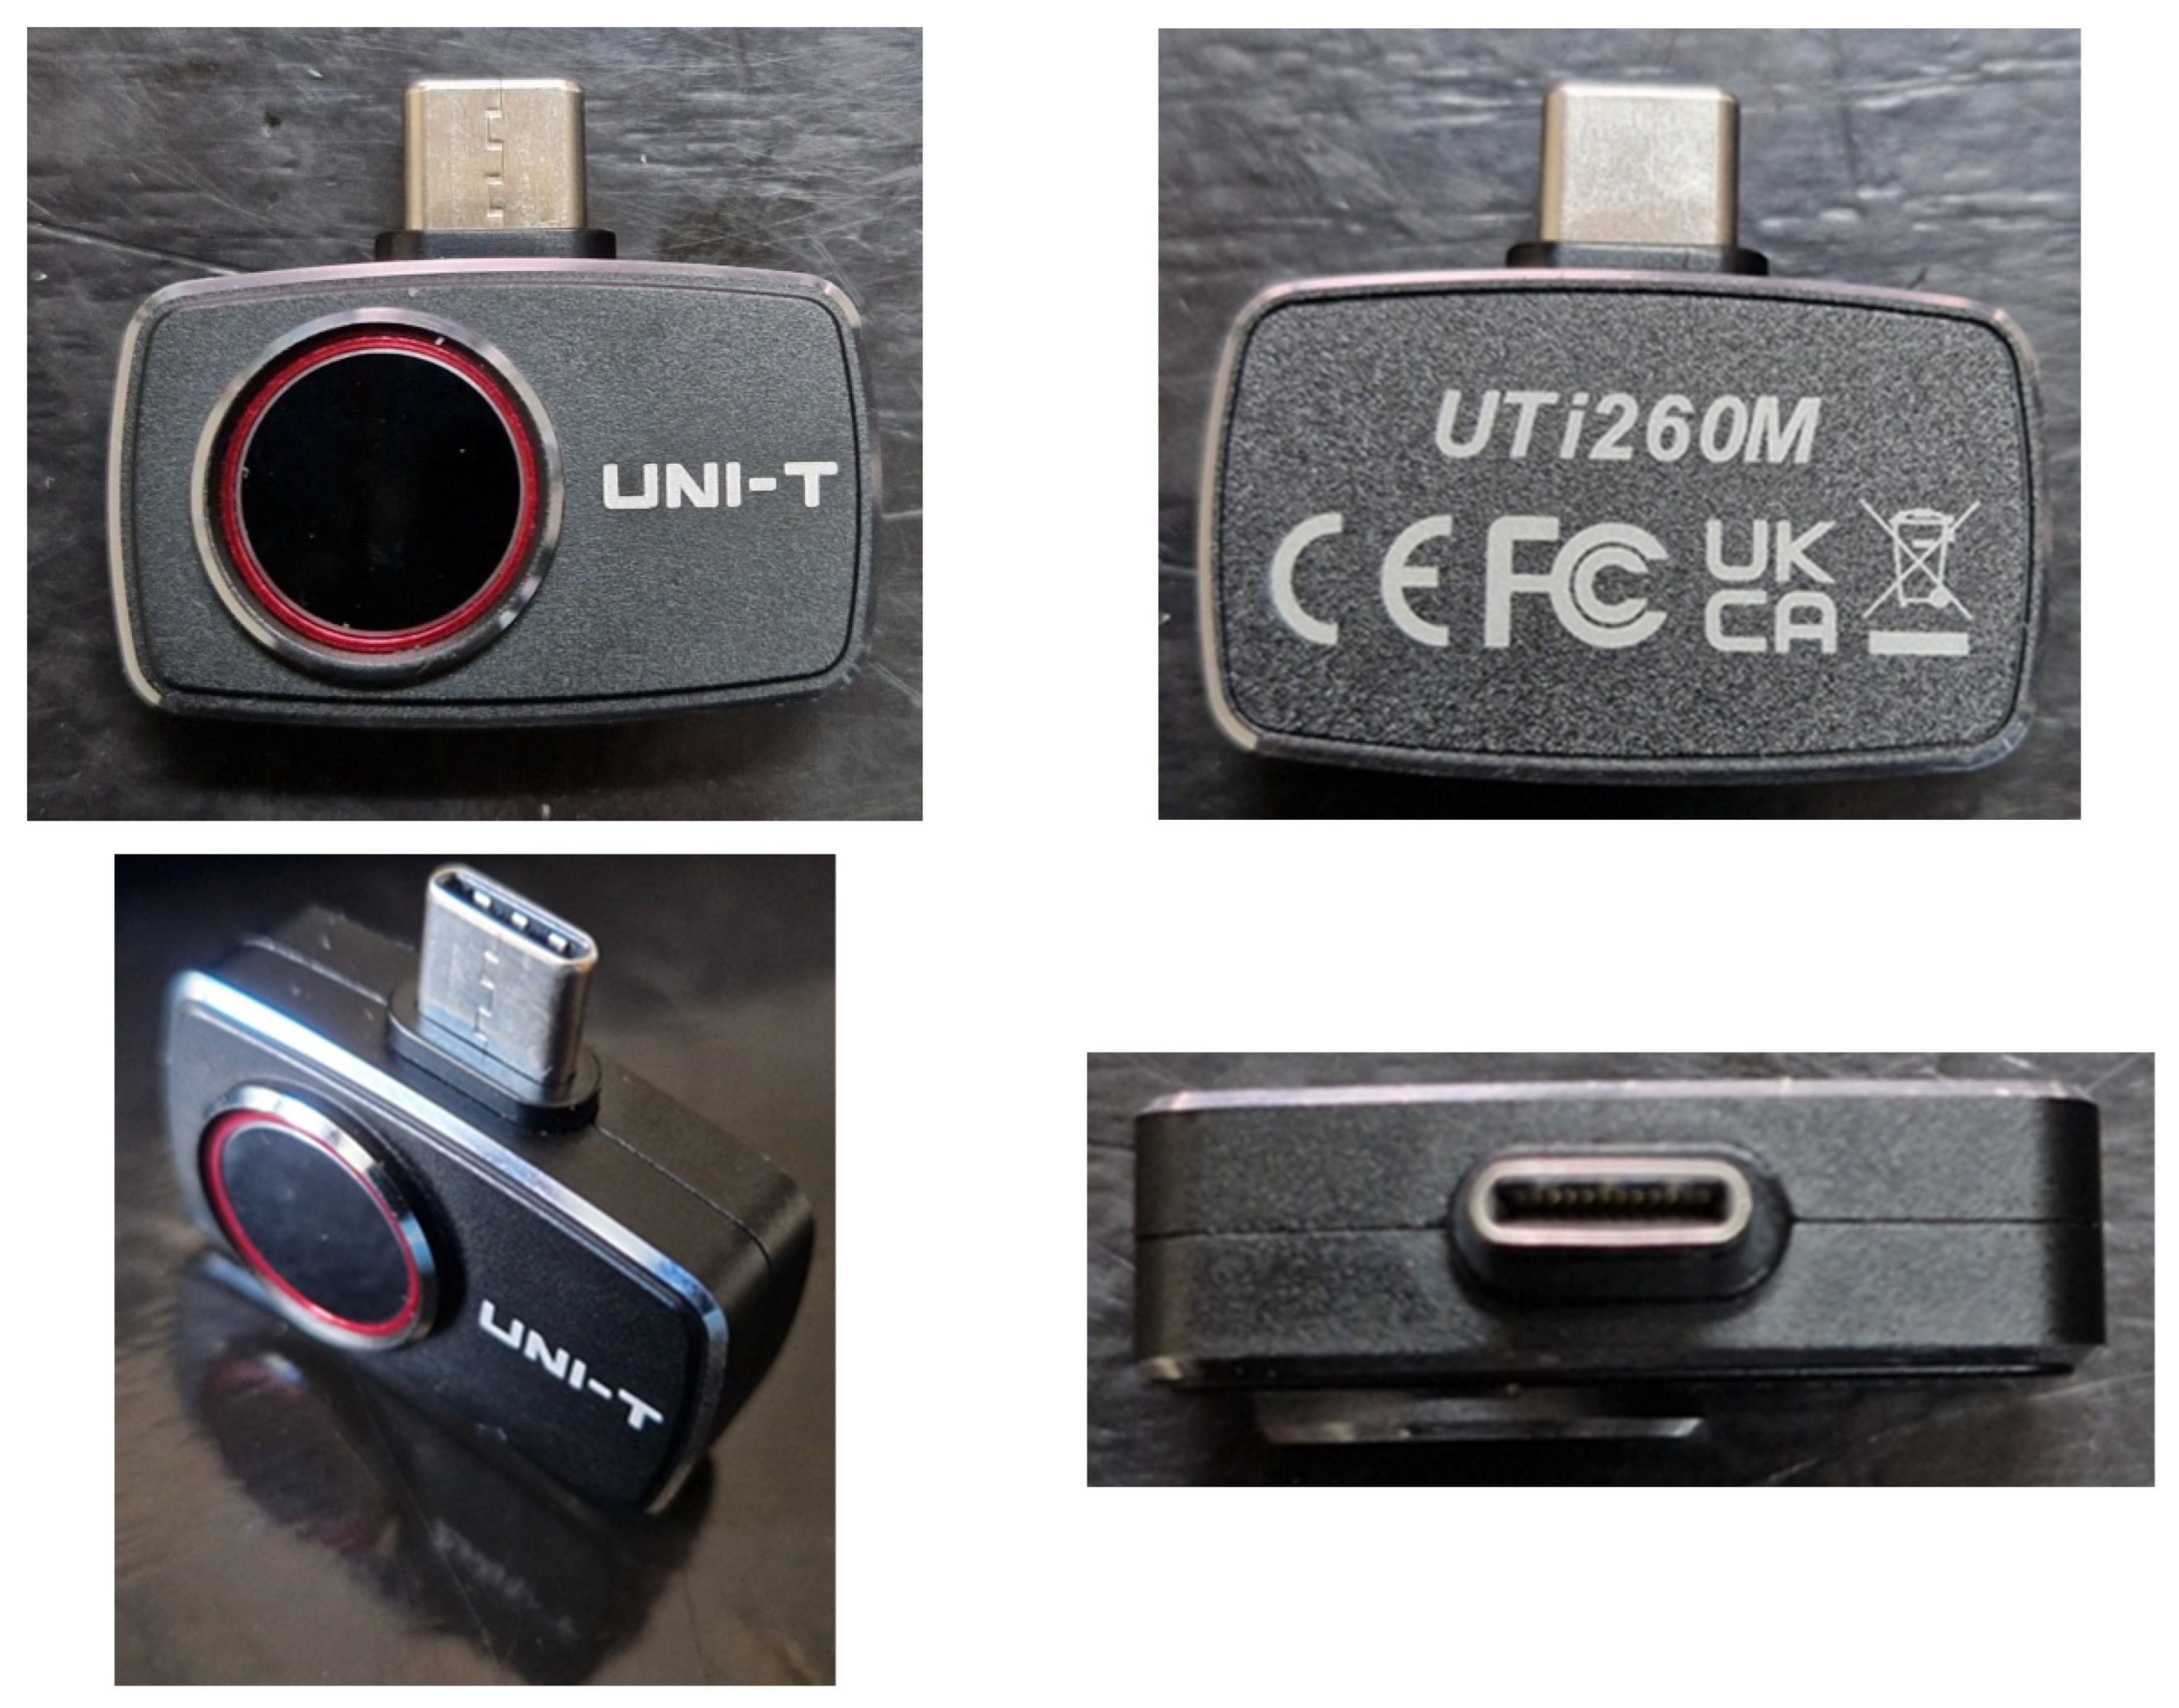
Figure 2.
UTi260T thermal imager.
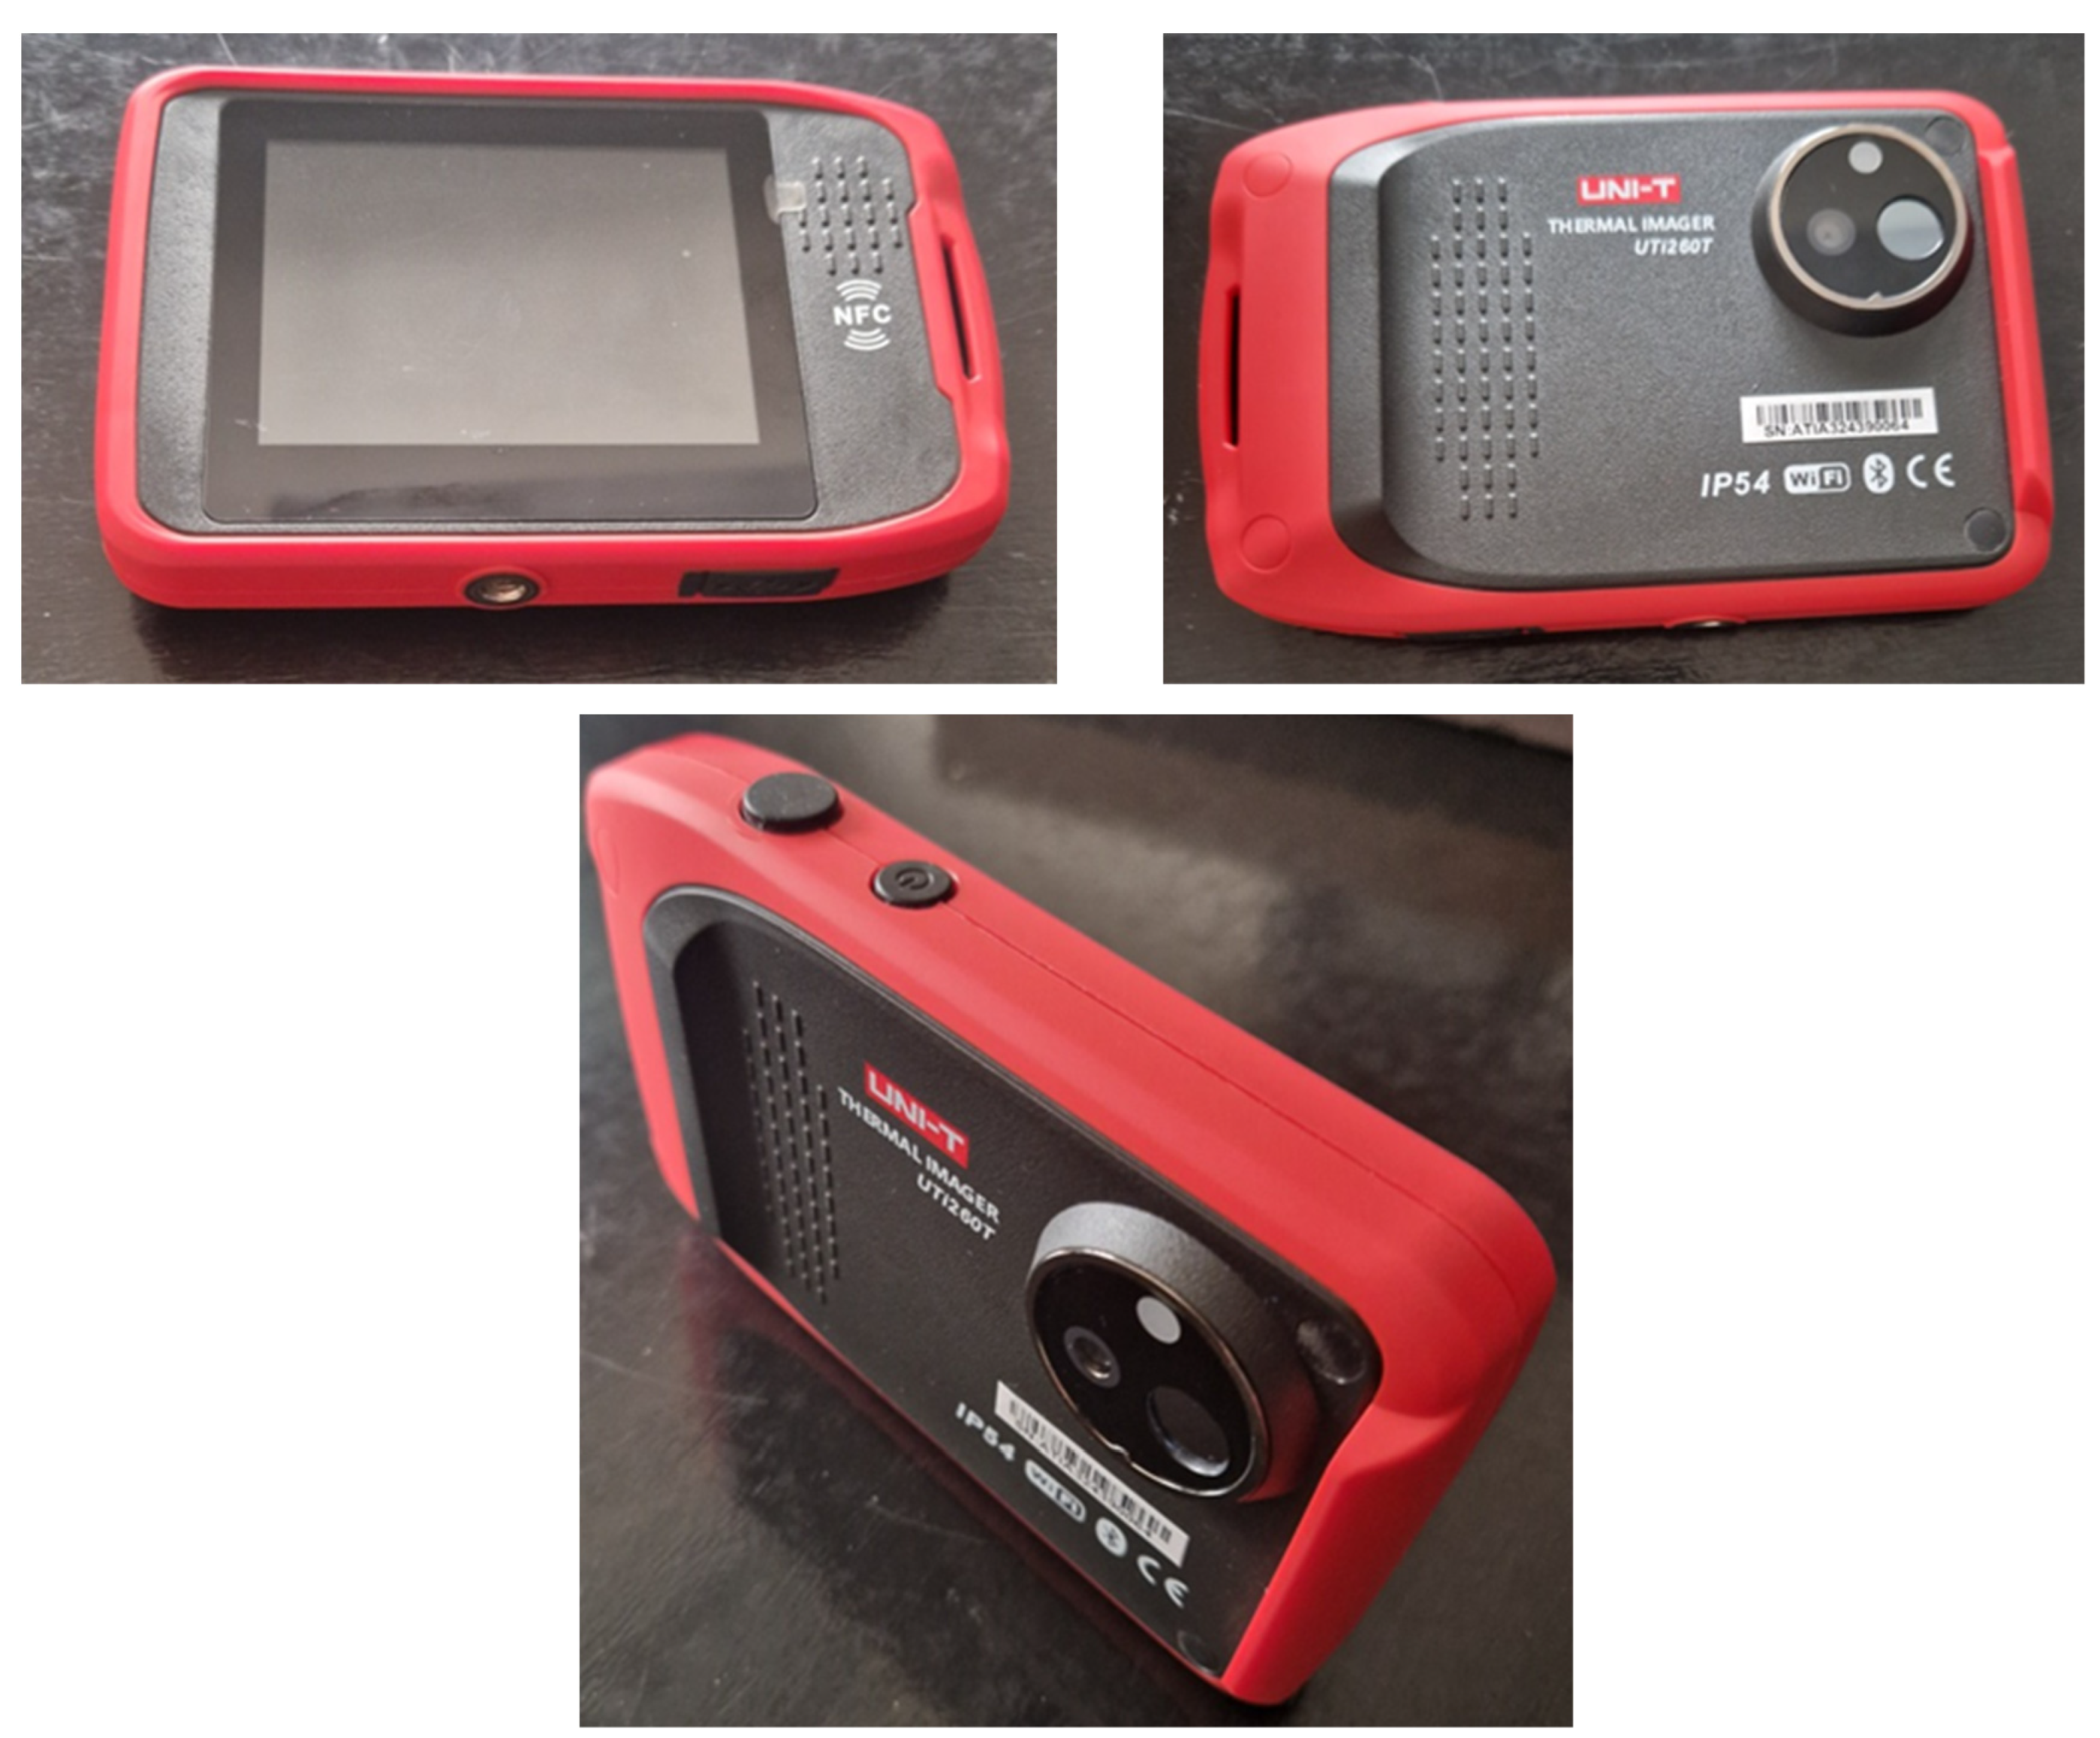
Figure 4.
Camera mounting configuration and positions on the vehicle: (a) UTi260T (pos. 1) on roof; UTi260M (pos. 2) near side mirror; (b) example mounting view.
Figure 4.
Camera mounting configuration and positions on the vehicle: (a) UTi260T (pos. 1) on roof; UTi260M (pos. 2) near side mirror; (b) example mounting view.

Figure 5.
Verification of smartphone streaming/recording and thermal responsiveness using an in-vehicle heat source.
Figure 5.
Verification of smartphone streaming/recording and thermal responsiveness using an in-vehicle heat source.
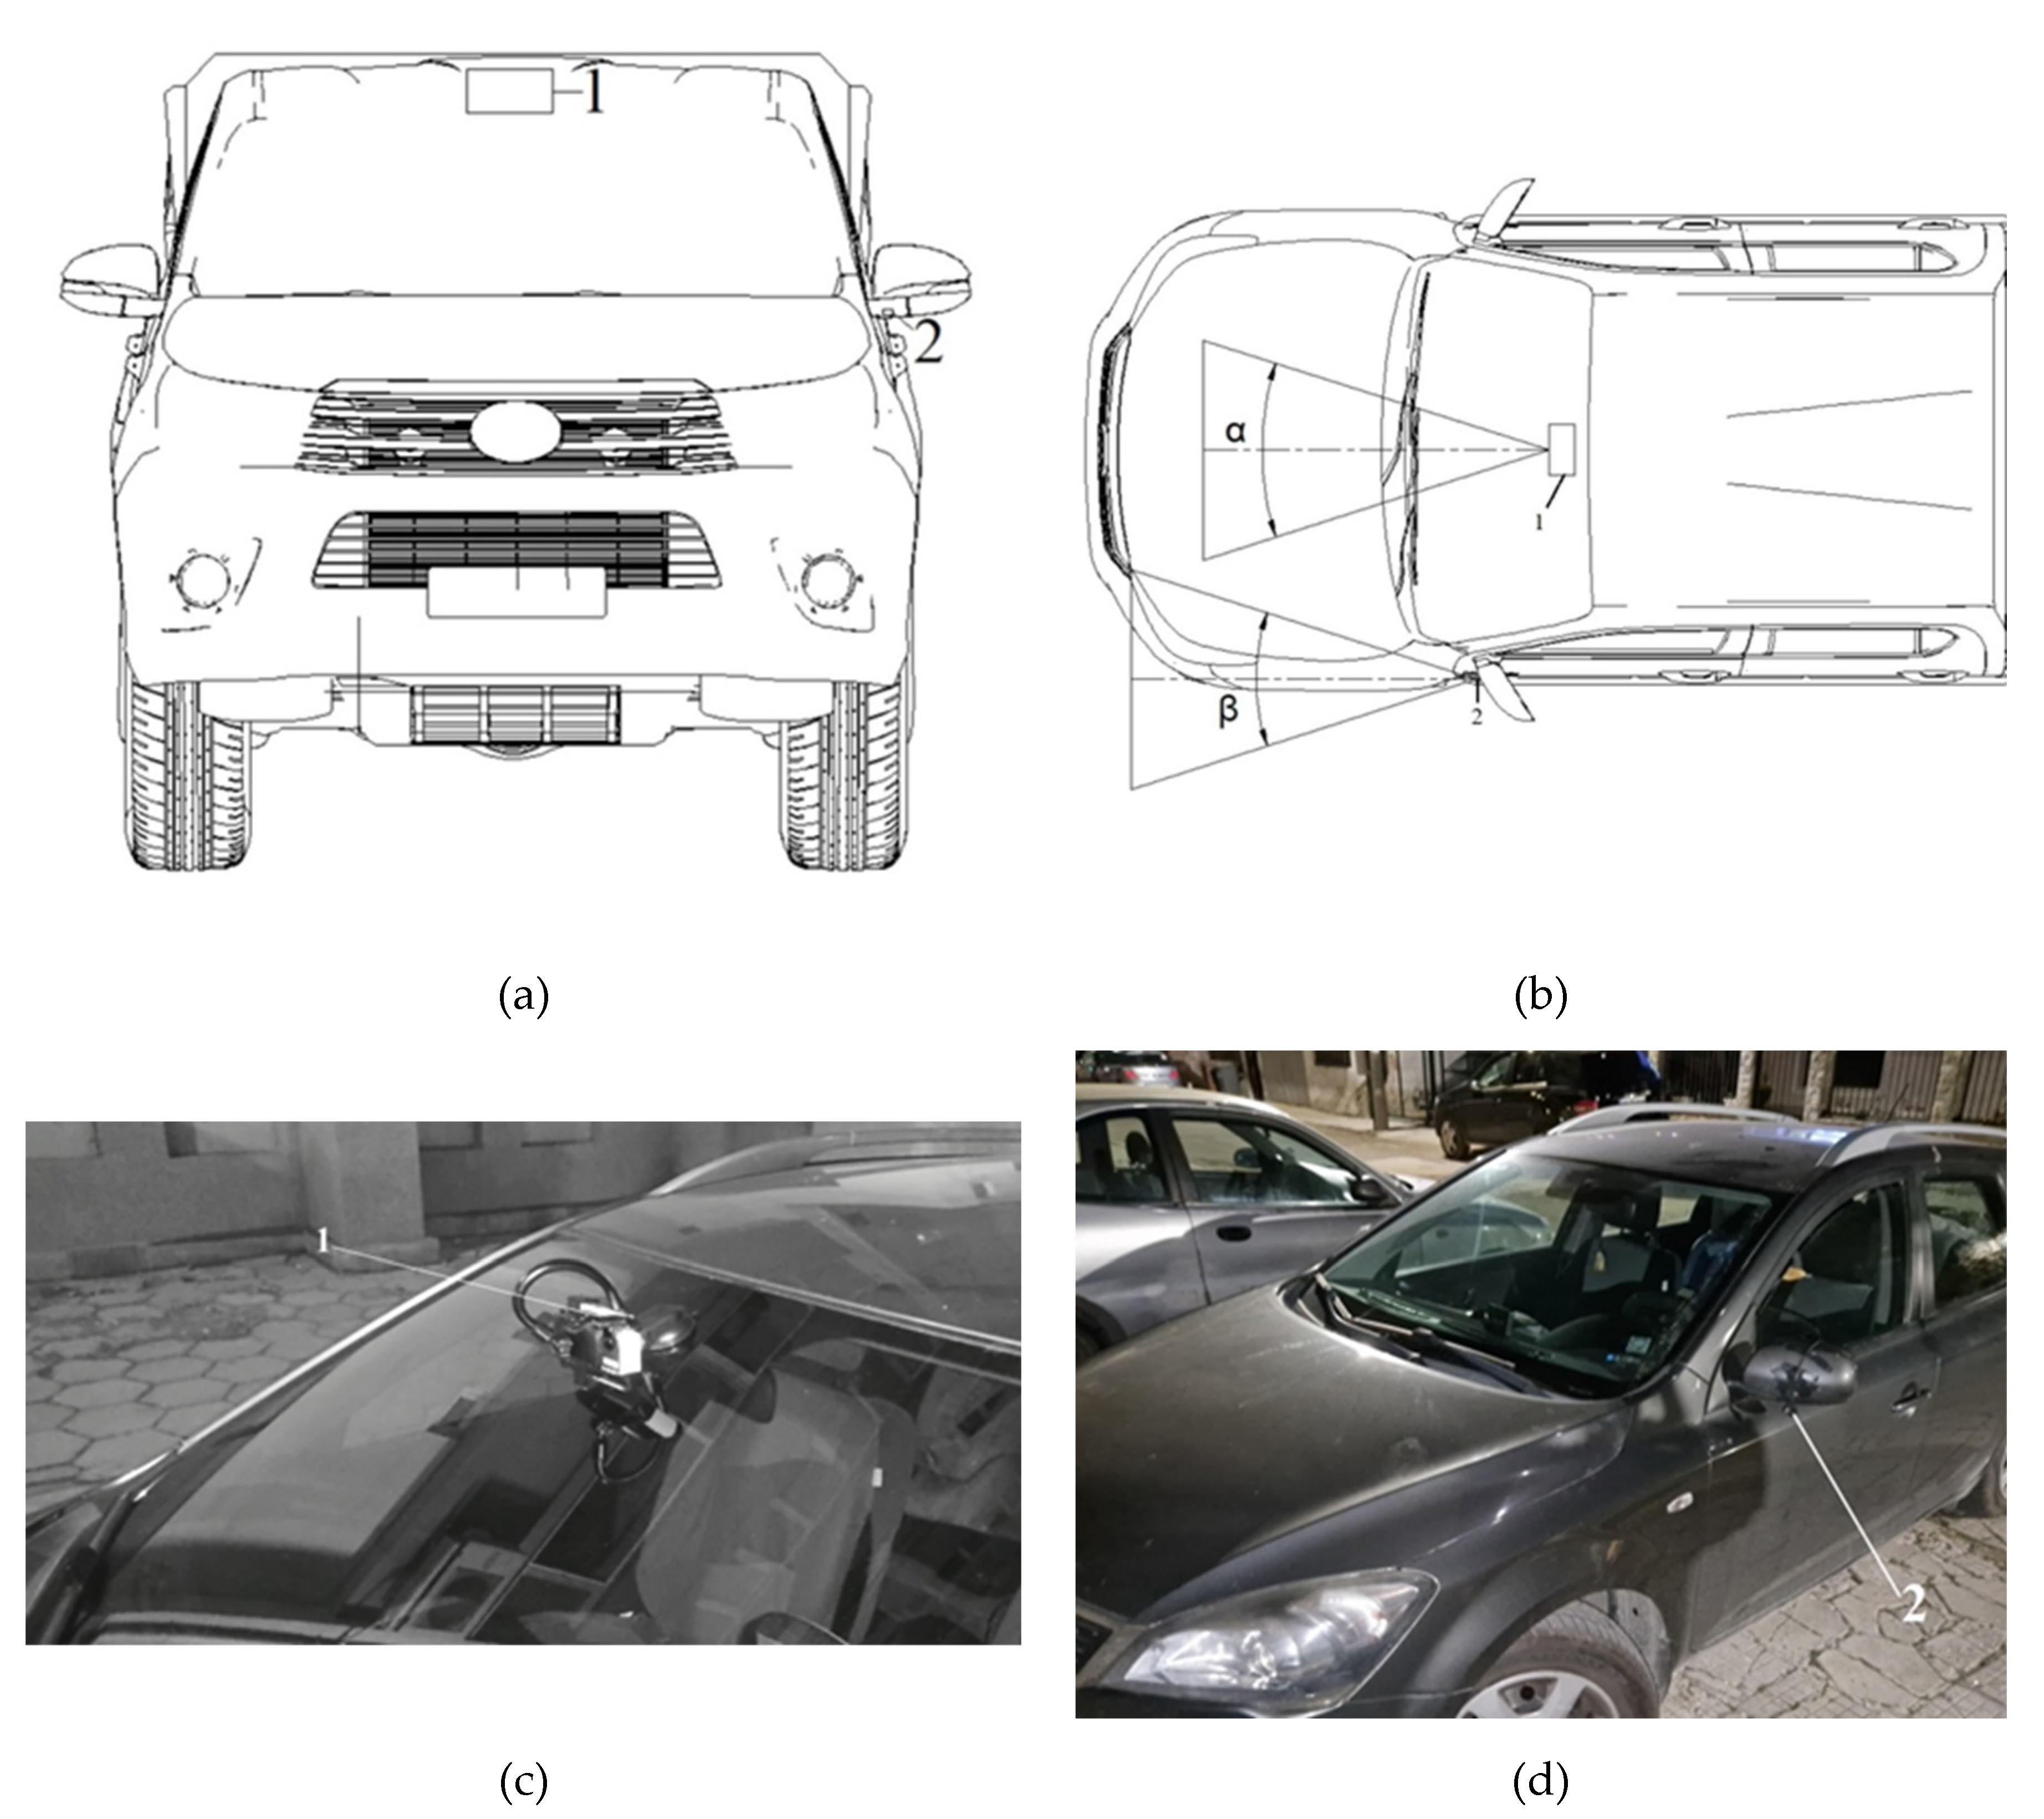
Figure 6.
Example illustrating sky-induced AGC/contrast shift and appearance changes at low temperature conditions.
Figure 6.
Example illustrating sky-induced AGC/contrast shift and appearance changes at low temperature conditions.
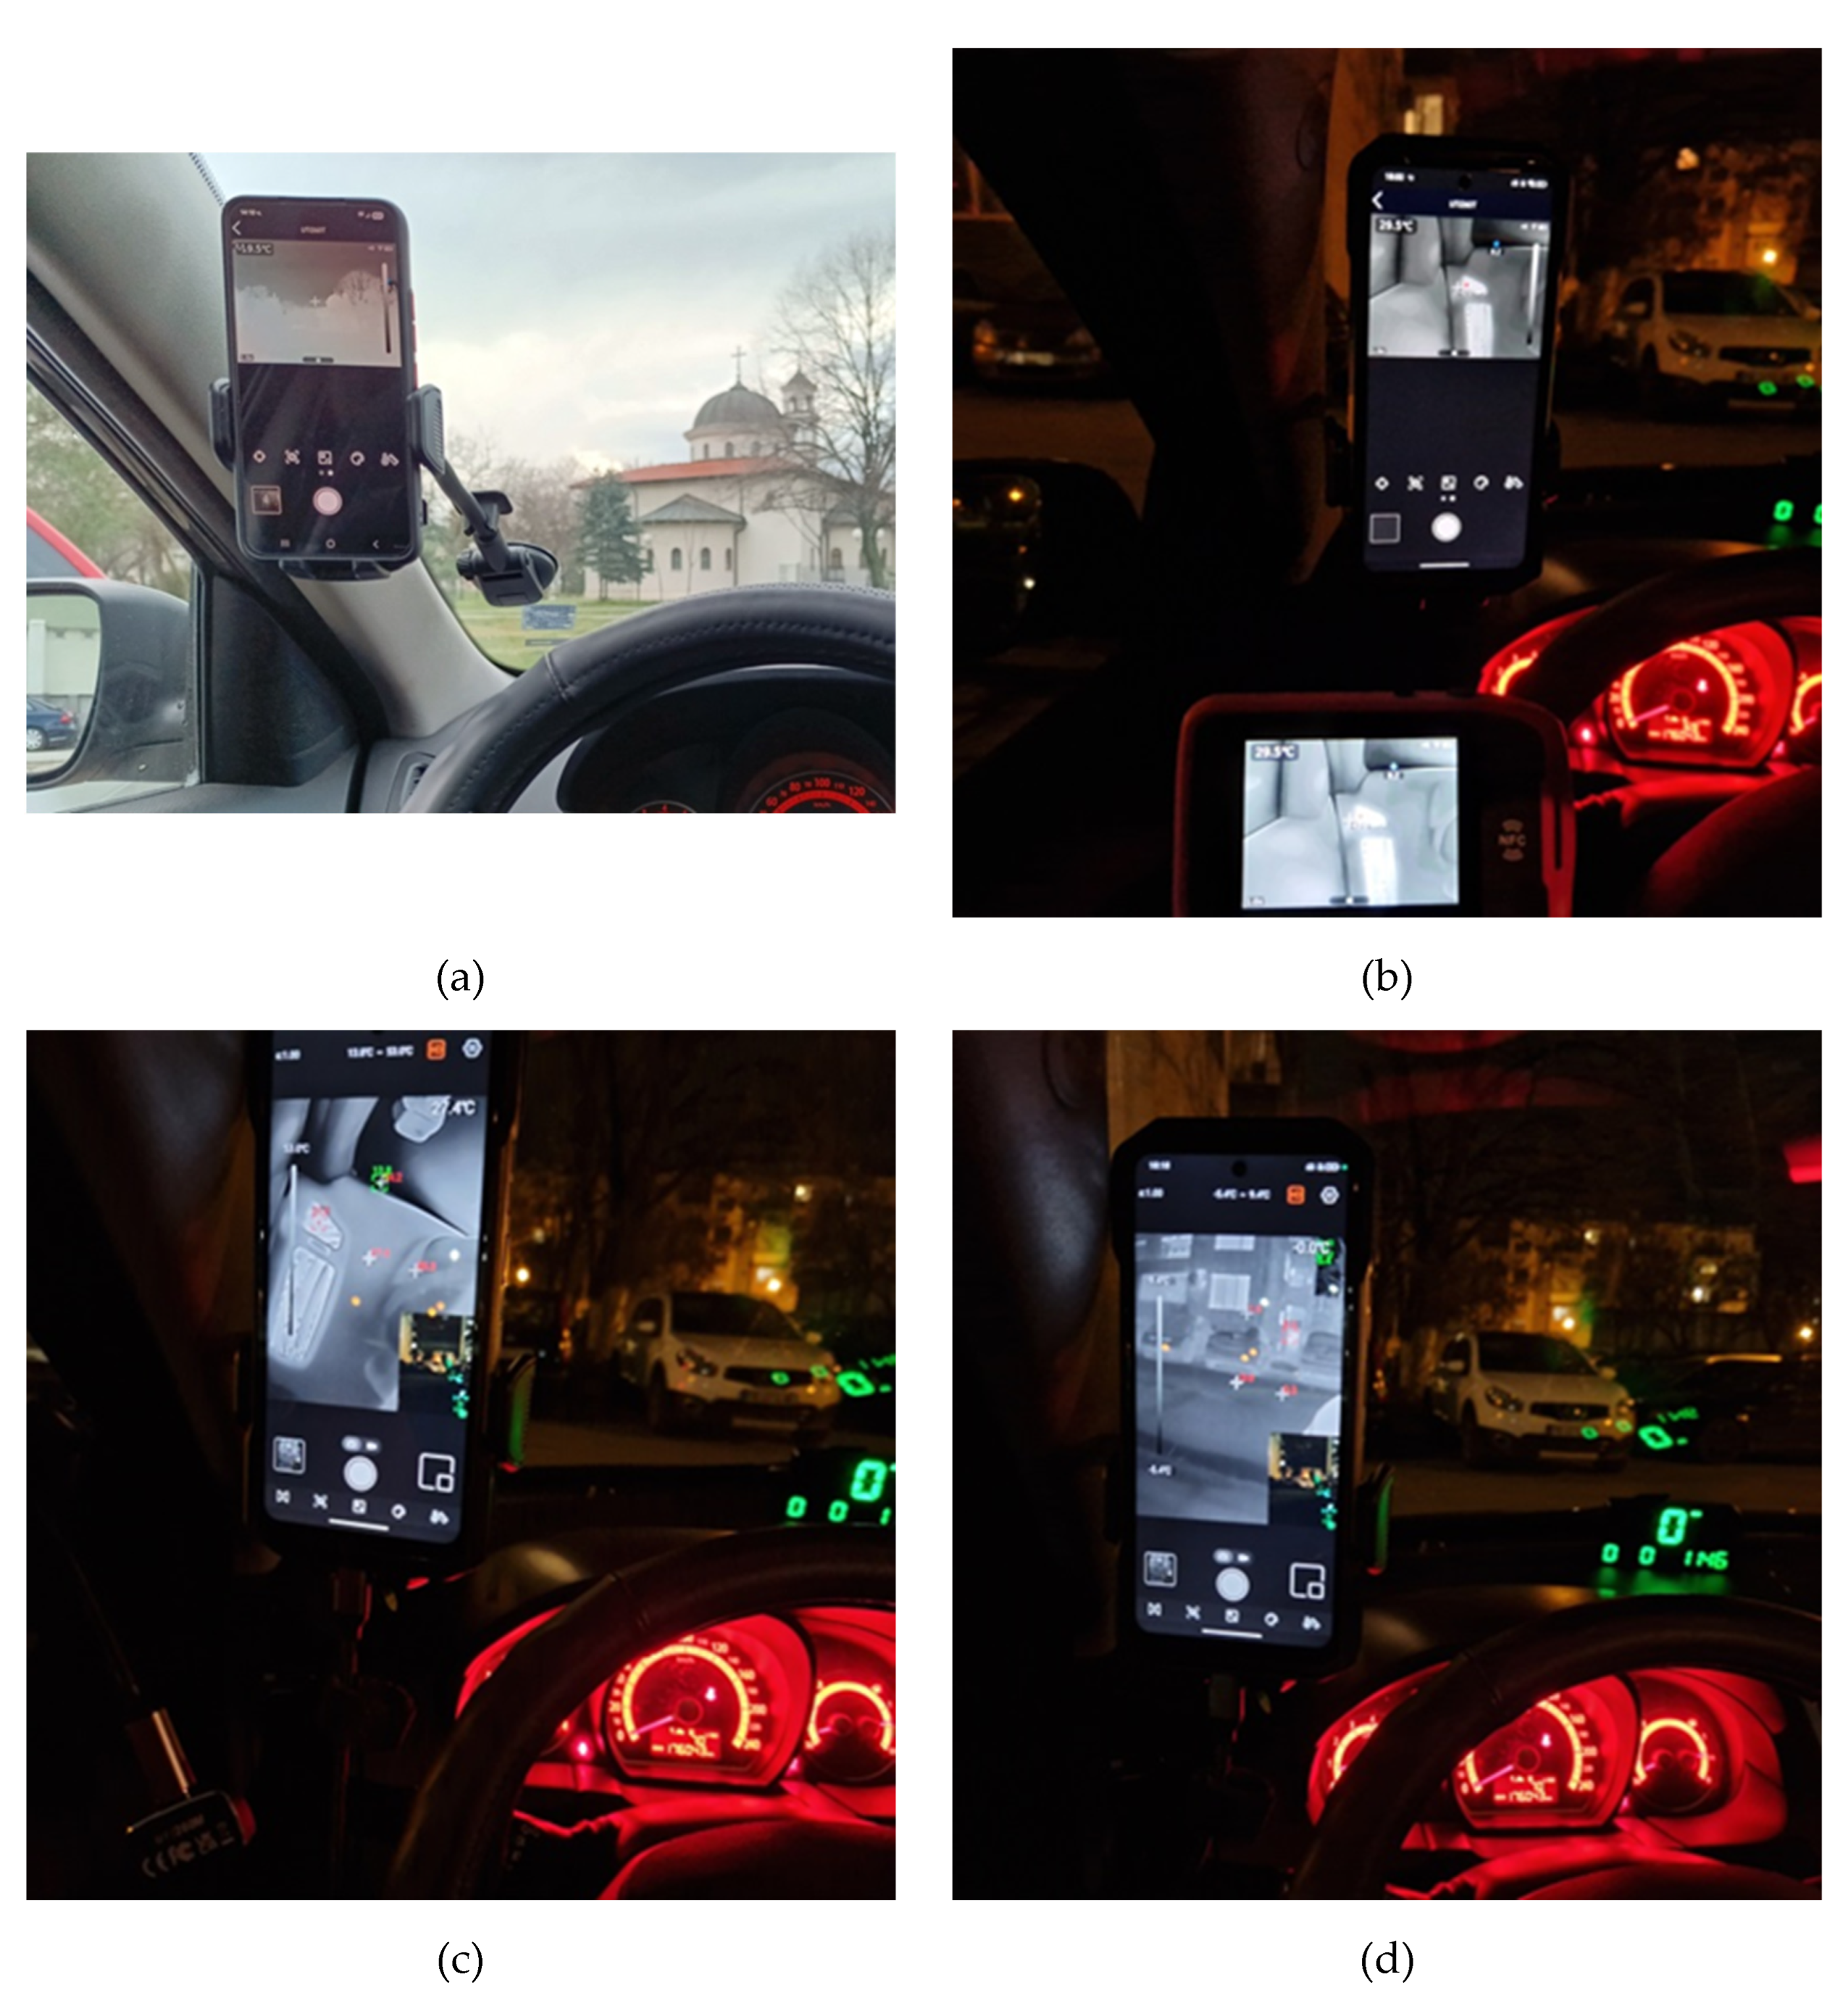
Figure 7.
Uti260T night-time frame and visualization in analysis software: (a) thermal frame with software overlay tools (processing/visualization); (b) corresponding baseline (“normal”) view.
Figure 7.
Uti260T night-time frame and visualization in analysis software: (a) thermal frame with software overlay tools (processing/visualization); (b) corresponding baseline (“normal”) view.
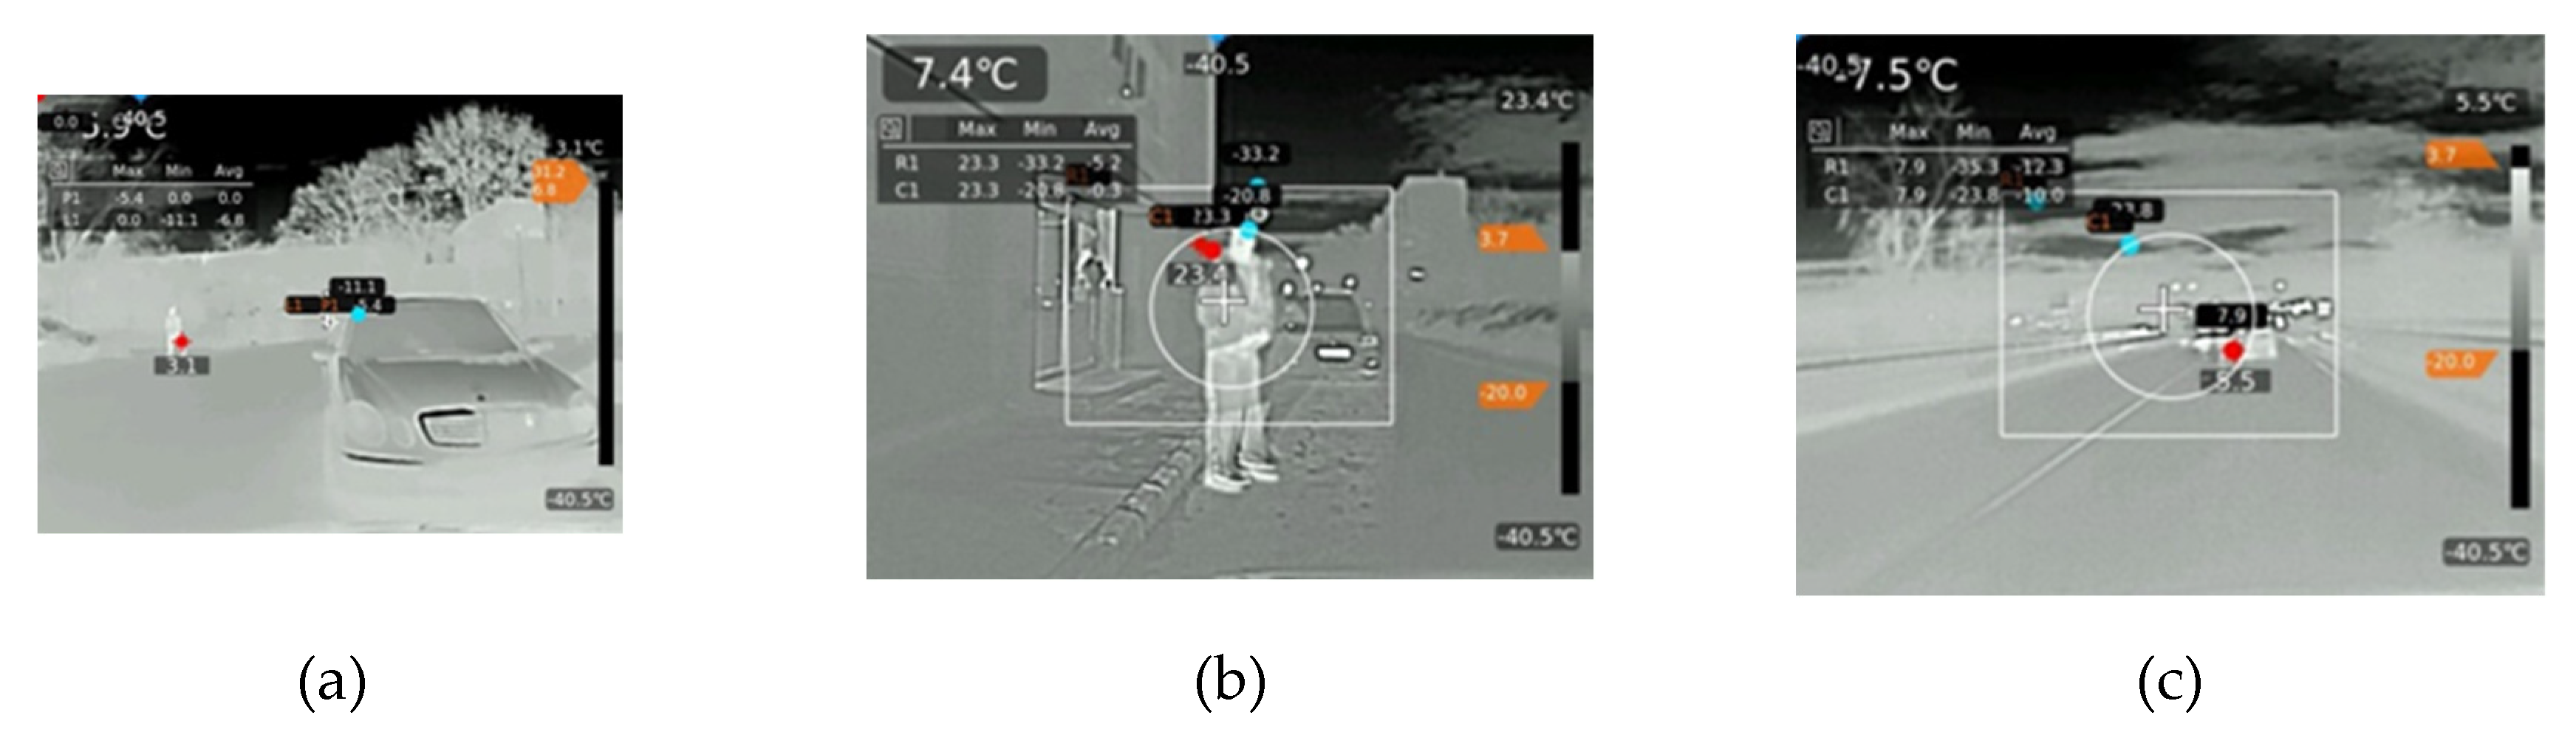
Figure 8.
UTi260T night-time frame for a different scene and visualization in analysis software: (a) thermal frame with activated processing/visualization tools; (b) baseline (“normal”) view for comparison.
Figure 8.
UTi260T night-time frame for a different scene and visualization in analysis software: (a) thermal frame with activated processing/visualization tools; (b) baseline (“normal”) view for comparison.
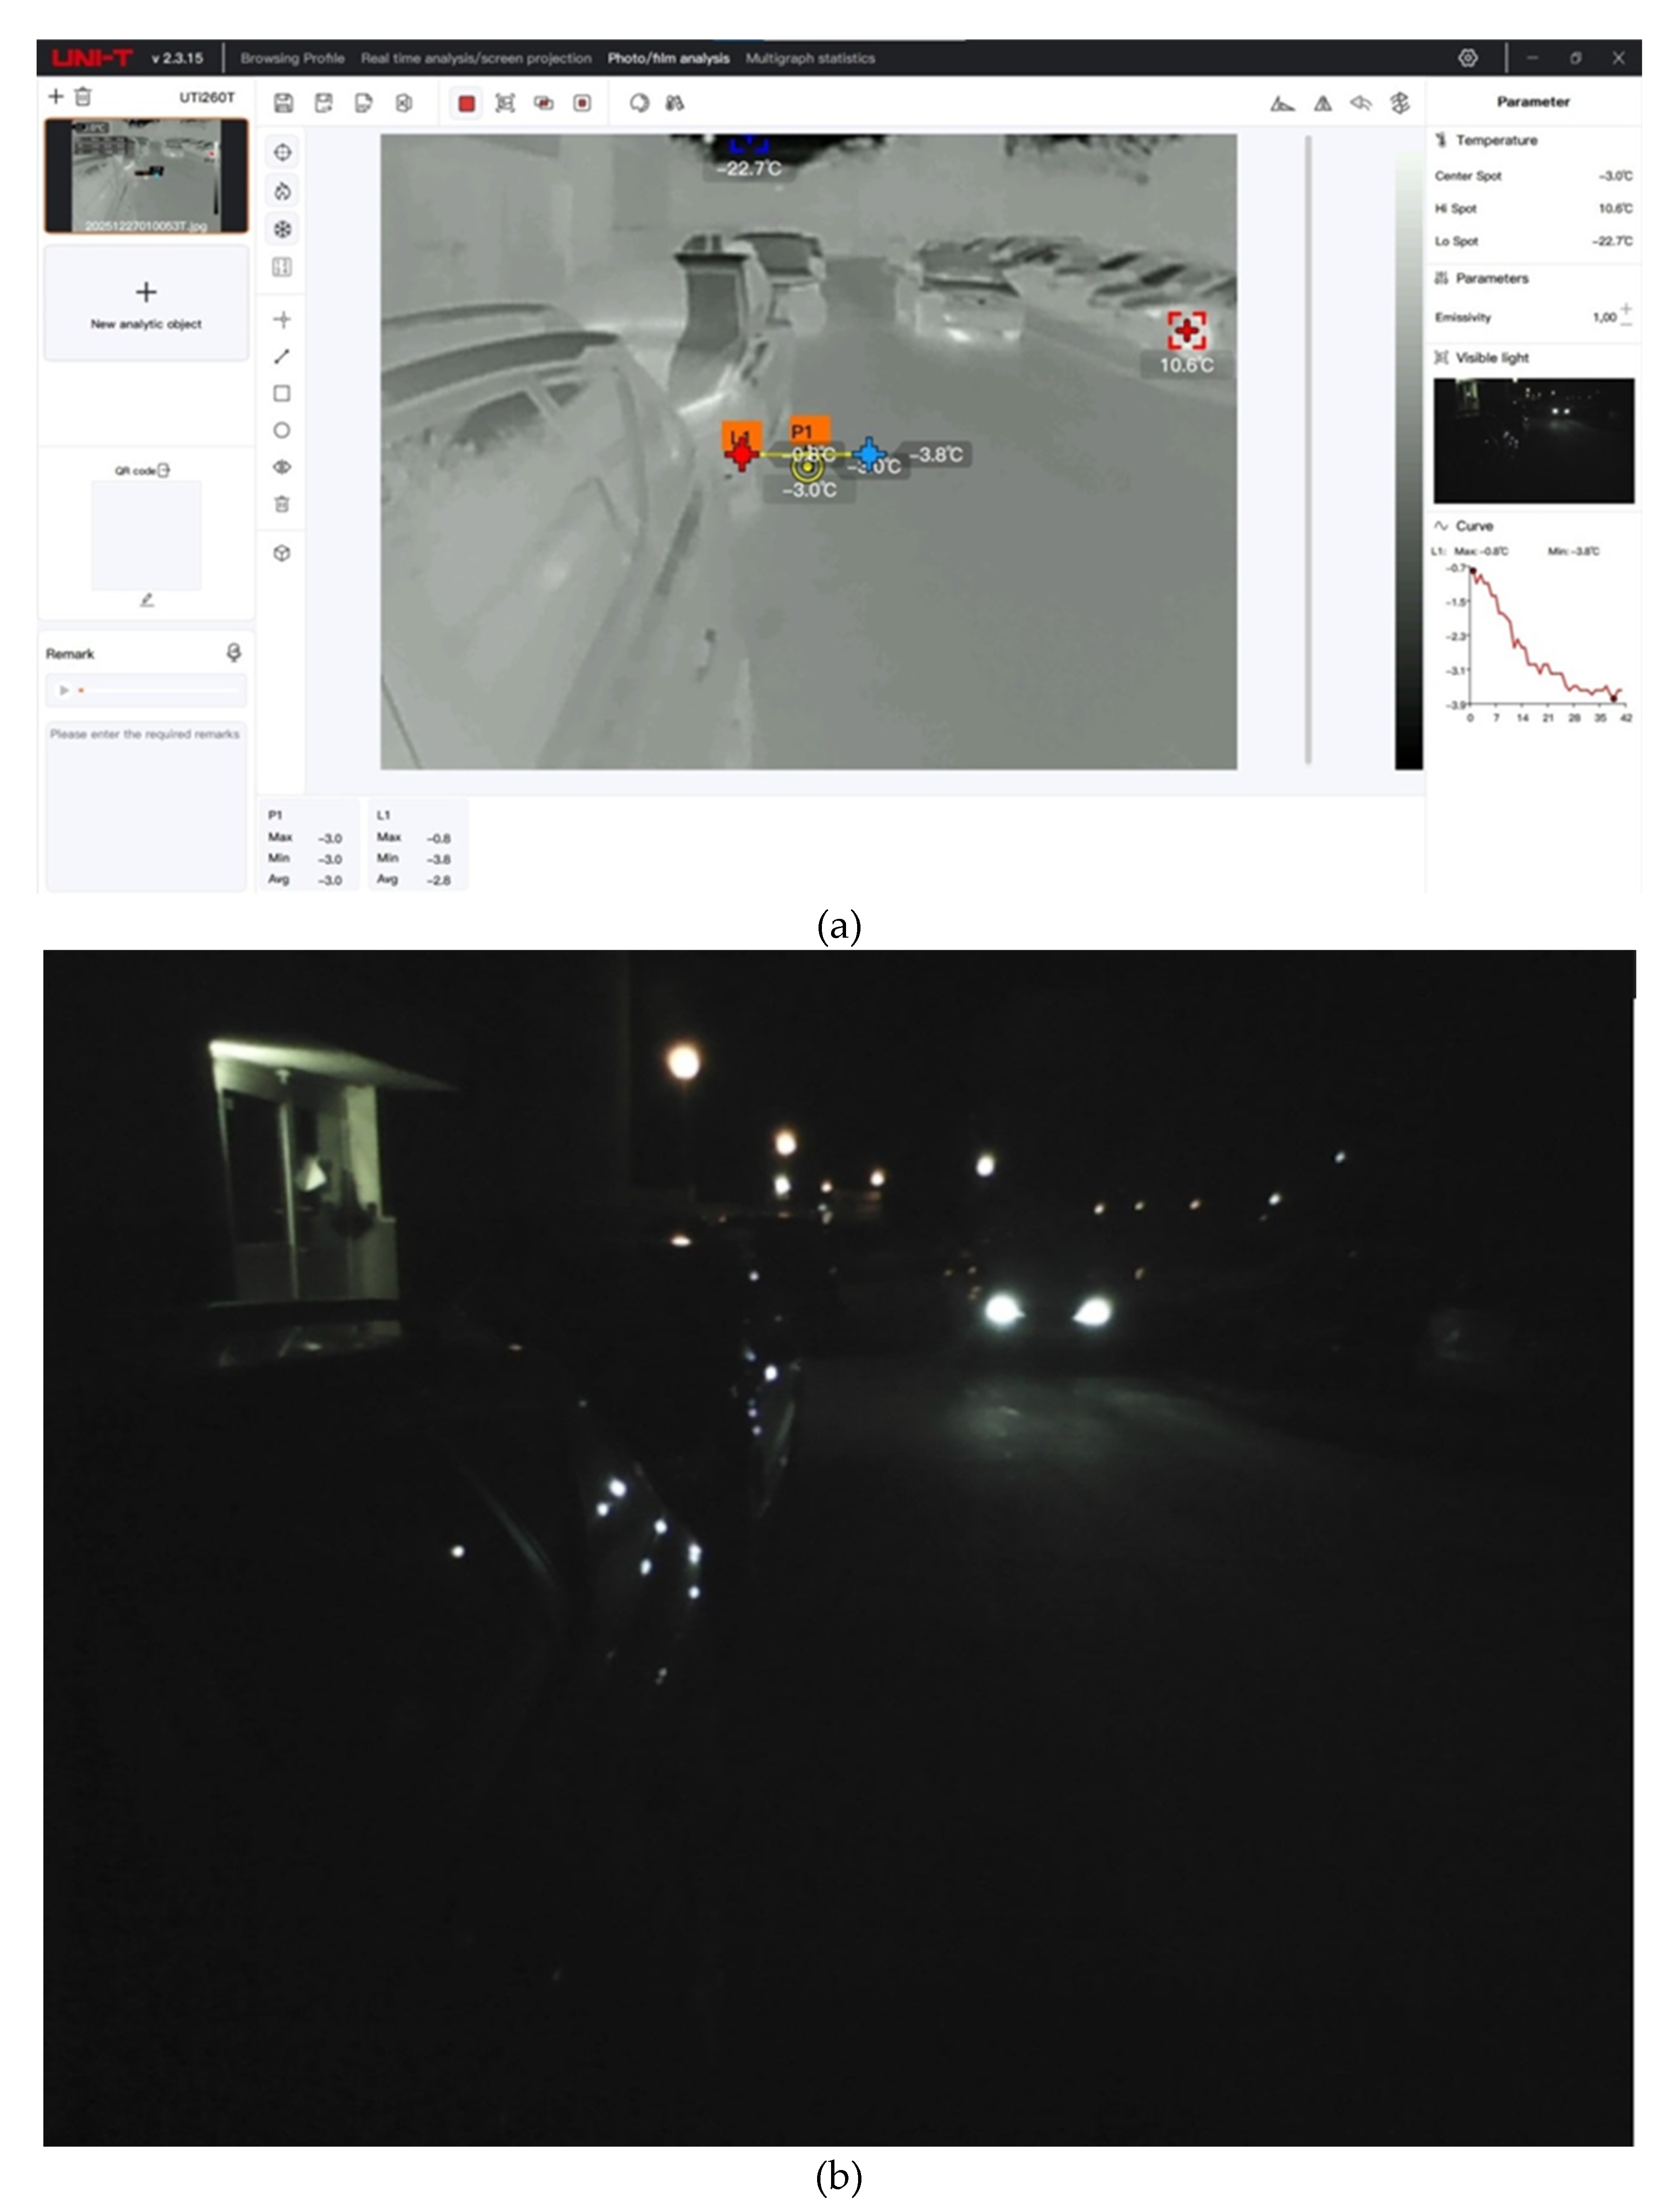
Figure 9.
Thermal frame captured with UTi260M and visualized via a smartphone application under night-time conditions. The frame demonstrates automatic highlighting of a higher apparent-temperature target (e.g., a vehicle) and illustrates how scene composition (open horizon/sky) may influence automatic dynamic-range scaling.: (a) Gray scale; (b) Red hot; (c) Black White; (d) Lava; (d) Iron red.
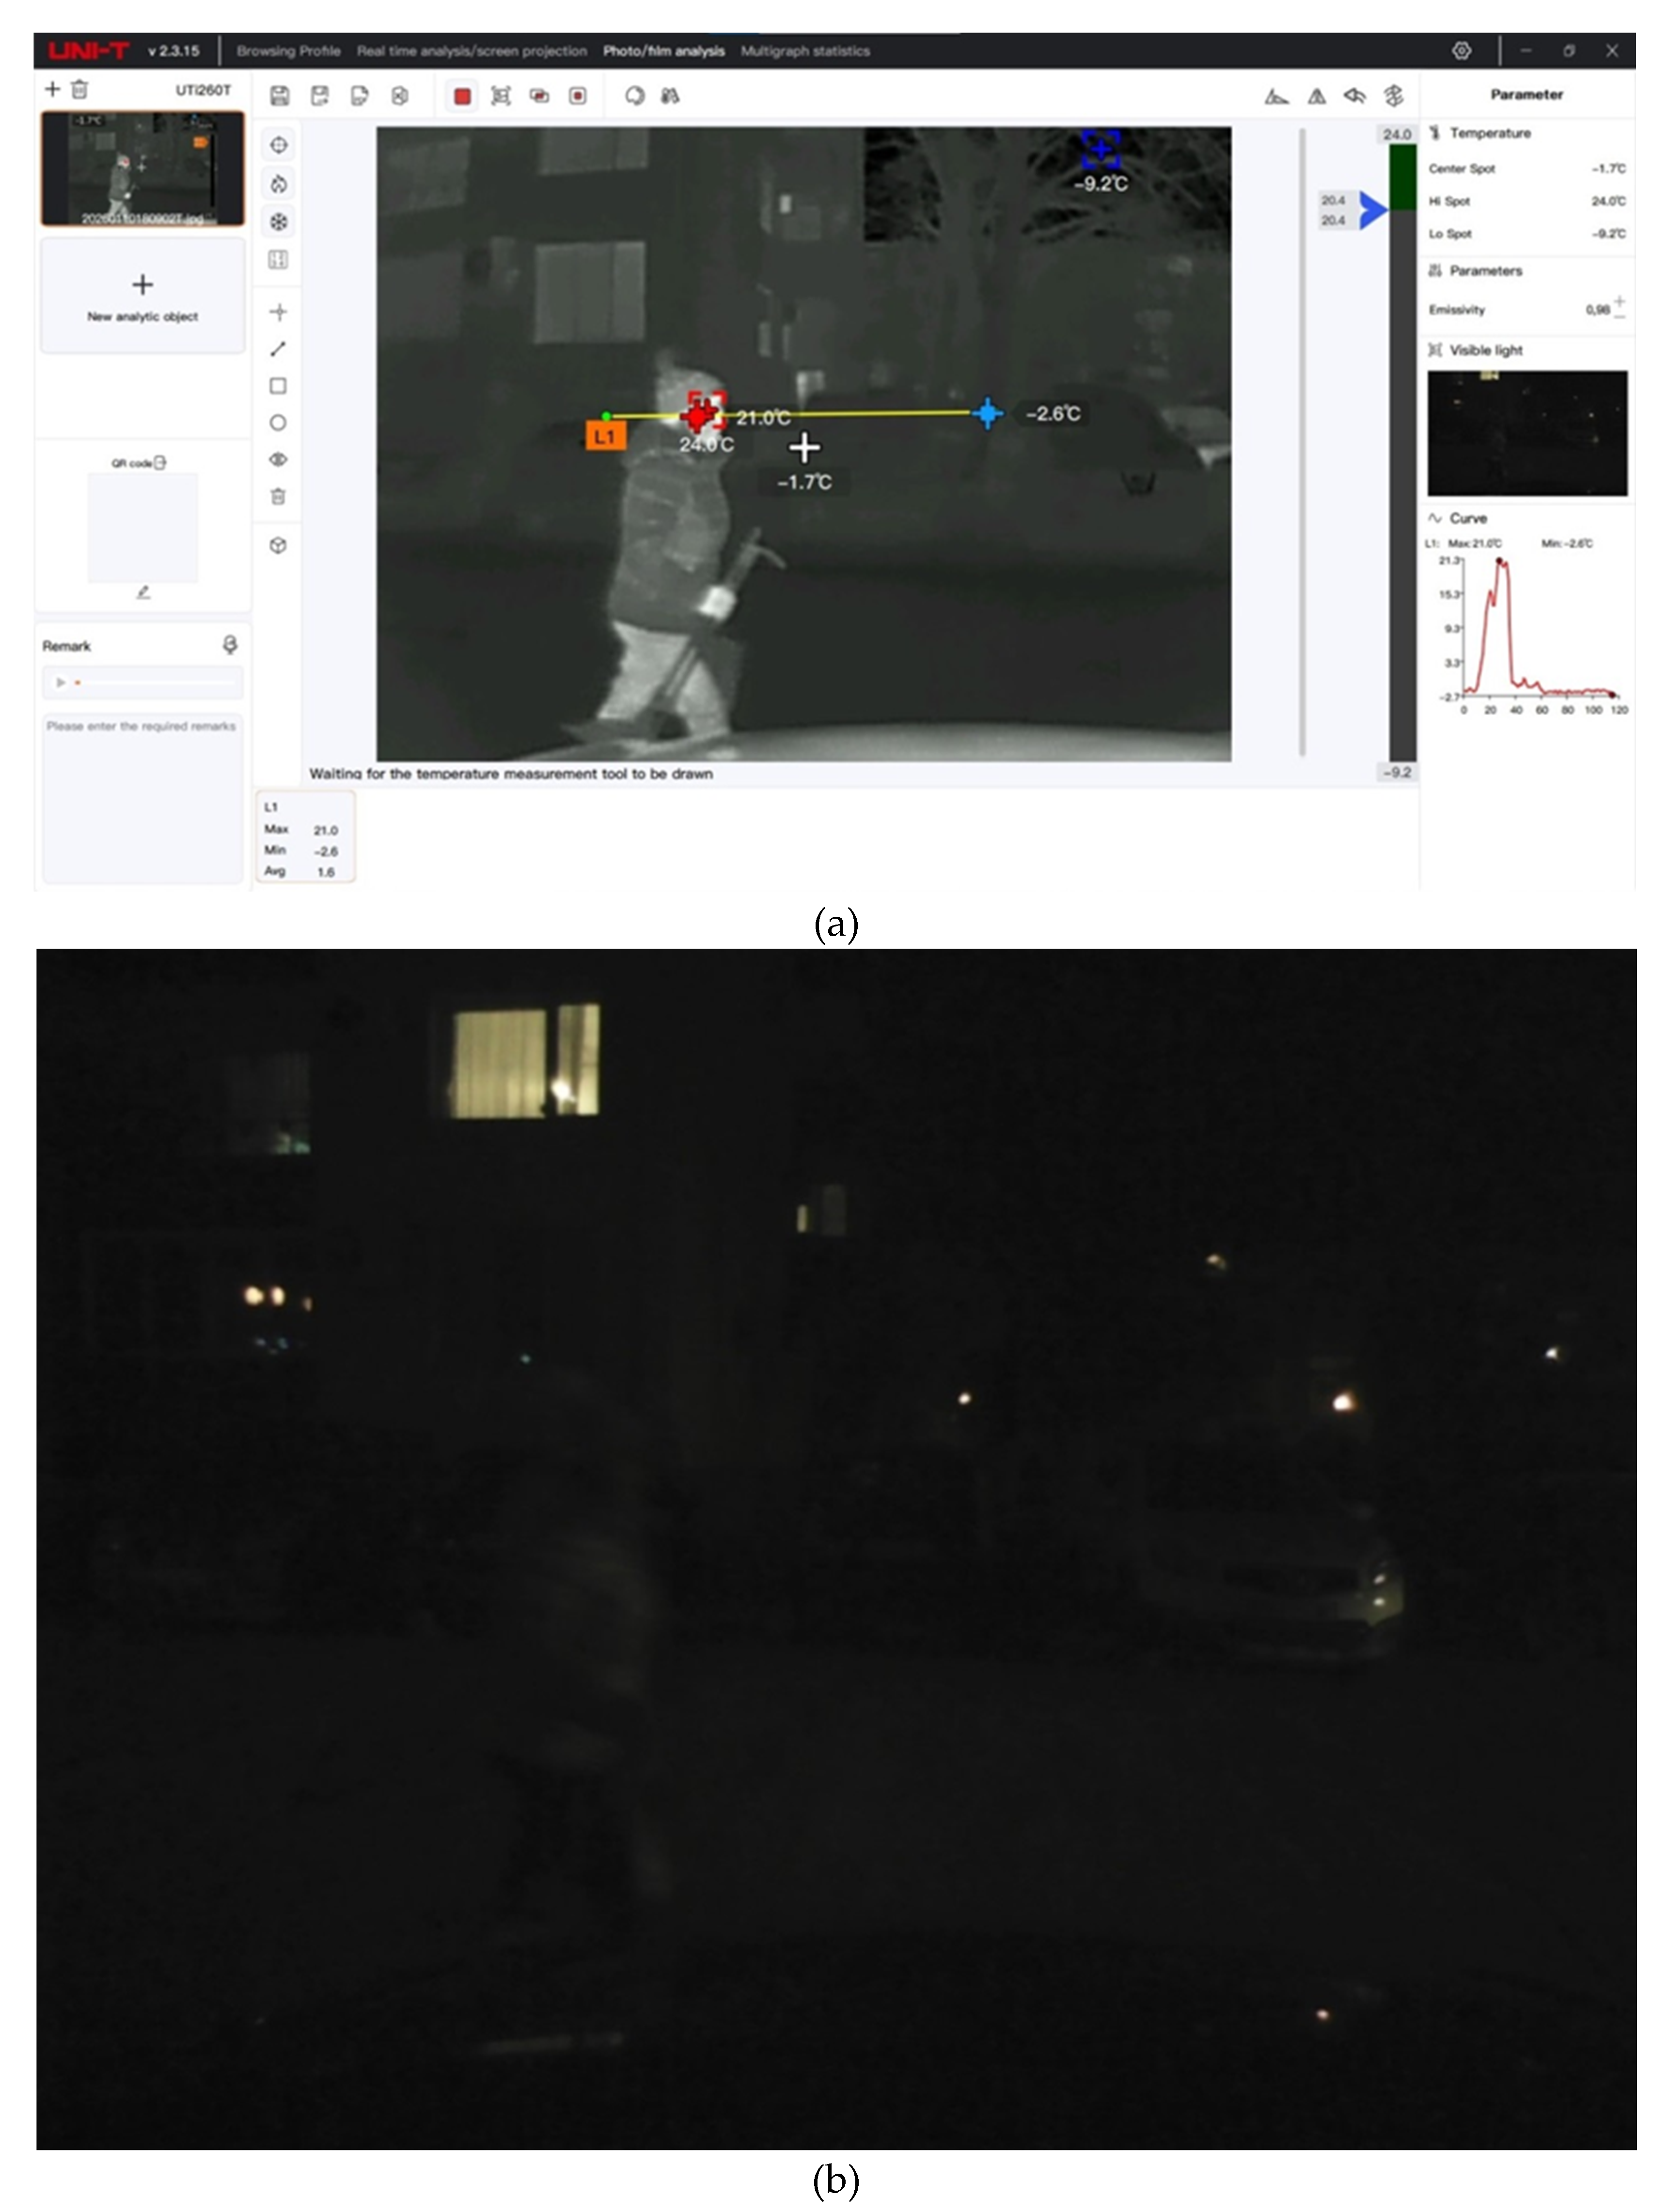
Figure 10.
Thermal frame acquired with UTi260M used for monocular distance calibration and single-frame pedestrian ranging based on the “real height–pixel height” relationship. The pedestrian (≈1.95 m) is represented by a bounding box, from which the pixel height is measured and used to estimate the distance after prior calibration. The visible-light view (inset) is included for contextual reference under low illumination and oncoming headlight conditions.
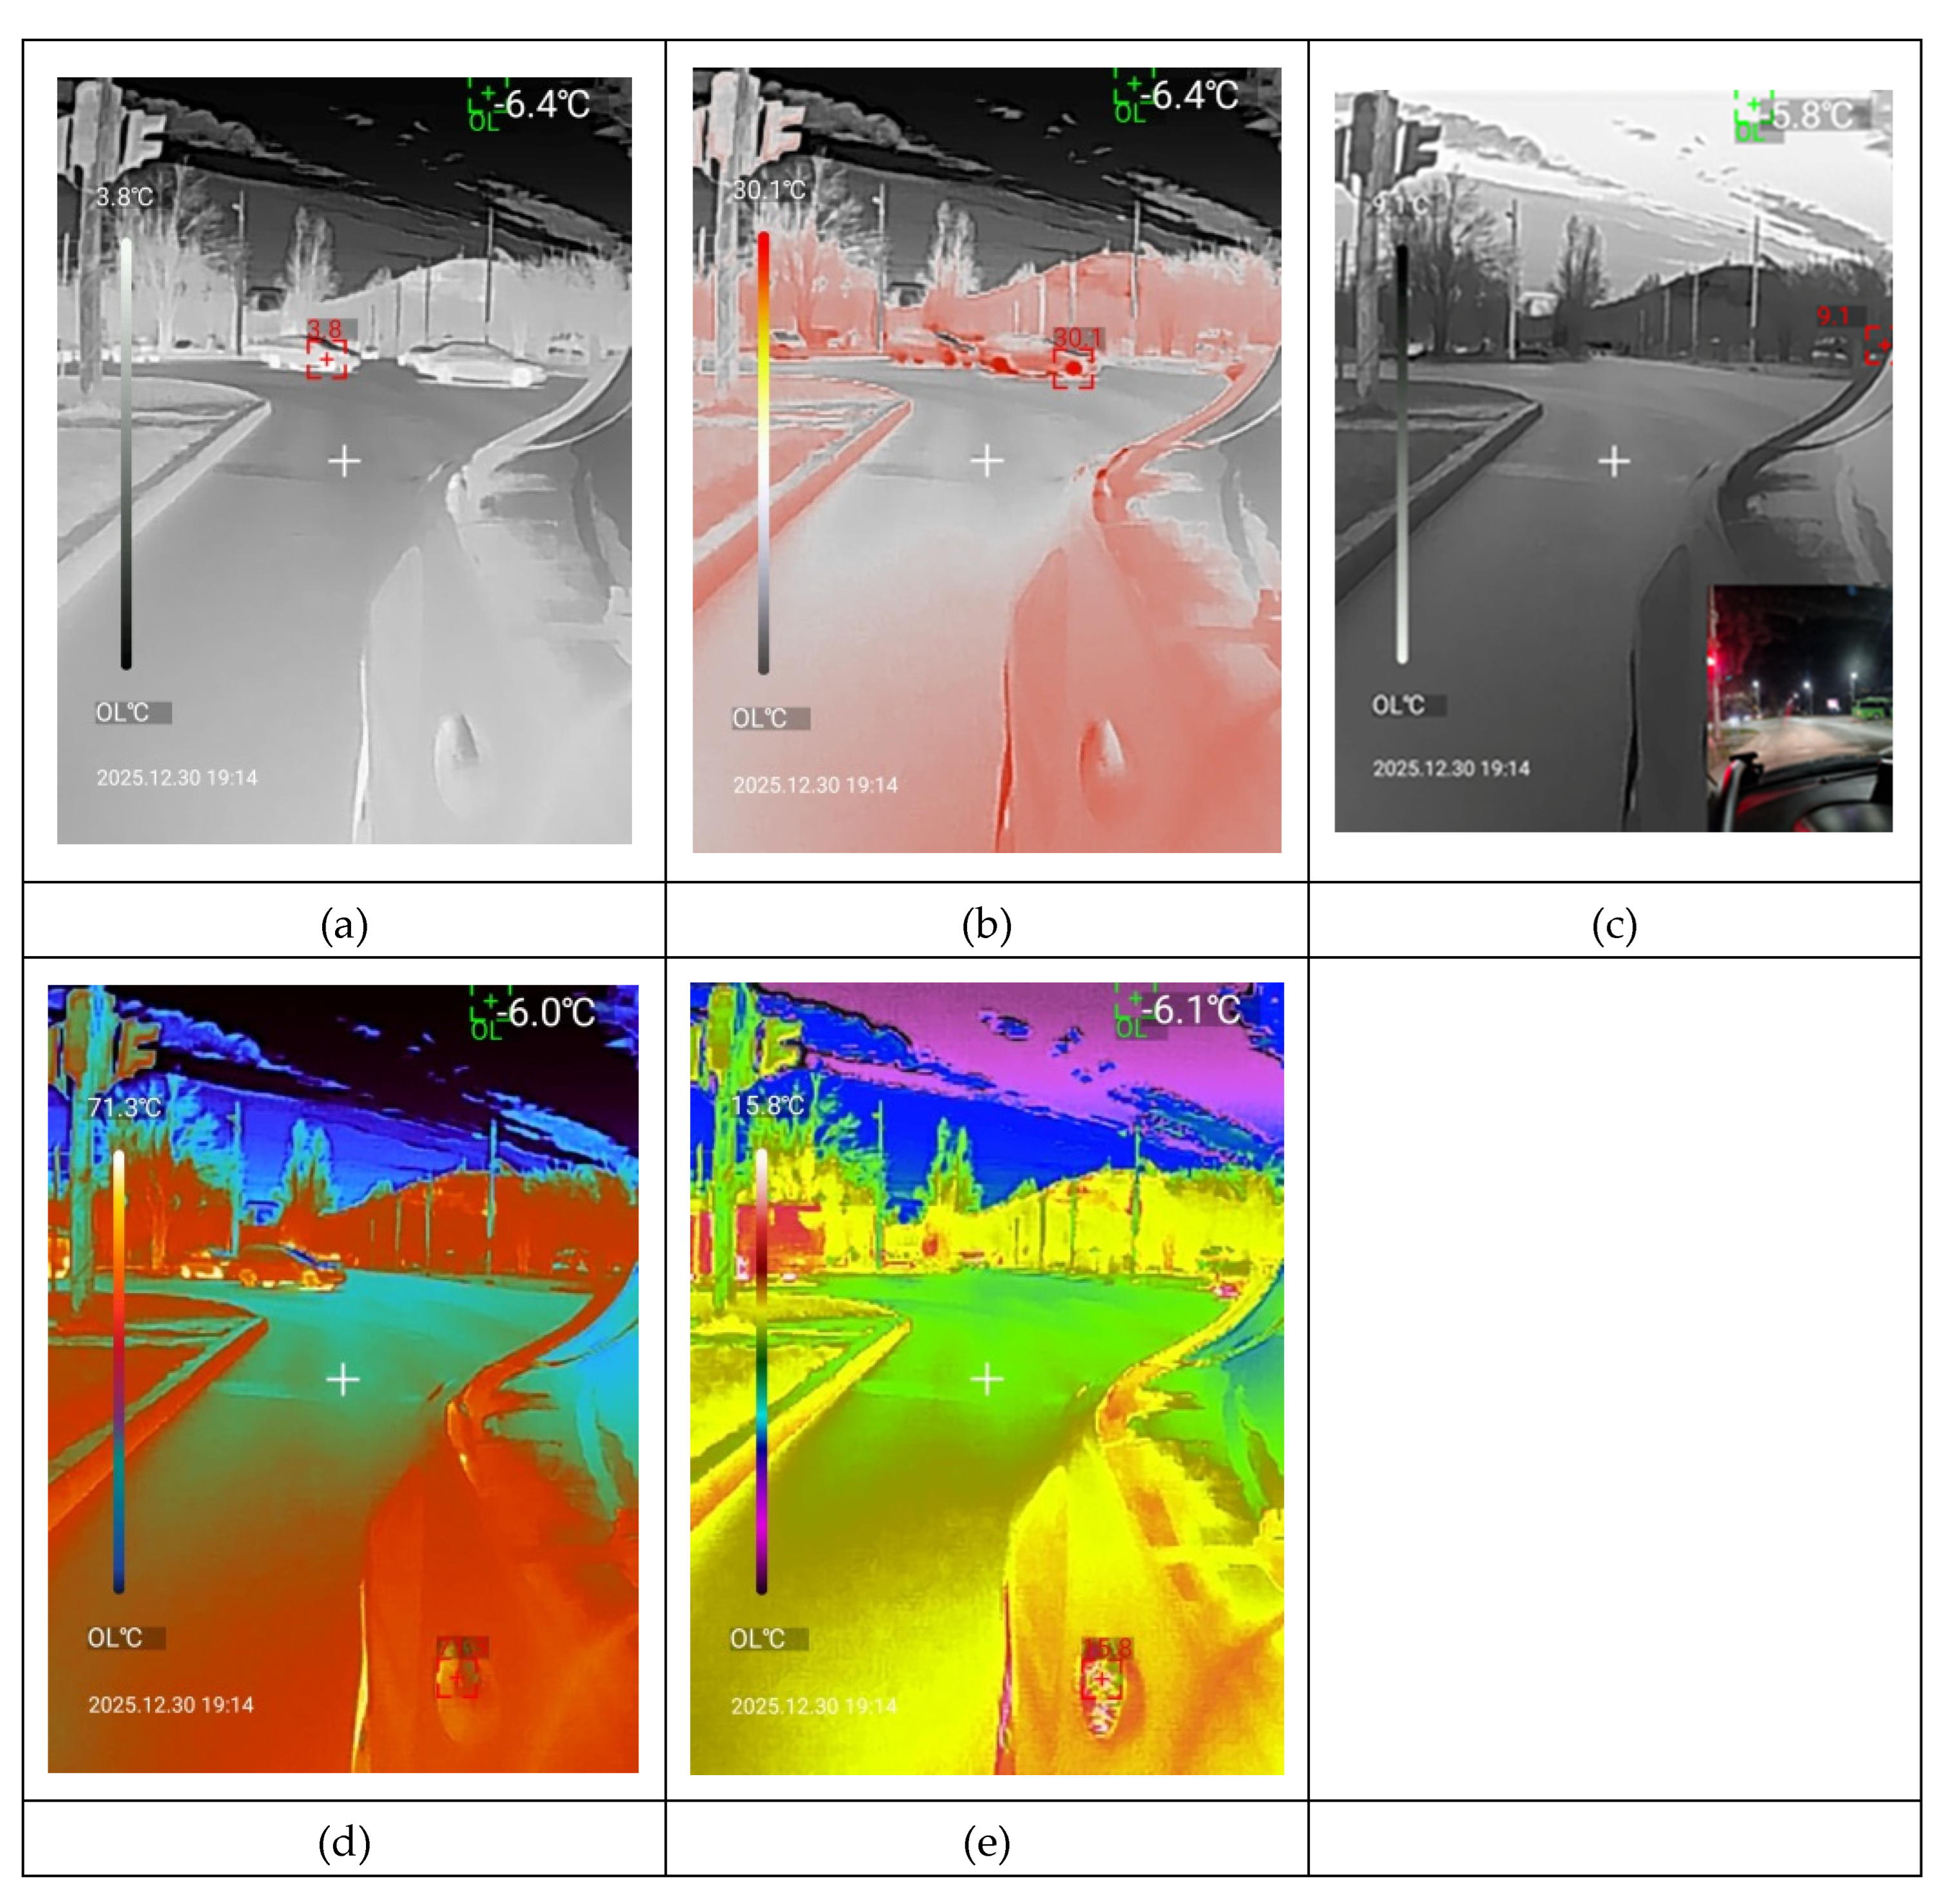
Figure 11.
Visualization the dependence of pedestrian pixel height on distance.
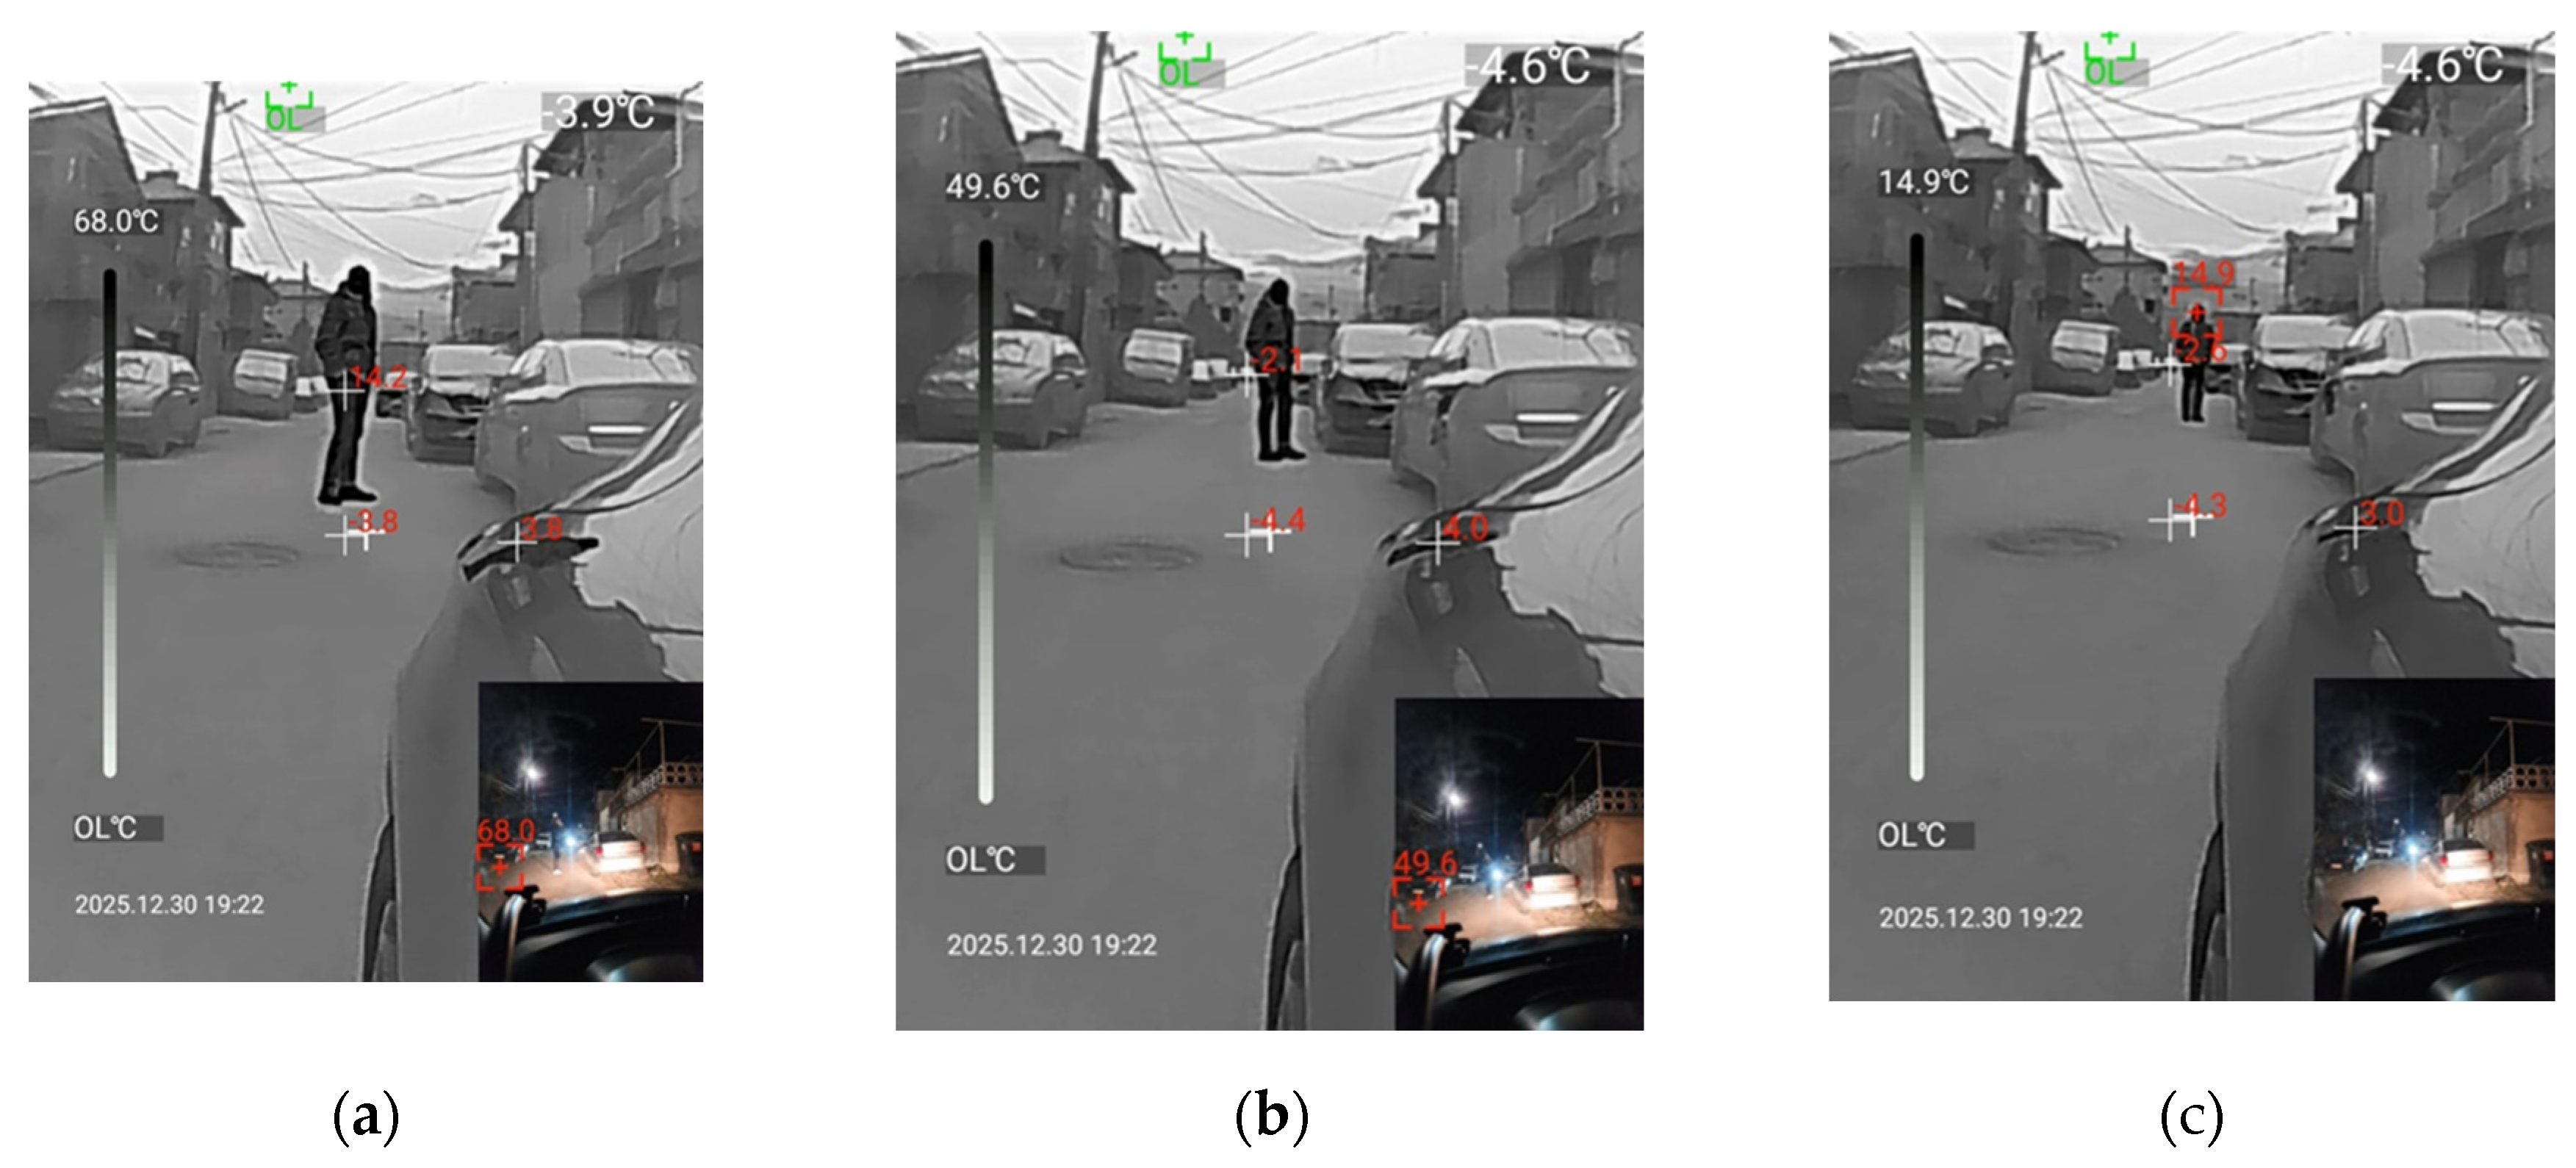
Figure 12.
Example demonstrating practical observation range and scene coverage for UTi260M and synchronized dual-channel capture with UTi260T: (a) UTi260M with smartphone and application; (b) thermal frame used for temperature-contrast and detectability assessment; (c) simultaneous visible-light frame used to document illumination conditions and scene context (road geometry, traffic, and glare sources).
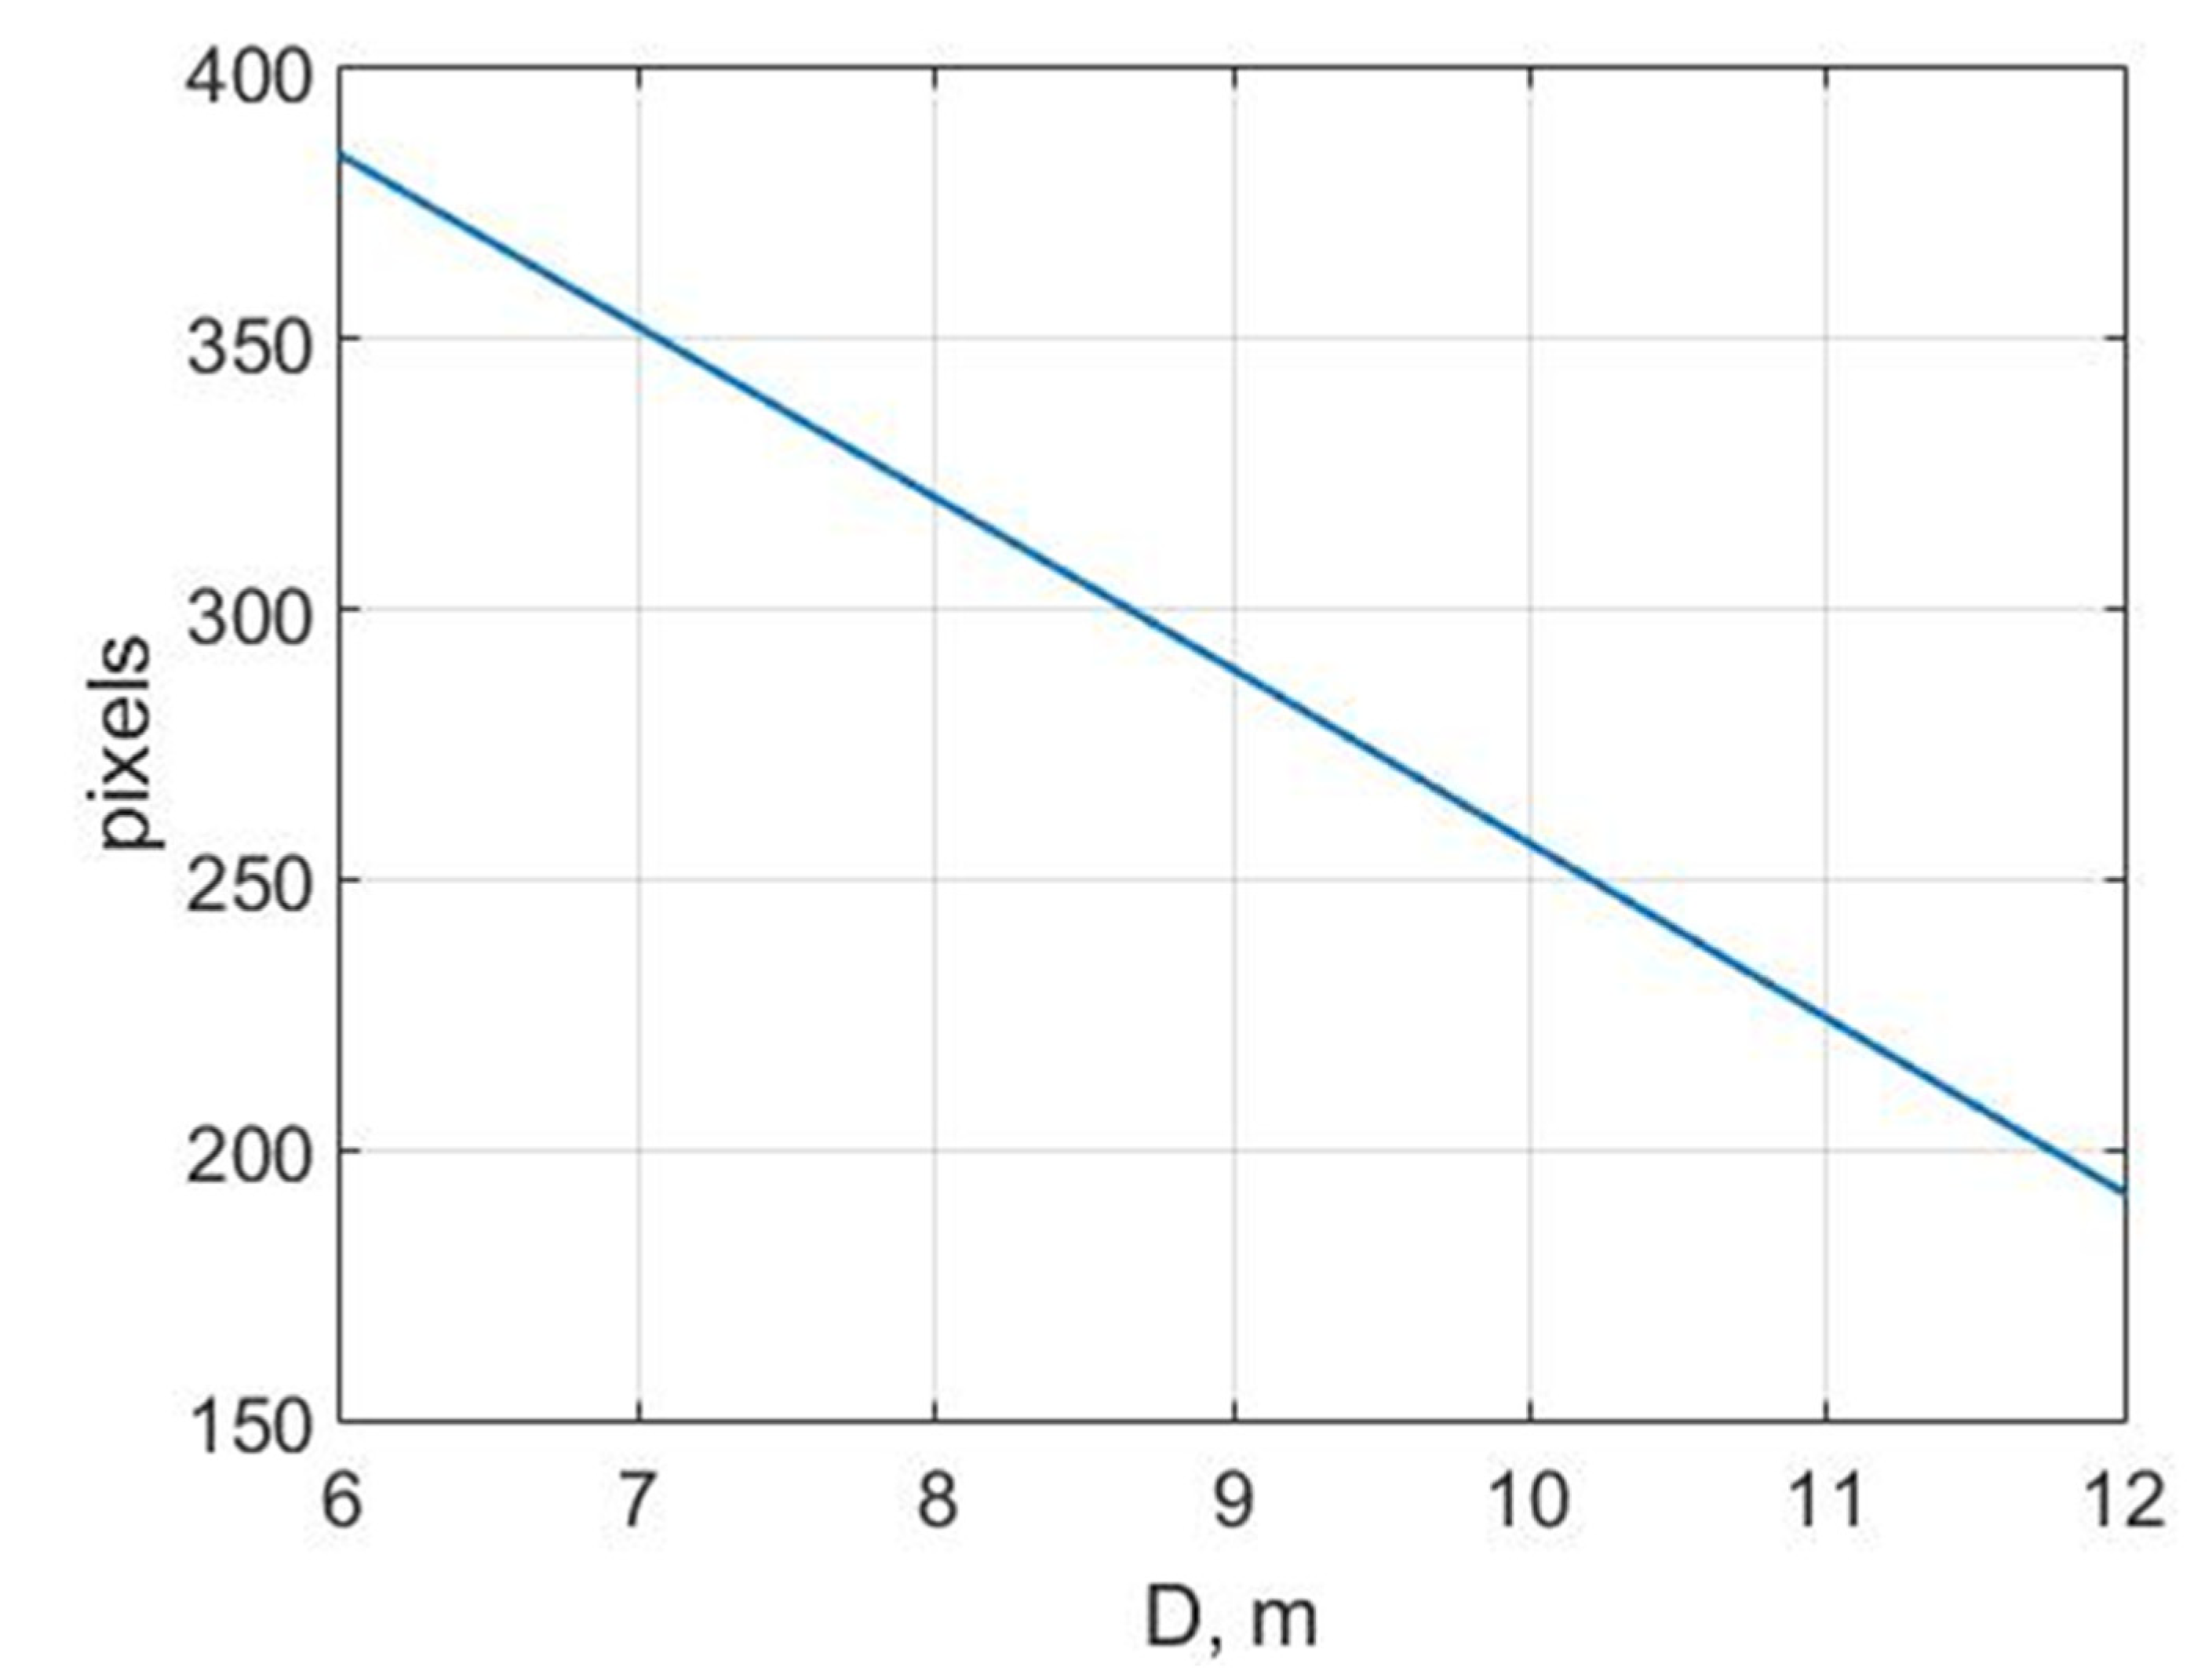

Table 1.
UTi260M thermal imager specifications.
| Sensor | Uncooled vanadium oxide |
|---|---|
| Range switching | Low temperature (-20°C-150°C), high temperature (0°C-550°C) (auto switching) |
| Modes | Industrial, human body |
| Emissivity | 0.95 (default) 0.01-1.00 |
| IR resolution | 256*192 (49152) |
| Infrared spectral bandwidth | 8-14 µm |
| Thermal sensitivity | <50mK |
| Frame rate | 25Hz |
Table 2.
UTi260T thermal imager specifications.
| Sensor | Uncooled vanadium oxide |
|---|---|
| Temperature measurement range | -20 ℃~150 ℃, 100 ℃~550 ℃ (manual shift) |
| Infrared response band | 8-14 µm |
| IR resolution | 256*192 (49152) |
| Infrared spectral bandwidth | 8-14 µm |
| Thermal sensitivity/NEDT | <50mK |
| Frame rate | 25Hz |
| Temperature measurement resolution | 0.1 ℃ |
Table 3.
Proxy noise and uniformity metrics computed on homogeneous background ROIs (8-bit, DN).
| Image | (DN) | Noise Range (DN) | Noise Mode (DN) | (DN) | (DN) | UI = 1−σ/μ | FPN proxy (DN) | SNR proxy | |
|---|---|---|---|---|---|---|---|---|---|
| UTi260T – thermal (pedestrian, frame, Figure 8) | 1.113 | 6 | 35 | 0.905 | 0.968 | 0.962 | 0.125 | 561.77 | n/a* |
| UTi260T – thermal (parked vehicles/street, frame, Figyre 7) | 1.363 | 8 | 150 | 1.273 | 1.197 | 0.993 | 0.229 | 120.16 | n/a* |
| UTi260M – thermal via smartphone (frame, Figure 9) | 0.488 | 3 | 116 | 0.454 | 0.453 | 0.996 | 0.069 | 301.23 | n/a* |
| Visible-light camera (night frame, Figure 8) | 1.293 | 8 | 4 | 1.283 | 0.893 | 0.601 | 0.260 | n/a | n/a |
Table 4.
Measured pedestrian pixel height and footprint metrics (preparation for distance calibration).
Table 4.
Measured pedestrian pixel height and footprint metrics (preparation for distance calibration).
| Frame | ||||
|---|---|---|---|---|
| Fig. 10 (a) | 1.95 | 6 | 1187 | 384 |
| Fig. 10 (b) | 1.95 | 9 | 1187 | 289 |
| Fig. 10 (c) | 1.95 | 12 | 1187 | 192 |
Disclaimer/Publisher’s Note: The statements, opinions and data contained in all publications are solely those of the individual author(s) and contributor(s) and not of MDPI and/or the editor(s). MDPI and/or the editor(s) disclaim responsibility for any injury to people or property resulting from any ideas, methods, instructions or products referred to in the content. |
© 2026 by the authors. Licensee MDPI, Basel, Switzerland. This article is an open access article distributed under the terms and conditions of the Creative Commons Attribution (CC BY) license.
Copyright: This open access article is published under a Creative Commons CC BY 4.0 license, which permit the free download, distribution, and reuse, provided that the author and preprint are cited in any reuse.


