
Submitted:
29 January 2026
Posted:
29 January 2026
You are already at the latest version
Abstract
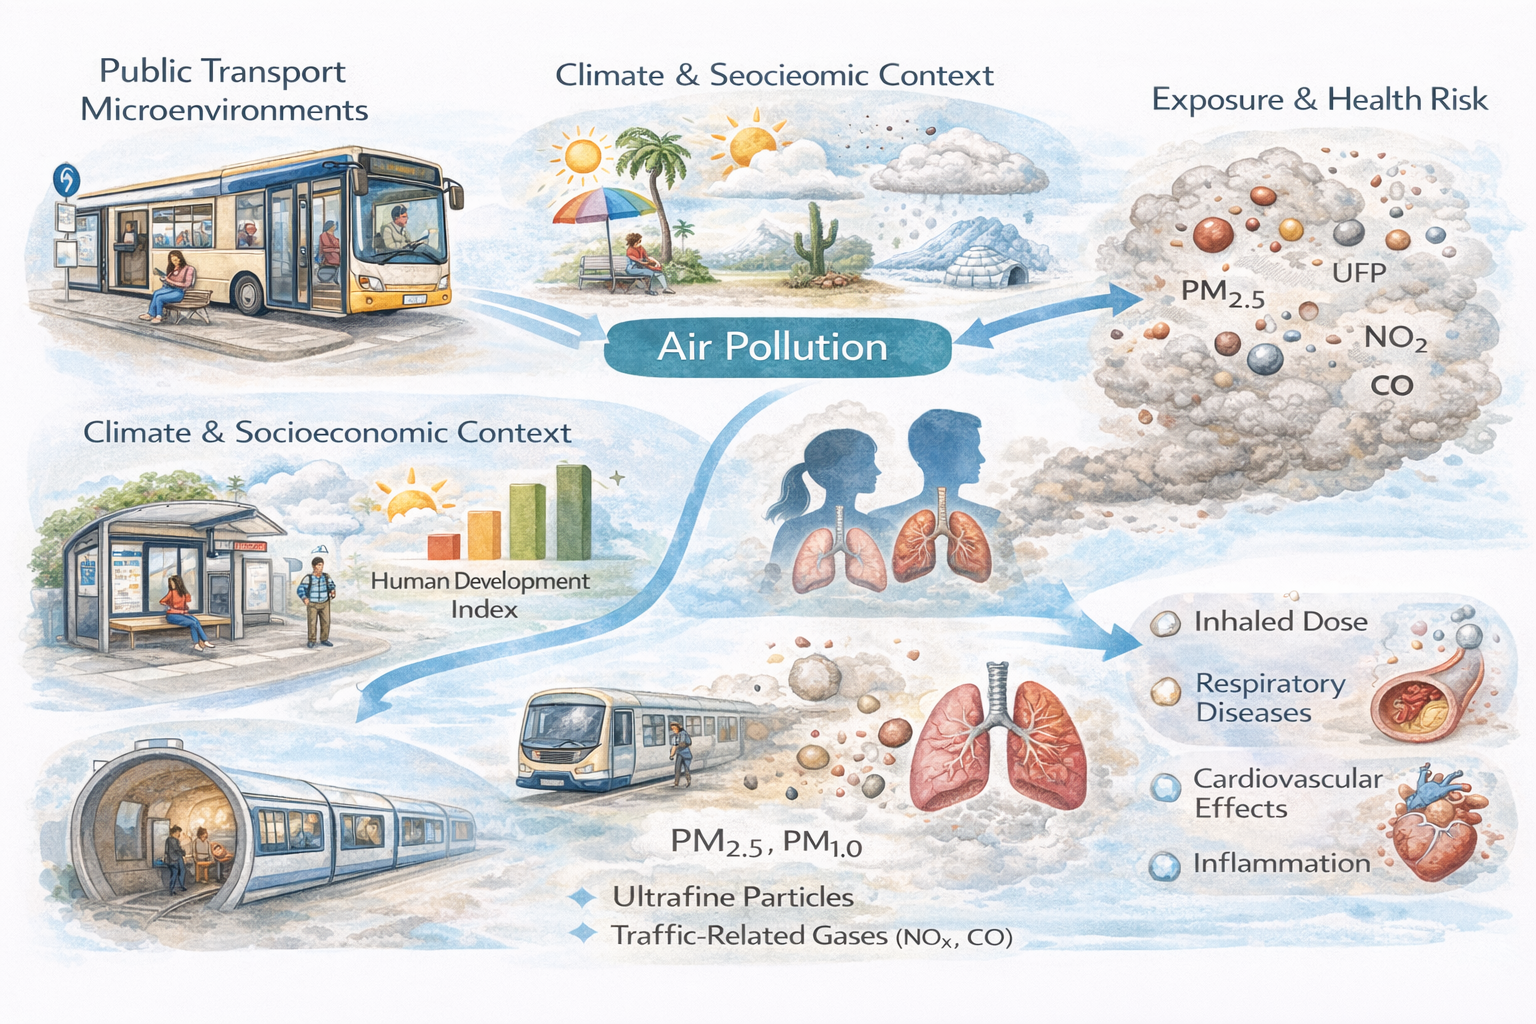
Air pollution associated with public transport systems constitutes a critical yet highly heterogeneous component of urban exposure, in which commuters and transport workers are frequently subjected to pollutant concentrations exceeding those reported by ambient background monitoring networks. This review provides a comprehensive and integrative synthesis of the global scientific literature on air quality in public transport microenvironments—including buses, bus stops, terminals, and underground stations—through a multidimensional analytical framework that explicitly accounts for climatic classification, socio-economic context, meteorological drivers, transport microenvironment typology, sampling strategies, analytical techniques, and exposure metrics. A large body of peer-reviewed studies published worldwide was examined to identify dominant patterns, methodological trends, and persistent knowledge gaps. Across regions, the evidence consistently reports elevated concentrations of particulate matter (PM₂.₅, PM₁₀, and ultrafine particles) and traffic-related gaseous pollutants, particularly within confined or poorly ventilated environments and during peak traffic periods. Marked geographical, climatic, and socio-economic imbalances are evident, with a strong concentration of studies conducted in temperate and tropical climates and in countries with very high or high Human Development Index, while arid, continental, and low-HDI regions remain substantially underrepresented. From a methodological standpoint, the literature is dominated by short- to intermediate-term monitoring campaigns relying on active sampling, mobile measurements, and increasingly calibrated low-cost sensors, whereas long-term stationary observations and standardized integrative monitoring frameworks remain scarce. Although advanced analytical approaches—such as chemical characterization, environmental magnetism, receptor modeling, computational fluid dynamics, and inhaled dose assessment—are progressively being applied, their combined and systematic implementation remains limited. Overall, this review reveals persistent methodological, geographical, and conceptual gaps and underscores the urgent need for standardized, interdisciplinary, and long-term monitoring strategies to improve exposure assessment and support evidence-based mitigation policies aimed at reducing health risks associated with public transport-related air pollution.
Keywords:
public transport
; air pollution
; particulate matter
; exposure assessment
; monitoring strategies
; low-cost sensors
; urban microenvironments
1. Introducción
Air pollution, particularly ambient air pollution, is one of the most significant environmental risks to public health worldwide, accounting for a substantial share of the global burden of respiratory and cardiovascular diseases (World Health Organization, 2021). In urban settings, a considerable portion of daily population exposure occurs within transport-related microenvironments, especially public transport systems, where vehicular emissions, local meteorological conditions, and infrastructure characteristics converge. As a result, air quality in public transport represents a critical interface between urban mobility, environmental sustainability, and human health (Mitsakou et al., 2021; Moreno et al., 2015; Salthammer et al., 2022).
Public transport has been widely promoted as a cornerstone of sustainable urban mobility aimed at reducing greenhouse gas emissions, traffic congestion, and environmental impacts associated with private vehicle use. Nevertheless, growing evidence indicates that public transport users and workers may experience elevated exposure to atmospheric pollutants during daily commuting, particularly fine particulate matter (PM₂.₅ and PM₁₀), ultrafine particles, and nitrogen oxides (Chen et al., 2017; Morales Betancourt et al., 2019; Velasco et al., 2019; Wu et al., 2024). These exposure levels are strongly influenced by fleet characteristics, traffic intensity, spatial confinement, ventilation efficiency, and operational conditions. Previous studies report that public transport microenvironments—including buses, stops, stations, and underground systems—exhibit pollution dynamics distinct from the general urban background. Enclosed or underground stations frequently show significant particle accumulation from both external sources and internal processes such as mechanical wear and particle resuspension (Briant et al., 2025; Chen et al., 2017; Moreno et al., 2015), whereas exposure at open stops and surface vehicles is more closely associated with traffic density, urban morphology, and local meteorological conditions (Abbass et al., 2021; Amegah et al., 2022; Bel & Holst, 2018).
Despite the increasing number of studies addressing air quality in public transport systems, the available literature remains highly heterogeneous with respect to methodological approaches, temporal resolution, and geographical coverage. Research conducted in very high Human Development Index (HDI) countries—primarily in Europe, North America, and parts of Asia—generally relies on reference-grade instrumentation, extended monitoring campaigns, and advanced dispersion and exposure modeling (Correia et al., 2020; Fameli et al., 2024; Lund et al., 2020; Van Ryswyk et al., 2021). In contrast, studies from high- and medium-HDI regions, including Latin America, Africa, and South Asia, more frequently employ intermediate-duration monitoring campaigns and low-cost sensor technologies. While these approaches allow broader spatial coverage, they often present limitations in long-term continuity and detailed chemical characterization (Bhusal et al., 2024; Bikis & Pandey, 2022; Morales Betancourt et al., 2022; Velasco et al., 2019). Furthermore, most evidence originates from temperate and tropical climates, whereas arid, continental, and polar regions remain underrepresented (Abbass et al., 2021; Peel et al., 2007; Velasco et al., 2019), restricting the transferability of findings across diverse climatic contexts. Within this framework, the present review critically examines and compares the scientific literature on air quality in public transport systems by integrating climatic, socio-economic, methodological, and meteorological factors across transport-related microenvironments. Based on approximately 167 studies published worldwide, an updated synthesis of the state of the art is provided, and future research directions are outlined to improve exposure assessment, inform mitigation strategies, and support the development of healthier and more sustainable urban transport systems.
2. Materials and Methods
2.1. Literature Search Strategy
A comprehensive literature search was conducted to compile and analyze peer-reviewed studies addressing air quality and human exposure in public transport systems. The search focused on articles published in international indexed journals and included studies from all continents, without restrictions on publication year, provided that methodologies and results were clearly described. Bibliographic searches were performed using major scientific databases, including Web of Science, Scopus, and ScienceDirect, and were complemented by targeted searches in Google Scholar to capture region-specific studies that may not be fully indexed. Keywords and Boolean combinations were structured around three main themes: (i) public transport (e.g., bus, metro, subway, BRT, station, stop), (ii) air quality and exposure (e.g., PM₂.₅, PM₁₀, ultrafine particles, gaseous pollutants, inhaled dose), and (iii) methodological approaches (e.g., monitoring, low-cost sensors, magnetic monitoring, chemical analysis, modeling). Only peer-reviewed articles written in English or Spanish were considered; conference proceedings, technical reports, theses, and non-peer-reviewed documents were excluded to ensure scientific robustness.
2.2. Eligibility Criteria and Article Selection
An initial screening of titles and abstracts was conducted to identify studies explicitly addressing air quality measurements, exposure assessment, or pollutant characterization in public transport environments. Articles were included if they reported measurements inside public transport vehicles, within transport-related microenvironments (stations, terminals, platforms, or bus stops), personal exposure or inhaled dose during public transport use, or the application of chemical, physical, magnetic, or modeling techniques related to transport-associated pollutants. Studies focusing exclusively on private vehicles, urban background monitoring stations without a transport component, or traffic flow modeling without air quality data were excluded. Following full-text evaluation, a total of 167 scientific articles met the inclusion criteria and were retained for analysis.
2.3. Data Extraction and Classification Framework
For each selected study, key information was extracted and organized into a structured database, including geographic location, type of public transport system and microenvironment, pollutants analyzed, monitoring strategy and instrumentation, temporal scale of the monitoring campaign, meteorological variables considered, analytical and modeling techniques, and indicators of exposure and health relevance. To enable comparative and integrative analysis, studies were classified using five complementary criteria.
2.4. Geographic and Climatic Classification
Each study was assigned to a continent and classified according to the Köppen–Geiger climate classification, following the updated scheme proposed by Peel et al. (2007). The five main climate groups (A: tropical, B: dry, C: temperate, D: continental, E: polar) were used to evaluate the influence of climatic conditions on pollutant behavior, dispersion, and exposure in transport microenvironments, allowing the identification of climatic biases and comparison across contrasting meteorological regimes.
2.5. Socioeconomic Classification
To assess socioeconomic context, studies were grouped according to the Human Development Index (HDI) of the country in which the research was conducted, using the United Nations Development Programme classification corresponding to the study period. Countries were categorized as very high, high, medium, or low HDI, enabling evaluation of disparities in research coverage, technological availability, and methodological sophistication.
2.6. Transport Microenvironments and Sampling Strategies
Studies were classified according to the transport microenvironments investigated, including vehicle interiors (buses, BRT, metro, tram), bus stops and shelters, stations and platforms, underground metro systems, and transport terminals. Sampling strategies were categorized as active, passive, mobile, or stationary and further grouped by temporal scale (short-term, intermediate, or long-term campaigns), allowing identification of dominant methodological trends and gaps in long-term exposure assessment.
2.7. Analytical Techniques
Analytical approaches were grouped into four categories: (i) chemical analyses (e.g., ICP-MS, ICP-OES, XRF, SEM-EDS) for elemental and morphological characterization; (ii) magnetic monitoring, including low-frequency susceptibility, remanent magnetization, hysteresis parameters, and advanced techniques such as FORC, used as proxies for traffic-related metallic particles; (iii) modeling approaches, including statistical models, receptor models (e.g., PMF), GIS-based spatial modeling, machine learning, and computational fluid dynamics (CFD); and (iv) dose and exposure assessment, in which inhaled dose was estimated from pollutant concentrations, exposure duration, and physiological parameters. Studies were assigned to one or more categories depending on the methodologies applied.
2.8. Meteorological Variables
Meteorological parameters reported in the studies—including temperature, relative humidity, wind speed and direction, precipitation, pressure, and solar radiation, when available—were systematically recorded. The source of meteorological data (in situ measurements or external stations) was also documented to assess representativeness at the microenvironment scale.
2.9. Synthesis and Comparative Analysis
A qualitative and semi-quantitative comparative synthesis was performed rather than a meta-analysis. Results were interpreted by identifying consistent patterns, methodological limitations, geographical and climatic gaps, and emerging trends across the reviewed studies, with particular emphasis on how methodological choices, climatic conditions, and socioeconomic context influence reported exposure levels in public transport systems.
3. Results and Discussion
A review of studies conducted across the five continents reveals consistent evidence of elevated exposure of public transport users to atmospheric pollutants. At the same time, the existing literature highlights significant methodological and conceptual shortcomings that limit a comprehensive characterization of this exposure. To evaluate the current state of scientific knowledge and its contributions, it is essential to identify the main constraints reported in previous research. Based on the analysis of the available literature, four major categories of limitations were identified: methodological, geographical, technological, and conceptual.
3.1. Continental Distribution
A substantial proportion of the analyzed studies exhibit restricted experimental designs in terms of temporal coverage and spatial scope. Measurements are commonly carried out during short monitoring periods or through isolated campaigns, which hinders the identification of daily and seasonal variability. Furthermore, simultaneous measurements inside and outside transport vehicles are frequently absent, limiting the assessment of pollutant infiltration processes and exposure gradients. The global distribution of public transport air quality studies by continent is summarized in Table 1.
Several methodological limitations have been reported in the literature. For instance, the inability to continuously monitor outdoor pollutant concentrations while vehicles are in motion often requires indirect estimations, which introduce uncertainty into contaminant distribution models (Y. Zhao et al., 2023). In addition, small sample sizes and sampling restricted to peak hours, rather than covering full daily cycles, may bias reported exposure levels and reduce comparability across studies. A pronounced geographical imbalance is evident in the available literature. Most studies have been conducted in Europe, North America, and Asia, whereas regions such as Sub-Saharan Africa, Latin America, and Oceania remain underrepresented (Ogundiran et al., 2025). Even in highly polluted urban areas, investigations focusing on exposure at bus stops or inside buses are scarce (Ngoc et al., 2018). This lack of data is particularly critical given that some of the most polluted cities worldwide are located in South Asia and Africa. Consequently, incomplete geographic coverage limits the external validity of global conclusions, as local conditions—such as fleet age, fuel quality, and extreme climatic regimes—may differ substantially from those of well-studied regions (Ogundiran et al., 2025).
Technological constraints further restrict current research. Many studies rely on conventional environmental sampling techniques characterized by bulky, high-cost instrumentation, which limits the number of sensors and sampling locations. For example, a study conducted on buses in Dalian, China, reported limited instrumentation and personnel availability, resulting in measurements at only a few points inside the vehicle and hampering the characterization of spatial variability within the microenvironment (Y. Zhao et al., 2023). Moreover, most investigations focus primarily on particulate matter (PM₂.₅ and PM₁₀), while other relevant pollutants such as NOₓ, CO, and ultrafine particles are frequently neglected due to analytical complexity or lack of suitable sensors. The limited adoption of real-time continuous monitoring, low-cost sensor networks, portable personal devices, and complementary modeling approaches—such as computational fluid dynamics—may lead to incomplete exposure characterization, particularly in complex settings such as crowded stops or poorly ventilated buses.
A narrow disciplinary focus also predominates in the literature. Many studies quantify pollutant concentrations without linking exposure to emission sources or directly evaluating health implications. Air quality in buses and stops is often assessed independently of other factors influencing passenger well-being, such as thermal comfort, noise, or visual stress. Only a limited number of studies adopt a holistic indoor environmental quality approach that integrates air quality with noise, temperature, and crowding conditions (Ogundiran et al., 2025). Furthermore, a clear separation persists between engineering and monitoring studies and those rooted in epidemiology or public health, resulting in weak integration between exposure measurements and health outcome data. Static or segment-specific measurements also prevail, while real-world, door-to-door personal exposure assessments along complete travel chains remain scarce. Overall, significant knowledge gaps persist due to the lack of integrated and interdisciplinary approaches capable of capturing the complexity of public transport as a socio-technical system. The global literature consistently indicates that both bus stops and vehicle interiors constitute high-risk microenvironments where users may inhale concerning concentrations of atmospheric pollutants. Although existing studies have advanced understanding of this issue, persistent methodological, geographic, technological, and conceptual limitations hinder comprehensive exposure assessment. Addressing these gaps represents a key opportunity for future research. Only through a coordinated and truly global research agenda will it be possible to develop effective strategies to reduce air pollution exposure in public transport systems and protect the health of millions of daily users worldwide (Ngoc et al., 2018).
3.2. Clasificación Climática de Köppen–Geiger
The Köppen–Geiger climate classification has been widely applied in environmental and health studies due to its ability to synthesize thermal and precipitation conditions that govern atmospheric dynamics at the global scale (Peel et al., 2007). In the context of air pollution associated with public transport, climate-based analysis enables the identification of differentiated exposure patterns driven by local conditions of pollutant dispersion, accumulation, and transformation. This approach allows not only the comparison of methodologies and pollutants investigated across climatic regimes, but also the identification of limitations and research gaps in underrepresented regions. Table 2 summarizes the main characteristics of public transport air quality studies according to the Köppen–Geiger climate classification.
3.2.1. Tropical Climate(A)
A relatively high concentration of studies addressing exposure to atmospheric pollutants in public transport environments has been reported in tropical regions, particularly in cities across Africa, Latin America, and Asia. Evidence indicates that climatic conditions characterized by high temperatures and elevated relative humidity influence pollutant dispersion and accumulation in confined microenvironments such as bus stops and vehicle cabins. Particle resuspension driven by intense traffic and fossil fuel combustion has been identified as the dominant source of particulate matter (PM₂.₅ and PM₁₀), with passengers and drivers representing highly exposed groups (Abbass et al., 2021; Bahino et al., 2024; Okokon et al., 2018). Methodological approaches in tropical settings have included continuous monitoring using low-cost sensors (Singh et al., 2021; Soruma & Woldeamanuel, 2022), passive samplers deployed at bus stops (Ngo et al., 2015; Njeru et al., 2024), and personal exposure modeling techniques (Morales Betancourt et al., 2019, 2022). Several studies reported PM₂.₅ concentrations exceeding World Health Organization guidelines, particularly along high-traffic transport corridors, highlighting the need for improvements in vehicle fleets and urban infrastructure (Fosu-Amankwah et al., 2025; Moges & Alemu, 2024). Despite the relatively large body of literature, recurrent limitations include short monitoring periods, limited spatial representativeness, and scarce chemical and magnetic characterization of particles, underscoring the need for longitudinal and methodologically integrated studies in tropical climates.
3.2.2. Dry–Arid Climate (B)
A limited number of studies have been conducted in dry and arid climates, despite their relevance for public health in major urban centers such as Mexico City, Cairo, Tunis, and border regions of Texas, USA. These environments are characterized by low relative humidity and high solar radiation, conditions that favor the resuspension of mineral dust and urban surface-derived particles. Reviewed studies indicate that emissions from vehicular traffic and surface wear contribute substantially to PM₂.₅ and PM₁₀ levels at public transport stations and within vehicles (Bel & Holst, 2018; Hernández-Paniagua et al., 2018; Velasco et al., 2019). In addition, secondary photochemical pollutant formation, particularly ozone, represents an additional exposure risk during periods of intense solar radiation (Abbass et al., 2021). Applied methodologies have included mobile sensors deployed in buses and urban transects (Velasco et al., 2019; Vera Valdés & Rodríguez Caballero, 2021) as well as fixed monitoring stations at transport stops (Mraihi et al., 2015). In several cases, particulate concentrations exceeded international WHO guidelines, especially during the dry season, indicating increased vulnerability among populations reliant on public transport. However, limited temporal continuity, insufficient chemical characterization, and the absence of magnetic tracer analyses remain key limitations, revealing a critical gap in the multidisciplinary assessment of air pollution in dry–arid climates.
3.2.3. Temperate Climate (C)
Temperate climates concentrate the largest number of studies on air pollution in public transport systems, enabling a more detailed characterization of exposure across diverse urban microenvironments. Investigations conducted in bus stations, metro systems, trams, and vehicle cabins consistently report elevated concentrations of particulate matter (PM₂.₅ and PM₁₀) and gaseous pollutants such as NO₂ and O₃ (Correia et al., 2020, 2023; Wu et al., 2024; Yu et al., 2022). A wide range of methodological approaches has been applied, including mobile monitoring along bus routes and urban transects (Singh et al., 2021; Velasco & Segovia, 2021), computational fluid dynamics (CFD) to model ventilation in stops and terminals (R. Zhao et al., 2018), and receptor-based analyses such as Positive Matrix Factorization to identify emission sources (Fameli et al., 2024). Emerging applications of environmental magnetism have also been reported as proxies for traffic-related metallic particles (Letaïef et al., 2024). Results consistently indicate higher pollutant concentrations in enclosed or semi-enclosed environments, such as underground stations and tunnels, compared with open stops or surface vehicles (Briant et al., 2025; Mitsakou et al., 2021). Lower exposure levels have been observed in electric and hybrid transport systems relative to diesel fleets, demonstrating the positive impact of technological modernization on urban air quality (Matthaios et al., 2024; Mendoza et al., 2024). Nevertheless, short monitoring durations and limited integration of chemical and magnetic particle analyses persist, representing key priorities for future research in temperate climates.
3.2.4. Clima Continental (D)
An intermediate number of studies has been identified in continental climates, mainly conducted in cities across Eastern Europe, North America, and Asia. Evidence indicates that seasonality plays a key role in shaping exposure patterns in these contexts. Higher concentrations of particulate matter and gaseous pollutants have been consistently reported during winter, driven by the combined effects of residential heating, increased atmospheric stability, and intensified vehicular emissions (Chen et al., 2017; Kim et al., 2021). In contrast, summer periods are characterized by improved atmospheric dispersion, although increases in ozone and fine particles associated with photochemical processes have been observed (Yan et al., 2015). Methodological approaches include personal monitoring campaigns among public and school bus users (Austin et al., 2019; Szyszkowicz, 2024), deployment of low-cost sensors at transport stations (Van Ryswyk et al., 2021), and exposure modeling based on pollutant time series and mobility patterns (Bhusal et al., 2024; Shrestha & Dhital, 2024). Environmental magnetism has also been applied to assess traffic-related metallic particles in urban areas of Poland, providing complementary evidence on transport-associated emission sources (Górka-Kostrubiec et al., 2020). However, short monitoring durations, limited spatial coverage, weak integration with population health data, and the lack of systematic comparisons between warm and cold seasons remain recurrent limitations, highlighting the need for longitudinal studies addressing seasonal variability in continental climates.
3.2.5. Polar Climate (E)
No studies addressing air quality in public transport systems were identified for polar climates within the reviewed database. This absence reflects both the low population density of these regions and the limited development of collective transport infrastructure in Arctic and Antarctic environments. Although atmospheric pollution related to maritime and aviation transport has been investigated in polar regions, no evidence was found linking polar climatic conditions to exposure within urban or peri-urban public transport systems. This lack of literature represents a clear research gap. Considering the high vulnerability of polar regions to climate change and the potential expansion of urban activities in Arctic areas, future studies integrating public transport, air pollution, and extreme climatic conditions are warranted.
Analysis of the 167 reviewed articles indicates that most studies were conducted in temperate climates (C, 72 studies; 42.9%) and tropical climates (A, 61 studies; 35.9%). These regions exhibit the greatest methodological diversity, including mobile and low-cost sensors, CFD modeling, PMF source apportionment, and emerging applications of environmental magnetism. Elevated concentrations of particulate matter and gaseous pollutants were consistently reported in transport microenvironments, particularly in enclosed or underground stations. In contrast, dry–arid (B, 12 studies; 7.1%) and continental climates (D, 22 studies; 12.9%) were less represented, despite reporting distinct exposure drivers, such as mineral dust resuspension in arid regions and strong seasonal contrasts in continental settings. No studies were identified for polar climates (E, 0 studies; 0%), representing a major gap and a clear opportunity for future research. Overall, the literature exhibits a strong bias toward temperate and tropical climates, reflecting both global urban population distribution and institutional monitoring capacity, while limiting the extrapolation of findings to arid, continental, and polar regions.
3.3. Human Development Index (HDI)
Classification of the literature according to the Human Development Index (HDI) was applied to examine the influence of socioeconomic factors on knowledge production related to air quality in public transport systems. This approach enabled the identification of disparities in research output associated with technological capacity and institutional resources across countries. The review shows that very high-HDI contexts concentrate most scientific production, reflecting greater access to advanced instrumentation and stronger links between research outcomes and public policy. In contrast, studies conducted in high- and medium-HDI countries often report more severe exposure conditions alongside methodological constraints that limit the scope of findings. The absence of studies from low-HDI countries constitutes a critical gap, restricting understanding of exposure risks in particularly vulnerable populations. The methodological capacity of studies according to HDI level is summarized in Table 3. Overall, HDI-based classification not only provides a structured framework for organizing the state of the art, but also reveals persistent inequities in the global distribution of scientific evidence, with direct implications for sustainable mobility planning and public health policy at the global scale.
3.3.1. IDH Muy Alto
In very high-HDI countries, research on air quality in public transport environments is characterized by broad methodological diversity, advanced technologies, and strong integration with sustainable mobility policies. Studies conducted in European cities such as Barcelona, Lisbon, Paris, Rome, and Vienna have applied high-precision reference instruments and atmospheric dispersion modeling to estimate exposure of passengers and pedestrians (Agathokleous et al., 2025; Correia et al., 2020, 2023; Grana et al., 2017; Strasser et al., 2018). Similarly, investigations in North American cities including New York, Sacramento, Salt Lake City, and Toronto combined reference monitoring, meteorological data, and computational fluid dynamics (CFD) simulations to characterize pollutant accumulation in transport microenvironments (Ham et al., 2017; E. S. Lee et al., 2015; Mendoza et al., 2024; Szyszkowicz, 2024), while studies in London, Brussels, and Berlin confirmed diesel traffic as a dominant exposure source (Mitsakou et al., 2021; Salthammer et al., 2022; Van Den Bossche et al., 2015).
The incorporation of low-cost sensors has expanded spatial coverage, particularly in Shanghai, Guangzhou, and Beijing, where calibration against reference equipment enabled the assessment of intra-urban variability (Jin et al., 2024; Lan et al., 2024; Li et al., 2022; Y. Zhang et al., 2023). Continuous monitoring in transport stations has been implemented in cities such as Seoul, Stockholm, and Ottawa, facilitating real-time exposure assessment (Kim et al., 2021; Lund et al., 2020; Szyszkowicz, 2024), while complementary applications have been reported in Vancouver and Vienna (Strasser et al., 2018; Van Ryswyk et al., 2021). Computational modeling has played a central role in interpreting pollutant dispersion and accumulation. CFD and PMF approaches, combined with meteorological records, have been applied in Paris, Barcelona, and Lisbon to estimate exposure scenarios (Briant et al., 2025; Fameli et al., 2024; Moreno et al., 2015), while studies in Shanghai, Beijing, and Tokyo integrated high-resolution spatial and temporal data (Shinohara et al., 2025; Wu et al., 2024; Xu et al., 2016). Across these contexts, fine and ultrafine particles and nitrogen oxides were consistently identified as key exposure drivers, primarily linked to diesel fleet operation (Chen et al., 2017; Moreno et al., 2015; Wang et al., 2018; Y. Zhao et al., 2023). Reductions in pollutant levels associated with fleet electrification and fossil-fuel restrictions have been documented in Lisbon, Barcelona, and Paris (Correia et al., 2023; Remy et al., 2025; Renard et al., 2023). Although these studies demonstrate strong policy relevance, their applicability remains constrained to contexts with consolidated infrastructure.
3.3.2. High HDI
In high-HDI countries, research on air quality in public transport reflects a combination of conventional methodologies and emerging approaches aimed at overcoming infrastructural and financial constraints. In Latin American cities such as Mexico City, São Paulo, and Bogotá, multiple monitoring campaigns using reference stations and portable low-cost sensors have reported elevated particulate and gaseous concentrations in buses and stops affected by traffic congestion (Bel & Holst, 2018; Hernández-Paniagua et al., 2018; Ibarra-Espinosa et al., 2022; Malagon-Rojas et al., 2022; Morales Betancourt et al., 2019, 2022, 2023; Nogueira et al., 2020; Velasco et al., 2019; Velasco & Segovia, 2021; Velasco & Tan, 2016; Vera Valdés & Rodríguez Caballero, 2021). In Brazil and Colombia, calibrated sensors enabled spatial comparisons between transport corridors, while studies in Mexico linked exposure patterns to critical ozone and particulate episodes influenced by local meteorology. In the Middle East and North Africa, studies conducted in Cairo and Tunis highlighted the vulnerability of transport microenvironments in arid and semi-arid climates, where vehicular emissions combined with dust resuspension significantly contribute to PM₁₀ and PM₂.₅ levels (Abbass et al., 2021; Amin et al., 2024; Ben Rayana et al., 2022; Elmarakby & Elkadi, 2024; Ezz et al., 2015; Letaïef et al., 2023, 2024; Mraihi et al., 2015). Overall, exposure levels in high-HDI countries tend to be higher and more variable than in very high-HDI contexts, largely due to older fleets, limited emission control technologies, and slower adoption of electric mobility (Malagon-Rojas et al., 2022; Morales Betancourt et al., 2019; Velasco et al., 2019).
3.3.3. Medium HDI
In medium-HDI countries, studies emphasize critical exposure conditions in rapidly growing urban areas characterized by congested transport systems and limited institutional capacity for emission control. In Sub-Saharan African cities such as Accra, Lagos, Nairobi, Kumasi, Kampala, and Addis Ababa, particulate concentrations in buses and stations frequently exceeded World Health Organization guidelines, driven by aging fleets and widespread use of low-quality diesel fuels (Aga et al., 2025; Amegah et al., 2022; Bahino et al., 2024; Bikis, 2023; Bikis & Pandey, 2022; Bizualem et al., 2023; Brempong et al., 2016; Fosu-Amankwah et al., 2025; Moges & Alemu, 2024; Njeru et al., 2024; Nkansah et al., 2025; Owusu Yankyera & Twumasi, 2024; Soruma & Woldeamanuel, 2022; Yasin et al., 2025). Exposure was shown to depend not only on traffic intensity but also on poor vehicle ventilation and stop placement along congested corridors. In South Asia, studies conducted in New Delhi, Kathmandu, and Colombo reported critical levels of fine and ultrafine particles, particularly during peak congestion and under low-dispersion meteorological conditions (Adikaram & Arambepola, 2025; Bhat et al., 2022; Bhusal et al., 2024; Lakra et al., 2025; Mahesh, 2021; Mukherjee et al., 2024; R. Subramanian, 2020; Ranjan & Sm, 2025; Rawat & Kumar, 2023; Singh et al., 2021). Although low-cost sensors have been explored in some cases (Adikaram & Arambepola, 2025; Bikis, 2023; Moges & Alemu, 2024), most studies relied on conventional sampling and chemical analyses, with emphasis on PM₁₀ and traffic-related metals. These findings underscore persistent technological and regulatory gaps that hinder the transfer of mitigation strategies from higher-HDI contexts.
3.3.4. Low HDI
No studies addressing air quality in public transport systems were identified for countries classified with low HDI. This absence constitutes a critical research gap, reflecting structural limitations related to technical capacity, monitoring infrastructure, and financial resources. Given the prevalence of informal transport systems, aging vehicles, and low-quality fuels in these regions, potential exposure levels may be even more severe than those reported elsewhere. However, the lack of empirical evidence prevents reliable assessment and comparison, revealing a marked inequity in global scientific knowledge production. Overall, analysis by HDI level demonstrates that research on air quality in public transport is closely linked to socioeconomic development. While very high-HDI contexts focus on methodological optimization and policy integration, high- and medium-HDI regions report more severe exposure conditions constrained by structural limitations, and low-HDI countries remain largely absent from the literature, representing a critical gap for future research.
3.4. Meteorological Factors
Review of the available evidence indicates that meteorological variables play a central role in interpreting exposure to pollutants in public transport environments. Analysis of the 167 reviewed studies shows that temperature and relative humidity are consistently reported, whereas variables such as wind, precipitation, and atmospheric pressure are incorporated less systematically and often present methodological limitations. The integration of meteorological factors in public transport air quality studies is synthesized in Table 4.
The balance of evidence indicates that temperature and relative humidity were essential parameters across all studied microenvironments—stops, buses, stations, and metros—due to their direct influence on dispersion, resuspension, and secondary pollutant formation processes (Abbass et al., 2021; Velasco et al., 2019). In parallel, wind speed and direction were repeatedly associated with marked differences in passenger exposure through both ventilation of open settings and intrusion of polluted air masses into semi-open stations (Briant et al., 2025; Moreno et al., 2015). Precipitation was consistently identified as a natural particle removal mechanism, with substantial post-rain reductions reported in Asian and African case studies (Bhusal et al., 2024; P. N. De Souza et al., 2021). Long-term monitoring in temperate regions further showed that seasonality drives pronounced contrasts between wet and dry periods, explaining a major share of seasonal PM variability (Lund et al., 2020). However, relevant gaps remain, including the scarce incorporation of atmospheric pressure and the near absence of solar radiation records despite their relevance to stability and photochemistry, as well as frequent reliance on external meteorological datasets that may be poorly representative of stop- and cabin-scale conditions. Overall, meteorological variables should be treated not only as control covariates but as determinants of pollutant dynamics in public transport environments, and their systematic integration is required to strengthen exposure characterization and support robust cross-context comparisons.
3.4.1. Most Commonly Recorded Factors
Across public transport air quality studies, temperature and relative humidity were the most consistently reported meteorological variables, reflecting their central role in dispersion, deposition, and chemical transformation processes. In arid and semi-arid settings such as Cairo, continuous records supported the interpretation of PM resuspension under high temperatures and low ambient humidity (Abbass et al., 2021; Amin et al., 2024; Elmarakby & Elkadi, 2024), while studies in Tunisia and Morocco highlighted the relevance of relative humidity for PM₂.₅ hygroscopic behavior during high-insolation episodes (Ben Rayana et al., 2022; Letaïef et al., 2023, 2024; Mraihi et al., 2015). In Latin America, systematic recording of both variables in bus stops, minibuses, and BRT systems enabled the interpretation of intraday particle cycles in Mexico City (Bel & Holst, 2018; Hernández-Paniagua et al., 2018; Velasco et al., 2019; Velasco & Segovia, 2021; Velasco & Tan, 2016), while mobile campaigns in Bogotá incorporated portable meteorological sensors to assess humidity-related changes in ultrafine particle behavior (Morales Betancourt et al., 2019, 2022, 2023). Comparable integration was reported in São Paulo and other Brazilian cities to interpret daily and seasonal variability (Gouveia et al., 2021; Sá et al., 2022; Targino et al., 2020, 2025). Similar practices were observed in Europe (Accorinti et al., 2023; Briant et al., 2025; Correia et al., 2020, 2023; Górka-Kostrubiec et al., 2020; Marinello et al., 2023; Matthaios et al., 2024; Moreno et al., 2015; Strasser et al., 2018) and Asia (Bhat et al., 2022; Bhusal et al., 2024; Chen et al., 2017; Li et al., 2022; R Subramanian, 2020; Ranjan & Sm, 2025; Rawat & Kumar, 2023; Shen & Gao, 2019; Song et al., 2023), with consistent evidence that these variables are indispensable for interpreting concentration variability in transport microenvironments. Evidence from Sub-Saharan Africa further confirms their value under limited monitoring capacity (Bizualem et al., 2023; P. De Souza et al., 2017; P. N. De Souza et al., 2021; Soruma & Woldeamanuel, 2022; Sserunjogi et al., 2022).
3.4.2. Relationships Between Meteorological Factors and Concentrations
The literature indicates that meteorology strongly governs concentration variability in public transport settings. Temperature was repeatedly linked to vertical dispersion and atmospheric stability; long-term metro studies in Beijing and Shanghai reported increased PM₂.₅ accumulation under low mixing heights (Chen et al., 2017; Li et al., 2022; Song et al., 2023; Y. Zhao et al., 2023), while Mexico City campaigns observed PM₂.₅ peaks coinciding with daytime temperature maxima under congested traffic and reduced mixing conditions (Hernández-Paniagua et al., 2018; Velasco et al., 2019; Velasco & Segovia, 2021; Velasco & Tan, 2016). Relative humidity was consistently associated with hygroscopic growth and secondary particle formation, increasing fine particle concentrations in bus-stop microenvironments in Cairo and Tunis (Abbass et al., 2021; Amin et al., 2024; Ben Rayana et al., 2022; Elmarakby & Elkadi, 2024; Mraihi et al., 2015) and serving as a key covariate in mobile campaigns in Bogotá and São Paulo (Gouveia et al., 2021; Morales Betancourt et al., 2019, 2023; Nogueira et al., 2020). Wind speed and direction were central for interpreting ventilation and pollutant transport to stations and stops, with exposure differences linked to stop orientation and prevailing wind fields (Górka-Kostrubiec et al., 2020; Matthaios et al., 2024; Mitsakou et al., 2021) and intrusion-driven accumulation episodes documented in Barcelona and Paris (Briant et al., 2025; Marinello et al., 2023; Moreno et al., 2015). Precipitation acted as an effective scavenging mechanism, reducing PM₂.₅ and PM₁₀ during rain events in Kathmandu, Shanghai, and other Asian cities (Bhusal et al., 2024; Shen & Gao, 2019; Yu et al., 2022; Y. Zhang et al., 2022), with comparable effects reported in Tunisia and Thailand (Letaïef et al., 2023; Lewchalermvongs et al., 2024). Multi-variable interactions were also highlighted, including high-temperature/low-humidity/low-wind combinations associated with peak PM levels in African cities (Amegah et al., 2022; Bizualem et al., 2023; Fosu-Amankwah et al., 2025) and longer-term seasonal modulation in Canada and Sweden (Lund et al., 2020; Szyszkowicz, 2024; Van Ryswyk et al., 2021).
3.4.3. Specific Cases: Rainfall, Wind, and Seasonality
Evidence from case studies confirms that precipitation, wind regimes, and seasonality exert pronounced effects on pollutant concentrations in public transport settings. Rain events were associated with immediate reductions in PM₂.₅ and PM₁₀ in metro stations and urban stops in Shanghai and Beijing (Shen & Gao, 2019; Yu et al., 2022; Y. Zhang et al., 2022; R. Zhao et al., 2018), and mobile campaigns in Kathmandu reported decreases of up to ~50% in average concentrations following rainfall (Bhusal et al., 2024). Similar post-precipitation reductions were documented in North Africa (Ben Rayana et al., 2022; Elmarakby & Elkadi, 2024; Mraihi et al., 2015). Wind effects were equally salient, with exposure differences linked to stop/station orientation (Górka-Kostrubiec et al., 2020; Matthaios et al., 2024; Mitsakou et al., 2021) and wind-direction-driven intrusion events increasing PM₁₀ in transport stations in Barcelona and Paris (Briant et al., 2025; Marinello et al., 2023; Moreno et al., 2015). Seasonal patterns were robust in temperate and continental climates, with higher winter concentrations associated with reduced dispersion and thermal inversions in Sweden and Canada (Lund et al., 2020; Szyszkowicz, 2024; Van Ryswyk et al., 2021), and pronounced wet–dry contrasts shaping exposure in Latin American cities (Bel & Holst, 2018; Morales Betancourt et al., 2019, 2023; Velasco et al., 2019). Comparable seasonal differences were also documented in Sub-Saharan Africa (Bizualem et al., 2023; P. De Souza et al., 2017; P. N. De Souza et al., 2021; Soruma & Woldeamanuel, 2022; Sserunjogi et al., 2022).
Overall, comparative assessment across the 167 studies reveals persistent gaps in meteorological integration. While temperature and relative humidity are routinely reported, wind, precipitation, atmospheric pressure, and solar radiation are incorporated inconsistently, limiting cross-study comparability. Reliance on external meteorological stations remains frequent and can reduce microenvironment representativeness, as reported in campaigns in Mexico and Brazil (Bel & Holst, 2018; Gouveia et al., 2021; Velasco et al., 2019) and in Sub-Saharan Africa (Bizualem et al., 2023; P. De Souza et al., 2017; Soruma & Woldeamanuel, 2022). Atmospheric pressure was rarely reported and mainly in longer European and Asian series (Grana et al., 2017; Lund et al., 2020; Noh et al., 2021; Renard et al., 2023), while solar radiation was almost absent despite its importance for photolysis and ozone formation in open microenvironments (Salthammer et al., 2022; Saucy et al., 2018). Short campaign durations further constrain robust seasonal inference, particularly in tropical and monsoon regions (Bhusal et al., 2024; P. De Souza et al., 2017). These limitations support the need for in situ meteorological monitoring at the microenvironment scale, broader inclusion of underused parameters, and improved geographic and temporal coverage to strengthen exposure characterization and comparative assessments.
3.5. Sampling Strategies
The literature indicates that sampling strategies in public transport air quality research are highly heterogeneous and aligned with distinct study objectives. Table 5 summarizes the main data collection strategies used in public transport air quality studies. Active sampling approaches predominate, reflecting the priority of high-resolution time series in stations and stops (Abbass et al., 2021; Bel & Holst, 2018). Mobile monitoring has mainly been used to characterize exposure during bus trips, whereas stationary monitoring provides continuity in metros and terminals (Briant et al., 2025; Chen et al., 2017). Passive approaches remain less frequent but have proven valuable for expanding spatial coverage in resource-limited contexts (Bikis & Pandey, 2022).
Intermediate-duration campaigns predominated, enabling the identification of short- to mid-term variability. In contrast, long-term monitoring was scarce and was almost exclusively associated with underground environments, such as metro systems in Beijing and Paris (Briant et al., 2025; Chen et al., 2017). Short-duration sampling was mainly used for exploratory assessments or sensor validation, limiting its ability to capture seasonal trends. Regarding the microenvironments assessed, the largest number of studies focused on stations and buses, followed by bus stops (Accorinti et al., 2023; Amegah et al., 2022), whereas underground metros and terminals were less frequently investigated despite their relevance for passenger and worker exposure (Mendoza et al., 2024). When temporal scale, sampling design, and microenvironment were jointly considered, long-term stationary monitoring clustered in metros and terminals, while bus stops showed the highest methodological diversity (active, passive, and stationary). Key gaps include the scarcity of long-term studies at stops and inside buses, and limited attention to peripheral terminals and specific cabin settings (Ben Rayana et al., 2022; Lewchalermvongs et al., 2024), supporting the need for diversified microenvironments and sustained time series to strengthen chronic exposure assessment in public transport.
3.5.1. Predominant Methodological Approaches
Active sampling was the dominant approach across the reviewed literature, typically implemented with reference-grade instruments and low-cost sensors in stations and transport stops. Its application was documented in arid and semi-arid contexts such as Cairo (Abbass et al., 2021; Amin et al., 2024; Elmarakby & Elkadi, 2024), in high-density urban settings such as Mexico City (Bel & Holst, 2018; Hernández-Paniagua et al., 2018; Velasco et al., 2019), and across European corridors (Accorinti et al., 2023; Correia et al., 2020; Rivas et al., 2017). Where reported, sampling intensity varied, including multi-month continuous active series in Lisbon (Correia et al., 2020) and multi-week datasets in Mexico City microbuses and urban stops (Hernández-Paniagua et al., 2018; Velasco & Segovia, 2021).
Mobile monitoring constituted a second relevant group (19 studies), designed to characterize personal exposure during trips in buses, BRT, and school transport. Applications were reported in Accra (Amegah et al., 2022; Fosu-Amankwah et al., 2025), Bogotá (Morales Betancourt et al., 2019, 2023), São Paulo (Gouveia et al., 2021; Nogueira et al., 2020), and Kathmandu (Bhusal et al., 2024), enabling route-scale variability and in-cabin exposure conditions to be captured over campaigns ranging from days to weeks.
Stationary sampling was documented in 17 studies, mainly in metro stations and bus terminals. Its main contribution was the generation of longer time series, including >1-year monitoring in Beijing (Chen et al., 2017) and Paris (Briant et al., 2025), allowing seasonal variability and accumulation effects in enclosed environments to be evaluated. Intermediate stationary campaigns in Poland further highlighted contrasts between open stops and semi-enclosed settings (Górka-Kostrubiec et al., 2020). Passive techniques were less frequent and were mostly applied in low-cost, spatially extensive deployments, particularly in Addis Ababa (Bikis, 2023; Bikis & Pandey, 2022; Bizualem et al., 2023), Nairobi (P. De Souza et al., 2017; P. N. De Souza et al., 2021), and Uganda (Soruma & Woldeamanuel, 2022). While limited in temporal resolution, passive approaches supported broad spatial screening and, in some cases, integration with chemical PM analyses. Overall, methodological practice remains centered on intermediate active campaigns, with mobile designs advancing dynamic exposure characterization and long-term stationary monitoring providing critical but still rare seasonal evidence.
3.5.2. Temporal Scale of Monitoring Campaigns
Most studies relied on intermediate-duration campaigns (weeks to months), reported in 139 of 167 articles, capturing short-term variability and, in some cases, partial seasonality. Intermediate campaigns were documented in arid contexts such as Cairo (Abbass et al., 2021; Amin et al., 2024; Elmarakby & Elkadi, 2024) and in Latin American cities such as Mexico City and São Paulo (Gouveia et al., 2021; Hernández-Paniagua et al., 2018; Velasco et al., 2019). Weekly repeated transects were common in Bogotá BRT and urban routes (Morales Betancourt et al., 2019, 2023), and multi-week mobile campaigns were reported in Accra and Kathmandu (Amegah et al., 2022; Bhusal et al., 2024; Fosu-Amankwah et al., 2025).
Short-duration sampling (hours to days) was less frequent (17 studies) and was mainly used for exploratory purposes or sensor validation, including urban stations in Tunisia and Turkey (Ben Rayana et al., 2022; Ozgen et al., 2016), U.S. school buses (Austin et al., 2019), and Mexico City minibuses (Velasco & Tan, 2016). Only nine studies reported long-term campaigns (>1 year), largely concentrated in stationary monitoring of metro systems and urban stations, including Beijing (Chen et al., 2017), Paris (Briant et al., 2025), and Sweden (Lund et al., 2020). Long-duration efforts were also reported using passive collectors in Addis Ababa (Bizualem et al., 2023) and multi-year station datasets in Canada (Szyszkowicz, 2024; Van Ryswyk et al., 2021). Overall, the dominance of intermediate campaigns reflects resource constraints and the absence of permanent monitoring networks dedicated to public transport environments, leaving chronic exposure insufficiently characterized through sustained time series.
3.5.3. Transport Microenvironments Assessed
The reviewed studies covered multiple transport microenvironments, with a strong emphasis on urban stations, buses, and bus stops. Stations were the most represented setting (58 studies), typically using active and stationary techniques, with examples across Europe (Accorinti et al., 2023; Marinello et al., 2023; Rivas et al., 2017), Asia (Li et al., 2022; Song et al., 2023; Sui et al., 2022), and Latin America (Fameli et al., 2024; Sá et al., 2022). Contrasts between semi-open and underground environments were documented in Greece (Matthaios et al., 2024; Mitsakou et al., 2021), and seasonal PM patterns were reported in Barcelona (Moreno et al., 2015).
Buses constituted the second most represented microenvironment (46 studies), dominated by active and mobile designs, including Bogotá BRT systems (Morales Betancourt et al., 2019, 2023), urban buses in Accra (Amegah et al., 2022; Fosu-Amankwah et al., 2025) and São Paulo (Gouveia et al., 2021; Nogueira et al., 2020), and U.S. school buses (Austin et al., 2019). In India, onboard monitoring with intermediate-duration series supported inter-city comparisons (Bhat et al., 2022; R Subramanian, 2020; Ranjan & Sm, 2025). Bus stops were evaluated in 37 studies with diverse active, passive, and stationary approaches, including arid-climate measurements in Cairo (Abbass et al., 2021; Amin et al., 2024; Elmarakby & Elkadi, 2024), passive deployments over weeks to months in Nairobi (P. De Souza et al., 2017; P. N. De Souza et al., 2021), and meteorology-driven variability analyses in Tunisia and Thailand (Ben Rayana et al., 2022; Lewchalermvongs et al., 2024).
Underground metros accounted for 13 studies, frequently reporting strong particle accumulation; long-term series in Beijing (Chen et al., 2017) and Paris (Briant et al., 2025) enabled seasonal interpretation, and intermediate exposure campaigns were also conducted in Lisbon (Correia et al., 2023), with permanent monitoring networks reported in Sweden (Lund et al., 2020). Bus terminals were the least represented setting (eight studies), using active and stationary methods in Lisbon (Correia et al., 2023), Addis Ababa (Bizualem et al., 2023), and the USA (Ham et al., 2017; Mendoza et al., 2024). Overall, the evidence shows a clear bias toward accessible, high-density settings, leaving gaps in peripheral terminals, specific cabin contexts, and long-duration monitoring in open environments.
Across studies, active sampling clustered in intermediate campaigns and urban stations (Abbass et al., 2021; Accorinti et al., 2023; Li et al., 2022; Rivas et al., 2017), whereas stationary designs were most strongly associated with long-term monitoring in underground metros such as Beijing and Paris (Briant et al., 2025; Chen et al., 2017) and with transport terminals in some urban contexts (Bizualem et al., 2023; Mendoza et al., 2024). Mobile monitoring was tightly linked to in-motion exposure characterization in buses and BRT systems over multi-week campaigns (Amegah et al., 2022; Morales Betancourt et al., 2019, 2023), including technology-related contrasts in São Paulo (Gouveia et al., 2021; Nogueira et al., 2020). Passive techniques were concentrated in bus stops and resource-limited African deployments (Bikis, 2023; Bikis & Pandey, 2022; P. N. De Souza et al., 2021), but their low prevalence limits systematic comparability with active designs. Notably, long-term monitoring remains rare in stops and buses, constraining robust evaluation of seasonal patterns and cumulative exposure in open environments (Ben Rayana et al., 2022; Lewchalermvongs et al., 2024). These patterns indicate that study design quality is strongly mediated by instrumentation choices, which ultimately constrain temporal resolution, spatial coverage, and cross-study comparability.
3.5.4. Sampling Instrumentation: Sensors
Among studies using sensors for data acquisition (n = 111 records), a diversification of platforms was evident, with a strong preference for direct-reading particle measurements. Sensor-based methodologies and techniques directly applied in public transport environments are presented in Table 6. Recurrent use of low-cost optical PM sensors was reported (e.g., PurpleAir, AirBeam, OPC families, Plantower/Sensirion, AirVisual, and AirQo-type networks), alongside portable or continuous research-grade monitors (e.g., DustTrak/SidePak/pDR, TEOM, Grimm, Met One). These approaches were not mutually exclusive, as hybrid configurations and multi-parameter instrument suites were described across multiple studies (Abbass et al., 2021; Aix et al., 2024; Amegah et al., 2022; Bahino et al., 2024; Ben Rayana et al., 2022; Bhat et al., 2022; Bhusal et al., 2024; Bobbia et al., 2025; Correia et al., 2023; Dingemanse et al., 2022; Djossou et al., 2018; Ham et al., 2017; Hernández-Paniagua et al., 2018).
Specialized instrumentation targeting specific exposure metrics was also identified. Black carbon was measured using aethalometers or micro-aethalometers (e.g., AE51 and comparable devices), while particle number concentration and ultrafine fractions were characterized using instruments such as CPC, P-Trak, and DiSCmini. This pattern suggests an emerging shift toward exposure characterization beyond PM mass, although adoption remains heterogeneous across studies (Bauer et al., 2018; Correia et al., 2020; Ezz et al., 2015; Ham et al., 2017; Leavey et al., 2017; Lim et al., 2015; Malagon-Rojas et al., 2022; Matthews et al., 2023; Moreno et al., 2015; Targino et al., 2025; Van Ryswyk et al., 2021).
Gas measurements were also reported using electrochemical/NDIR sensors or PEMS-type platforms for gases and/or CO₂. Increasing integration of contextual sensors was observed, including GPS, meteorological modules (temperature/humidity/pressure), and, in some cases, physiological variables (e.g., heart rate), enabling exposure interpretation with spatiotemporal support and occasional individual load approximations (Agathokleous et al., 2025; Ajayi et al., 2025; Amegah et al., 2021; Bizualem et al., 2023; Correia et al., 2023; Dirk Dingemanse et al., 2022; Aix et al., 2024; Hernández-Paniagua, 2018; Huang, 2023; Ibarra-Espinosa, 2022; Kim, 2021). Comparable use of mobile and fixed deployments was documented, including vehicle-mounted systems, backpack- or motorcycle-based platforms, and stationary point configurations; network-based approaches (multi-node deployments) were also explicitly reported, supporting broader spatial coverage (Amegah et al., 2022; Bobbia et al., 2025; P. N. De Souza et al., 2021; Galiwango et al., 2022; Ghaffarpasand et al., 2024; Guttikunda et al., 2025; Ham et al., 2017; Lakra et al., 2025; J. J. Lee et al., 2021; Remy et al., 2025; Sanz & Perdiguero, 2024; Singh et al., 2021; Soruma & Woldeamanuel, 2022).
Overall, two methodological trajectories emerge: (i) scalability through low-cost sensors and networks and (ii) high-resolution characterization via direct-reading portable instruments. However, cross-study comparability is frequently constrained by instrumental heterogeneity and non-standardized operational frameworks (Amegah et al., 2022; Morales Betancourt et al., 2019, 2022, 2023; Okure et al., 2022, 2025; Renard et al., 2022, 2023, 2024; Velasco et al., 2019; Velasco & Segovia, 2021; Velasco & Tan, 2016). A critical gap concerns traceability: explicit validation was reported in only one study, and only five studies explicitly mentioned comparison or reference procedures, limiting cross-study interpretation for sensor-based records at regional or global scales (Bhusal et al., 2024; Ibarra-Espinosa et al., 2022; Njeru et al., 2024; Sserunjogi et al., 2022; Targino et al., 2025; Wadlow et al., 2019). Co-measurement of particles, gases, and covariates (e.g., electrochemical sensors with OPC/PM, or CO₂ with particles) supports more mechanistic interpretations related to ventilation, combustion, congestion, and indoor–outdoor exchange, although multiparameter configurations remain non-dominant, indicating that particle metrics are still prioritized in public transport research (Correia et al., 2023; P. De Souza et al., 2017; Ramel-Delobel et al., 2024; Salthammer et al., 2022; Wang et al., 2018; Yu et al., 2022). The repeated use of GPS and mobile deployments further suggests a shift from point measurements toward exposure mapping and in-transit characterization (Aix et al., 2024; P. N. De Souza et al., 2021; Renard et al., 2022, 2023, 2024; Van Den Bossche et al., 2015; Zheng et al., 2021).
3.6. Methods for Sample Analysis
3.6.1. Chemical Analyses
Inductively coupled plasma spectrometry—both mass spectrometry (ICP-MS) and optical emission spectrometry (ICP-OES)—was widely applied for multi-element quantification in particulate samples from transport microenvironments. These techniques were used to identify both major constituents and trace metals. The main chemical analysis techniques employed in public transport air quality studies are summarized in Table 7. In Barcelona, PM₂.₅ filters were chemically analyzed using ICP-AES for major components and ICP-MS for trace metals (Moreno et al., 2015). In urban exposure campaigns in São Paulo, Coimbra, and Aveiro, quartz filter subsamples were microwave-digested with acid mixtures and analyzed by ICP-MS, complemented by ion chromatography for sugars and determinations of polycyclic aromatic hydrocarbons (Pereira et al., 2025). In indoor contexts, including domestic dust assessments, microwave acid digestion (HNO₃) followed by ICP-MS enabled quantification of metals such as Cd, Cu, Co, Cr, Fe, Mn, Ni, Pb, and Zn (Szczepaniak-Wnuk & Górka-Kostrubiec, 2016), illustrating the suitability of ICP-MS for low-mass filter samples and trace-level detection.
Scanning electron microscopy coupled with energy-dispersive X-ray spectroscopy (SEM-EDS) was widely used to complement chemical analyses through particle-scale morphological and elemental characterization. In London, particles collected on PTFE filters were examined by SEM-EDS, allowing identification of individual particle structures and elemental composition (Grana et al., 2017). In Barcelona, urban transport filters were analyzed using field-emission SEM-EDS, providing high-resolution images and spectra of single particles (Rivas et al., 2017). In Venice, road dust (<37 µm) was mounted on aluminum stubs and gold-coated for SEM-EDS analysis, confirming the presence of glass microspheres associated with road paint (Valotto et al., 2015), while uncoated fine fractions revealed microspheres and irregular particles (Zannoni et al., 2016). In indoor environments, SEM-EDS was also applied to dust deposited inside Athens buses, revealing compositions dominated by Si, Ca, Fe, and trace heavy metals (Botsou et al., 2020). Although SEM-EDS enabled linking particle morphology and composition to specific sources such as vehicular friction and material wear, limitations were noted, including restricted carbon quantification when C or Au coatings were used and the requirement for high-vacuum conditions, which may limit particle representativeness (Rivas et al., 2017).
X-ray fluorescence (XRF) was employed in a subset of studies as a complementary technique. In Ho Chi Minh City, filters were analyzed using ED-P-XRF (Spectro XEPOS), enabling multi-element quantification with blank control and QA/QC procedures (Ngo et al., 2015). In Canada, a Xact 625 particulate metals analyzer was used to measure up to 24 PM₂.₅-associated elements quasi-continuously, calibrated with certified reference materials (Y. Zhang et al., 2023). These applications highlight XRF as a non-destructive technique with high temporal resolution, suitable for near-real-time exposure studies, albeit with lower sensitivity than ICP-MS. In contrast, atomic absorption spectroscopy (AAS) was not reported among the reviewed studies, reflecting its replacement by methods offering greater multielement capability and sensitivity (ICP, XRF) or higher spatial resolution (SEM-EDS).
Overall, the reviewed literature indicates that chemical characterization of particles in transport and urban environments primarily relied on ICP-MS/ICP-OES for precise metal quantification, SEM-EDS for particle-scale morphology and elemental analysis, and XRF for non-destructive and continuous elemental monitoring. Technique selection depended on sample type and study objectives: low-mass air filters favored ICP-MS for sensitivity, bulk road dust was commonly analyzed by ICP-OES, SEM-EDS enabled tracing individual particles to their sources, and XRF supported extended monitoring without destructive preparation. This integrated methodological framework enabled robust identification of sources such as vehicular wear, road paint, fossil fuel combustion, and dust resuspension, providing diverse and complementary evidence of chemical contamination in transport microenvironments.
3.6.2. Environmental Magnetism
Environmental magnetism has been applied across urban and transport environments to characterize particulate matter, with emphasis on ferrimagnetic fractions associated with vehicular and industrial sources. Environmental magnetism methodologies applied in transport-related air quality studies are presented in Table 8. In roadside soils, low-frequency magnetic susceptibility (χlf) and saturation isothermal remanent magnetization (SIRM) showed significant correlations with Ni, Cu, and Zn concentrations, indicating sensitivity to particles derived from brake friction and tire wear (Brempong et al., 2016). In indoor urban environments, household dust characterization using χlf and coercivity measurements revealed that elevated values were associated with low-coercivity, Fe-rich particles, as confirmed by thermomagnetic spectra and chemical analyses (Szczepaniak-Wnuk & Górka-Kostrubiec, 2016).
Recent studies expanded the methodological framework through the incorporation of advanced magnetic parameters. In industrial and urban environments, the combined use of hysteresis parameters (Ms, Mr, Bc, Bcr) and first-order reversal curve (FORC) diagrams enabled discrimination of magnetic populations with different domain states, revealing the coexistence of pseudo-single-domain grains linked to combustion-derived spherical particles and multidomain grains associated with natural and pedogenic dust (Górka-Kostrubiec et al., 2020). This approach improved source discrimination beyond interpretations based solely on χlf. Complementarily, the application of anhysteretic remanent susceptibility (χARM) together with frequency-dependent susceptibility (χfd) proved critical for estimating the contribution of anthropogenic ultrafine particles in high-traffic urban canyon studies, confirming intensified magnetic signals under limited ventilation conditions (Letaïef et al., 2023).
The use of biomonitors and passive filters also benefited from remanent magnetic parameters such as SIRM and χARM. In citizen science experiments, the Qmag index was proposed as an integrative magnetometric parameter and applied to Hedera helix leaves and passive filters, enabling discrimination of urban microenvironments with high sensitivity to spatial pollution variability (Letaïef et al., 2023, 2024). In these studies, χfd was used to distinguish contributions from natural particles exhibiting frequency-dependent behavior from vehicular particles characterized by fine ferrimagnetic grains with strong magnetic responses (Letaïef et al., 2024). The applicability of environmental magnetometry was further demonstrated in public transport environments. In dust accumulated inside urban buses, combined analysis of χlf, IRM, and hysteresis parameters revealed the presence of anthropogenic magnetite enriched in Cu, Zn, and Pb, corroborated by SEM-EDS observations showing spherical iron particles with metallic inclusions (Botsou et al., 2020). In underground stations, it has been suggested that future application of FORC diagrams and coercivity analyses would allow more detailed characterization of Fe-rich particles derived from rail and brake friction, a process identified as critical for understanding magnetic loading in enclosed transport microenvironments (L. Zhang et al., 2025).
Comparative studies indicate that integrating multiple magnetic parameters substantially reduces ambiguity in source attribution. While χlf and SIRM act as proxies for total ferrimagnetic particle concentration, χARM and χfd enhance sensitivity to fine grains, and hysteresis parameters combined with FORC provide mineralogical and domain-state information. The combined application of these techniques enabled more reliable discrimination among vehicular, industrial, and resuspended sources than isolated metrics (Górka-Kostrubiec et al., 2020; Letaïef et al., 2023, 2024). Methodological advantages include low cost, rapid analysis, and the capacity to deploy dense sampling networks with high spatial resolution, positioning environmental magnetometry as a powerful tool for urban pollution mapping (Letaïef et al., 2023, 2024). However, limitations remain: magnetic signals are dominated by ferrimagnetic fractions, potentially underrepresenting non-magnetic ultrafine particles; overlapping sources complicate interpretation; and validation through chemical analyses and SEM-EDS remains essential (Botsou et al., 2020; Brempong et al., 2016; Szczepaniak-Wnuk & Górka-Kostrubiec, 2016). Moreover, in indoor and underground environments, magnetic parameters alone do not allow estimation of inhaled dose and should be integrated with personal exposure and environmental health data (Matthews et al., 2023; Mitsakou et al., 2021; Remy et al., 2025; Saucy et al., 2018).
Overall, the reviewed evidence confirms that environmental magnetometry—particularly when incorporating advanced parameters such as FORC, χARM, χfd, and full hysteresis analysis—constitutes a robust and flexible methodology for assessing particulate pollution in urban and transport environments. Its greatest potential is achieved when combined with chemical and microscopic techniques, enabling high-resolution, low-cost tracing of traffic-related and other anthropogenic emissions and consolidating its role as a key tool for environmental management.
3.6.3. Modelling
Within the scientific literature on public transport and air pollution, several studies explicitly incorporated modelling approaches to analyze exposure and pollutant dynamics (Vera Valdés & Rodríguez Caballero, 2021). These works employed statistical, physical, computational, and dosimetric techniques to estimate concentrations, reproduce dispersion processes in urban microenvironments, and project risk scenarios under different operational conditions (Wu et al., 2024; Yasin et al., 2025; Zhan et al., 2025). Table 9 provides an overview of statistical, predictive, and exposure-related modelling approaches used in public transport air quality studies. The application of modelling has been essential to move beyond empirical descriptions, generating predictive frameworks that integrate environmental and social parameters within high-complexity structures (Remy et al., 2025; R. Zhao et al., 2018).
Statistical models have been widely applied in this field. Multiple and semiparametric regressions, as well as econometric techniques such as Granger causality tests, were used to analyze relationships between public transport mobility and pollutant concentrations (Sanz & Perdiguero, 2024; Vera Valdés & Rodríguez Caballero, 2021). Time-series decomposition methods, including the Prophet algorithm applied to daily PM₂.₅ concentrations in the United States, enabled separation of trends and seasonality and detection of weekly and seasonal pollution patterns (R. Zhao et al., 2018). These models integrated parameters such as wind speed, relative humidity, temperature, traffic intensity, vehicle age, and public transport usage frequency (Szyszkowicz, 2024; Van Den Bossche et al., 2015). Results indicated that seasonality and weekly cycles account for a substantial fraction of concentration variability, with winter and summer peaks and weekend-associated maxima (R. Zhao et al., 2018). Despite their strong predictive performance, these approaches require long, homogeneous time series and are sensitive to missing data and abrupt changes in urban dynamics (Sanz & Perdiguero, 2024; Vera Valdés & Rodríguez Caballero, 2021).
A further relevant stream involves spatial modelling supported by geographic information systems, satellite imagery, and machine-learning algorithms. Random Forest, K-Nearest Neighbors, and Naïve Bayes models were applied to predict PM₁₀ concentrations in African cities by integrating topographic, meteorological, and land-use variables (Yasin et al., 2025). Multiscale geographically weighted regression (MGWR) was used to assess differentiated socioeconomic and natural drivers of PM₂.₅ and O₃ across 337 Chinese cities (Zhan et al., 2025). High-resolution satellite data combined with machine learning enabled street-level PM₂.₅ mapping, revealing marked increases near highways and high-traffic corridors (Wu et al., 2024). Overall, concentrations increased with population and industrial density, whereas vegetation cover and GDP per capita exerted mitigating effects (Zhan et al., 2025). Despite producing detailed risk maps, these approaches are limited by computational complexity, the need for high-quality georeferenced data, and challenges in transferability across contexts (Wu et al., 2024; Yasin et al., 2025; Zhan et al., 2025). Dosimetric models integrating breathing frequency and pulmonary ventilation rates were also employed to estimate inhaled particle dose during public transport trips. These models showed pronounced differences between adults and children and between vehicles with and without filtration systems (Muresan & François, 2018). In some cases, walking along high-traffic roads resulted in particle doses up to an order of magnitude higher than travelling in adequately ventilated buses (Moreno et al., 2015; Muresan & François, 2018). While these findings underscore the relevance of linking ambient exposure to internal dose, individual physiological variability and the lack of direct biomarkers constrain extrapolation (Moreno et al., 2015).
Calibrated mobile sensor networks deployed on buses or trams enabled high-resolution urban contaminant mapping (Remy et al., 2025; Renard et al., 2024; Salthammer et al., 2022). Interpolation and calibration against reference stations showed highest PM₂.₅ levels along major roadways, with exposure decreasing with distance from traffic arteries (Remy et al., 2025; Renard et al., 2024). Marked differences between weekdays and holidays were also observed, with higher peaks during the latter (Remy et al., 2025; Wu et al., 2024). Advantages include low cost and extensive coverage, whereas limitations relate to sensor calibration and route representativeness (Renard et al., 2024). Econometric and policy-evaluation models were applied to assess the impacts of bus network reorganizations and abrupt mobility changes. Route restructuring in Barcelona was associated with improved air quality along major corridors (Sanz & Perdiguero, 2024). During the COVID-19 pandemic, reductions in public transport use did not yield proportional pollution decreases, suggesting a dominant role of industrial sources and private transport (Vera Valdés & Rodríguez Caballero, 2021). Although effective for evaluating real-world policies, these models depend on high-quality historical series and appropriate control variable specification (Sanz & Perdiguero, 2024).
Collectively, modelling studies converge on complementary strengths: statistical models capture trends and periodicities (Vera Valdés & Rodríguez Caballero, 2021; R. Zhao et al., 2018); spatial models reveal local heterogeneities (Wu et al., 2024; Yasin et al., 2025; Zhan et al., 2025); physical models reproduce microenvironmental conditions in detail (Matthaios et al., 2024; Todorov et al., 2023); and dosimetric models link external exposure to internal dose (Moreno et al., 2015; Muresan & François, 2018). Advantages include scenario anticipation and mitigation planning, while limitations relate to data quality, computational complexity, and the need for experimental validation (Remy et al., 2025; Renard et al., 2024; Szyszkowicz, 2024).
3.6.4. Inhaled Dose
The concept of inhaled dose has been increasingly recognized as a key metric for assessing air-pollution risks in public transport contexts. While many studies report only ambient concentrations in vehicle cabins, stations, or interiors, translating these concentrations into inhaled dose is essential for evaluating health impacts. Inhaled dose methodologies applied in public transport air quality studies are summarized in Table 10. Reviews highlighted inhaled dose as an integrative exposure metric without performing original calculations, emphasizing the need to incorporate physiological and individual factors (Mitsakou et al., 2021). Building on this premise, fifteen studies explicitly quantified inhaled dose in transport environments. A concentration-inhalation rate-time approach was applied to estimate PM₂.₅ dose as a function of trip duration (Correia et al., 2020). Dose estimates stratified by age and sex demonstrated variability in population vulnerability driven by physiology and travel time (Fameli et al., 2024). Exposure during cycling, motorcycling, and public transport was translated into inhaled dose per kilometre travelled, showing the highest loads for cyclists due to elevated ventilation rates (Goel et al., 2015).
Hernández-Paniagua et al. (2018) estimated PM₂.₅ inhaled doses across transport modes, showing that minibus and bus users inhaled higher amounts than metro passengers. Doses associated with waiting environments were quantified by Mahesh (2021), who demonstrated the relevance of pre-boarding microenvironments using 15-min bus-stop exposure scenarios. Mainka et al. (2025) quantified NO₂ and PM₂.₅ doses per kilometre for pedestrians, cyclists, and car users, confirming higher doses for active modes due to exercise-related physiology. A single round trip on mass transit was reported to account for up to 60% of the daily PM₂.₅ dose and nearly 90% of black carbon exposure (Morales Betancourt et al., 2019). Elevated inhaled doses of PM₂.₅, black carbon, and toxic metals were also reported inside bus terminals, often doubling outdoor values (Nogueira et al., 2020). Heart-rate–based ventilation models were applied to estimate particle doses in buses and metro systems (Qiu & Cao, 2020), while commuting trips were shown to contribute approximately 30% of the daily PM₂.₅ dose, with marked differences across transport modes (Ramel-Delobel et al., 2024). Active travel modes were associated with up to fivefold higher PM₂.₅ doses compared with metro use (Shen & Gao, 2019). Integrated approaches combining pollutant concentrations, travel time, and heart rate were applied in multiple transport settings, including double-decker buses (Velasco et al., 2019; Velasco & Segovia, 2021). Seasonal variability in accumulated PM₂.₅ dose in buses was also documented (Y. Zhao et al., 2023), while combined concentration–ventilation–cardiac data enabled estimation of inhaled dose and associated life expectancy loss (Zheng et al., 2021). Collectively, studies applying explicit inhaled-dose calculations consistently demonstrate that the actual pollutant burden experienced by passengers exceeds what is inferred from ambient concentrations alone. Both direct formulations and physiology-based models consolidate inhaled dose as a robust, integrative exposure metric. Although earlier works often referenced inhaled dose only conceptually, accumulated empirical evidence confirms its central role in understanding exposure magnitude in public transport and informing mitigation and public health strategies.
3.6.5. Positive Matrix Factorization (PMF)
The application of Positive Matrix Factorization (PMF) across the reviewed studies enabled identification of commonalities and divergences in particulate matter (PM) source apportionment. PMF methodologies and applications in public transport studies are summarized in Table 11. Most studies followed standardized data pre-treatment procedures consistent with U.S. EPA guidelines. Values below detection limits were commonly replaced with half the detection limit, and uncertainty matrices were constructed by combining fractional error with detection limits (Leoni et al., 2018; Olufemi et al., 2025; Pereira et al., 2025; Y. Zhang et al., 2023). Chemical species were systematically classified by signal-to-noise ratio, excluding low-variability variables to ensure that extracted factors represented real sources rather than instrumental noise.
A consistent methodological pattern emerged in determining the optimal number of factors: multiple solutions were tested and selected based on minimization of the objective function Q and physical interpretability. Six factors were identified as optimal for reproducing PM₁ size distributions and chemical composition in one study, avoiding overfitting (Leoni et al., 2018). Five-factor solutions were validated using bootstrap and displacement (DISP) analyses, ensuring robustness (Pereira et al., 2025). Sensitivity analyses demonstrated PMF stability under alternative treatments of extreme events and sub-detection-limit values (Y. Zhang et al., 2023). In contrast, studies with limited chemical markers relied on qualitative expert interpretation when selecting factor numbers, due to constraints in applying advanced diagnostics (Olufemi et al., 2025).
Validation strategies varied in rigor. While rotation (Fpeak), bootstrap, and DISP analyses were implemented to minimize rotational ambiguity in several studies (Pereira et al., 2025; Y. Zhang et al., 2023), others relied primarily on direct comparison of factor profiles and contributions (Olufemi et al., 2025). Additional verification was achieved through cross-correlation of particle size distributions and chemical composition (Leoni et al., 2018). Across all studies, consistency with established source tracers—such as potassium for biomass burning, vanadium for fuel oil, elemental carbon for traffic, and heavy metals for industrial processes—was critical for factor interpretation.
In the case of Lakra et al. (2025), the study was limited to measuring PM₁, PM₂.₅, and PM₁₀ in public transport environments, without implementing a full factorization analysis. The methodology relied on descriptive statistics and comparisons with exposure guidelines to identify elevated concentrations inside vehicles and at stops. Although PMF was not applied, the availability of PM time series placed the study within the same thematic framework, highlighting the distinction between direct exposure assessments and investigations aimed at source apportionment through receptor models. A distinct case was reported by R. Subramanian (2020), who adopted an Observation-Based Method (OBM) instead of PMF due to logistical constraints in collecting extensive chemical datasets in Kigali. In this approach, temporal variability in pollutant concentrations measured by low-cost sensors was used to infer relative contributions of local and regional sources. Unlike PMF, OBM does not mathematically decompose concentration matrices into source profiles and contributions, but rather infers source influence through space–time pattern comparisons. Although less detailed in source characterization, this method demonstrated that urban traffic and biomass combustion accounted for more than half of PM₂.₅ concentrations during the wet season.
Comparative analysis indicates that studies implementing PMF consistently identify it as a robust framework for source apportionment in complex urban environments. However, data temporal resolution strongly conditions results: 24-h samples, as in Pereira et al. (2025), tend to merge traffic emissions and resuspended dust, whereas hourly datasets, as in Y. Zhang et al. (2023), enable discrimination of specific episodes such as fireworks or dust storms. In resource-limited contexts, simplified approaches such as OBM or descriptive analyses are adopted, providing useful but less detailed source attribution. Overall, methodological evidence shows that PMF performance depends largely on the quality, chemical richness, and temporal resolution of input data. When comprehensive datasets are available, PMF yields robust and statistically validated factors consistent with known source tracers. In contrast, data-limited scenarios rely on simplified methods that, while informative, do not achieve the same level of source resolution.
3.6.6. Computational Fluid Dynamics (CFD)
The application of computational fluid dynamics (CFD) to particulate matter (PM) analysis was identified in five studies employing differentiated approaches. CFD-based methodologies used to assess pollutant dispersion and ventilation in public transport environments are summarized in Table 12. Zhao et al. (2018) simulated ventilation performance in an underground bus terminal, modelling pollutant dispersion and heat accumulation under scenarios with and without mechanical ventilation. Model outputs were validated against in situ CO and particle measurements, demonstrating the effectiveness of the proposed system in reducing PM levels and improving thermal comfort. Noh et al. (2021) applied CFD to investigate dust intrusion at bus stops using a Reynolds stress turbulence model to reproduce anisotropic airflow around barriers. Three stop configurations were compared, showing that air curtains reduced particle concentrations in waiting areas by up to 88%, illustrating how CFD can inform simple architectural interventions with substantial exposure reduction. Yu et al. (2022) analysed vehicular emission dispersion at bus stops with different geometric designs, revealing that passenger inhaled dose depends on both stop geometry and prevailing wind direction. The integration of traffic microsimulation into CFD scenarios strengthened the linkage between traffic dynamics, emissions, and exposure.
Bahman Zadeh et al. (2025) modelled aerosol dispersion inside buses using a coupled Eulerian–Lagrangian framework. Although increased ventilation reduced average particle concentrations, persistent local accumulation zones were identified, underscoring the need for ventilation strategies that ensure spatial uniformity rather than solely increased air exchange rates. Finally, Shinohara et al. (2025) combined experimental testing with CFD simulations to evaluate recirculation and filtration in tourist buses. Results showed that unfiltered recirculation dispersed particles throughout the cabin, whereas MERV-11 and MERV-13 filtration drastically reduced droplet nuclei concentrations, achieving removal efficiencies comparable to or exceeding those of outdoor air ventilation. These findings validated filtration as an effective strategy for both thermal comfort and aerosol control.
The remaining four studies provided complementary empirical evidence without explicitly applying CFD. Y. Zhao et al. (2023) measured PM₂.₅ concentrations and estimated personal doses in urban buses in Dalian, reporting frequent exceedances of WHO guideline values. Lan et al. (2024) compared ultrafine particle exposure at bus stops located in urban street canyons versus open areas, confirming the strong influence of urban morphology on particle accumulation. Lewchalermvongs et al. (2024) approached the problem through game theory, modelling route choice as a function of maximum PM₂.₅ exposure and demonstrating the potential of transport demand management as an indirect mitigation strategy. Finally, L. Zhang et al. (2025) applied machine learning techniques (SOM–GEE) to analyse PM dispersion in metro stations, identifying coupled patterns between external and internal sources. These studies are complementary because they provide observational, contextual, and analytical evidence that supports and constrains CFD-based assumptions. Measurements reported by Lan et al. (2024), R. Zhao et al. (2018), and Y. Zhao et al. (2023) enable validation of simulated concentration magnitudes, while the management-oriented framework proposed by Lewchalermvongs et al. (2024) addresses mitigation pathways beyond the scope of CFD.
Similarly, the statistical learning approach of L. Zhang et al. (2025) offers a practical alternative when system complexity limits direct numerical simulation. Collectively, these contributions enrich the mechanistic insights provided by CFD with empirical validation and planning-oriented perspectives. Overall, the integrated analysis of measurement strategies, chemical and magnetic characterization, modelling approaches, and inhaled dose assessments reveals a field that has advanced substantially in methodological diversity but remains fragmented in standardization and integration. While high-resolution measurements, receptor models, CFD simulations, and dosimetric calculations have each provided valuable insights into exposure dynamics in public transport environments, their application has largely occurred in isolation. This compartmentalization limits cross-comparability and constrains the capacity to synthesize robust, transferable evidence across climatic, socioeconomic, and infrastructural contexts. In particular, the heterogeneity of instrumentation, temporal scales, and modelling assumptions continues to challenge the consolidation of exposure metrics that are directly relevant for health risk assessment and policy design.
Future research would benefit from a more cohesive framework that explicitly links in situ measurements, advanced analytical techniques (including environmental magnetism and chemical speciation), spatial–statistical modelling, CFD-based mechanistic simulations, and inhaled dose estimation within unified study designs. Priority should be given to long-term and multi-seasonal monitoring in underrepresented microenvironments such as bus stops, terminals, and vehicle cabins, especially in regions with limited monitoring capacity. The integration of low-cost sensor networks with targeted high-precision validation, coupled with modelling approaches that bridge concentration, exposure, and dose, represents a critical pathway toward improving both scientific robustness and practical relevance. Such convergence is essential to move beyond descriptive assessments and toward actionable evidence capable of informing transport planning, ventilation design, exposure mitigation strategies, and public health policy in diverse urban settings.
4. Conclusions
This review demonstrates that air pollution in public transport systems constitutes a major, yet systematically underestimated, component of urban population exposure. Across diverse geographic, climatic, and socioeconomic contexts, commuters and transport workers are consistently exposed to pollutant concentrations that exceed those reported by fixed ambient monitoring stations. Fine and ultrafine particulate matter (PM₂.₅, PM₁₀, and UFPs) emerges as the dominant exposure driver, particularly within confined or poorly ventilated microenvironments such as bus cabins, underground metro systems, and enclosed stations, where accumulation processes and limited air exchange amplify pollutant levels during peak operating periods.
The synthesized evidence reveals pronounced structural imbalances in the global research landscape. Current knowledge is heavily skewed toward temperate and tropical regions and toward countries with very high and high Human Development Index, while dry–arid, continental, and especially low-HDI regions remain critically underrepresented despite potentially severe exposure conditions. Methodologically, the literature is dominated by short- to intermediate-term campaigns relying on active and mobile measurements, with increasing but still fragmented use of calibrated low-cost sensors. In contrast, long-term stationary observations, harmonized protocols, and integrated monitoring frameworks remain scarce, limiting the ability to characterize chronic exposure, seasonal variability, and cumulative health risks in public transport environments.
A central contribution of this review is the identification of environmental magnetism as a powerful yet markedly underutilized tool in public transport air-quality research. Magnetic techniques offer a rapid, cost-effective, and non-destructive proxy for traffic-related particulate matter, particularly iron-bearing particles associated with brake wear, rail–wheel interaction, and resuspension processes that dominate many transport microenvironments. Despite these advantages, magnetic monitoring has been applied in only a limited number of studies, and its systematic integration with chemical characterization, sensor-based measurements, dispersion modeling, and inhaled-dose assessment remains largely unexplored. This underuse represents a missed opportunity to enhance source discrimination, spatial resolution, and monitoring feasibility, especially in data-poor regions.
Overall, the findings highlight persistent methodological, geographical, and conceptual fragmentation within the field. Advancing the state of the art requires a shift toward standardized, interdisciplinary, and long-term monitoring strategies that explicitly link concentration measurements with exposure dynamics, source attribution, and dose-based metrics. The coordinated integration of sensor technologies, chemical analyses, modeling approaches—including CFD and receptor models—and environmental magnetism has the potential to substantially improve exposure assessment, strengthen cross-context comparability, and support the development of evidence-based mitigation policies. Such convergence is essential to reduce health risks associated with public transport-related air pollution and to ensure that sustainable mobility strategies effectively protect the millions of users who rely on public transport systems worldwide.
Supplementary Materials
The following supporting information can be downloaded at the web-site of this paper posted on preprints.org.
Data availability
Data available on demand.
Acknowledgments
The authors acknowledge the support of the Mexican National Council for Humanities, Science, and Technology (CONAHCYT) for the scholarship awarded to Q.I. Juan José Pacheco Tovar, which enabled his master’s studies and the development of this research. The authors also thank the anonymous reviewers for their constructive and insightful comments, which significantly improved the quality and clarity of this manuscript.
Conflicts of Interest
The authors declare no conflict of interest.
References
- Abbass, R. A.; Kumar, P.; El-Gendy, A. Fine particulate matter exposure in four transport modes of Greater Cairo. Science of The Total Environment 2021, 791, 148104. [Google Scholar] [CrossRef]
- Accorinti, J.; Allende, D.; Puliafito, S. E. The impact on air quality of PM10 emissions from the bus fleet of Buenos Aires City. SN Applied Sciences 2023, 5(1), 6. [Google Scholar] [CrossRef]
- Adikaram, W. D. C. N.; Arambepola, C. Occupational hazard to on-road air pollution within passenger transport micro-environments: Evidence from traffic congested areas in Colombo, Sri Lanka. BMC Public Health 2025, 25(1), 2253. [Google Scholar] [CrossRef]
- Aga, A. G.; Gebresenbet, G.; Gopal, R.; Nallamothu, R. B. Route-Based Emissions Inventory and Energy Consumption of Passenger Vehicles: Case of Addis Ababa, Ethiopia. Innovation and Green Development 2025, 4(3), 100251. [Google Scholar] [CrossRef]
- Agathokleous, S.; Kedwell, K.; Casado, C.; Asbach, C.; Fonseca, A. S.; Liisberg, J. B.; Jensen, S. B.; Jensen, K. A.; Rodríguez, J. A.; Karanasiou, A.; Lehmann, M.; Moreno, T. Air quality in a bus depot and a way of improving it: Effect of using air purifiers. Environmental Pollution 2025, 375, 126310. [Google Scholar] [CrossRef]
- Aix, M.-L.; Claitte, M.; Bicout, D. J. Exposure to particulate matter when commuting in the urban area of Grenoble, France. Atmospheric Environment 2024, 339, 120887. [Google Scholar] [CrossRef]
- Amegah, A. K.; Dakuu, G.; Mudu, P.; Jaakkola, J. J. K. Particulate matter pollution at traffic hotspots of Accra, Ghana: Levels, exposure experiences of street traders, and associated respiratory and cardiovascular symptoms. Journal of Exposure Science & Environmental Epidemiology 2022, 32(2), 333–342. [Google Scholar] [CrossRef]
- Amin, M.; Aun, S.; Hang, L.; Hata, M.; Phairuang, W.; Masami, F. Investigation into personal exposure to ultrafine particle (UFP) in Phnom Penh, Cambodia: A pilot study. Atmospheric Pollution Research 2024, 15(12), 102307. [Google Scholar] [CrossRef]
- Austin, W.; Heutel, G.; Kreisman, D. School bus emissions, student health and academic performance. Economics of Education Review 2019, 70, 109–126. [Google Scholar] [CrossRef]
- Bahino, J.; Giordano, M.; Beekmann, M.; Yoboué, V.; Ochou, A.; Galy-Lacaux, C.; Liousse, C.; Hughes, A.; Nimo, J.; Lemmouchi, F.; Cuesta, J.; Amegah, A. K.; Subramanian, R. Temporal variability and regional influences of PM2.5 in the West African cities of Abidjan (Côte d’Ivoire) and Accra (Ghana). Environmental Science: Atmospheres 2024, 4(4), 468–487. [Google Scholar] [CrossRef]
- Bahman Zadeh, Z.; Cummings, B. E.; Lo, L. J. Parametric Analysis of the Factors Impacting the Spatial Distribution of Particles in a Bus Environment. Sustainability 2025, 17(3), 1051. [Google Scholar] [CrossRef]
- Bauer, K.; Bosker, T.; Dirks, K. N.; Behrens, P. The impact of seating location on black carbon exposure in public transit buses: Implications for vulnerable groups. Transportation Research Part D: Transport and Environment 2018, 62, 577–583. [Google Scholar] [CrossRef]
- Bel, G.; Holst, M. Evaluation of the impact of Bus Rapid Transit on air pollution in Mexico City. Transport Policy 2018, 63, 209–220. [Google Scholar] [CrossRef]
- Ben Rayana, T.; Debatisse, A.; Jouannique, V.; Sakthithasan, K.; Besançon, S.; Molle, R.; Wild, P.; Guinhouya, B. C.; Guseva Canu, I. Sixteen-Year Monitoring of Particulate Matter Exposure in the Parisian Subway: Data Inventory and Compilation in a Database. Atmosphere 2022, 13(7), 1061. [Google Scholar] [CrossRef]
- Bhat, M. A.; Eraslan, F. N.; Awad, A.; Malkoç, S.; Üzmez, Ö. Ö.; Döğeroğlu, T.; Gaga, E. O. Investigation of indoor and outdoor air quality in a university campus during COVID-19 lock down period. Building and Environment 2022, 219, 109176. [Google Scholar] [CrossRef] [PubMed]
- Bhusal, P.; Shrestha, S. M.; Dhital, N. B.; Bhandari, G. S.; Das, B.; Pandit, R. Analysis of in-vehicle air quality and load factor as environmental and social dimensions of sustainable urban mobility: A case study from Kathmandu valley, Nepal. Journal of Air Pollution and Health 2024. [Google Scholar] [CrossRef]
- Bikis, A. Urban Air Pollution and Greenness in Relation to Public Health. Journal of Environmental and Public Health 2023, 2023, 1–18. [Google Scholar] [CrossRef]
- Bikis, A.; Pandey, D. Air Quality at Public Transportation Stations/Stops: Contribution of Light Rail Transit to Reduce Air Pollution. Aerosol Science and Engineering 2022, 6(1), 1–16. [Google Scholar] [CrossRef]
- Bizualem, B.; Tefera, N.; Angassa, K.; Feyisa, G. L. Spatial and Temporal Analysis of Particulate Matter and Gaseous Pollutants at Six Heavily Used Traffic Junctions in Megenagna, Addis Ababa, Ethiopia. Aerosol Science and Engineering 2023, 7(1), 118–130. [Google Scholar] [CrossRef]
- Bobbia, M.; Poggi, J.-M.; Portier, B.; Thulliez, E. A dataset of particulate matters measurements from a network of mobile and fixed sensors and monitoring stations in Rouen (Northwestern France). Data in Brief 2025, 59, 111439. [Google Scholar] [CrossRef]
- Botsou, F.; Moutafis, I.; Dalaina, S.; Kelepertzis, E. Settled bus dust as a proxy of traffic-related emissions and health implications of exposures to potentially harmful elements. Atmospheric Pollution Research 2020, 11(10), 1776–1784. [Google Scholar] [CrossRef]
- Brempong, F.; Mariam, Q.; Preko, K. The use of magnetic susceptibility measurements to determine pollution of agricultural soils in road proximity. African Journal of Environmental Science and Technology 2016, 10(9), 263–271. [Google Scholar] [CrossRef]
- Briant, S.; Cushing, D.; Washington, T.; Swart, M. Small but Significant: A Review of Research on the Potential of Bus Shelters as Resilient Infrastructure. Applied Sciences 2025, 15(12), 6724. [Google Scholar] [CrossRef]
- Castaneda-Miranda, A. G.; Böhnel, H. N.; Molina-Garza, R. S.; Chaparro, M. A. Magnetic evaluation of TSP-filters for air quality monitoring. Atmospheric environment 2014, 96, 163–174. [Google Scholar] [CrossRef]
- Miranda, A. G. C.; Chaparro, M. A.; Chaparro, M. A.; Böhnel, H. N. Magnetic properties of Tillandsia recurvata L. and its use for biomonitoring a Mexican metropolitan area. Ecological Indicators 2016, 60, 125–136. [Google Scholar] [CrossRef]
- Castañeda-Miranda, A. G.; Chaparro, M. A.; Pacheco-Castro, A.; Chaparro, M. A.; Böhnel, H. N. Magnetic biomonitoring of atmospheric dust using tree leaves of Ficus benjamina in Querétaro (México). Environmental Monitoring and Assessment 2020, 192(6), 382. [Google Scholar] [CrossRef]
- Castaneda-Miranda, A. G.; Chaparro, M. A.; Böhnel, H. N.; Chaparro, M. A.; Castaneda-Miranda, R.; Pacheco-Castro, A.; Ornelas-Vargas, G. Bursera fagaroides bark as a bioindicator for air particle pollution using magnetic properties. Journal of South American Earth Sciences 2021, 108, 103217. [Google Scholar] [CrossRef]
- Castañeda-Miranda, A. G.; Böhnel, H. N.; Chaparro, M. A.; Pinedo-Torres, L. A.; Rodríguez-Trejo, A.; Castañeda-Miranda, R.; Delgado, S. I. Magnetic Biomonitoring of PM in a Semi-Arid Urban Park of North-Central Mexico Using Tillandsia recurvata as a Particulate Matter Biocollector. Atmosphere 2025, 17(1), 55. [Google Scholar] [CrossRef]
- Chen, X.; Han, X.; Yu, L.; Wei, C. Does Operation Scheduling Make a Difference: Tapping the Potential of Optimized Design for Skipping-Stop Strategy in Reducing Bus Emissions. Sustainability 2017, 9(10), 1737. [Google Scholar] [CrossRef]
- Correia, C.; Martins, V.; Cunha-Lopes, I.; Faria, T.; Diapouli, E.; Eleftheriadis, K.; Almeida, S. M. Particle exposure and inhaled dose while commuting in Lisbon. Environmental Pollution 2020, 257, 113547. [Google Scholar] [CrossRef]
- Correia, C.; Martins, V.; Matroca, B.; Santana, P.; Mariano, P.; Almeida, A.; Almeida, S. M. A Low-Cost Sensor System Installed in Buses to Monitor Air Quality in Cities. International Journal of Environmental Research and Public Health 2023, 20(5), 4073. [Google Scholar] [CrossRef]
- De Souza, P. N.; Oriama, P. A.; Pedersen, P. P.; Horstmann, S.; Gordillo-Dagallier, L.; Christensen, C. N.; Franck, C. O.; Ayah, R.; Kahn, R. A.; Klopp, J. M.; Messier, K. P.; Kinney, P. L. Spatial variation of fine particulate matter levels in Nairobi before and during the COVID-19 curfew: Implications for environmental justice. Environmental Research Communications 2021, 3(7), 071003. [Google Scholar] [CrossRef]
- De Souza, P.; Nthusi, V.; Klopp, J.; Shaw, B.; Ho, W.; Saffell, J.; Jones, R.; Ratti, C. A Nairobi experiment in using low cost air quality monitors. Clean Air Journal 2017, 27(2). [Google Scholar] [CrossRef]
- Dingemanse, J. D.; Abiyu, Muse Abayneh; Tesfaye, Kirubel Getachew; Roro, & Feyera Fekadu. Using student science to identify research priority areas for air pollution in a university environment: An Ethiopian case study. Clean Air Journal 2022, 32(2). [Google Scholar] [CrossRef]
- Djossou, J.; Léon, J.-F.; Akpo, A. B.; Liousse, C.; Yoboué, V.; Bedou, M.; Bodjrenou, M.; Chiron, C.; Galy-Lacaux, C.; Gardrat, E.; Abbey, M.; Keita, S.; Bahino, J.; Touré N’Datchoh, E.; Ossohou, M.; Awanou, C. N. Mass concentration, optical depth and carbon composition of particulate matter in the major southern West African cities of Cotonou (Benin) and Abidjan (Côte d’Ivoire). Atmospheric Chemistry and Physics 2018, 18(9), 6275–6291. [Google Scholar] [CrossRef]
- Elmarakby, E.; Elkadi, H. Comprehending particulate matter dynamics in transit-oriented developments: Traffic as a generator and design as a captivator. Science of The Total Environment 2024, 931, 172528. [Google Scholar] [CrossRef]
- Ezz, W.; Mazaheri, M.; Robinson, P.; Johnson, G.; Clifford, S.; He, C.; Morawska, L.; Marks, G. Ultrafine Particles from Traffic Emissions and Children’s Health (UPTECH) in Brisbane, Queensland (Australia): Study Design and Implementation. International Journal of Environmental Research and Public Health 2015, 12(2), 1687–1702. [Google Scholar] [CrossRef]
- Fameli, K.-M.; Moustris, K.; Spyropoulos, G.; Rodanas, D.-M. Exposure to PM2.5 on Public Transport: Guidance for Field Measurements with Low-Cost Sensors. Atmosphere 2024, 15(3), 330. [Google Scholar] [CrossRef]
- Fosu-Amankwah, K.; Owusu, S.; Bayor, J. S.; Asamoah, E.; Damoah, R. Exposure Assessment of Particulate Matter Concentrations in Urban-Transit Buses in Ghana. 2025. [Google Scholar] [CrossRef]
- Galiwango, R.; Bainomugisha, E.; Kivunike, F.; Kateete, D. P.; Jjingo, D. Air pollution and mobility patterns in two Ugandan cities during COVID-19 mobility restrictions suggest the validity of air quality data as a measure for human mobility. Environmental Science and Pollution Research 2022, 30(12), 34856–34871. [Google Scholar] [CrossRef]
- Ghaffarpasand, O.; Okure, D.; Green, P.; Sayyahi, S.; Adong, P.; Sserunjogi, R.; Bainomugisha, E.; Pope, F. D. The impact of urban mobility on air pollution in Kampala, an exemplar sub-Saharan African city. Atmospheric Pollution Research 2024, 15(4), 102057. [Google Scholar] [CrossRef]
- Goel, R.; Gani, S.; Guttikunda, S. K.; Wilson, D.; Tiwari, G. On-road PM2.5 pollution exposure in multiple transport microenvironments in Delhi. Atmospheric Environment 2015, 123, 129–138. [Google Scholar] [CrossRef]
- Górka-Kostrubiec, B.; Magiera, T.; Dudzisz, K.; Dytłow, S.; Wawer, M.; Winkler, A. Integrated Magnetic Analyses for the Discrimination of Urban and Industrial Dusts. Minerals 2020, 10(12), 1056. [Google Scholar] [CrossRef]
- Gouveia, N.; Kephart, J. L.; Dronova, I.; McClure, L.; Granados, J. T.; Betancourt, R. M.; O’Ryan, A. C.; Texcalac-Sangrador, J. L.; Martinez-Folgar, K.; Rodriguez, D.; Diez-Roux, A. V. Ambient fine particulate matter in Latin American cities: Levels, population exposure, and associated urban factors. Science of The Total Environment 2021, 772, 145035. [Google Scholar] [CrossRef] [PubMed]
- Grana, M.; Toschi, N.; Vicentini, L.; Pietroiusti, A.; Magrini, A. Exposure to ultrafine particles in different transport modes in the city of Rome. Environmental Pollution 2017, 228, 201–210. [Google Scholar] [CrossRef] [PubMed]
- Guttikunda, S. K.; Dammalapati, S. K.; Tefera, W.; Xie, J. Modelling particulate matter (PM2.5) source contributions for air pollution management in Addis Ababa, Ethiopia. Heliyon 2025, 11(10), e43112. [Google Scholar] [CrossRef]
- Ham, W.; Vijayan, A.; Schulte, N.; Herner, J. D. Commuter exposure to PM2.5, BC, and UFP in six common transport microenvironments in Sacramento, California. Atmospheric Environment 2017, 167, 335–345. [Google Scholar] [CrossRef]
- Hernández-Paniagua, I.; Andraca-Ayala, G.; Diego-Ayala, U.; Ruiz-Suarez, L.; Zavala-Reyes, J.; Cid-Juárez, S.; Torre-Bouscoulet, L.; Gochicoa-Rangel, L.; Rosas-Pérez, I.; Jazcilevich, A. Personal Exposure to PM2.5 in the Megacity of Mexico: A Multi-Mode Transport Study. Atmosphere 2018, 9(2), 57. [Google Scholar] [CrossRef]
- Ibarra-Espinosa, S.; Mendes Da Silva, G. A.; Rehbein, A.; Vara-Vela, A.; Dias De Freitas, E. Atmospheric effects of air pollution during dry and wet periods in São Paulo. Environmental Science: Atmospheres 2022, 2(2), 215–229. [Google Scholar] [CrossRef]
- Jin, Y.; Sharifi, A.; Li, Z.; Chen, S.; Chen, S.; Zhao, S. Analyzing particulate matter characteristics of the subway system: Case study of Guangzhou. Case Studies in Chemical and Environmental Engineering 2024, 10, 100953. [Google Scholar] [CrossRef]
- Kim, D.; Yum, Y.; George, K.; Kwon, J.-W.; Kim, W. K.; Baek, H.-S.; Suh, D. I.; Yang, H.-J.; Yoo, Y.; Yu, J.; Lim, D. H.; Seo, S.-C.; Song, D. J. Real-Time Low-Cost Personal Monitoring for Exposure to PM2.5 among Asthmatic Children: Opportunities and Challenges. Atmosphere 2021, 12(9), 1192. [Google Scholar] [CrossRef]
- Lakra, A. R.; Gautam, S.; Samuel, C.; Blaga, R. College bus commuter exposures to air pollutants in Indian city: The urban-rural transportation exposure study. Geosystems and Geoenvironment 2025, 4(1), 100346. [Google Scholar] [CrossRef]
- Lan, X.; Jin, Y.; Zhu, L. High exposure of ultrafine particles at Guangzhou bus stops and the impact of urban layout. Urban Climate 2024, 53, 101777. [Google Scholar] [CrossRef]
- Leavey, A.; Reed, N.; Patel, S.; Bradley, K.; Kulkarni, P.; Biswas, P. Comparing on-road real-time simultaneous in-cabin and outdoor particulate and gaseous concentrations for a range of ventilation scenarios. Atmospheric Environment 2017, 166, 130–141. [Google Scholar] [CrossRef]
- Lee, E. S.; Fung, C.-C. D.; Zhu, Y. Evaluation of a High Efficiency Cabin Air (HECA) Filtration System for Reducing Particulate Pollutants Inside School Buses. Environmental Science & Technology 2015, 49(6), 3358–3365. [Google Scholar] [CrossRef]
- Lee, J. J.; Hwang, H.; Hong, S. C.; Lee, J. Y. Effect of Air Purification Systems on Particulate Matter and Airborne Bacteria in Public Buses. Atmosphere 2021, 13(1), 55. [Google Scholar] [CrossRef]
- Leoni, C.; Pokorná, P.; Hovorka, J.; Masiol, M.; Topinka, J.; Zhao, Y.; Křůmal, K.; Cliff, S.; Mikuška, P.; Hopke, P. K. Source apportionment of aerosol particles at a European air pollution hot spot using particle number size distributions and chemical composition. Environmental Pollution 2018, 234, 145–154. [Google Scholar] [CrossRef] [PubMed]
- Letaïef, S.; Carvallo, C.; Franke, C.; Isambert, A.; Camps, P. Contributions and limitations of environmental magnetism to characterize traffic-related particulate matter sources. Geophysical Journal International 2024, 237(3), 1505–1525. [Google Scholar] [CrossRef]
- Letaïef, S.; Scotto-d’Apollonia, L.; Dosias-Perla, D.; Pinero, C.; Perier, R.; Nicol, P.; Camps, P. Benefits and Limitations of Environmental Magnetism for Completing Citizen Science on Air Quality: A Case Study in a Street Canyon. Community Science 2023, 2(2), e2022CSJ000010. [Google Scholar] [CrossRef]
- Lewchalermvongs, C.; Lewchalermvongs, P.; Chuesuphan, C.; Weeranukunjit, C.; Boonkangwan, C.; Chaikittiporn, M.; Srikirinth, P.; Glinpatgij, T. A game-theoretic approach for route planning on traveling by public transportation in the PM2.5 pollution: A case study in Bangkok. Transportation Research Interdisciplinary Perspectives 2024, 27, 101185. [Google Scholar] [CrossRef]
- Li, Z.; Zeng, J.; Wu, M.; Jin, Y.; Wang, X.; Zhai, S. Fine Particulate Matter Exposure and Inhalation Dose during Traffic Commuting-A Case Study in Guangzhou. Review 2022. [Google Scholar] [CrossRef]
- Lim, S.; Dirks, K. N.; Salmond, J. A.; Xie, S. Determinants of spikes in ultrafine particle concentration whilst commuting by bus. Atmospheric Environment 2015, 112, 1–8. [Google Scholar] [CrossRef]
- Lund, A. M.; Gouripeddi, R.; Facelli, J. C. STHAM: An agent based model for simulating human exposure across high resolution spatiotemporal domains. Journal of Exposure Science & Environmental Epidemiology 2020, 30(3), 459–468. [Google Scholar] [CrossRef] [PubMed]
- Mahesh, S. Exposure to fine particulate matter (PM2.5) and noise at bus stops in Chennai, India. Journal of Transport & Health 2021, 22, 101105. [Google Scholar] [CrossRef]
- Mainka, A.; Nocoń, W.; Malinowska, A.; Pfajfer, J.; Komisarczyk, E.; Góra, D.; Wargocki, P. Exposure to NO2 and PM2.5 While Commuting: Utility of Low-Cost Sensor. Applied Sciences 2025, 15(11), 5965. [Google Scholar] [CrossRef]
- Malagon-Rojas, J. N.; Pinzón-Silva, D. C.; Parra, E. L.; Lagos M, L. F.; Toloza-Perez, Y. G.; Hernández Florez, L. J.; Morales Betancourt, R.; Romero, S. A.; Ríos Cabra, A. P.; Sarmiento, O. L. Assessment of Personal Exposure to Particulate Air Pollution in Different Microenvironments and Traveling by Several Modes of Transportation in Bogotá, Colombia: Protocol for a Mixed Methods Study (ITHACA). JMIR Research Protocols 2022, 11(1), e25690. [Google Scholar] [CrossRef]
- Marinello, S.; Lolli, F.; Coruzzolo, A. M.; Gamberini, R. Exposure to Air Pollution in Transport Microenvironments. Sustainability 2023, 15(15), 11958. [Google Scholar] [CrossRef]
- Matthaios, V. N.; Holland, I.; Kang, C. M.; Hart, J. E.; Hauptman, M.; Wolfson, J. M.; Gaffin, J. M.; Phipatanakul, W.; Gold, D. R.; Koutrakis, P. The effects of urban green space and road proximity to indoor traffic-related PM2.5, NO2, and BC exposure in inner-city schools. Journal of Exposure Science & Environmental Epidemiology 2024, 34(5), 745–752. [Google Scholar] [CrossRef]
- Matthews, J. C.; Chompoobut, C.; Navasumrit, P.; Khan, M. A. H.; Wright, M. D.; Ruchirawat, M.; Shallcross, D. E. Particle Number Concentration Measurements on Public Transport in Bangkok, Thailand. International Journal of Environmental Research and Public Health 2023, 20(7), 5316. [Google Scholar] [CrossRef] [PubMed]
- Mendoza, D. L.; Gonzalez, A.; Jacques, A. A.; Johnson, C. M.; Whelan, P. T.; Horel, J. D. Electric buses as an air pollution and meteorological observation network: Methodology and preliminary results. Science of The Total Environment 2024, 951, 175327. [Google Scholar] [CrossRef]
- Mitsakou, C.; Adamson, J. P.; Doutsi, A.; Brunt, H.; Jones, S. J.; Gowers, A. M.; Exley, K. S. Assessing the exposure to air pollution during transport in urban areas – Evidence review. Journal of Transport & Health 2021, 21, 101064. [Google Scholar] [CrossRef]
- Moges, G. T.; Alemu, G. T. Contribution of congested traffic flow condition to air pollution at intersections in Addis Ababa, Ethiopia. Heliyon 2024, 10(17), e36477. [Google Scholar] [CrossRef]
- Morales Betancourt, R.; Galvis, B.; Mendez-Molano, D.; Rincón-Riveros, J. M.; Contreras, Y.; Montejo, T. A.; Rojas-Neisa, D. R.; Casas, O. Toward Cleaner Transport Alternatives: Reduction in Exposure to Air Pollutants in a Mass Public Transport. Environmental Science & Technology 2022, 56(11), 7096–7106. [Google Scholar] [CrossRef]
- Morales Betancourt, R.; Galvis, B.; Rincón-Riveros, J. M.; Rincón-Caro, M. A.; Rodriguez-Valencia, A.; Sarmiento, O. L. Personal exposure to air pollutants in a Bus Rapid Transit System: Impact of fleet age and emission standard. Atmospheric Environment 2019, 202, 117–127. [Google Scholar] [CrossRef]
- Morales Betancourt, R.; Wilches-Mogollon, M. A.; Sarmiento, O. L.; Mendez Molano, D.; Angulo, D.; Filigrana, P.; Arellana, J.; Guzman, L. A.; Garzon, G.; Gouveia, N.; Levy, P.; Diez-Roux, A. V. Commuter’s personal exposure to air pollutants after the implementation of a cable car for public transport: Results of the natural experiment TrUST. Science of The Total Environment 2023, 865, 160880. [Google Scholar] [CrossRef] [PubMed]
- Moreno, T.; Reche, C.; Rivas, I.; Cruz Minguillón, M.; Martins, V.; Vargas, C.; Buonanno, G.; Parga, J.; Pandolfi, M.; Brines, M.; Ealo, M.; Sofia Fonseca, A.; Amato, F.; Sosa, G.; Capdevila, M.; De Miguel, E.; Querol, X.; Gibbons, W. Urban air quality comparison for bus, tram, subway and pedestrian commutes in Barcelona. Environmental Research 2015, 142, 495–510. [Google Scholar] [CrossRef] [PubMed]
- Mraihi, R.; Harizi, R.; Mraihi, T.; Bouzidi, M. T. Urban air pollution and urban daily mobility in large Tunisia׳s cities. Renewable and Sustainable Energy Reviews 2015, 43, 315–320. [Google Scholar] [CrossRef]
- Mukherjee, S.; Sahu, S.; Pradhan, C. K. Assessment of the respiratory predicament of bus drivers in different environmental conditions. BLDE University Journal of Health Sciences 2024, 9(1), 68–74. [Google Scholar] [CrossRef]
- Muresan, B.; François, D. Air quality in tramway and high-level service buses: A mixed experimental/modeling approach to estimating users’ exposure. Transportation Research Part D: Transport and Environment 2018, 65, 244–263. [Google Scholar] [CrossRef]
- Ngo, N. S.; Gatari, M.; Yan, B.; Chillrud, S. N.; Bouhamam, K.; Kinney, P. L. Occupational exposure to roadway emissions and inside informal settlements in sub-Saharan Africa: A pilot study in Nairobi, Kenya. Atmospheric Environment 2015, 111, 179–184. [Google Scholar] [CrossRef]
- Ngoc, L. T. N.; Kim, M.; Bui, V. K. H.; Park, D.; Lee, Y.-C. Particulate Matter Exposure of Passengers at Bus Stations: A Review. International Journal of Environmental Research and Public Health 2018, 15(12), 2886. [Google Scholar] [CrossRef] [PubMed]
- Njeru, M. N.; Mwangi, E.; Gatari, M. J.; Kaniu, M. I.; Kanyeria, J.; Raheja, G.; Westervelt, D. M. First Results From a Calibrated Network of Low-Cost PM2.5 Monitors in Mombasa, Kenya Show Exceedance of Healthy Guidelines. GeoHealth 2024, 8(9), e2024GH001049. [Google Scholar] [CrossRef]
- Nkansah, F. K.; Durosimi Belford, E. J.; Hogarh, J. N.; Anim, A. K. Assessment of ambient air quality and health risks from vehicular emissions in urban Ghana: A case study of Winneba. Journal of Air Pollution and Health 2025. [Google Scholar] [CrossRef]
- Nogueira, T.; Kumar, P.; Nardocci, A.; Andrade, M. D. F. Public health implications of particulate matter inside bus terminals in Sao Paulo, Brazil. Science of The Total Environment 2020, 711, 135064. [Google Scholar] [CrossRef] [PubMed]
- Noh, S.-Y.; Park, D.; Yook, S.-J. Numerical investigation of bus stop structures in Seoul for the reduction of fine dust entry. Journal of Mechanical Science and Technology 2021, 35(1), 371–379. [Google Scholar] [CrossRef]
- Ogundiran, J. O.; Nyembwe, J.-P. K. B.; Ogundiran, J.; Ribeiro, A. S. N.; Gameiro Da Silva, M. A Systematic Review of Indoor Environmental Quality in Passenger Transport Vehicles of Tropical and Subtropical Regions. Atmosphere 2025, 16(2), 140. [Google Scholar] [CrossRef]
- Okokon, E. O.; Taimisto, P.; Turunen, A. W.; Amoda, O. A.; Fasasi, A. E.; Adeyemi, L. G.; Juutilainen, J.; Lanki, T. Particulate air pollution and noise: Assessing commuter exposure in Africa’s most populous city. Journal of Transport & Health 2018, 9, 150–160. [Google Scholar] [CrossRef]
- Okure, D.; Guttikunda, S. K.; Sserunjogi, R.; Adong, P.; Dammalapati, S. K.; Lsoto, D.; Green, P.; Bainomugisha, E.; Xie, J. Integrated air quality information for Kampala: Analysis of PM2.5, emission sources, modelled contributions, and institutional framework. Environmental Science: Atmospheres 2025, 5(4), 471–484. [Google Scholar] [CrossRef]
- Okure, D.; Ssematimba, J.; Sserunjogi, R.; Gracia, N. L.; Soppelsa, M. E.; Bainomugisha, E. Characterization of Ambient Air Quality in Selected Urban Areas in Uganda Using Low-Cost Sensing and Measurement Technologies. Environmental Science & Technology 2022, 56(6), 3324–3339. [Google Scholar] [CrossRef]
- Olufemi, A. P.; Babatunde, O. A.; Adebayo, A. S.; Ovie, O.; Toyeje, A. B.; Omokungbe, O. R.; Abiodun, Pelumi. O. Receptor modelling of airborne pollutants along major highways in lagos, southwest, Nigeria. Discover Applied Sciences 2025, 7(8), 898. [Google Scholar] [CrossRef]
- Owusu Yankyera, B.; Twumasi, J. In-Vehicle Air Quality Assessment in the ‘Trotro’ Transport System: Implications for Respiratory Health in Madina, Ghana. SSRN Electronic Journal 2024. [Google Scholar] [CrossRef]
- Ozgen, S.; Ripamonti, G.; Malandrini, A.; S. Ragettli, M.; Lonati, G. Particle number and mass exposure concentrations by commuter transport modes in Milan, Italy. AIMS Environmental Science 2016, 3(2), 168–184. [Google Scholar] [CrossRef]
- Peel, M. C.; Finlayson, B. L.; McMahon, T. A. Updated world map of the Köppen-Geiger climate classification. Hydrology and Earth System Sciences 2007, 11(5), 1633–1644. [Google Scholar] [CrossRef]
- Pereira, G. M.; Yoshiaki Kamigauti, L.; Pereira, R. F.; Monteiro Dos Santos, D.; Da Silva Santos, T.; Martins, J. V.; Alves, C.; Gonçalves, C.; Casotti Rienda, I.; Kováts, N.; Nogueira, T.; Rizzo, L.; Artaxo, P.; Maura De Miranda, R.; Yamasoe, M. A.; Dias De Freitas, E.; De Castro Vasconcellos, P.; De Fatima Andrade, M. Source apportionment and ecotoxicity of PM2.5 pollution events in a major Southern Hemisphere megacity: Influence of a biofuel-impacted fleet and biomass burning. Atmospheric Chemistry and Physics 2025, 25(8), 4587–4616. [Google Scholar] [CrossRef]
- Qiu, Z.; Cao, H. Commuter exposure to particulate matter in urban public transportation of Xi’an, China. Journal of Environmental Health Science and Engineering 2020, 18(2), 451–462. [Google Scholar] [CrossRef]
- Subramanian, R. Air pollution in Kigali, Rwanda: Spatial and temporal variability, source contributions, and the impact of car-free Sundays. Clean Air Journal 2020, 30(2). [Google Scholar] [CrossRef]
- Ramel-Delobel, M.; Peruzzi, C.; Coudon, T.; De Vito, S.; Fattoruso, G.; Praud, D.; Fervers, B.; Salizzoni, P. Exposure to airborne particulate matter during commuting using portable sensors: Effects of transport modes in a French metropolis study case. Journal of Environmental Management 2024, 365, 121400. [Google Scholar] [CrossRef]
- Ranjan, S.; Sm, S. N. Driving Dynamics and Air Quality: Clustering Analysis of Particulate Matter Exposure in Urban Transit Buses. Transportation Research Procedia 2025, 86, 387–396. [Google Scholar] [CrossRef]
- Rawat, N.; Kumar, P. Interventions for improving indoor and outdoor air quality in and around schools. Science of The Total Environment 2023, 858, 159813. [Google Scholar] [CrossRef]
- Remy, V. F. M.; Innocent, G.; Vernez, D.; Guseva Canu, I. Bus-exposure matrix, a tool to assess bus drivers’ exposure to physicochemical hazards. Annals of Work Exposures and Health 2025, 69(7), 736–751. [Google Scholar] [CrossRef]
- Renard, J.-B.; Becker, G.; Nodorft, M.; Tavakoli, E.; Thiele, L.; Poincelet, E.; Scholz, M.; Surcin, J. High-Spatial Resolution Maps of PM2.5 Using Mobile Sensors on Buses: A Case Study of Teltow City, Germany, in the Suburb of Berlin, 2023. Atmosphere 2024, 15(12), 1494. [Google Scholar] [CrossRef]
- Renard, J.-B.; Poincelet, E.; Annesi-Maesano, I.; Surcin, J. Spatial Distribution of PM2.5 Mass and Number Concentrations in Paris (France) from the Pollutrack Network of Mobile Sensors during 2018–2022. Sensors 2023, 23(20), 8560. [Google Scholar] [CrossRef] [PubMed]
- Renard, J.-B.; Surcin, J.; Annesi-Maesano, I.; Delaunay, G.; Poincelet, E.; Dixsaut, G. Relation between PM2.5 pollution and Covid-19 mortality in Western Europe for the 2020–2022 period. Science of The Total Environment 2022, 848, 157579. [Google Scholar] [CrossRef]
- Rivas, I.; Kumar, P.; Hagen-Zanker, A. Exposure to air pollutants during commuting in London: Are there inequalities among different socio-economic groups? Environment International 2017, 101, 143–157. [Google Scholar] [CrossRef] [PubMed]
- Sá, J. P.; Alvim-Ferraz, M. C. M.; Martins, F. G.; Sousa, S. I. V. Application of the low-cost sensing technology for indoor air quality monitoring: A review. Environmental Technology & Innovation 2022, 28, 102551. [Google Scholar] [CrossRef]
- Salthammer, T.; Fauck, C.; Omelan, A.; Wientzek, S.; Uhde, E. Time and spatially resolved tracking of the air quality in local public transport. Scientific Reports 2022, 12(1), 3262. [Google Scholar] [CrossRef]
- Sanz, À.; Perdiguero, J. Does urban bus route assignment improve air quality? Transportation Research Part D: Transport and Environment 2024, 129, 104146. [Google Scholar] [CrossRef]
- Saucy, A.; Röösli, M.; Künzli, N.; Tsai, M.-Y.; Sieber, C.; Olaniyan, T.; Baatjies, R.; Jeebhay, M.; Davey, M.; Flückiger, B.; Naidoo, R. N.; Dalvie, M. A.; Badpa, M.; De Hoogh, K. Land Use Regression Modelling of Outdoor NO2 and PM2.5 Concentrations in Three Low Income Areas in the Western Cape Province, South Africa. International Journal of Environmental Research and Public Health 2018, 15(7), 1452. [Google Scholar] [CrossRef]
- Shen, J.; Gao, Z. Commuter exposure to particulate matters in four common transportation modes in Nanjing. Building and Environment 2019, 156, 156–170. [Google Scholar] [CrossRef]
- Shinohara, N.; Tatsu, K.; Naito, W.; Murashima, Y.; Sakurai, H.; Kizu, T.; Kan, K. Reducing the airborne infection risk in tourist buses using medium-efficiency filters in air-conditioning systems. Building and Environment 2025, 281, 113186. [Google Scholar] [CrossRef]
- Shrestha, A.; Dhital, N. B. In-vehicle air quality in public buses during real-world trips in Kathmandu Valley, Nepal. Environmental Challenges 2024, 17, 101054. [Google Scholar] [CrossRef]
- Singh, A.; Ng’ang’a, D.; Gatari, M. J.; Kidane, A. W.; Alemu, Z. A.; Derrick, N.; Webster, M. J.; Bartington, S. E.; Thomas, G. N.; Avis, W.; Pope, F. D. Air quality assessment in three East African cities using calibrated low-cost sensors with a focus on road-based hotspots. Environmental Research Communications 2021, 3(7), 075007. [Google Scholar] [CrossRef]
- Song, J.; Ren, G.; Zhang, J.; Qiu, Z. Evaluating zone of influence for traffic-related emissions generated near bus stops: A case study in Nanjing, China. International Journal of Urban Sciences 2023, 27(2), 280–300. [Google Scholar] [CrossRef]
- Soruma, M.; Woldeamanuel, M. The level of air quality at public transport stations: The Case of Torhailoch-Ayat main road in Addis Ababa. Journal of Transport & Health 2022, 24, 101328. [Google Scholar] [CrossRef]
- Sserunjogi, R.; Ssematimba, J.; Okure, D.; Ogenrwot, D.; Adong, P.; Muyama, L.; Nsimbe, N.; Bbaale, M.; Bainomugisha, E. Seeing the air in detail: Hyperlocal air quality dataset collected from spatially distributed AirQo network. Data in Brief 2022, 44, 108512. [Google Scholar] [CrossRef]
- Strasser, G.; Hiebaum, S.; Neuberger, M. Commuter exposure to fine and ultrafine particulate matter in Vienna. Wiener Klinische Wochenschrift 2018, 130(1-2), 62–69. [Google Scholar] [CrossRef] [PubMed]
- Sui, C.; Fatichi, S.; Burlando, P.; Weber, E.; Battista, G. Modeling distributed metal pollution transport in a mine impacted catchment: Short and long-term effects. Science of The Total Environment 2022, 812, 151473. [Google Scholar] [CrossRef]
- Szczepaniak-Wnuk, I.; Górka-Kostrubiec, B. Magnetic particles in indoor dust as marker of pollution emitted by different outside sources. Studia Geophysica et Geodaetica 2016, 60(2), 297–315. [Google Scholar] [CrossRef]
- Szyszkowicz, M. Diesel Engine Age and Fine Particulate Matter Concentrations in School Buses. Air 2024, 2(3), 220–228. [Google Scholar] [CrossRef]
- Targino, A. C.; Da Costa, C. C.; Krecl, P. A first screening of black carbon concentrations whilst commuting by diesel-fuelled buses in Montevideo, Uruguay. Heliyon 2025, 11(2), e41697. [Google Scholar] [CrossRef]
- Targino, A. C.; Krecl, P.; Cipoli, Y. A.; Oukawa, G. Y.; Monroy, D. A. Bus commuter exposure and the impact of switching from diesel to biodiesel for routes of complex urban geometry. Environmental Pollution 2020, 263, 114601. [Google Scholar] [CrossRef]
- Todorov, A.; Gicheva, P.; Stoykova, V.; Karapetkov, S.; Uzunov, H.; Dechkova, S.; Zlatev, Z. Environmental Monitoring in Bus Transportation Using a Developed Measurement System. Urban Science 2023, 7(3), 90. [Google Scholar] [CrossRef]
- Valotto, G.; Rampazzo, G.; Visin, F.; Gonella, F.; Cattaruzza, E.; Glisenti, A.; Formenton, G.; Tieppo, P. Environmental and traffic-related parameters affecting road dust composition: A multi-technique approach applied to Venice area (Italy). Atmospheric Environment 2015, 122, 596–608. [Google Scholar] [CrossRef]
- Van Den Bossche, J.; Peters, J.; Verwaeren, J.; Botteldooren, D.; Theunis, J.; De Baets, B. Mobile monitoring for mapping spatial variation in urban air quality: Development and validation of a methodology based on an extensive dataset. Atmospheric Environment 2015, 105, 148–161. [Google Scholar] [CrossRef]
- Van Ryswyk, K.; Evans, G. J.; Kulka, R.; Sun, L.; Sabaliauskas, K.; Rouleau, M.; Anastasopolos, A. T.; Wallace, L.; Weichenthal, S. Personal exposures to traffic-related air pollution in three Canadian bus transit systems: The Urban Transportation Exposure Study. Journal of Exposure Science & Environmental Epidemiology 2021, 31(4), 628–640. [Google Scholar] [CrossRef]
- Velasco, E.; Retama, A.; Segovia, E.; Ramos, R. Particle exposure and inhaled dose while commuting by public transport in Mexico City. Atmospheric Environment 2019, 219, 117044. [Google Scholar] [CrossRef]
- Velasco, E.; Segovia, E. Determining a Commuters’ Exposure to Particle and Noise Pollution on Double-decker Buses. Aerosol and Air Quality Research 2021, 21(12), 210165. [Google Scholar] [CrossRef]
- Velasco, E.; Tan, S. H. Particles exposure while sitting at bus stops of hot and humid Singapore. Atmospheric Environment 2016, 142, 251–263. [Google Scholar] [CrossRef]
- Vera Valdés, J. E.; Rodríguez Caballero, C. V. Air Pollution and Mobility in the Mexico City Metropolitan Area in Times of COVID-19; Atmósfera, 2021. [Google Scholar] [CrossRef]
- Wadlow, I.; Paton-Walsh, C.; Forehead, H.; Perez, P.; Amirghasemi, M.; Guérette, É.-A.; Gendek, O.; Kumar, P. Understanding Spatial Variability of Air Quality in Sydney: Part 2—A Roadside Case Study. Atmosphere 2019, 10(4), 217. [Google Scholar] [CrossRef]
- Wang, C.; Ye, Z.; Yu, Y.; Gong, W. Estimation of bus emission models for different fuel types of buses under real conditions. Science of The Total Environment 2018, 640-641, 965–972. [Google Scholar] [CrossRef]
- World Health Organization. WHO Global Air Quality Guidelines: Particulate Matter (PM2. 5 and PM10), Ozone, Nitrogen Dioxide, Sulfur Dioxide and Carbon Monoxide, 1st ed; World Health Organization, 2021; Available online: https://www.who.int/publications/i/item/9789240034228.
- Wu, Y.; Lee, H. F.; Deng, R. R.; Yim, S. H. L. An analysis of roadside particulate matter pollution and population exposure over the Pearl River Delta region of China under clear-sky condition using new ultra-high-resolution PM2.5 satellite-retrieval algorithms. Environmental Research Letters 2024, 19(3), 034042. [Google Scholar] [CrossRef]
- Xu, W.; Mai, G.; Zhu, Q.; Yu, Z.; Liu, Y. Pollution exposure at bus commuter stations in Guangzhou, China. International Journal of Environmental Technology and Management 2016, 19(2), 103. [Google Scholar] [CrossRef]
- Yan, C.; Zheng, M.; Yang, Q.; Zhang, Q.; Qiu, X.; Zhang, Y.; Fu, H.; Li, X.; Zhu, T.; Zhu, Y. Commuter exposure to particulate matter and particle-bound PAHs in three transportation modes in Beijing, China. Environmental Pollution 2015, 204, 199–206. [Google Scholar] [CrossRef] [PubMed]
- Yasin, K. H.; Yasin, M. I.; Iguala, A. D.; Gelete, T. B.; Tulu, D.; Kebede, E. Predictive machine learning and geospatial modeling reveal PM10 hotspots and guide targeted air pollution interventions in Addis Ababa, Ethiopia. Discover Applied Sciences 2025, 7(4), 263. [Google Scholar] [CrossRef]
- Yu, Q.; Lu, L.; Li, T.; Tu, R. Quantifying the Impact of Alternative Bus Stop Platforms on Vehicle Emissions and Individual Pollution Exposure at Bus Stops. International Journal of Environmental Research and Public Health 2022, 19(11), 6552. [Google Scholar] [CrossRef] [PubMed]
- Zannoni, D.; Valotto, G.; Visin, F.; Rampazzo, G. Sources and distribution of tracer elements in road dust: The Venice mainland case of study. Journal of Geochemical Exploration 2016, 166, 64–72. [Google Scholar] [CrossRef]
- Zhan, D.; Wang, Z.; Xiang, H.; Xu, Y.; Zhou, K. Identifying the spatiotemporal patterns and natural and socioeconomic influencing factors of PM2.5 and O3 pollution in China. PLOS ONE 2025, 20(2), e0317691. [Google Scholar] [CrossRef]
- Zhang, L.; Tan, J.; Wang, Z.; Wang, W. Spatiotemporal distribution and diffusion patterns of particulate matter in PSD-equipped subway stations using integrated monitoring and machine learning models. Building and Environment 2025, 284, 113447. [Google Scholar] [CrossRef]
- Zhang, Y.; Huang, Z.; Huang, J. A Comparison of Particulate Exposure Levels during Taxi, Bus, and Metro Commuting among Four Chinese Megacities. International Journal of Environmental Research and Public Health 2022, 19(10), 5830. [Google Scholar] [CrossRef]
- Zhang, Y.; Liu, Y.; Li, S.; Xu, R.; Yu, P.; Ramos, C.; Ebrahimifakhar, A.; Guo, Y. Efficiency of portable air purification on public buses: A pilot study. Environmental Pollution 2023, 329, 121696. [Google Scholar] [CrossRef]
- Zhang, Y.; Lou, D.; Tan, P.; Hu, Z. Particulate emissions from urban bus fueled with biodiesel blend and their reducing characteristics using particulate after-treatment system. Energy 2018, 155, 77–86. [Google Scholar] [CrossRef]
- Zhao, R.; Zhou, L.; Ma, J. CFD design of ventilation system for large underground bus terminal in Macau Barrier Gate. Journal of Wind Engineering and Industrial Aerodynamics 2018, 179, 1–13. [Google Scholar] [CrossRef]
- Zhao, Y.; Gu, C.; Song, X. Evaluation of indoor environmental quality, personal cumulative exposure dose, and aerosol transmission risk levels inside urban buses in Dalian, China. Environmental Science and Pollution Research International 2023, 30(19), 55278–55297. [Google Scholar] [CrossRef]
- Zheng, J.; Qiu, Z.; Gao, H. O.; Li, B. Commuter PM exposure and estimated life-expectancy loss across multiple transportation modes in Xi’an, China. Ecotoxicology and Environmental Safety 2021, 214, 112117. [Google Scholar] [CrossRef] [PubMed]

Table 1.
Distribution of studies on air quality associated with public transport by continent (2015-2025).
Table 1.
Distribution of studies on air quality associated with public transport by continent (2015-2025).
| CONTINENT | STUDIES | MICROENVIRONMENTS | METHODOLOGY | GAPS |
| Europe | 45 | Metro, stations, stops | Benchmark instrumentation; stationary sampling; modeling (CFD, PMF) | Shortage of extended surveys at stops and buses; |
| Asia | 44 | Metro, stations, buses | Prolonged campaigns in metro; active and mobile sampling; | Low coverage of stops and buses in long series. |
| Africa | 44 | Buses, stops | Low-cost sensors; passive and mobile sampling | Lack of long series; poor chemical and magnetic characterization; underrepresentation of terminals |
| Americas | 29 | Buses, BRT, stops | Active and mobile sampling; portable sensors; statistical analysis | Limited standardization of peak metrics; few annual series at bus stops and buses |
| Oceania | 5 | Buses, urban stations | Active sampling and reference stations | Very limited evidence; lack of studies in terminals and subway systems |
| Polar regions | 0 | Not reported | Not reported | No studies at all |
Table 2.
Characteristics of public transport air quality studies according to the Köppen-Geiger climate classification (2015-2025).
Table 2.
Characteristics of public transport air quality studies according to the Köppen-Geiger climate classification (2015-2025).
| CLIMATE (KÖPPEN-GEIGER) | MICROENVIRONMENTS STUDIED | METEOROLOGICAL VARIABLES | POLLUTION PATTERNS |
| A (Tropical) | Buses, open stops, surface stations | Temperature and relative humidity; precipitation in monsoon regions | High intraday variability of PM; reduced concentrations after rainfall events; strong influence of traffic |
| B (Arid / Semi-arid) | Buses and open stops | Temperature; wind in resuspension contexts | Elevated concentrations of coarse and fine PM; peaks associated with dust resuspension and traffic |
| C (Temperate) | Subway, closed and semi-open stations, stops | Temperature, wind and seasonality | PM accumulation in winter; sharp contrasts between indoor and outdoor environments |
| D (Continental) | Metro and closed stations | Winter temperature; atmospheric stability | High PM concentrations in winter; limited ventilation in subway systems |
| E (Polar) | Not reported | Not reported | Not reported |
Table 3.
Methodological capacity of public transport air quality studies by Human Development Index (HDI) level (2015-2025).
Table 3.
Methodological capacity of public transport air quality studies by Human Development Index (HDI) level (2015-2025).
| HDI | INSTRUMENTATION | TEMPORAL CONTINUITY | (QA/QC) REPORTED | MODELED | OBSERVATIONS |
| Very high | Reference instrumentation and mixed approaches (reference + sensors) | Seasonal campaigns and extended series (months to ≥1 year). | Yes | CFD, PMF, inhaled dose models (present in part of the literature) | Greater methodological depth, temporal continuity and recurrent use of advanced analytical tools. |
| High | Portable and low-cost sensors; reference instrumentation in specific cases. | Campaigns of intermediate duration (weeks) and, to a lesser extent, seasonal. | Partial | Limited application of PMFs and simplified exposure estimates | Wide spatial coverage and increasing adoption of sensors, with less temporal continuity and limited use of modeling. |
| Medium | Low-cost sensors and passive or mobile sampling | Short (hours to days), occasionally repeated campaigns | Rarely | Not reported or absent | Focused on exploratory exposure characterization, with limitations in quality control and analytical depth. |
| Under | Not reported | Not reported | Not reported | Not reported | Research gap |
Table 4.
Integration of meteorological factors in public transport air quality studies (2015-2025).
| VARIABLE | INCLUSION | INTEGRATION | MAIN USE | REMARKS |
| Temperature | High | Data from off-site weather stations; on-site measurement to a lesser extent | Statistical control and correlation analysis with pollutant concentrations. | Generally used descriptively; its influence is more often discussed than explicitly modeled |
| Relative humidity | High | External stations and sensors are integrated into monitoring equipment | Correlation analysis and support for interpretation of temporal variability | Often considered in conjunction with temperature; rarely analyzed independently |
| Wind speed/direction | Average | Mainly off-site weather stations; little in situ measurement | Particle scattering and resuspension interpretation | Integration limited by spatial resolution; often decoupled from transport microenvironment |
| Precipitation | Low | External meteorological records | Seasonal interpretation and discussion of atmospheric outwash processes | Considered qualitatively; effect rarely quantified in analysis |
| Pressure | Rare | External weather stations | Descriptive or contextual use | Generally reported without explicit analysis of its influence on air quality. |
Table 5.
Methods for data collection used in public transport air quality studies (2015-2025).
| Strategy | Description | Microenvironments | Advantages | Limitations |
| Fixed (stationary) sampling | Monitoring at a specific point during defined periods of time | Stations, terminals, stops | High temporal comparability; suitable for trends and seasonality | Limited spatial representativeness |
| Mobile sampling | Instrumentation transported along routes or paths | Buses, trains, BRT routes | Captures real spatial variability of the path | Difficulty with time control and QA/QC |
| Personal sampling | Devices carried by users or operators | Vehicle interiors and waiting areas | Approximates individual exposure | High variability; behavioral dependence |
| Short duration campaigns | Intensive measurements from hours to days | Stops and vehicles | Low cost; rapid implementation | Does not capture seasonal variability |
| Prolonged campaigns | Monitoring from weeks to ≥1 year | Major stations and nodes | Trend and seasonality analysis | Requires more infrastructure and maintenance |
Table 6.
Sensor methodologies and techniques used in air quality studies associated with public transport (2015-2025; criterion: direct application in public transport).
Table 6.
Sensor methodologies and techniques used in air quality studies associated with public transport (2015-2025; criterion: direct application in public transport).
| METHODOLOGY | TECHNIQUE | AUTHOR |
| Low-cost optical PM sensors | Direct reading of PM inside vehicles | Ham et al., 2017 |
| Optical PM sensors at bus stops and stations | Avis et al., 2020 | |
| Optical sensors in public transport campaigns | Bahino et al., 2024 | |
| Portable photometers/nephelometers (PM) | Personal monitoring in public transport | Abbass et al., 2021 |
| Portable aethalometers (BC) | BC measurement in transport microenvironments | Correia et al., 2020 |
| Optical particle counters (OPC) | Real-time characterization inside vehicles | Bobbia et al., 2025 |
| Gas sensors (electrochemical/NDIR) | NO2/CO measurement in public transport | Bizualem et al., 2023 |
| Reference sampling in filters | Gravimetric sampling in transport systems | Agathokleous et al., 2025 |
| Integrated multiparametric systems | Integrated PM–gas–GPS platforms in transport | Bhat et al., 2022 |
Table 7.
Chemical analysis techniques used in studies of air quality associated with public transport (2015–2025).
Table 7.
Chemical analysis techniques used in studies of air quality associated with public transport (2015–2025).
| METHODOLOGY | TECHNIQUE | AUTHOR |
| Gravimetric analysis and particulate carbon | Gravimetry in filters (PTFE, quartz) | Djossou et al., 2018 |
| Gravimetry and PM₂.₅ analysis | Ben Rayana et al., 2022 | |
| Organic and elemental carbon analysis (OC/EC, IMPROVE protocol) | Dingemanse et al., 2023 | |
| Digital reflectometry for black carbon | Nogueira et al., 2020 | |
| Total Carbon (TC) Analysis | Pereira et al., 2025 | |
| Elemental analysis (inorganic chemistry) | ICP-MS for trace metals | Moreno et al., 2015 |
| ICP-OES / ICP-AES | Botsou et al., 2020 | |
| Microwave acid digestion (HNO₃, H₂O₂, HF) | Brempong et al., 2016 | |
| ED-XRF for elemental analysis | Ngo et al., 2015 | |
| S-XRF for elemental characterization | Valotto et al., 2015 | |
| Hg analysis by wet oxidation | Szczepaniak-Wnuk & Górka-Kostrubiec, 2016 | |
| ICP-MS combined with multielemental analysis | Zhang et al., 2023 | |
| Morphological and compositional analysis | SEM-EDS / SEM-EDX | Grana et al., 2017 |
| SEM-EDXS for individual particles | Rivas et al., 2017 | |
| Surface analysis by XPS | Letaïef et al., 2024 | |
| Analysis of organic compounds | GC-MS for PAHs | Mikuška et al., 2015 |
| GC/MS for volatile organic compounds | Yan et al., 2015 | |
| Py-GC/MS for polymers and organic material | Molden et al., 2023 | |
| GC×GC-TOF-MS | Chae et al., 2024 | |
| Ultrasonic extraction and derivatization by silylation | Muresan et al., 2018 | |
| Extraction with hexane/dichloromethane and GC-MS | Leoni et al., 2018 | |
| Magnetic analysis supplemented with chemistry | Magnetic susceptibility (κ) | Górka-Kostrubiec et al., 2020 |
| Thermomagnetic curves κ(T), M(T) | Szczepaniak-Wnuk & Górka-Kostrubiec, 2016 | |
| Magnetometry (VSM) combined with SEM-EDS | Letaïef et al., 2024 | |
| Gas and emissions analysis | Chemiluminescence (NO, NO₂, NOx) | Moolla et al., 2015 |
| UV photometry for O₃ | Xu et al., 2016 | |
| GC-PID for BTEX | Wang et al., 2018 | |
| PEMS and ELPI systems | Zhang et al., 2018 | |
| Chemical modeling and source apportionment | Positive Matrix Factorization (PMF) | Ibarra-Espinosa et al., 2022 |
| RADM2/MADE/SORGAM chemical models | Leoni et al., 2018 | |
| Use of chemical tracers for sources | Zhang et al., 2023 |
Table 8.
Environmental magnetism methodologies and techniques used in studies of air quality associated with public transport (2015-2025).
Table 8.
Environmental magnetism methodologies and techniques used in studies of air quality associated with public transport (2015-2025).
| METHODOLOGY | TECHNIQUE | AUTHOR |
| Environmental magnetism as a proxy for traffic pollution | Specific magnetic susceptibility (χ) | Botsou et al., 2020 |
| Frequency-dependent susceptibility (χfd%) | Brempong et al., 2016 | |
| Measurements with Bartington susceptimeter (MS2B) | Szczepaniak-Wnuk & Górka-Kostrubiec, 2016 | |
| Integrated magnetic analysis for source discrimination | MRI acquisition and demixing curves | Górka-Kostrubiec et al., 2020 |
| FORC diagrams | Letaïef et al., 2024 | |
| Hysteresis loops (Ms, Mrs, Bc) | Sheikh et al., 2022 | |
| Thermomagnetic analysis χ(T), SIRM(T) | Ingo et al., 2022 | |
| Curie temperature determination | Górka-Kostrubiec et al., 2020 | |
| Magnetic biomonitoring and citizen science | Isothermal Remanent Magnetization (IRM) | Hofman et al., 2017 |
| Cryogenic Magnetometry (2G-SQUID) | Winkler et al., 2021 | |
| Magnetic indices (Qmag) | Letaïef et al., 2023 | |
| Environmental magnetism combined with chemical/morphological analysis | Environmental magnetism is integrated with SEM-EDS | Castanheiro et al., 2020 |
| Environmental magnetism combined with ED-XRF | Rivas et al., 2017 | |
| Magnetic biomonitoring | Using epiphytic plants χlf, χARM, SEM-EDS integration |
Castaneda-Miranda et al., 2022; Castaneda-Miranda et al., 2025 |
| Magnetism applied to nanoparticles and health | Ferromagnetic characterization of nanoparticles | Maher et al., 2016 |
| Magnetism applied to nanoparticles and health Measurement of magnetic fields (LF-MF) |
Magnetic coercivity analysis | Gonet & Maher, 2019 |
| Magnetic field dosimetry (μT) | Remy et al., 2025 | |
| Measurement of magnetic fields (LF-MF) | Bayesian modeling (INLA) of magnetic exposure | Remy et al., 2025 |
Table 9.
Methodology and modeling techniques used in studies of air quality associated with public transportation.
Table 9.
Methodology and modeling techniques used in studies of air quality associated with public transportation.
| METHODOLOGY | TECHNIQUE | AUTHOR |
| Explanatory statistical models | Linear/multiple regression | Bikis et al., 2021 |
| GLM / GAM | Yan et al., 2015 | |
| Difference in Differences (DiD) | Bel & Holst, 2018 | |
| Propensity Score Matching (PSM) | Hao et al., 2025 | |
| Machine learning models | Random Forest | Aix et al., 2024 |
| Neural networks (ANN, BPNN) | Ngoc et al., 2018 | |
| LSTM / Bi-LSTM | Huang et al., 2023 | |
| Support Vector Machine (SVM) | Yasin et al., 2025 | |
| Calibration and correction models | Deweathering | Ghaffarpasand et al., 2024 |
| Hygroscopic correction (k-Köhler) | Correia et al., 2023 | |
| Sensor calibration with ML | Sserunjogi et al., 2022 | |
| Exposure and risk models | Wells–Riley | Shinohara et al., 2025 |
| Risk indices (HQ, HI) | Botsou et al., 2020 | |
| Spatial models | Land Use Regression (LUR) | Gouveia et al., 2021 |
| GWR / MGWR | Zhan et al., 2025 | |
| Bayesian models | INLA | Remy et al., 2025 |
| Hierarchical Bayesian models | Ezz et al., 2015 | |
| Agent-based models | Agent-Based Models (ABM) | Lund et al., 2020 |
| Monte Carlo simulation | Morales-Betancourt et al., 2023 |
Table 10.
Inhaled dose methodology and techniques used in studies of air quality associated with public transport.
Table 10.
Inhaled dose methodology and techniques used in studies of air quality associated with public transport.
| METHODOLOGY | TECHNIQUE | AUTHOR |
| Classic inhaled dose | C × IR × time | Goel et al., 2015 |
| Dose per trip/distance | Ramos et al., 2016 | |
| C × IR × Δt | Tan et al., 2017 | |
| Intermodal comparison | Borghi et al., 2020 | |
| Physiologically adjusted dose | Ventilation derived from HR | Qiu et al., 2020 |
| VE based on physical exertion | Zheng et al., 2021 | |
| Dynamic respiratory rate | Aix et al., 2024 | |
| Doses by population groups | Normalization by body weight | Jeong & Park, 2017 |
| Age segmentation | Fameli et al., 2024 | |
| Lung deposition dose | ICRP model (RDD) | Kumar et al., 2018 |
| LDSA | Strasser et al., 2018 | |
| Size fractions | Rivas et al., 2017 | |
| Cumulative dose | Temporal integration | Yang et al., 2015 |
| Integrated exposure | Muresan & François, 2018 | |
| Risk-weighted dose | Monte Carlo | Morales-Betancourt et al., 2019 |
| Scenario assessment | Zhao et al., 2023 |
Table 11.
Methodology, technique, and PFM (Positive Matrix Factorization) model used in studies of air quality associated with public transportation.
Table 11.
Methodology, technique, and PFM (Positive Matrix Factorization) model used in studies of air quality associated with public transportation.
| METHODOLOGY | TECHNIQUE | MODEL | AUTHOR |
| Classic chemical PMF | Concentration–uncertainty matrix; species classification; BS/DISP | USEPA PMF 5.0 | Tefera et al., 2021 |
| Source apportionment based on chemical composition | USEPA PMF 5.0 | Barraza et al., 2017 | |
| Bootstrap validation and sensitivity analysis | USEPA PMF 5.0 | Ramírez et al., 2018 | |
| Separation of major urban sources | USEPA PMF 5.0 | Vossler et al., 2016 | |
| PM₂.₅ analysis with BS–DISP validation | USEPA PMF 5.0 | Srivastava et al., 2021 | |
| Application to complex urban settings | USEPA PMF 5.0 | Nava et al., 2020 | |
| Multi-site assessment | USEPA PMF 5.0 | Amato et al., 2016 | |
| Recent application with chemical integration | USEPA PMF 5.0 | Olufemi et al., 2025 | |
| Integration with other chemical analyses | USEPA PMF 5.0 | Pereira et al., 2025 | |
| PMF applied to traffic | Separation of escape/non-escape using EC and metals | USEPA PMF 5.0 | Demir et al., 2022 |
| Identification of brake and tire wear | USEPA PMF 5.0 | Matthaios et al., 2022 | |
| Resolution of vehicle sources | USEPA PMF 5.0 | Pokorná et al., 2015 | |
| PMF based on particle size | Size distribution (NSD) | USEPA PMF | Sowlat et al., 2016 |
| Particle number (PNC) | USEPA PMF | Beddows et al., 2015 | |
| Mass–number integration | USEPA PMF | Leoni et al., 2018 | |
| PMF integrated with meteorology | Meteorological clustering and seasonal analysis | Integrated PMF | Skiles et al., 2018 |
| Local vs. regional separation | Integrated PMF | Hovorka et al., 2015 | |
| Sensor-adapted PMF | Instrumental uncertainty assessment | Adapted PMF | Bousiotis et al., 2022 |
| Advanced PMF | Normalization by dispersion | DN-PMF | Faisal et al., 2024 |
| Multiple scenarios and sensitivity to MDL | USEPA PMF 5.0 | Cheong et al., 2024 | |
| Separation of episodic events | USEPA PMF 5.0 | Zhang et al., 2023 |
Table 12.
CMF (Computational Fluid Dynamics) methodologies and techniques used in air quality studies associated with public transport.
Table 12.
CMF (Computational Fluid Dynamics) methodologies and techniques used in air quality studies associated with public transport.
| METHODOLOGY | TECHNIQUE | AUTHOR |
| CFD for pollutant dispersion in vehicles | RANS k–ε realizable; Lagrangian particle tracking (1 µm) | Bahman Zadeh et al., 2025 |
| RANS RNG k–ε for CO dispersion in microenvironments | Yu et al., 2022 | |
| Multizone model coupled to CFD for self-pollution | Li et al., 2015 | |
| CFD for ventilation design and evaluation | RANS RNG k–ε; species transport (CO) | Zhao et al., 2018 |
| Evaluation of air change rates (ACH) | Pirouz et al., 2021 | |
| Duct optimization using DOE | Dodwad et al., 2023 | |
| CFD for shutdowns and semi-open environments | Reynolds stress model + DPM | Noh et al., 2021 |
| Optimization of curved barriers and fences | Noh et al., 2021 | |
| Exposure analysis based on platform geometry | Yu et al., 2022 | |
| CFD coupled with advanced models | CFD–Monte Carlo for risk assessment | Guevara-Luna et al., 2023 |
| CFD with aerosol dynamics and chemical reactions | Lin et al., 2023 | |
| Comparison of RANS vs. LES in urban canyons | Lan et al., 2024 | |
| CFD for thermal comfort | PMV/PPD evaluation in cabins | Eldegwy & Khalil, 2018 |
| Standard Effective Temperature Index (SET) | Alam et al., 2020 | |
| Evaluation of cabin air circulators | Ochiai et al., 2019 | |
| CFD as an auxiliary tool | Urban dispersion modeling (review) | Zhang et al., 2025 |
| Applications in transportation and respiratory health | Lakra et al., 2025 |
Disclaimer/Publisher’s Note: The statements, opinions and data contained in all publications are solely those of the individual author(s) and contributor(s) and not of MDPI and/or the editor(s). MDPI and/or the editor(s) disclaim responsibility for any injury to people or property resulting from any ideas, methods, instructions or products referred to in the content. |
© 2026 by the authors. Licensee MDPI, Basel, Switzerland. This article is an open access article distributed under the terms and conditions of the Creative Commons Attribution (CC BY) license.
Copyright: This open access article is published under a Creative Commons CC BY 4.0 license, which permit the free download, distribution, and reuse, provided that the author and preprint are cited in any reuse.


